Embed Size (px)
Citation preview

ci
c
B
Local spectral information in thenear field with wavelet analysis and entropy
Dominique Barchiesi and Tijani Gharbi
In near-field optical microscopy the resolution is strongly related to the experimental illuminationconditions and to the separation between tip and sample. Therefore the spectral information in near-field data ~related to the resolution in images! can be described only locally as a function of the tip–sampleposition. To make a local study of the spectral information in near-field data, we use wavelet decom-position that is associated with the calculation of entropy. We deduce the resolution from the charac-teristics of the wavelet, which leads to an automatic and numerical evaluation of the resolution innear-field data. © 1999 Optical Society of America
OCIS codes: 180.5810, 070.4560, 350.5730.
8
gwAisuTtaws
lhndriclncw
1. Introduction
Near-field optical microscopes use tips that interactwith the electromagnetic field diffracted by a sample toenable the detection of high spatial frequencies ~Fig. 1!.Super-resolution currently is achieved by variousnear-field optical setups.1 The determination of res-olution and the characterization of experimental set-ups generally is ignored because it is well known thatthe lateral resolution depends significantly on the il-lumination conditions, the polarization, the tip shapeor size, and the distance between the tip and the sam-ple.2,3 Therefore the resolution currently is deter-mined by visual inspection of the experimentalimages.4–6 Few papers have dealt with methods foralculating the resolution in experimental near-fieldmages. The transfer function of the setup3,6,7 has
been investigated in particular cases. On the otherhand, the local resolution has been studied by use ofthe usual Fourier spectrogram method.8
In previous studies, Barchiesi used Fourier analy-
When this study was performed, the authors were with theLaboratoire d’Optique P. M. Duffieux, Unite Mixte de Rechercheau Centre National de la Recherche Scientifique 6603, Institut deMicrotechniques, Universite de Franche-Comte, F-25030 Besan-¸on, France. T. Gharbi is also with CERAH ~Centre d’Etudes etde la Recherches sur l’Appareillage pour les Handicapes!. D.
archiesi [email protected]! is now with theLaboratoire de Nanotechnologie et d’Instrumentation Optique, 12rue Marie Curie, B.P. 2060, F-10010 Troyes Cedex, France.
Received 18 March 1999; revised manuscript received 29 June1999.
0003-6935y99y316587-10$15.00y0© 1999 Optical Society of America
sis for those purposes. The main drawback of Fou-rier analysis is related to the relation between thesize of the processed sample N and the Fourier fre-quencies ~N 2 1!y2, even if the results with spectro-rams are significant in near-field data. In contrast,avelets furnish a real time–frequency analysis.nother problem encountered with Fourier analysis
s the aliasing that is related to the extraction of aample from near-field data. Aliasing requires these of a smooth filter to calculate spectrograms.herefore the characteristics of the filter are addi-ional parameters that could perturb the frequencynalysis of the processed data. On the other hand,avelets can be used directly because of their limited
upport width in direct space and reciprocal space.The problems related to near-field images are the
ocation and the evaluation of high resolution in aigh-spatial-frequency domain. At the same timeoise is generally predominant in the same frequencyomain. Therefore determination of the resolutionequires discrimination of the useful signal from noisen the high-frequency range. In this paper we use theontinuous wavelet transform, which additionally al-ows us to discriminate the noise from the useful sig-al. Multilevel analysis acts like a filtering processarried out with well-defined filters of a given spectralidth.It must be noted that the aim of this paper is not to
characterize the experimental setup. We focus ononly the evaluation of the spectral information inexperimental data. The means of image formationcan be ignored in the first steps of multilevel analysisif the purpose of the study is to help researchersobtain the quantitative information that is contained
1 November 1999 y Vol. 38, No. 31 y APPLIED OPTICS 6587

osmSmtt
6
in recorded data with a method that, because of itstime–frequency localization, is suitable for analyzingnear-field records. In this paper we introduce thewavelet transform and describe various properties ofnear-field data that justify wavelet analysis for thiscase. We show the results of wavelet analysis onsimulated data and experimental data. We intro-duce wavelet analysis and its associated entropy aspowerful tools for evaluating local information innear-field data.
2. Wavelet Transform and Near-Field Data Properties
In Subsection 2.A we introduce wavelet analysis andits advantages compared with conventional Fourieranalysis. In Subsection 2.B we summarize the maincharacteristics of near-field data that are related tothe scanning-probe process.
A. Wavelet Transform
To illustrate the power of the wavelet transform, wefirst consider some linear transforms. We denote bys~t! the signal as a function of the date of acquisition~or the position of the tip above the sample7!. Onebtains this signal by scanning the probe above theample, and the scanning step is related to the ulti-ate resolution in the scanning process by thehannon–Wittaker theorem. If the spectral infor-ation in the recorded data has to be determined a
ransformation can be applied by use of a spectralest function T~t!:
s~ f ! 5 *2`
1`
s~t!T*~t, f !dt 5 ^s, T&. (1)
Fig. 1. ~a! Experimental setup and ~b! 7 mm 3
588 APPLIED OPTICS y Vol. 38, No. 31 y 1 November 1999
At this stage some spectral test functions can beused:
• The well-known Fourier transform uses theharmonic-function basis functions:
T~t, f ! 5 exp~ j2pft!. (2)
The properties of these basis functions are their or-thogonality and their precise location in the fre-quency domain ~there is only one value of f for eachfunction of the basis!. In contrast, the time exten-sion of the function is infinite. Therefore Fourieranalysis cannot lead to a precise location in time t ofthe frequency f. The Fourier analysis is nonlocal.
• As a consequence of nonlocality, the short-timeFourier transform9 ~STFT! was introduced to obtainmore localization in the frequency analysis. TheSTFT consists of windowing the signal s~t! around aparticular time t0 and then calculating its Fouriertransform inside this window h~t!. This process iscarried out for each instant:
T~t, f, h, t0! 5 h~t 2 t0!exp~ j2pft!. (3)
Thus the STFT represents the local spectrum of thesignal s~t! around the time point t0. The STFT wasapplied to near-field data by Barchiesi.8 The STFTmethod is governed by the Heisenberg–Gabor in-equality. This relation implies that the temporalresolution is enhanced if a Dirac function is used as atemporal window. Consequently, no frequency res-olution is provided,10 and the method is not suitablefor near-field data recordings. Moreover, the spec-tral width of the test function T~t, f, h, t0! dependsstrongly on the size and the shape of the windowingfunction h~t 2 t0!. Therefore the obtained result s~ f,
~128 3 128 pixel! intensity map of the image.
7 mm
p
el
dbte
h, u! is not stable versus the size of the windowingfunction h~t 2 t0!. Moreover, the result is a two-dimensional ~2-D! map ~the spectrogram! for each
rocessed data line.• The continuous wavelet transform provides an
efficient way to represent a signal by localization inboth the time and the frequency domains.11 Thespectral test function is, in fact, a family of zero-meanfunctions ~the wavelets! that are derived from an el-mentary function C ~the mother wavelet! by trans-ation and dilation:
T~t, a, C! 5 uau21y2CSt 2 t0
a D , (4)
where a corresponds to a scale factor.
For wavelets that are localized around a nonzerofrequency f0 a time–frequency interpretation is pos-sible thanks to the following definition: f 5 f0ya.When the scale factor a varies, the duration and thebandwidth of the wavelet both change, but the wave-let’s shape ~and especially its spectral shape! remainsthe same. The wavelet-analysis method behaveslike a bandpass-filter-bank analysis. Each filter hasa relatively constant bandwidth. A wavelet trans-form generates wavelet coefficients s~t0, a, C!. The
iscrete wavelet transform consists of a correlationetween the wavelet and the signal. The result hashe same dimensions as the investigated data forach value of a and C. The wavelet transform has
been applied in different fields, such as signal patternrecognition, radar, sonar, speech, sound, medical im-aging,12 optical signal processing,13 and x-ray imag-ing and tomography.14
B. Scanning-Probe Data Properties
As indicated in Section 1, scanning-probe microscopyis based on the displacement of a probe near an ob-served sample. In near-field optical microscopy theprobe is the end of an etched optical fiber. The smalldistance between the tip and the sample ~i.e., be-tween contact and some hundreds of nanometers!and the sharpness of the tip enable the detection ofhigh spatial frequencies of the diffracted light. Thetip is scanned by piezotranslators. Three scanningmethods are available: constant distance ~with thehelp of shear-force feedback, for example!, constantheight ~the tip is scanned in a plane!, and constantintensity. The main properties and artifacts relatedto these scanning methods are discussed in Refs. 15and 16.
The main points of scanning-probe optical micros-copy are as follows:
• Whatever the scanning methods might be, thedistance between the tip and the sample can vary,leading to a loss of high spatial frequencies when thetip-to-sample distance increases. In the case ofconstant-height scanning the angle between thescanning plane and the mean plane of the sample caninvolve a dependence of the high-spatial-frequency
contribution on the various zones of the recorded da-ta.3 It has been shown that sharp sample edges in-duce wide tip jumps and, consequently, greatvariation in the detected optical signal16 in constant-distance scanning. These variations do not containpurely optical information and can be called artifacts.In the same paper ~Ref. 16! it was shown that thecomplex and sometimes not analytic shape of theintensity profiles can lead to wide tip jumps. There-fore it might be useful to separate spectral informa-tion in these zones of artifacts from that of otherzones.
• The recorded signal consists of successive datalines as a result of the scanning process. The probeis scanned with piezotranslators, leading to possibledecay between successive lines. This effect couldjustify one-dimensional, as opposed to the common2-D, signal processing. If 2-D signal processing isapplied to the whole image artifactual high spatialfrequencies can be found in the direction that is per-pendicular to the scanning direction. Moreover, it ispossible for the tip to rub against the sample and thusto modify the tip size or shape during scanning.This modification contributes to inhomogeneity interms of the resolution ~or spectral contents! of therecorded data.
• The scanning process uses piezotranslatorsthat can be characterized by a nonlinear response tothe control voltage. Therefore the scanning step canvary slightly from the center of the recorded map tothe edges of the scanning window. Local analysis ofthe spectral information is therefore suitable in thiscase.
It should to be noted that the piezotranslator’s hys-teresis prevents us from using the direct record andthe backrecord because the hysteresis causes backand forth displacement of the probe. Hysteresiscompensation could enable enhancement of thesignal-to-noise ratio.17 Of course, it is possible tocompensate for this defect with built-in sensors, al-though at the price of increased time.
With respect to the above points, a local probe-scanning data characterization will benefit from localprocessing. In Section 3, we introduce wavelet anal-ysis and test it on near-field simulated data.
3. Application of Wavelet Analysis to Near-Field Data
A. Multilevel Wavelet Analysis
As was indicated in Subsection 2.A, wavelet analysiswas introduced to allow the performance of local anal-ysis in signal processing. In the following, we useDaubechies wavelets because they are suitable for de-tecting discontinuities in the signal.18 Moreover,their frequency response has maximum flatness.This last point is very useful for a spectral-bandwidthanalysis of the data. The main advantage of the dis-crete wavelet transform is its capability of local anal-ysis with no aliasing effects, contrary to the capabilityof Fourier analysis. Figures 2 and 3 show a compar-ison between the Hamming window HW ~used in
1 November 1999 y Vol. 38, No. 31 y APPLIED OPTICS 6589

dlssntw“0ctc
6
STFT8 to prevent the aliasing effect! and the Dau-bechies wavelets:
HW~n, p! 5 0.54 2 0.46 cosS 2p
n 2 1pD ,
p [ @0, n 2 1#. (5)
The spatial Fourier spectra of the Hamming win-dow and the Daubechies wavelet are shown in Figs. 2and 3. This first step is used to show that the wave-let has a regular spectral characteristic. Figures 2and 3 illustrate that Daubechies wavelets are suit-able for making local analyses ~the time dependenceis, in fact, the dependence on the size of the wavelet!
Fig. 2. Plots of the Hamming windows and the associated mod-ulus of the discrete Fourier transform spectrum as functions of thenormalized Fourier frequency. The abscissas represent the nor-malized Fourier frequency with a maximum of 1y2, which corre-sponds to the Shannon–Wittaker limit, i.e., more than two pixelsare necessary to define the signal. The normalized Fourier fre-quency is independent of the size of the original function.
Fig. 3. Daubechies wavelets ~dbN has a length of 2N! and theassociated modulus of the discrete Fourier transform spectrumplotted as functions of the normalized Fourier frequency. Theabscissas represent the normalized Fourier frequency. The Fou-rier spectrum is slightly dependent on the size of the wavelet.
590 APPLIED OPTICS y Vol. 38, No. 31 y 1 November 1999
with the relative flatness of the bypass filter ~theFourier spectrum of the wavelet is much less sensi-tive to the wavelet length than is the Hamming func-tion!. We emphasize again that a classical STFTmethod leads to a 2-D map for a processed data line,with each column representing the Fourier transformof the windowed data and each row calculated as afunction of the sliding window position. On theother hand, the wavelet analysis is one dimensional ifthe processed data are one dimensional. Actually,this economy of one-dimensional compared with 2-Danalysis is due to both the Fourier spectrum and thesize limits of the wavelet. Another advantage ofwavelet analysis versus a statistical method like theKarhunen–Loeve transform19 is that the spectralstudy can be applied to only one near-field image.
Among the various applications of the wavelet wechose multilevel analysis, which closely follows thetransform introduced in Eq. ~1!.11 The basic princi-ple of multilevel analysis is the use of the transformdescribed in Eq. ~1! with basis functions that verifythe property given in Eq. ~4! to construct a tree rep-resentation. Wavelet decomposition and recomposi-tion are based on the convolution of the wavelet withthe signal. For this process, and for each wavelet, alow-pass filter and a complementary high-pass filterare used ~Fig. 4!.
The first level of decomposition uses the convolu-tion of the raw data with the low- and the high-passfilters, leading to cA1 ~an approximation! and cD1 ~a
etail!, respectively, by recomposition. The secondevel of decomposition uses the convolution of theame filters with cA1 and leads to cA2 and cD2, re-pectively. The wavelet order is combined with aumber that corresponds to the half-size in pixels ofhe wavelet filters. For example, the Daubechiesavelet that is calculated with 2N pixels is called
dbN.” The cutoff of the wavelet is located near.25, regardless of the wavelet order. This cutoffan make it possible to distinguish between noise andhe useful signal or the cutoff frequency in the pro-essed signal.
Fig. 4. Chart of the general principles of multilevel analysis.
iF~
fon
ltiitfif
cps
Four filters are used to proceed to multilevel anal-ysis: two decomposition filters, WL
d ~low pass! andWH
d ~high pass!, and two reconstruction filters, WLr
and WHr. The two first levels of decomposition can
be expressed as follows:
cD1 5 ^^s, WHd&, WH
r&&, (6)
cA1 5 ^^s, WLd&, WL
r&&, (7)
cD2 5 ^^cA1, WHd&, WH
r&&, (8)
cA2 5 ^^cA1, WLd&, WL
r&&. (9)
The orthogonality of each wavelet filter implies theproperty of reconstruction at each level i of the anal-ysis:
s 5 cD1 1 . . . 1 cDi 1 cAi. (10)
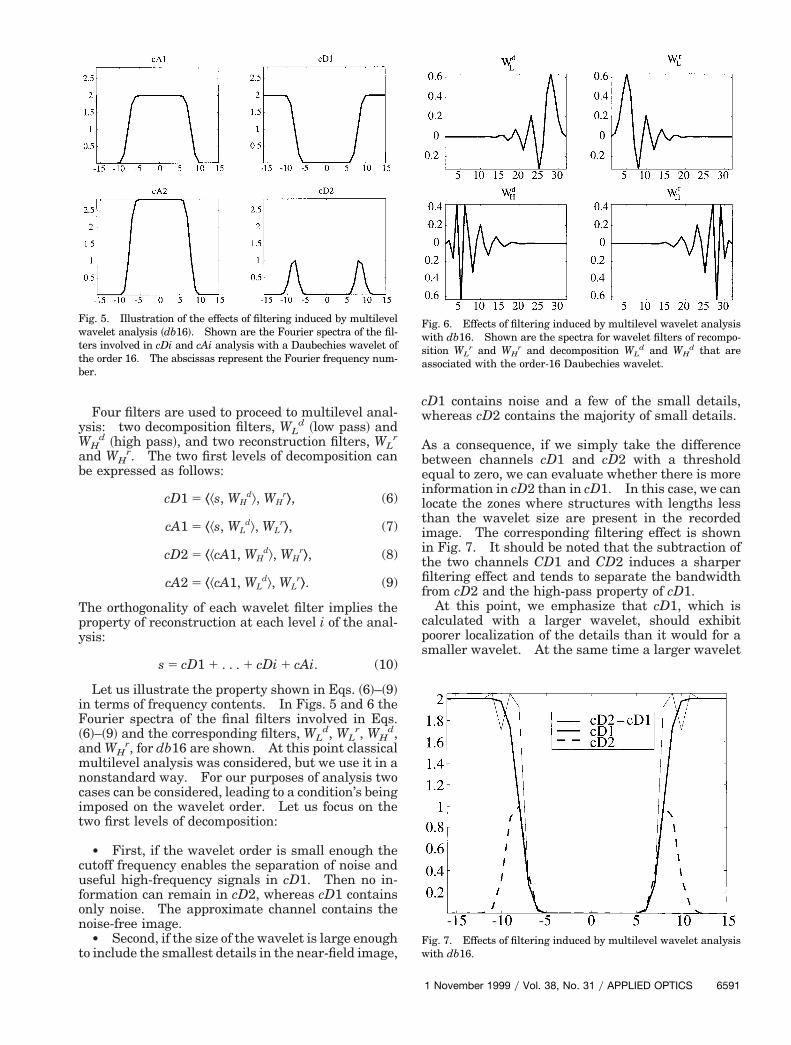
Let us illustrate the property shown in Eqs. ~6!–~9!n terms of frequency contents. In Figs. 5 and 6 theourier spectra of the final filters involved in Eqs.
6!–~9! and the corresponding filters, WLd, WL
r, WHd,
and WHr, for db16 are shown. At this point classical
multilevel analysis was considered, but we use it in anonstandard way. For our purposes of analysis twocases can be considered, leading to a condition’s beingimposed on the wavelet order. Let us focus on thetwo first levels of decomposition:
• First, if the wavelet order is small enough thecutoff frequency enables the separation of noise anduseful high-frequency signals in cD1. Then no in-ormation can remain in cD2, whereas cD1 containsnly noise. The approximate channel contains theoise-free image.• Second, if the size of the wavelet is large enough
to include the smallest details in the near-field image,
Fig. 5. Illustration of the effects of filtering induced by multilevelwavelet analysis ~db16!. Shown are the Fourier spectra of the fil-ters involved in cDi and cAi analysis with a Daubechies wavelet ofthe order 16. The abscissas represent the Fourier frequency num-ber.
cD1 contains noise and a few of the small details,whereas cD2 contains the majority of small details.
As a consequence, if we simply take the differencebetween channels cD1 and cD2 with a thresholdequal to zero, we can evaluate whether there is moreinformation in cD2 than in cD1. In this case, we canocate the zones where structures with lengths lesshan the wavelet size are present in the recordedmage. The corresponding filtering effect is shownn Fig. 7. It should be noted that the subtraction ofhe two channels CD1 and CD2 induces a sharperltering effect and tends to separate the bandwidthrom cD2 and the high-pass property of cD1.
At this point, we emphasize that cD1, which isalculated with a larger wavelet, should exhibitoorer localization of the details than it would for amaller wavelet. At the same time a larger wavelet
Fig. 7. Effects of filtering induced by multilevel wavelet analysiswith db16.
Fig. 6. Effects of filtering induced by multilevel wavelet analysiswith db16. Shown are the spectra for wavelet filters of recompo-sition WL
r and WHr and decomposition WL
d and WHd that are
associated with the order-16 Daubechies wavelet.
1 November 1999 y Vol. 38, No. 31 y APPLIED OPTICS 6591

sofoo
c3nfllp
wtotSu
6
of size 2N implies mixing of the details with a sizemaller than 2N in cD1. On the other hand, becausef the property of convolution ~or the wavelet trans-orm! a maximum of the reconstructed data in cD1 isbtained when the size of the wavelet equals the sizef the detail.Consequently, to get the most from multilevel de-
Fig. 8. Simulated R-SNOM signal. The resolution dependsstrongly on the distance between the tip and the sample.
Fig. 9. Simulated signals for cD1, cD2, cD2 2 cD1, and entropy.db16 and db5.
592 APPLIED OPTICS y Vol. 38, No. 31 y 1 November 1999
omposition, we calculate symmetrical entropy ~ory2 entropy! of the wavelet recomposition to elimi-ate saturation in the images by decreasing the in-uence of the high-intensity and the low-intensity
evels. Symmetrical entropy is often used in imagerocessing20 for normalized signals $s~t! [ @0, 1#%:
E@s~t!# 5 2s~t!1.5 log s~t!1.5. (11)
The symmetrical entropy decreases as a function oflevel decomposition if the wavelet order is too small,whereas the entropy is lower in cD2 than in cD1 if the
avelet order is large enough. As a consequence,he cutoff can be assumed to be the cutoff of the firstrder of the wavelet that satisfies the local decrease ofhe symmetrical entropy in part of the signal. Inubsection 3.B the above method is tested on a sim-lated near-field optical scanning line.
B. Entropy in the Multilevel Analysis of Simulated Data
We investigate the effect of the slope of the scanningplane with respect to and the mean sample plane.For this purpose, we use a previous model ~Ref. 21and references therein! to calculate the near-field op-tical intensity in the case of a reflection scanningnear-field optical microscope ~R-SNOM!. In thisconfiguration the tip illuminates the sample and de-tects the signal. The tip is a bare optical fiber endthat is pulled and stretched to realize a radius of
abscissas are in units of pixels. The analysis was carried out with
The
2t
curvature of approximately 50 nm. The tip is as-sumed to be a pure dielectric dipole, and the opticalsignal is the squared modulus of the electric field thatis diffracted in the collection angle of the tip ~near25°!. The purpose of this paper is not to providedetails of the model and its domain of applicationbecause, first, they can be found in Refs. 3 and 21–23and, second, we do not focus here on image formationbut on image spectral information.
The experimental setup is a R-SNOM ~see Fig. 1!.The sample is a glass substrate ~refractive index of1.5! with two rectangular dots. The lateral size ofthe sample is 400 nm. The height of each dot is 20
Fig. 10. Experimental R-SNOM data: Level-1 and level-2 decDaubechies order-4 wavelet ~db4!. ~a! The original experimentachannels cD1 ~left-hand side! and cD2 ~right-hand side!. ~c! Symmside! from ~b!. The data were acquired in constant-height mode.
nm. The wavelength is 632.8 nm, and the distancebetween the tip and the sample varies from contacton the left-hand side ~20 nm from the bottom of thegrating grooves! to 35 nm. The slope angle is only°. Contrast reversal was observed both experimen-ally and theoretically,3 and image formation was
studied in Ref. 24, especially the confinement of lightat the edges of the sample tracks. The sensitivity ofthe tip-to-sample distance can be related heuristi-cally to the exponential decrease of the evanescentdiffracted-waves amplitude. Actually, the variationof the optical near-field intensity with an increasingtip-to-sample distance is no longer exponential but
sitions of the detail channels of an experimental image with ata that correspond to the image shown in Fig. 1~b!. ~b! Detailentropy corresponding to cD1 ~left-hand side! and cD2 ~right-hand
ompol daetric
1 November 1999 y Vol. 38, No. 31 y APPLIED OPTICS 6593

tsce
rcofDssw
oedt
6
rather is superposed with a decay characteristic thatis related to the size of the sample.25,26
Figure 8 shows the simulated intensity line and itsderivative. Figure 8 illustrates the power of classi-cal multilevel wavelet decomposition. Detail cD2exhibits enhancement of the right-hand dot and couldbe useful as is in obtaining noise-free low-frequencyinformation from the processed near-field data. Atthe same time cD1 provides strong enhancement inhe zone where the distance between the tip and theample is small. A resolution of less than 16 pixelsan be found in this zone. On the other hand, asxpected, the amplitude of cD1 in the zone of the less
Fig. 11. Experimental R-SNOM data: Location of the resolution~a! The original experimental data, which correspond to the imagedb1 ~left-hand side! and db2 ~right-hand side!. ~c! Locations of theside!. The data were acquired in constant-height mode.
594 APPLIED OPTICS y Vol. 38, No. 31 y 1 November 1999
esolved dot is much lower. The peaks caused by theonfinement of the near-field signal around the edgesf the left-hand dots induce many oscillations. Thisact is naturally due to the convolution of a quasi-irac delta ~the peak! with the wavelet, showing the
hape of the wavelet in cD1. As expected, the lateralize of these oscillations is close to the size of theavelet.As was indicated above, to diminish the effects of
scillations, we calculate the entropy of cD1 minus thentropy of cD2, as shown in Fig. 9. The entropy of theifference is less accurate because it contains the sub-raction of highly oscillating functions. Entropy is
experimental image obtained by use of various orders of wavelets.n in Fig. 1~b!. ~b! Locations of the resolution for wavelet orders
lution for wavelet orders db3 ~left-hand side! and db4 ~right-hand
in anshowreso

ppdMt
T
sbpc
iisdstfis
smtT~swtttl
nq
1t.wftppcp
thus characteristic of the accumulation of spectral in-formation in the investigated zone of the signal. Fig-ure 9 shows that entropy seems to be a good tool forseparating the data zones with a resolution of less than16 pixels or 50 nm ~db16 on the left-hand side! and 5ixels or 16 nm ~db5 on the right-hand side!. The twoeaks to the left of the signal are separated by use ofb16 analysis, whereas they are not by db5 analysis.oreover, although the signal corresponding to the dot
o the right of the signal line remains ~slightly! withdb5, it disappears completely with db16. This spec-tral information ~or resolution! can be interpreted justby observation of Fig. 8. Let us now investigate realnear-field images.
C. Application of Wavelet Analysis to Raw Near-FieldOptical Data
Figure 10 shows the wavelet decomposition of an ex-perimental image that was recorded with a R-SNOM.The window size is 7 mm 3 7 mm ~128 by 128 pixels!.
he wavelet order is db4. Figure 10~c! illustratesthe symmetric entropy of Fig. 10~b! ~detail channelscD1 and cD2!. The usefulness of symmetric entropyis clear with regard to the dynamics of Fig. 10~c!compared with Fig. 10~a!. The effect of the tip’s rub-bing ~along the horizontal lines near a and b! and theaturation at the beginning of scanning are lessenedy the entropy calculation and by one-dimensionalrocessing. Therefore the artifactual resolutionaused by saturation will be eliminated.
Figure 11 shows the location of the resolution super-mposed on the original image but calculated for var-ous wavelet orders ~db1, db2, db3, and db4!. Wetress that we use no criterion to define resolution; weetermine only the locations where the entropy of theecond level of decomposition–recomposition is greaterhan that of the first level, assuming that the waveletlter makes separation of the noise from the usefulignal possible. Wavelet db1 ~called the Haar wave-
let! is not capable of separating the noise from theuseful signal. In contrast, the other wavelets lead toa local resolution that has to be compared with previ-ous experimental and theoretical observations ~seeRef. 3!.
As a first remark, we must emphasize that thebetter resolved dot 1 appears with db2 and moreclearly with db4, whereas the less resolved dot 2 doesnot appear clearly with db3 or db4. The edges of theample ~3 in Fig. 10! and of the dot contain approxi-ately the same information. A scanned line from
he same zone could show this property directly:he edges of the dot are approximately 4 pixels wide
218 nm!. We can see that, if the tip rubs on theample, no artifactual high resolution is obtainedith this method, even if the corresponding zones of
he image correspond to saturation and high varia-ions of the intensity level. As expected, scanning ofhe flat surface between dots does not lead to theocation of resolution.
The wavelet analysis is, moreover, used to eliminateoise from the common signal data. As a conse-uence, if noise is predominant in cDk, as it is in Fig.
1~b! for db2, the orthogonality of the wavelets is suchhat the resolution can be studied with cDk9, where k9
k, with less contribution from noise. The discreteavelet transform is such that some regions can be
ound with 2-pixel and 3-pixel resolutions because ofhe shortness, i.e., it is defined with a small number ofixels, of the wavelet definition. This effect disap-ears if the wavelet order increases. Thus this effectannot be related to the threshold that we choose whenlotting the figures @E~cD2! 2 E~cD1! . 0#.
4. Conclusions
Wavelet analysis associated with the entropy criterionappears to be a good method for determining automat-ically the local resolution in near-field images. Wave-let analysis is a powerful tool for time–frequencystudies that could lead to meticulous study of the localresolution. It should be noted that no knowledge ofthe sample is necessary to apply the method. Thewavelet analysis itself ~the wavelet order! furnishesthe localization of the associated resolution, whateverthe image may be. Study of the resolution in near-field images is currently performed with various wave-lets to determine if the resolution can be studied interms of the edge criterion.27 This type of character-ization of the recorded data could help to test system-atically the tip shapes or suitable illuminationconditions. Further studies are planned that willdeal with the Wigner transform to suppress any de-pendence of the characterization on the chosen waveletfamily ~even if it is slight!.
The authors are grateful to D. Courjon and D. VanLabeke for having encouraged them to undertakethis study. Thanks are also due to O. Bergossi andM. Spajer for providing the images.
References and Notes1. D. Courjon, F. Baida, C. Bainier, D. van Labeke, and D.
Barchiesi, “Near field instrumentation,” in Photons and LocalProbes, O. Marti and R. Moller, eds., NATO ASI Ser. E 300,59–78 ~1995!.
2. D. van Labeke and D. Barchiesi, “Scanning–tunneling opticalmicroscopy: a theoretical macroscopic approach,” J. Opt. Soc.Am. A 9, 732–739 ~1992!.
3. D. Barchiesi, O. Bergossi, C. Pieralli, and M. Spajer, “Reflec-tion scanning near-field optical microscopy ~R-SNOM! in con-stant height mode with a dielectric probe: imageinterpretation and resolution for high topographic variations,”Ultramicroscopy 71, 361–370 ~1998!.
4. R. U. Maheswari, H. Tatsumi, Y. Katayama, and M. Ohtsu,“Observation of subcellular nanostructure of single neuronswith an illumination mode photon scanning tunneling micro-scope,” Opt. Commun. 120, 325–334 ~1995!.
5. O. Bergossi, M. Spajer, and P. Schiavone, “Visualization oflatent images by reflection near-field optical microscopy,” Ul-tramicroscopy 61, 241–246 ~1995!.
6. R. U. Maheswari, H. Kadono, and M. Ohtsu, “Power spectralanalysis for evaluating optical near-field images of 20 nm goldparticles,” Opt. Commun. 131, 133–142 ~1996!.
7. D. Barchiesi, “Pseudo modulation transfer function in reflec-tion scanning near-field optical microscopy,” Opt. Commun.154, 167–172 ~1998!.
8. D. Barchiesi, “Application of the Fourier algorithm to near field
1 November 1999 y Vol. 38, No. 31 y APPLIED OPTICS 6595

optical images: local resolution estimation,” Microsc. Micro-
1
1
11
1
1
1
1
1
1
20. P. W. Hawkes and E. Kasper, Wave Optics ~Academic, London,
2
2
2
2
2
2
2
6
anal. Microstruct. 8, 1–10 ~1997!.9. L. Cohen, “Time–frequency distribution—a review,” Proc.
IEEE 77, 941–981 ~1989!.0. D. Gabor, “Theory of communication,” J. IEE 93, 429–457
~1946!.1. S. Mallat, “A theory for multiresolution signal decomposition:
the wavelet representation,” IEEE Trans. Pattern Anal. Mach.Intell. 11, 674–693 ~1989!.
2. See the entire issue of Opt. Eng. 33, 2104–2486 ~1994!.3. P. Sandoz, “Wavelet transform as a processing tool in white-
light interferometry,” Opt. Lett. 22, 1065–1067 ~1997!.4. A. V. Bronnikov and G. Duifhuis, “Wavelet-based image en-
hancement in x-ray imaging and tomography,” Appl. Opt. 37,4437–4448 ~1998!.
5. B. Hecht, H. Bielefeldt, Y. Inouye, D. W. Pohl, and L. Novotny,“Facts and artifacts in near-field optical microscopy,” J. Appl.Phys. 81, 2492–2498 ~1997!.
6. C. Girard and D. Courjon, “The role of scanning mode in near-field optical microscopy,” Surf. Sci. 382, 9–18 ~1997!.
7. N. Bonnet, “On the use of correlation functions for improvingthe image signal-to-noise ratio,” Optik ~Stuttgart! 80, 103–106~1988!.
8. G. Strang and T. Nguyen, Wavelets and Filter Banks~Wellesley-Cambridge Press, Wellesley, Mass., 1996!.
9. D. Charraut, D. Courjon, C. Bainier, and L. Moulinier, “Anal-ysis of optical near-field images by Karhunen–Loeve transfor-mation,” Appl. Opt. 35, 3853–3861 ~1996!.
596 APPLIED OPTICS y Vol. 38, No. 31 y 1 November 1999
1994!.1. D. Barchiesi, “A 3-D multilayer model of scattering by nano-
structures. Application to the optimization of thin coatednanosources,” Opt. Commun. 126, 7–13 ~1996!.
2. D. Barchiesi, C. Girard, O. J. F. Martin, D. van Labeke, and D.Courjon, “Computing the optical near-field distributionsaround complex subwavelength surface structures: a com-parative study of different methods,” Phys. Rev. E 54, 4285–4292 ~1996!.
3. A. Vial, D. Barchiesi, and G. Parent, “Spectroscopic study ofthe image formation in near-field microscopy, near anevanescent-homogeneous switching,” J. Microsc. 194, 265–270~1999!.
4. S. Davy, D. Barchiesi, M. Spajer, and D. Courjon, “Spectro-scopic study of resonant dielectric structures in the near field,”Eur. Phys. J. ~Appl. Phy.! 5, 277–281 ~1999!.
5. K. Jang and W. Jhe, “Nonglobal model for a near-field scan-ning optical microscope using diffraction of the optical nearfield,” Opt. Lett. 21, 236–238 ~1996!.
6. T. Saiki, M. Ohtsu, K. Jang, and W. Jhe, “Direct observationof size-dependant features of the optical near field on asubwavelength spherical surface,” Opt. Lett. 21, 674–676~1996!.
7. J. L. Kann, T. D. Milster, F. F. Froehlich, R. W. Ziolkowski, andJ. B. Judkins, “Linear behavior of a near-field optical system,”J. Opt. Soc. Am. A 12, 1677–1682 ~1995!.
![Entropy OPEN ACCESS entropy - Semantic Scholar · for the retrieval performance. In the work of [34], a color histogram based on the wavelet is introduced, which also considers the](https://img.pdfslide.net/doc/110x75/5fb111d70462a673a3732de9/entropy-open-access-entropy-semantic-scholar-for-the-retrieval-performance-in.jpg)


![1 Introduction - Lagout Science/2...(MaxEnt spectral analysis) is a method of improving spectral estimation based on the principle of maximum entropy [45 48]. MaxEnt spectral analysis](https://img.pdfslide.net/doc/110x75/612705d65c4d055cc06a280a/1-introduction-lagout-science2-maxent-spectral-analysis-is-a-method-of-improving.jpg)