Embed Size (px)
Citation preview

arX
iv:1
801.
0217
0v1
[as
tro-
ph.G
A]
7 J
an 2
018
Local Stellar Kinematics from RAVE data – VIII. Effectsof the Galactic Disc Perturbations on Stellar Orbits ofRed Clump Stars
O. Onal Tas 1• S. Bilir 1
• O. Plevne 2
Abstract We aim to probe the dynamic structure ofthe extended Solar neighbourhood by calculating theradial metallicity gradients from orbit properties, whichare obtained for axisymmetric and non-axisymmetricpotential models, of red clump (RC) stars selectedfrom the RAdial Velocity Experiment’s Fourth DataRelease. Distances are obtained by assuming a singleabsolute magnitude value in near-infrared, i.e. MKs =−1.54±0.04mag, for each RC star. Stellar orbit param-eters are calculated by using the potential functions: (i)for the MWPotential2014 potential, (ii) for the same po-tential with perturbation functions of the Galactic barand transient spiral arms. The stellar age is calculatedwith a method based on Bayesian statistics. The radialmetallicity gradients are evaluated based on the maxi-mum vertical distance (zmax) from the Galactic planeand the planar eccentricity (ep) of RC stars for bothof the potential models. The largest radial metallicitygradient in the 0 < zmax ≤ 0.5 kpc distance inter-val is −0.065 ± 0.005 dex kpc−1 for a subsample withep ≤ 0.1, while the lowest value is −0.014± 0.006 dexkpc−1 for the subsample with ep ≤ 0.5. We find thatat zmax > 1 kpc, the radial metallicity gradients havezero or positive values and they do not depend on epsubsamples. There is a large radial metallicity gradi-ent for thin disc, but no radial gradient found for thick
O. Onal Tas
1Istanbul University, Faculty of Science, Department of Astron-
omy and Space Sciences, 34119 University, Istanbul, Turkey
S. Bilir
1Istanbul University, Faculty of Science, Department of Astron-
omy and Space Sciences, 34119 University, Istanbul, Turkey
O. Plevne
2Istanbul University, Department of Astronomy and Space Sci-
ences, Graduate School of Science and Engineering, Istanbul Uni-
versity, 34116, Beyazıt, Istanbul, Turkey
disc. Moreover, the largest radial metallicity gradients
are obtained where the outer Lindblad resonance region
is effective. We claim that this apparent change in ra-dial metallicity gradients in the thin disc is a result of
orbital perturbation originating from the existing reso-
nance regions.
Keywords The Galaxy: solar neighbourhood – disc –
structure – stars: horizontal branch
1 Introduction
Galaxies are dynamically active ensembles of gas, dust
and stars that take aeons to shape their almost sta-
tionary faces. Likewise our galaxy, the Milky Way,is exposed to certain drastic changes due to both in-
ner and outer perturbations. The Galaxy is gener-
ally considered to have distinct components, which
are known as bulge, disc and halo, and each have
different characteristics in age, kinematics and chem-istry. Regardless of the status of the transition be-
tween these Galactic components, they are formed from
each other as a combination of gas either in clouds
or in dark matter halos inside the same gravitationalpotential (Bland-Hawthorn & Gerhard 2016). These
components are thought to be shaped by an on-going
collapse into a plane of the gas material, or by part
of stellar evolution of its subjects and or by merger
events with the surrounding environment such as dwarfgalaxies, gas etc (Binney & Tremaine 2008). Mean-
while, the gas content governs this formation period
in two ways. Firstly by its amount and how it var-
ied over time and secondly by the chemical enrich-ment of the gas via on-going stellar evolution of the
stars (Chiappini, Matteucci & Gratton 1997). It is
known that stars have the same chemical structure
2
as the molecular cloud in which they were born un-til the dredge-up and/or stellar wind processes takeover. Moreover, as a natural extension of the stellarevolution, most of the synthesized elements do returnto the interstellar medium (ISM), where new stars areformed, either through supernova explosions of short-lived massive stars and/or binary stars or expandingshells of long-lived low mass stars. These processesenrich the ISM with various elements in the periodictable on different time-scales and abundances. This isknown with different names such as chemical tagging(Freeman & Bland-Hawthorn 2002), the cosmic clockapproach (Minchev, Chiappini & Martig 2013). This,in principle, helps to uncover the time dependent chem-ical structure of any chosen, observable Galactic region,and also helps to put constraints on Galactic formationscenarios. At this juncture, one other important aspectof the Galactic evolution helps to establish the neces-sary environment to test the existing findings regardingthe Galactic formation, which is called as the inside-out formation of the Galaxy disc (Chiappini et al. 1997,and references therein). According to the two infallmodel (Chiappini et al. 1997; Chiappini 2001) the thindisc is evolved by the infall of high-angular momentumgas from inside-out, from the central regions like bulgeto the outer regions of the disc radius, for the last 7-8Gyrs.
The Sun is embedded in the Galactic disc and sincethe disc entails two important aspects of the chemo-dynamic evolution; on one hand it is composed of 80 percent of the visible matter in the Galaxy and on the otherit contains the major perturbers of the Galactic poten-tial, such as the Galactic bar and spiral arms, thereforeit is only logical to further study it. Over the past twodecades there has been various type of all sky surveys,i.e. Hipparcos (ESA 1997), SDSS (York et al. 2000),GCS (Nordstrom et al. 2004), 2MASS (Skrutskie et al.2006), RAVE (Steinmetz et al. 2006), APOGEE (Allende Prieto et al.2008), SEGUE (Yanny et al. 2009), GALAH (de Silva et al.2015), LAMOST (Zhao et al. 2012), GES (Gilmore et al.2012), Gaia (Gaia Collabration 2016), which swept var-ious sized space volumes around the Sun and gathered ahuge amount of astrometric, photometric and spectro-scopic data of the objects in it. Meanwhile, our increas-ing capability in theoretical computation allowed us todevelop models in order to test the partial or completeformation and evolution scenarios of the Milky Wayand its components in different contexts (cf. Minchev2017; Bovy 2015; Hayden et al. 2015; Nidever et al.2014; Minchev, Chiappini & Martig 2013).
Observations of the Solar neighbourhood objects al-lowed us to spot the various effects of these interactionsby studying their chemistry, kinematics and orbital dy-namics. According to Eggen, Lynden-Bell & Sandage
(1962), stellar orbit shapes vary from circular to elon-
gated eccentric as the vertical distance from the Galac-tic plane increase. Wielen (1977) showed that the nat-
ural encounters with massive objects like giant molec-
ular clouds during a lifetime of a star do alter the
shape of the stellar orbit. Moreover, the Galactic barcauses resonance regions that affect the gravitational
field which are known as inner and outer Lindblad (ILR
and OLR) and co-rotation resonance (CR) regions. In
CR region stars revolve with the Galactic bar with the
same angular rotational rate, while the interplay be-tween azimuthal and radial angular frequencies define
whether a star is in the ILR or OLR (cf. Dehnen 2000;
Minchev 2017). According to Fux (1999), the CR re-
gion covers 3.5 - 5 kpc of Galactocentric distance range.Based on the hydrodynamical modelling of the inner
Galaxy, Dehnen (2000) suggests that the Solar neigh-
bourhood is in the OLR of the Galactic bar. Dehnen
(2000) showed that under the assumption of a flat ro-
tation curve ROLR = 1.7RCR and using the epicycleapproximation for late-type disc stars roughly calcu-
lated the Galactocentric position of the OLR as 6 - 9
kpc. Also, various values for OLR’s position is quoted
in Antoja et al. (2009, 2015)’s stellar stream studies.Metallicity gradients are one way of looking into
the chemo-dynamic structure of the Galaxy, which is
a stronger sight that probe the change in metallicity
trends during its ongoing evolution, especially if var-
ious metallicity indicators are derived from the mid-or high-resolution spectroscopy (HRS) of a large num-
ber of objects that reach out to a large space vol-
ume. Yet it is very hard to reveal the complexi-
ties that govern the temporal evolution of the MilkyWay, only by looking into the metallicity gradients. It
is important to have accurate spectroscopic observa-
tions and distance measurements for metallicity gra-
dient calculations. Even though the metallicities be-
come more and more reliable with each new gener-ation of the multi-object spectroscopic surveys, the
distances still remain problematic. There are limited
number of HRS studies such as APOGEE, GALAH,
GES in the literature and these surveys do not coverall sky, thus stars with accurate metallicities are only
limited to a few kpc within the Solar neighbourhood.
Especially, these limitations decrease the sensitivity
of the radial metallicity gradient calculations. Apart
from the common interest in the current Galactocen-tric distances, analyze from the current position of
stars do not exactly reflect their true Galactic popu-
lation whereabouts. To overcome this problem there
is another approach in the literature, in which theGalactic orbit parameters of various objects are cal-
culated, and by doing this the sensitivity of the radial

3
metallicity gradients is enhanced. Even though in re-
cent studies (i.e. Nordstrom et al. 2004; Wu et al. 2009;Coskunoglu et al. 2012; Bilir et al. 2012; Boeche et al.
2013, 2014; Plevne et al. 2015; Onal Tas et al. 2016)
that determine the radial metallicity gradients using
this method, the gradient values still scatter in a widerange. This variation might depend on the spectral
resolution, object type, distance determination, and
Galactic populations. On the other hand, the most
crucial dependencies stem from the spectral analysis
method, such as spectral fitting, equivalent widths, at-mospheric models, local or non-local thermodynamic
equilibrium. The majority of the metallicity gradient
studies between the years 2000 and 2016 are compiled
in Onal Tas et al. (2016). Also, in the same study theauthors pointed out that the radial metallicity gradi-
ents are strongly dependent on both the maximum ver-
tical distances from the Galactic plane and the planar
eccentricities. Moreover, stellar orbits are affected by
Galactic perturbation sources with age, and this makesthe orbits more eccentric, which in result changes the
Galactic radial metallicity gradients in time.
This paper is aimed to show the effects of major
Galactic perturbers, such as the Galactic bar and spi-ral arms, on stellar orbits of the RC stars selected from
the RAdial Velocity Experiment’s Fourth Data Release
(RAVE DR4; Kordopatis et al. 2013). It is also shown
that the planar eccentricities play a crucial role in se-
lecting the proper sample in order to reflect the chemo-dynamic structure of the Solar neighbourhood. The
layout of the paper is as follows. In Sections 2 and
3, the data and methods are introduced, in Section 4,
the results are presented and finally, the results are dis-cussed in Section 5.
2 Data
RC stars are selected from the RAVE DR4 catalogue
(Kordopatis et al. 2013). We neglected stars with fol-
lowing properties from the catalogue: (i) stars with
missing model atmosphere parameters, (ii) stars withmissing proper motion components from the fourth U.S.
Naval Observatory CCD Astrograph Catalog (UCAC4,
Zacharias et al. 2013), (iii) stars which do not have
2MASS photometric filter quality as A, which also
means signal-to-noise ratio is S/N < 20 (Cutri et al.2003), and (iv) stars that observed in Galactic lati-
tude |b| < 10, to avoid the effects of the interstel-
lar medium, (v) stars with radial velocity errors less
than 10 km s−1, (vi) stars with algo conv=1, whichmeans spectral pipeline has not converged, and (vii)
stars that do not have “normal” spectral morphology.
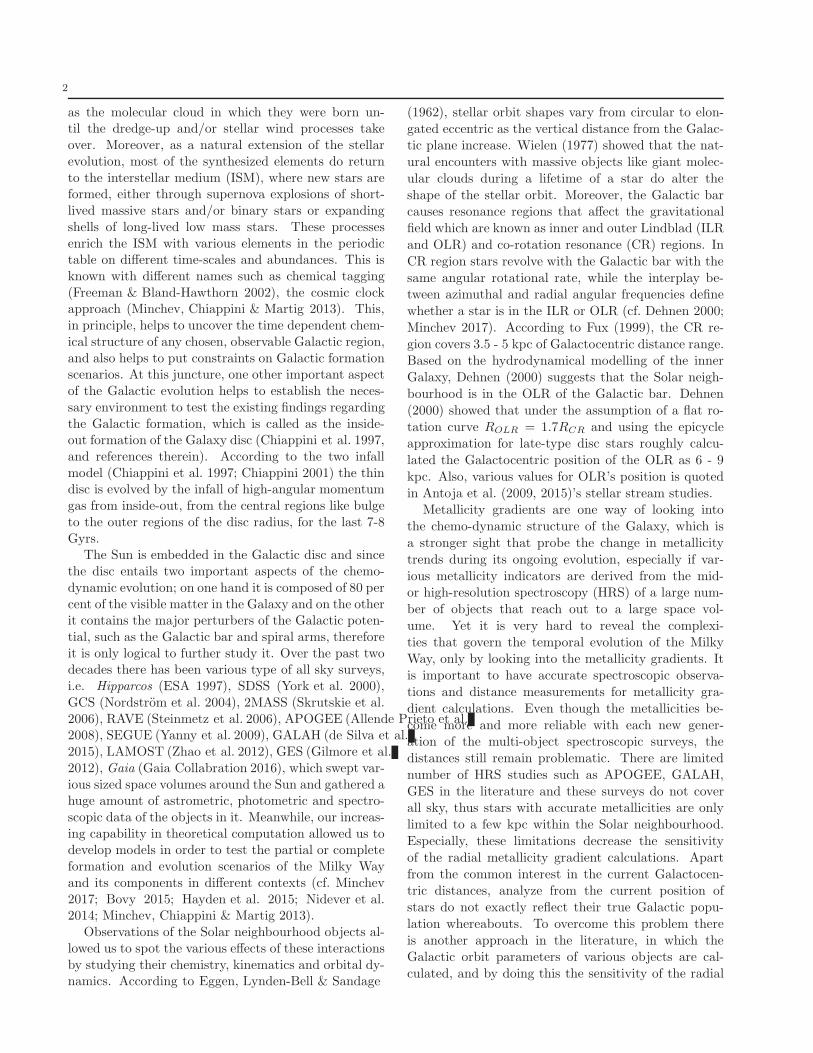
Fig. 1 HR diagram of selected RC stars from RAVE DR4,colour-coded by logarithmic number density (a) and bymetallicity (b).
After these mandatory eliminations, the initial selectioncriteria is applied on the model atmosphere parametersof the remaining sources in the RAVE DR4 catalogue(Kordopatis et al. 2013), i.e. 4000 < Teff (K) < 5400and 1 < log g (cgs) < 3. In Fig. 1, Hertzsprung - Rus-sell (HR) diagrams of the region where the RC starsare most likely to reside are presented in two panels,one colour coded by logarithmic number density andthe other by logarithmic metallicity. Also, a 1σ con-tour line based on the most crowded region is drawnwith white solid line in Fig. 1. Using the contour line,we selected the stars that reside in the 1σ area. More-over, we applied S/N ≥ 40 constraint, which reducedthe number of sources to 51,941.
RC stars are considered as standard candles forthe distance determination, thus their absolute mag-nitudes are assumed to be constant, especially innear-infrared Ks band, MKs = −1.54 ± 0.04 mag(Groenewegen 2008). Colour excess at infinity val-ues, E∞(B − V ), for each star are obtained individ-ually from Schlafly & Finkbeiner (2011)’s reddeningmaps from NASA IPAC Extragalactic database andare reduced to Ed(B − V ) related to individual stellardistances of the RC sample using Bahcall & Soneira(1980)’s equation. Finally, the distance and Ed(B−V )values are calculated using the photometric parallaxmethod. This method is described in detail in the stud-ies of Coskunoglu et al. (2012) and Bilir et al. (2012).
3 METHODS
3.1 Stellar Kinematics
When RAVE DR4’s radial velocities (γ), UCAC4proper motions (µα cos δ, µδ) and distances (d) are

4
coupled with individual equatorial and Galactic coor-
dinates of the RC sample in accordance with the al-gorithm and matrices of Johnson & Soderblom (1987),
then the space velocity components (U , V , W ) and
their respective uncertainties are calculated for the
J2000 epoch. In a right-handed Galactic referencesystem, the space velocity components are defined as
U positive towards the Galactic centre, V in the di-
rection of Galactic rotation, and W positive towards
the North Galactic Pole. The total space velocity and
its uncertainty are calculated as root mean squares ofthe individual space velocity components and their un-
certainties, respectively, for each RC star. Apparent
magnitudes of RAVE stars vary in the 9 < I < 12
mag interval and the RAVE catalogue includes starswith different luminosity classes, especially giants and
dwarfs. When their distances are compared, one see
that giant stars are dispersed in a larger space volume
than dwarf stars (Plevne et al. 2015; Onal Tas et al.
2016). Thus, it is important to make a correctionon the space velocity components that are parallel to
the Galactic plane for the differential rotation, espe-
cially for the bright objects in the sample. Differen-
tial rotation corrections of Mihalas & Binney (1981)are applied only on the U and V space velocity compo-
nents in order to compensate the distance divergence
on the orbital speeds around the Galactic centre. How-
ever, the W space velocity component is not corrected
for differential rotation since it is aligned verticallyto the Galactic plane. Then all of the space veloc-
ity components are reduced into the local standard of
rest of Coskunoglu et al. (2011)’s, (U⊙, V⊙,W⊙)LSR =
(8.83± 0.24, 14.19± 0.34, 6.57± 0.21) km s−1.Uncertainties in each space velocity component are
calculated by propagating uncertainties in radial ve-
locity, distance and proper motion of RC stars using
Johnson & Soderblom (1987)’s algorithm. The total
space velocity errors are calculated as the square rootof sum of the squares of the individual space-velocity
component errors, i.e. (Serr =√
U2err + V 2
err +W 2err).
The total space velocity error distribution is shown in
Fig. 2a. A final constraint is applied on the totalspace velocity errors by defining a cutoff point. To
do this, the median and 1σ values of the Serr distri-
bution, 9.42 and 10.54 km s−1, respectively, are added
to obtain the cut-off point, which give Serr ≃ 20 km
s−1 as a limiting value. Thus, stars with total spacevelocity errors greater than 20 km s−1 are removed
from the sample, which is only 10% of 51,941 RC
stars. So, we retained the most sensitive 46,818 RC
star sample. After these eliminations final RC samplehas median space velocity errors: (Uerr, Verr,Werr =
(4.89 ± 2.67, 4.09 ± 2.87, 4.88 ± 2.75) km s−1. The
histograms of the space velocity component errors areshown in Fig. 2b-d. Finally, histograms of the modelatmosphere parameters (Teff , log g, [Fe/H]) of the RCsample after the imposing on the total space velocityerror are presented in the three panels of Fig. 3.
3.2 Stellar Dynamics
Properties of RC orbits are calculated using the poten-tial functions that defined in galpy, the Galactic dy-namics library (Bovy 2015). These calculations areperformed both for an axisymmetric potential for theMilky Way galaxy (hereafter MW) and for a non- ax-isymmetric potential, which includes the perturbationfunctions of the Galactic bar and the spiral arms (here-after MWBS). Galactic rotational speed and the Galac-tocentric distance of the Sun are chosen as 220 km s−1
and 8 kpc (Majewski 1993), respectively, for the dy-namic parameter calculations.
The MW potential is selected from the galpy.potentiallibrary, which has the relevant parameters of the MilkyWay galaxy, also known as MWPotential2014, (for de-tails see Table 1 in Bovy 2015). This potential functionis composed of three models that each of which repre-sents the gravitational field of one of the main Galacticcomponents of the Galaxy, i.e. bulge, disc, and halo.According to Bovy (2015), the bulge is modeled as aspherical power law density profile with exponential cutoff at 1.9 kpc with an exponent of -1.8, which is shownin Eq. (1),
ρ(r) = A(r1r
)a
exp
[
−(
r
rc
)2]
(1)
where A, is the amplitude that applied to the potentialin mass density units, α is the inner power, rc and r1are the cut-off radius and the reference radius for theamplitude, respectively.
The disc is modeled with a Miyamoto & Nagai(1975) potential as in Eq. (2),
Φdisc(Rgc, z) = − GMd√
R2gc +
(
ad +√
z2 + b2d
)2(2)
here Rgc, is star’s distance from the Galactic centre, zis star’s vertical distance to the Galactic plane, G is theUniversal gravitational constant, Md, is the disc mass,ad and bd are the scale-length and the scale-height ofthe Galactic disc, respectively.
The Galactic halo is modeled with Navarro, Frenk, White(1996) potential defined as in Eq. (3),
Φhalo(r) = −GMs
Rgcln
(
1 +Rgc
rs
)
(3)

5
Fig. 2 Total space velocity error histogram of 51,941 stars(top panel). The median and standard deviation are 9.42km s−1 and 10.54 km s−1, respectively. Their sum givesapproximately 20 km s−1 (red arrow) and this is the lastconstraint that imposed on the sample. As a result 46,818RC stars are retained as the final sample. Histograms ofU , V , and W space velocity errors are shown in comparisonwith the total space velocity error histogram of 46,818 RCstars (lower panels).
4300 4400 4500 4600 4700 4800 4900 5000 5100Teff (K)
0
2000
4000
6000
8000
N
a
1.6 1.8 2.0 2.2 2.4 2.6 2.8logg (cm −2)
0
2000
4000
6000
8000
N
b
−1.50 −1.25 −1.00 −0.75 −0.50 −0.25 0.00 0.25 0.50[Fe/H] (dex)
0
2000
4000
6000
8000
10000
N
c
Fig. 3 Histograms of the model atmosphere parameters of46,818 RC stars in RAVE DR4. Effective temperature (a),logarithmic surface gravity (b), and metallicity (c).
where MS and rs are the mass and the radius that
assumed for the dark matter halo of the Galaxy.The perturbation function of the Galactic bar is de-
fined with Dehnen (2000)’s bar potential as in Eq. (4),
Φ(R, φ) = Ab(t) cos(2(φ− Ωbt)) (4)
×
−(Rb/R)3 forR > Rb
(Rb/R)3 − 2 forR ≤ Rb
here Ab(t), Ωb and Rb are the amplitude, the rotationspeed and the semi-major axis of the Galactic bar and
φ is the angle between the semi-major axis and the
line from Sun to the Galactic centre. The perturbation
function of the spiral arms are selected as transient log-
arithmic spiral arm potential from the galpy library,which is shown in Eq. (5),
Φ(R, φ) =amp(t)
αcos(α lnR −m(φ− Ωst− γ)) (5)
where the term amp(t) is the time dependent am-
plitude of the potential and modeled by a Gaussian
amp(t) = amp×A exp(−(t− to)2/(2σ)2) in which to is
the time at which the spiral peaks and σ is the spiral
duration. Other parameters, such as Ωs, α, m and γare the pattern speed, the pitch angle, the number of

6
spiral arms and the angle between the line connecting
the peak of the spiral pattern at the Solar radius andthe line from Sun to the Galactic centre, respectively.
Each star’s orbital properties around the Galactic
centre are extracted from the complete orbits that are
calculated with 3 Myr steps for a 3 Gyr integrationtime. Same input parameters that are used in space
velocity component calculations are also used in dy-
namic orbit parameter estimations. According to this,
the output parameters are peri- and apo-galactic dis-
tances (Rp and Ra), the planar eccentricity (ep) andthe maximum vertical distance from the Galactic plane
(zmax). Moreover, the mean Galactocentric distance
(Rm) is calculated as an average of Rp and Ra. These
are the key parameters for investigating the effects ofthe large-scale Galactic perturbation forces, i.e. bar
and spiral arms, in this study. When propagated er-
rors, that are caused by radial velocities, proper mo-
tions and distances are taken into account, we found
the mean errors on zmax, Rm, and ep of RC stars to be0.1 kpc, 0.2 kpc, and 0.02, respectively.
Galactic orbit parameters of 46,818 RC stars are cal-
culated for the MW and MWBS potential models and
their comparison is presented in Fig. 4. Mean dif-ferences and their standard deviations for peri- and
apo-galactic distance comparisons for both potential
models are 0.16, 0.37 kpc and 0.22, 1.12 kpc, respec-
tively. Similarly, the mean difference and it’s stan-
dard deviation for the mean Galactocentric distancesare found from comparison as 0.17 and 0.55 kpc. More-
over, the same calculation is performed for the planar
eccentricity, which is a function of Rp and Ra, and it’s
mean difference and standard deviation are 0.033 and0.043. In Fig. 4c, Rm values of RC stars are com-
pared. There are obvious horizontal strips in different
Galactocentric distances. The stepped structure con-
sisting of these horizontal strips is formed by RC stars
caught in Lindblad resonances at different distances.Moreover, in Fig. 4d, in which compares the planar ec-
centricities, there is a separate population of RC stars
that reside between 0.3 < ep < 0.6 in MW axis and
0.6 < ep < 0.8 in MWBS axis. This prominent RCgroup is also apparent in the lower left part of the Fig.
4b, which shows the comparison between the perigalac-
tic distances. When the maximum vertical distance
from the Galactic plane and the metallicity abundances
of this group of stars are examined, we found that theylie between 0.8 < zmax < 10 kpc distance interval and
their mean distance is 〈zmax〉 = 1.22 ± 0.60 kpc and
their metallicities range is −1.0 < [Fe/H] < −0.3 dex
and their mean metallicity is 〈[Fe/H]〉 = −0.66 ± 0.30dex. These results point out that this group of stars
belong to other stellar populations in the Galaxy, i.e.
mostly thick disc and halo. Since population analysisdid not applied on the main RC sample, this is nota very surprising result and it can be expected to seesmall number of stars from different stellar populations.There are 382 out 46,818 RC stars with properties thatdeviate from the general trends of the main sample.Moreover, this small number of stars is less than 1%of the total sample, thus they do not directly affectthe results obtained from the analysis. It is strikingthat there are significant differences and large standarddeviations among Galactic orbit parameters calculatedfrom axisymmetric and non-axisymmetric Galactic po-tentials and this lead us to evaluate the results obtainedfrom both of the potentials individually.
Fig. 4 Comparison between Galactic orbital parameterscalculated using the MW and MWBS potential models.Apo-galactic distance (a), peri-galactic distance (b), meanGalactocentric distance (c), and planar eccentricity (d).
3.3 Stellar Ages
Stellar positions, space velocities, chemical structureand ages are necessary parameters to thoroughly in-vestigate the existing structure and the evolution ofthe Milky Way (cf. Freeman & Bland-Hawthorn 2002;Bland-Hawthorn & Gerhard 2016). In this study,RC ages are calculated with a method based onBayesian statistics, which includes probability den-sity functions (pdf) that are obtained from compar-ative calculations of the theoretical model parametersand the observational parameters (Pont & Eyer 2004;Jørgensen & Lindegren 2005; Duran et al. 2013). Ac-cording to Pont & Eyer (2004), the Solar neighbour-hood mass, age and metallicity priors are assumed to

7
be independent, therefore they are considered sepa-rately. Based on this argument, the mass distribution
of RC stars is important. In our RC sample, stars
reside in a narrow mass range (0.8 ≤ M/M⊙ ≤ 2.2;
Girardi 1999), so the choice of the IMF has no stronginfluence on Bayesian age calculations. In the recent
study of Girardi (2016), the IMF for a typical RC
star in the Solar neighbourhood is 1.3 M⊙. Since theSFR of the Galactic disc is not well known, it is as-
sumed to be either constant or slowly decreasing (cf.
Pont & Eyer 2004). Moreover, the reliability of the
metallicity prior in age calculations for the Solar neigh-bourhood sample depends on the uncertainties. Our
sample has σ[Fe/H] ≃ 0.10 dex (Kordopatis et al. 2013),
thus the metallicity affects age calculations of RC starsless, since the uncertainties are rather small. Like-
wise following Jørgensen & Lindegren (2005), the first
assumption was that the standard errors in the obser-
vational parameters are independent of each other andshow normal distributions. Then a likelihood function
(L) is defined as
L(τ, ζ,m) =
n∏
i=1
1√2πσi
exp [−χ2/2] (6)
where
χ2 =
n∑
i=1
(
qobsi − qi(τ, ζ,m)
σi
)
(7)
here q represents the model atmosphere parameters,
such as the effective temperature (Teff ), the logarith-
mic surface gravity (log g) and the metallicity ([Fe/H]),whereas τ , ζ and m are the theoretical model parame-
ters which represents age, metallicity, and mass, respec-
tively. n and σ stand for the number of objects and the
standard errors, respectively. Then, the final pdf is ob-tained by applying a Bayesian correction defined as
f(τ, ζ,m) ∝ f0(τ, ζ,m)× L(τ, ζ,m) (8)
where f0 is the initial pdf and given as
f0 = ψ(τ)ϕ(ζ|τ)ξ(m|ζ, τ) (9)
here ψ(τ), ϕ(ζ) and ξ(m) are the star formation rate(SFR), the metallicity distribution (MDF) and the ini-
tial mass function (IMF), respectively. SFR and MDF
are assumed to be constant since τ , ζ and m are in-dependent from each other. However, the IMF is ex-
pressed as a power law, (Jørgensen & Lindegren 2005),
because the amount of low-mass stars is bigger than
the high-mass stars in the Galaxy. The final pdf in Eq.(8) is also depending on other parameters along with
age and this is overcome by integrating the final pdf
over the MDF and the IMF. When Eq. (8) is insertedin Eq. (9) and integrated, one can obtain the G(τ)
function which shows the pdf obtained from a compari-
son between observationally inferred model atmosphere
parameters and theoretical model parameters.
G(τ) ∝
∫ ∫
L(τ, ζ,m)ξ(m)dmdζ (10)
According to Jørgensen & Lindegren (2005), Eq.
(10) is evaluated for each age value (τj) as a doublesum along a set of isochrones at the required age that
are equidistant in metallicity (ζk). In our application,
we used pre-computed isochrones for a step size 0.05
dex in ζ. Let mjkl be the initial mass values along eachisochrone (τj , ζk). This function is re-formed by ap-
plying isochrone data into the function and comparing
the results with observational parameters given in the
below form,
G(τj) ∝ ΣkΣlL(τj , ζk,mjkl)ξ(mjkl)(mjkl+1 −mjkl−1)
(11)
The function G is obtained for a large age range by
comparing model atmosphere parameters with each ofthe isochrones, but the maximum of G function gives
the most likely age for any given object. Isochrones
are selected from the PARSEC (Bressan et al. 2012)
stellar evolution models for −2.25 <[Fe/H](dex)< +0.5and 0 < τ (Gyr) < 13 with 0.05 dex and 0.1 Gyr
steps, respectively. The results of Bayesian age esti-
mations of 46,818 RC stars are shown in Fig. 5. In
the figure the frequency counts of the age parameter is
shown in five metallicity intervals, namely, 0 <[Fe/H]≤+0.5, −0.25 <[Fe/H]≤ 0, −0.5 <[Fe/H]≤ −0.25,
−0.75 <[Fe/H]≤ −0.5, and −1.5 <[Fe/H]≤ −0.75 dex,
from the top panel to the bottom, respectively.
In the RAVE DR4 catalogue (Kordopatis et al.2013), the internal errors for the atmosphere model pa-
rameters are given in tabular form after re-normalization
with photometric priors as a function of spectral type
and luminosity class. Internal errors of atmosphere
model parameters for KII-V and S/N > 50, whichare listed in Table 2 of Kordopatis et al. (2013), are
adopted general errors for individual star in our RC
sample, since they are mostly KIII stars with S/N > 40,
i.e. 76 ≤ Teff (K) ≤ 105, 0.14 ≤ log g(cgs) ≤ 0.35,0.08 ≤ [M/H](dex) ≤ 0.10. Due to complex and non-
Gausian nature of Bayesian age estimation method,
overall uncertainties on estimated RC star ages vary
between 20% and 50%.

8
0
250
500
750
1000
1250
1500
N
0.00< [Fe/H](dex)≤ +0.5
0
1000
2000
3000
4000
5000
6000
N
−0.25< [Fe/H](dex)≤0.00
0
1000
2000
3000
4000
N
−0.50< [Fe/H](dex)≤ −0.25
0
250
500
750
1000
1250
1500
N
−0.75< [Fe/H](dex)≤ −0.50
0 1 2 3 4 5 6 7 8 9 10 11 12 13 14Age (Gyr)
0
200
400
600
N
−1.50< [Fe/H](dex)≤ −0.75
Fig. 5 Stellar age distribution of RC stars in the fivemetallicity intervals: 0 <[Fe/H]≤ +0.5, −0.25 <[Fe/H]≤0, −0.5 <[Fe/H]≤ −0.25, −0.75 <[Fe/H]≤ −0.5, and−1.5 <[Fe/H]≤ −0.75 dex from top to bottom panel, re-spectively.
4 Results
Various parameters of RC stars in RAVE DR4 such asdistances, space velocities, orbit properties and ages arecalculated with the methods described above in orderto assess the major perturbation effects on the stellarorbits that govern the Galactic disc. The RC stars arenot separated into stellar populations with any existingmethods in the literature, but instead they are roughlyseparated based on their maximum vertical distancefrom the Galactic plane. In this section, the resultsobtained for the radial metallicity gradients calculatedboth for the MW and MWBS potentials are presented.
4.1 Radial Metallicity Gradients
The radial metallicity gradients of the RC stars are cal-culated for the mean Galactocentric distances obtainedfrom their completed orbits in 3 Gyr around the Galac-tic centre, whereas the metallicity parameters are ob-tained from RAVE DR4. In this study, the radial metal-licity gradients are investigated as a function of zmax
and ep. Most of the RC sample (∼99%) reaches up to
zmax = 3 kpc from the Galactic plane, thus the RCstars are divided into four consecutive zmax distance
intervals, for the MW and MWBS potential models,
each of which reflects a certain state of the Galactic
disc. zmax distance limits are defined by consideringthe population efficiencies, so the RC sample is sepa-
rated into following distance intervals: 0 < zmax ≤ 0.5
kpc for dominant thin-disc stars, 0.5 < zmax ≤ 1 kpc
for the transition region between thin and thick disc
stars, 1 < zmax ≤ 2 kpc for dominant thick-disc starsand zmax > 2 kpc for the transition region between
thick disc and halo stars. Then, the ep distribution
in these samples are investigated with two different ap-
proaches: First, we grouped RC stars with cumulativelyincreasing ep subsamples, which allows us to see the
contamination effects on the radial metallicity gradi-
ents from the inclusion of the eccentric stellar orbits and
second, we considered discretely increasing ep subsam-
ples, which gives the radial extent of the RC samplesthat are affected from the well-known resonance regions
(CR and OLR). In both approaches each ep subsample
is selected between 0 and 1 with ∆ep = 0.05 steps. The
cumulative ep distributions in each zmax distance inter-val for the MW and MWBS potential models are shown
in the left and right panels in Fig. 6, respectively. Ac-
cording to both panels, the number of stars reaches up
to 90% at ep = 0.5, for zmax ≤ 2 kpc distances, while
for zmax > 2 kpc this happens at ep = 0.6. However,the ep subsamples beyond the ep = 0.5 limit are ex-
cluded in all zmax distance intervals. By applying this
limitation on the RC sample, 2% and 4% of stars are
removed from the sample for MW and MWBS models,respectively.
4.1.1 According to MW Potential Model
The radial metallicity gradients which are calculatedfor the RC stars in consecutive zmax intervals for cu-
mulative ep subsamples are listed and shown in the left
panel of Table 1 and Fig. 7, respectively. In Table 1,
the planar eccentricity range, the median values of ec-centricity, peri- and apo-galactic distances, metallicity,
age, the number of RC stars and the radial metallicity
gradient results are given for each zmax distance inter-
val. Furthermore, if a subsample contains less than 100
RC stars, it is ignored since they lack the statisticalsensitivity.

9
0.0 0.1 0.2 0.3 0.4 0.5 0.6 0.7 0.8 0.9 1.0ep
0
20
40
60
80
100
%
0 < zmax (kpc)≤ 0.50.5< zmax (kpc)≤ 1
1< zmax (kpc)≤ 2zmax (kpc)> 2
0.0 0.1 0.2 0.3 0.4 0.5 0.6 0.7 0.8 0.9 1.0ep
0
20
40
60
80
100
%
0 < zmax (kpc)≤ 0.50.5< zmax (kpc)≤ 1
1< zmax (kpc)≤ 2zmax (kpc)> 2
Fig. 6 Cumulative number of RC stars in the ep parameter for the MW (left panel) and MWBS (right panel) potentialmodels. The solid lines represent 0 < zmax ≤ 0.5 (red), 0.5 < zmax ≤ 1 (green), 1 < zmax ≤ 2 (blue) and zmax > 2 kpc(purple) distance intervals. The orange dashed lines represent the ep = 0.5 limit where at least 90% of the RC stars residein the first three distance intervals.
ep
−0.6
−0.5
−0.4
−0.3
−0.2
[Fe/
H] (d
ex)
0 < zmax (kpc)≤ 0.50.5< zmax (kpc)≤ 1
1< zmax (kpc)≤ 2zmax (kpc)> 2
ep
8.5
9.0
9.5
10.0
10.5
R a (k
pc)
ep
5
6
7
8
R p (k
pc)
ep
3.5
4.0
4.5
5.0
Age
(Gy
)
0.00 0.05 0.10 0.15 0.20 0.25 0.30 0.35 0.40ep
−0.10
−0.05
0.00
0.05
0.10
d[Fe
/H]/d
R m
(dex
kpc−
1 )
ep
−0.6
−0.5
−0.4
−0.3
−0.2
[Fe/
H] (d
ex)
0 < zmax (kpc)≤ 0.50.5< zmax (kpc)≤ 1
1< zmax (kpc)≤ 2zmax (kpc)> 2
ep
8.5
9.0
9.5
10.0
10.5
R a (k
pc)
ep
5
6
7
8
R p (k
pc)
ep
3.5
4.0
4.5
5.0
Age
(Gy
)
0.00 0.05 0.10 0.15 0.20 0.25 0.30 0.35 0.40ep
−0.10
−0.05
0.00
0.05
0.10
d[Fe
/H]/d
R m
(dex
kpc−
1 )
Fig. 7 Planar eccentricity versus metallicity, apo- and peri-galactic distances, age, and the radial metallicity gradientsshown from the top to the bottom panels for the MW (left) and MWBS (right) potential models, respectively. Colouredlines represent the four zmax distance intervals, as in Fig. 6.
10
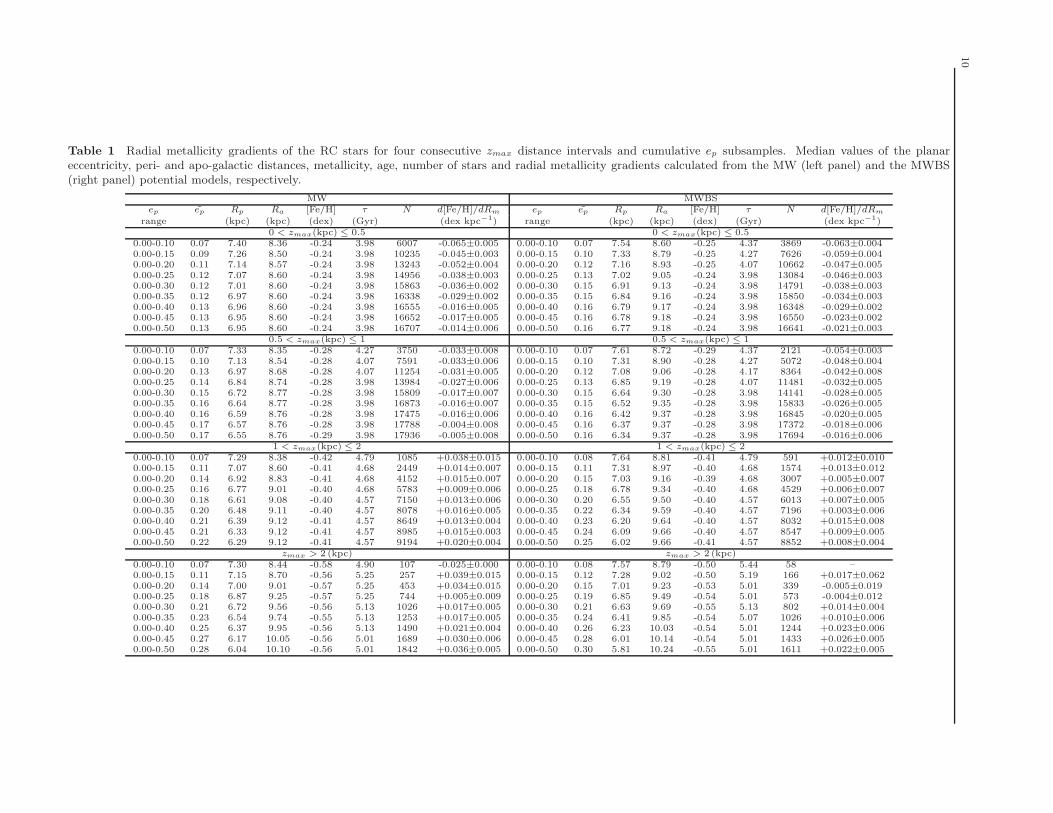
Table 1 Radial metallicity gradients of the RC stars for four consecutive zmax distance intervals and cumulative ep subsamples. Median values of the planareccentricity, peri- and apo-galactic distances, metallicity, age, number of stars and radial metallicity gradients calculated from the MW (left panel) and the MWBS(right panel) potential models, respectively.
MW MWBSep ep Rp Ra [Fe/H] τ N d[Fe/H]/dRm ep ep Rp Ra [Fe/H] τ N d[Fe/H]/dRm
range (kpc) (kpc) (dex) (Gyr) (dex kpc−1) range (kpc) (kpc) (dex) (Gyr) (dex kpc−1)0 < zmax(kpc) ≤ 0.5 0 < zmax(kpc) ≤ 0.5
0.00-0.10 0.07 7.40 8.36 -0.24 3.98 6007 -0.065±0.005 0.00-0.10 0.07 7.54 8.60 -0.25 4.37 3869 -0.063±0.0040.00-0.15 0.09 7.26 8.50 -0.24 3.98 10235 -0.045±0.003 0.00-0.15 0.10 7.33 8.79 -0.25 4.27 7626 -0.059±0.0040.00-0.20 0.11 7.14 8.57 -0.24 3.98 13243 -0.052±0.004 0.00-0.20 0.12 7.16 8.93 -0.25 4.07 10662 -0.047±0.0050.00-0.25 0.12 7.07 8.60 -0.24 3.98 14956 -0.038±0.003 0.00-0.25 0.13 7.02 9.05 -0.24 3.98 13084 -0.046±0.0030.00-0.30 0.12 7.01 8.60 -0.24 3.98 15863 -0.036±0.002 0.00-0.30 0.15 6.91 9.13 -0.24 3.98 14791 -0.038±0.0030.00-0.35 0.12 6.97 8.60 -0.24 3.98 16338 -0.029±0.002 0.00-0.35 0.15 6.84 9.16 -0.24 3.98 15850 -0.034±0.0030.00-0.40 0.13 6.96 8.60 -0.24 3.98 16555 -0.016±0.005 0.00-0.40 0.16 6.79 9.17 -0.24 3.98 16348 -0.029±0.0020.00-0.45 0.13 6.95 8.60 -0.24 3.98 16652 -0.017±0.005 0.00-0.45 0.16 6.78 9.18 -0.24 3.98 16550 -0.023±0.0020.00-0.50 0.13 6.95 8.60 -0.24 3.98 16707 -0.014±0.006 0.00-0.50 0.16 6.77 9.18 -0.24 3.98 16641 -0.021±0.003
0.5 < zmax(kpc) ≤ 1 0.5 < zmax(kpc) ≤ 10.00-0.10 0.07 7.33 8.35 -0.28 4.27 3750 -0.033±0.008 0.00-0.10 0.07 7.61 8.72 -0.29 4.37 2121 -0.054±0.0030.00-0.15 0.10 7.13 8.54 -0.28 4.07 7591 -0.033±0.006 0.00-0.15 0.10 7.31 8.90 -0.28 4.27 5072 -0.048±0.0040.00-0.20 0.13 6.97 8.68 -0.28 4.07 11254 -0.031±0.005 0.00-0.20 0.12 7.08 9.06 -0.28 4.17 8364 -0.042±0.0080.00-0.25 0.14 6.84 8.74 -0.28 3.98 13984 -0.027±0.006 0.00-0.25 0.13 6.85 9.19 -0.28 4.07 11481 -0.032±0.0050.00-0.30 0.15 6.72 8.77 -0.28 3.98 15809 -0.017±0.007 0.00-0.30 0.15 6.64 9.30 -0.28 3.98 14141 -0.028±0.0050.00-0.35 0.16 6.64 8.77 -0.28 3.98 16873 -0.016±0.007 0.00-0.35 0.15 6.52 9.35 -0.28 3.98 15833 -0.026±0.0050.00-0.40 0.16 6.59 8.76 -0.28 3.98 17475 -0.016±0.006 0.00-0.40 0.16 6.42 9.37 -0.28 3.98 16845 -0.020±0.0050.00-0.45 0.17 6.57 8.76 -0.28 3.98 17788 -0.004±0.008 0.00-0.45 0.16 6.37 9.37 -0.28 3.98 17372 -0.018±0.0060.00-0.50 0.17 6.55 8.76 -0.29 3.98 17936 -0.005±0.008 0.00-0.50 0.16 6.34 9.37 -0.28 3.98 17694 -0.016±0.006
1 < zmax(kpc) ≤ 2 1 < zmax(kpc) ≤ 20.00-0.10 0.07 7.29 8.38 -0.42 4.79 1085 +0.038±0.015 0.00-0.10 0.08 7.64 8.81 -0.41 4.79 591 +0.012±0.0100.00-0.15 0.11 7.07 8.60 -0.41 4.68 2449 +0.014±0.007 0.00-0.15 0.11 7.31 8.97 -0.40 4.68 1574 +0.013±0.0120.00-0.20 0.14 6.92 8.83 -0.41 4.68 4152 +0.015±0.007 0.00-0.20 0.15 7.03 9.16 -0.39 4.68 3007 +0.005±0.0070.00-0.25 0.16 6.77 9.01 -0.40 4.68 5783 +0.009±0.006 0.00-0.25 0.18 6.78 9.34 -0.40 4.68 4529 +0.006±0.0070.00-0.30 0.18 6.61 9.08 -0.40 4.57 7150 +0.013±0.006 0.00-0.30 0.20 6.55 9.50 -0.40 4.57 6013 +0.007±0.0050.00-0.35 0.20 6.48 9.11 -0.40 4.57 8078 +0.016±0.005 0.00-0.35 0.22 6.34 9.59 -0.40 4.57 7196 +0.003±0.0060.00-0.40 0.21 6.39 9.12 -0.41 4.57 8649 +0.013±0.004 0.00-0.40 0.23 6.20 9.64 -0.40 4.57 8032 +0.015±0.0080.00-0.45 0.21 6.33 9.12 -0.41 4.57 8985 +0.015±0.003 0.00-0.45 0.24 6.09 9.66 -0.40 4.57 8547 +0.009±0.0050.00-0.50 0.22 6.29 9.12 -0.41 4.57 9194 +0.020±0.004 0.00-0.50 0.25 6.02 9.66 -0.41 4.57 8852 +0.008±0.004
zmax > 2 (kpc) zmax > 2 (kpc)0.00-0.10 0.07 7.30 8.44 -0.58 4.90 107 -0.025±0.000 0.00-0.10 0.08 7.57 8.79 -0.50 5.44 58 –0.00-0.15 0.11 7.15 8.70 -0.56 5.25 257 +0.039±0.015 0.00-0.15 0.12 7.28 9.02 -0.50 5.19 166 +0.017±0.0620.00-0.20 0.14 7.00 9.01 -0.57 5.25 453 +0.034±0.015 0.00-0.20 0.15 7.01 9.23 -0.53 5.01 339 -0.005±0.0190.00-0.25 0.18 6.87 9.25 -0.57 5.25 744 +0.005±0.009 0.00-0.25 0.19 6.85 9.49 -0.54 5.01 573 -0.004±0.0120.00-0.30 0.21 6.72 9.56 -0.56 5.13 1026 +0.017±0.005 0.00-0.30 0.21 6.63 9.69 -0.55 5.13 802 +0.014±0.0040.00-0.35 0.23 6.54 9.74 -0.55 5.13 1253 +0.017±0.005 0.00-0.35 0.24 6.41 9.85 -0.54 5.07 1026 +0.010±0.0060.00-0.40 0.25 6.37 9.95 -0.56 5.13 1490 +0.021±0.004 0.00-0.40 0.26 6.23 10.03 -0.54 5.01 1244 +0.023±0.0060.00-0.45 0.27 6.17 10.05 -0.56 5.01 1689 +0.030±0.006 0.00-0.45 0.28 6.01 10.14 -0.54 5.01 1433 +0.026±0.0050.00-0.50 0.28 6.04 10.10 -0.56 5.01 1842 +0.036±0.005 0.00-0.50 0.30 5.81 10.24 -0.55 5.01 1611 +0.022±0.005

11
The median of the planar eccentricities of all RC
stars up to ep = 0.5 varies between 0.13 and 0.28 whenthe samples change from distances 0 < zmax ≤ 0.5 kpc
to zmax > 2 kpc distances. Median metallicities for
each zmax interval are found almost constant and be-
come more metal poor as the vertical distance from theGalactic plane is increased. The median metallicities
are -0.24, -0.28, -0.41 and -0.56 dex for 0 < zmax ≤ 0.5,
0.5 < zmax ≤ 1, 1 < zmax ≤ 2 and zmax > 2
kpc, respectively. Similarly, the median ages of the
RC stars are 3.98, 3.98, 4.57 and 5.13 Gyrs for the0 < zmax ≤ 0.5, 0.5 < zmax ≤ 1, zmax ≤ 2 and
zmax > 2 kpc distance intervals, respectively. The re-
sults show that RC samples are becoming more metal
poor and old from the 0 < zmax ≤ 0.5 to the zmax > 2kpc distance intervals for the MW potential model.
The radial metallicity gradients obtained for the
MW potential have the highest value for ep ≤ 0.1 in
the 0 < zmax ≤ 0.5 kpc distance interval, given by
-0.065±0.005 dex kpc−1, and then it decreases to -0.014±0.006 dex kpc−1 in ep ≤ 0.5. This implies that
the metallicity gradients become positive as the more
eccentric orbits added subsequently into the sample. A
similar behaviour is found for 0.5 < zmax ≤ 1 kpc dis-tance interval, in which it takes the values -0.033±0.008
and -0.005±0.008 dex kpc−1 for ep ≤ 0.1 and ep ≤ 0.5,
respectively. For 1 < zmax ≤ 2 kpc and zmax > 2
kpc distance intervals, the radial metallicity gradients
nearly vanish with tiny values.
4.1.2 According to MWBS Potential Model
In order to see the effects of the Galactic bar and thetransient spiral arms on the stellar orbits, the mean
Galactocentric distances of the RC stars are calculated
with the MWBS potential and the sample divided into
the aforementioned four zmax intervals, accordingly.
The results are listed and shown on the right panel ofTable 1 and Fig. 7, respectively.
The median values of ep vary between 0.16 and 0.30
from 0 < zmax ≤ 0.5 to zmax > 2 kpc distance inter-
vals, respectively. The median metallicities show thesame behaviour as for the MW potential, and have val-
ues -0.24, -0.28, -0.40 and -0.54 dex for 0 < zmax ≤ 0.5,
0.5 < zmax ≤ 1, zmax ≤ 2 and zmax > 2 kpc, re-
spectively. The median RC ages also progress in the
same trend as for the MW potential model, we find3.98, 3.98, 4.57 and 5.01 Gyrs for 0 < zmax ≤ 0.5,
0.5 < zmax ≤ 1, zmax ≤ 2 and zmax > 2 kpc distance
intervals, respectively. The results show that RC sam-
ples likewise becoming more metal poor and older from0 < zmax ≤ 0.5 to zmax > 2 kpc distance intervals,
this suggests that the ep, [Fe/H] and τ parameters cal-
culated for the MWBS potential model show the sametrends as seen in the MW potential model.
The radial metallicity gradients obtained under the
assumption of the MWBS potential have the steepest
value, -0.063 ± 0.004 dex kpc−1, for the ep ≤ 0.1 sub-sample in the 0 < zmax ≤ 0.5 kpc distance interval.
The gradients become flatter as more eccentric orbits
are added to the subsamples giving, -0.021±0.003 dex
kpc−1, for ep ≤ 0.5. In 0.5 < zmax ≤ 1 kpc dis-
tance interval, the metallicity gradients tend to becomeshallower, but still have negative values (about −0.032
dex kpc−1), like in the 0 < zmax ≤ 0.5 kpc inter-
val, and their values vary between -0.054±0.003 and
-0.016±0.006 dex kpc−1, from ep ≤ 0.1 to ep ≤ 0.5, re-spectively. For the 1 < zmax ≤ 2 kpc distance interval,
the radial metallicity gradients are nearly flat, having
positive values closer to zero, except for ep ≤ 0.1 where
+0.012±0.010 dex kpc−1, but this ep subsample is af-
fected from the small number of stars, which is almostthree times lower than the next ep subsample. The
first subsample, ep ≤ 0.1, for a distance zmax > 2 kpc
is ignored because the number of stars (N = 58) are
statistically low. The radial metallicity gradients tendto remain flat and have positive values.
4.1.3 Stellar Orbits and Galactic Resonance Regions
As the number of stars with eccentric orbits increases inthe ep subsamples, the radial metallicity gradients be-
come positive in the 0 < zmax ≤ 0.5 and 0.5 < zmax ≤ 1
kpc distance intervals for both the MW and MWBS
potential models. It can be deduced that as the planareccentricities of the disc stars in these distance intervals
increase, they move closer towards the Galactic centre,
and as a consequence their orbits become perturbed
by various phenomena from the inner Galactic regions.
In order to investigate these perturbation effects, RCstars in the zmax intervals mentioned above are sepa-
rated into discrete ep subsamples up to ep = 0.5 with
∆ep = 0.05 steps. Output parameters such as the me-
dian values of eccentricity, peri- and apo-galactic dis-tances, metallicity, age, the number of RC stars and the
radial metallicity gradients are re-calculated for both of
the potential models. The results are listed in Table 2.
According to re-calculations the median values of epvary between 0.07 and 0.47 from the 0 < ep ≤ 0.1to the 0.45 < ep ≤ 0.5 subsamples, respectively, in
the 0 < zmax ≤ 0.5 and 0.5 < zmax ≤ 1 kpc dis-
tance intervals for both potential models. The peri-
galactic distances of the RC stars in both zmax inter-vals for the MW potential model gives 7.40 kpc value
for 0 < ep ≤ 0.1 subsamples and it decreases down to
12
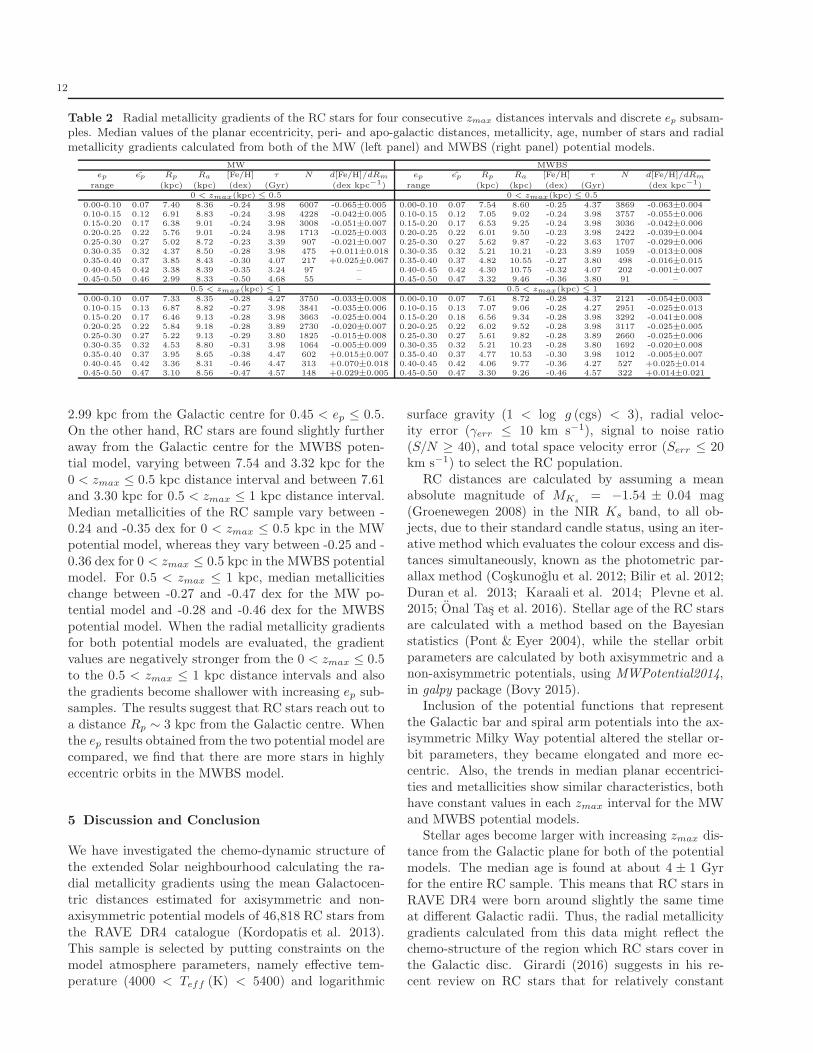
Table 2 Radial metallicity gradients of the RC stars for four consecutive zmax distances intervals and discrete ep subsam-ples. Median values of the planar eccentricity, peri- and apo-galactic distances, metallicity, age, number of stars and radialmetallicity gradients calculated from both of the MW (left panel) and MWBS (right panel) potential models.
MW MWBSep ep Rp Ra [Fe/H] τ N d[Fe/H]/dRm ep ep Rp Ra [Fe/H] τ N d[Fe/H]/dRm
range (kpc) (kpc) (dex) (Gyr) (dex kpc−1) range (kpc) (kpc) (dex) (Gyr) (dex kpc−1)0 < zmax(kpc) ≤ 0.5 0 < zmax(kpc) ≤ 0.5
0.00-0.10 0.07 7.40 8.36 -0.24 3.98 6007 -0.065±0.005 0.00-0.10 0.07 7.54 8.60 -0.25 4.37 3869 -0.063±0.0040.10-0.15 0.12 6.91 8.83 -0.24 3.98 4228 -0.042±0.005 0.10-0.15 0.12 7.05 9.02 -0.24 3.98 3757 -0.055±0.0060.15-0.20 0.17 6.38 9.01 -0.24 3.98 3008 -0.051±0.007 0.15-0.20 0.17 6.53 9.25 -0.24 3.98 3036 -0.042±0.0060.20-0.25 0.22 5.76 9.01 -0.24 3.98 1713 -0.025±0.003 0.20-0.25 0.22 6.01 9.50 -0.23 3.98 2422 -0.039±0.0040.25-0.30 0.27 5.02 8.72 -0.23 3.39 907 -0.021±0.007 0.25-0.30 0.27 5.62 9.87 -0.22 3.63 1707 -0.029±0.0060.30-0.35 0.32 4.37 8.50 -0.28 3.98 475 +0.011±0.018 0.30-0.35 0.32 5.21 10.21 -0.23 3.89 1059 -0.013±0.0080.35-0.40 0.37 3.85 8.43 -0.30 4.07 217 +0.025±0.067 0.35-0.40 0.37 4.82 10.55 -0.27 3.80 498 -0.016±0.0150.40-0.45 0.42 3.38 8.39 -0.35 3.24 97 – 0.40-0.45 0.42 4.30 10.75 -0.32 4.07 202 -0.001±0.0070.45-0.50 0.46 2.99 8.33 -0.50 4.68 55 – 0.45-0.50 0.47 3.32 9.46 -0.36 3.80 91 –
0.5 < zmax(kpc) ≤ 1 0.5 < zmax(kpc) ≤ 10.00-0.10 0.07 7.33 8.35 -0.28 4.27 3750 -0.033±0.008 0.00-0.10 0.07 7.61 8.72 -0.28 4.37 2121 -0.054±0.0030.10-0.15 0.13 6.87 8.82 -0.27 3.98 3841 -0.035±0.006 0.10-0.15 0.13 7.07 9.06 -0.28 4.27 2951 -0.025±0.0130.15-0.20 0.17 6.46 9.13 -0.28 3.98 3663 -0.025±0.004 0.15-0.20 0.18 6.56 9.34 -0.28 3.98 3292 -0.041±0.0080.20-0.25 0.22 5.84 9.18 -0.28 3.89 2730 -0.020±0.007 0.20-0.25 0.22 6.02 9.52 -0.28 3.98 3117 -0.025±0.0050.25-0.30 0.27 5.22 9.13 -0.29 3.80 1825 -0.015±0.008 0.25-0.30 0.27 5.61 9.82 -0.28 3.89 2660 -0.025±0.0060.30-0.35 0.32 4.53 8.80 -0.31 3.98 1064 -0.005±0.009 0.30-0.35 0.32 5.21 10.23 -0.28 3.80 1692 -0.020±0.0080.35-0.40 0.37 3.95 8.65 -0.38 4.47 602 +0.015±0.007 0.35-0.40 0.37 4.77 10.53 -0.30 3.98 1012 -0.005±0.0070.40-0.45 0.42 3.36 8.31 -0.46 4.47 313 +0.070±0.018 0.40-0.45 0.42 4.06 9.77 -0.36 4.27 527 +0.025±0.0140.45-0.50 0.47 3.10 8.56 -0.47 4.57 148 +0.029±0.005 0.45-0.50 0.47 3.30 9.26 -0.46 4.57 322 +0.014±0.021
2.99 kpc from the Galactic centre for 0.45 < ep ≤ 0.5.On the other hand, RC stars are found slightly furtheraway from the Galactic centre for the MWBS poten-tial model, varying between 7.54 and 3.32 kpc for the0 < zmax ≤ 0.5 kpc distance interval and between 7.61and 3.30 kpc for 0.5 < zmax ≤ 1 kpc distance interval.Median metallicities of the RC sample vary between -0.24 and -0.35 dex for 0 < zmax ≤ 0.5 kpc in the MWpotential model, whereas they vary between -0.25 and -0.36 dex for 0 < zmax ≤ 0.5 kpc in the MWBS potentialmodel. For 0.5 < zmax ≤ 1 kpc, median metallicitieschange between -0.27 and -0.47 dex for the MW po-tential model and -0.28 and -0.46 dex for the MWBSpotential model. When the radial metallicity gradientsfor both potential models are evaluated, the gradientvalues are negatively stronger from the 0 < zmax ≤ 0.5to the 0.5 < zmax ≤ 1 kpc distance intervals and alsothe gradients become shallower with increasing ep sub-samples. The results suggest that RC stars reach out toa distance Rp ∼ 3 kpc from the Galactic centre. Whenthe ep results obtained from the two potential model arecompared, we find that there are more stars in highlyeccentric orbits in the MWBS model.
5 Discussion and Conclusion
We have investigated the chemo-dynamic structure ofthe extended Solar neighbourhood calculating the ra-dial metallicity gradients using the mean Galactocen-tric distances estimated for axisymmetric and non-axisymmetric potential models of 46,818 RC stars fromthe RAVE DR4 catalogue (Kordopatis et al. 2013).This sample is selected by putting constraints on themodel atmosphere parameters, namely effective tem-perature (4000 < Teff (K) < 5400) and logarithmic
surface gravity (1 < log g (cgs) < 3), radial veloc-ity error (γerr ≤ 10 km s−1), signal to noise ratio(S/N ≥ 40), and total space velocity error (Serr ≤ 20km s−1) to select the RC population.
RC distances are calculated by assuming a meanabsolute magnitude of MKs
= −1.54 ± 0.04 mag(Groenewegen 2008) in the NIR Ks band, to all ob-jects, due to their standard candle status, using an iter-ative method which evaluates the colour excess and dis-tances simultaneously, known as the photometric par-allax method (Coskunoglu et al. 2012; Bilir et al. 2012;Duran et al. 2013; Karaali et al. 2014; Plevne et al.2015; Onal Tas et al. 2016). Stellar age of the RC starsare calculated with a method based on the Bayesianstatistics (Pont & Eyer 2004), while the stellar orbitparameters are calculated by both axisymmetric and anon-axisymmetric potentials, using MWPotential2014,in galpy package (Bovy 2015).
Inclusion of the potential functions that representthe Galactic bar and spiral arm potentials into the ax-isymmetric Milky Way potential altered the stellar or-bit parameters, they became elongated and more ec-centric. Also, the trends in median planar eccentrici-ties and metallicities show similar characteristics, bothhave constant values in each zmax interval for the MWand MWBS potential models.
Stellar ages become larger with increasing zmax dis-tance from the Galactic plane for both of the potentialmodels. The median age is found at about 4 ± 1 Gyrfor the entire RC sample. This means that RC stars inRAVE DR4 were born around slightly the same timeat different Galactic radii. Thus, the radial metallicitygradients calculated from this data might reflect thechemo-structure of the region which RC stars cover inthe Galactic disc. Girardi (2016) suggests in his re-cent review on RC stars that for relatively constant

13
star formation rate the average stellar age for the RC
population is somewhere between 1 and 4 Gyrs. Thisis in accordance with our median RC age for the Solar
neighbourhood.
In order to asses the selected effects in metallicity
and kinematics in the data, the RAVE DR4 RC sam-ple is divided into three apparent magnitude intervals:
9 < I ≤ 9.75, 9.75 < I < 10.4, and 10.4 < I ≤ 11.3
mag, which include in the RAVE sample almost the
same number of stars (Fig. 8). To assess the bias in
metallicities the stellar distribution is plotted for eachmagnitude interval. We find the mode of the distribu-
tion is at -0.30 dex skewed right for each I magnitude
interval. Also, the dispersion in metallicity increase
as the brightness decreases. A similar assessment isperformed for kinematics plotting Toomre diagrams in
three I magnitude intervals. In each Toomre diagram,
the total space velocity limits are shown with 50 km−1
increment in red lines. According to the diagram most
of the RC stars lie within VLSR = 150 km−1. Moreover,the total space velocity dispersions vary between 29 and
38 km s−1 as the I magnitude intervals increase, but
this variation is negligible. These results suggest that
RC stars in our sample are analogous in kinematics andmetallicity, thus we can conclude that our RAVE DR4
RC sample is unbiased. Similar results are obtained in
Wojno et al. (2017)’s study that discuss the selection
effects in kinematics and metallicity of all RAVE stars.
Finally, this analysis concurs with Wojno et al. (2017)’sresults.
Tracer objects such as main-sequence, turn-off, red
giant branch, and RC stars, cepheid variables, O-B as-
sociations, open and globular clusters, planetary neb-ulae and HII regions, are used in both the radial and
vertical metallicity gradients in the literature. These
gradients are obtained for three distinct distance indi-
cators, which are the current Galactocentric distance
(Rgc) of stars, the mean Galactocentric distance of thecomplete orbit of stars (Rm) and the guiding radii of the
stellar orbits (Rg). According to the radial metallicity
gradient studies in the literature, the gradient values
easily change when the tracer population or the dis-tance indicator is set differently, but their trends do
not. This is a challenge to the chemical/cosmic clock
approach that serves the logic under the inside-out for-
mation scenario of the Galactic disc. Jacobson et al.
(2016) used open clusters that lie in the 6 < Rgc < 12kpc distance interval to calculate the radial metal-
licity gradient as −0.100 ± 0.020 dex kpc−1, while
Genovali et al. (2014) used cepheid variables that lie
in the 5 < Rgc < 19 kpc distance interval and ob-tained −0.021 ± 0.029 dex kpc−1. Chen et al. (2003)
also used Galactic orbit parameters of open clusters
that lie within the 6 < Rgc < 15 kpc distance interval
and the obtained gradient is −0.063± 0.008 dex kpc−1.Compilation of detailed results of radial and vertical
metallicity gradient studies between the years 2000 and
2016 especially from sky surveys are presented in Table
1 of Onal Tas et al. (2016). These studies show that theradial metallicity gradients give different results when
either the tracer objects are chosen differently, or the
radial extents from the Galactic center vary, and the
only common property is their negative trend.
Another perspective lies in the recent studies thatuse guiding radii as distance indicator for the radial
metallicity gradient calculations from RAVE DR4 data.
Plevne et al. (2015) and Boeche et al. (2013) used F-G
spectral type main-sequence stars with different sampleselection methods and their calculated radial metallic-
ity gradients are −0.083 ± 0.030 dex kpc−1 for 0 <
zmax ≤ 0.5 kpc and −0.065 ± 0.003 dex kpc−1 for
zmax ≤ 0.4 kpc, respectively. Moreover, Boeche et al.
(2014) calculated metallicity gradients from RC starsand found −0.054 ± 0.004 dex kpc−1 for zmax ≤ 0.4
kpc. These results are either caused by the differences
in the sample selection or the chosen distance parame-
ter. This shows that even from the same data source themetallicity gradients can give different results. How can
one find the traces of the chemical clocks of the inside-
out scenario by not depending on the tracer object.
A new approach to this problem is introduced us-
ing the planar eccentricity and maximum vertical dis-tance from the Galactic plane (Plevne et al. 2015;
Onal Tas et al. 2016). Onal Tas et al. (2016) is mainly
focused on the radial metallicity gradients which are
calculated for the mean Galactocentric distances of RCstars selected from the RAVE DR4 catalogue. The
median distance of this sample is 1 kpc. The radial
metallicity gradient is found as −0.025 ± 0.002 dex
kpc−1 for all of the objects in the 0 < zmax ≤ 0.5
kpc distance interval. Then, the planar eccentricity pa-rameter is constrained by cumulatively increasing the
ep subsamples. The steepest radial metallicity gradient
value is −0.089 ± 0.002 dex kpc−1 for the ep ≤ 0.05
subsample. This result is in good agreement with themetallicity gradient of F-G spectral type main-sequence
sample of Plevne et al. (2015), constrained by ep ≤ 0.1
and zmax ≤ 825 pc. They found the gradient in the
0 < zmax ≤ 0.5 kpc distance interval as −0.083± 0.030
dex kpc−1, as well. Both samples are representing boththe Galactic thin disc and open star clusters. These
metallicity gradient studies obtained with RAVE data
are also in good agreement with Wu et al. (2009)’s
study in which they determined the open cluster ra-dial metallicity gradient in Rm, for stars that lie in the
6 < Rgc < 20 kpc distance interval close to the Galactic

14
Fig. 8 Metallicity (left panels) and Toomre diagrams (right panels) of RAVE DR4 RC stars in three I apparent magnitudeintervals: 9 < I ≤ 9.75, 9.75 < I < 10.4, and 10.4 < I ≤ 11.3 mag. The colour coding in the Toomre diagrams representthe logarithmic number of stars.
plane and find, −0.082± 0.014 dex kpc−1. These find-
ings suggest that the radial metallicity gradients are a
function of ep and zmax. These dependencies can be
determined by investigating the effects of phenomenain the Galactic disc.
This study introduces the planar eccentricity limits
that coincide with the Galactocentric radii where the
positions of the well-known resonance regions. Radialmetallicity gradients show a general trend of flattening
with increasing planar eccentricity and also their values
become more positive with increasing vertical distance
from the Galactic plane. This trend has been found
for both of the potential models. We noticed that oncewe eliminated the RC stars with more eccentric orbits,
the radial metallicity gradients become steeper. We
also put a schematic diagram for RC stars which show
their orbital extensions towards the inner Galaxy. Fig.9 helps to spot whether the sample stars are inside a
resonance region, i.e. CR or OLR, or not, from the
interrelation between the planar eccentricity and peri-
galactic distance parameters in 0 < zmax ≤ 0.5 and
0.5 < zmax ≤ 1 kpc intervals for the MW and MWBS
potential models. The radial coverage of the CR and
OLR regions are taken from Dehnen (2000). According
to the schematic diagram, RC stars under the influ-ence of an axisymmetrical potential reach down to 3
kpc distance from the Galactic centre, whereas for the
MWBS potential model the peri-galactic distances in-
crease by ∼ 0.3 kpc (Rp = 3.3 kpc). This is anotherdemonstration of what happens to stellar orbits when
major perturbers are considered in potential calcula-
tions. The schematic diagram in Fig. 9 shows that the
limit of OLR is where the RC stars have planar eccen-
tricities between 0 < ep < 0.2 for both zmax intervalsfor the MW potential model, whereas the planar eccen-
tricity range is slightly larger, 0 < ep < 0.22, for both
zmax distance intervals for the MWBS potential model.
Meanwhile, there is almost a 1 kpc gap between CR andOLR regions and this is reflected on planar eccentric-
ities of the MW potential as 0.20 < ep < 0.27 for the
0 < zmax ≤ 0.5 kpc and 0.5 < zmax ≤ 1 kpc distance
intervals. Results from the MWBS potential seem to be

15
0 1 2 3 4 5 6 7 8 9 10RGC (kpc)
Rp (kpc) ep
Rp (kpc) ep
0.037.62
0.047.56
0.087.29
0.087.25
0.126.91
0.136.87
0.176.38
0.176.46
0.225.76
0.225.84
0.275.02
0.275.22
0.324.37
0.324.53
0.373.85
0.373.95
0.423.38
0.423.36
0.462.99
0.473.10
0.047.85
0.047.98
0.087.44
0.087.50
0.127.05
0.137.07
0.176.53
0.186.56
0.226.01
0.226.02
0.275.62
0.275.61
0.325.21
0.325.21
0.374.82
0.374.77
0.424.30
0.424.06
0.473.32
0.473.30
Rp (kpc) ep
Rp (kpc) ep
CR OLR
MW
MWBS
SunGC
BulgeZmax (kpc) ≤ 0.5
0.5<Zmax (kpc) ≤ 1.0
Zmax (kpc) ≤ 0.5
0.5<Zmax (kpc) ≤ 1.0
Fig. 9 Galactic map showing the whereabouts of the Galactic centre, bulge, CR, OLR and the Sun (at R0 = 8 kpc)along with the peri-galactic distances with corresponding planar eccentricities calculated only for 0 < zmax ≤ 0.5 and0.5 < zmax ≤ 1 kpc distance intervals that show considerable radial metallicity gradients in MW and MWBS potentialmodels. Line colours are the same as in Figs. 6 and 7 for the two zmax intervals. The Galactocentric positions of CR andOLR are taken from Dehnen (2000)’s study.
more compact and vary within 0.22 < ep < 0.36. Basedon Fig. 9, stellar orbits calculated from the MW po-tential model reach beyond the CR region, meanwhilestellar orbits of the MWBS potential model only reachinto the vicinity of the CR region. The radial metal-licity gradients calculated from the discrete ep subsam-ples are becoming shallow as the eccentricity ranges in-crease. In Fig. 9, the RC subsamples with eccentricorbits reach out to 3 kpc distance towards the Galac-tic center. Thus, once the samples that might originatefrom slightly inner Galactic radii are excluded, then theradial metallicity gradients become more authentic forthe Solar neighbourhood. We claim that this apparentchange in radial metallicity gradients in the thin discis a result of the RC stars perturbed from the existingresonance regions, the largest radial metallicity gradi-ents are obtained where the outer Lindblad resonanceregion is effective.
Ultimately, this study can be improved by combiningthe model atmosphere parameters and radial velocitiescoming from new HRS observations and trigonometricparallaxes and proper motions coming from the Gaia
astrometry satellite. This will provide more reliableinputs from kinematic and dynamic orbit analysis andgive more realistic results about the perturbation effectsin the inner Galaxy and their reflection in the Solarneighbourhood.
6 Acknowledgments
The authors are grateful to the anonymous referee
for his/her considerable contributions to improve the
paper. This study has been supported in part bythe Scientific and Technological Research Council
(TUBITAK) 114F347 and the Research Fund of the
University of Istanbul, Project Number: 24292. This
study is a part of the PhD thesis of Ozgecan Onal Tas.This research has made use of NASA’s (National Aero-
nautics and Space Administration) Astrophysics Data
System and the SIMBAD Astronomical Database, op-
erated at CDS, Strasbourg, France and NASA/IPAC
Infrared Science Archive, which is operated by the JetPropulsion Laboratory, California Institute of Technol-
ogy, under contract with the National Aeronautics and
Space Administration. Also, the authors are grateful
to Prof. Dr. Salih Karaali and Dr. Kai O. Schwenzerfor their contributions on revising the paper.

16
References
Allende, P. C., Majewski, S. R., Shiavon, R., et al., 2008,AN, 329, 1018
Antoja, T., Valenzuela, O., Pichardo, B., et al., 2009, ApJ,700, 78
Antoja, T., Monari, G., Helmi, A., et al., 2015, ApJ, 800,32
Bahcall, J. N., Soneira, R. M., 1980, ApJS, 44, 73Bilir, S., Karaali, S., Ak, S., et al., 2012, MNRAS, 421, 3362Binney, J., Tremaine, S., 2008, Galactic Dynamics Second
Edition (Princeton University Press)Bland-Hawthorn, J., Gerhard, O., 2016, ARA&A, 54, 529Boeche, C., Siebert, A., Piffl, T., et al., 2013, A&A, 559A,
59Boeche, C., Siebert, A., Piffl, T., et al., 2014, A&A, 568A,
71Bovy, J., 2015, ApJS, 216, 29Bressan, A., Marigo, P. et al., 2012, MNRAS, 427,127Chen, L., Hou, J. L., Wang, J. J., 2003, AJ, 125, 1397Chiappini, C., Matteucci, F., Gratton, R., 1997, ApJ, 477,
765Chiappini, C., 2001, AmSci, 89, 506Coskunoglu, B., Ak, S., Bilir, S., et al., 2011, MNRAS, 412,
1237Coskunoglu, B., Ak, S., Bilir, S., et al., 2012, MNRAS, 419,
2844Cutri, R. M., et al., 2003, 2MASS All-Sky Catalog of Point
Sources, CDS/ADC Electronic Catalogues, 2246Dehnen, W., 2000, AJ, 119, 800De Silva, G. M., Freeman, K. C., Bland-Hawthorn, J., et
al., 2015, MNRAS, 449, 2604Duran, S., Ak, S., Bilir, S., et al., 2013, PASA, 30, e043Eggen, O. J., Lynden-Bell, D., Sandage, A. R., 1962, ApJ,
136, 748ESA, 1997, The Hipparcos and Tycho Catalogues, ESA SP-
1200. ESA, NoordwijkFreeman, H., Bland-Hawthorn, 2002, ARA&A, 40, 487Fux, R., 1999, A&A, 345, 787Gaia Collabration, Prusti, T., de Bruijne, J. H. J., et al.,
2016, A&A, 595, 1Genovali, K., Lemasle, B., Bono, G., et al., 2014, A&A, 566,
37Gilmore, G., Randich, S., Asplund, M., et al., 2012, Msngr,
147,25Girardi, L., 1999, MNRAS, 308, 818Girardi, L., 2016, ARA&A, 54, 95Groenewegen, M. A. T., 2008, A&A, 488, 25Hayden, M. R., Bovy, J., Holtzman, J. A., et al., 2015, ApJ,
808, 132Jacobson, H. R., Friel, E. D., Jlkov, L., et al., 2016, A&A,
591, 37Johnson, D. R. H., Soderblom, D. R., 1987, AJ, 93, 864Jørgensen, B. R., Lindegren, L., 2005, A&A, 436, 127Karaali, S., Bilir, S., Ak, S., Gokce, E. Yaz, Onal Tas, O.,
Ak, T., 2014, PASA, 31, 13Kordopatis, G., Gilmore, G., Steinmetz, M., et al., 2013,
AJ, 146, 134Majewski, S. R., 1993, ARA&A, 31, 575Mihalas, D., Binney, J., 1981. in Galactic Astronomy, 2nd
edition, Freeman, San Fransisco
Minchev, I., Chiappini, C., Martig, M., 2013, A&A, 558, 9Minchev, I., 2017, AN , 337, 703Miyamoto, M., Nagai, R., 1975, PASJ, 27, 533Navarro, J. F., Frenk, C. S., White, S. D., 1996, ApJ, 462,
563Nidever, D. L., Bovy, J., Bird, J. C., et al., 2014, ApJ,
796,38Nordstrom, B., Mayor, M., et al., 2004, A&A, 418, 989Onal Tas, O., Bilir, S., Seabroke, G. M., et al., 2016, PASA,
33, e044Plevne, O., Ak, T., Karaali, S., et al., 2015, PASA, 32, 43Pont, F., Eyer, L., 2004, MNRAS, 351, 487Sales, L. V., Helmi, A., Abadi, M. G., et al., 2009, MNRAS,
400L, 61Schlafly, E. F., Finkbeiner, D. P., 2011, ApJ, 737, 103Schonrich, R., 2012, MNRAS, 427, 274Skrutskie, M. F., Cutri, R. M., Stiening, R., et al., 2006,
AJ, 131, 1163Steinmetz, M., Zwitter, T., Siebert, A., et al., 2006, AJ,
132, 1645Wielen, R., 1977, A&A, 60, 263Wojno, J., Kordopatis, G., Piffl, T., et al., 2017, MNRAS,
468, 33, 68Wu, Z., Zhou, X., Ma, J., Du, C., 2009, MNRAS, 399, 2146Yanny, B., Rockosi, C., Newberg, H. Jo, et al., 2009, AJ,
137, 4377York, D. G., Adelman, J., Anderson, J. E., et al., 2000, AJ,
120, 1579Zacharias, N., Finch, C. T., Girard, T. M., et al., 2013, AJ,
145, 44Zhao, G., Zhao, Y., Chu, Y., Jing, Y., Deng, L., 2012, RAA,
12, 723
This manuscript was prepared with the AAS LATEX macros v5.2.