Embed Size (px)
Citation preview

BROOKINGS | April 2012 1
Locating American Manufacturing: Trends in the Geography of ProductionSusan Helper, Timothy Krueger, and Howard Wial1
“ Different regions
of the country,
different met-
ropolitan areas,
and even dif-
ferent counties
within the same
metropolitan
area differ greatly
in their manufac-
turing industries,
technology lev-
els, wages, and
plant sizes.”
FindingsAnalysis of data on employment, earnings, and the number of business establishments engaged in U.S. manufacturing finds that:n Metropolitan areas, especially large metropolitan areas and central metropolitan coun-
ties, contain the great majority of manufacturing jobs and nearly all very high-technology manufacturing jobs, reflecting the advantages they provide to manufacturing in general and very high-technology manufacturing in particular. In 2010, metropolitan areas con-tained 79.5 percent of all manufacturing jobs, 78.6 percent of moderately high-technology manufacturing jobs, and 95 percent of very high-technology manufacturing jobs.
n U.S. metropolitan areas have become increasingly specialized in manufacturing since 1980 but they vary widely in their manufacturing activities and focuses. Nearly all met-ropolitan areas specialize strongly in at least one manufacturing industry even if they do not specialize strongly in manufacturing as a whole.
n Manufacturing in most metropolitan areas follows one or more of six broad patterns of industry clustering. These patterns are anchored in high specializations in computers and electronics, transportation equipment, low-wage manufacturing industries, chemicals, machin-ery, and food production.
n Manufacturing wages vary widely among metropolitan areas. In the nation’s 100 largest metropolitan areas, the average manufacturing earnings are highest in San Jose, at about $145,000 per year, and lowest in McAllen, at about $35,000.
n Metropolitan manufacturing plants are relatively small but vary widely in size among metropolitan areas. In 2009, the average metropolitan manufacturing plant had 57.4 employ-ees, a figure that ranged from a high of 203.6 in Kingsport, TN, to a low of 9.1 in Ocean City, NJ.
n The long-term shift of manufacturing jobs toward the South came to a halt in the first decade of the 21st century, while the Midwest had the fastest manufacturing job gains over the last two years. Between 2000 and 2010 both the Midwest and the South lost about 34 percent of their manufacturing jobs, while between the first quarter of 2010 and the fourth quarter of 2011 the Midwest saw a manufacturing job gain of 5.2 percent while the South saw a gain of 2.2 percent.
n The early 21st century saw a resumption or continuation of long-term shifts of manu-facturing jobs away from metropolitan areas and central metropolitan counties. Between 2000 and 2010 the central counties of metropolitan areas with three or more counties lost 33.9 percent of their manufacturing jobs while the outlying counties of those metropolitan areas lost 29.3 percent. Although metropolitan areas lost manufacturing jobs at a slower rate than nonmetropolitan counties between 2000 and 2010, nonmetropolitan counties gained manufacturing jobs more rapidly than metropolitan areas during the past two years.
In view of these findings, public policy should enhance the innovation and productivity advan-tages that metropolitan areas offer manufacturers, while eliminating artificial incentives for manufacturers to seek low-wage locations. Because there is so much regional variation in manufacturing, federal policy should provide a platform for state, local, and metropolitan efforts, which can formulate policies to respond to regional needs.
BROOKINGS | April 20122
Introduction
With the slight resurgence of U.S. manufacturing in the recent years—termed a potential “manufacturing moment” by some—it is important to consider not just the future of manufacturing in America but also its geography.2
Geographic considerations are, in fact, central to whether the slow growth of U.S. manufacturing jobs during the last two years signals a renaissance of American manufacturing or merely a temporary respite from long-term decline.
General Electric CEO Jeffrey Immelt recently stated:[T]oday at GE we are outsourcing less and producing more in the U.S. . . . When we are decid-ing where to manufacture, we ask, ‘Will our people and technology in the U.S. provide us with a competitive advantage?’ Increasingly, the answer is yes.3
The people and technology that Immelt sees as crucial to his company’s decisions to increase manu-facturing in the United States are place-specific. Those locations—especially metropolitan areas— help create the conditions that give firms such as GE a competitive advantage from manufacturing in the United States.
When firms locate near each other, they gain a number of advantages. The geographic clustering of companies in the same industry or related industries—along with the educational, R&D, business, and labor institutions that support them—promotes high wages and innovation. Such clustering gives manufacturers access to specialized workers, suppliers, and customers and makes it easier for them to share ideas that can improve their performance. Manufacturers can also benefit from their location in a geographic area that has a diverse set of industries, including those not associated solely with manufacturing. In such locations, they can learn from the practices of non-manufacturing industries and gain easier access to such services as engineering, finance, legal services, and management con-sulting.4
These geographic benefits are not simply natural advantages but also advantages created by public policy. The policy approach that aims to create such advantages, often called the high-road approach, encourages firms to utilize highly paid skilled workers to create innovative products and processes.5 Because manufacturing’s contribution to the nation’s economic well-being is based in part on its high wages and innovative capacity, high-road policies are in the national interest. High-road policies should have an important geographic component if manufacturing differs in important ways in different parts of the nation and if clustering and diversity are important for manufacturers. Geographic high-road policies build on the strengths that come when firms locate near each other.
It is a common belief that manufacturing is basically the same throughout the United States, that it has completely decentralized from its historic central locations, and that this decentralization mat-ters little to the productivity of manufacturing firms. For example, Christina Romer, former chair of President Obama’s Council of Economic Advisers, recently claimed that geographic clustering is not especially important in manufacturing.6 This report shows that such views are incorrect. American manufacturing is highly differentiated geographically. Different regions of the country, different met-ropolitan areas, and even different counties within the same metropolitan area differ greatly in their manufacturing industries, technology levels, wages, and plant sizes. Moreover, groups of manufactur-ing industries cluster systematically in different types of metropolitan areas.
Geographic high-road policies are easier to implement if manufacturers are already moving toward locations that offer the benefits of clustering and diversity and away from those whose competitive advantage is based largely on low wages. Here, this report suggests, the evidence is mixed. The report shows that manufacturing jobs have, for several decades, been moving out of the dense, centrally located metropolitan counties that provide manufacturers with the greatest benefits of diversity. Yet it also shows that the flight of manufacturing jobs to the right-to-work states of the South has at least temporarily halted.
In its totality, this report offers the first comprehensive analysis ever of the metropolitan geography of U.S. manufacturing.
The report begins by situating the present moment of U.S. manufacturing. It continues by reporting a series of often surprising descriptive trends affecting the nature and location of American produc-tion. Finally, it concludes by concludes by proposing geographic high-road policies for American
BROOKINGS | April 2012 3
manufacturing.7 These policies require a federal platform that is sensitive to the ways in which manufacturing differs geographically. They require state and local decisionmakers to take the lead in adapting the high-road approach to their specific needs. This policy prescription differs from the gen-eral business attraction incentives that have dominated state and local economic development policy. These incentives (which cost state and local treasuries $70 billion annually) are problematic because they reduce the revenue available to fund investments in training and technology—investments that are essential to a high-road approach.8
Background
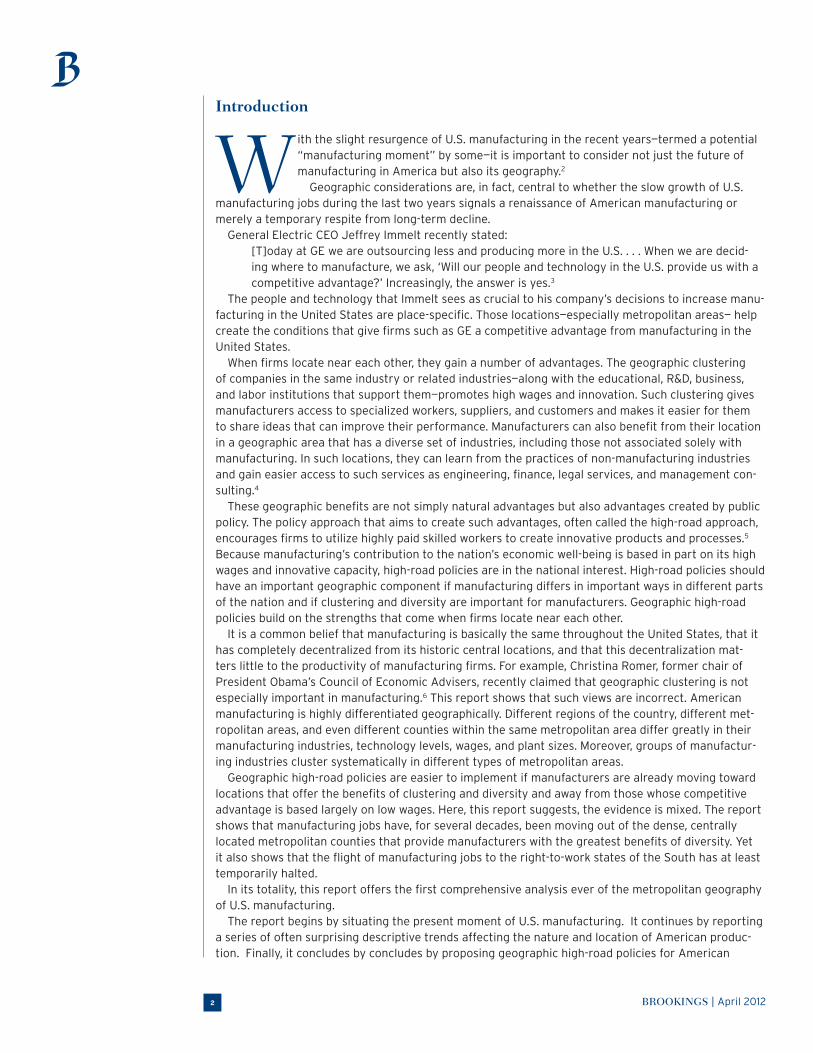
Some basic facts about manufacturing at the national level provide important background for understanding the geography of American manufacturing. Figure 1 charts the number of U.S. manufacturing jobs during the last three decades. In 2010 the United States had 11.5 million manufacturing jobs, which made up 8.5 percent of all U.S. jobs. The number of
manufacturing jobs declined by 40.7 percent from 1979 (when it peaked at 19.4 million) through 2010. This decline did not occur evenly over time, however. There were two large waves of manufacturing job loss, one from 1979 through 1990 and the other from 2000 through 2010. The second wave was by far the more severe; between 2000 and 2010 the United States lost 5.9 million manufacturing jobs, a decline of 33.8 percent.9
Since the beginning of 2010 the United States has gained manufacturing jobs, although the 350,000-job (3.1 percent) gain between January 2010 and December 2011 pales in comparison with the previous decade’s loss. This gain may turn out to be nothing more than a bounce-back of demand from the Great Recession. However, there are a number of reasons to believe that it may be the beginning of a longer-term trend. The recent boom in American oil and natural gas production has boosted the
Figure 1. Manufacturing Jobs, 1979-2010 and January 2010-December 2011
Source: Bureau of Labor Statistics Current Employment Statistics program
21,000
19,000
15,000
13,000
11,000
9,000
7,000
5,0001979 1981 1983 1985 1987 1989 1991 1993 1995 1997 1999 2001 2003 2005 2007 2009 2011
Tota
l U
.S. M
an
ufa
ctu
rin
g J
obs
(th
ou
san
ds)
Year
January2010 December
2011
BROOKINGS | April 20124
demand for the machinery and chemicals used to extract oil and gas and by providing U.S. manufac-turers with an inexpensive, reliable energy source. Developments in China, the major destination for offshored manufacturing, have also contributed to the recent growth of U.S. manufacturing. Although labor costs in Chinese manufacturing are only about 9 percent of those in the United States, they have been rising about twice as rapidly as productivity in recent years, reducing China’s labor cost advan-tage. The value of the Chinese yuan has risen slightly, also reducing China’s competitive advantage in manufacturing.10 Spurred in part by the disruptive impact of last year’s Fukushima earthquake on the automotive supply chain and by Boeing’s difficulties in coordinating a far-flung global supply chain for its 787 Dreamliner, manufacturers are reconsidering the costs of offshoring and are beginning to bring some previously offshored production back to the United States (“reshore” it).11
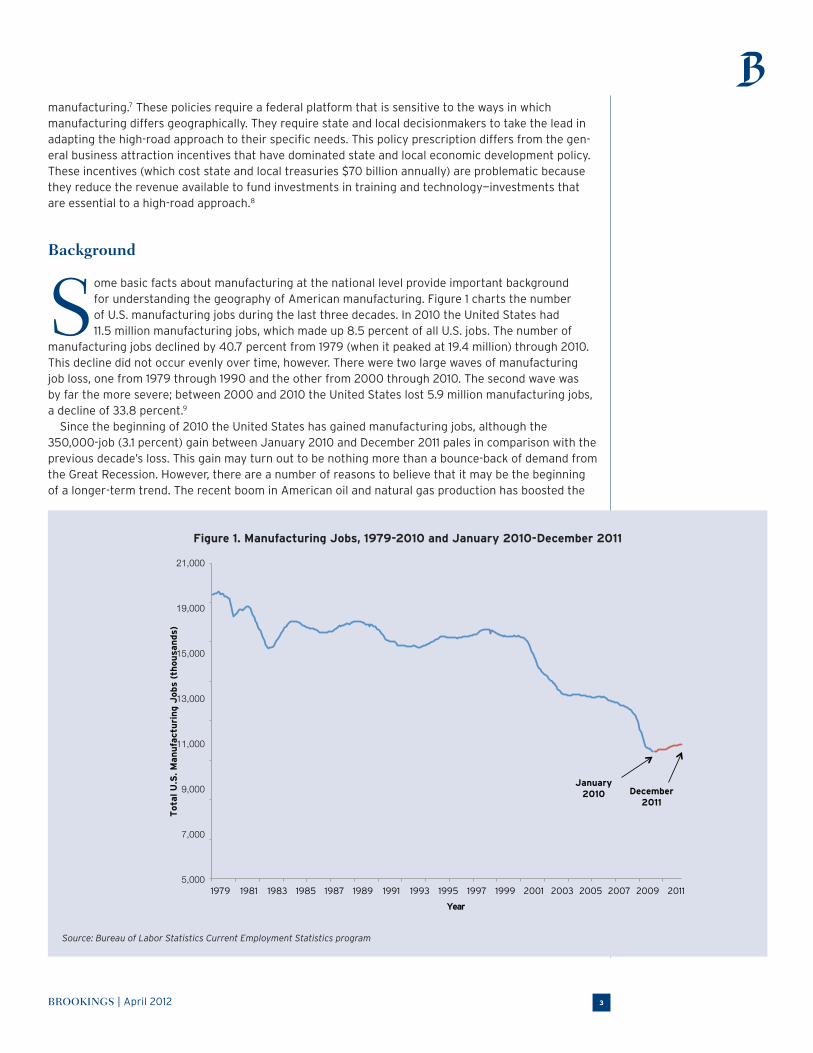
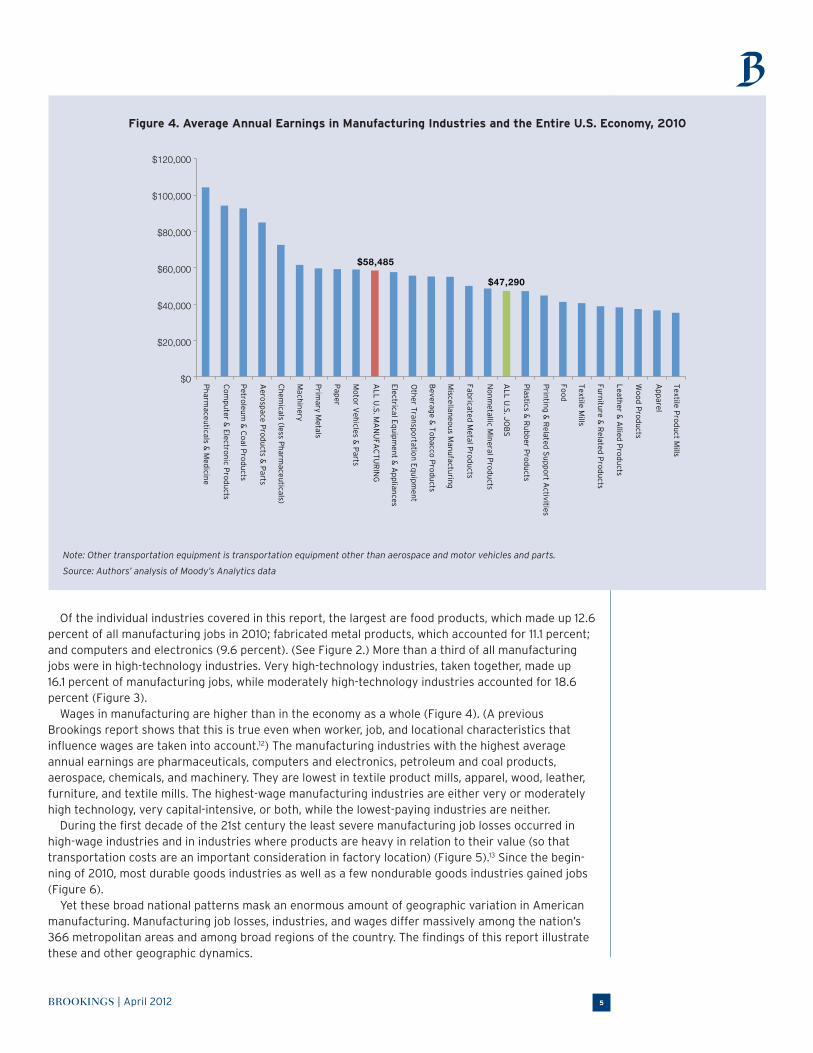
Figure 2. Industry Composition of Manufacturing Jobs, 2010
Note: “Other” includes furniture, electrical equipment, wood products, pharmaceuticals, beverage and tobacco, transporta-
tion equipment other than aerospace and motor vehicles and parts, apparel, textile and textile product mills, petroleum and
coal products, and leather. “Motor vehicles and parts” includes only those establishments that categorize themselves as
principally involved in this industry; firms in many other industries listed above also send products to the auto industry.
Source: Authors’ analysis of Moody’s Analytics data
Other
Primary Metals
Nonmetallic Mineral Products
Paper
Aerospace Products & Parts
Printing & Related Support Activities
Chemicals (less Pharmaceuticals)Miscellaneous ManufacturingPlastics & Rubber ProductsMotor Vehicles & Parts
Machinery
Computer and Electronic Products
Fabricated Metal Products
Food
Other 19.3%
Primary Metals 3.1%
Nonmetallic Mineral Products 3.2%
Paper 3.4%
Aerospace Products & Parts 4.1%
Printing & Related Support Activities 4.2%
Chemicals (less Pharmaceuticals) 4.4%
Miscellaneous Manufacturing 4.9%Plastics & Rubber Products 5.4%
Motor Vehicles & Parts 5.9%
Machinery 8.6%
Computer & Electronic Products 9.6%
Fabricated Metal Products 11.1%
Food 12.6%
Figure 3. Technology Composition of Manufacturing Jobs, 2010
Source: Authors’ analysis of Moody’s Analytics data
all Other Manufacturing
Very High Tech
Moderately High Tech
All Other Manufacturing 65.3%Very High Tech 16.1%
Moderately High Tech 18.6%
BROOKINGS | April 2012 5
Of the individual industries covered in this report, the largest are food products, which made up 12.6 percent of all manufacturing jobs in 2010; fabricated metal products, which accounted for 11.1 percent; and computers and electronics (9.6 percent). (See Figure 2.) More than a third of all manufacturing jobs were in high-technology industries. Very high-technology industries, taken together, made up 16.1 percent of manufacturing jobs, while moderately high-technology industries accounted for 18.6 percent (Figure 3).
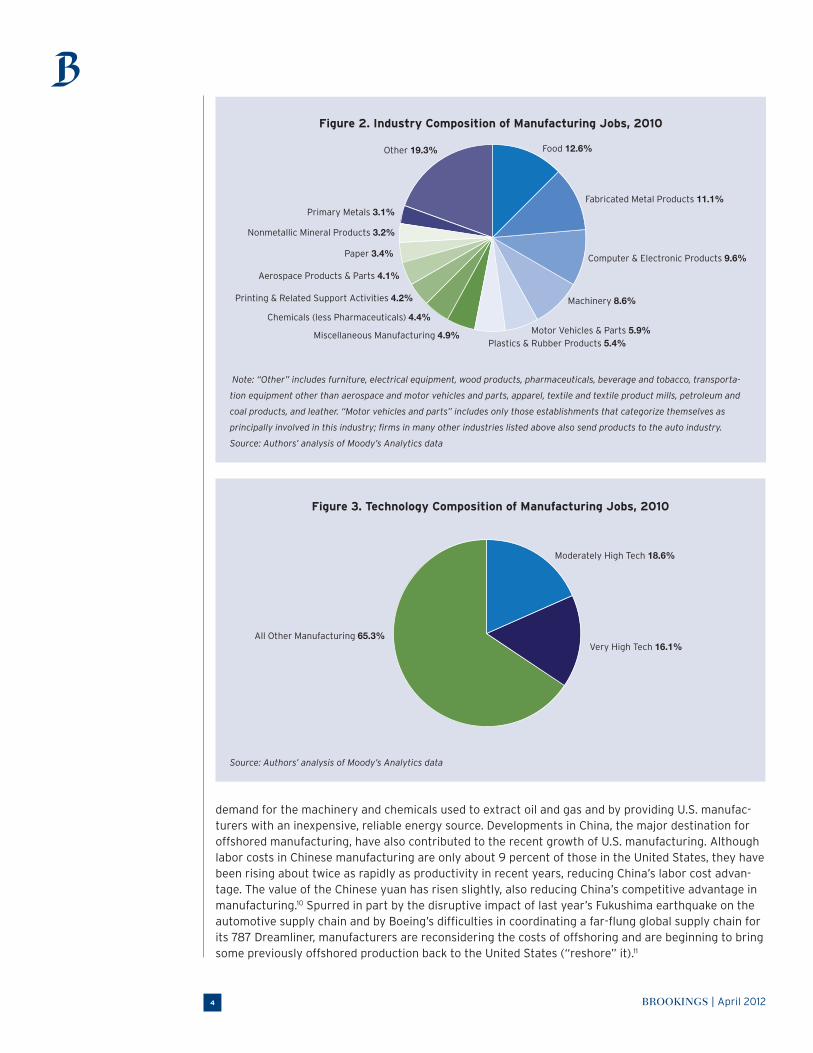
Wages in manufacturing are higher than in the economy as a whole (Figure 4). (A previous Brookings report shows that this is true even when worker, job, and locational characteristics that influence wages are taken into account.12) The manufacturing industries with the highest average annual earnings are pharmaceuticals, computers and electronics, petroleum and coal products, aerospace, chemicals, and machinery. They are lowest in textile product mills, apparel, wood, leather, furniture, and textile mills. The highest-wage manufacturing industries are either very or moderately high technology, very capital-intensive, or both, while the lowest-paying industries are neither.
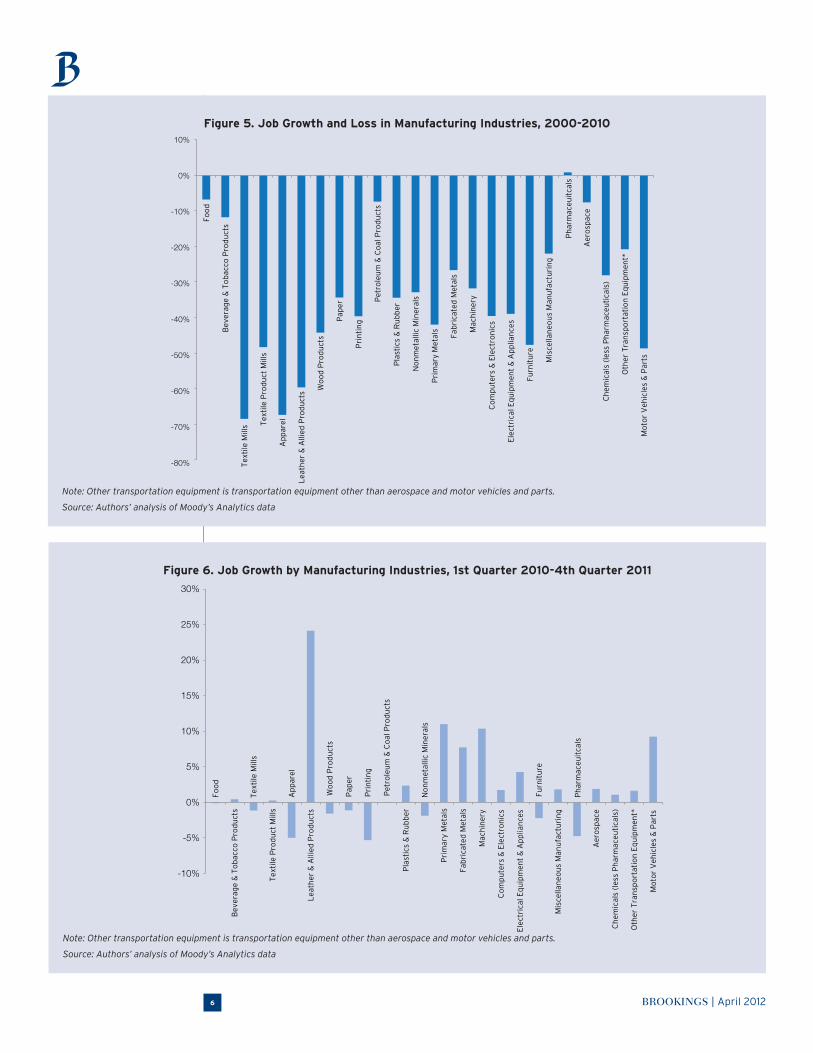
During the first decade of the 21st century the least severe manufacturing job losses occurred in high-wage industries and in industries where products are heavy in relation to their value (so that transportation costs are an important consideration in factory location) (Figure 5).13 Since the begin-ning of 2010, most durable goods industries as well as a few nondurable goods industries gained jobs (Figure 6).
Yet these broad national patterns mask an enormous amount of geographic variation in American manufacturing. Manufacturing job losses, industries, and wages differ massively among the nation’s 366 metropolitan areas and among broad regions of the country. The findings of this report illustrate these and other geographic dynamics.
Figure 4. Average Annual Earnings in Manufacturing Industries and the Entire U.S. Economy, 2010
Note: Other transportation equipment is transportation equipment other than aerospace and motor vehicles and parts.
Source: Authors’ analysis of Moody’s Analytics data
$58,485
$47,290
$120,000
$100,000
$80,000
$60,000
$40,000
$20,000
$0 Ph
armaceu
ticals & M
edicin
e
Co
mp
uter &
Electro
nic P
rod
ucts
Petro
leum
& C
oal P
rod
ucts
Aero
space P
rod
ucts &
Parts
Ch
emicals (less P
harm
aceuticals)
Mo
tor V
ehicles &
Parts
Mach
inery
Prim
ary Metals
Pap
er
AL
L U
.S. M
AN
UFA
CT
UR
ING
Electrical E
qu
ipm
ent &
Ap
plian
ces
Oth
er Tran
spo
rtation
Eq
uip
men
t
Beverag
e & T
ob
acco P
rod
ucts
Miscellan
eou
s Man
ufactu
ring
Fabricated
Metal P
rod
ucts
No
nm
etallic Min
eral Pro
du
cts
AL
L U
.S. J
OB
S
Plastics &
Ru
bb
er Pro
du
cts
Prin
ting
& R
elated S
up
po
rt Activities
Foo
d
Textile M
ills
Furn
iture &
Related
Pro
du
cts
Leath
er & A
llied P
rod
ucts
Wo
od
Pro
du
cts
Ap
parel
Textile P
rod
uct M
ills
BROOKINGS | April 20126
Figure 5. Job Growth and Loss in Manufacturing Industries, 2000-2010
Note: Other transportation equipment is transportation equipment other than aerospace and motor vehicles and parts.
Source: Authors’ analysis of Moody’s Analytics data
Foo
d
Bev
erag
e &
To
bac
co P
rod
uct
s
Tex
tile
Mill
s Tex
tile
Pro
du
ct M
ills
Ap
par
el
Lea
ther
& A
llied
Pro
du
cts W
oo
d P
rod
uct
s
Pap
er
Pri
nti
ng
Pet
role
um
& C
oal
Pro
du
cts
Pla
stic
s &
Ru
bb
er
No
nm
etal
lic M
iner
als
Pri
mar
y M
etal
s
Fab
rica
ted
Met
als
Mac
hin
ery
Co
mp
ute
rs &
Ele
ctro
nic
s
Ele
ctri
cal E
qu
ipm
ent
& A
pp
lian
ces
Furn
itu
re
Mis
cella
neo
us
Man
ufa
ctu
rin
g
Ph
arm
aceu
itca
ls
Aer
osp
ace
Ch
emic
als
(les
s P
har
mac
euti
cals
)
Oth
er T
ran
spo
rtat
ion
Eq
uip
men
t*
Mo
tor
Veh
icle
s &
Par
ts
10%
0%
-10%
-20%
-30%
-40%
-50%
-60%
-70%
-80%
Figure 6. Job Growth by Manufacturing Industries, 1st Quarter 2010-4th Quarter 2011
Note: Other transportation equipment is transportation equipment other than aerospace and motor vehicles and parts.
Source: Authors’ analysis of Moody’s Analytics data
30%
25%
20%
15%
10%
5%
0%
-5%
-10%
Foo
d
Bev
erag
e &
To
bac
co P
rod
uct
s
Tex
tile
Mill
s
Tex
tile
Pro
du
ct M
ills
Ap
par
el
Lea
ther
& A
llied
Pro
du
cts
Wo
od
Pro
du
cts
Pap
er
Pri
nti
ng
Pet
role
um
& C
oal
Pro
du
cts
Pla
stic
s &
Ru
bb
er
No
nm
etal
lic M
iner
als
Pri
mar
y M
etal
s
Fab
rica
ted
Met
als
Mac
hin
ery
Co
mp
ute
rs &
Ele
ctro
nic
s
Ele
ctri
cal E
qu
ipm
ent
& A
pp
lian
ces
Furn
itu
re
Mis
cella
neo
us
Man
ufa
ctu
rin
g
Ph
arm
aceu
itca
ls
Aer
osp
ace
Ch
emic
als
(les
s P
har
mac
euti
cals
)
Oth
er T
ran
spo
rtat
ion
Eq
uip
men
t*
Mo
tor
Veh
icle
s &
Par
ts
BROOKINGS | April 2012 7
Methodology
This report covers manufacturing activity in the nation’s metropolitan areas and, for some findings, in nonmetropolitan areas and portions of some metropolitan areas. (See below for details.) Manufacturing, as defined in the North American Industry Classification System (NAICS), includes business establishments that are primarily devoted to the production of
goods from raw materials, substances, or components. Anyone who works in such an establishment is considered a manufacturing worker. Thus, production workers, maintenance and repair workers, managers, engineers and others who work in factories are considered manufacturing workers. How-ever, people who work for manufacturing companies but not in or immediately adjacent to factories are not. Engineers in free-standing R&D centers and managers in separate corporate headquarters are examples of the latter.
This report generally breaks manufacturing down into industries defined at the NAICS three-digit level. However, some NAICS four-digit industries or combinations of those industries (pharmaceuticals, aerospace, and motor vehicles and parts) are also considered because they are especially important to the U.S. economy.14 Appendix Table 1 shows the manufacturing industries covered in this report.
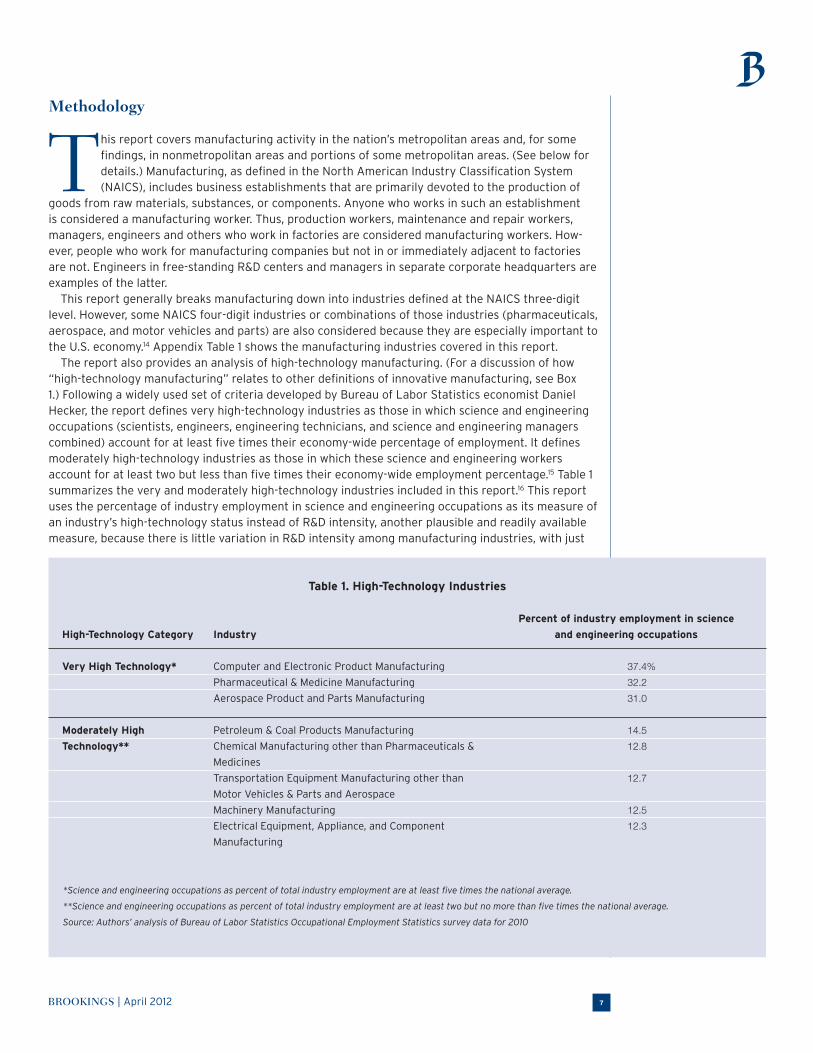
The report also provides an analysis of high-technology manufacturing. (For a discussion of how “high-technology manufacturing” relates to other definitions of innovative manufacturing, see Box 1.) Following a widely used set of criteria developed by Bureau of Labor Statistics economist Daniel Hecker, the report defines very high-technology industries as those in which science and engineering occupations (scientists, engineers, engineering technicians, and science and engineering managers combined) account for at least five times their economy-wide percentage of employment. It defines moderately high-technology industries as those in which these science and engineering workers account for at least two but less than five times their economy-wide employment percentage.15 Table 1 summarizes the very and moderately high-technology industries included in this report.16 This report uses the percentage of industry employment in science and engineering occupations as its measure of an industry’s high-technology status instead of R&D intensity, another plausible and readily available measure, because there is little variation in R&D intensity among manufacturing industries, with just
Table 1. High-Technology Industries
*Science and engineering occupations as percent of total industry employment are at least five times the national average.
**Science and engineering occupations as percent of total industry employment are at least two but no more than five times the national average.
Source: Authors’ analysis of Bureau of Labor Statistics Occupational Employment Statistics survey data for 2010
High-Technology Category
Very High Technology*
Moderately High
Technology**
Industry
Computer and Electronic Product Manufacturing
Pharmaceutical & Medicine Manufacturing
Aerospace Product and Parts Manufacturing
Petroleum & Coal Products Manufacturing
Chemical Manufacturing other than Pharmaceuticals &
Medicines
Transportation Equipment Manufacturing other than
Motor Vehicles & Parts and Aerospace
Machinery Manufacturing
Electrical Equipment, Appliance, and Component
Manufacturing
Percent of industry employment in science
and engineering occupations
37.4% 32.2 31.0
14.5 12.8
12.7 12.5 12.3
BROOKINGS | April 20128
two exceptions. Of the industries covered in this report, pharmaceuticals and computers and electron-ics are the only ones whose R&D intensity exceeds the average for manufacturing as a whole.17
Some findings in the report categorize metropolitan areas according to the extent to which they specialize in manufacturing as a whole, in very and moderately high-technology manufacturing industries, and in other selected manufacturing industries. A metropolitan area is considered to be strongly specialized in a manufacturing industry if that industry’s percentage of the metropolitan area’s total employment is at least 1.05 times its percentage of nationwide total employment. An area
Box 1. What is Innovative Manufacturing?Manufacturing contributes to the national goal of promoting innovation. There are several ways to define the most innovative kinds of manufacturing.
“High-technology” manufacturing is often defined as industries that employ a high average percentage of scientists and engineers in their manufacturing establishments. (See the main text and Table 1 for examples and the exact definition used in this report.) Alternatively, some have delineated which manufacturing industries are high-technology based on products, reaching somewhat different conclusions about the geography and other characteristics of high-technology manufacturing. The occupation-based approach used in this report uncovers some types of high-technology manufacturing that are inap-propriately omitted from a product-based categorization and depicts a more geographically diverse image of high-technology manufacturing.18
The President’s Council of Advisors on Science and Technology defines “advanced manufacturing” as “a family of activi-ties that (a) depend on the use and coordination of information, automation, computation, software, sensing, and networking, and/or (b) make use of cutting edge materials and emerging capabilities enabled by the physical and biological sciences, for example nanotechnology, chemistry, and biology. It involves both new ways to manufacture existing products, and the manu-facture of new products emerging from new advanced technologies.”19
“High-road” manufacturing is a technique that firms in any industry can use to innovate. In this technique, firms harness the knowledge of all their workers to create innovative products and processes. Firms do this by hiring or training highly skilled workers at all levels, ranging from engineers to skilled tradespeople with four-year apprenticeships to production workers who can set up and operate many different kinds of equipment. Such a workforce enables firms to quickly generate and implement significant innovations in products, materials, and processes. Firms may also employ mechanisms such as “quality circles” that bring together workers at all levels to brainstorm about problems such as how to de-bug the production process quickly for a new product or save money by reducing defects. The higher wages paid to the more-skilled workers are offset by their higher productivity and fast response to unexpected circumstances.20
All these definitions of innovative manufacturing describe situations in which firms are introducing new products and processes at a high rate. A great deal of evidence shows that such innovation yields benefits to consumers and workers as a whole that go well beyond those captured by company owners.21
However, many firms are classified as innovative under some definitions but not others. For example, a manufacturer of small metal clips for aerospace would count as using “very high technology” but would not be considered “advanced” if it used standard materials and production techniques. It could be considered a “high-road” manufacturer if it involved production workers in improving its products or processes and paid an above-average wage. Conversely, a manufacturer of stamped parts for automobiles would be considered “advanced’ if it made extensive use of sensors and other computer controls and “high road” if the firm employed a high percentage of engineers, but would not be considered “high technology” because others in its industry do not employ a high percentage of engineers. High-road techniques should be considered “advanced” because they involve new ways of decentralizing information flow. However, an “advanced” firm need not be high road. Such a firm could employ a combination of Ph.D.’s, who develop new compounds, and minimum-wage workers, who mix the compounds by simply following orders.
This report measures the innovativeness of metropolitan areas based on the extent to which they contain industries that are “very high technology” or “moderately high technology.” This measure is imperfect in that it is based on national industry averages, not on the innovativeness of the firms that are actually in the metropolitan area in question. Also, the data count as manufacturing employment only those jobs that are found in factories. Employment in separate headquarters or R&D facili-ties is not counted as manufacturing employment; since many of these employees are likely to be innovators, and since these facilities are highly likely to be located in metropolitan areas, the innovativeness of metropolitan manufacturing will in general be significantly understated.
BROOKINGS | April 2012 9
is considered to be very strongly specialized in a manufacturing industry if that industry’s percent-age of the metropolitan area’s total employment is at least 1.50 times its percentage of nationwide total employment. An area is considered to be highly specialized in a manufacturing industry if that industry’s percentage of the metropolitan area’s total employment is at least 1.90 times its percentage of nationwide total employment. An area is not specialized in an industry if that industry’s percentage of the metropolitan area’s total employment is below its nationwide percentage.22
The report shows that many metropolitan areas have common patterns of manufacturing industry composition; their manufacturing jobs come from similar groups of manufacturing industries. The specific quantitative cutoffs used to define these groups are derived from a mathematical cluster analysis of the manufacturing industry employment percentages in metropolitan areas.23 Metropolitan areas that do not meet the criteria for any of these groups are classified as “diversified manufactur-ing” or “other specialized manufacturing” metropolitan areas. The latter two categories are based on the extent to which a metropolitan area’s manufacturing employment is diversified across many industries or concentrated in a few. Diversification of manufacturing is measured by a Herfindahl index, a standard measure of diversification used in economics. Lower values of the index indicate more industrial diversification.24 Metropolitan areas that do not meet the criteria for other groups and that have Herfindahl index values below 0.12 are classified as “diversified manufacturing” areas. Those that do not meet the criteria for other groups and that have Herfindahl index values of 0.12 or more are considered “other specialized manufacturing” areas.25
One of the metropolitan area groupings is defined, in part, on the basis of a specialization in low-wage manufacturing industries. These industries are the industries whose national average wages are below the national average wage for manufacturing as a whole. The industries included in the low-wage manufacturing group are food, textile mills, textile product mills, apparel, leather, wood, and furniture.
The report compares manufacturing wage levels among the 100 largest metropolitan areas. It mea-sures wages by average annual earnings per job in 2010. The analysis is restricted to the 100 largest metropolitan areas because extremely high average earnings in industries with very few workers can have a large influence on overall average earnings in some smaller metropolitan areas. In addition to examining average earnings for the 100 largest metropolitan areas, the analysis compares each met-ropolitan area’s actual average earnings with the average earnings that it would be expected to have given the extent to which its manufacturing jobs are in industries that pay high wages nationwide.26 In this analysis a metropolitan area is not classified as high-wage simply because its manufacturing job mix is tilted toward industries that are high-wage nationwide. Thus, this latter measure does not give Austin “extra credit” toward high-wage status simply because a relatively large share of its manufac-turing employment is in computers and electronics.
The report also presents information on average plant size in manufacturing. This information is derived from the Census Bureau’s County Business Patterns data series. County Business Patterns reports the results of an annual survey of employers. County Business Patterns is the only data series available for estimating average plant size at the national and metropolitan levels. Average plant size is defined as total employment divided by the number of business establishments. To preserve employer confidentiality, County Business Patterns suppresses the number of employees and/or establishments in some industries in some metropolitan areas. Where this occurs, the series usually provides a range of values. This report uses the midpoint of that range as an estimate of the relevant data value. In the few cases where no range of values is available, the report omits the industry/metro-politan area combination from its estimates.
The primary data source for this report is the economic forecasting firm Moody’s Analytics, which provides estimates of employment,and wages. Moody’s Analytics data are based on data from the Bureau of Labor Statistics and Bureau of Economic Analysis. A previous Brookings report details their advantages and limitations.27 As noted above, the analysis of plant size is based on data from County Business Patterns; those data are not necessarily comparable to Moody’s Analytics data but are used because they are the only data available for the purpose. In addition, the report occasionally uses data from other U.S. government sources to supplement its analysis.
The report presents data for the nation’s 366 metropolitan areas. It uses metropolitan area boundaries defined as of 2009. The report also compares metropolitan and nonmetropolitan areas
BROOKINGS | April 201210
(aggregated nationwide), broad regions of the country (Northeast, Midwest, South, and West, combin-ing metropolitan and nonmetropolitan areas), and, for metropolitan areas with three or more counties, central and outlying counties of the metropolitan area. A central county of a metropolitan area is one that contains the metropolitan area’s principal city or cities.28 Outlying counties are those that do not contain a principal city. Every county in the United States is either a central or outlying county of a metropolitan area with three or more counties, a county in a one- or two-county metropolitan area, or a nonmetropolitan county.
Most data in the report are for the year 2010, the last full year for which Moody’s Analytics data are available. (Where a year is not specified, data pertain to 2010.) Some findings make comparisons over time; those comparisons use Moody’s data from 1980, 1990, 2000, and the period from the first quar-ter of 2010 through the fourth quarter of 2011 (the last quarter for which final data are available). Plant size data are for 2009, the last year for which County Business Patterns data are available.
An online companion to this report (www.brookings.edu/usmfginteractive) provides comprehensive data on manufacturing jobs and wages for the nation’s metropolitan areas.
Findings
A. Metropolitan areas, especially large metropolitan areas and central metropolitan counties, contain the great majority of manufacturing jobs and nearly all very high-technology manufacturing jobs, reflecting the advantages they provide to manufactur-ing in general and very high-technology manufacturing in particular.Contrary to the popular view that geography does not matter much for manufacturing, most U.S. manufacturing jobs are located in metropolitan areas. In 2010, metropolitan areas were home to 79.5 percent of manufacturing jobs. Although this percentage is lower than the 85.2 percent of all U.S. jobs that resided in metropolitan areas, it nevertheless indicates that manufacturers gain important advan-tages from locating in metropolitan areas. These advantages include the benefits of clustering with other companies in the same industry and related industries: access to a broad pool of skilled workers with industry- or cluster-specific skills, access to suppliers and business customers, the ability to share ideas face-to-face with others who are working on similar business or technological problems, and access to educational, research, consulting, and engineering services that are specialized in the needs of the industry or cluster. Metropolitan areas also benefit manufacturers because of their industrial diversity, which provides manufacturers with access to educational, financial, legal, and management and engineering consulting services that are not necessarily specific to their industries, larger pools of generally skilled workers, and opportunities to share ideas with firms in unrelated industries.29
Because of their size, the nation’s 100 largest metropolitan areas typically offer greater advantages of industrial diversity than smaller metropolitan areas. These advantages are important enough to manufacturers that 58.5 percent of manufacturing jobs were located in the 100 largest metropolitan areas in 2010. Once again, this figure is below the corresponding 66.8 percent figure for all U.S. jobs but still represents a large majority of manufacturing jobs.
The central counties of metropolitan areas are typically the places that have the greatest density of businesses (manufacturing and non-manufacturing). Research has shown that manufacturers are more productive in locations with a high density of businesses, perhaps because the advantages of clustering and diversity are greatest in those locations.30 The location of manufacturing jobs within metropolitan areas reflects the benefits of density. Of all manufacturing jobs located in metropolitan areas with three or more counties, 88.8 percent were located in the central counties of those metro-politan areas. The corresponding figure for all jobs was 58.9 percent, suggesting that the benefits of density are more important for manufacturing than for other industries.
The advantages of locating in metropolitan areas in general, and large metropolitan areas and cen-tral metropolitan counties in particular, are especially pronounced for very high-technology industries. In 2010, 95.0 percent of all very high-technology jobs were located in metropolitan areas, 79.5 percent were located in the 100 largest metropolitan areas, and 94.3 percent of all very high-technology jobs in three- or more-county metropolitan areas resided in the central counties of those metropoli-tan areas. The advantages of these locations were less pronounced for moderately high-technology
BROOKINGS | April 2012 11
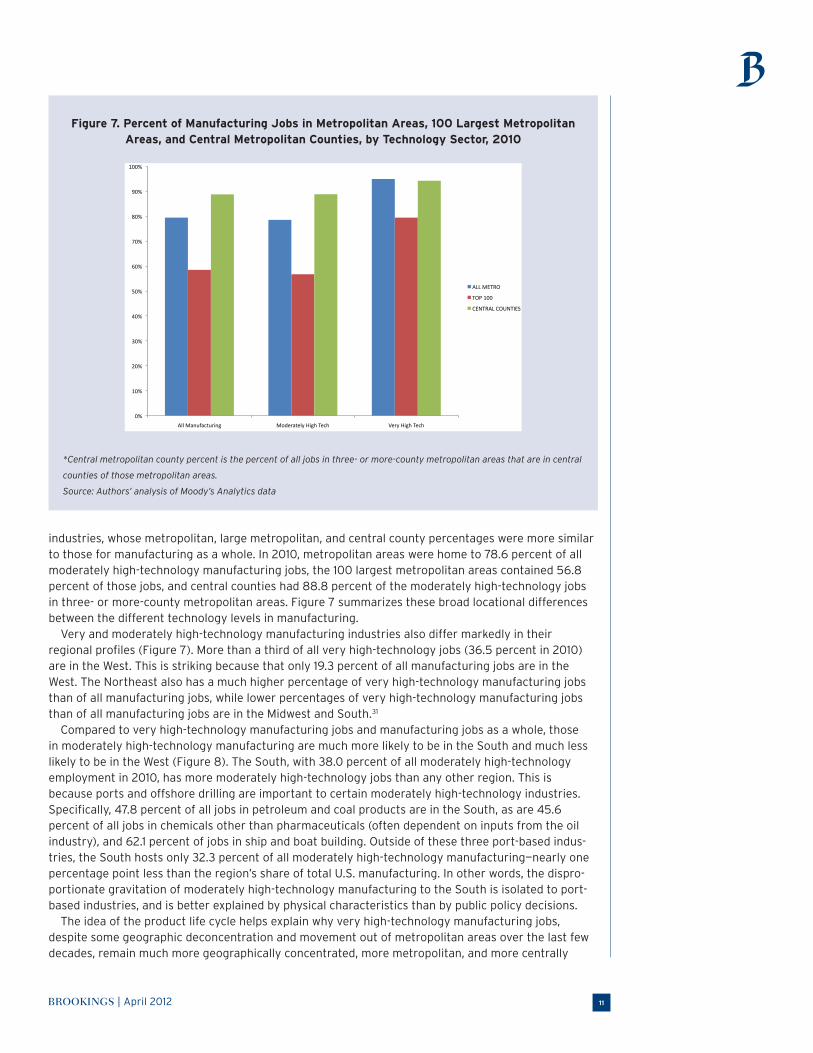
industries, whose metropolitan, large metropolitan, and central county percentages were more similar to those for manufacturing as a whole. In 2010, metropolitan areas were home to 78.6 percent of all moderately high-technology manufacturing jobs, the 100 largest metropolitan areas contained 56.8 percent of those jobs, and central counties had 88.8 percent of the moderately high-technology jobs in three- or more-county metropolitan areas. Figure 7 summarizes these broad locational differences between the different technology levels in manufacturing.
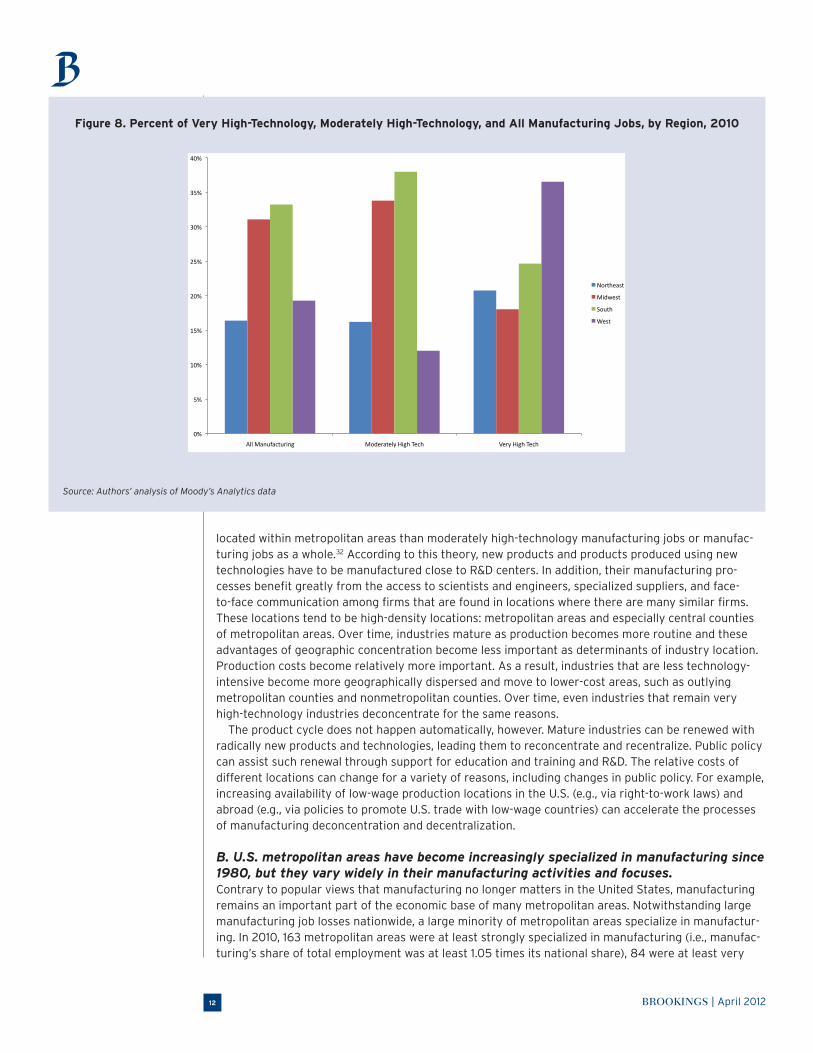
Very and moderately high-technology manufacturing industries also differ markedly in their regional profiles (Figure 7). More than a third of all very high-technology jobs (36.5 percent in 2010) are in the West. This is striking because that only 19.3 percent of all manufacturing jobs are in the West. The Northeast also has a much higher percentage of very high-technology manufacturing jobs than of all manufacturing jobs, while lower percentages of very high-technology manufacturing jobs than of all manufacturing jobs are in the Midwest and South.31
Compared to very high-technology manufacturing jobs and manufacturing jobs as a whole, those in moderately high-technology manufacturing are much more likely to be in the South and much less likely to be in the West (Figure 8). The South, with 38.0 percent of all moderately high-technology employment in 2010, has more moderately high-technology jobs than any other region. This is because ports and offshore drilling are important to certain moderately high-technology industries. Specifically, 47.8 percent of all jobs in petroleum and coal products are in the South, as are 45.6 percent of all jobs in chemicals other than pharmaceuticals (often dependent on inputs from the oil industry), and 62.1 percent of jobs in ship and boat building. Outside of these three port-based indus-tries, the South hosts only 32.3 percent of all moderately high-technology manufacturing—nearly one percentage point less than the region’s share of total U.S. manufacturing. In other words, the dispro-portionate gravitation of moderately high-technology manufacturing to the South is isolated to port-based industries, and is better explained by physical characteristics than by public policy decisions.
The idea of the product life cycle helps explain why very high-technology manufacturing jobs, despite some geographic deconcentration and movement out of metropolitan areas over the last few decades, remain much more geographically concentrated, more metropolitan, and more centrally
Figure 7. Percent of Manufacturing Jobs in Metropolitan Areas, 100 Largest Metropolitan Areas, and Central Metropolitan Counties, by Technology Sector, 2010
*Central metropolitan county percent is the percent of all jobs in three- or more-county metropolitan areas that are in central
counties of those metropolitan areas.
Source: Authors’ analysis of Moody’s Analytics data
0%
10%
20%
30%
40%
50%
60%
70%
80%
90%
100%
All Manufacturing Moderately High Tech Very High Tech
ALL METRO
TOP 100
CENTRAL COUNTIES
BROOKINGS | April 201212
located within metropolitan areas than moderately high-technology manufacturing jobs or manufac-turing jobs as a whole.32 According to this theory, new products and products produced using new technologies have to be manufactured close to R&D centers. In addition, their manufacturing pro-cesses benefit greatly from the access to scientists and engineers, specialized suppliers, and face-to-face communication among firms that are found in locations where there are many similar firms. These locations tend to be high-density locations: metropolitan areas and especially central counties of metropolitan areas. Over time, industries mature as production becomes more routine and these advantages of geographic concentration become less important as determinants of industry location. Production costs become relatively more important. As a result, industries that are less technology-intensive become more geographically dispersed and move to lower-cost areas, such as outlying metropolitan counties and nonmetropolitan counties. Over time, even industries that remain very high-technology industries deconcentrate for the same reasons.
The product cycle does not happen automatically, however. Mature industries can be renewed with radically new products and technologies, leading them to reconcentrate and recentralize. Public policy can assist such renewal through support for education and training and R&D. The relative costs of different locations can change for a variety of reasons, including changes in public policy. For example, increasing availability of low-wage production locations in the U.S. (e.g., via right-to-work laws) and abroad (e.g., via policies to promote U.S. trade with low-wage countries) can accelerate the processes of manufacturing deconcentration and decentralization.
B. U.S. metropolitan areas have become increasingly specialized in manufacturing since 1980, but they vary widely in their manufacturing activities and focuses. Contrary to popular views that manufacturing no longer matters in the United States, manufacturing remains an important part of the economic base of many metropolitan areas. Notwithstanding large manufacturing job losses nationwide, a large minority of metropolitan areas specialize in manufactur-ing. In 2010, 163 metropolitan areas were at least strongly specialized in manufacturing (i.e., manufac-turing’s share of total employment was at least 1.05 times its national share), 84 were at least very
Figure 8. Percent of Very High-Technology, Moderately High-Technology, and All Manufacturing Jobs, by Region, 2010
Source: Authors’ analysis of Moody’s Analytics data
0%
5%
10%
15%
20%
25%
30%
35%
40%
All Manufacturing Moderately High Tech Very High Tech
Northeast
Midwest
South
West
BROOKINGS | April 2012 13
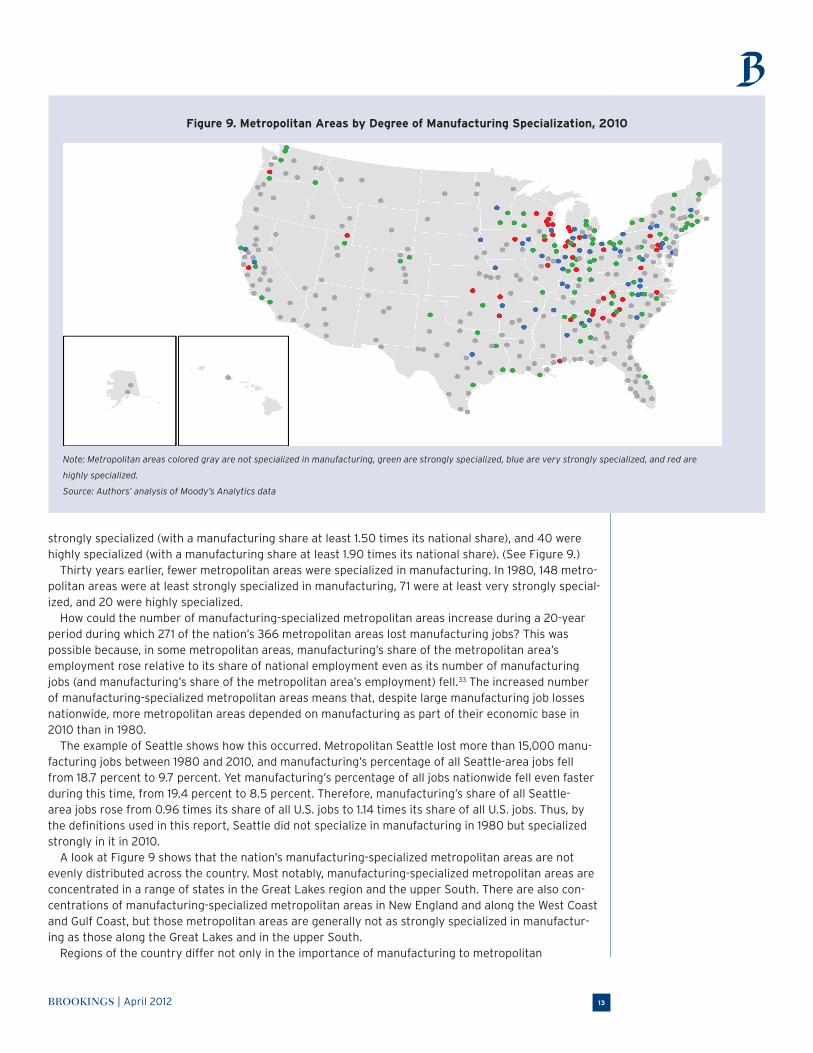
strongly specialized (with a manufacturing share at least 1.50 times its national share), and 40 were highly specialized (with a manufacturing share at least 1.90 times its national share). (See Figure 9.)
Thirty years earlier, fewer metropolitan areas were specialized in manufacturing. In 1980, 148 metro-politan areas were at least strongly specialized in manufacturing, 71 were at least very strongly special-ized, and 20 were highly specialized.
How could the number of manufacturing-specialized metropolitan areas increase during a 20-year period during which 271 of the nation’s 366 metropolitan areas lost manufacturing jobs? This was possible because, in some metropolitan areas, manufacturing’s share of the metropolitan area’s employment rose relative to its share of national employment even as its number of manufacturing jobs (and manufacturing’s share of the metropolitan area’s employment) fell.33 The increased number of manufacturing-specialized metropolitan areas means that, despite large manufacturing job losses nationwide, more metropolitan areas depended on manufacturing as part of their economic base in 2010 than in 1980.
The example of Seattle shows how this occurred. Metropolitan Seattle lost more than 15,000 manu-facturing jobs between 1980 and 2010, and manufacturing’s percentage of all Seattle-area jobs fell from 18.7 percent to 9.7 percent. Yet manufacturing’s percentage of all jobs nationwide fell even faster during this time, from 19.4 percent to 8.5 percent. Therefore, manufacturing’s share of all Seattle-area jobs rose from 0.96 times its share of all U.S. jobs to 1.14 times its share of all U.S. jobs. Thus, by the definitions used in this report, Seattle did not specialize in manufacturing in 1980 but specialized strongly in it in 2010.
A look at Figure 9 shows that the nation’s manufacturing-specialized metropolitan areas are not evenly distributed across the country. Most notably, manufacturing-specialized metropolitan areas are concentrated in a range of states in the Great Lakes region and the upper South. There are also con-centrations of manufacturing-specialized metropolitan areas in New England and along the West Coast and Gulf Coast, but those metropolitan areas are generally not as strongly specialized in manufactur-ing as those along the Great Lakes and in the upper South.
Regions of the country differ not only in the importance of manufacturing to metropolitan
Figure 9. Metropolitan Areas by Degree of Manufacturing Specialization, 2010
Note: Metropolitan areas colored gray are not specialized in manufacturing, green are strongly specialized, blue are very strongly specialized, and red are
highly specialized.
Source: Authors’ analysis of Moody’s Analytics data
BROOKINGS | April 201214
economies but also in which manufacturing industries are most important to those economies. On average, Midwestern metropolitan areas have strong specializations in the largest number of manu-facturing industries. Those industries include the entire range of wage and technological levels: low-wage, established-technology industries (leather, paper, printing, plastics and rubber, fabricated metal products), very high-technology pharmaceuticals, moderately high-technology machinery and electrical equipment/appliances, other high-wage durables (motor vehicles and parts and primary met-als). The Midwest is also the only region in which metropolitan areas are, on average, at least strongly specialized in manufacturing as a whole. Metropolitan areas in the South specialize strongly in three low- to moderate-wage nondurable goods industries with established technologies (beverages and tobacco products, textile mills, and textile product mills) and a high-wage, moderately high-technology industry (petroleum and coal products). Northeastern metropolitan areas are strongly specialized in two low-wage nondurable goods industries that use long-established technologies (apparel, leather) and in two very high-technology industries (pharmaceuticals and computers and electronics), as well as in miscellaneous manufacturing.34 Western metropolitan areas similarly specialize strongly in two low- to moderate-wage nondurable goods industries with established technologies (beverages and tobacco products and apparel) and two very high-technology industries (computers and electronics and aerospace), plus a high-wage, moderately high-technology industry (petroleum and coal products) and miscellaneous manufacturing.35
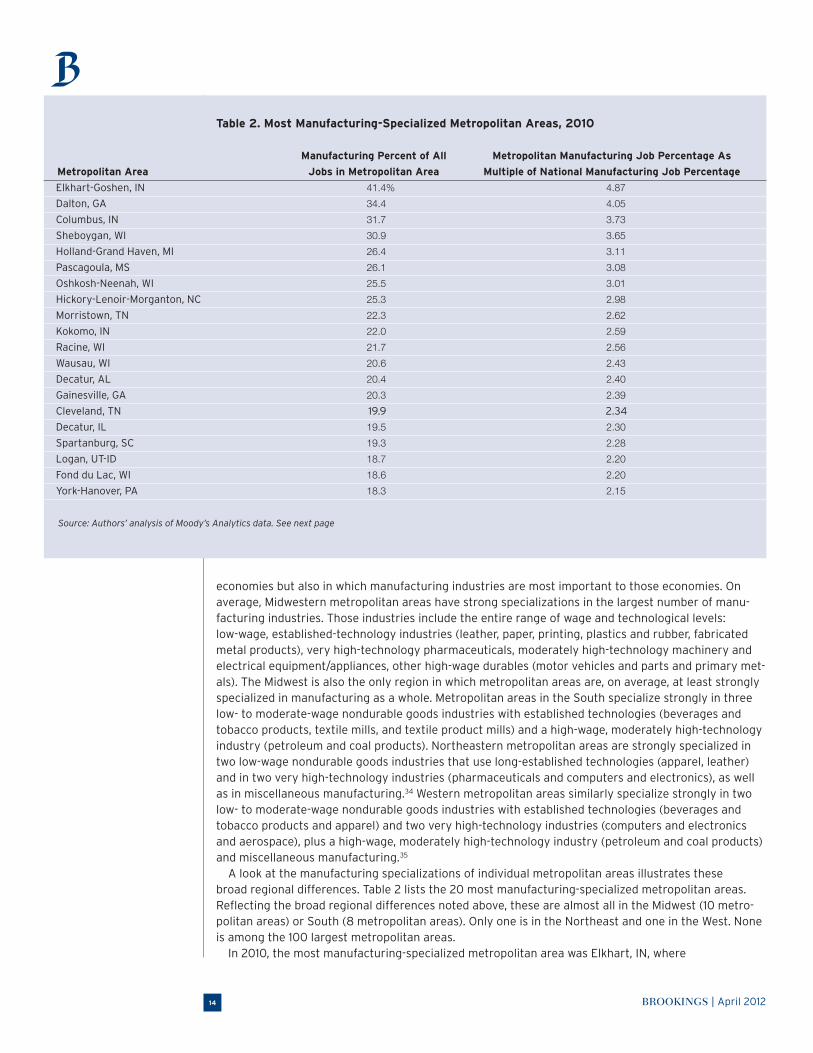
A look at the manufacturing specializations of individual metropolitan areas illustrates these broad regional differences. Table 2 lists the 20 most manufacturing-specialized metropolitan areas. Reflecting the broad regional differences noted above, these are almost all in the Midwest (10 metro-politan areas) or South (8 metropolitan areas). Only one is in the Northeast and one in the West. None is among the 100 largest metropolitan areas.
In 2010, the most manufacturing-specialized metropolitan area was Elkhart, IN, where
Table 2. Most Manufacturing-Specialized Metropolitan Areas, 2010
Manufacturing Percent of All Metropolitan Manufacturing Job Percentage As
Metropolitan Area Jobs in Metropolitan Area Multiple of National Manufacturing Job Percentage
Elkhart-Goshen, IN 41.4% 4.87Dalton, GA 34.4 4.05Columbus, IN 31.7 3.73Sheboygan, WI 30.9 3.65Holland-Grand Haven, MI 26.4 3.11Pascagoula, MS 26.1 3.08Oshkosh-Neenah, WI 25.5 3.01Hickory-Lenoir-Morganton, NC 25.3 2.98Morristown, TN 22.3 2.62Kokomo, IN 22.0 2.59Racine, WI 21.7 2.56Wausau, WI 20.6 2.43Decatur, AL 20.4 2.40Gainesville, GA 20.3 2.39Cleveland, TN 19.9 2.34
Decatur, IL 19.5 2.30Spartanburg, SC 19.3 2.28Logan, UT-ID 18.7 2.20Fond du Lac, WI 18.6 2.20York-Hanover, PA 18.3 2.15
Source: Authors’ analysis of Moody’s Analytics data. See next page
BROOKINGS | April 2012 15
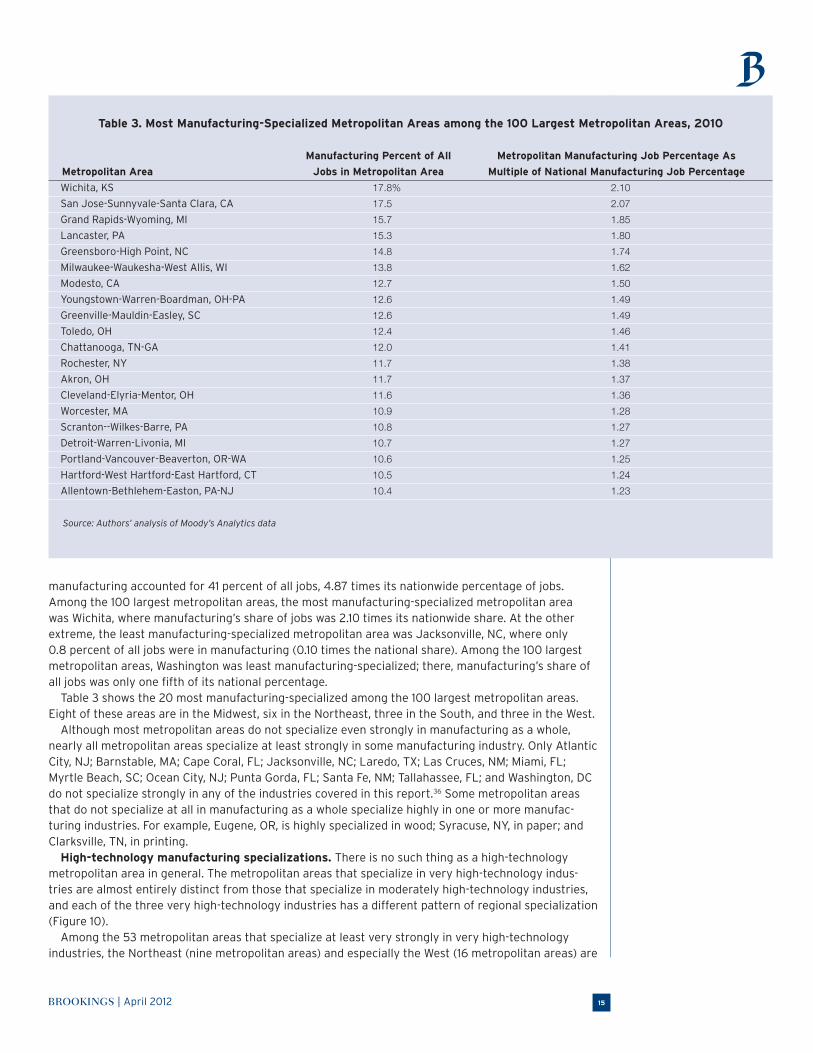
manufacturing accounted for 41 percent of all jobs, 4.87 times its nationwide percentage of jobs. Among the 100 largest metropolitan areas, the most manufacturing-specialized metropolitan area was Wichita, where manufacturing’s share of jobs was 2.10 times its nationwide share. At the other extreme, the least manufacturing-specialized metropolitan area was Jacksonville, NC, where only 0.8 percent of all jobs were in manufacturing (0.10 times the national share). Among the 100 largest metropolitan areas, Washington was least manufacturing-specialized; there, manufacturing’s share of all jobs was only one fifth of its national percentage.
Table 3 shows the 20 most manufacturing-specialized among the 100 largest metropolitan areas. Eight of these areas are in the Midwest, six in the Northeast, three in the South, and three in the West.
Although most metropolitan areas do not specialize even strongly in manufacturing as a whole, nearly all metropolitan areas specialize at least strongly in some manufacturing industry. Only Atlantic City, NJ; Barnstable, MA; Cape Coral, FL; Jacksonville, NC; Laredo, TX; Las Cruces, NM; Miami, FL; Myrtle Beach, SC; Ocean City, NJ; Punta Gorda, FL; Santa Fe, NM; Tallahassee, FL; and Washington, DC do not specialize strongly in any of the industries covered in this report.36 Some metropolitan areas that do not specialize at all in manufacturing as a whole specialize highly in one or more manufac-turing industries. For example, Eugene, OR, is highly specialized in wood; Syracuse, NY, in paper; and Clarksville, TN, in printing.
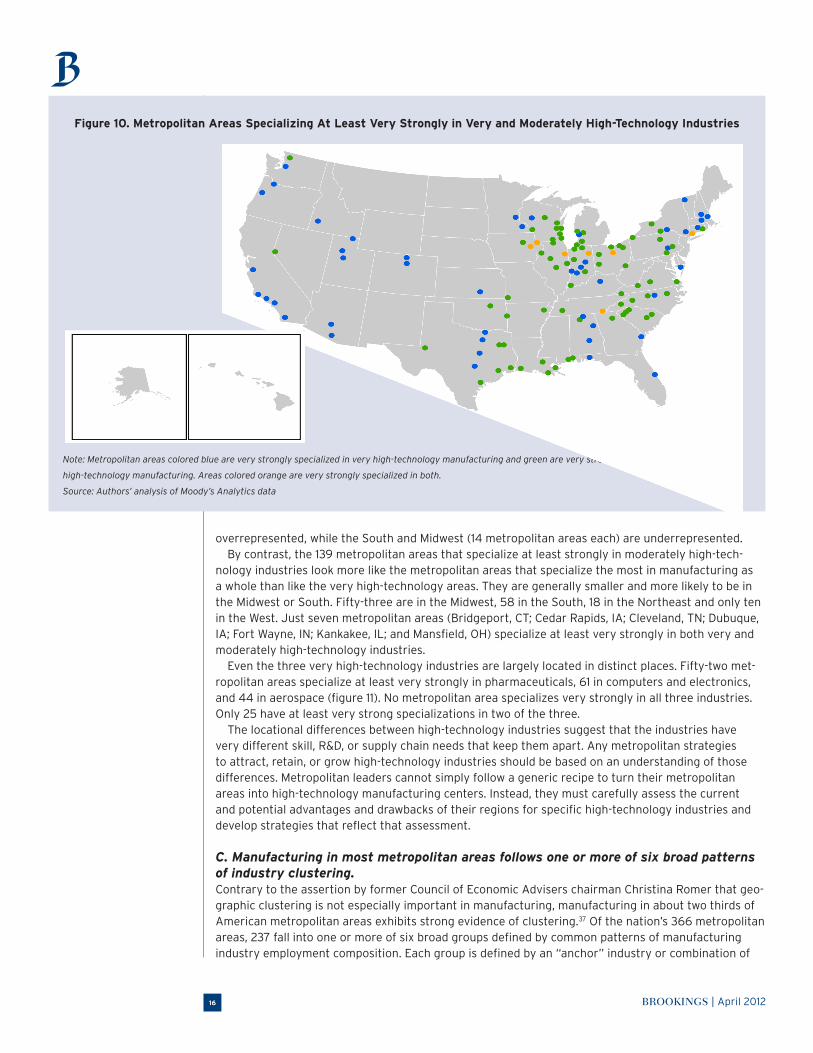
High-technology manufacturing specializations. There is no such thing as a high-technology metropolitan area in general. The metropolitan areas that specialize in very high-technology indus-tries are almost entirely distinct from those that specialize in moderately high-technology industries, and each of the three very high-technology industries has a different pattern of regional specialization (Figure 10).
Among the 53 metropolitan areas that specialize at least very strongly in very high-technology industries, the Northeast (nine metropolitan areas) and especially the West (16 metropolitan areas) are
Table 3. Most Manufacturing-Specialized Metropolitan Areas among the 100 Largest Metropolitan Areas, 2010
Manufacturing Percent of All Metropolitan Manufacturing Job Percentage As
Metropolitan Area Jobs in Metropolitan Area Multiple of National Manufacturing Job Percentage
Wichita, KS 17.8% 2.10San Jose-Sunnyvale-Santa Clara, CA 17.5 2.07Grand Rapids-Wyoming, MI 15.7 1.85Lancaster, PA 15.3 1.80Greensboro-High Point, NC 14.8 1.74Milwaukee-Waukesha-West Allis, WI 13.8 1.62Modesto, CA 12.7 1.50Youngstown-Warren-Boardman, OH-PA 12.6 1.49Greenville-Mauldin-Easley, SC 12.6 1.49Toledo, OH 12.4 1.46Chattanooga, TN-GA 12.0 1.41Rochester, NY 11.7 1.38Akron, OH 11.7 1.37Cleveland-Elyria-Mentor, OH 11.6 1.36Worcester, MA 10.9 1.28Scranton--Wilkes-Barre, PA 10.8 1.27Detroit-Warren-Livonia, MI 10.7 1.27Portland-Vancouver-Beaverton, OR-WA 10.6 1.25Hartford-West Hartford-East Hartford, CT 10.5 1.24Allentown-Bethlehem-Easton, PA-NJ 10.4 1.23 Source: Authors’ analysis of Moody’s Analytics data
BROOKINGS | April 201216
overrepresented, while the South and Midwest (14 metropolitan areas each) are underrepresented.By contrast, the 139 metropolitan areas that specialize at least strongly in moderately high-tech-
nology industries look more like the metropolitan areas that specialize the most in manufacturing as a whole than like the very high-technology areas. They are generally smaller and more likely to be in the Midwest or South. Fifty-three are in the Midwest, 58 in the South, 18 in the Northeast and only ten in the West. Just seven metropolitan areas (Bridgeport, CT; Cedar Rapids, IA; Cleveland, TN; Dubuque, IA; Fort Wayne, IN; Kankakee, IL; and Mansfield, OH) specialize at least very strongly in both very and moderately high-technology industries.
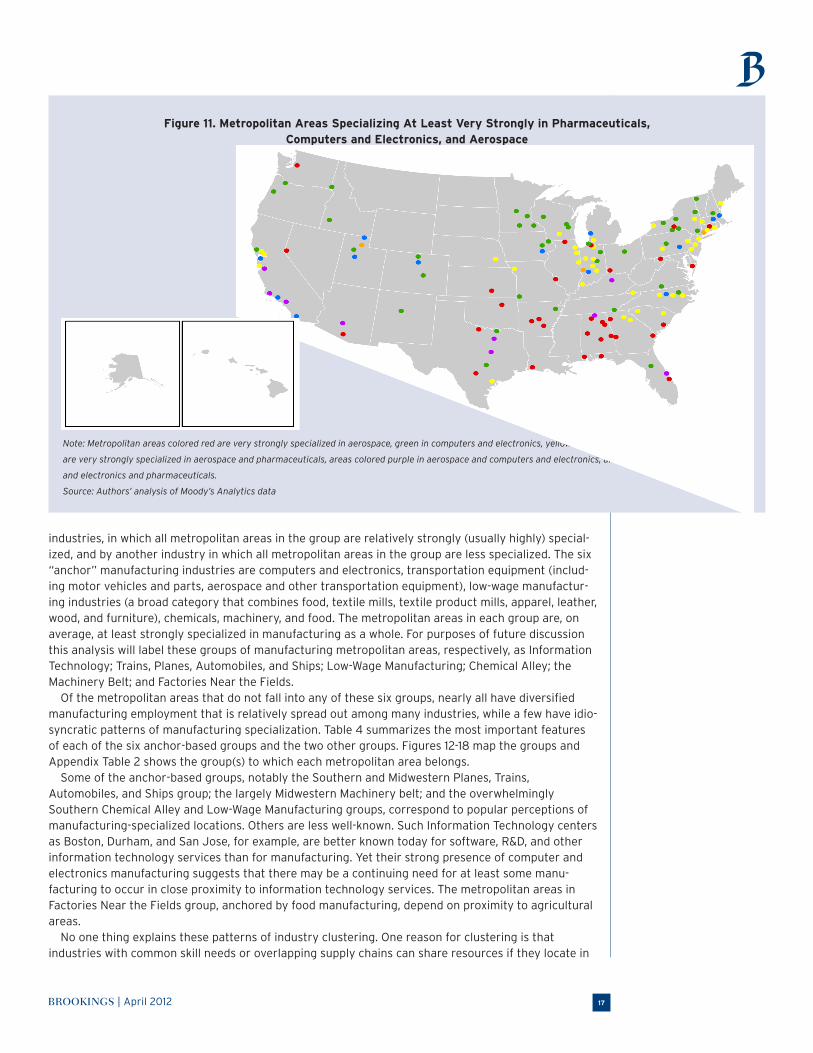
Even the three very high-technology industries are largely located in distinct places. Fifty-two met-ropolitan areas specialize at least very strongly in pharmaceuticals, 61 in computers and electronics, and 44 in aerospace (figure 11). No metropolitan area specializes very strongly in all three industries. Only 25 have at least very strong specializations in two of the three.
The locational differences between high-technology industries suggest that the industries have very different skill, R&D, or supply chain needs that keep them apart. Any metropolitan strategies to attract, retain, or grow high-technology industries should be based on an understanding of those differences. Metropolitan leaders cannot simply follow a generic recipe to turn their metropolitan areas into high-technology manufacturing centers. Instead, they must carefully assess the current and potential advantages and drawbacks of their regions for specific high-technology industries and develop strategies that reflect that assessment.
C. Manufacturing in most metropolitan areas follows one or more of six broad patterns of industry clustering. Contrary to the assertion by former Council of Economic Advisers chairman Christina Romer that geo-graphic clustering is not especially important in manufacturing, manufacturing in about two thirds of American metropolitan areas exhibits strong evidence of clustering.37 Of the nation’s 366 metropolitan areas, 237 fall into one or more of six broad groups defined by common patterns of manufacturing industry employment composition. Each group is defined by an “anchor” industry or combination of
Figure 10. Metropolitan Areas Specializing At Least Very Strongly in Very and Moderately High-Technology Industries
Note: Metropolitan areas colored blue are very strongly specialized in very high-technology manufacturing and green are very strongly specialized in moderately
high-technology manufacturing. Areas colored orange are very strongly specialized in both.
Source: Authors’ analysis of Moody’s Analytics data
BROOKINGS | April 2012 17
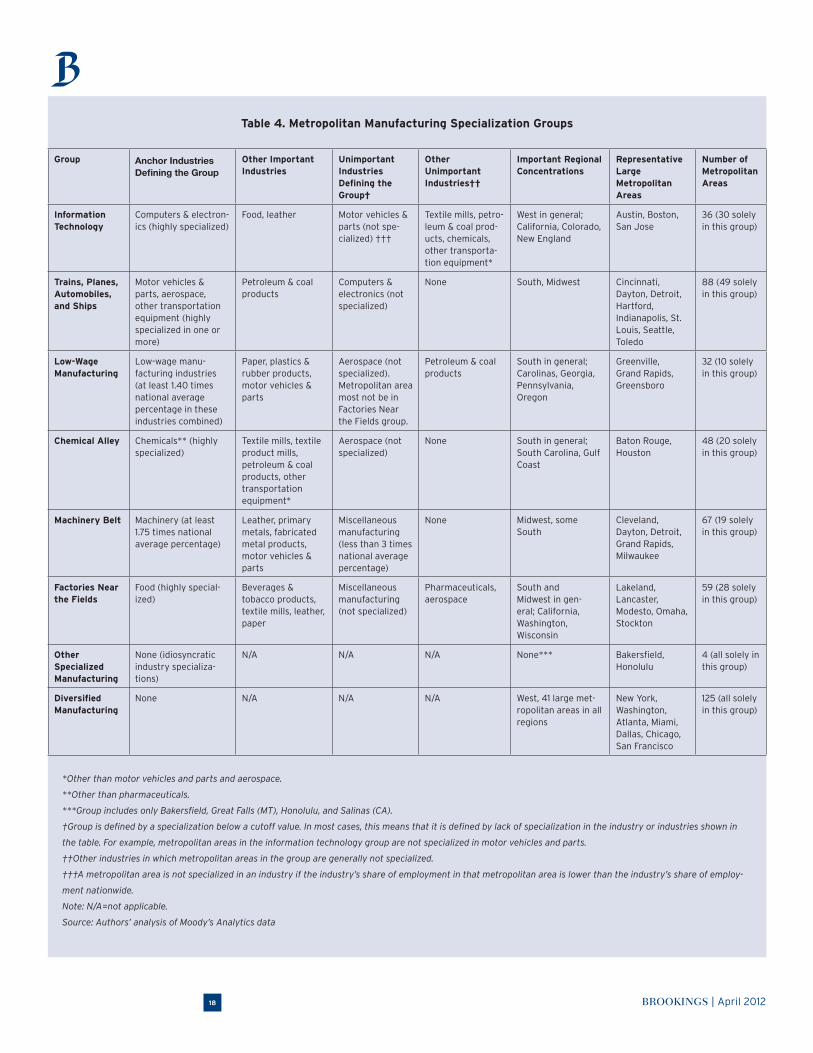
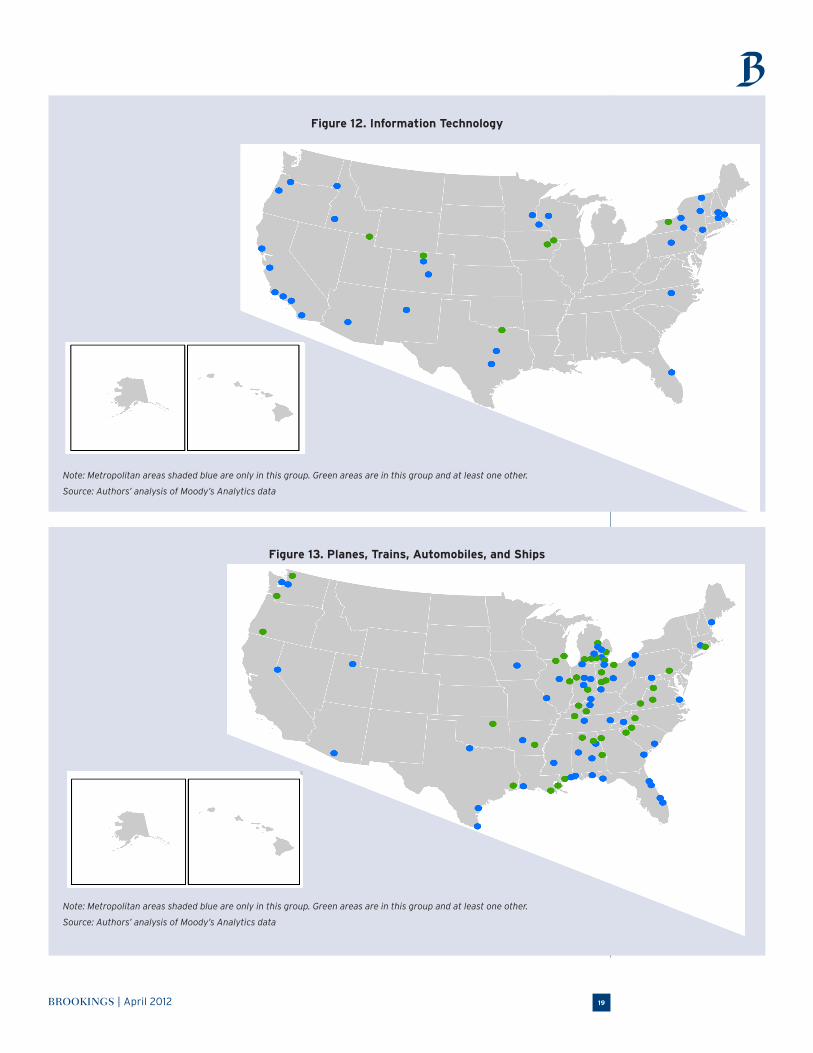
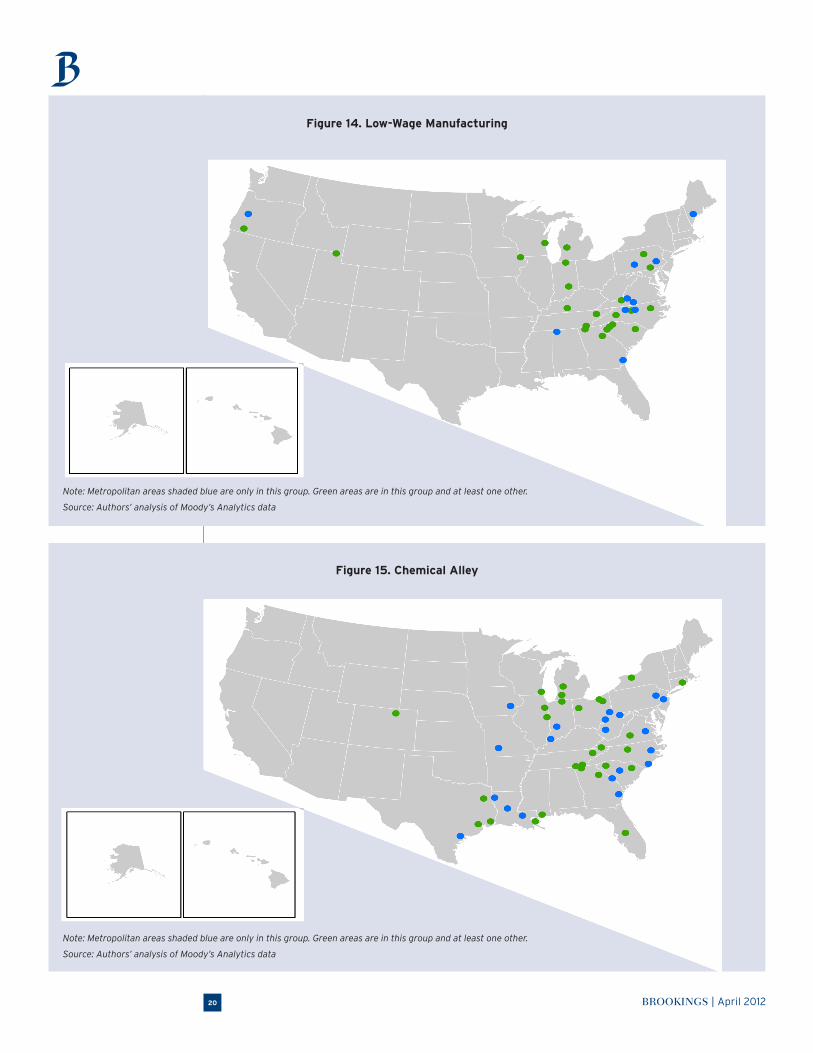
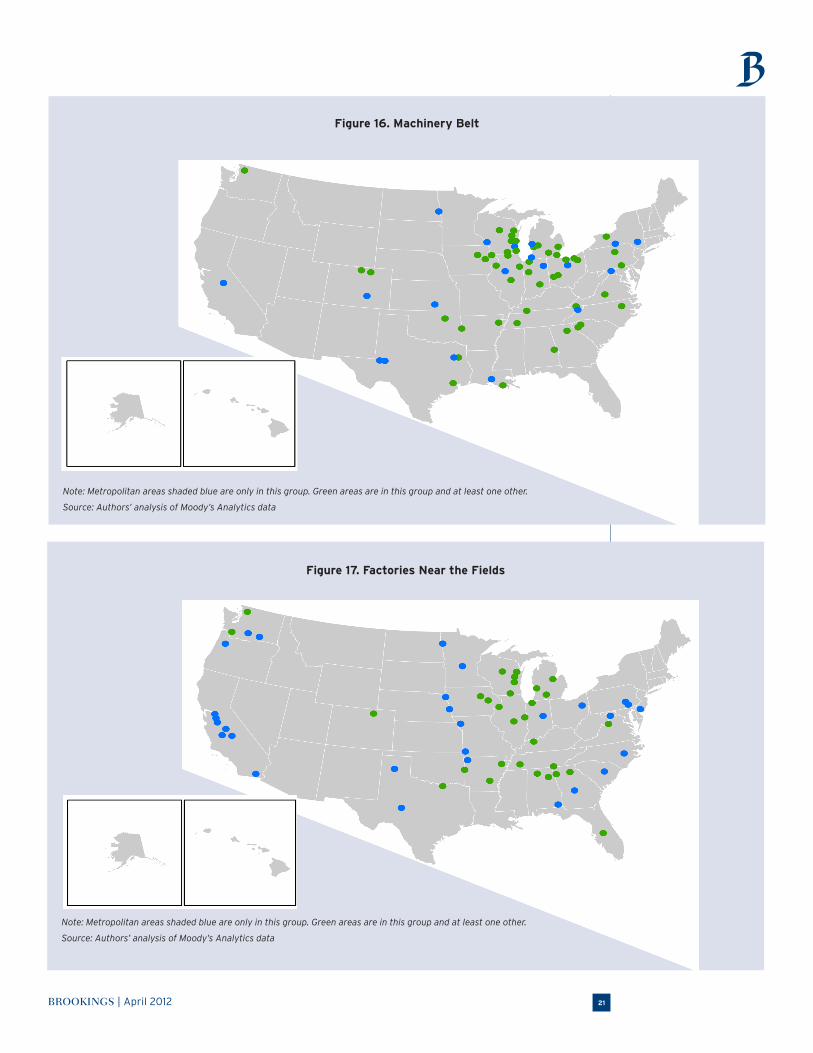
industries, in which all metropolitan areas in the group are relatively strongly (usually highly) special-ized, and by another industry in which all metropolitan areas in the group are less specialized. The six “anchor” manufacturing industries are computers and electronics, transportation equipment (includ-ing motor vehicles and parts, aerospace and other transportation equipment), low-wage manufactur-ing industries (a broad category that combines food, textile mills, textile product mills, apparel, leather, wood, and furniture), chemicals, machinery, and food. The metropolitan areas in each group are, on average, at least strongly specialized in manufacturing as a whole. For purposes of future discussion this analysis will label these groups of manufacturing metropolitan areas, respectively, as Information Technology; Trains, Planes, Automobiles, and Ships; Low-Wage Manufacturing; Chemical Alley; the Machinery Belt; and Factories Near the Fields.
Of the metropolitan areas that do not fall into any of these six groups, nearly all have diversified manufacturing employment that is relatively spread out among many industries, while a few have idio-syncratic patterns of manufacturing specialization. Table 4 summarizes the most important features of each of the six anchor-based groups and the two other groups. Figures 12-18 map the groups and Appendix Table 2 shows the group(s) to which each metropolitan area belongs.
Some of the anchor-based groups, notably the Southern and Midwestern Planes, Trains, Automobiles, and Ships group; the largely Midwestern Machinery belt; and the overwhelmingly Southern Chemical Alley and Low-Wage Manufacturing groups, correspond to popular perceptions of manufacturing-specialized locations. Others are less well-known. Such Information Technology centers as Boston, Durham, and San Jose, for example, are better known today for software, R&D, and other information technology services than for manufacturing. Yet their strong presence of computer and electronics manufacturing suggests that there may be a continuing need for at least some manu-facturing to occur in close proximity to information technology services. The metropolitan areas in Factories Near the Fields group, anchored by food manufacturing, depend on proximity to agricultural areas.
No one thing explains these patterns of industry clustering. One reason for clustering is that industries with common skill needs or overlapping supply chains can share resources if they locate in
Figure 11. Metropolitan Areas Specializing At Least Very Strongly in Pharmaceuticals, Computers and Electronics, and Aerospace
Note: Metropolitan areas colored red are very strongly specialized in aerospace, green in computers and electronics, yellow in pharmaceuticals. Areas colored orange
are very strongly specialized in aerospace and pharmaceuticals, areas colored purple in aerospace and computers and electronics, areas colored blue in computers
and electronics and pharmaceuticals.
Source: Authors’ analysis of Moody’s Analytics data
BROOKINGS | April 201218
Table 4. Metropolitan Manufacturing Specialization Groups
Group Anchor Industries Defining the Group
Other Important Industries
Unimportant Industries Defining the Group†
Other Unimportant Industries††
Important Regional Concentrations
Representative Large Metropolitan Areas
Number of Metropolitan Areas
Information Technology
Computers & electron-ics (highly specialized)
Food, leather Motor vehicles & parts (not spe-cialized) †††
Textile mills, petro-leum & coal prod-ucts, chemicals, other transporta-tion equipment*
West in general; California, Colorado, New England
Austin, Boston, San Jose
36 (30 solely in this group)
Trains, Planes, Automobiles, and Ships
Motor vehicles & parts, aerospace, other transportation equipment (highly specialized in one or more)
Petroleum & coal products
Computers & electronics (not specialized)
None South, Midwest Cincinnati, Dayton, Detroit, Hartford, Indianapolis, St. Louis, Seattle, Toledo
88 (49 solely in this group)
Low-Wage Manufacturing
Low-wage manu-facturing industries (at least 1.40 times national average percentage in these industries combined)
Paper, plastics & rubber products, motor vehicles & parts
Aerospace (not specialized). Metropolitan area most not be in Factories Near the Fields group.
Petroleum & coal products
South in general; Carolinas, Georgia, Pennsylvania, Oregon
Greenville, Grand Rapids, Greensboro
32 (10 solely in this group)
Chemical Alley Chemicals** (highly specialized)
Textile mills, textile product mills, petroleum & coal products, other transportation equipment*
Aerospace (not specialized)
None South in general; South Carolina, Gulf Coast
Baton Rouge, Houston
48 (20 solely in this group)
Machinery Belt Machinery (at least 1.75 times national average percentage)
Leather, primary metals, fabricated metal products, motor vehicles & parts
Miscellaneous manufacturing (less than 3 times national average percentage)
None Midwest, some South
Cleveland, Dayton, Detroit, Grand Rapids, Milwaukee
67 (19 solely in this group)
Factories Near the Fields
Food (highly special-ized)
Beverages & tobacco products, textile mills, leather, paper
Miscellaneous manufacturing (not specialized)
Pharmaceuticals, aerospace
South and Midwest in gen-eral; California, Washington, Wisconsin
Lakeland, Lancaster, Modesto, Omaha, Stockton
59 (28 solely in this group)
Other Specialized Manufacturing
None (idiosyncratic industry specializa-tions)
N/A N/A N/A None*** Bakersfield, Honolulu
4 (all solely in this group)
Diversified Manufacturing
None N/A N/A N/A West, 41 large met-ropolitan areas in all regions
New York, Washington, Atlanta, Miami, Dallas, Chicago, San Francisco
125 (all solely in this group)
*Other than motor vehicles and parts and aerospace.
**Other than pharmaceuticals.
***Group includes only Bakersfield, Great Falls (MT), Honolulu, and Salinas (CA).
†Group is defined by a specialization below a cutoff value. In most cases, this means that it is defined by lack of specialization in the industry or industries shown in
the table. For example, metropolitan areas in the information technology group are not specialized in motor vehicles and parts.
††Other industries in which metropolitan areas in the group are generally not specialized.
†††A metropolitan area is not specialized in an industry if the industry’s share of employment in that metropolitan area is lower than the industry’s share of employ-
ment nationwide.
Note: N/A=not applicable.
Source: Authors’ analysis of Moody’s Analytics data
BROOKINGS | April 2012 19
Figure 12. Information Technology
Note: Metropolitan areas shaded blue are only in this group. Green areas are in this group and at least one other.
Source: Authors’ analysis of Moody’s Analytics data
Figure 13. Planes, Trains, Automobiles, and Ships
Note: Metropolitan areas shaded blue are only in this group. Green areas are in this group and at least one other.
Source: Authors’ analysis of Moody’s Analytics data
BROOKINGS | April 201220
Figure 14. Low-Wage Manufacturing
Note: Metropolitan areas shaded blue are only in this group. Green areas are in this group and at least one other.
Source: Authors’ analysis of Moody’s Analytics data
Figure 15. Chemical Alley
Note: Metropolitan areas shaded blue are only in this group. Green areas are in this group and at least one other.
Source: Authors’ analysis of Moody’s Analytics data
BROOKINGS | April 2012 21
Figure 16. Machinery Belt
Note: Metropolitan areas shaded blue are only in this group. Green areas are in this group and at least one other.
Source: Authors’ analysis of Moody’s Analytics data
Figure 17. Factories Near the Fields
Note: Metropolitan areas shaded blue are only in this group. Green areas are in this group and at least one other.
Source: Authors’ analysis of Moody’s Analytics data
BROOKINGS | April 201222
the same metropolitan areas.38 For example, in the Machinery Belt, high employment percentages in machinery, primary metals, fabricated metal products, and motor vehicles and parts reflect common needs of industries that depend on access to machines and tools for forming metal. Other reasons for industry co-location include needs for access to a common set of natural resources (as in the common importance of textiles, textile products, and petroleum and coal products in Chemical Alley), and the desire of workers to live near others with similar occupations or consumption patterns.39 Thus, the co-location of similar firms likely results from a robust ecosystem of several factors, including workforce skills, physical landscape characteristics, and amenities. The importance of such ecosystems suggests that efforts to create a cluster of industries without some pre-existing heritage in the area are likely to fail.
Some industries may be located in different places from others because the industries rely on technologies or forms of business organization that require incompatible skills or habits. For example, Information Technology centers’ high specialization in computers and electronics is accompanied by a lack of specialization in motor vehicles and parts, while Planes, Trains, Automobiles, and Ships’ high specialization in transportation equipment goes along with a lack of specialization in computers and electronics. The large firms, highly standardized products, and relatively stable firm-based employ-ment systems that characterize the auto industry are very different from the computer industry’s smaller firms, more customized products, and higher degree of interfirm worker mobility. Employees who are used to working in one of these industries may be poorly suited to the other.40
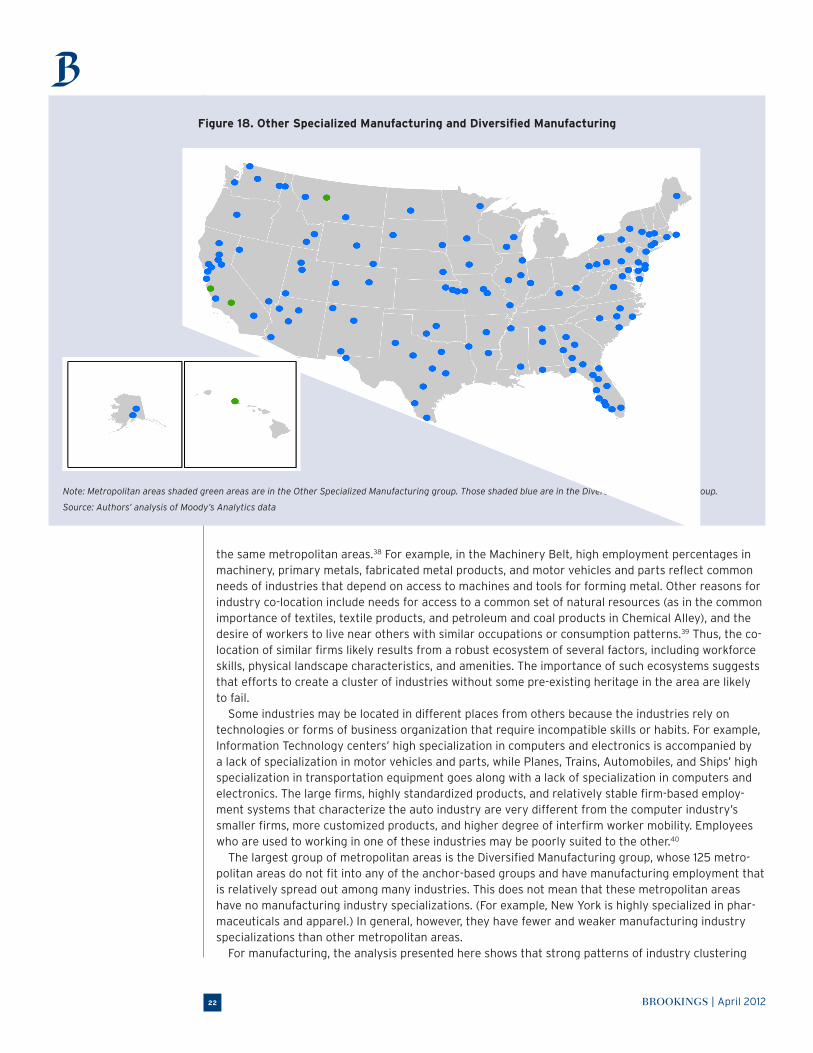
The largest group of metropolitan areas is the Diversified Manufacturing group, whose 125 metro-politan areas do not fit into any of the anchor-based groups and have manufacturing employment that is relatively spread out among many industries. This does not mean that these metropolitan areas have no manufacturing industry specializations. (For example, New York is highly specialized in phar-maceuticals and apparel.) In general, however, they have fewer and weaker manufacturing industry specializations than other metropolitan areas.
For manufacturing, the analysis presented here shows that strong patterns of industry clustering
Figure 18. Other Specialized Manufacturing and Diversified Manufacturing
Note: Metropolitan areas shaded green areas are in the Other Specialized Manufacturing group. Those shaded blue are in the Diversified Manufacturing group.
Source: Authors’ analysis of Moody’s Analytics data
BROOKINGS | April 2012 23
continue to characterize metropolitan America. About two thirds of metropolitan areas, including most of the 100 largest metropolitan areas, follow one or more of six well defined patterns of industry spe-cialization. A few more have strong but more idiosyncratic specializations. Multiple industry clusters often characterize the manufacturing bases of metropolitan areas in the diversified manufacturing group as well, All these patterns of geographic specialization confer economic benefits and create opportunities for high-road policy.
D. Manufacturing wages vary widely among metropolitan areas. Along with strong innovation performance (which is difficult to measure for industries within metro-politan areas), high wages are a key component of the high-road approach to manufacturing. Thus, differences in wages among metropolitan areas suggest that high-road manufacturers are more preva-lent in some metropolitan areas than in others.
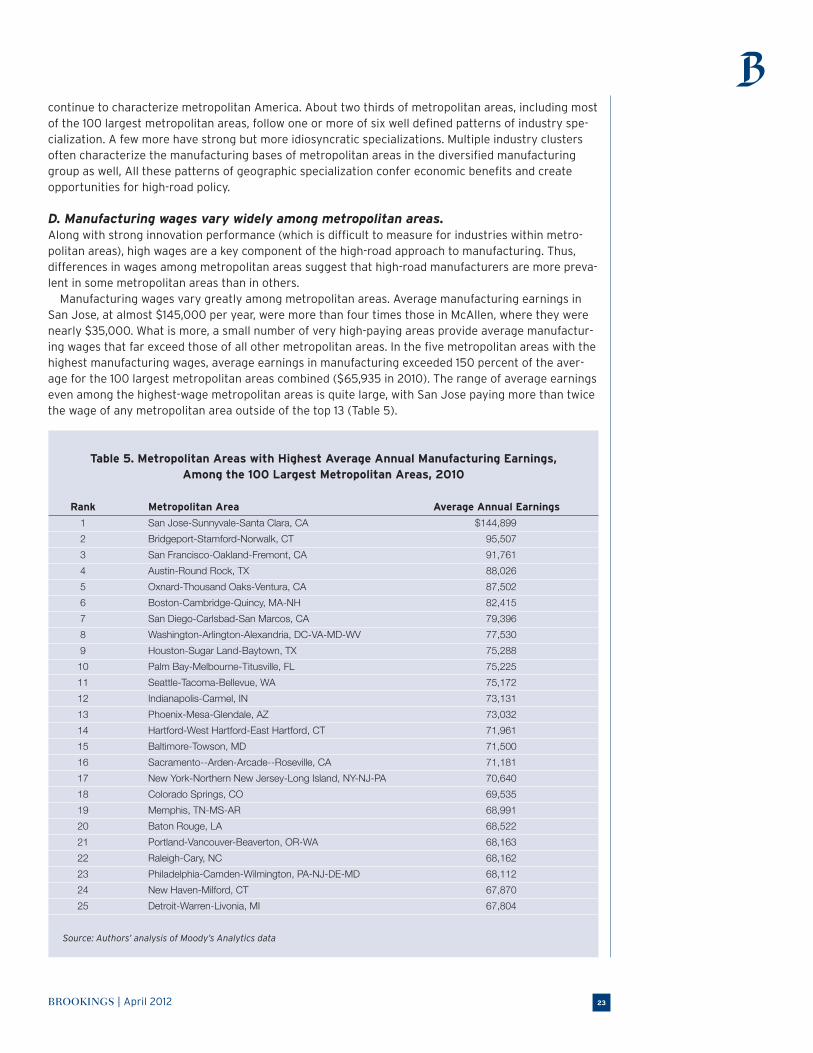
Manufacturing wages vary greatly among metropolitan areas. Average manufacturing earnings in San Jose, at almost $145,000 per year, were more than four times those in McAllen, where they were nearly $35,000. What is more, a small number of very high-paying areas provide average manufactur-ing wages that far exceed those of all other metropolitan areas. In the five metropolitan areas with the highest manufacturing wages, average earnings in manufacturing exceeded 150 percent of the aver-age for the 100 largest metropolitan areas combined ($65,935 in 2010). The range of average earnings even among the highest-wage metropolitan areas is quite large, with San Jose paying more than twice the wage of any metropolitan area outside of the top 13 (Table 5).
Table 5. Metropolitan Areas with Highest Average Annual Manufacturing Earnings, Among the 100 Largest Metropolitan Areas, 2010
Rank Metropolitan Area Average Annual Earnings
1 SanJose-Sunnyvale-SantaClara,CA $144,899 2 Bridgeport-Stamford-Norwalk,CT 95,507 3 SanFrancisco-Oakland-Fremont,CA 91,761 4 Austin-RoundRock,TX 88,026 5 Oxnard-ThousandOaks-Ventura,CA 87,502 6 Boston-Cambridge-Quincy,MA-NH 82,415 7 SanDiego-Carlsbad-SanMarcos,CA 79,396 8 Washington-Arlington-Alexandria,DC-VA-MD-WV 77,530 9 Houston-SugarLand-Baytown,TX 75,288 10 PalmBay-Melbourne-Titusville,FL 75,225 11 Seattle-Tacoma-Bellevue,WA 75,172 12 Indianapolis-Carmel,IN 73,131 13 Phoenix-Mesa-Glendale,AZ 73,032 14 Hartford-WestHartford-EastHartford,CT 71,961 15 Baltimore-Towson,MD 71,500 16 Sacramento--Arden-Arcade--Roseville,CA 71,181 17 NewYork-NorthernNewJersey-LongIsland,NY-NJ-PA 70,640 18 ColoradoSprings,CO 69,535 19 Memphis,TN-MS-AR 68,991 20 BatonRouge,LA 68,522 21 Portland-Vancouver-Beaverton,OR-WA 68,163 22 Raleigh-Cary,NC 68,162 23 Philadelphia-Camden-Wilmington,PA-NJ-DE-MD 68,112 24 NewHaven-Milford,CT 67,870 25 Detroit-Warren-Livonia,MI 67,804
Source: Authors’ analysis of Moody’s Analytics data
BROOKINGS | April 201224
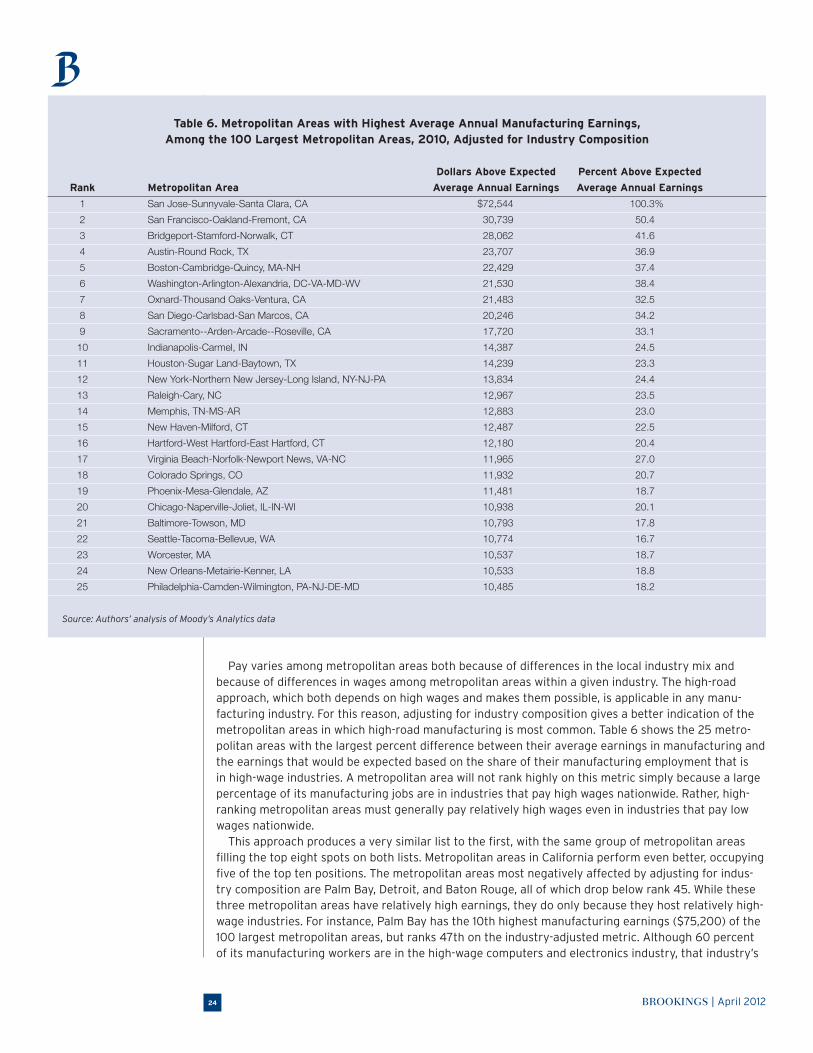
Pay varies among metropolitan areas both because of differences in the local industry mix and because of differences in wages among metropolitan areas within a given industry. The high-road approach, which both depends on high wages and makes them possible, is applicable in any manu-facturing industry. For this reason, adjusting for industry composition gives a better indication of the metropolitan areas in which high-road manufacturing is most common. Table 6 shows the 25 metro-politan areas with the largest percent difference between their average earnings in manufacturing and the earnings that would be expected based on the share of their manufacturing employment that is in high-wage industries. A metropolitan area will not rank highly on this metric simply because a large percentage of its manufacturing jobs are in industries that pay high wages nationwide. Rather, high-ranking metropolitan areas must generally pay relatively high wages even in industries that pay low wages nationwide.
This approach produces a very similar list to the first, with the same group of metropolitan areas filling the top eight spots on both lists. Metropolitan areas in California perform even better, occupying five of the top ten positions. The metropolitan areas most negatively affected by adjusting for indus-try composition are Palm Bay, Detroit, and Baton Rouge, all of which drop below rank 45. While these three metropolitan areas have relatively high earnings, they do only because they host relatively high-wage industries. For instance, Palm Bay has the 10th highest manufacturing earnings ($75,200) of the 100 largest metropolitan areas, but ranks 47th on the industry-adjusted metric. Although 60 percent of its manufacturing workers are in the high-wage computers and electronics industry, that industry’s
Table 6. Metropolitan Areas with Highest Average Annual Manufacturing Earnings, Among the 100 Largest Metropolitan Areas, 2010, Adjusted for Industry Composition
Dollars Above Expected Percent Above Expected
Rank Metropolitan Area Average Annual Earnings Average Annual Earnings
1 SanJose-Sunnyvale-SantaClara,CA $72,544 100.3% 2 SanFrancisco-Oakland-Fremont,CA 30,739 50.4 3 Bridgeport-Stamford-Norwalk,CT 28,062 41.6 4 Austin-RoundRock,TX 23,707 36.9 5 Boston-Cambridge-Quincy,MA-NH 22,429 37.4 6 Washington-Arlington-Alexandria,DC-VA-MD-WV 21,530 38.4 7 Oxnard-ThousandOaks-Ventura,CA 21,483 32.5 8 SanDiego-Carlsbad-SanMarcos,CA 20,246 34.2 9 Sacramento--Arden-Arcade--Roseville,CA 17,720 33.1 10 Indianapolis-Carmel,IN 14,387 24.5 11 Houston-SugarLand-Baytown,TX 14,239 23.3 12 NewYork-NorthernNewJersey-LongIsland,NY-NJ-PA 13,834 24.4 13 Raleigh-Cary,NC 12,967 23.5 14 Memphis,TN-MS-AR 12,883 23.0 15 NewHaven-Milford,CT 12,487 22.5 16 Hartford-WestHartford-EastHartford,CT 12,180 20.4 17 VirginiaBeach-Norfolk-NewportNews,VA-NC 11,965 27.0 18 ColoradoSprings,CO 11,932 20.7 19 Phoenix-Mesa-Glendale,AZ 11,481 18.7 20 Chicago-Naperville-Joliet,IL-IN-WI 10,938 20.1 21 Baltimore-Towson,MD 10,793 17.8 22 Seattle-Tacoma-Bellevue,WA 10,774 16.7 23 Worcester,MA 10,537 18.7 24 NewOrleans-Metairie-Kenner,LA 10,533 18.8 25 Philadelphia-Camden-Wilmington,PA-NJ-DE-MD 10,485 18.2
Source: Authors’ analysis of Moody’s Analytics data
BROOKINGS | April 2012 25
average wage in the Palm Bay area remains $11,000 below the national average ($94,000). Detroit’s 74,000 motor vehicles and parts workers earn $21,000 above the average for that industry ($59,000) but virtually all other major industries in the area pay below their respective 100-metropolitan area averages. Conversely, the three metropolitan areas that perform substantially better when adjusting for industry composition are Raleigh, Virginia Beach, and Chicago. The broad similarity between these two lists indicates that most high-wage metropolitan areas pay above-average wages across a broad range of industries, including those industries with a lower average wage nationally. In general, the cost of living is higher in metropolitan areas, largely because of higher housing costs and other costs of congestion. Thus, even low-wage industries must generally pay more if they wish to attract workers in such an area. Of course, this deters much low-wage activity from locating in a higher-wage area, although many low-wage industries still find it profitable to do so. The importance of supply chain localization, proximity to certain technologies, or proximity to certain other industries likely explain why some low-wage industries still find it profitable to locate in high-wage areas, paying more in wages than they otherwise would. For example, printing workers in the Bridgeport area earn $14,000 above the national average ($45,000) for their industry. The metropolitan area is one of the most costly in the country but its proximity to the publishing industry in New York likely makes higher wages profit-able even in this relatively low-wage industry.
However, low-wage industries do not always offer higher wages when in high-wage metropolitan areas. In the San Jose area, with the highest average manufacturing wages in the nation, food manu-facturing workers still earn $3,000 less than the industry’s average annual wage.
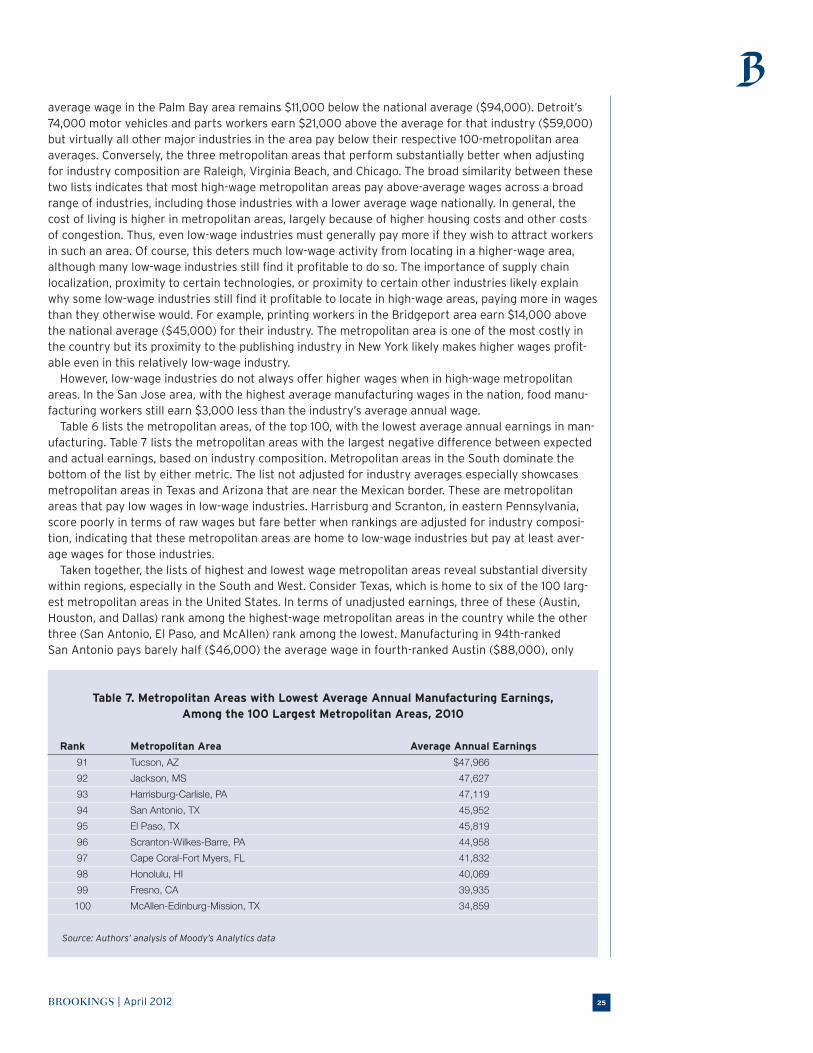
Table 6 lists the metropolitan areas, of the top 100, with the lowest average annual earnings in man-ufacturing. Table 7 lists the metropolitan areas with the largest negative difference between expected and actual earnings, based on industry composition. Metropolitan areas in the South dominate the bottom of the list by either metric. The list not adjusted for industry averages especially showcases metropolitan areas in Texas and Arizona that are near the Mexican border. These are metropolitan areas that pay low wages in low-wage industries. Harrisburg and Scranton, in eastern Pennsylvania, score poorly in terms of raw wages but fare better when rankings are adjusted for industry composi-tion, indicating that these metropolitan areas are home to low-wage industries but pay at least aver-age wages for those industries.
Taken together, the lists of highest and lowest wage metropolitan areas reveal substantial diversity within regions, especially in the South and West. Consider Texas, which is home to six of the 100 larg-est metropolitan areas in the United States. In terms of unadjusted earnings, three of these (Austin, Houston, and Dallas) rank among the highest-wage metropolitan areas in the country while the other three (San Antonio, El Paso, and McAllen) rank among the lowest. Manufacturing in 94th-ranked San Antonio pays barely half ($46,000) the average wage in fourth-ranked Austin ($88,000), only
Table 7. Metropolitan Areas with Lowest Average Annual Manufacturing Earnings, Among the 100 Largest Metropolitan Areas, 2010
Rank Metropolitan Area Average Annual Earnings
91 Tucson,AZ $47,966 92 Jackson,MS 47,627 93 Harrisburg-Carlisle,PA 47,119 94 SanAntonio,TX 45,952 95 ElPaso,TX 45,819 96 Scranton-Wilkes-Barre,PA 44,958 97 CapeCoral-FortMyers,FL 41,832 98 Honolulu,HI 40,069 99 Fresno,CA 39,935 100 McAllen-Edinburg-Mission,TX 34,859
Source: Authors’ analysis of Moody’s Analytics data
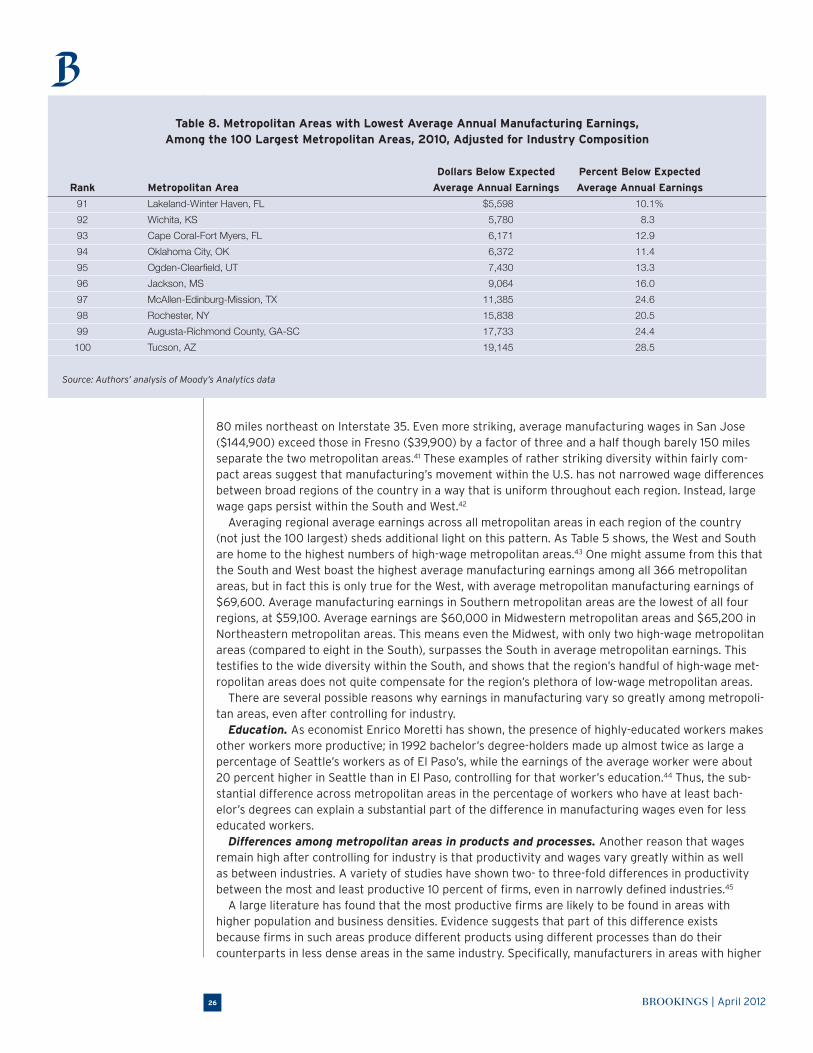
BROOKINGS | April 201226
80 miles northeast on Interstate 35. Even more striking, average manufacturing wages in San Jose ($144,900) exceed those in Fresno ($39,900) by a factor of three and a half though barely 150 miles separate the two metropolitan areas.41 These examples of rather striking diversity within fairly com-pact areas suggest that manufacturing’s movement within the U.S. has not narrowed wage differences between broad regions of the country in a way that is uniform throughout each region. Instead, large wage gaps persist within the South and West.42
Averaging regional average earnings across all metropolitan areas in each region of the country (not just the 100 largest) sheds additional light on this pattern. As Table 5 shows, the West and South are home to the highest numbers of high-wage metropolitan areas.43 One might assume from this that the South and West boast the highest average manufacturing earnings among all 366 metropolitan areas, but in fact this is only true for the West, with average metropolitan manufacturing earnings of $69,600. Average manufacturing earnings in Southern metropolitan areas are the lowest of all four regions, at $59,100. Average earnings are $60,000 in Midwestern metropolitan areas and $65,200 in Northeastern metropolitan areas. This means even the Midwest, with only two high-wage metropolitan areas (compared to eight in the South), surpasses the South in average metropolitan earnings. This testifies to the wide diversity within the South, and shows that the region’s handful of high-wage met-ropolitan areas does not quite compensate for the region’s plethora of low-wage metropolitan areas.
There are several possible reasons why earnings in manufacturing vary so greatly among metropoli-tan areas, even after controlling for industry.
Education. As economist Enrico Moretti has shown, the presence of highly-educated workers makes other workers more productive; in 1992 bachelor’s degree-holders made up almost twice as large a percentage of Seattle’s workers as of El Paso’s, while the earnings of the average worker were about 20 percent higher in Seattle than in El Paso, controlling for that worker’s education.44 Thus, the sub-stantial difference across metropolitan areas in the percentage of workers who have at least bach-elor’s degrees can explain a substantial part of the difference in manufacturing wages even for less educated workers.
Differences among metropolitan areas in products and processes. Another reason that wages remain high after controlling for industry is that productivity and wages vary greatly within as well as between industries. A variety of studies have shown two- to three-fold differences in productivity between the most and least productive 10 percent of firms, even in narrowly defined industries.45
A large literature has found that the most productive firms are likely to be found in areas with higher population and business densities. Evidence suggests that part of this difference exists because firms in such areas produce different products using different processes than do their counterparts in less dense areas in the same industry. Specifically, manufacturers in areas with higher
Table 8. Metropolitan Areas with Lowest Average Annual Manufacturing Earnings, Among the 100 Largest Metropolitan Areas, 2010, Adjusted for Industry Composition
Dollars Below Expected Percent Below Expected
Rank Metropolitan Area Average Annual Earnings Average Annual Earnings
91 Lakeland-WinterHaven,FL $5,598 10.1% 92 Wichita,KS 5,780 8.3 93 CapeCoral-FortMyers,FL 6,171 12.9 94 OklahomaCity,OK 6,372 11.4 95 Ogden-Clearfield,UT 7,430 13.3 96 Jackson,MS 9,064 16.0 97 McAllen-Edinburg-Mission,TX 11,385 24.6 98 Rochester,NY 15,838 20.5 99 Augusta-RichmondCounty,GA-SC 17,733 24.4 100 Tucson,AZ 19,145 28.5
Source: Authors’ analysis of Moody’s Analytics data
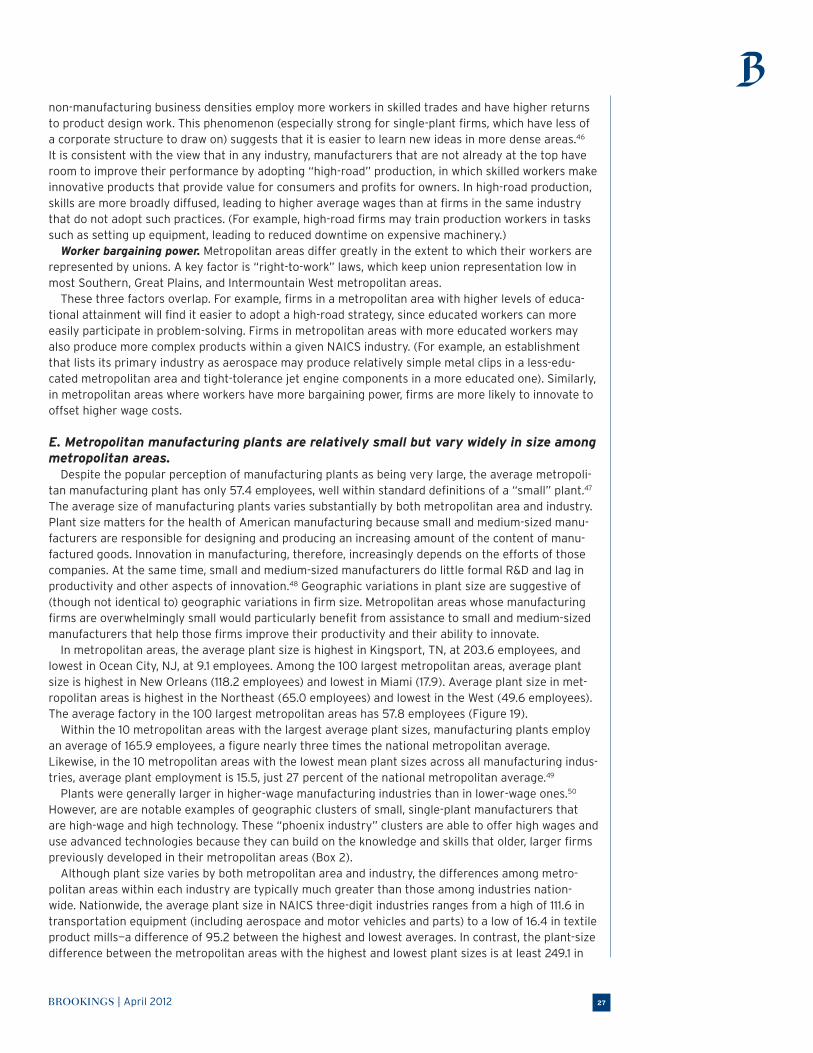
BROOKINGS | April 2012 27
non-manufacturing business densities employ more workers in skilled trades and have higher returns to product design work. This phenomenon (especially strong for single-plant firms, which have less of a corporate structure to draw on) suggests that it is easier to learn new ideas in more dense areas.46 It is consistent with the view that in any industry, manufacturers that are not already at the top have room to improve their performance by adopting “high-road” production, in which skilled workers make innovative products that provide value for consumers and profits for owners. In high-road production, skills are more broadly diffused, leading to higher average wages than at firms in the same industry that do not adopt such practices. (For example, high-road firms may train production workers in tasks such as setting up equipment, leading to reduced downtime on expensive machinery.)
Worker bargaining power. Metropolitan areas differ greatly in the extent to which their workers are represented by unions. A key factor is “right-to-work” laws, which keep union representation low in most Southern, Great Plains, and Intermountain West metropolitan areas.
These three factors overlap. For example, firms in a metropolitan area with higher levels of educa-tional attainment will find it easier to adopt a high-road strategy, since educated workers can more easily participate in problem-solving. Firms in metropolitan areas with more educated workers may also produce more complex products within a given NAICS industry. (For example, an establishment that lists its primary industry as aerospace may produce relatively simple metal clips in a less-edu-cated metropolitan area and tight-tolerance jet engine components in a more educated one). Similarly, in metropolitan areas where workers have more bargaining power, firms are more likely to innovate to offset higher wage costs.
E. Metropolitan manufacturing plants are relatively small but vary widely in size among metropolitan areas.
Despite the popular perception of manufacturing plants as being very large, the average metropoli-tan manufacturing plant has only 57.4 employees, well within standard definitions of a “small” plant.47 The average size of manufacturing plants varies substantially by both metropolitan area and industry. Plant size matters for the health of American manufacturing because small and medium-sized manu-facturers are responsible for designing and producing an increasing amount of the content of manu-factured goods. Innovation in manufacturing, therefore, increasingly depends on the efforts of those companies. At the same time, small and medium-sized manufacturers do little formal R&D and lag in productivity and other aspects of innovation.48 Geographic variations in plant size are suggestive of (though not identical to) geographic variations in firm size. Metropolitan areas whose manufacturing firms are overwhelmingly small would particularly benefit from assistance to small and medium-sized manufacturers that help those firms improve their productivity and their ability to innovate.
In metropolitan areas, the average plant size is highest in Kingsport, TN, at 203.6 employees, and lowest in Ocean City, NJ, at 9.1 employees. Among the 100 largest metropolitan areas, average plant size is highest in New Orleans (118.2 employees) and lowest in Miami (17.9). Average plant size in met-ropolitan areas is highest in the Northeast (65.0 employees) and lowest in the West (49.6 employees). The average factory in the 100 largest metropolitan areas has 57.8 employees (Figure 19).
Within the 10 metropolitan areas with the largest average plant sizes, manufacturing plants employ an average of 165.9 employees, a figure nearly three times the national metropolitan average. Likewise, in the 10 metropolitan areas with the lowest mean plant sizes across all manufacturing indus-tries, average plant employment is 15.5, just 27 percent of the national metropolitan average.49
Plants were generally larger in higher-wage manufacturing industries than in lower-wage ones.50 However, are are notable examples of geographic clusters of small, single-plant manufacturers that are high-wage and high technology. These “phoenix industry” clusters are able to offer high wages and use advanced technologies because they can build on the knowledge and skills that older, larger firms previously developed in their metropolitan areas (Box 2).
Although plant size varies by both metropolitan area and industry, the differences among metro-politan areas within each industry are typically much greater than those among industries nation-wide. Nationwide, the average plant size in NAICS three-digit industries ranges from a high of 111.6 in transportation equipment (including aerospace and motor vehicles and parts) to a low of 16.4 in textile product mills—a difference of 95.2 between the highest and lowest averages. In contrast, the plant-size difference between the metropolitan areas with the highest and lowest plant sizes is at least 249.1 in
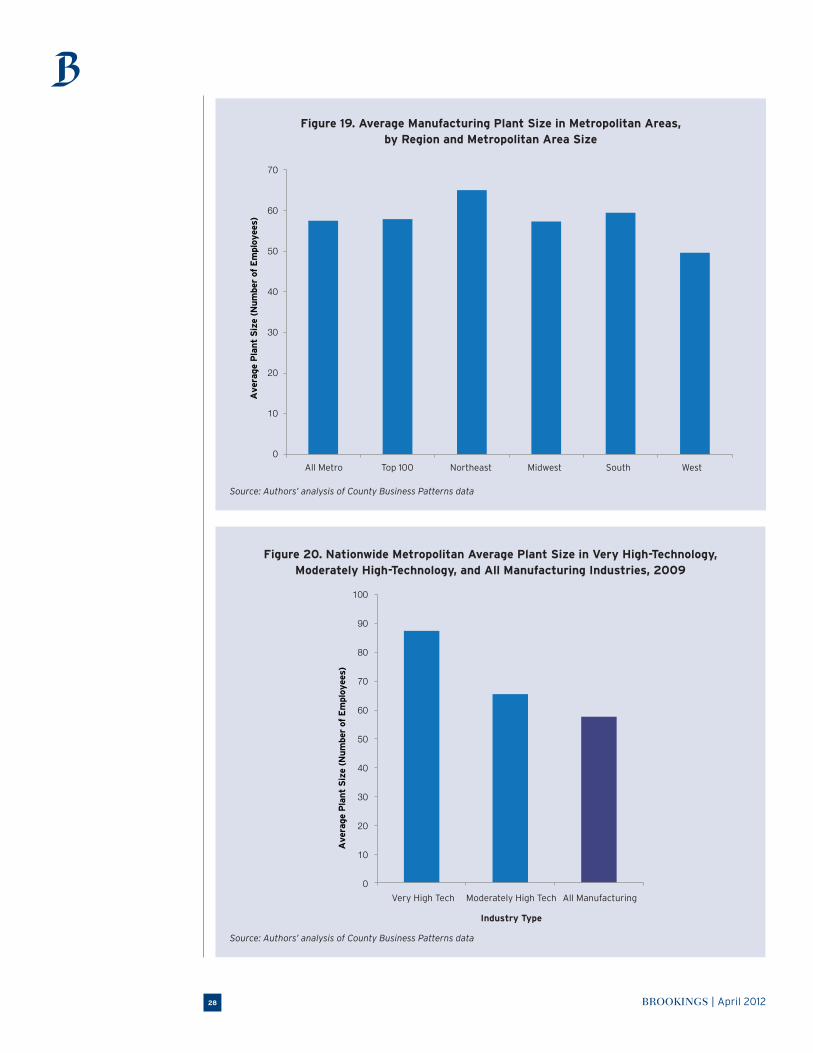
BROOKINGS | April 201228
Figure 19. Average Manufacturing Plant Size in Metropolitan Areas, by Region and Metropolitan Area Size
Source: Authors’ analysis of County Business Patterns data
Figure 20. Nationwide Metropolitan Average Plant Size in Very High-Technology, Moderately High-Technology, and All Manufacturing Industries, 2009
Source: Authors’ analysis of County Business Patterns data
70
60
50
40
30
20
10
0
Ave
rage
Pla
nt
Siz
e (N
um
ber
of E
mpl
oyee
s)
All Metro Top 100 Northeast Midwest South West
100
90
80
70
60
50
40
30
20
10
0
Ave
rage
Pla
nt
Siz
e (N
um
ber
of E
mpl
oyee
s)
Very High Tech Moderately High Tech
Industry Type
All Manufacturing
BROOKINGS | April 2012 29
every NAICS three-digit industry. In the furniture industry, average plant size ranges from 249.8 in Monroe, MI, to 0.7 in Palm Coast, FL. The gap between top and bottom average plant sizes is greatest in chemicals (including pharmaceuticals), where average plant size ranges from 1749.5 in Morgantown, WV, to 3.2 in Carson City, NV.51
F. The long-term shift of manufacturing jobs toward the South came to a halt in the first decade of the 21st century, while the Midwest had the fastest manufacturing job gains over the last two years. Between 1980 and 2000, the Northeast and Midwest both lost manufacturing jobs, while the South and West gained them.54 This trend represented a shift of manufacturing jobs toward regions where right-to-work laws are more common, and, in the case of the South, toward a lower-wage region where generous industrial recruitment subsidies have long been an important economic development policy tool. Yet in the last decade these dynamics have changed. Since 2000, the long-term shift of manufac-turing jobs away from the Northeast and Midwest was partially reversed, suggesting that recruitment of manufacturers on the basis of low labor costs and locational subsidies may no longer be an effec-tive regional policy for attracting manufacturing jobs, if it ever was. In the first decade of the century, when all regions of the country lost manufacturing jobs, but the Midwest and South both lost those jobs at about the national rate of 34 percent (Figure 21).
During the last two years the Midwest was the nation’s largest gainer of manufacturing jobs. Between the first quarter of 2010 and the last quarter of 2011, the Midwest gained those jobs much more rapidly than the nation as a whole (with an increase of 5.2 percent, compared with a gain of about 2.7 percent nationwide). Nearly half of all manufacturing jobs gained during this period were gained in the Midwest. At the same time, the South saw manufacturing job growth of 2.2 percent.
Traditional Midwestern manufacturing centers figured strongly in recent manufacturing job gains. Two large Midwestern metropolitan areas, Youngstown and Detroit, had double-digit percentage growth in manufacturing jobs during this period. The number of manufacturing jobs in Youngstown rose by nearly 11.7 percent between the first quarter of 2010 and the fourth quarter of 2011, while the corresponding gain for Detroit was nearly 12.1 percent. An even larger number of Midwestern metro-politan areas accounted for disproportionate shares of the nation’s overall manufacturing job growth during this time. In addition to Detroit and Youngstown, Cincinnati, Elkhart (IN), Grand Rapids, Holland (MI), Kansas City, Milwaukee, Peoria (IL), St. Louis, and Toledo each accounted for more than 1 per-cent of national manufacturing job growth but accounted for a smaller percentage of manufacturing
Box 2. Phoenix IndustriesOne factor promoting the growth of small plants in metropolitan areas is the phenomenon of what Susan Christopherson has dubbed “phoenix industries.”52 These are small, relatively new, high-wage, high-technology firms that have risen “from the ashes” of older, formerly large employers. These industries “benefit from the pre-existing personal networks, technical skills, and market knowledge that have developed over a long time in their metropolitan areas, the products of investments in R&D and the workforce made during the heyday of American manufacturing, from the 1950s to the 1970s.” Even when large firms such as General Electric and Kodak closed large swaths of their manufacturing operations in metropolitan areas including Schenectady and Rochester, not all the fruits of these investments were lost. Many engineers who used to work for large firms, research universities and sometimes even the R&D operations of the large firms remained behind and went to work for or cre-ated dozens of the new “phoenix” establishments. Christopherson notes:
Despite their ties to the past, phoenix industries look very different from the old manufacturing industries that they have gradually replaced. Instead of one dominant employer, the sector is made up of many small and medium-size companies. . . . They are frequently described as “enabling industries” because they research, develop, and produce technologies that are used in many different industries, instead of just one.53
An example is the photonics industry in Rochester, New York. This industry is built on the basis of investments that Kodak, Xerox, and Bausch and Lomb made in optics and engineering programs at local universities, as well as in the training of thou-sands of workers in areas such as quality control and specialized machining. This skilled labor pool and knowledge base helped spawn more than 100 photonics firms Rochester metropolitan area since the 1980s. Although the total employment of these firms is far less than that of the giants they replaced. The phoenix industries represent a platform for future growth.
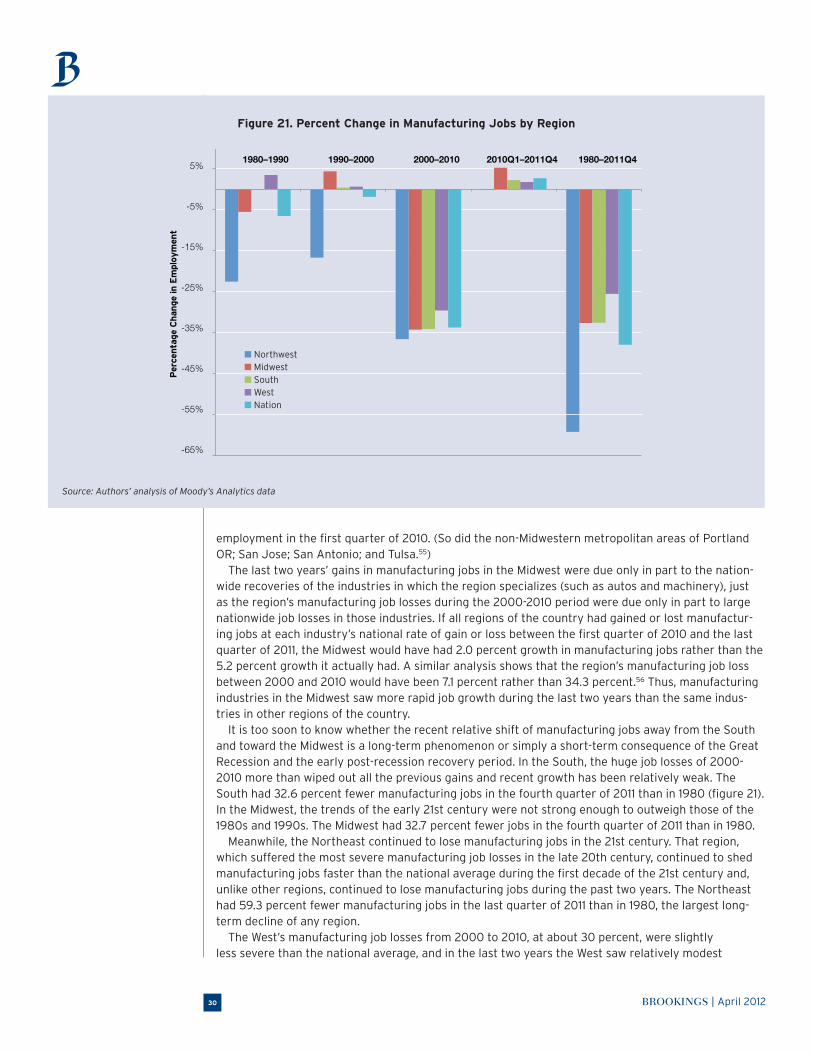
BROOKINGS | April 201230
employment in the first quarter of 2010. (So did the non-Midwestern metropolitan areas of Portland OR; San Jose; San Antonio; and Tulsa.55)
The last two years’ gains in manufacturing jobs in the Midwest were due only in part to the nation-wide recoveries of the industries in which the region specializes (such as autos and machinery), just as the region’s manufacturing job losses during the 2000-2010 period were due only in part to large nationwide job losses in those industries. If all regions of the country had gained or lost manufactur-ing jobs at each industry’s national rate of gain or loss between the first quarter of 2010 and the last quarter of 2011, the Midwest would have had 2.0 percent growth in manufacturing jobs rather than the 5.2 percent growth it actually had. A similar analysis shows that the region’s manufacturing job loss between 2000 and 2010 would have been 7.1 percent rather than 34.3 percent.56 Thus, manufacturing industries in the Midwest saw more rapid job growth during the last two years than the same indus-tries in other regions of the country.
It is too soon to know whether the recent relative shift of manufacturing jobs away from the South and toward the Midwest is a long-term phenomenon or simply a short-term consequence of the Great Recession and the early post-recession recovery period. In the South, the huge job losses of 2000-2010 more than wiped out all the previous gains and recent growth has been relatively weak. The South had 32.6 percent fewer manufacturing jobs in the fourth quarter of 2011 than in 1980 (figure 21). In the Midwest, the trends of the early 21st century were not strong enough to outweigh those of the 1980s and 1990s. The Midwest had 32.7 percent fewer jobs in the fourth quarter of 2011 than in 1980.
Meanwhile, the Northeast continued to lose manufacturing jobs in the 21st century. That region, which suffered the most severe manufacturing job losses in the late 20th century, continued to shed manufacturing jobs faster than the national average during the first decade of the 21st century and, unlike other regions, continued to lose manufacturing jobs during the past two years. The Northeast had 59.3 percent fewer manufacturing jobs in the last quarter of 2011 than in 1980, the largest long-term decline of any region.
The West’s manufacturing job losses from 2000 to 2010, at about 30 percent, were slightly less severe than the national average, and in the last two years the West saw relatively modest
Figure 21. Percent Change in Manufacturing Jobs by Region
Source: Authors’ analysis of Moody’s Analytics data
5%
-5%
-15%
-25%
-35%
-45%
-55%
-65%
Per
centa
ge C
han
ge in
Em
ploy
men
t
1980–1990 1990–2000 2000–2010 2010Q1–2011Q4 1980–2011Q4
■ Northwest■ Midwest■ South■ West■ Nation
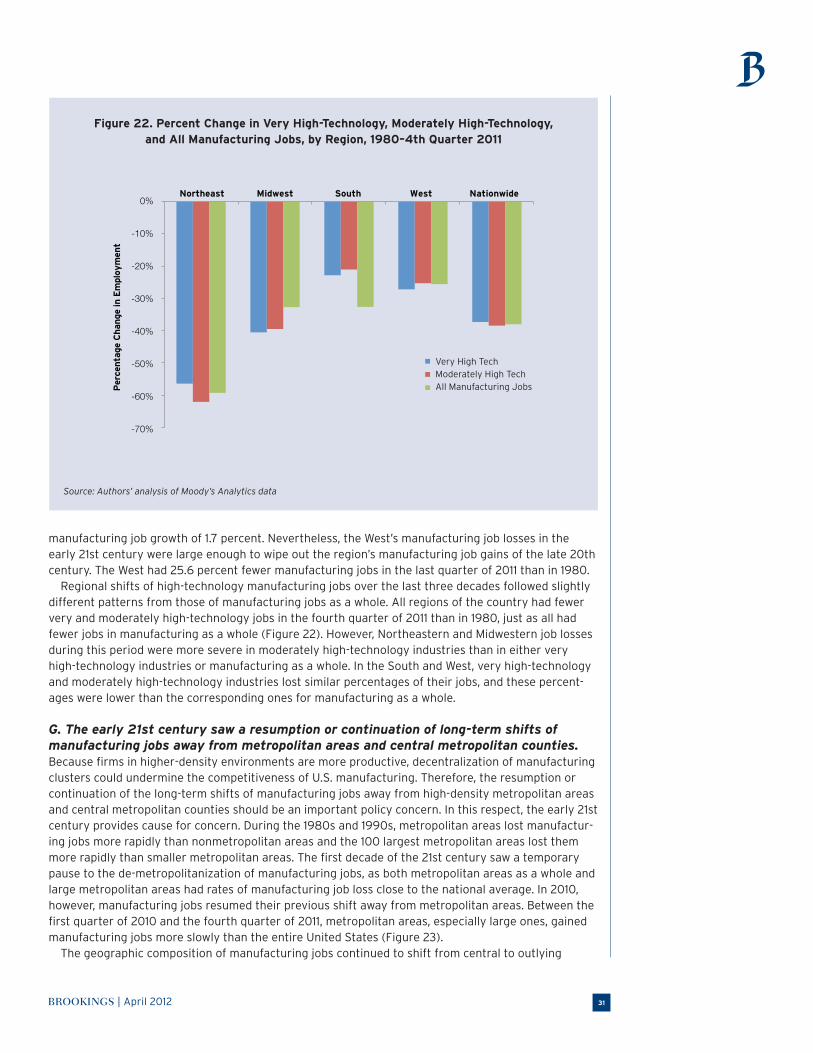
BROOKINGS | April 2012 31
manufacturing job growth of 1.7 percent. Nevertheless, the West’s manufacturing job losses in the early 21st century were large enough to wipe out the region’s manufacturing job gains of the late 20th century. The West had 25.6 percent fewer manufacturing jobs in the last quarter of 2011 than in 1980.
Regional shifts of high-technology manufacturing jobs over the last three decades followed slightly different patterns from those of manufacturing jobs as a whole. All regions of the country had fewer very and moderately high-technology jobs in the fourth quarter of 2011 than in 1980, just as all had fewer jobs in manufacturing as a whole (Figure 22). However, Northeastern and Midwestern job losses during this period were more severe in moderately high-technology industries than in either very high-technology industries or manufacturing as a whole. In the South and West, very high-technology and moderately high-technology industries lost similar percentages of their jobs, and these percent-ages were lower than the corresponding ones for manufacturing as a whole.
G. The early 21st century saw a resumption or continuation of long-term shifts of manufacturing jobs away from metropolitan areas and central metropolitan counties. Because firms in higher-density environments are more productive, decentralization of manufacturing clusters could undermine the competitiveness of U.S. manufacturing. Therefore, the resumption or continuation of the long-term shifts of manufacturing jobs away from high-density metropolitan areas and central metropolitan counties should be an important policy concern. In this respect, the early 21st century provides cause for concern. During the 1980s and 1990s, metropolitan areas lost manufactur-ing jobs more rapidly than nonmetropolitan areas and the 100 largest metropolitan areas lost them more rapidly than smaller metropolitan areas. The first decade of the 21st century saw a temporary pause to the de-metropolitanization of manufacturing jobs, as both metropolitan areas as a whole and large metropolitan areas had rates of manufacturing job loss close to the national average. In 2010, however, manufacturing jobs resumed their previous shift away from metropolitan areas. Between the first quarter of 2010 and the fourth quarter of 2011, metropolitan areas, especially large ones, gained manufacturing jobs more slowly than the entire United States (Figure 23).
The geographic composition of manufacturing jobs continued to shift from central to outlying
Figure 22. Percent Change in Very High-Technology, Moderately High-Technology, and All Manufacturing Jobs, by Region, 1980–4th Quarter 2011
Source: Authors’ analysis of Moody’s Analytics data
0%
-10%
-20%
-30%
-40%
-50%
-60%
-70%
Per
centa
ge C
han
ge in
Em
ploy
men
t
Northeast Midwest South West Nationwide
Very High TechModerately High TechAll Manufacturing Jobs
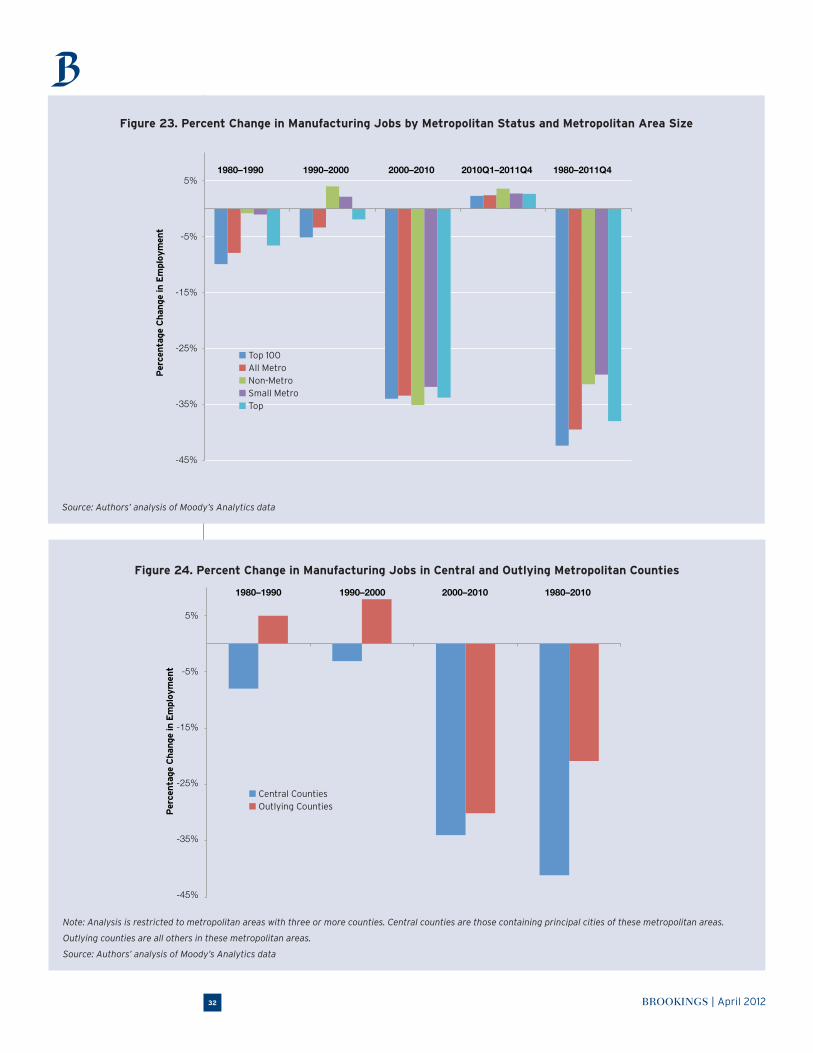
BROOKINGS | April 201232
Figure 23. Percent Change in Manufacturing Jobs by Metropolitan Status and Metropolitan Area Size
Source: Authors’ analysis of Moody’s Analytics data
Figure 24. Percent Change in Manufacturing Jobs in Central and Outlying Metropolitan Counties
Note: Analysis is restricted to metropolitan areas with three or more counties. Central counties are those containing principal cities of these metropolitan areas.
Outlying counties are all others in these metropolitan areas.
Source: Authors’ analysis of Moody’s Analytics data
1980–1990 1990–2000 2000–2010 2010Q1–2011Q4 1980–2011Q45%
-5%
-15%
-25%
-35%
-45%
Per
centa
ge C
han
ge in
Em
ploy
men
t
■ Top 100■ All Metro■ Non-Metro■ Small Metro■ Top
5%
-5%
-15%
-25%
-35%
-45%
Per
centa
ge C
han
ge in
Em
ploy
men
t
■ Central Counties■ Outlying Counties
1980–1990 1990–2000 2000–2010 1980–2010
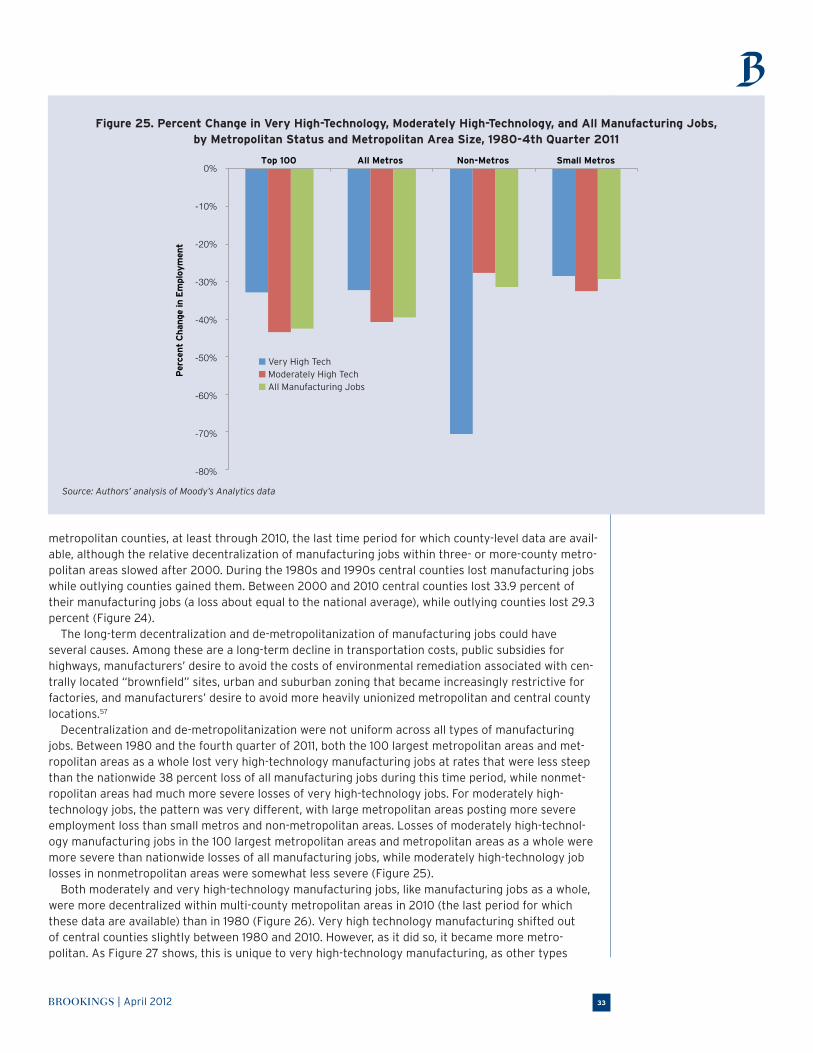
BROOKINGS | April 2012 33
metropolitan counties, at least through 2010, the last time period for which county-level data are avail-able, although the relative decentralization of manufacturing jobs within three- or more-county metro-politan areas slowed after 2000. During the 1980s and 1990s central counties lost manufacturing jobs while outlying counties gained them. Between 2000 and 2010 central counties lost 33.9 percent of their manufacturing jobs (a loss about equal to the national average), while outlying counties lost 29.3 percent (Figure 24).
The long-term decentralization and de-metropolitanization of manufacturing jobs could have several causes. Among these are a long-term decline in transportation costs, public subsidies for highways, manufacturers’ desire to avoid the costs of environmental remediation associated with cen-trally located “brownfield” sites, urban and suburban zoning that became increasingly restrictive for factories, and manufacturers’ desire to avoid more heavily unionized metropolitan and central county locations.57
Decentralization and de-metropolitanization were not uniform across all types of manufacturing jobs. Between 1980 and the fourth quarter of 2011, both the 100 largest metropolitan areas and met-ropolitan areas as a whole lost very high-technology manufacturing jobs at rates that were less steep than the nationwide 38 percent loss of all manufacturing jobs during this time period, while nonmet-ropolitan areas had much more severe losses of very high-technology jobs. For moderately high-technology jobs, the pattern was very different, with large metropolitan areas posting more severe employment loss than small metros and non-metropolitan areas. Losses of moderately high-technol-ogy manufacturing jobs in the 100 largest metropolitan areas and metropolitan areas as a whole were more severe than nationwide losses of all manufacturing jobs, while moderately high-technology job losses in nonmetropolitan areas were somewhat less severe (Figure 25).
Both moderately and very high-technology manufacturing jobs, like manufacturing jobs as a whole, were more decentralized within multi-county metropolitan areas in 2010 (the last period for which these data are available) than in 1980 (Figure 26). Very high technology manufacturing shifted out of central counties slightly between 1980 and 2010. However, as it did so, it became more metro-politan. As Figure 27 shows, this is unique to very high-technology manufacturing, as other types
Figure 25. Percent Change in Very High-Technology, Moderately High-Technology, and All Manufacturing Jobs, by Metropolitan Status and Metropolitan Area Size, 1980-4th Quarter 2011
Source: Authors’ analysis of Moody’s Analytics data
0%
-10%
-20%
-30%
-40%
-50%
-60%
-70%
-80%
Per
cent
Chan
ge in
Em
ploy
men
t
■ Very High Tech■ Moderately High Tech■ All Manufacturing Jobs
Top 100 All Metros Non-Metros Small Metros
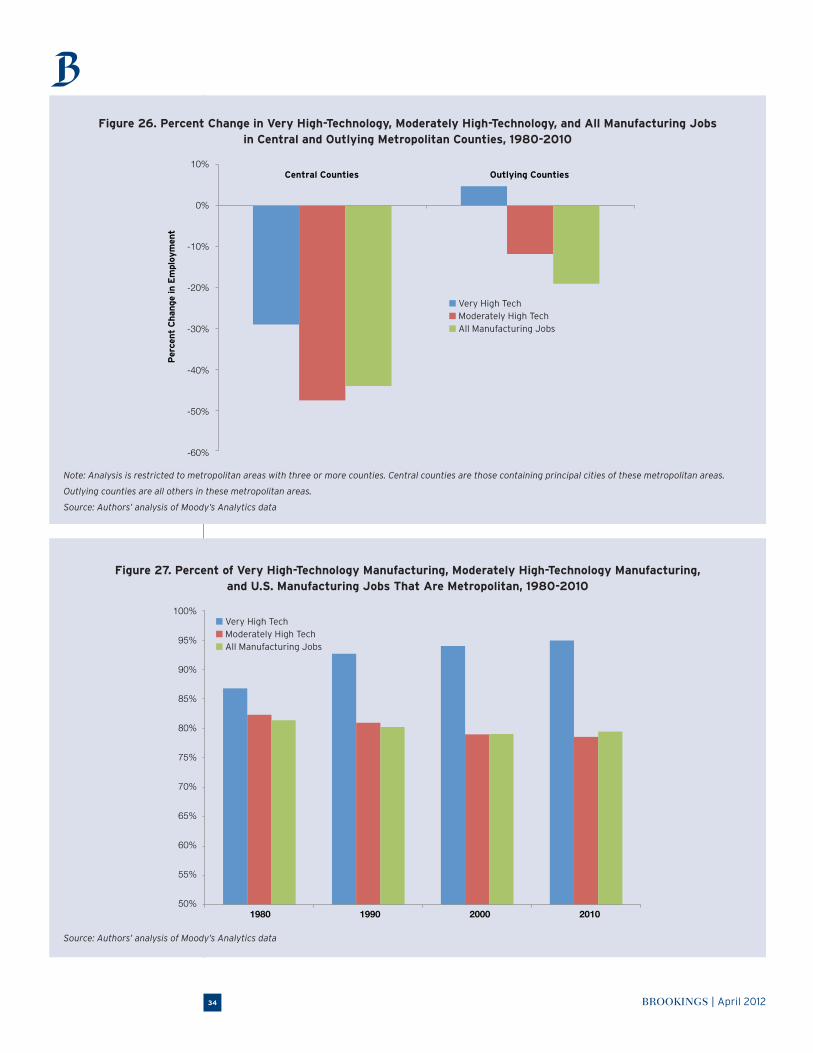
BROOKINGS | April 201234
Figure 26. Percent Change in Very High-Technology, Moderately High-Technology, and All Manufacturing Jobs in Central and Outlying Metropolitan Counties, 1980-2010
Note: Analysis is restricted to metropolitan areas with three or more counties. Central counties are those containing principal cities of these metropolitan areas.
Outlying counties are all others in these metropolitan areas.
Source: Authors’ analysis of Moody’s Analytics data
Figure 27. Percent of Very High-Technology Manufacturing, Moderately High-Technology Manufacturing, and U.S. Manufacturing Jobs That Are Metropolitan, 1980-2010
Source: Authors’ analysis of Moody’s Analytics data
10%
0%
-10%
-20%
-30%
-40%
-50%
-60%
Per
cent
Chan
ge in
Em
ploy
men
t
■ Very High Tech■ Moderately High Tech■ All Manufacturing Jobs
Central Counties Outlying Counties
100%
95%
90%
85%
80%
75%
70%
65%
60%
55%
50%
■ Very High Tech■ Moderately High Tech■ All Manufacturing Jobs
1980 1990 2000 2010
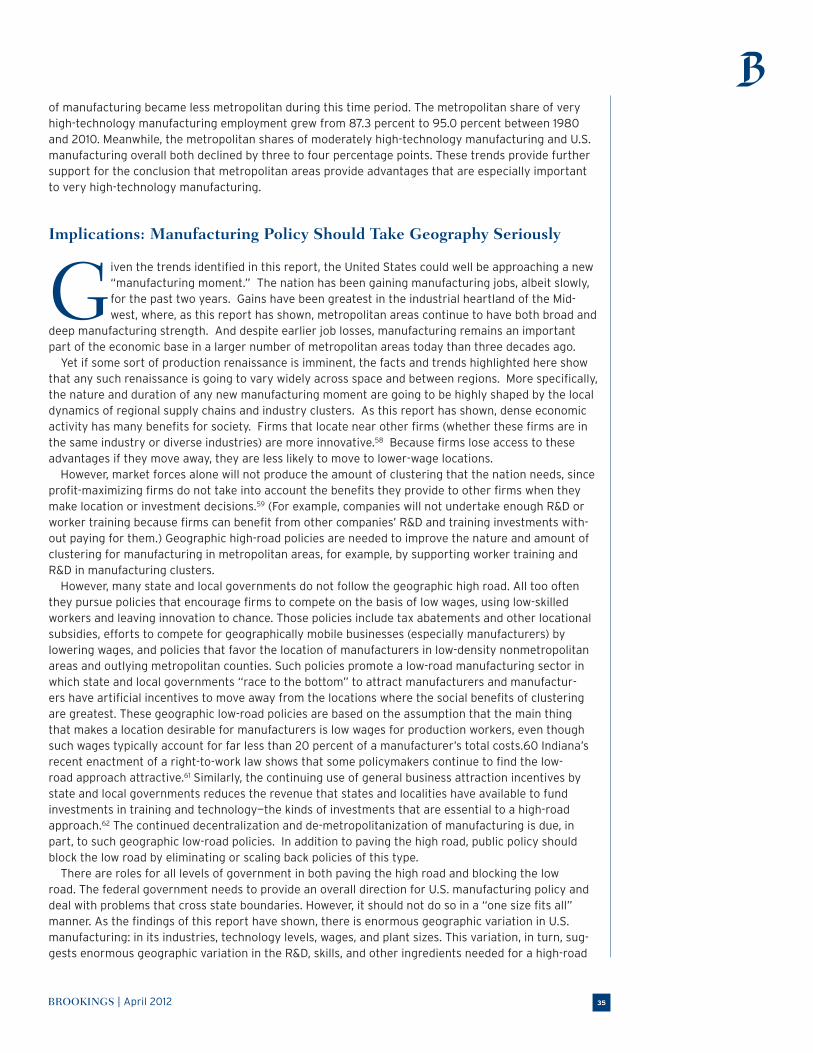
BROOKINGS | April 2012 35
of manufacturing became less metropolitan during this time period. The metropolitan share of very high-technology manufacturing employment grew from 87.3 percent to 95.0 percent between 1980 and 2010. Meanwhile, the metropolitan shares of moderately high-technology manufacturing and U.S. manufacturing overall both declined by three to four percentage points. These trends provide further support for the conclusion that metropolitan areas provide advantages that are especially important to very high-technology manufacturing.
Implications: Manufacturing Policy Should Take Geography Seriously
G iven the trends identified in this report, the United States could well be approaching a new “manufacturing moment.” The nation has been gaining manufacturing jobs, albeit slowly, for the past two years. Gains have been greatest in the industrial heartland of the Mid-west, where, as this report has shown, metropolitan areas continue to have both broad and
deep manufacturing strength. And despite earlier job losses, manufacturing remains an important part of the economic base in a larger number of metropolitan areas today than three decades ago.
Yet if some sort of production renaissance is imminent, the facts and trends highlighted here show that any such renaissance is going to vary widely across space and between regions. More specifically, the nature and duration of any new manufacturing moment are going to be highly shaped by the local dynamics of regional supply chains and industry clusters. As this report has shown, dense economic activity has many benefits for society. Firms that locate near other firms (whether these firms are in the same industry or diverse industries) are more innovative.58 Because firms lose access to these advantages if they move away, they are less likely to move to lower-wage locations.
However, market forces alone will not produce the amount of clustering that the nation needs, since profit-maximizing firms do not take into account the benefits they provide to other firms when they make location or investment decisions.59 (For example, companies will not undertake enough R&D or worker training because firms can benefit from other companies’ R&D and training investments with-out paying for them.) Geographic high-road policies are needed to improve the nature and amount of clustering for manufacturing in metropolitan areas, for example, by supporting worker training and R&D in manufacturing clusters.
However, many state and local governments do not follow the geographic high road. All too often they pursue policies that encourage firms to compete on the basis of low wages, using low-skilled workers and leaving innovation to chance. Those policies include tax abatements and other locational subsidies, efforts to compete for geographically mobile businesses (especially manufacturers) by lowering wages, and policies that favor the location of manufacturers in low-density nonmetropolitan areas and outlying metropolitan counties. Such policies promote a low-road manufacturing sector in which state and local governments “race to the bottom” to attract manufacturers and manufactur-ers have artificial incentives to move away from the locations where the social benefits of clustering are greatest. These geographic low-road policies are based on the assumption that the main thing that makes a location desirable for manufacturers is low wages for production workers, even though such wages typically account for far less than 20 percent of a manufacturer’s total costs.60 Indiana’s recent enactment of a right-to-work law shows that some policymakers continue to find the low-road approach attractive.61 Similarly, the continuing use of general business attraction incentives by state and local governments reduces the revenue that states and localities have available to fund investments in training and technology—the kinds of investments that are essential to a high-road approach.62 The continued decentralization and de-metropolitanization of manufacturing is due, in part, to such geographic low-road policies. In addition to paving the high road, public policy should block the low road by eliminating or scaling back policies of this type.
There are roles for all levels of government in both paving the high road and blocking the low road. The federal government needs to provide an overall direction for U.S. manufacturing policy and deal with problems that cross state boundaries. However, it should not do so in a “one size fits all” manner. As the findings of this report have shown, there is enormous geographic variation in U.S. manufacturing: in its industries, technology levels, wages, and plant sizes. This variation, in turn, sug-gests enormous geographic variation in the R&D, skills, and other ingredients needed for a high-road
BROOKINGS | April 201236
manufacturing sector. The federal role should therefore be to create platforms that are sensitive to this variation. Building on those platforms, state and local governments and non-governmental actors (such as regional economic development organizations, unions, and educational institutions) can develop high-road manufacturing policies that respond to the specific needs of their manufacturing sectors.
Similarly, blocking the low road is a joint responsibility of federal, state, and local governments. Through their competition for geographically mobile businesses, such as manufacturers, state and local governments are responsible for most geographic low-road policies. The federal government has little or no direct influence over these policies. However, the federal government does play an impor-tant role in some policy areas, such as transportation, that affect manufacturers’ location decisions. It also has the opportunity to block the low road by conditioning its manufacturing assistance on states’ agreement not to use subsidies to poach manufacturing jobs from other states.
The recommendations that follow, therefore, are divided into a group that pave the high road and a group that block the low road. Each group is, in turn, divided into recommendations that create a federal platform and those that suggest how state, local, and metropolitan policymakers can build on that platform.
Pave the Geographic High RoadProductive assets that are shared by manufacturers in a geographic area, such as a skilled workforce, a technology base, and institutions that promote the creation and diffusion of innovation, are key to the success of manufacturing clusters. High-road policies should assist manufacturers by helping to develop these shared assets through R&D, technical assistance, and training programs. The Federal PlatformThe federal platform for paving the geographic high road includes policies to support the kinds of R&D that are most relevant to small and medium-sized manufacturers, help companies solve supply-chain coordination problems that extend across state lines, and help self-organized manufacturing clusters cooperate to solve common problems. State and local governments can also perform some of these activities but without a strong federal platform their efforts will be insufficient.
Build a National Network for Manufacturing Innovation. The federal government funds basic research and some applied research that is important to large and very high-technology manufactur-ers. Those manufacturers perform virtually all the formal R&D in U.S. manufacturing. However, neither the federal government nor any other level of government devotes much attention to the techni-cal engineering challenges that are most critical to small and medium-sized manufacturers’ ability to innovate. Yet small and medium-sized companies, which do very little formal R&D, have become increasingly important to innovation in manufacturing as a whole, which in turn is the principal source of innovation in the U.S. economy.63 Therefore, the nation can no longer afford to neglect the kinds of R&D that are most important for small and medium-sized manufacturers.
President Obama recently proposed that the federal government establish a National Network for Manufacturing Innovation, consisting of up to 15 institutes that would perform exactly these kinds of applied research. The institutes would be distributed throughout all regions of the country and would serve as regional hubs for advanced manufacturing. Creation of the entire network requires congres-sional approval, but one institute will be established using existing funding.64
The network is based on the idea of advanced manufacturing centers or laboratories, which two of the authors of this report proposed in previous Brookings papers.65 Because the nation as a whole benefits from increased innovation by small and medium-sized manufacturers, it is critical for the federal government to establish the network as a platform for that innovation. In recognition of the geographically diverse needs of manufacturers, Congress should fund the entire proposed network of 15 centers and require that the centers be located in different parts of the country. Selection criteria for the centers should include the relationship of each center’s proposed technological focus to the innovation needs of manufacturers in its region. Since there are likely to be important technological needs that the federal network is unable to meet, state and local governments should create similar centers to promote innovation by manufacturers in their jurisdictions.66
Adapt assistance programs for small manufacturers to take supply-chain structure seri-ously. Instead of vertically integrated behemoths, most U.S. manufacturing is now characterized by
BROOKINGS | April 2012 37
lead firms that depend on a network of suppliers to provide components and help with innovation. These “shared supply chains” have several potential benefits. Suppliers can specialize in particular processes, providing efficiency and innovation to their customers. Also, when one customer is having trouble, another may be experiencing a boom, making specialization less risky.
However, there are problems if these shared supply chains are not governed well. Customer firms in the United States have often found incentives to squeeze these suppliers, pressing them for such a low price that they lack money to reinvest, since any improvement a supplier makes will be shared with competitors. That is, if one firm works with its supplier to improve quality or purchase new equipment, the better process could benefit the supplier’s other customers. Each firm would prefer someone else make the co-investment with the supplier. Therefore, investment and quality improvement are under-supplied. A significant problem is simply coordinating, since one firm’s investment may be worthwhile only if a large number of firms make complementary investments.
One example is the urgent need to increase the energy efficiency of cars and light trucks. An impor-tant way of achieving this goal is to reduce vehicle weight—a 10 percent reduction in a vehicle’s weight can lead to a 6-8 percent reduction in fuel use.67 Fuel-economy standards are a potential boon for small automotive toolmakers because U.S. toolmakers can make tools to form light-weight materials into components and are far ahead of their Chinese competitors (who have grabbed significant market share in this industry which is high-wage and key-for-implementing innovation). However, there are significant coordination problems. Busy designers at automakers want to meet higher fuel-economy standards simply by specifying that a component be made out of new steels that are stronger (and hence can be thinner and lighter). The problem is that to gain the advantage of the high-strength steels, designs and processes must be changed. For example, “dual-phase” steel becomes strong only if it is stretched, so a lighter-weight part will fail unless ridges or embosses are included in the design, to ensure that all areas of the part are stretched as it is stamped. Some kinds of steels require pro-cessing that few if any U.S. companies know how to do.68
Supply-chain coordination problems are not only problems of coordination between companies; they are problems of coordination between locations as well. Although supplier and customer firms often benefit from being located in close proximity to one another, they do not always need to be in the same metropolitan area or state to reap these benefits. Auto parts suppliers, for example, may be located as much as a day’s drive from the auto assembly factories to which they sell.69 Because supplier-customer relationships frequently cross state and metropolitan boundaries, the federal gov-ernment is best situated to help companies solve supply-chain coordination problems and, more gen-erally, to help small and medium-sized suppliers improve their performance. However, the Commerce Department’s Manufacturing Extension Partnership program (MEP), the principal federal program that provides technical assistance to small and medium-sized manufacturers, typically works with indi-vidual companies, not groups of firms in a supply chain. In addition, MEP works through state-based centers that are not able to coordinate assistance to companies in multiple states. Finally, neither MEP nor any other federal agency collects information about the geography of supply-chain relationships, so the federal government lacks the basic knowledge of which companies would need supply-chain assistance in which locations.
To remedy these defects, MEP centers should step up their development of common tools to sup-port the delivery of services by centers located in different states. MEP centers should also have access to data about the structure and geography of supply chains, which would enable them to understand where supply-chain problems may exist and what kinds of interventions would be most productive. Either the federal MEP office or the institutes of the National Network for Manufacturing Innovation would be well situated to coordinate both the delivery of services to and the collection of data about supply chains.
In addition, for supply-chain problems that are not amenable to the kinds of technical assistance provided by MEP, the federal government should award competitive multi-firm grants directly to groups of manufacturers. Such grants could, for example, be made available to an assembler and its suppliers even if the suppliers were not located in the same state or metropolitan area as any of the assembler’s plants. Their award should be conditioned on showing significant spillover benefits to workers and communities.
BROOKINGS | April 201238
Stimulate regional cooperation among manufacturers and related institutions with competitive grants to support self-organized cluster programs. This report has shown that geographic cluster-ing is important in manufacturing. Specific manufacturing industries and groups of interconnected industries are more likely to be located in some metropolitan areas than in others. However, the firms in a cluster face common problems, such as worker training, that they cannot solve individually. Government grants could help those firms come together, along with supporting institutions such as community colleges, universities, industry associations, and unions, to identify and solve those prob-lems.70 Those grants should be offered on a competitive basis to self-organized groups of firms and supporting institutions.
Providing support to groups of firms and related organizations is necessary because market failures often prevent firms from solving problems individually. This often manifests in underinvestment in shared assets, such as worker training and R&D, because firms that invest in these activities cannot prevent others from benefiting from them without paying for them. In addition, small and medium-sized manufacturers may be able to reduce costs by sharing expensive equipment that each needs only occasionally.71 Finally, solving problems on a multi-firm basis means that solutions are more likely to be of broad, long-term benefit to firms and workers throughout an industry or in multiple industries.
The Obama administration has used support for regional industry clusters as an operating system to link and align multiple federal agencies and programs in support of regional prosperity.72 The admin-istration’s approach has been to pool funds from multiple agencies or programs to award competi-tive grants to self-organized regional industry cluster groups, which would use the grants to fund cluster activities in support of critical national goals. Examples include the Economic Development Administration’s i6 Challenge to support entrepreneurship and technology commercialization in regional innovation ecosystems; the Small Business Administration’s Regional Innovation Clusters program, which supports small business growth through training, technology transfer, and mentoring services in regional clusters; the Department of Energy’s Energy Efficient Building Systems Regional Innovation Cluster, which supports a regional research center that develops and commercializes new-building energy efficiency technologies; and the multi-agency Rural Jobs and Innovation Accelerator Challenge, which supports industry cluster groups that will spur job creation and economic growth in rural areas.73 However, these programs are very limited in scale and do not focus on manufacturing. Similarly, in the area of workforce development, the Department of Labor’s Workforce Innovation Fund provides a small amount of competitive grant funding that can be used for (but is not restricted to) cluster-based activities. Yet the Workforce Investment Act, which provides the overall framework for federally funded workforce development efforts, does not include support for cluster-based train-ing efforts as part of that framework. Cluster-based economic development efforts have been very popular at the state level over the last two decades but have suffered from a lack of continuity across gubernatorial administrations and, in some cases, a lack of understanding of the purpose of public support for cluster-based efforts.
It is time for both federal and state economic and workforce development programs to embrace the cluster model more fully. Grant programs should be operated on a larger scale, opened to a greater number of regional clusters, and provide support for ongoing problem-solving activities as well as problem identification and planning. The cluster approach should be applied to all policy areas where local market failures make collective action by firms the best way to solve common problems. Although the logic of clustering and cluster-based policies is not unique to manufacturing, all federal and state policies to strengthen manufacturing should include cluster grants as an important element.
The State, Local, and Metropolitan RoleThe federal government does not have the knowledge or capacity to develop and implement strategies that will pave the high road for manufacturing in particular states, localities, and metropolitan areas. Only state and local governments and metropolitan-level economic development institutions, acting in cooperation with manufacturers and other manufacturing-cluster participants in their regions, can do that. To accomplish this, they need first to understand their regional manufacturing bases and then use that understanding to formulate and implement strategies.
Understand the regional manufacturing base. The first step in developing such strategies is to understand the regional manufacturing base; its industries and the differences among firms within
BROOKINGS | April 2012 39
industries; its innovation, technology, skill, financing, and other needs; its relationship to the rest of the regional economy and to manufacturing in other regions; and its competitive strengths and weak-nesses in relation to manufacturing in other regions. In showing how manufacturing varies geographi-cally, this report provides a foundation for that understanding. However, there is much more that regional policymakers need to know to understand their manufacturing bases. They can gain that knowledge from analysis of more detailed quantitative data at the state, metropolitan, and local levels and from discussions with manufacturers and other manufacturing-cluster participants.
Formulate regionally specific strategies. Regional policymakers should develop high-road manu-facturing strategies that build on their understanding of the regional manufacturing base. Different kinds of regions need different kinds of strategies. For example, as this report has shown, average plant size varies widely among metropolitan areas, suggesting that those areas have different mixes of large and small firms. Because large and small firms have different innovation needs, high-road regional manufacturing strategies need to stake these differences into account.
If several large manufacturers are in the same geographic area as their smaller suppliers, then regionally based programs should involve these larger firms in designing programs that will ben-efit their shared supply base. An example of such a program was the Wisconsin Manufacturing Development Consortium, in which a Wisconsin technical assistance program worked jointly with firms such as John Deere and Caterpillar to design training in lead-time reduction which was then offered to small suppliers. The combination of publicly-funded experts and company personnel helped ensure that the training was generally applicable and relevant; the strong recommendation of customers kept small suppliers (who often focus on the urgent rather than the important task of upgrading) focused on the program.74
Metropolitan areas in which there are many small and medium-sized manufacturers but no large ones in the same supply chain need policies to improve the performance of their small and medium-sized manufacturers. Those manufacturers often lag in adopting best practices in work organization, including waste-reducing lean production techniques, and often have difficulty in designing new products, finding new markets (including export markets) for their existing products, and distributing their products. They also do little or no R&D and receive little benefit from the kinds of R&D performed at research universities. Their primary need is for assistance with incremental product and process innovation rather than with radical product innovation.75
Metropolitan areas in which most manufacturing occurs in large firms have very different needs. Their prosperity depends on the continued ability of large manufacturers to innovate and on that innovation leading to the creation of high-wage manufacturing jobs in the metropolitan area. Radical product innovation as well as incremental product and process innovation matters for large manufac-turers.76 Large manufacturers increasingly depend on partnerships with universities or other research organizations to carry out the R&D that leads to innovation. These partnerships, however, do not always run smoothly because the goals of companies and universities in pursuing R&D partnerships are not identical. In addition, because the benefits of R&D inevitably spill over beyond the firms and universities that perform the R&D, too little R&D will be performed. To overcome these problems, state governments should provide matching funding to industry-university R&D partnerships.77 In general, state governments should condition R&D and other support on the creation of high-wage jobs in their states, just as some federal R&D programs require job creation in the United States as a condition of funding.78
Implement regionally specific strategies. Although regional high-road manufacturing strategies have been unfashionable in the United States for several decades, some state, local, and metropolitan leaders, recognizing manufacturing’s continued importance for their regional economies, have begun to craft such strategies. Massachusetts Governor Deval Patrick recently launched the Massachusetts Advanced Manufacturing Collaborative to strengthen the state’s manufacturing base. Because Massachusetts manufacturing relies heavily on small and medium-sized firms and advanced manu-facturing capabilities, the Collaborative will focus on those kinds of manufacturing. Its members will include representatives of manufacturers, industry associations, academic institutions, and govern-ment agencies. Initially it will focus on promoting Massachusetts manufacturing (to manufacturers, students, and the general public), improving education and training for manufacturing, providing technical assistance to small and medium-sized manufacturers, reducing the cost of doing business in
BROOKINGS | April 201240
the state, and improving small and medium-sized manufacturers’ access to financing.79 Northeast Ohio provides another example. There, a coalition of more than 80 business, government,
higher education, research, and foundation leaders recently developed a “regional business plan” for a 16-county region that includes the Cleveland, Akron, and Youngstown metropolitan areas and surrounding small metropolitan and nonmetropolitan counties. The plan, based on an assessment of the region’s economic strengths and weaknesses, describes new strategies to strengthen the regional economy. Prominent among those strategies is the Partnership for Regional Innovation Services to Manufacturers (PRISM), a collaboration between the MEP center and regional innovation and indus-try cluster organizations. PRISM will help strengthen manufacturing clusters by helping small and medium-sized manufacturers adopt new manufacturing methods, develop new products, access new markets, or make other changes that will drive growth.80
Major cities are also beginning to develop manufacturing strategies as a component of their overall economic development strategies. Chicago Mayor Rahm Emanuel’s newly released economic develop-ment plan includes, as one of its key goals, making the city a center for advanced manufacturing. To accomplish this goal, the plan recommends spurring growth in advanced manufacturing industries in which the city already specializes, helping low-growth manufacturers repurpose assets and improve their performance, expanding workforce development programs for manufacturing, and ensuring that zoning and permitting processes support manufacturing.81 Newark, NJ, is also in the early stages of formulating a manufacturing-based strategy.
These strategies, based on analyses of the strengths and weaknesses of manufacturing in each region, seem to avoid the common mistakes of either focusing narrowly on a particular kind of manu-facturing specialization (such as the very high-technology industries described in this report) or trying to diversify the regional manufacturing base in ways that are unrelated to existing regional strengths. Attempting to transform a metropolitan economy, or its manufacturing sector, from a more specialized one to a diversified one, or vice-versa, is almost certainly an unwise policy goal. Rather, policymakers should understand the extent to which a metropolitan areas manufacturing is diverse or specialized, consider the array of advantages metropolitan areas can offer to manufacturing, and enhance those most appropriate for specific industries in a certain area.82
The advantages of diverse metropolitan areas include proximity to key suppliers, customers, or con-sumers outside of one’s own industry, access to workers whose specialized skills are useful in a variety of industries, or the continued importance of cross-industry knowledge spillovers.83 There may also be benefits to keeping some routine production close to centers of R&D and high-end production; there is increasing concern that movement of too much low-end production to a far-away locale threatens the competitiveness of high-end production and R&D activities that remain in a metropolitan area.84
Specialized metropolitan areas also have advantages. When firms derive the greatest benefits from sharing knowledge within an industry it is often advantageous for that industry to locate in more spe-cialized metropolitan areas. Specialized metropolitan areas can also be advantageous when firms in an industry have a unique need to locate near certain physical features such as ports. A large number of competitors and location near an industry’s most sophisticated consumers can also be advantages of specialized metropolitan areas.85
However, excessive concentration of a metropolitan area’s employment in one industry may lead to blind spots that prevent the renewal of the area’s manufacturing base or its entire economy.86 A cur-rent example of a potentially vulnerable one-industry metropolitan area is Elkhart, Indiana, which has 40 times the national average percentage of its employment in motor vehicles and parts; this industry represents 20 percent of the metropolitan area’s total employment. While the United States lost 5 percent of all jobs between 2008 and 2010, Elkhart lost 12 percent.
Policymakers in small metropolitan areas should, therefore, be particularly aware of the long-term effects that may result from promoting one type of growth over another. Although public policy is not likely to be able to transform a specialized economy wholesale into a diversified one, policymakers would be better equipped to plan for the future by understanding how current advantages in industry composition may fade in the future. Public policy that anticipates workforce skills gaps as technology evolves, and plans for cyclical downturns as new industries with different geographies replace old ones, will benefit more specialized areas. Also, as explained earlier in this report, cyclical downturn is not inevitable if policymakers take steps to reinvigorate mature industries. Specialized metropolitan
BROOKINGS | April 2012 41
areas can institutionalize methods of seeking new ideas to avoid growing insular. Training centers operated jointly by unions and firms in the construction industry provide one example of proactively seeking exposure to new ideas.
Block the Geographic Low RoadThe shift of manufacturing jobs away from metropolitan areas, especially large ones, and out of cen-tral counties is undesirable. It raises greenhouse gas emissions by increasing the number of miles that goods travel. By reducing manufacturers’ exposure to the benefits of density and economic diversity, it also works against innovation, which is a key aspect of high-road competitiveness.87 Federal, state, and local public policies are partly responsible for the decentralization and de-metropolitanization of manufacturing. Blocking the geographic low road means eliminating (or, if that is not feasible) scaling back the policies that encourage the decentralization of manufacturing.
The Federal PlatformThe federal platform for blocking the geographic low road consists of both changing federal policy that promotes decentralization and de-metropolitanization and creating incentives for state and local governments to change their policies.
Pursue a modally neutral approach to federal transportation funding. The freight infrastructure and federal goods movement policy should span all modes of transportation (roads, rails, ports). The federal surface transportation program is currently on its eighth extension and Congressional delib-erations are, so far, unproductive. However, the bill recently passed by the Senate, ‘Moving Ahead for Progress in the 21st Century Act’ (MAP–21) contains an important requirement for the creation of a national freight strategy that pays particular attention to freight corridors, urban freight, and last mile sections. Another federal program, Transportation Investment Generating Economic Recovery (TIGER), applies common intermodal standards to awarding projects across modes, including freight. That program should be made permanent and continue to treat rail and highway projects equally and enable state and local leaders to design transportation projects to meet broad policy goals, such as strengthening manufacturing.88
Condition federal manufacturing assistance on states’ agreement not to poach manufacturing from other states. Federal support for manufacturing R&D and for technical assistance to manu-facturers can be a powerful lever that the federal government can use to discourage states from competing for manufacturers in a “race to the bottom.” The federal government should not provide manufacturing support to states that use subsidies to individual firms as a means of recruiting manu-facturers from other states. Similarly, it should not locate manufacturing assistance facilities, such as the proposed National Network for Manufacturing Innovation centers, in states that do so.
The State, Local, and Metropolitan RoleState and local governments should change business-attraction and land use policies that promote the decentralization and de-metropolitanization of manufacturing.
Restrict business-attraction subsidies. Without federal incentives such as those proposed above, states are unlikely to eliminate the subsidies they use to attract manufacturers (and other geographi-cally mobile businesses) from other states. However, there are several feasible ways in which these state subsidies (and their local-level counterparts) can be restricted. Business location incentive programs should consider the productivity and environmental impacts of location subsidies. State incentive programs, which favor the construction of new plants, disproportionately assist companies that locate in outlying and nonmetropolitan counties. These programs should instead give preference to metropolitan and especially central-county locations.89 States should limit their use of locational incentives in favor of programs to foster new firms and support the growth and improve the perfor-mance of firms already located within their jurisdictions. They should also restrict local governments’ ability use these incentives to compete with other jurisdictions within the same state. At the very least, all locational incentives that state and local governments offer should contain enforceable job creation, minimum job duration, and wage standards, so that the residents of the states and localities offering the awards receive the job and wage benefits for which the incentives are intended.90
BROOKINGS | April 201242
Change local zoning that excludes manufacturers. Some central cities seeking to maximize prop-erty tax receipts have used zoning to discourage manufacturers from locating within their boundaries, preferring residential and commercial buildings, which generate more property tax revenue per acre.91 Local governments should not “zone out” manufacturers, who disproportionately provide high-wage jobs for workers who would otherwise earn low wages. Because manufacturing creates benefits for the national economy that are not confined within the borders of local jurisdictions, federal and state governments should provide financial incentives to encourage local governments to use their zoning power to include manufacturing.92
Conclusion
The locational patterns and trends described in this report offer cause for both optimism and concern—both about American manufacturing and about the prospects for public policy to nurture a high-road “manufacturing moment” in the United States. The most important reason for optimism is that manufacturing remains a key part of the economic base in many
metropolitan areas—manufacturing as a whole in a large minority of metropolitan areas and one or more specific manufacturing industries in nearly all of them. Moreover, despite enormous losses of manufacturing jobs, more metropolitan areas depend on manufacturing as a part of their economic base today than three decades ago.
Geographic high-road policy makes sense for manufacturing only if manufacturing benefits from clustering and economic diversity. Here, too, there is great reason for optimism. American manufac-turing is highly geographically differentiated; the world of manufacturing is not “flat.” Both clustering and diversity matter for manufacturing. Metropolitan manufacturing specializations, while sometimes subtle, are far from random. In most metropolitan areas manufacturing follows one or more of a few identifiable patterns of industry clustering, while in nearly all the others manufacturing is made up of a diverse combination of industry specializations.
Further cause for optimism comes from the end of, or at least pause in, the decades-long shift of manufacturing toward the South, where states have long used low wages, right-to-work laws, and gen-erous subsidies to try to attract manufacturers.93 This is a welcome development, not because there is anything wrong with manufacturers locating in the South, but because it may motivate state, local, and metropolitan policymakers in the South and elsewhere to rethink the value of these geographic low-road policies and embrace the high-road policies recommended in this report.
Yet the trends detailed here also offer cause for concern about the prospects for a geographic high road in American manufacturing. Even as manufacturing employment has risen during the last two years, manufacturing has continued to shift away from the kinds of locations where the benefits of economic diversity are greatest: metropolitan areas in general and large metropolitan areas and central metropolitan counties in particular. The continued decentralization and de-metropolitanization of manufacturing result in part from economic forces and in part from public policies. To the extent that they result from policy, eliminating or curtailing the geographic low-road policies that encourage these developments is critical.
The policy recommendations in this report point the way for federal, state, local, and metropolitan policymakers to pave the geographic high road and block the geographic low road for manufacturing. Those recommendations must be supplemented with non-spatial manufacturing policies that pave the high road and block the low road in such areas as trade, innovation, workforce development, and finance, and with policies that ensure that assistance to manufacturers creates high-wage jobs in the United States.94
This is a time of great opportunity for the United States to stem and even begin to reverse the decades-long erosion of its manufacturing base and to do so in a way that makes American manufac-turing better for its workers and more innovative for the nation as a whole. That opportunity will not turn into reality without the right kinds of public policies. To a large extent, those policies are geo-graphic in nature and require action by federal, state, local, and metropolitan leaders. This report has provided the information needed to inform that action. The task now is to act on it.
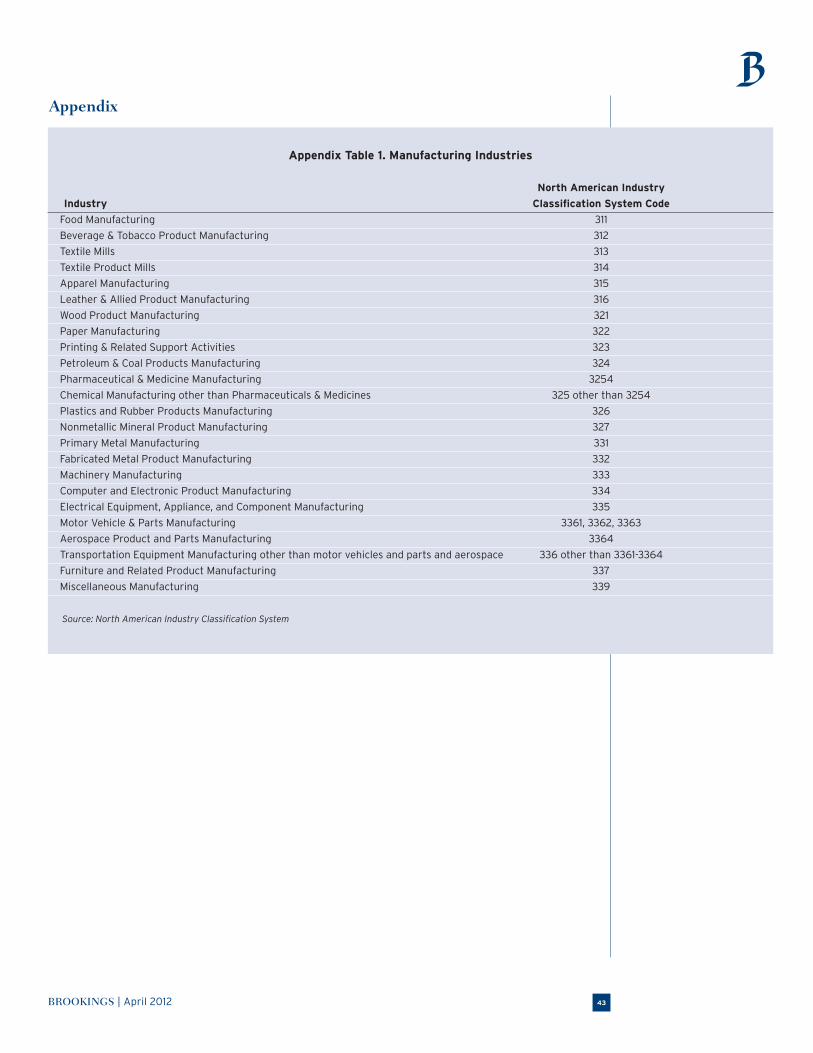
BROOKINGS | April 2012 43
Appendix
Appendix Table 1. Manufacturing Industries
North American Industry
Industry Classification System Code
Food Manufacturing 311
Beverage & Tobacco Product Manufacturing 312
Textile Mills 313
Textile Product Mills 314
Apparel Manufacturing 315
Leather & Allied Product Manufacturing 316
Wood Product Manufacturing 321
Paper Manufacturing 322
Printing & Related Support Activities 323
Petroleum & Coal Products Manufacturing 324
Pharmaceutical & Medicine Manufacturing 3254
Chemical Manufacturing other than Pharmaceuticals & Medicines 325 other than 3254
Plastics and Rubber Products Manufacturing 326
Nonmetallic Mineral Product Manufacturing 327
Primary Metal Manufacturing 331
Fabricated Metal Product Manufacturing 332
Machinery Manufacturing 333
Computer and Electronic Product Manufacturing 334
Electrical Equipment, Appliance, and Component Manufacturing 335
Motor Vehicle & Parts Manufacturing 3361, 3362, 3363
Aerospace Product and Parts Manufacturing 3364
Transportation Equipment Manufacturing other than motor vehicles and parts and aerospace 336 other than 3361-3364
Furniture and Related Product Manufacturing 337
Miscellaneous Manufacturing 339
Source: North American Industry Classification System
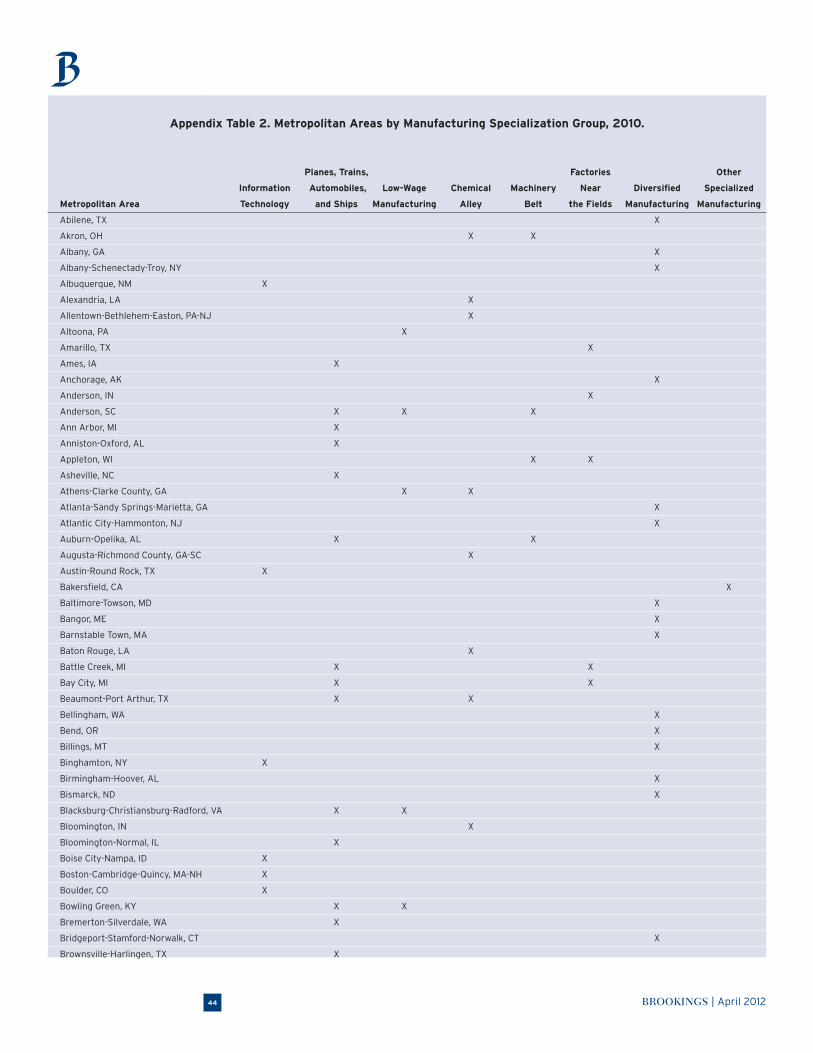
BROOKINGS | April 201244
Appendix Table 2. Metropolitan Areas by Manufacturing Specialization Group, 2010.
Planes, Trains, Factories Other
Information Automobiles, Low-Wage Chemical Machinery Near Diversified Specialized
Metropolitan Area Technology and Ships Manufacturing Alley Belt the Fields Manufacturing Manufacturing
Abilene, TX X
Akron, OH X X
Albany, GA X
Albany-Schenectady-Troy, NY X
Albuquerque, NM X
Alexandria, LA X
Allentown-Bethlehem-Easton, PA-NJ X
Altoona, PA X
Amarillo, TX X
Ames, IA X
Anchorage, AK X
Anderson, IN X
Anderson, SC X X X
Ann Arbor, MI X
Anniston-Oxford, AL X
Appleton, WI X X
Asheville, NC X
Athens-Clarke County, GA X X
Atlanta-Sandy Springs-Marietta, GA X
Atlantic City-Hammonton, NJ X
Auburn-Opelika, AL X X
Augusta-Richmond County, GA-SC X
Austin-Round Rock, TX X
Bakersfield, CA X
Baltimore-Towson, MD X
Bangor, ME X
Barnstable Town, MA X
Baton Rouge, LA X
Battle Creek, MI X X
Bay City, MI X X
Beaumont-Port Arthur, TX X X
Bellingham, WA X
Bend, OR X
Billings, MT X
Binghamton, NY X
Birmingham-Hoover, AL X
Bismarck, ND X
Blacksburg-Christiansburg-Radford, VA X X
Bloomington, IN X
Bloomington-Normal, IL X
Boise City-Nampa, ID X
Boston-Cambridge-Quincy, MA-NH X
Boulder, CO X
Bowling Green, KY X X
Bremerton-Silverdale, WA X
Bridgeport-Stamford-Norwalk, CT X
Brownsville-Harlingen, TX X
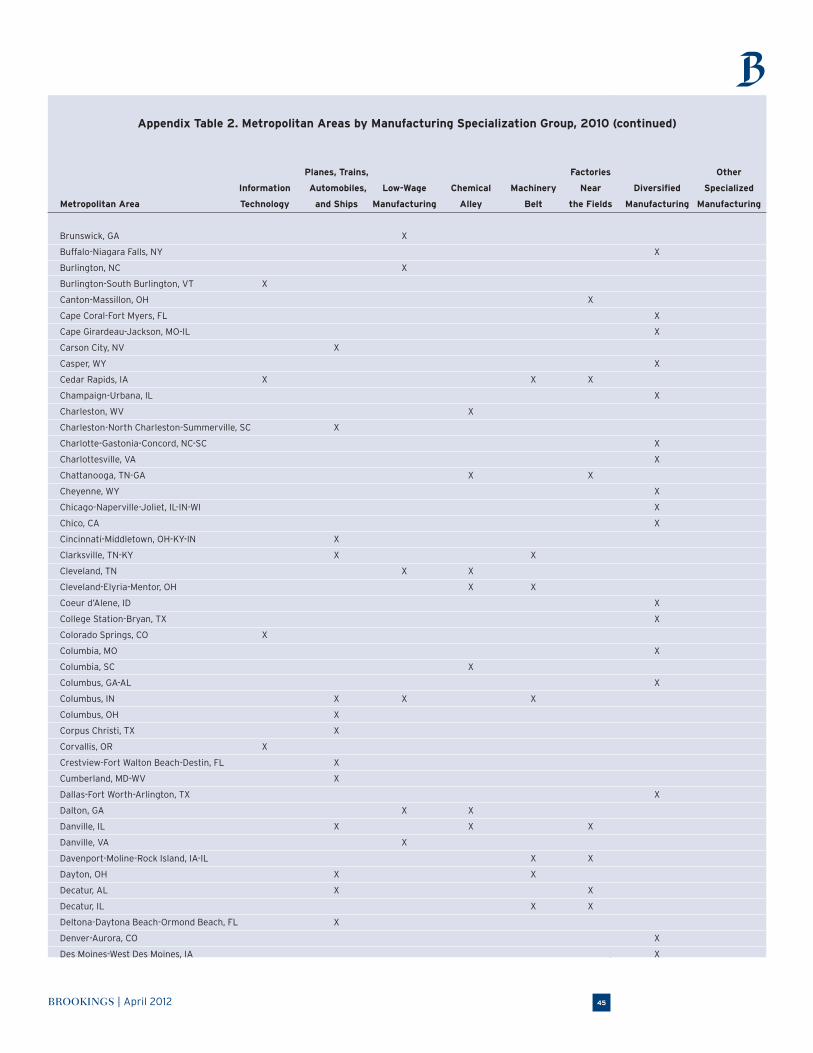
BROOKINGS | April 2012 45
Brunswick, GA X
Buffalo-Niagara Falls, NY X
Burlington, NC X
Burlington-South Burlington, VT X
Canton-Massillon, OH X
Cape Coral-Fort Myers, FL X
Cape Girardeau-Jackson, MO-IL X
Carson City, NV X
Casper, WY X
Cedar Rapids, IA X X X
Champaign-Urbana, IL X
Charleston, WV X
Charleston-North Charleston-Summerville, SC X
Charlotte-Gastonia-Concord, NC-SC X
Charlottesville, VA X
Chattanooga, TN-GA X X
Cheyenne, WY X
Chicago-Naperville-Joliet, IL-IN-WI X
Chico, CA X
Cincinnati-Middletown, OH-KY-IN X
Clarksville, TN-KY X X
Cleveland, TN X X
Cleveland-Elyria-Mentor, OH X X
Coeur d’Alene, ID X
College Station-Bryan, TX X
Colorado Springs, CO X
Columbia, MO X
Columbia, SC X
Columbus, GA-AL X
Columbus, IN X X X
Columbus, OH X
Corpus Christi, TX X
Corvallis, OR X
Crestview-Fort Walton Beach-Destin, FL X
Cumberland, MD-WV X
Dallas-Fort Worth-Arlington, TX X
Dalton, GA X X
Danville, IL X X X
Danville, VA X
Davenport-Moline-Rock Island, IA-IL X X
Dayton, OH X X
Decatur, AL X X
Decatur, IL X X
Deltona-Daytona Beach-Ormond Beach, FL X
Denver-Aurora, CO X
Des Moines-West Des Moines, IA X
Appendix Table 2. Metropolitan Areas by Manufacturing Specialization Group, 2010 (continued)
Planes, Trains, Factories Other
Information Automobiles, Low-Wage Chemical Machinery Near Diversified Specialized
Metropolitan Area Technology and Ships Manufacturing Alley Belt the Fields Manufacturing Manufacturing
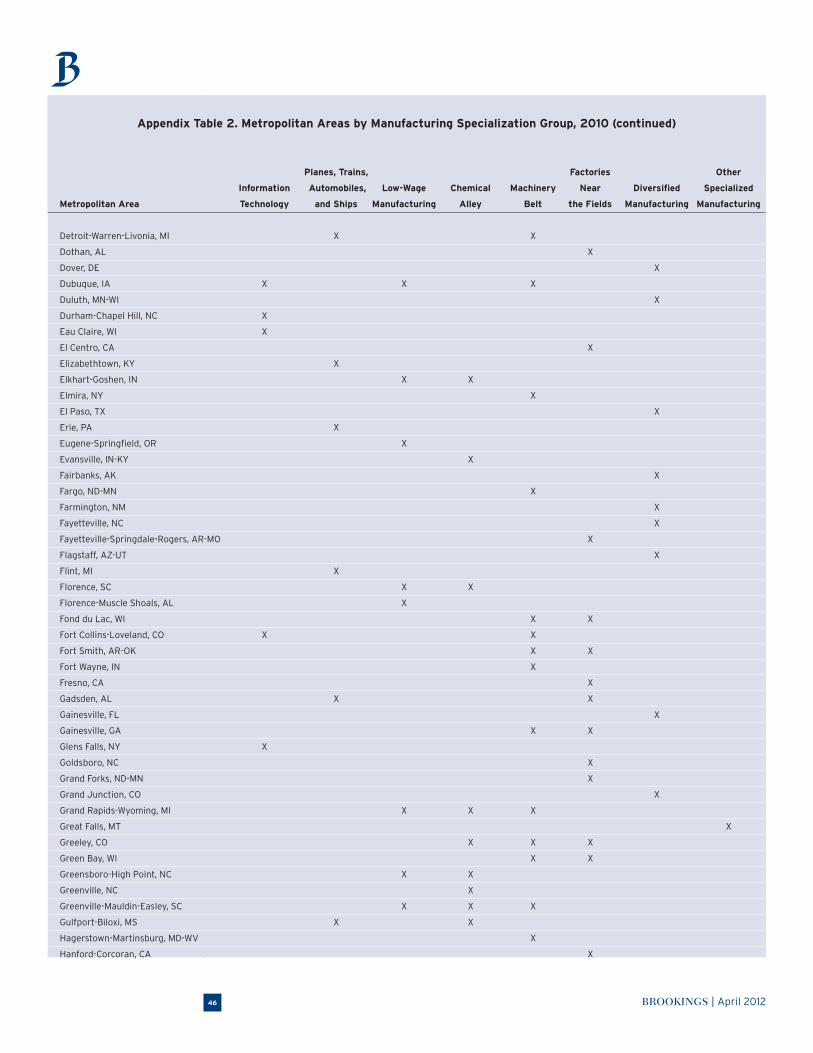
BROOKINGS | April 201246
Detroit-Warren-Livonia, MI X X
Dothan, AL X
Dover, DE X
Dubuque, IA X X X
Duluth, MN-WI X
Durham-Chapel Hill, NC X
Eau Claire, WI X
El Centro, CA X
Elizabethtown, KY X
Elkhart-Goshen, IN X X
Elmira, NY X
El Paso, TX X
Erie, PA X
Eugene-Springfield, OR X
Evansville, IN-KY X
Fairbanks, AK X
Fargo, ND-MN X
Farmington, NM X
Fayetteville, NC X
Fayetteville-Springdale-Rogers, AR-MO X
Flagstaff, AZ-UT X
Flint, MI X
Florence, SC X X
Florence-Muscle Shoals, AL X
Fond du Lac, WI X X
Fort Collins-Loveland, CO X X
Fort Smith, AR-OK X X
Fort Wayne, IN X
Fresno, CA X
Gadsden, AL X X
Gainesville, FL X
Gainesville, GA X X
Glens Falls, NY X
Goldsboro, NC X
Grand Forks, ND-MN X
Grand Junction, CO X
Grand Rapids-Wyoming, MI X X X
Great Falls, MT X
Greeley, CO X X X
Green Bay, WI X X
Greensboro-High Point, NC X X
Greenville, NC X
Greenville-Mauldin-Easley, SC X X X
Gulfport-Biloxi, MS X X
Hagerstown-Martinsburg, MD-WV X
Hanford-Corcoran, CA X
Appendix Table 2. Metropolitan Areas by Manufacturing Specialization Group, 2010 (continued)
Planes, Trains, Factories Other
Information Automobiles, Low-Wage Chemical Machinery Near Diversified Specialized
Metropolitan Area Technology and Ships Manufacturing Alley Belt the Fields Manufacturing Manufacturing
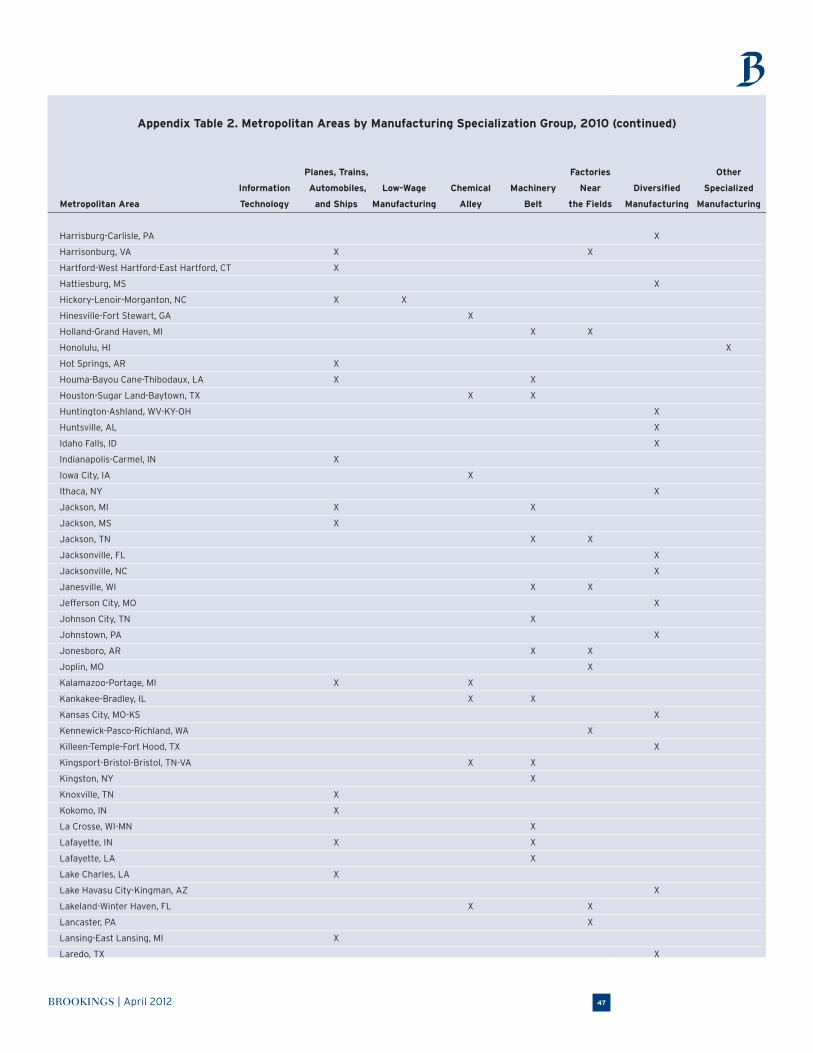
BROOKINGS | April 2012 47
Harrisburg-Carlisle, PA X
Harrisonburg, VA X X
Hartford-West Hartford-East Hartford, CT X
Hattiesburg, MS X
Hickory-Lenoir-Morganton, NC X X
Hinesville-Fort Stewart, GA X
Holland-Grand Haven, MI X X
Honolulu, HI X
Hot Springs, AR X
Houma-Bayou Cane-Thibodaux, LA X X
Houston-Sugar Land-Baytown, TX X X
Huntington-Ashland, WV-KY-OH X
Huntsville, AL X
Idaho Falls, ID X
Indianapolis-Carmel, IN X
Iowa City, IA X
Ithaca, NY X
Jackson, MI X X
Jackson, MS X
Jackson, TN X X
Jacksonville, FL X
Jacksonville, NC X
Janesville, WI X X
Jefferson City, MO X
Johnson City, TN X
Johnstown, PA X
Jonesboro, AR X X
Joplin, MO X
Kalamazoo-Portage, MI X X
Kankakee-Bradley, IL X X
Kansas City, MO-KS X
Kennewick-Pasco-Richland, WA X
Killeen-Temple-Fort Hood, TX X
Kingsport-Bristol-Bristol, TN-VA X X
Kingston, NY X
Knoxville, TN X
Kokomo, IN X
La Crosse, WI-MN X
Lafayette, IN X X
Lafayette, LA X
Lake Charles, LA X
Lake Havasu City-Kingman, AZ X
Lakeland-Winter Haven, FL X X
Lancaster, PA X
Lansing-East Lansing, MI X
Laredo, TX X
Appendix Table 2. Metropolitan Areas by Manufacturing Specialization Group, 2010 (continued)
Planes, Trains, Factories Other
Information Automobiles, Low-Wage Chemical Machinery Near Diversified Specialized
Metropolitan Area Technology and Ships Manufacturing Alley Belt the Fields Manufacturing Manufacturing
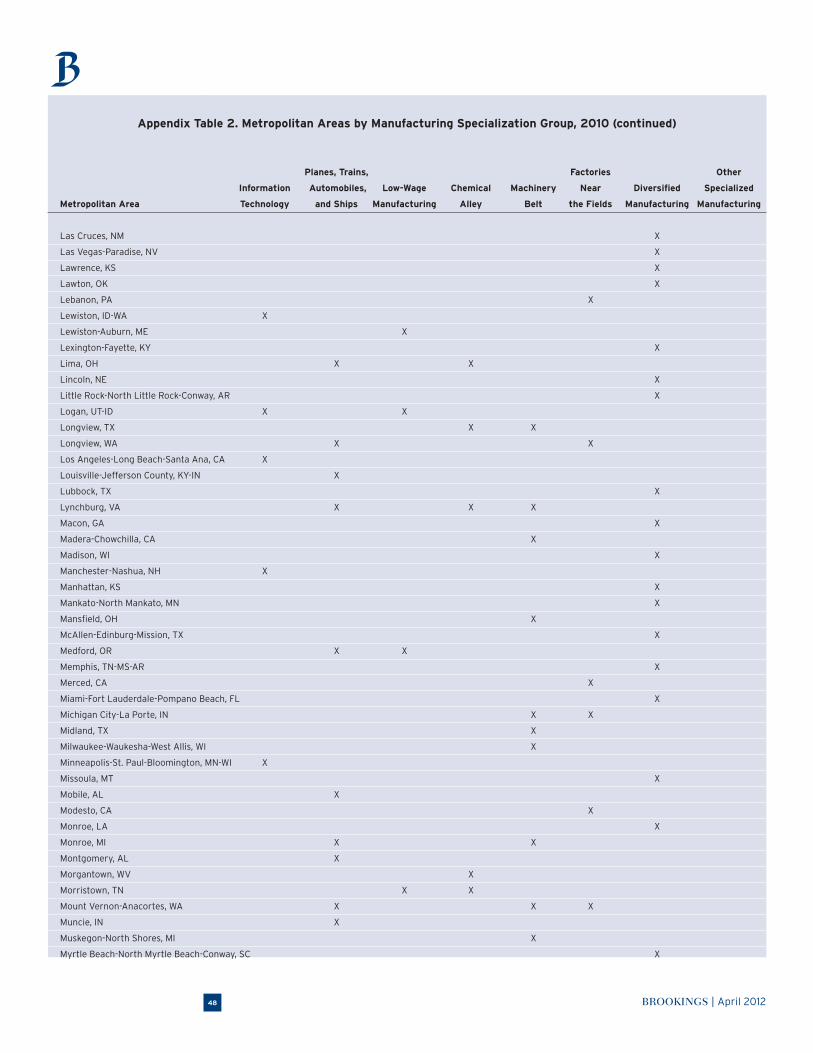
BROOKINGS | April 201248
Las Cruces, NM X
Las Vegas-Paradise, NV X
Lawrence, KS X
Lawton, OK X
Lebanon, PA X
Lewiston, ID-WA X
Lewiston-Auburn, ME X
Lexington-Fayette, KY X
Lima, OH X X
Lincoln, NE X
Little Rock-North Little Rock-Conway, AR X
Logan, UT-ID X X
Longview, TX X X
Longview, WA X X
Los Angeles-Long Beach-Santa Ana, CA X
Louisville-Jefferson County, KY-IN X
Lubbock, TX X
Lynchburg, VA X X X
Macon, GA X
Madera-Chowchilla, CA X
Madison, WI X
Manchester-Nashua, NH X
Manhattan, KS X
Mankato-North Mankato, MN X
Mansfield, OH X
McAllen-Edinburg-Mission, TX X
Medford, OR X X
Memphis, TN-MS-AR X
Merced, CA X
Miami-Fort Lauderdale-Pompano Beach, FL X
Michigan City-La Porte, IN X X
Midland, TX X
Milwaukee-Waukesha-West Allis, WI X
Minneapolis-St. Paul-Bloomington, MN-WI X
Missoula, MT X
Mobile, AL X
Modesto, CA X
Monroe, LA X
Monroe, MI X X
Montgomery, AL X
Morgantown, WV X
Morristown, TN X X
Mount Vernon-Anacortes, WA X X X
Muncie, IN X
Muskegon-North Shores, MI X
Myrtle Beach-North Myrtle Beach-Conway, SC X
Appendix Table 2. Metropolitan Areas by Manufacturing Specialization Group, 2010 (continued)
Planes, Trains, Factories Other
Information Automobiles, Low-Wage Chemical Machinery Near Diversified Specialized
Metropolitan Area Technology and Ships Manufacturing Alley Belt the Fields Manufacturing Manufacturing
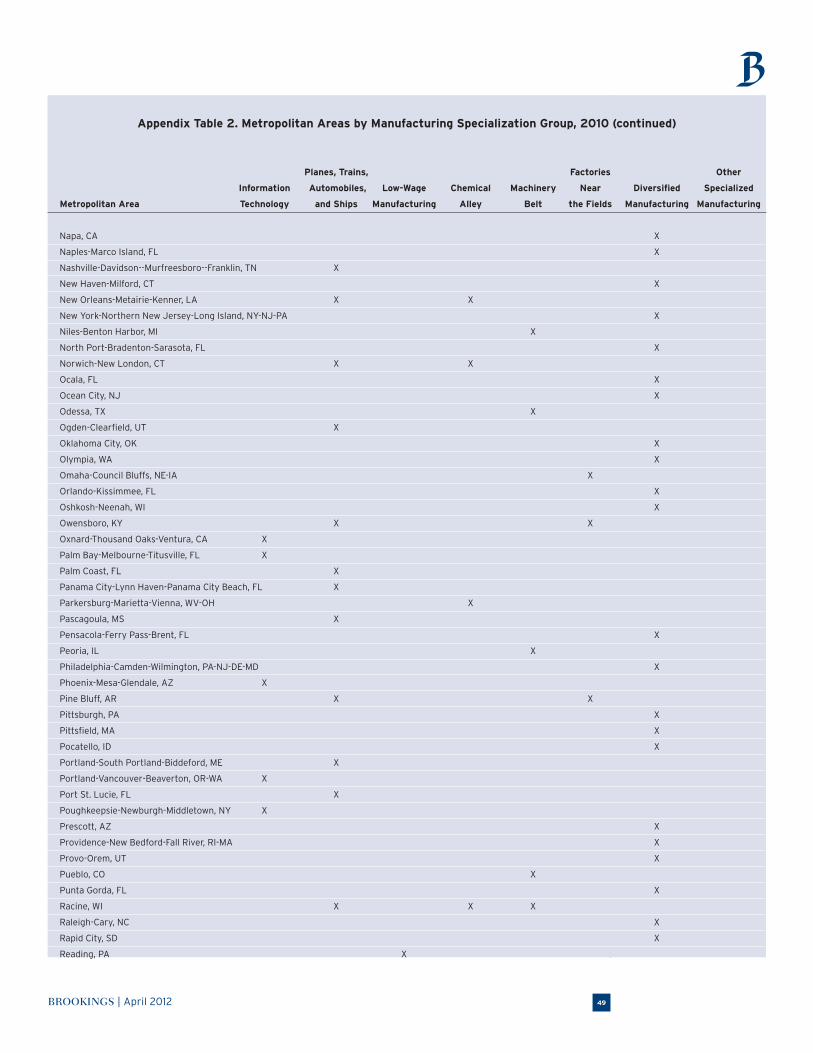
BROOKINGS | April 2012 49
Napa, CA X
Naples-Marco Island, FL X
Nashville-Davidson--Murfreesboro--Franklin, TN X
New Haven-Milford, CT X
New Orleans-Metairie-Kenner, LA X X
New York-Northern New Jersey-Long Island, NY-NJ-PA X
Niles-Benton Harbor, MI X
North Port-Bradenton-Sarasota, FL X
Norwich-New London, CT X X
Ocala, FL X
Ocean City, NJ X
Odessa, TX X
Ogden-Clearfield, UT X
Oklahoma City, OK X
Olympia, WA X
Omaha-Council Bluffs, NE-IA X
Orlando-Kissimmee, FL X
Oshkosh-Neenah, WI X
Owensboro, KY X X
Oxnard-Thousand Oaks-Ventura, CA X
Palm Bay-Melbourne-Titusville, FL X
Palm Coast, FL X
Panama City-Lynn Haven-Panama City Beach, FL X
Parkersburg-Marietta-Vienna, WV-OH X
Pascagoula, MS X
Pensacola-Ferry Pass-Brent, FL X
Peoria, IL X
Philadelphia-Camden-Wilmington, PA-NJ-DE-MD X
Phoenix-Mesa-Glendale, AZ X
Pine Bluff, AR X X
Pittsburgh, PA X
Pittsfield, MA X
Pocatello, ID X
Portland-South Portland-Biddeford, ME X
Portland-Vancouver-Beaverton, OR-WA X
Port St. Lucie, FL X
Poughkeepsie-Newburgh-Middletown, NY X
Prescott, AZ X
Providence-New Bedford-Fall River, RI-MA X
Provo-Orem, UT X
Pueblo, CO X
Punta Gorda, FL X
Racine, WI X X X
Raleigh-Cary, NC X
Rapid City, SD X
Reading, PA X
Appendix Table 2. Metropolitan Areas by Manufacturing Specialization Group, 2010 (continued)
Planes, Trains, Factories Other
Information Automobiles, Low-Wage Chemical Machinery Near Diversified Specialized
Metropolitan Area Technology and Ships Manufacturing Alley Belt the Fields Manufacturing Manufacturing
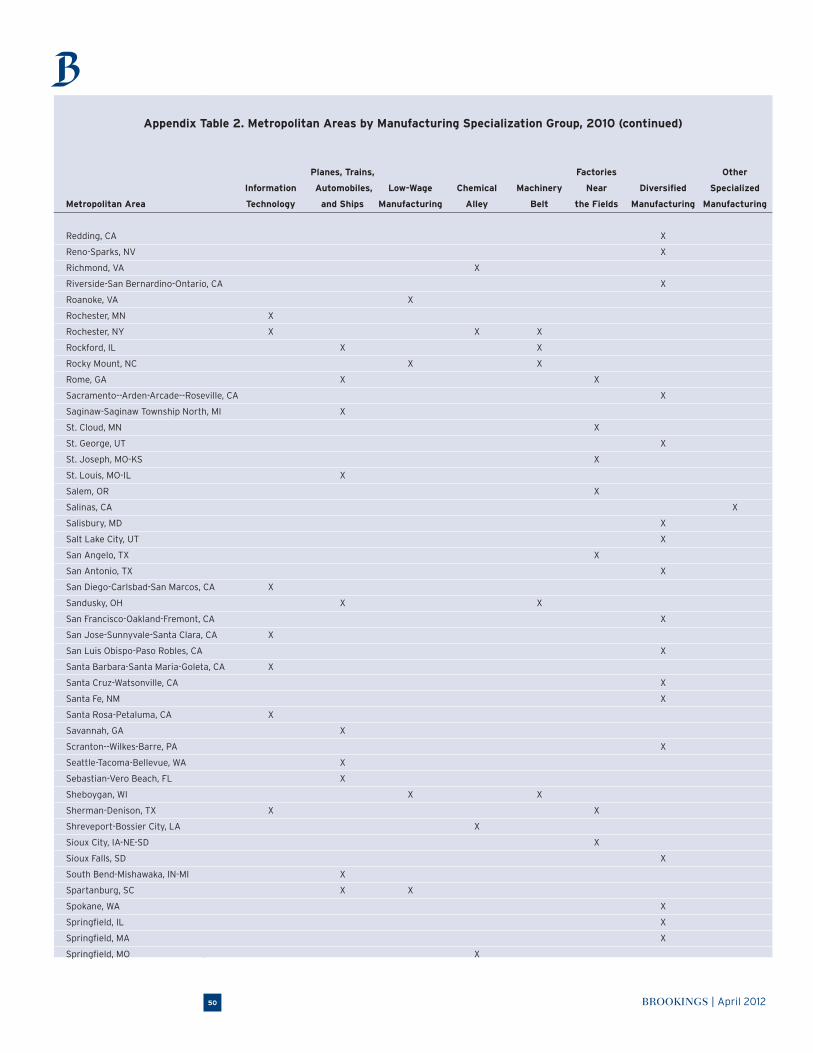
BROOKINGS | April 201250
Redding, CA X
Reno-Sparks, NV X
Richmond, VA X
Riverside-San Bernardino-Ontario, CA X
Roanoke, VA X
Rochester, MN X
Rochester, NY X X X
Rockford, IL X X
Rocky Mount, NC X X
Rome, GA X X
Sacramento--Arden-Arcade--Roseville, CA X
Saginaw-Saginaw Township North, MI X
St. Cloud, MN X
St. George, UT X
St. Joseph, MO-KS X
St. Louis, MO-IL X
Salem, OR X
Salinas, CA X
Salisbury, MD X
Salt Lake City, UT X
San Angelo, TX X
San Antonio, TX X
San Diego-Carlsbad-San Marcos, CA X
Sandusky, OH X X
San Francisco-Oakland-Fremont, CA X
San Jose-Sunnyvale-Santa Clara, CA X
San Luis Obispo-Paso Robles, CA X
Santa Barbara-Santa Maria-Goleta, CA X
Santa Cruz-Watsonville, CA X
Santa Fe, NM X
Santa Rosa-Petaluma, CA X
Savannah, GA X
Scranton--Wilkes-Barre, PA X
Seattle-Tacoma-Bellevue, WA X
Sebastian-Vero Beach, FL X
Sheboygan, WI X X
Sherman-Denison, TX X X
Shreveport-Bossier City, LA X
Sioux City, IA-NE-SD X
Sioux Falls, SD X
South Bend-Mishawaka, IN-MI X
Spartanburg, SC X X
Spokane, WA X
Springfield, IL X
Springfield, MA X
Springfield, MO X
Appendix Table 2. Metropolitan Areas by Manufacturing Specialization Group, 2010 (continued)
Planes, Trains, Factories Other
Information Automobiles, Low-Wage Chemical Machinery Near Diversified Specialized
Metropolitan Area Technology and Ships Manufacturing Alley Belt the Fields Manufacturing Manufacturing
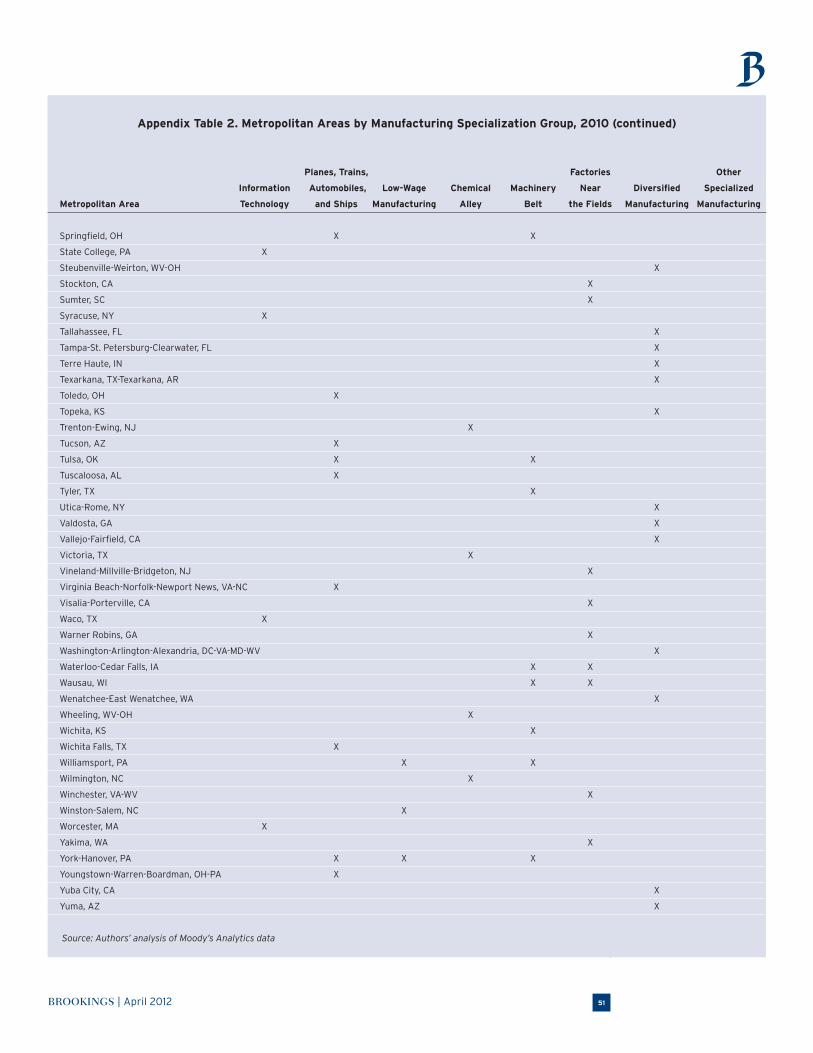
BROOKINGS | April 2012 51
Springfield, OH X X
State College, PA X
Steubenville-Weirton, WV-OH X
Stockton, CA X
Sumter, SC X
Syracuse, NY X
Tallahassee, FL X
Tampa-St. Petersburg-Clearwater, FL X
Terre Haute, IN X
Texarkana, TX-Texarkana, AR X
Toledo, OH X
Topeka, KS X
Trenton-Ewing, NJ X
Tucson, AZ X
Tulsa, OK X X
Tuscaloosa, AL X
Tyler, TX X
Utica-Rome, NY X
Valdosta, GA X
Vallejo-Fairfield, CA X
Victoria, TX X
Vineland-Millville-Bridgeton, NJ X
Virginia Beach-Norfolk-Newport News, VA-NC X
Visalia-Porterville, CA X
Waco, TX X
Warner Robins, GA X
Washington-Arlington-Alexandria, DC-VA-MD-WV X
Waterloo-Cedar Falls, IA X X
Wausau, WI X X
Wenatchee-East Wenatchee, WA X
Wheeling, WV-OH X
Wichita, KS X
Wichita Falls, TX X
Williamsport, PA X X
Wilmington, NC X
Winchester, VA-WV X
Winston-Salem, NC X
Worcester, MA X
Yakima, WA X
York-Hanover, PA X X X
Youngstown-Warren-Boardman, OH-PA X
Yuba City, CA X
Yuma, AZ X
Source: Authors’ analysis of Moody’s Analytics data
Appendix Table 2. Metropolitan Areas by Manufacturing Specialization Group, 2010 (continued)
Planes, Trains, Factories Other
Information Automobiles, Low-Wage Chemical Machinery Near Diversified Specialized
Metropolitan Area Technology and Ships Manufacturing Alley Belt the Fields Manufacturing Manufacturing
BROOKINGS | April 201252
Selected References
Atkinson, Robert, and Howard Wial. 2008. Boost-ing Productivity, Innovation, and Growth through a National Innovation Foundation. Washington: Brookings Institution and Information Technol-ogy and Innovation Foundation.
Breznitz, Dan, and Peter Cowhey. 2012. “Ameri-ca’s Two Systems of Innovation: Recommenda-tions for Policy Changes to Support Innovation, Production and Job Creation.” San Diego: CON-NECT Innovation Institute.
Christopherson, Susan. 2009. “Manufacturing: Up from the Ashes,” Democracy 14 (Fall): 25-30.
Clark, Jennifer, Hsin I. Huang, and John P. Walsh. 2010. “A Typology of Innovation Districts: What it Means for Regional Resilience,” Cambridge Jour-nal of Regions, Economy and Society 3(1):121-137.
Cortright, Joseph. 2006. “Making Sense of Clus-ters: Regional Competitiveness and Economic Development.” Washington: Brookings Institu-tion.
Delgado, Mercedes, Michael E. Porter, and Scott Stern. 2011. “Clusters, Convergence, and Eco-nomic Performance,” unpublished paper, Harvard Business School, March, available at www.isc.hbs.edu/pdf/DPS_Clusters_Performance_2011-0311.pdf.
Hecker, Daniel E. 2005. “High-Technology Employment: A NAICS-Based Update,” Monthly Labor Review 128 (7): 57-72.
Helper, Susan, Timothy Krueger, and Howard Wial. 2012. “Why Does Manufacturing Matter? Which Manufacturing Matters? A Policy Frame-work.” Washington: Brookings Institution.
Helper, Susan, and Marcus Stanley. 2010. “Exter-nal Economies: How Innovative Small Manufac-turers Compete,” unpublished paper, Department of Economics, Case Western Reserve University, November, available at http://faculty.weather-head.case.edu/helper/papers/networkingur-ban%20icos_helper.pdf.
Helper, Susan, and Howard Wial. 2011. “Accelerat-ing Advanced Manufacturing with New Research Centers.” Washington: Brookings Institution.
Helper, Susan and Howard Wial. 2010. “Strength-ening American Manufacturing: A New Federal Approach.” Washington: Brookings Institution.
Immelt, Jeffrey R. 2012. “How We Did It . . . The CEO of General Electric On Sparking an Ameri-can Manufacturing Renewal,” Harvard Business Review, (March 2012): 43-46.
Mills, Karen G., Elisabeth B. Reynolds, and Andrew Reamer. 2008. “Clusters and Competi-tiveness: A New Federal Role for Stimulating Regional Economies.” Washington: Brookings Institution.
Mistry, Nisha, and Joan Byron. 2011. “The Federal Role in Supporting Urban Manufacturing.” Wash-ington: Brookings Institution and Pratt Center for Community Development.
Muro, Mark, and Kenan Fikri. 2011. “Job Creation on a Budget: How Regional Industry Clusters Can Add Jobs, Bolster Entrepreneurship, and Spark Innovation.” Washington: Brookings Institution.
Puentes, Robert. 2008. A Bridge to Somewhere: Rethinking American Transportation for the 21st Century. Washington: Brookings Institution.
Rast, Joel. 2012. “The Promises and Pitfalls of Planned Manufacturing Districts,” Progressive Planning 190 (Winter 2012): 21-23.
Rosenthal, Stuart and William Strange. 2001. “The Determinants of Agglomeration,” Journal of Urban Economics 50: 191-229.
BROOKINGS | April 2012 53
Endnotes
1. Susan Helper is Carlton Professor of Economics at
Case Western Reserve University. Timothy Krueger is a
research assistant at Policy Matters Ohio. Howard Wial
is an economist and fellow in the Metropolitan Policy
Program at the Brookings Institution.
2. See Steve Poftak, “Is It Manufacturing’s Moment?”
Boston Magazine online, February 3, 2012, avail-
able at http://blogs.bostonmagazine.com/bos-
ton_daily/2012/02/03/is-it-manufacturings-moment;
Daniel Howes, “Demand for Manufacturing May Set
Stage for ‘Michigan Moment’, Detroit News online,
February 24, 2012, available at www.detroitnews.com/
article/20120224/OPINION03/202240339; Susan
Christopherson, “Riding the Small Wave in Manufacturing
to More Good Jobs and a More Diverse Economy,”
prepared for Conference on Big Ideas for Job Creation in
a Jobless Recovery, Institute for Labor and Employment,
University of California, Berkeley, June 2011.
3. Jeffrey R. Immelt, “How We Did It . . . The CEO of General
Electric On Sparking an American Manufacturing
Renewal,” Harvard Business Review, 90 (March 2012):
43-46.
4. See Joseph Cortright, “Making Sense of Clusters:
Regional Competitiveness and Economic Development”
(Washington: Brookings Institution, 2006).
5. See Susan Helper, Timothy Krueger, and Howard Wial,
“Why Does Manufacturing Matter? Which Manufacturing
Matters? A Policy Framework” (Washington: Brookings
Institution, 2012).
6. Christina D. Romer, “Do Manufacturers Need Special
Treatment?” New York Times, February 4, 2012, available
at www.nytimes.com/2012/02/05/business/do-manufac-
turers-need-special-treatment-economic-view.html.
7. In addition to the location-specific policies we discuss in
this report, national policies are also needed for revital-
izing US manufacturing. See Helper, Krueger, and Wial,
“Why Does Manufacturing Matter?” for discussion of
these national policies.
8. Amy Dean, “We Want Our Money Back,” American
Prospect online, http://prospect.org/article/we-want-our-
money-back; Timothy Bartik and Randall Eberts, ”The
Roles of Tax Incentives and Other Business Incentives in
Local Economic Development,” in Oxford Handbook of
Urban Economics and Planning, edited by Nancy Brooks,
Kieran Donaghy, and Gerrit-Jan Knaap (New York: Oxford
University Press, 2012), pp. 634-654; Timothy J. Bartik,
”State Economic Development Policies: What Works?”
presented at 19th annual State Fiscal Policy Conference,
Center on Budget and Policy Priorities, Washington,,
November 2011.
9. In contrast, the 1990s were a time of only modest manu-
facturing job losses. The United States lost only 432,000
manufacturing jobs between 1990 and 2000, a loss of 2.4
percent. All data cited in this section are from the Bureau
of Labor Statistics’ Current Employment Statistics pro-
gram.
10. On the impact of Chinese wage and currency movements
on U.S. manufacturing employment, see Helper, Krueger,
and Wial, “Why Does Manufacturing Matter?”
11. Ibid.
12. Helper, Krueger, and Wial, “Why Does Manufacturing
Matter?”
13. Petroleum and coal products, pharmaceuticals, and
chemicals (all high-wage industries) were among the
industries that lost the lowest percentages of their jobs
during this period, as were food and beverages and
tobacco (industries with heavy products that are expen-
sive to ship). Meanwhile, textile mills, apparel, leather,
furniture, textile product mills, and wood (all low-wage
industries) lost the highest percentages of their jobs dur-
ing this period. See Helper, Krueger, and Wial, “Why Does
Manufacturing Matter?”
14. The medical device industry, which is also important
as part of the nation’s high-technology manufacturing
base, is not included because it includes all of one NAICS
four-digit industry (3391, medical equipment and supplies
manufacturing) and part of another one (3345, naviga-
tional, measuring, electromedical, and control instru-
ments manufacturing). The Moody’s Analytics data on
which most of this report relies does not include NAICS
industries below the four-digit level, so it is impossible to
identify the medical device industry using those data.
15. Daniel E. Hecker, “High-Technology Employment: A
NAICS-Based Update,” Monthly Labor Review 128 (7)
(2005): 57-72.
16. We applied Hecker’s criteria to 2010 Bureau of Labor
Statistics Occupational Employment Survey data for
the industries covered in this report. The occupational
categories in that survey that correspond to Hecker’s
occupational categories are computer and mathemati-
cal scientists; architecture and engineering occupations
BROOKINGS | April 201254
( a category that, in manufacturing industries, consists
almost entirely of engineers and engineering techni-
cians); life, physical and social scientists (which, in manu-
facturing, consists almost entirely of life and physical
scientists); computer and information systems managers;
engineering managers; and natural science managers.
Our “very high-technology” industry category corre-
sponds to Hecker’s Level I high-technology industries.
Our “moderately high-technology” category corresponds
to Hecker’s Levels II and III.
17. See Susan Helper, Timothy Krueger, and Howard Wial,
“Why Does Manufacturing Matter?” (Washington:
Brookings Institution, 2012).
18. Karen Chapple and others, “Gauging Metropolitan
‘High-Tech’ and ‘I-Tech’ Activity,” Economic Development
Quarterly 18 (1) (February 2004): 10-29.
19. Executive Office of the President, National Technology
Council, “A National Strategic Plan for Advanced
Manufacturing” (Washington, 2012: P. 2)
20. Helper, Krueger, and Wial, “Why Does Manufacturing
Matter?”
21. See the evidence cited in Robert Atkinson and Howard
Wial, Boosting Productivity, Innovation, and Growth
through a National Innovation Foundation (Washington:
Brookings Institution and Information Technology and
Innovation Foundation, 2008).
22. In 2010, manufacturing as a whole accounted for 8.5
percent of nationwide total employment, so 1.05 times
this nationwide percentage was 8.9 percent, 1.50 times
the nationwide percentage was 12.8 percent, and 1.90
times the nationwide percentage was 16.2 percent. Any
metropolitan area in which manufacturing’s share of
employment exceeds its share of national employment
is presumptively specialized in manufacturing. However,
there is no consensus in the literature on quantitative
cutoffs to represent the strength of metropolitan areas’
manufacturing specializations, and any such choices,
such as those used in this report, are inevitably matters
of judgment.
23. Mathematical cluster analysis organizes data into mutu-
ally exclusive groups by maximizing the similarity within
the groups while minimizing the similarity between the
groups. It is an analytic tool that is useful in guiding
researchers’ judgments about classifications, not a
statistical method that permits inferences about empiri-
cal relationships. See Brian S. Everitt and others, Cluster
Analysis, 5th edition (London: Wiley, 2011). The groups
identified in Finding C are not all mutually exclusive and
do not correspond precisely to those obtained from the
cluster analysis. Instead, they are based on cutoff values
of selected industry employment shares that were cho-
sen to approximate the groups obtained from the cluster
analysis. The groups identified in Finding B are more
easily interpreted than those obtained from the cluster
analysis. The cluster analysis often includes a metropoli-
tan area in a particular group not because its pattern
of industry employment percentages is typical for that
group but simply because it is closer to that of the rest of
that group than to that of any other group.
24. The Herfindahl index equals the sum of the squares
of the employment shares of a metropolitan area’s
industries. The index has a maximum value of 1 and a
minimum value that approaches zero as the number
of industries increases, with 1 indicating that all the
metropolitan area’s employment is in one industry
and the minimum value indicating that employment is
equally distributed among all industries. Thus, lower
values of the index mean more industrial diversity. See
Alec Friedhoff, Howard Wial, and Harold Wolman, “The
Consequences of Metropolitan Manufacturing Decline:
Testing Conventional Wisdom” (Washington: Brookings
Institution, 2011), appendix B.
25. We chose this cutoff because there is a relatively large
gap between metropolitan areas whose index is above
this level (0.121 or above) and those whose index is below
it (0.108 or below).
26. The expected level of average earnings for each of the
100 largest metropolitan areas is the predicted value
from a regression of metropolitan areas’ average manu-
facturing earnings on the percentage of their manufac-
turing employment that is in industries whose average
earnings exceed the national manufacturing average. The
percentage difference between each metropolitan area’s
actual average earnings and its predicted average earn-
ings is then computed for each metropolitan area.
27. Friedhoff, Wial, and Wolman, “Testing.”
28. A few metropolitan areas have more than one central
county because they have multiple principal cities that
are located in different counties.
29. Cortright, “Making Sense.”
30. Susan Helper and Marcus Stanley, “External Economies:
How Innovative Small Manufacturers Compete,”
unpublished paper, Department of Economics, Case
Western Reserve University, November 2010, available
BROOKINGS | April 2012 55
at http://faculty.weatherhead.case.edu/helper/papers/
networkingurban%20icos_helper.pdf.
31. In general, the regional distribution of manufacturing
jobs is similar to the regional distribution of all jobs. The
exception is the Midwest, which has only 22.9 percent of
all jobs, but 31.1 percent of manufacturing jobs. All other
regions have about three percentage points fewer manu-
facturing jobs than total jobs.
32. For discussions of the product cycle, see Raymond
Vernon, “International Investment and International
Trade in the Product Cycle,” Quarterly Journal of
Economics 80 (2) (1966): 190-207; Ann Markusen, Profit
Cycles, Oligopoly, and Regional Development (Cambridge:
MIT Press, 1985); Klaus Desmet and Esteban Rossi-
Hansberg, “Spatial Growth and Industry Age,” Journal of
Economic Theory 144 (6) (2009): 2477-2502.
33. See Friedhoff, Wial, and Wolman, “Testing.”
34. The specialization in both computers and electronics and
miscellaneous manufacturing may indicate a specializa-
tion in medical devices, which are classified in both of
those industries.
35. These facts do not mean that all metropolitan areas in
each region specialize in each of the indicated industries;
nor do they mean that those industries are the only ones
in which any metropolitan area in each region specializes.
They simply indicate regional averages.
36. This does not mean that even these metropolitan areas
have no manufacturing specializations. They may special-
ize in very narrowly defined kinds of manufacturing that
are only small parts of the larger industries covered here.
37. See Romer, “Do Manufacturers Need Special Treatment?”
38. See Joseph Cortright, “Making Sense of Clusters”
(Washington: Brookings Institution, 2006); Glenn Ellison,
Edward L. Glaeser, and William Kerr, “What Causes
Industry Agglomeration? Evidence from Coagglomeration
Patterns,” American Economic Review 100 (2010): 1195-
1213.
39. See Robert W. Helsley and William C. Strange,
“Coagglomeration,” unpublished paper presented at
annual meetings of the American Real Estate and Urban
Economics Association, January 2012, available at http://
haas.berkeley.edu/faculty/papers/coagglomeration.pdf.
40. See Edward L. Glaeser and others, “Growth in Cities,”
Journal of Political Economy 100 (1992): 1126-1152.
41. Similar patterns emerge between high-wage Phoenix
($73,000) and low-wage Tucson ($48,000), and between
high-wage Palm Bay ($75,200) and low-wage Lakeland
($49,600) and Cape Coral ($41,800). Likewise, low-wage
Jackson, MS ($47,600), is halfway between high-wage
Baton Rouge ($68,500) and New Orleans ($66,700)
to the south and high-wage Memphis ($69,000) to the
north, about 200 miles from each on Interstate 55.
42. These observations are consistent with much of Sukkoo
Kim’s framework for regional economic convergence. See
Sukkoo Kim, “Economic Integration and Convergence:
U.S. Regions, 1840-1987,” Journal of Economic History 58
(3) (1998): 659-683.
43. The Census Bureau classifies Washington and Baltimore
as Southern metropolitan areas.
44. Enrico Moretti, “Workers’ Education, Spillovers, and
Productivity: Evidence from Plant-Level Production
Functions,” American Economic Review 94 (3) (2004):
656-690.
45. Chad Syverson, “What Determines Productivity?”
Journal of Economic Literature, 49 (2) (2011), 326-365;
Helper, Krueger, and Wial, “Why Does Manufacturing
Matter?”
46. Helper and Stanley, “External Economies.”
47. For example, in most manufacturing industries the Small
Business Administration defines a “small business” as
one with no more than 500 employees. “Small Business
Administration, Summary of Size Standards by Industry,”
available at www.sba.gov/content/summary-size-stan-
dards-industry.
48. Susan Helper and Howard Wial, “Strengthening American
Manufacturing: A New Federal Approach” (Washington:
Brookings Institution, 2010); Susan Helper and Howard
Wial, “Accelerating Advanced Manufacturing with New
Research Centers” (Washington: Brookings Institution,
2011).
49. These are unweighted averages of the average plant
sizes in the ten metropolitan areas in each group.
50. The larger average plant sizes in higher-wage indus-
tries probably reflects the fact that workers are paid
more in larger establishments, The higher pay in larger
establishments results from the greater difficulty that
managers have in controlling the work process in such
establishments. To induce workers in those establish-
ments to take more responsibility for production and, to
BROOKINGS | April 201256
some extent, manage themselves, companies pay higher
wages. See Simon D. Woodcock, ”Wage Differentials in
the Presence of Unobserved Worker, Firm, and Match
Heterogeneity,” Labour Economics 15 (4) (2008): 774-98;
George Borjas and Valerie Ramey, “Market Responses to
Interindustry Wage Differentials,” NBER Working Paper
7799 (Cambridge, MA: National Bureau of Economic
Research, 2000); Alan B. Krueger and Lawrence H.
Summers, “Efficiency Wages and the Inter-Industry Wage
Structure,” Econometrica 56 (2) (1988): 259-293.
51. A more formal analysis using the coefficient of variation
(the standard deviation divided by the average) produces
the same result. The coefficient of variation of average
plant size across metropolitan areas within each NAICS
three-digit industry is greater than that of average plant
size across industries nationwide.
52. The material in this box is based on Susan
Christopherson, “Manufacturing: Up from the Ashes,”
Democracy 14 (Fall 2009): 25-30.
53. Ibid. p. 26.
54. The Midwest gained about 225,000 manufacturing jobs
between 1990 and 2000 but this gain was smaller than
the 308,000-job loss the region experienced between
1980 and 1990. Authors’ analysis of Moody’s Analytics
data.
55. Authors’ analysis of Moody’s Analytics data.
56. Authors’ analysis of Moody’s Analytics data. Between
the first quarter of 2010 and the fourth quarter of 2011,
corresponding figures would have been a 2.5 percent
gain for the South (compared with an actual gain of
about 2,2 percent), a 1.7 percent gain for the Northeast
(compared with an actual loss of 0.1 percent), and a 1.9
percent gain for the West (compared with an actual gain
of 1.7 percent). Between 2000 and 2010, corresponding
figures would have been a 1.1 percent gain for the South
(compared with an actual loss of 34.2 percent), a 2.2
percent loss for the Northeast (compared with an actual
loss of 36.6 percent), and a 0.6 percent gain for the West
(compared with an actual loss of 29.6 percent).
57. See David Hummels, “Transportation Costs and
International Trade In the Second Era of Globalization,”
Journal of Economic Perspectives 21 (2007): 131-154
(declining transportation costs); Peter B. Meyer and
Kristen R. Yount, “Planning for—and Managing—
Environmental Risks: Fighting “Sprawl” by Stimulating
Brownfield Redevelopment” (Louisville: Center for
Environmental Policy and Management, 2001) (brownfield
reclamation costs); Nisha Mistry and Joan Byron, “The
Federal Role in Supporting Urban Manufacturing”
(Washington: Brookings Institution and Pratt Center for
Community Development, 2011) (use of zoning to exclude
manufacturers); Robert Puentes, A Bridge to Somewhere:
Rethinking American Transportation for the 21st Century
(Washington: Brookings Institution, 2008) (bias toward
highways in federal transportation funding decisions).
58. See also Mercedes. Delgado, Michael E. Porter, and
Scott Stern, “Clusters, Convergence, and Economic
Performance,” unpublished paper, Harvard Business
School, March 2011, available at www.isc.hbs.edu/pdf/
DPS_Clusters_Performance_2011-0311.pdf.
59. Firms that cluster together also impose costs on others
(for example, costs of congestion), and they do not take
these impacts into consideration, either.
60. Helper, Krueger, and Wial, “Why Does Manufacturing
Matter?” p. 21.
61. Indiana Governor Mitch Daniels argued that the right-
to-work law would be a business recruitment tool. After
signing the law, he stated: “Seven years of evidence
and experience ultimately demonstrated that Indiana
did need a right-to-work law to capture jobs for which,
despite our highly-rated business climate, we are not
currently being considered.” Tony Pugh, “Indiana’s New
Right-to-Work law Could Prompt Copycats,” Washington
Post, February 25, 2012, available at www.washington-
post.com/national/indianas-new-right-to-work-law-could-
prompt-copycats/2012/02/19/gIQAadRlaR_story.html. Yet
economic analysis shows that relative union strength
does not seem to explain broader regional shifts in
manufacturing. Controlling for variables such as weather,
right-to-work states have tended to lose manufacturing
employment at about the same rates as other states.
This is true both between and within regions. See Gordon
Lafer, “Working Hard to Make Indiana Look Bad: The
Tortured, Uphill Case for ‘Right-to-Work,’” (Washington:
Economic Policy Institute, 2012).
62. See Timothy Bartik and Randall Eberts, ”The Roles of
Tax Incentives and Other Business Incentives in Local
Economic Development,” in Oxford Handbook of Urban
Economics and Planning, edited by Nancy Brooks, Kieran
Donaghy, and Gerrit-Jan Knaap (New York: Oxford
University Press, 2012), pp. 634-654; Timothy J. Bartik,
”State Economic Development Policies: What Works?”
presented at 19th annual State Fiscal Policy Conference,
Center on Budget and Policy Priorities, Washington,
November 2011.
BROOKINGS | April 2012 57
63. Helper and Wial, “Strengthening”; Helper and Wial,
“Accelerating.”
64. “President Obama to Announce New Efforts to Support
Manufacturing Innovation, Encourage Insourcing,” White
House press release, March 9, 2012.
65. Helper and Wial, “Strengthening”; Helper and Wial,
“Accelerating.”
66. Previous Brookings work estimated the cost of each
state-level center at a relatively modest $9 million per
year initially, with the state contribution expected to
drop over time as the centers obtain funding from other
sources. Helper and Wial, “Accelerating.”
67. Lightweight materials are particularly important for cars;
a 10 percent reduction in vehicle weight could lead to a
6 percent increase in fuel economy for cars (8 percent
for light trucks). See Lynette Cheah, John Heywood, and
Randolph Kirchain, “The Energy Impact of U.S. Passenger
Vehicle Fuel Economy Standards,”, presented at Institute
of Electrical and Electronics Engineers International
Symposium on Sustainable Systems and Technology,
Washington, May 2010.
68. Author interviews in the automotive tooling industry.
69. See Thomas Klier and James Rubenstein, Who Really
Made Your Car? (Kalamazoo, MI: Upjohn Institute for
Employment Research, 2008).
70. See Karen G, Mills, Elisabeth B. Reynolds, and Andrew
Reamer, “Clusters and Competitiveness: A New Federal
Role for Stimulating Regional Economies” (Washington:
Brookings Institution, 2008); and Mark Muro and Kenan
Fikri, “Job Creation on a Budget: How Regional Industry
Clusters Can Add Jobs, Bolster Entrepreneurship, and
Spark Innovation” (Washington: Brookings Institution,
2011).
71. Case Western Reserve University’s Swagelok Center
for Surface Analysis of Materials has addressed this
problem. It houses expensive equipment that a number
of Cleveland-area materials and chemical manufac-
turing firms use for a small fee to conduct research
they were not previously able to do. Karin Connelly,
“Case’s Swagelok Center ‘Best Facility on Planet’ for
Microstructural Analysis,” Fresh Water, March 29, 2012
available at www.freshwatercleveland.com/innovation-
news/scsam032912.aspx
72. Mark Muro and Bruce Katz, “The New ‘Cluster Moment’:
How Regional Innovation Clusters Can Foster the Next
Economy” (Washington: Brookings Institution, 2010).
73. For an overview of these and other programs, see Muro
and Katz, “New ‘Cluster Moment’.” The Rural Jobs
and Innovation Accelerator challenge is described in
“Obama Administration Announces $15 Million Multi-
Agency Challenge To Foster Job Creation and Business
Innovation in Rural Communities Nationwide,” Economic
Development Administration press release, March 8,
2012.
74. Josh Whitford and Jonathan Zeitlin, “Governing
Decentralized Production: Public Policy and the
Prospects for Inter-firm Collaboration in U.S.
Manufacturing,” Industry and Innovation 11 (2004): 11-44.
75. Dan Breznitz and Peter Cowhey, “America’s Two Systems
of Innovation: Recommendations for Policy Changes to
Support Innovation, Production and Job Creation” (San
Diego: CONNECT Innovation Institute, 2012).
76. Ibid.
77. Robert Atkinson and Howard Wial, Boosting Productivity,
Innovation, and Growth through a National Innovation
Foundation (Washington: Brookings Institution and
Information Technology and Innovation Foundation,
2008).
78. Atkinson and Wial, “Boosting.”
79. Commonwealth of Massachusetts, Executive Office of
Housing and Economic Development, “Building Bridges
to Growth: A Roadmap for Advanced Manufacturing in
Massachusetts” (Boston, 2011).
80. Fund for Our Economic Future, “Northeast Ohio Regional
Business Plan Brookings Institution” (n.p., 2011).
81. World Business Chicago, “A Plan for Economic Growth
and Jobs” (Chicago, 2012).
82. See Joseph Cortright’s detailed discussion of how
policymakers should approach industry clusters with
the goal of understanding and enhancing what already
exists. Joseph Cortright, “Making Sense of Clusters:
Regional Competitiveness and Economic Development,”
(Washington: Brookings Institution, 2006).
83. These factors help explain why industries such as print-
ing, which depends upon inputs from other industries
such as law firms and book publishing, continues to
BROOKINGS | April 201258
locate in industrially diverse metropolitan areas such as
New York and Chicago.
84. For example, Harvard Business School professors Gary
Pisano and Willy Shih argue that offshoring of computer
production threatens future competitiveness of areas
such as San Jose in this industry. Gary P. Pisano and Willy
C. Shih, “Restoring American Competitiveness,” Harvard
Business Review, July-August 2009, pp. 2-13.
85. Scholars differ on the relative importance for innovation
of cooperation and competition among firms within a
cluster. Competition may force all firms in a metropolitan
area to improve at a rapid pace or fail—or competition
could promote cutthroat price-cutting. Conversely, a
large number of rivals can create a critical mass that
spawns institutions (such as apprenticeships and uni-
versity research programs) and sophisticated consum-
ers that promote cooperation and continuous learning.
William Lazonick, “Industry Clusters and Global Webs:
Organizational Capabilities in the American Economy,”
Industrial and Corporate Change 2 (1993): 1-24.
86. Brock Yates has argued that the decline of the U.S. auto
industry in Detroit was due in large part to the lack of
outside influence on Detroit Three automakers; they
came to a common and self-reinforcing conception of
what a car should do (be large and have up-to-date
styling) that made it very difficult to understand how to
respond to Japanese competitors who provided cars that
were small and boring but highly reliable and fuel effi-
cient. Brock Yates, The Decline and Fall of the American
Automobile Industry (New York: Empire Books, 1983). See
also Gernot Grabher, “The Weakness of Strong Ties: The
Lock-in of Regional Development in the Ruhr Area,” in
The Embedded Firm: On the Socioeconomics of Industrial
Networks, edited by Gernot Grabher (London: Routledge,
1993) pp. 255-277; Jennifer Clark, Hsin I. Huang, and
John P. Walsh, “A Typology of Innovation Districts: What
it Means for Regional Resilience,” Cambridge Journal of
Regions, Economy and Society 3 (2010): 121-137.
87. See, e.g., Susan Helper and Marcus Stanley, “External
Economies.”
88. Robert Puentes, A Bridge to Somewhere: Rethinking
American Transportation for the 21st Century
(Washington: Brookings Institution, 2008).
89. See Dennis Bellafiore, Maria Cristina Herrera,
and Stephen Herzenberg, “Making Smarter State
Investments” (Harrisburg, PA: Keystone Research Center,
2010).
90. See Philip Mattera and others, Money for Something
(Washington: Good Jobs First, 2011).
91. Since the beginning of the 21st century, Atlanta,
Baltimore, Boston, Los Angeles, Minneapolis, New
York, Portland, and San Jose have rezoned substantial
amounts of their industrial land for other uses. Nisha
Mistry and Joan Byron, “The Federal Role in Supporting
Urban Manufacturing” (Washington: Brookings Institution
and Pratt Center for Community Development, 2011).
92. Some kinds of manufacturing do not mix well with resi-
dential and other and uses. If reducing pollution or noise
from these facilities is too expensive, zoning is justified
as a means of separating the pollution- and noise-
generating activities from other activities. However,
zoning should concentrate on the pollution or noise
rather than categorically excluding all manufacturing,
and it should not be used to exclude manufacturing from
entire metropolitan areas. Chicago and some other large
cities have created planned manufacturing districts; this
approach should be used more widely. See Joel Rast,
“The Promises and Pitfalls of Planned Manufacturing
Districts,” Progressive Planning 190 (Winter 2012), pp.
21-23.
93. Although many have speculated that right-to-work laws
have played a key role in creating manufacturing jobs in
the South and parts of the Intermountain West, economic
analysis shows that rates of growth and decline in a
state’s manufacturing employment are uncorrelated with
right-to-work legislation. Therefore we are skeptical of
attributing much of manufacturing’s relative decline in
any state or region to right-to-work. See Gordon Lafer
and Sylvia Allegetto, “Does ‘Right-to-Work’ Create Jobs?
Answers from Oklahoma,” (Washington: Economic Policy
Institute, 2011). The evidence that low tax rates attract
and promote entrepreneurial activity is similarly scant.
See Scott Shane, “Small Businesses Don’t Choose Low-
Tax States,” Bloomberg Businessweek, April 10, 2012,
available at www.businessweek.com/articles/2012-04-10/
small-businesses-dont-choose-low-tax-states.
94. See Helper, Krueger, and Wial, “Why Does Manufacturing
Matter?” and Helper and Wial, “Strengthening.”
BROOKINGS | April 2012 59
Acknowledgments
This report would not have been possible without the contributions of many people and institu-tions. Rob Atkinson, John Austin, Susan Christopherson, Jennifer Clark, Bruce Katz, Dan Luria, Mark Muro, Rob Puentes, Jonathan Rothwell, Carey Treado, and Ed Wolking provided helpful com-ments on earlier drafts of the report. Siddharth Kulkarni, Niraj Patel, Andrew Loucky, and Alex Warofka provided outstanding research assistance.
JPMorgan Chase generously provided support for this report. The Global Cities Initiative: A Joint Project of Brookings and JPMorgan Chase aims to equip U.S. metropolitan leaders with the data and research, policy ideas, and global connections necessary to make strategic decisions and investments as they work to realize their potential and bolster their metro’s position within the global economy.
The Brookings Metropolitan Policy Program would also like to thank the Alcoa Foundation and the Surdna Foundation for their support of its manufacturing work, as well as the John D. and Catherine T. MacArthur Foundation, the Heinz Endowments, the F.B. Heron Foundation, and the George Gund Foundation, which provide general support for the Program’s research and policy efforts. Finally, we would like to thank the Metropolitan Leadership Council, a network of individ-ual, corporate, and philanthropic investors that provide us financial support but, more impor-tantly, are true intellectual and strategic partners.
For More Information
Susan HelperCarlton Professor of EconomicsCase Western Reserve [email protected]
Howard WialFellowMetropolitan Policy Program at [email protected]
For General Information
Metropolitan Policy Program at Brookings202.797.6139www.brookings.edu/metrotelephone 202.797.6139fax 202.797.2965
The Brookings Institution is a private non-profit organization. Its mission is to conduct high qual-ity, independent research and, based on that research, to provide innovative, practical recommen-dations for policymakers and the public. The conclusions and recommendations of any Brookings publication are solely those of its author(s), and do not reflect the views of the Institution, its management, or its other scholars.
Brookings recognizes that the value it provides to any supporter is in its absolute commitment to quality, independence and impact. Activities supported by its donors reflect this commitment and the analysis and recommendations are not determined by any donation.

1775 Massachusetts Avenue NWWashington D.C. 20036-2188telephone 202.797.6139fax 202.797.2965website www.brookings.edu
202.797.6139www.brookings.edu/metro
BROOKINGS
About the Metropolitan Policy Program at Brookings
Created in 1996, the Brookings Institution’s Metropolitan Policy Program provides decision mak-ers with cutting-edge research and policy ideas for improving the health and prosperity of cities and metropolitan areas including their component cities, suburbs, and rural areas. To learn more visit: www.brookings.edu/metro.


![American Manufacturing [INFOGRAPHIC]](https://img.pdfslide.net/doc/110x75/53e9872e8d7f7289708b4d79/american-manufacturing-infographic.jpg)

![Atmel : American Manufacturing on the Rise [INFOGRAPHIC]](https://img.pdfslide.net/doc/110x75/55a6aa371a28abf4018b45d5/atmel-american-manufacturing-on-the-rise-infographic.jpg)