Embed Size (px)
Citation preview
Location- and lesion-dependent estimation of background tissue complexity for anthropomorphic model observer
Ali R. N. Avanakia, Kathryn S. Espiga, Eddie Knippela, Tom R. L. Kimpeb, Albert Xthonaa,
Andrew D. A. Maidmentc
aBarco Healthcare, Beaverton, OR; bBarco Healthcare, Kortrijk, Belgium; cUniversity of Pennsylvania, Philadelphia, PA
ABSTRACT
In this paper, we specify a notion of background tissue complexity (BTC) as perceived by a human observer that is suited for use with model observers. This notion of BTC is a function of image location and lesion shape and size. We propose four unsupervised BTC estimators based on: (i) perceived pre- and post-lesion similarity of images, (ii) lesion border analysis (LBA; conspicuous lesion should be brighter than its surround), (iii) tissue anomaly detection, and (iv) mammogram density measurement. The latter two are existing methods we adapt for location- and lesion-dependent BTC estimation. To validate the BTC estimators, we ask human observers to measure BTC as the visibility threshold amplitude of an inserted lesion at specified locations in a mammogram. Both human-measured and computationally estimated BTC varied with lesion shape (from circular to oval), size (from small circular to larger circular), and location (different points across a mammogram). BTCs measured by different human observers are correlated (ρ=0.67). BTC estimators are highly correlated to each other (0.84<ρ<0.95) and less so to human observers (ρ<=0.81). With change in lesion shape or size, estimated BTC by LBA changes in the same direction as human-measured BTC. A generalization of proposed methods for viewing breast tomosynthesis sequences in cine mode is outlined. The proposed estimators, as-is or customized to a specific human observer, may be used to construct a BTC-aware model observer, with applications such as optimization of contrast-enhanced medical imaging systems, and creation of a diversified image dataset with characteristics of a desired population. Keywords: Human visual system properties, anthropomorphic numerical observer, virtual clinical trials, QUEST adaptive threshold seeking
1. INTRODUCTION Validation of a medical imaging system is challenging due to the large number of system parameters that must be considered. Conventional methods involving clinical trials are limited by cost and duration, and in the instance of systems using ionizing radiation, the requirement for the repeated irradiation of volunteers. We are proponents of an alternative, in the form of Virtual Clinical Trials (VCTs) based on models of human anatomy, image acquisition, display and processing, and image analysis and interpretation. In a joint effort, a team of researchers at University of Pennsylvania is working on the first half of this pipeline [7, 8, 9] which includes anatomy and image simulation, and a team of researchers at Barco is working on the second half which includes display simulation and model observer. Barco has developed anthropomorphic model observers that predict typical human observers better than commonly used model observers which are designed after ideal observers with some concessions for computational tractability. Previously we reported [1, 2] that by embedding properties of human visual system (HVS) as pre-processing steps to a commonly used model observer (multi-slice channelized Hotelling observer – msCHO [3]), the model observer can better track the performance of a human observer with changes in viewing distance, display contrast, and browsing speed when reading digital breast tomosynthesis (DBT) images.
Medical Imaging 2016: Image Perception, Observer Performance, and Technology Assessment, edited by Craig K. Abbey, Matthew A. Kupinski, Proc. of SPIE Vol. 9787, 97870A
© 2016 SPIE · CCC code: 1605-7422/16/$18 · doi: 10.1117/12.2217612
Proc. of SPIE Vol. 9787 97870A-1
Downloaded From: http://spiedigitallibrary.org/ on 07/15/2016 Terms of Use: http://spiedigitallibrary.org/ss/TermsOfUse.aspx
In this paperhereafter). Aat various BTvaries considobserver’s cadesign and/orelative to ththus lesion vautomatic me We believe tbelow. These 1.1 BTC is a
The notion odetected) thaspatiotemporlesion does n 1.2 BTC de
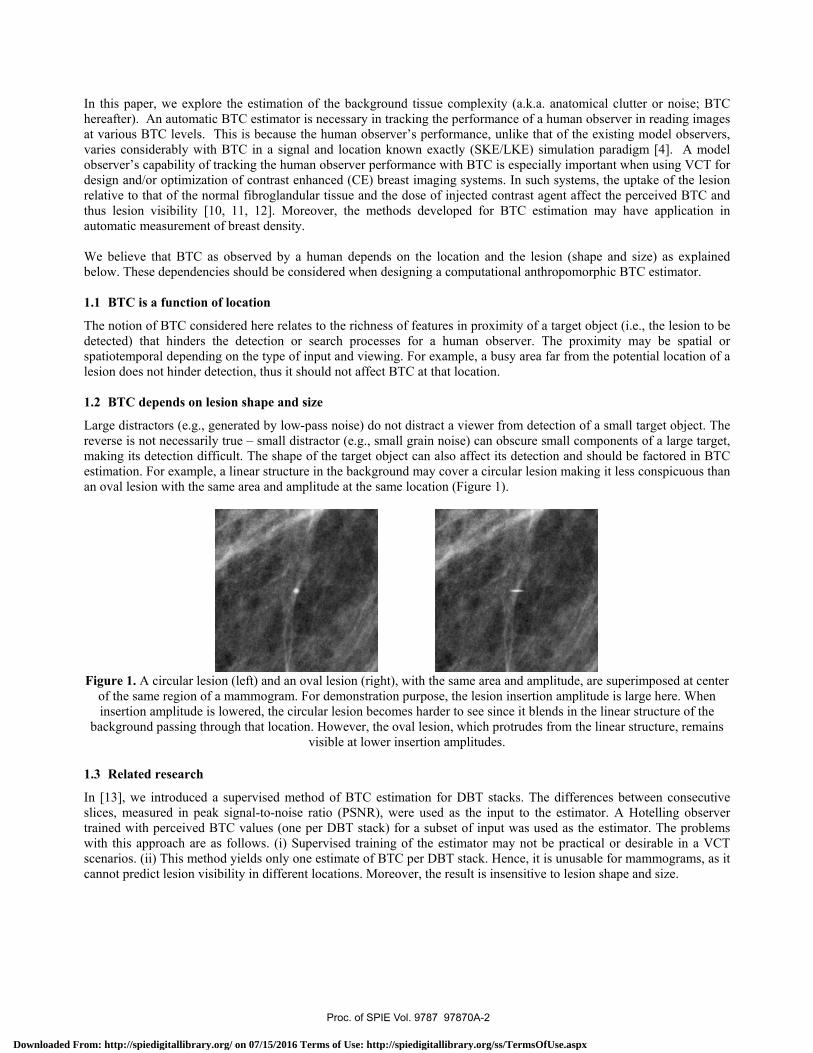
Large distracreverse is nomaking its deestimation. Fan oval lesion
Figure 1. A of the saminsertion a
background
1.3 Related
In [13], we islices, measutrained with with this appscenarios. (iicannot predic
r, we explore tAn automatic BTC levels. Thderably with Bapability of tracr optimization
hat of the normvisibility [10, easurement of
that BTC as oe dependencies
a function of l
f BTC consideat hinders theral depending onot hinder detec
pends on lesio
ctors (e.g., genet necessarily tretection difficu
For example, a n with the sam
circular lesion me region of a mamplitude is lod passing throug
research
introduced a sured in peak sperceived BTC
proach are as f) This method ct lesion visibil
the estimation BTC estimator i
is is because thBTC in a signacking the humaof contrast en
mal fibroglandu11, 12]. Morbreast density.
observed by a s should be con
location
ered here relate detection or on the type of iction, thus it sh
on shape and s
erated by low-rue – small disult. The shape linear structure
me area and amp
(left) and an omammogram. Fwered, the circgh that location
upervised metsignal-to-noise C values (one follows. (i) Suyields only onlity in differen
of the backgris necessary inhe human obse
al and locationan observer pe
nhanced (CE) bular tissue and reover, the me
human dependnsidered when
es to the richnesearch proces
input and viewhould not affec
size
-pass noise) dostractor (e.g., smof the target oe in the backgrplitude at the s
oval lesion (rigFor demonstratcular lesion becn. However, thvisible at low
thod of BTC eratio (PSNR)per DBT stack
upervised trainine estimate of Bnt locations. Mo
round tissue con tracking the perver’s perform
n known exactlerformance witbreast imagingthe dose of inj
ethods develop
ds on the locadesigning a co
ess of features sses for a hum
wing. For examct BTC at that l
o not distract a mall grain nois
object can also round may covame location (
ht), with the sation purpose, thcomes harder the oval lesion, er insertion am
estimation for , were used ask) for a subseting of the estiBTC per DBT oreover, the res
omplexity (a.kperformance ofmance, unlike ly (SKE/LKE)th BTC is especg systems. In sujected contrastped for BTC
ation and the lomputational an
in proximity oman observer.
mple, a busy arelocation.
viewer from dse) can obscureaffect its dete
ver a circular leFigure 1).
ame area and ahe lesion insertto see since it bwhich protrude
mplitudes.
DBT stacks. Ts the input to t of input was mator may nostack. Hence, sult is insensiti
k.a. anatomical f a human obsethat of the exi
) simulation pacially importanuch systems, tht agent affect testimation ma
lesion (shape anthropomorphi
of a target objec. The proximiea far from the
detection of a se small compo
ection and shouesion making it
amplitude, are stion amplitudeblends in the lines from the lin
The differencethe estimator.used as the es
ot be practical it is unusable five to lesion sh
clutter or noierver in readingsting model obaradigm [4]. Ant when using he uptake of ththe perceived Bay have applic
and size) as eic BTC estimat
ct (i.e., the lesiity may be sp
e potential loca
small target objonents of a larguld be factoredt less conspicu
superimposed ae is large here. Wnear structure o
near structure, r
s between con A Hotelling
stimator. The por desirable infor mammograhape and size.
ise; BTC g images bservers, A model VCT for he lesion BTC and cation in
xplained tor.
ion to be patial or ation of a
ject. The ge target, d in BTC uous than
at center When of the remains
nsecutive observer
problems n a VCT ams, as it
Proc. of SPIE Vol. 9787 97870A-2
Downloaded From: http://spiedigitallibrary.org/ on 07/15/2016 Terms of Use: http://spiedigitallibrary.org/ss/TermsOfUse.aspx

(1) = ( ( , ) ( , ) )( , ) ( , ) ( , ) In (1), T is the modulation transfer function, W is the task function, NNPS is the normalized “noise” power spectrum (noise includes an anatomical component due to breast structure), and (u,v) are spatial frequencies. dlocal is calculated for non-overlapping regions of interest (ROIs) of the input mammogram. Direct calculation of the NNPS for each ROI is not possible. Therefore, a model of NNPS [20] is calibrated using the noise measured for each ROI. Considering that the numerator of (1) is independent of the ROI, for a given mammogram and a given system, dlocal is inversely proportional to ROI energy (i.e., local energy of the image). Note that this method is unsupervised and local (i.e., provides local complexity information) and is shown to perform worse the supervised BTC estimator in [13].
To locate anomalies in phantom CT images, Pezeshk et al performed principal component analysis (PCA) over all overlapping ROIs across various scales, and identified the anomaly ROIs as those far from mean ROI in PCA coordinate system [14]. They also showed that the phase-only-transform (PHOT), defined below, functions similarly.
(2) { } = { }‖ { }‖
In (2), I is the input image, ||.|| denotes absolute value (of complex number), and F and F-1 denote forward and inverse 2D Fourier transform. The density of anomalies (considered potential lesions) calculated as such may be used as a local and unsupervised BTC estimate.
2. METHODS2.1 Estimate BTC as pre- and post-lesion perceptual similarity (P3S)
In this method, to estimate BTC, we first superimpose the lesion at the location in question with a fixed amplitude. Next, we compare the post-lesion and pre-lesion images using structural similarity metric (SSIM), a perceptual image similarity metric [15], defined below.
(3) ( , ) = (2 + )(2 + )( + + )( + + )In (3), and are input signals (e.g., image ROI pre- and post-lesion), and indicate average and standard deviation,
is the signals’ covariance, and and are small positive constants keeping the denominator non-zero. We consider the perceptual similarity calculated as such as a predictor of BTC at the given location, for the given lesion. This is based on the premise that the greater the BTC, the less noticeable adding a lesion will be; thus, the more similar are the pre- and post-lesion images. For better sensitivity of the estimate, only ROIs centered on the given location are compared. ROI size may be tuned for the desired estimation accuracy and sensitivity.
2.2 BTC estimator based on lesion border analysis (LBA)
This method is based on the premise that BTC is correlated with the amplitude required to superimpose the given lesion at a given location conspicuously (i.e., the more complex the background, the higher insertion amplitude needed for visibility). The superimposed lesion should be brighter than its immediate surround to be conspicuous. For a binary lesion, the surround is easily defined
wherever there is no lesion (Figure 2). Since far regions of background should not affect local BTC, we use a distance weighting function. Real lesions are not binary (Figure 3). For such lesion, we calculate the surround mask by inverting the lesion and applying a distance weighting function, yielding an immediate surround mask. To estimate BTC at a given location, we multiply the background by the immediate surround mask centered at the location and use the maximum of the product as a predictor of BTC. The distance weighting function may be tuned for desired estimation performance.
Maiprize et al proposed a local signal to noise ratio, dlocal defined below, as a measure of apparent mammogram density, hence a metric for potential masking of a lesion [6]:
Proc. of SPIE Vol. 9787 97870A-3
Downloaded From: http://spiedigitallibrary.org/ on 07/15/2016 Terms of Use: http://spiedigitallibrary.org/ss/TermsOfUse.aspx
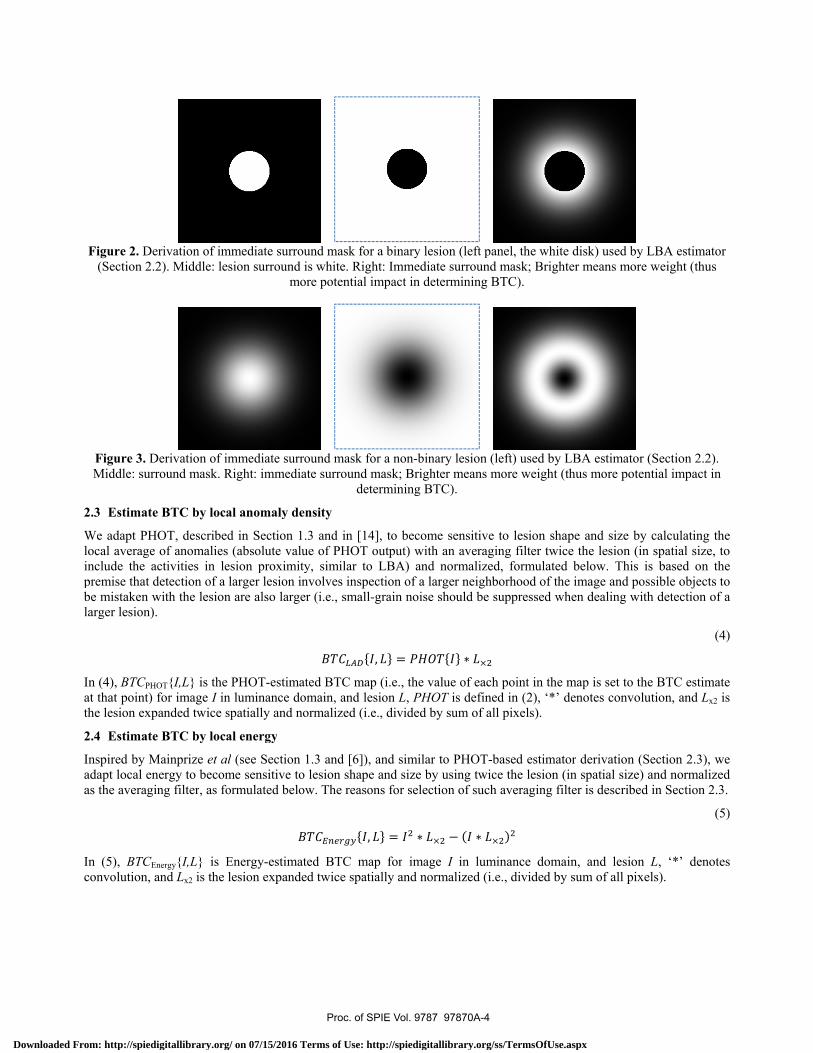
Figure 2. D(Section 2
Figure 3. DMiddle: sur
2.3 Estimat
We adapt PHlocal averageinclude the apremise that be mistaken wlarger lesion)
In (4), BTCPHat that point)the lesion exp
2.4 Estimat
Inspired by Madapt local enas the averag
In (5), BTCEconvolution,
erivation of im.2). Middle: le
Derivation of imrround mask. R
e BTC by loca
HOT, describede of anomaliesactivities in ledetection of a with the lesion).
HOT{I,L} is the ) for image I inpanded twice s
e BTC by loca
Mainprize et alnergy to becom
ging filter, as fo
Energy{I,L} is Eand Lx2 is the l
mmediate surrousion surround
mo
mmediate surrRight: immedia
al anomaly de
d in Section 1 (absolute valu
esion proximitylarger lesion in
n are also large
PHOT-estiman luminance dospatially and no
al energy
l (see Section me sensitive toormulated belo
Energy-estimatlesion expande
und mask for ais white. Right
ore potential im
ound mask forate surround m
deter
ensity
.3 and in [14],ue of PHOT ouy, similar to Lnvolves inspecer (i.e., small-g
{ ,ated BTC map omain, and lesiormalized (i.e.
1.3 and [6]), ao lesion shape aow. The reason
{ , }ted BTC maped twice spatia
a binary lesion t: Immediate su
mpact in determ
r a non-binary lmask; Brighter m
rmining BTC).
, to become seutput) with an LBA) and nortion of a larger
grain noise shou
} = { }(i.e., the value ion L, PHOT is, divided by su
and similar to Pand size by usis for selection
} = ∗ for image Illy and normal
(left panel, the
urround mask; mining BTC).
lesion (left) usemeans more we.
ensitive to lesioaveraging filte
rmalized, formr neighborhooduld be suppres
} ∗
of each point s defined in (2
um of all pixels
PHOT-based eing twice the leof such averag
( ∗ )
in luminance lized (i.e., divid
e white disk) uBrighter mean
ed by LBA esteight (thus mor
on shape and er twice the le
mulated below.d of the image ssed when deal
in the map is s2), ‘*’ denotes s).
stimator derivaesion (in spatiaging filter is de
domain, and ded by sum of
used by LBA esns more weight
timator (Sectiore potential im
size by calculasion (in spatial This is basedand possible o
ling with detec
set to the BTC convolution, a
ation (Section al size) and norescribed in Sect
lesion L, ‘*’ all pixels).
stimator t (thus
n 2.2). mpact in
ating the l size, to d on the
objects to ction of a
(4)
estimate and Lx2 is
2.3), we rmalized tion 2.3.
(5)
denotes
Proc. of SPIE Vol. 9787 97870A-4
Downloaded From: http://spiedigitallibrary.org/ on 07/15/2016 Terms of Use: http://spiedigitallibrary.org/ss/TermsOfUse.aspx
2.5 Human measurement of BTC
To measure BTC at a specific point, p, a human observer may adjust the insertion amplitude of the given lesion until it becomes visible. To find the insertion amplitude corresponding to threshold visibility, we use QUEST [16], an adaptive threshold seeking procedure. As compared to adjusting the amplitude manually, QUEST is more convenient for the user and yields a more accurate threshold as well as its confidence interval. We use a Matlab implementation of QUEST available from http://psychtoolbox.org with the default value of parameters and 41 trials per threshold measurement (40 is the typical number of trials used in QUEST example; we added one for reasons explained below).
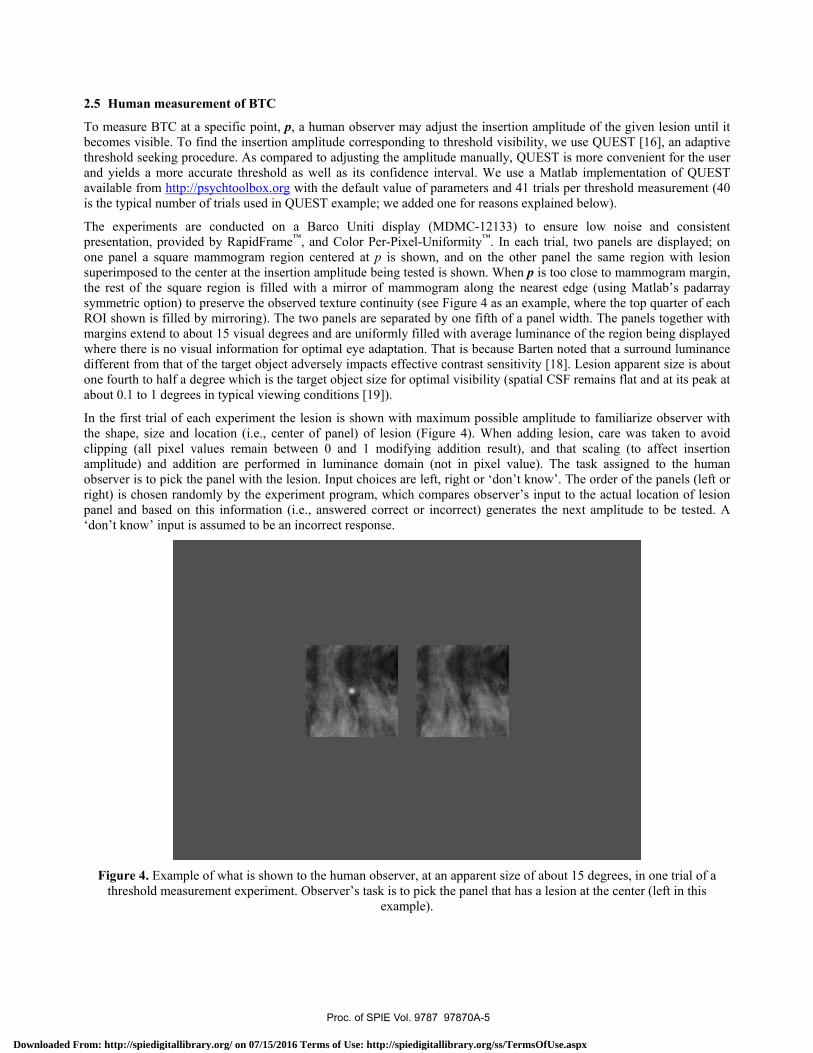
The experiments are conducted on a Barco Uniti display (MDMC-12133) to ensure low noise and consistent presentation, provided by RapidFrame™, and Color Per-Pixel-Uniformity™. In each trial, two panels are displayed; on one panel a square mammogram region centered at p is shown, and on the other panel the same region with lesion superimposed to the center at the insertion amplitude being tested is shown. When p is too close to mammogram margin, the rest of the square region is filled with a mirror of mammogram along the nearest edge (using Matlab’s padarray symmetric option) to preserve the observed texture continuity (see Figure 4 as an example, where the top quarter of each ROI shown is filled by mirroring). The two panels are separated by one fifth of a panel width. The panels together with margins extend to about 15 visual degrees and are uniformly filled with average luminance of the region being displayed where there is no visual information for optimal eye adaptation. That is because Barten noted that a surround luminance different from that of the target object adversely impacts effective contrast sensitivity [18]. Lesion apparent size is about one fourth to half a degree which is the target object size for optimal visibility (spatial CSF remains flat and at its peak at about 0.1 to 1 degrees in typical viewing conditions [19]).
In the first trial of each experiment the lesion is shown with maximum possible amplitude to familiarize observer with the shape, size and location (i.e., center of panel) of lesion (Figure 4). When adding lesion, care was taken to avoid clipping (all pixel values remain between 0 and 1 modifying addition result), and that scaling (to affect insertion amplitude) and addition are performed in luminance domain (not in pixel value). The task assigned to the human observer is to pick the panel with the lesion. Input choices are left, right or ‘don’t know’. The order of the panels (left or right) is chosen randomly by the experiment program, which compares observer’s input to the actual location of lesion panel and based on this information (i.e., answered correct or incorrect) generates the next amplitude to be tested. A ‘don’t know’ input is assumed to be an incorrect response.
Figure 4. Example of what is shown to the human observer, at an apparent size of about 15 degrees, in one trial of a
threshold measurement experiment. Observer’s task is to pick the panel that has a lesion at the center (left in this example).
Proc. of SPIE Vol. 9787 97870A-5
Downloaded From: http://spiedigitallibrary.org/ on 07/15/2016 Terms of Use: http://spiedigitallibrary.org/ss/TermsOfUse.aspx
QUEST generates the probability distribution function (PDF) for the threshold being measured. In each experiment, we record mean and standard deviation of the threshold PDF.
2.6 Evaluation
For a given mammogram, we generate BTC maps using P3S, LBA, PHOT-based, and energy-based estimators described above. The pixel value at each point in the map is set to the BTC estimate using a certain method for the mammogram at that point and for the given lesion. We inspect the proposed methods by checking variation of their maps with location, and lesion shape and size, per the design criteria set out in Section 1. For the BTC maps to become comparable, we perform histogram equalization on the maps generated by each method. Thus, each the value at each point becomes approximately (because number of bins used in histogram equalization is smaller than the number of possible BTC values) proportional to the BTC rank within the maps generated by each method.
We compare the proposed methods against the human observers as follows. Since measuring BTC for a human is time consuming, generation of full BTC maps (for comparison against maps by proposed methods) using a human observer is not practical. Assuming that the proposed methods are good estimators, the BTC maps they generate are highly correlated. Thus, we use the computationally generated maps to pick a set of interesting points for BTC estimation by human as follows:
(i) The point with the highest sensitivity to shape (i.e., the map for small circular and oval lesions differ most),
(ii) The point with the highest sensitivity to size (i.e., the map for small and large circular lesions differ most),
(iii) The point where one BTC estimate most greatly exceeds the maximum of the other three (e.g., arg max{BTCPHOT-based – max{BTCEnergy-based, BTCLBA, BTCP3S}}, where both max operators are point-wise and across all pixels), and
(iv) The point where the minimum of three BTC estimates most greatly exceeds the fourth (e.g., arg max{min{BTCEnergy-based, BTCLBA, BTCP3S} – BTCPHOT-based}, where max & min operators are point-wise and across all pixels).
Since we proposed four methods, human observer has to estimate BTC at maximum (assuming no redundancy) sixteen points with the small circular lesion, at four points in category (i) with the oval lesion, and at four points in category (ii) with the large circular lesion.
To check our assumption on good quality of the proposed BTC estimators, in addition to the interesting points above, we measure BTC on ten randomly picked points and inspect the correlation of the measurements with the BTC estimates by proposed methods at those points.
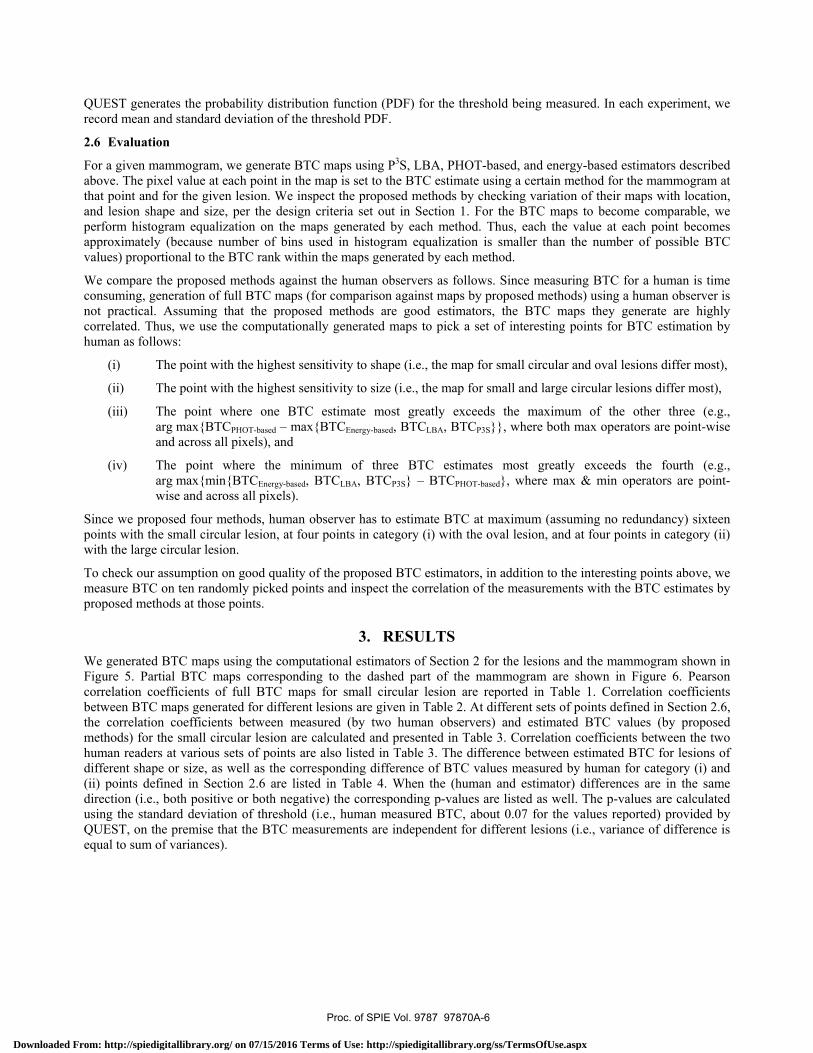
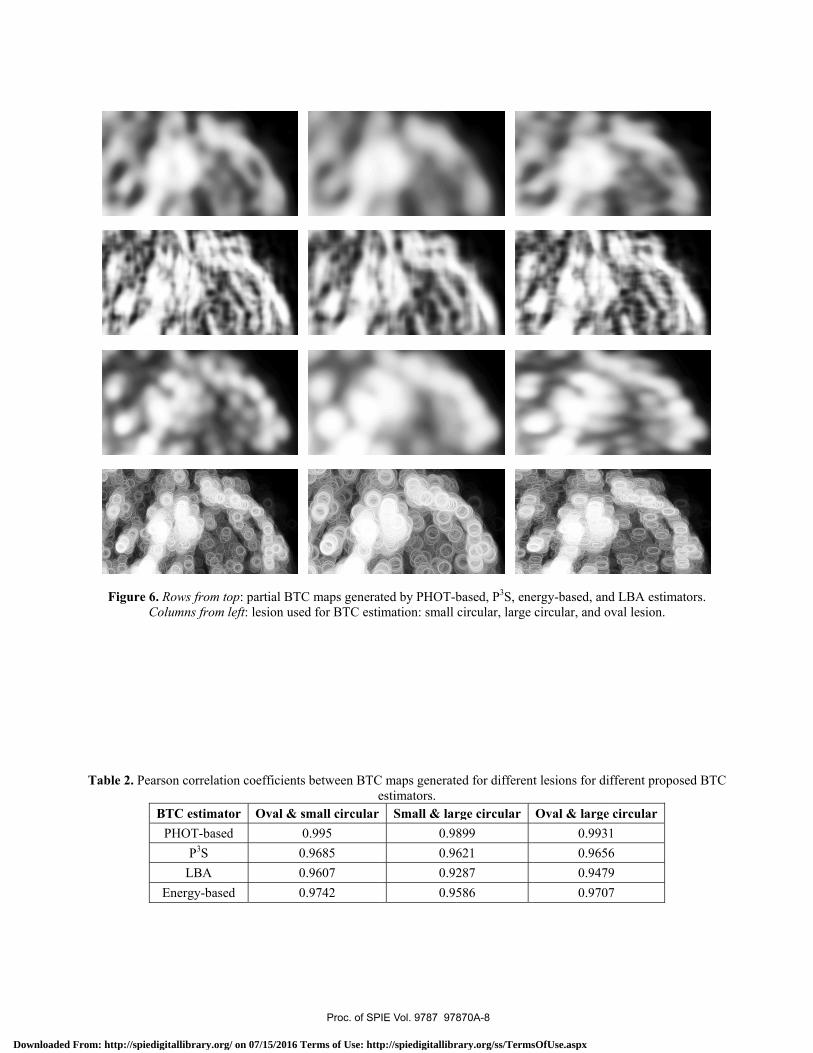
3. RESULTS We generated BTC maps using the computational estimators of Section 2 for the lesions and the mammogram shown in Figure 5. Partial BTC maps corresponding to the dashed part of the mammogram are shown in Figure 6. Pearson correlation coefficients of full BTC maps for small circular lesion are reported in Table 1. Correlation coefficients between BTC maps generated for different lesions are given in Table 2. At different sets of points defined in Section 2.6, the correlation coefficients between measured (by two human observers) and estimated BTC values (by proposed methods) for the small circular lesion are calculated and presented in Table 3. Correlation coefficients between the two human readers at various sets of points are also listed in Table 3. The difference between estimated BTC for lesions of different shape or size, as well as the corresponding difference of BTC values measured by human for category (i) and (ii) points defined in Section 2.6 are listed in Table 4. When the (human and estimator) differences are in the same direction (i.e., both positive or both negative) the corresponding p-values are listed as well. The p-values are calculated using the standard deviation of threshold (i.e., human measured BTC, about 0.07 for the values reported) provided by QUEST, on the premise that the BTC measurements are independent for different lesions (i.e., variance of difference is equal to sum of variances).
Proc. of SPIE Vol. 9787 97870A-6
Downloaded From: http://spiedigitallibrary.org/ on 07/15/2016 Terms of Use: http://spiedigitallibrary.org/ss/TermsOfUse.aspx
Figure 5Bottom: ma
Table
5. Top: Lesionsammogram use
1. Pearson cor
s used in the exed in the experi
rrelation coeffiBTC ePHOT
PL
xperiments, enliments. Partial
icient between stimator PT-based 0.8P3S
LBA
larged. OriginaBTC maps sho
full BTC mapP3S LBA 8433 0.9485
0.8941
al sizes are 29 xown in Figure
s generated byEnergy-bas
0.9054 0.8882 0.9222
x 29, 41 x 41, a6 correspond t
y the proposed Bsed
and 21 x 41 pixto the dashed p
BTC estimator
xels.
portion.
rs.
Proc. of SPIE Vol. 9787 97870A-7
Downloaded From: http://spiedigitallibrary.org/ on 07/15/2016 Terms of Use: http://spiedigitallibrary.org/ss/TermsOfUse.aspx
71
I
1
ilI
1
Figure 6C
Table 2. Pea
6. Rows from toColumns from
arson correlatio
BTC estimatPHOT-based
P3S LBA
Energy-base
op: partial BTCleft: lesion use
on coefficients
tor Oval & sd 0
00
ed 0
C maps generated for BTC esti
s between BTCe
small circular0.995
0.9685 0.9607 0.9742
ted by PHOT-bimation: small
C maps generatestimators.
Small & lar0.90.960.920.95
based, P3S, enecircular, large
ed for differen
rge circular 899 621 287 586
ergy-based, ancircular, and o
nt lesions for di
Oval & large0.9930.9650.9470.970
d LBA estimatoval lesion.
ifferent propos
e circular 1 6 9 7
tors.
ed BTC
Proc. of SPIE Vol. 9787 97870A-8
Downloaded From: http://spiedigitallibrary.org/ on 07/15/2016 Terms of Use: http://spiedigitallibrary.org/ss/TermsOfUse.aspx
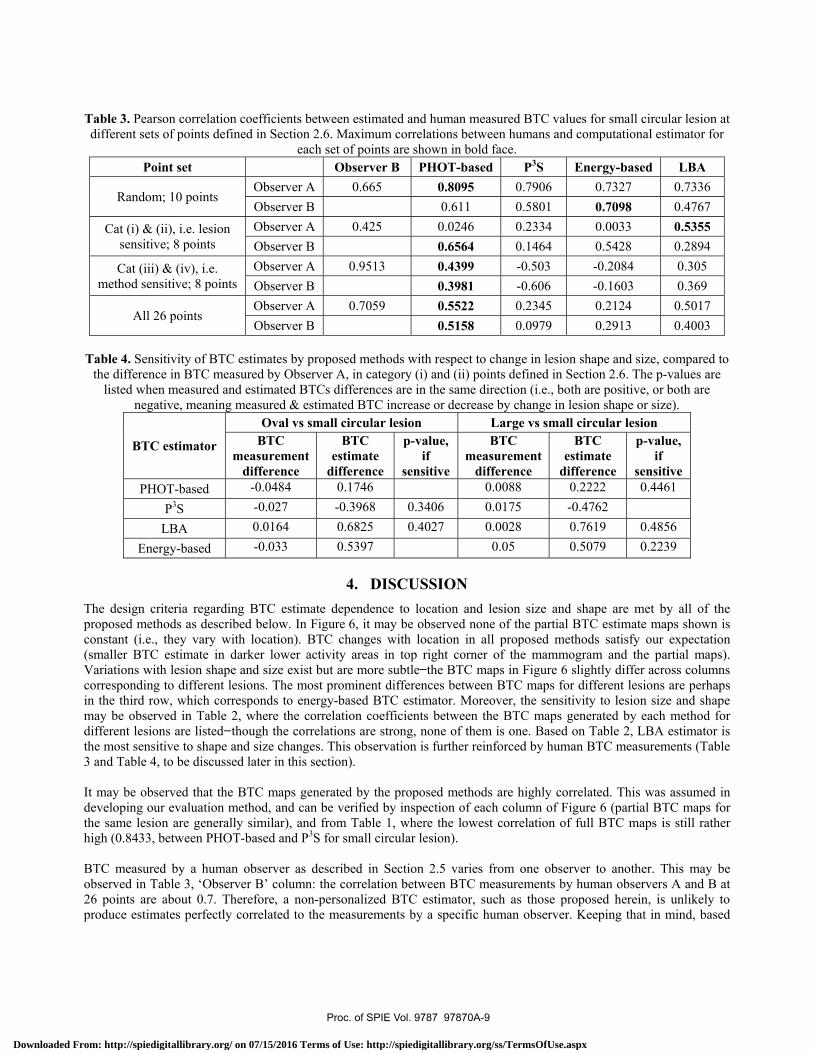
Table 3. Pearson correlation coefficients between estimated and human measured BTC values for small circular lesion at different sets of points defined in Section 2.6. Maximum correlations between humans and computational estimator for
each set of points are shown in bold face. Point set Observer B PHOT-based P3S Energy-based LBA
Random; 10 points Observer A 0.665 0.8095 0.7906 0.7327 0.7336 Observer B 0.611 0.5801 0.7098 0.4767
Cat (i) & (ii), i.e. lesion sensitive; 8 points
Observer A 0.425 0.0246 0.2334 0.0033 0.5355 Observer B 0.6564 0.1464 0.5428 0.2894
Cat (iii) & (iv), i.e. method sensitive; 8 points
Observer A 0.9513 0.4399 -0.503 -0.2084 0.305 Observer B 0.3981 -0.606 -0.1603 0.369
All 26 points Observer A 0.7059 0.5522 0.2345 0.2124 0.5017 Observer B 0.5158 0.0979 0.2913 0.4003
Table 4. Sensitivity of BTC estimates by proposed methods with respect to change in lesion shape and size, compared to
the difference in BTC measured by Observer A, in category (i) and (ii) points defined in Section 2.6. The p-values are listed when measured and estimated BTCs differences are in the same direction (i.e., both are positive, or both are
negative, meaning measured & estimated BTC increase or decrease by change in lesion shape or size).
BTC estimator
Oval vs small circular lesion Large vs small circular lesion BTC
measurement difference
BTC estimate
difference
p-value, if
sensitive
BTC measurement
difference
BTC estimate
difference
p-value, if
sensitive PHOT-based -0.0484 0.1746 0.0088 0.2222 0.4461
P3S -0.027 -0.3968 0.3406 0.0175 -0.4762 LBA 0.0164 0.6825 0.4027 0.0028 0.7619 0.4856
Energy-based -0.033 0.5397 0.05 0.5079 0.2239
4. DISCUSSION The design criteria regarding BTC estimate dependence to location and lesion size and shape are met by all of the proposed methods as described below. In Figure 6, it may be observed none of the partial BTC estimate maps shown is constant (i.e., they vary with location). BTC changes with location in all proposed methods satisfy our expectation (smaller BTC estimate in darker lower activity areas in top right corner of the mammogram and the partial maps). Variations with lesion shape and size exist but are more subtle the BTC maps in Figure 6 slightly differ across columns corresponding to different lesions. The most prominent differences between BTC maps for different lesions are perhaps in the third row, which corresponds to energy-based BTC estimator. Moreover, the sensitivity to lesion size and shape may be observed in Table 2, where the correlation coefficients between the BTC maps generated by each method for different lesions are listed though the correlations are strong, none of them is one. Based on Table 2, LBA estimator is the most sensitive to shape and size changes. This observation is further reinforced by human BTC measurements (Table 3 and Table 4, to be discussed later in this section). It may be observed that the BTC maps generated by the proposed methods are highly correlated. This was assumed in developing our evaluation method, and can be verified by inspection of each column of Figure 6 (partial BTC maps for the same lesion are generally similar), and from Table 1, where the lowest correlation of full BTC maps is still rather high (0.8433, between PHOT-based and P3S for small circular lesion). BTC measured by a human observer as described in Section 2.5 varies from one observer to another. This may be observed in Table 3, ‘Observer B’ column: the correlation between BTC measurements by human observers A and B at 26 points are about 0.7. Therefore, a non-personalized BTC estimator, such as those proposed herein, is unlikely to produce estimates perfectly correlated to the measurements by a specific human observer. Keeping that in mind, based
Proc. of SPIE Vol. 9787 97870A-9
Downloaded From: http://spiedigitallibrary.org/ on 07/15/2016 Terms of Use: http://spiedigitallibrary.org/ss/TermsOfUse.aspx
on the first menergy-basedSection 2.6, cor higher; i.epertaining to
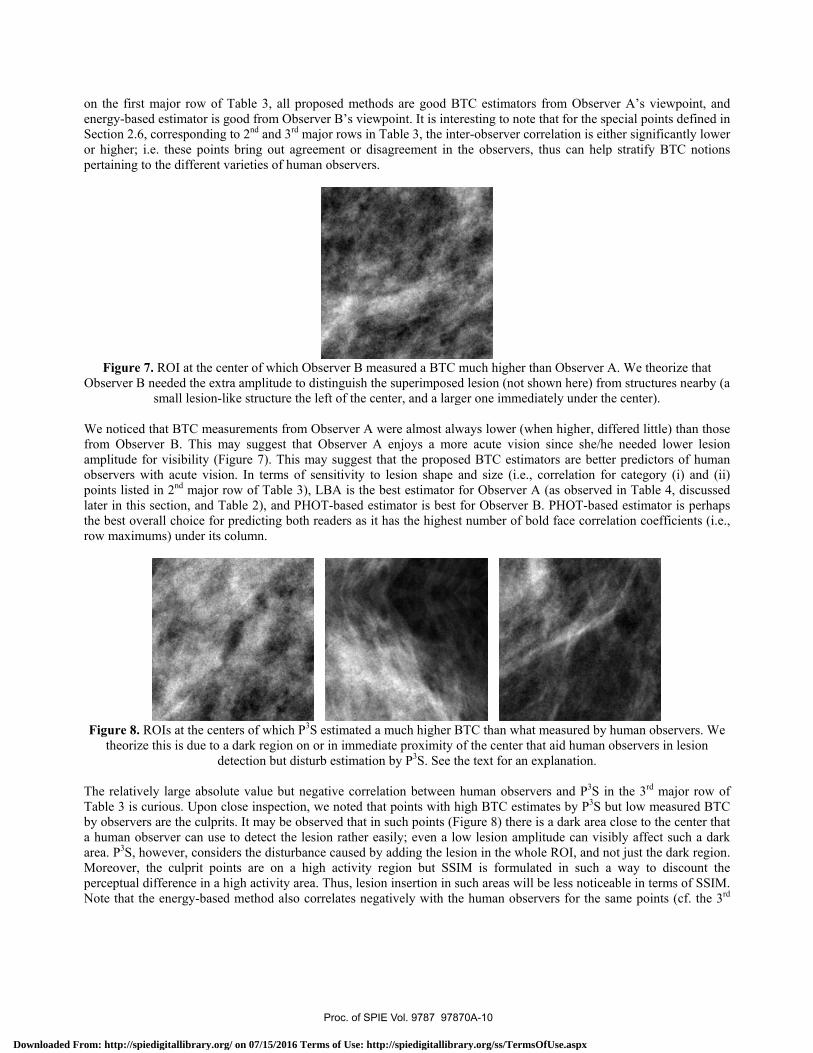
Figure 7.Observer B n
We noticed tfrom Observamplitude foobservers wipoints listed later in this sthe best overrow maximum
Figure 8. Rtheorize
The relativelTable 3 is cuby observers a human obsarea. P3S, hoMoreover, thperceptual diNote that the
major row of Td estimator is gcorresponding e. these pointsthe different v
. ROI at the cenneeded the extrsmall lesion-li
that BTC measver B. This mor visibility (Fiith acute visionin 2nd major ro
section, and Tarall choice for ms) under its c
OIs at the centthis is due to a
de
ly large absoluurious. Upon cl
are the culpritserver can use wever, considehe culprit poinifference in a he energy-based
Table 3, all prgood from Obse
to 2nd and 3rd ms bring out agrvarieties of hum
nter of which Ora amplitude toike structure th
surements fromay suggest thaigure 7). This n. In terms ofow of Table 3)able 2), and PHpredicting both
column.
ters of which Pa dark region onetection but dis
ute value but nlose inspectionts. It may be obto detect the l
ers the disturbants are on a hhigh activity ard method also
roposed methoerver B’s viewmajor rows in Treement or disman observers.
Observer B meo distinguish thhe left of the ce
m Observer A wat Observer Amay suggest th
f sensitivity to), LBA is the bHOT-based esth readers as it
P3S estimated an or in immedisturb estimation
negative correlan, we noted thabserved that inlesion rather eaance caused byhigh activity rea. Thus, lesiocorrelates nega
ods are good Bwpoint. It is inte
Table 3, the intsagreement in
easured a BTC he superimposeenter, and a larg
were almost alwA enjoys a mo
hat the propos lesion shape best estimator timator is best has the highes
a much higher Biate proximity n by P3S. See t
ation between at points with hn such points (Fasily; even a loy adding the lesregion but SSn insertion in satively with th
BTC estimatorseresting to noteter-observer cothe observers,
much higher t
ed lesion (not sger one immed
ways lower (wore acute visiosed BTC estimand size (i.e., for Observer Afor Observer
st number of b
BTC than whatof the center ththe text for an e
human observhigh BTC estimFigure 8) there ow lesion ampsion in the whoIM is formulasuch areas willhe human obse
s from Observe that for the sporrelation is eit, thus can help
than Observer Ahown here) fro
diately under th
when higher, difon since she/hemators are bette
correlation foA (as observedB. PHOT-baseold face correl
t measured by hat aid human explanation.
vers and P3S inmates by P3S bis a dark area
plitude can visiole ROI, and nated in such al be less noticeervers for the s
ver A’s viewpopecial points dether significantp stratify BTC
A. We theorizeom structures nhe center).
ffered little) the needed loweer predictors oor category (i)d in Table 4, ded estimator islation coefficie
human observobservers in le
n the 3rd majobut low measurclose to the ceibly affect suc
not just the darka way to discoeable in terms osame points (cf
oint, and efined in tly lower
C notions
e that nearby (a
han those er lesion
of human and (ii)
discussed perhaps
ents (i.e.,
vers. We esion
r row of red BTC enter that ch a dark k region. ount the of SSIM. f. the 3rd
Proc. of SPIE Vol. 9787 97870A-10
Downloaded From: http://spiedigitallibrary.org/ on 07/15/2016 Terms of Use: http://spiedigitallibrary.org/ss/TermsOfUse.aspx
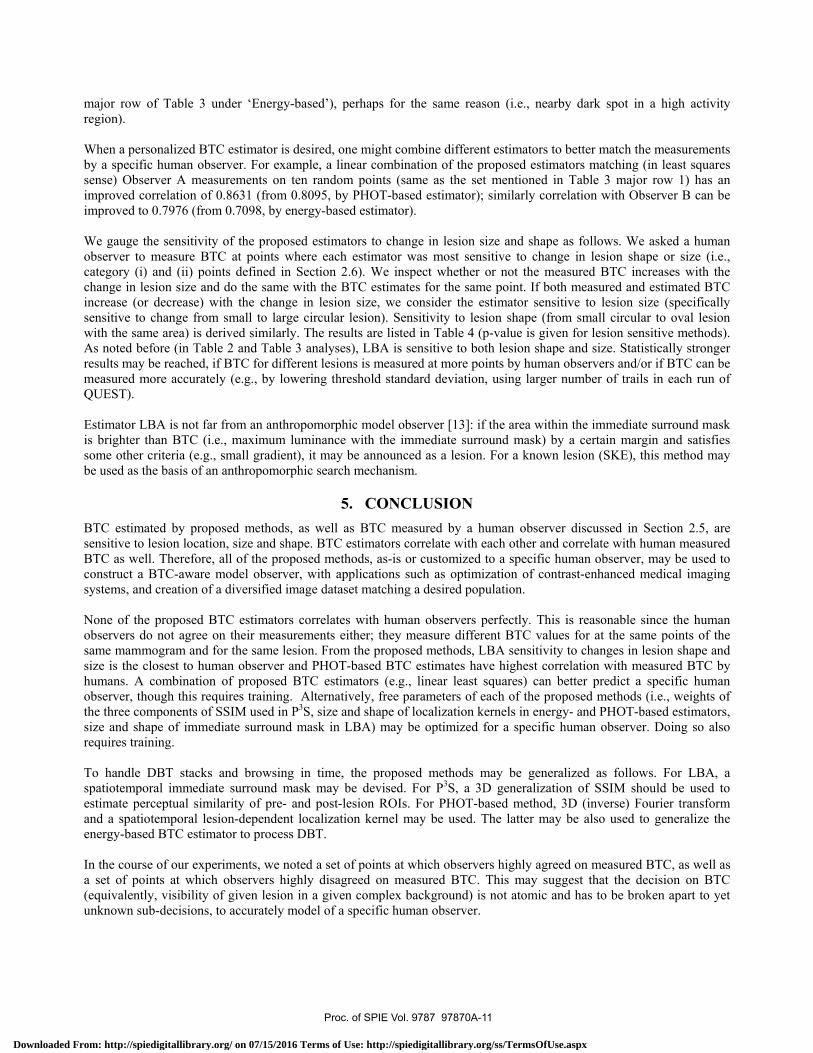
major row of Table 3 under ‘Energy-based’), perhaps for the same reason (i.e., nearby dark spot in a high activity region). When a personalized BTC estimator is desired, one might combine different estimators to better match the measurements by a specific human observer. For example, a linear combination of the proposed estimators matching (in least squares sense) Observer A measurements on ten random points (same as the set mentioned in Table 3 major row 1) has an improved correlation of 0.8631 (from 0.8095, by PHOT-based estimator); similarly correlation with Observer B can be improved to 0.7976 (from 0.7098, by energy-based estimator). We gauge the sensitivity of the proposed estimators to change in lesion size and shape as follows. We asked a human observer to measure BTC at points where each estimator was most sensitive to change in lesion shape or size (i.e., category (i) and (ii) points defined in Section 2.6). We inspect whether or not the measured BTC increases with the change in lesion size and do the same with the BTC estimates for the same point. If both measured and estimated BTC increase (or decrease) with the change in lesion size, we consider the estimator sensitive to lesion size (specifically sensitive to change from small to large circular lesion). Sensitivity to lesion shape (from small circular to oval lesion with the same area) is derived similarly. The results are listed in Table 4 (p-value is given for lesion sensitive methods). As noted before (in Table 2 and Table 3 analyses), LBA is sensitive to both lesion shape and size. Statistically stronger results may be reached, if BTC for different lesions is measured at more points by human observers and/or if BTC can be measured more accurately (e.g., by lowering threshold standard deviation, using larger number of trails in each run of QUEST). Estimator LBA is not far from an anthropomorphic model observer [13]: if the area within the immediate surround mask is brighter than BTC (i.e., maximum luminance with the immediate surround mask) by a certain margin and satisfies some other criteria (e.g., small gradient), it may be announced as a lesion. For a known lesion (SKE), this method may be used as the basis of an anthropomorphic search mechanism.
5. CONCLUSION BTC estimated by proposed methods, as well as BTC measured by a human observer discussed in Section 2.5, are sensitive to lesion location, size and shape. BTC estimators correlate with each other and correlate with human measured BTC as well. Therefore, all of the proposed methods, as-is or customized to a specific human observer, may be used to construct a BTC-aware model observer, with applications such as optimization of contrast-enhanced medical imaging systems, and creation of a diversified image dataset matching a desired population. None of the proposed BTC estimators correlates with human observers perfectly. This is reasonable since the human observers do not agree on their measurements either; they measure different BTC values for at the same points of the same mammogram and for the same lesion. From the proposed methods, LBA sensitivity to changes in lesion shape and size is the closest to human observer and PHOT-based BTC estimates have highest correlation with measured BTC by humans. A combination of proposed BTC estimators (e.g., linear least squares) can better predict a specific human observer, though this requires training. Alternatively, free parameters of each of the proposed methods (i.e., weights of the three components of SSIM used in P3S, size and shape of localization kernels in energy- and PHOT-based estimators, size and shape of immediate surround mask in LBA) may be optimized for a specific human observer. Doing so also requires training. To handle DBT stacks and browsing in time, the proposed methods may be generalized as follows. For LBA, a spatiotemporal immediate surround mask may be devised. For P3S, a 3D generalization of SSIM should be used to estimate perceptual similarity of pre- and post-lesion ROIs. For PHOT-based method, 3D (inverse) Fourier transform and a spatiotemporal lesion-dependent localization kernel may be used. The latter may be also used to generalize the energy-based BTC estimator to process DBT. In the course of our experiments, we noted a set of points at which observers highly agreed on measured BTC, as well as a set of points at which observers highly disagreed on measured BTC. This may suggest that the decision on BTC (equivalently, visibility of given lesion in a given complex background) is not atomic and has to be broken apart to yet unknown sub-decisions, to accurately model of a specific human observer.
Proc. of SPIE Vol. 9787 97870A-11
Downloaded From: http://spiedigitallibrary.org/ on 07/15/2016 Terms of Use: http://spiedigitallibrary.org/ss/TermsOfUse.aspx
5.1 Limitations
For lesion insertion, both in proposed estimators and in measuring BTC by human observer, we used a simple additive superimposition. A more realistic lesion insertion model (e.g., [21]) depends on the modality and perhaps even the specific medical imaging system being modeled, and can generate artifacts that can affect estimated or measured BTC. Such artifacts, for example, may make the lesion more conspicuous in certain locations, thus lowering measured or estimated BTC. We theorize that our methods and conclusions remain valid by considering the realistically inserted lesion (i.e., including artifacts) as the new lesion since we rely on near (visibility) threshold phenomenon in BTC estimation and measurement. Our proposed method of BTC measurement by human is slow (full measured BTC map is impractical and we resorted to measuring at a few points only) and not precise (measured BTC values have large standard deviation, causing large p-values in Table 4). We suspect simultaneous improvement in precision and speed of measurement may not be possible for the notion of BTC introduced herein, though each can be improved at the expense of the other: To speed up measurements, instead of adaptive threshold measurement by QUEST through several trials, the observer may adjust the insertion amplitude so that the lesion becomes “just-noticeable.” The problem with this approach is that the threshold may change over time (due to fatigue), thus may not be reproducible. Precision of BTC measurement may be improved by repeating our current method (based on QUEST) several times, averaging the results, and/or by increasing the number of trials per QUEST run.
REFERENCES [1] A.N. Avanaki, K.S. Espig, A.D.A. Maidment, C. Marchessoux, P.R. Bakic, T.R.L. Kimpe, “Development and
evaluation of a 3D model observer with nonlinear spatiotemporal contrast sensitivity,” Proc. of SPIE Medical Imaging, 2014.
[2] A.N. Avanaki, K.S. Espig, C. Marchessoux, E.A. Krupinski, P.R. Bakic, T.R.L. Kimpe, A.D.A. Maidment, “Integration of spatio-temporal contrast sensitivity with a multi-slice channelized Hotelling observer,” Proc. SPIE Medical Imaging, 2013.
[3] L. Platiša, B. Goossens, E. Vansteenkiste, S. Park, B. Gallas, A. Badano and W. Philips, “Channelized hotelling observers for the assessment of volumetric imaging data sets,” J. of Optical Society of America A, vol. 28, pp. 1145 – 1163, 2011.
[4] A.N. Avanaki, K.S. Espig, A. Xthona, T.R.L. Kimpe, P.R. Bakic, A.D.A. Maidment, “It is hard to see a needle in a haystack: Modeling contrast masking effect in a numerical observer,” Proc. of IWDM 2014, LNCS vol 8539, 2014.
[5] D.G. Pelli, B. Farell, D.C. Moore, “The remarkable inefficiency of word recognition,” Nature, 2003. [6] J. G. Mainprize, X. Wang, M. Ge, M. J. Yaffe, “Towards a Quantitative Measure of Radiographic Masking by Dense
Tissue in Mammography,” Proc. of IWDM 2014, LNCS vol 8539, 2014. [7] D. Pokrajac, A.D.A. Maidment, P.R. Bakic, “Optimized Generation of High Resolution Breast Anthropomorphic
Software Phantoms,” Medical Physics, vol. 39, pp. 2290-2302, April 2012. [8] M.A. Lago, A.D.A. Maidment, P.R. Bakic, “Modelling of mammographic compression of anthropomorphic software
breast phantom using FEBio,” Proc. Int'l Symposium on Computer Methods in Biomechanics and Biomedical Engineering (CMBBE) Salt Lake City, UT, 2013.
[9] J. Kuo, P. Ringer, S.G. Fallows, S. Ng, P.R. Bakic, A.D.A. Maidment, “Dynamic reconstruction and rendering of 3D tomosynthesis images” Proc. of SPIE, Medical Imaging 2011.
[10] Chen, S. C., Carton, A. K., Albert, M., Conant, E. F., Schnall, M. D., & Maidment, A. D. (2007). Initial clinical experience with contrast-enhanced digital breast tomosynthesis. Academic radiology, 14(2), 229-238.
[11] Hill, M. L., Mainprize, J. G., & Yaffe, M. J. (2010). An observer model for lesion detectability in contrast-enhanced digital mammography. In Digital Mammography (pp. 720-727). Springer Berlin Heidelberg.
[12] Hill, M. L., Mainprize, J. G., Jong, R. A., & Yaffe, M. J. (2011, March). Design and validation of a mathematical breast phantom for contrast-enhanced digital mammography. In SPIE Medical Imaging (pp. 79615E-79615E). International Society for Optics and Photonics.
[13] Avanaki, A. R., Espig, K. S., Kimpe, T. R., & Maidment, A. D. (2015, March). On anthropomorphic decision making in a model observer. In SPIE Medical Imaging (pp. 941610-941610). International Society for Optics and Photonics.
Proc. of SPIE Vol. 9787 97870A-12
Downloaded From: http://spiedigitallibrary.org/ on 07/15/2016 Terms of Use: http://spiedigitallibrary.org/ss/TermsOfUse.aspx

[14] Pezeshk, A. X., Popescu, L., & Sahiner, B. (2015, March). CT image quality evaluation for detection of signals with unknown location, size, contrast and shape using unsupervised methods. In SPIE Medical Imaging (pp. 94160J-94160J). International Society for Optics and Photonics.
[15] Wang, Z., Bovik, A. C., Sheikh, H. R., & Simoncelli, E. P. (2004). Image quality assessment: from error visibility to structural similarity. Image Processing, IEEE Transactions on, 13(4), 600-612.
[16] Watson, A. B., & Pelli, D. G. (1983). QUEST: A Bayesian adaptive psychometric method. Perception & psychophysics, 33(2), 113-120.
[17] Watson, A. B., & Pelli, D. G. (1983). QUEST: A Bayesian adaptive psychometric method. Perception & psychophysics, 33(2), 113-120.
[18] Barten, P. G. (2003, December). Formula for the contrast sensitivity of the human eye. In Electronic Imaging 2004 (pp. 231-238). International Society for Optics and Photonics.
[19] Barten, P. G. (1999). Contrast sensitivity of the human eye and its effects on image quality (Vol. 72). SPIE press. [20] Mainprize, J. G., & Yaffe, M. J. (2010). Cascaded analysis of signal and noise propagation through a heterogeneous
breast model. Medical physics, 37(10), 5243-5250. [21] Vaz, M. S., Besnehard, Q., & Marchessoux, C. (2011, March). 3D lesion insertion in digital breast tomosynthesis
images. In SPIE Medical Imaging(pp. 79615Z-79615Z). International Society for Optics and Photonics.
Proc. of SPIE Vol. 9787 97870A-13
Downloaded From: http://spiedigitallibrary.org/ on 07/15/2016 Terms of Use: http://spiedigitallibrary.org/ss/TermsOfUse.aspx