Embed Size (px)
Citation preview
Clark UniversityClark Digital CommonsInternational Development, Community andEnvironment (IDCE) Master’s Papers
5-2017
Location-based Modeling and Statistics Internshipwith Location, Inc.Yixuan [email protected]
Follow this and additional works at: https://commons.clarku.edu/idce_masters_papers
Part of the Geographic Information Sciences Commons
This Final Project is brought to you for free and open access by the Master’s Papers at Clark Digital Commons. It has been accepted for inclusion inInternational Development, Community and Environment (IDCE) by an authorized administrator of Clark Digital Commons. For more information,please contact [email protected], [email protected].
Recommended CitationWang, Yixuan, "Location-based Modeling and Statistics Internship with Location, Inc." (2017). International Development, Communityand Environment (IDCE). 168.https://commons.clarku.edu/idce_masters_papers/168
Location-based Modeling and Statistics Internship with Location, Inc.
Page i
Location-based Modeling and Statistics
Internship with Location, Inc.
Yixuan Wang
Degree will be conferred May 2017
A GISDE final project paper
submitted to the faculty of Clark University, Worcester, Massachusetts,
in partial fulfillment of the requirements for the degree of
Masters of Science in Geographic Information Sciences for Development and Environment
in the Department of International Development, Community, and Environment
Accepted on the recommendation of
Dr. Yelena Ogneva-Himmelberger, Project Advisor

Location-based Modeling and Statistics Internship with Location, Inc.
Page ii
Abstract
Location-based Modeling and Statistics Internship with Location, Inc.
Yixuan Wang
In the summer 2016, I had the honor to work as a GIS & statistics intern at Location, Inc.
It is a Software as a Service (SaaS) private company that builds and delivers location-based big
data, analytics, tools, and services. The company’s mission is to create the best location-based
technologies to help businesses make well-informed decisions (Location, Inc.). I was chosen by
the company’s CEO, Dr. Andrew Schiller, who is also a Clark Alumnus. During the internship
period, I worked in the data science team supervised by Jonathan Glick, and my main
responsibilities were handling geographical and statistical related tasks to support project
development. In general, I participated in two projects and worked on many different tasks such
as tabular data cleaning, descriptive statistics analysis, geo-datasets development, spatial
analysis, etc. The samples of work I describe here are processing TransUnion datasets and
network analysis in ArcMap. I have learned a few new skills such as processing big data or using
basic SPSS syntax, and gathered wider experience from the work. Overall, it was a wonderful
experience for me, and no doubt it would shape my future career. I would definitely recommend
this internship opportunity to other GISDE students.
Dr. Yelena Ogneva-Himmelberger, Project Advisor
Location-based Modeling and Statistics Internship with Location, Inc.
Page iii
Academic History
Name: Yixuan Wang Date: May, 2017
Place of Birth: Xi’an, Shaanxi Province, China Date: Feb 22, 1993
Baccalaureate School: The University of Arizona, Tucson, AZ Date: Aug, 2015
Baccalaureate Subject: B.S., Geography, GIS Emphasis
Occupation and Academic Connection since Baccalaureate Degree:
MS Candidate in GISDE, Clark University

Location-based Modeling and Statistics Internship with Location, Inc.
Page iv
Dedication
This paper is dedicated to my beloved parents, who are always supporting me to pursue what I
love. I also dedicate this paper to my dear girlfriend, Lei, who has been striving together with me since
college.

Location-based Modeling and Statistics Internship with Location, Inc.
Page v
Acknowledgements
I want to specially thank Dr. Andrew Schiller for providing me such a wonderful internship
position. I also want to thank Jonathan Glick for tutoring me during the internship.
Location-based Modeling and Statistics Internship with Location, Inc.
Page vi
Table of Contents
Chapter 1. Introduction ................................................................................................................................. 1
Chapter 2. Description of the Organization .................................................................................................. 2
2.1 Background ......................................................................................................................................... 2
2.2 Mission and Expertise ......................................................................................................................... 2
2.3 Organizational Structure and Culture ................................................................................................. 4
2.4 GIS and Mapping ................................................................................................................................ 6
Chapter 3. Description of Internship Responsibilities .................................................................................. 7
3.1 Overall Responsibility ........................................................................................................................ 7
3.2 Samples of Work ................................................................................................................................. 8
3.2.1 Processing TransUnion Datasets .................................................................................................. 8
3.2.2 Network Analysis in ArcMap .................................................................................................... 10
3.3 Connection to the Mission ................................................................................................................ 14
Chapter 4. Assessment of the Internship ..................................................................................................... 16
4.1 Learning during the Internship .......................................................................................................... 16
4.2 Useful Skills Acquired at Clark University ...................................................................................... 16
4.3 Relating to Studies and Goals ........................................................................................................... 17
4.4 Recommendation to Others ............................................................................................................... 17
Chapter 5. Conclusion ................................................................................................................................. 18
Reference .................................................................................................................................................... 19
Location-based Modeling and Statistics Internship with Location, Inc.
Page 1
Chapter 1. Introduction
Geographic Information Science for Development and Environment (GISDE) master
program at Clark University is a powerful and unique GIS program, and it shapes both my study
and career paths. We develop expertise in geospatial techniques, remote sensing, and advanced
spatial analysis, focusing on various fields, such as land change, biological conservation, earth
system modeling, public health, urban development, etc. This program offers not only a number
of high value courses and seminars but also several tracks to fulfill our different needs, including
internship track, research track, as well as portfolios track. As most of my colleagues, I chose the
internship track, which provides opportunities to apply our knowledge and skills learnt from
classes directly to the real world, and more importantly, to prepare for careers after graduation.
In the summer 2016, I had the honor to join the local geographic analytics company,
Location, Inc. I was chosen by the company’s CEO, Dr. Andrew Schiller, which is also a Clark
Alumnus. I worked as a GIS & statistics intern in the data science team supervised by Jonathan
Glick. During the internship period, I participated in two projects and worked on many different
tasks such as tabular data cleaning, descriptive statistics analysis, geo-datasets development,
spatial analysis, etc. I applied my knowledge and skills to contribute to the company and
meanwhile I have learned a few new skills and gathered experience from the work. Overall, it
was a wonderful experience for me, and no doubt it would shape my future career.
This internship paper is a general report for my 3-month location-based modeling and
statistics internship at Location, Inc., which includes the company’s description, overall
internship responsibilities, samples of work, as well as internship assessment.
Location-based Modeling and Statistics Internship with Location, Inc.
Page 2
Chapter 2. Description of the Organization
2.1 Background
Location, Inc. is a Software as a Service (SaaS) private company that builds and delivers
location-based big data, analytics, tools, and services. Its headquarters is located in the
downtown of Worcester, the heart of Massachusetts. The company was established by Dr.
Andrew Schiller, a geographer and demographer, when he was pursuing his Ph.D. degree in
geography at Clark University in 2000. He was inspired by his thought that people could spend
much less time finding new locations and neighborhoods in which to live if they could search out
the ideal imagined neighborhood based on specific criteria they input. Two years later, his idea
had come to the real world in the form of the first and the most renowned product he created,
NeighborhoodScout®, a web-based neighborhood search engine. Since then, the company has
been keeping rapidly developing and innovating new services and products. Today, it serves over
55 million individuals and businesses with its own exclusive data and products (Location, Inc.).
2.2 Mission and Expertise
The company’s cutting-edge algorithms and models provide risk assessment and
management, site selection, market analysis, and real estate investments for all kinds of
enterprises within the United States. The company’s mission is to create the best location-based
technologies it can that help businesses make well-informed decisions, which could transform
into greater revenue and reduced costs (Location, Inc.). “Our mission is simple. What we do is
not.” Just like the words in its website describing themselves, the company owns quite a few

Location-based Modeling and Statistics Internship with Location, Inc.
Page 3
exclusive or patented located-based technologies which have been refined over a decade of
research.
Location, Inc. currently has two major web-based products: SecurityGauge® and
NeighborhoodScout®. SecurityGauge® is a crime risk assessment tool that is able to evaluate
the risk of crime for any address in the U.S. immediately with extremely high accuracy based on
reported crime incident data from over 18,000 law enforcement agencies in the U.S. (Location,
Inc.). NeighborhoodScout® provides instant, and comprehensive neighborhood reports for any
address in the U.S., which contains about 300 statistics including demographic statistics,
lifestyle, house value, public schools, and crime statistics. It is recognized as the largest database
of neighborhood statistics available today. The company also provides a number of standalone
location-based data products including crime risk data, fire risk™ data, fraud risk/ecommerce
loss prevention, real estate, house values & appreciation rates, school data and ratings, and
lifestyle and demographics data. In addition, it offers geo-fence boundary products such as
neighborhood boundaries, zip code boundaries or city & metro boundaries.
With advanced technologies and abundant experience of location-based analytics, the
company offers comprehensive industry solutions serving different sectors from government to
academia and from small business to big corporation (Location, Inc.). It covers real estate, retail,
fraud detection, insurance, relocation, direct marketing, and site selection. Although all the
products and services currently are for the U.S. only, the company intends to cover their business
in Canada in the near future, and it has already initiated developing and analyzing crime data in
Canada.

Location-based Modeling and Statistics Internship with Location, Inc.
Page 4
2.3 Organizational Structure and Culture
When Dr. Andrew Schiller first started Location, Inc. in 2000, it had only two people.
Now, it has around 15 employees and the majority of them are in full-time position. Gender
composition is quite balanced, namely male and female staff are nearly half-and-half. The
management team consists of the CEO and the chair of the board, Dr. Andrew Schiller, a vice
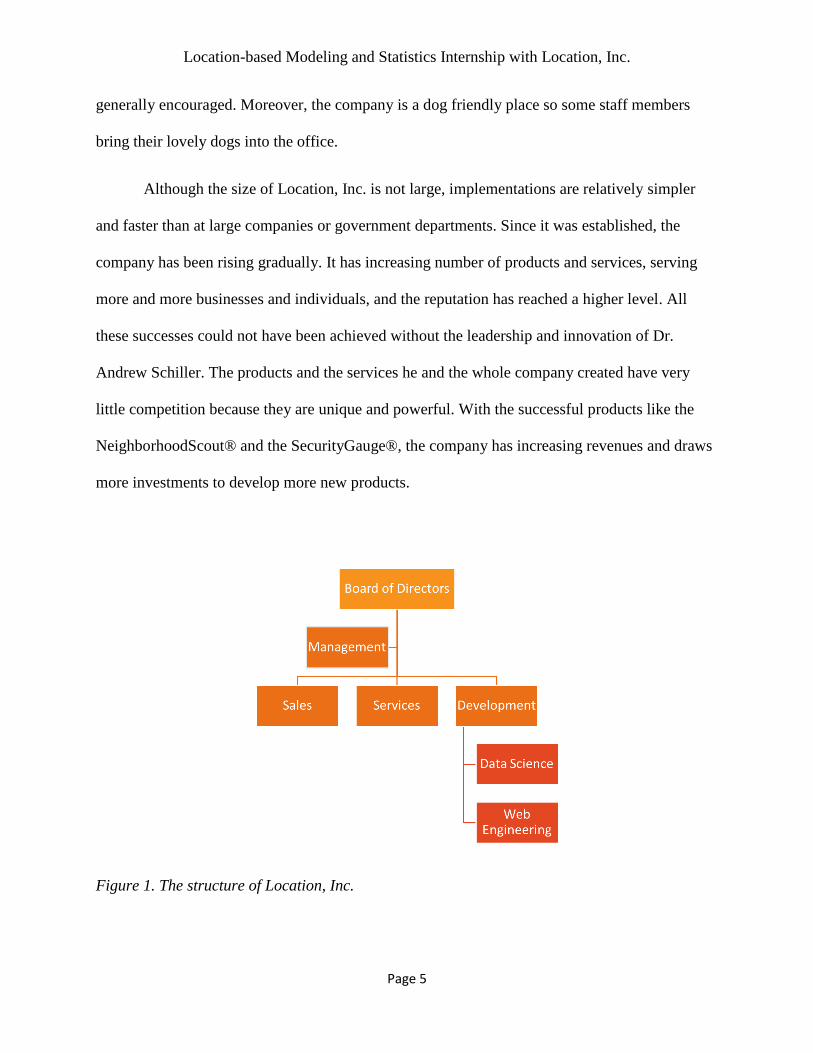
president, sales, services and operations managers. The company has three departments: sales,
services, and development, which includes web engineering team and data science team (see
Figure 1). Both the web engineering team and the data science team are the core of productivity
in the company. The primary responsibilities of the web engineering team are website
maintenances and development as well as data management. Since many products and services
are delivered on the internet, the web engineering team is the backbone of the company. The data
science team is led by an outstanding statistician, Jonathan Glick, who has been working for the
company for many years. He and the data science team are the muscle and blood of the
company, which focuses on analyzing data, constructing algorithms and models for tools and
products.
The culture of in the company tends to be informal. Since the company and the
departments are relatively small, staff communication either within a department or among
different departments is easy. Normally, every workday at noon, the staff members gather
together along with the CEO in the conference room to have lunch. Sometimes, the whole
company staff members go to a restaurant nearby to have a bigger lunch usually on someone’s
birthday or a special day. Every week, the company is likely to have a happy hour in a bar
nearby. Dress code in the company is not very restricted, so business casual or even casual are
Location-based Modeling and Statistics Internship with Location, Inc.
Page 5
generally encouraged. Moreover, the company is a dog friendly place so some staff members
bring their lovely dogs into the office.
Although the size of Location, Inc. is not large, implementations are relatively simpler
and faster than at large companies or government departments. Since it was established, the
company has been rising gradually. It has increasing number of products and services, serving
more and more businesses and individuals, and the reputation has reached a higher level. All
these successes could not have been achieved without the leadership and innovation of Dr.
Andrew Schiller. The products and the services he and the whole company created have very
little competition because they are unique and powerful. With the successful products like the
NeighborhoodScout® and the SecurityGauge®, the company has increasing revenues and draws
more investments to develop more new products.
Figure 1. The structure of Location, Inc.
Location-based Modeling and Statistics Internship with Location, Inc.
Page 6
2.4 GIS and Mapping
Since the business of Location, Inc. is all about location-based analytics, GIS is used
massively within the company. ArcGIS software is generally used to develop useful data in the
data science team. For most of the services and the products, GIS is highly involved in
developing data, especially for some basic spatial analysis tools. In the NeighborhoodScout®,
geocoding using Google Maps Geocoding API is applied in early stage of data development for
data that only contain address information. Most data require precise x and y coordinates to be
used later. Spatial join is another GIS tool that is normally used. For example, some data that is
in a very small scale are needed to be joined into the census tract scale in order to be further
analyzed. Geovisualization is another big part. Web mapping is a part of the final report in the
NeighborhoodScout®. The crime product SecurityGauge® requires surface interpolation to
show crime map reports based on crime data. Network analysis is recently utilized for a
developing product, for instance, calculating driving time to jobs from the centroids of the block
group.
Location-based Modeling and Statistics Internship with Location, Inc.
Page 7
Chapter 3. Description of Internship Responsibilities
3.1 Overall Responsibility
As a GIS & statistics intern, I worked in the data science team supervised by the lead
statistician, Jonathan Glick, who was always working remotely in Seattle, WA. I communicated
with him through skype every workday. In general, he directly assigned tasks to me and usually
provided helpful statistical instructions. I also came to him with advice or questions when I
encountered some issues on the tasks. We used JIRA Software to track our individual tasks and
project flows. Once I finished a task, I reported my work to him directly via Dropbox. He would
then evaluate the task and let me know if it needs to be improved. In addition, I was obligated to
report processes to the CEO Dr. Schiller often. My main responsibilities were handling
geographical and statistical related tasks to support project development. More specifically, they
included cleaning, merging, and aggregating tabular data sets, running descriptive statistics in
SPSS, cleaning and developing geodatabases, performing spatial analysis in ArcMap, as well as
geoprocessing datasets using spatial join tool, clip tool, merge tool, etc. With regards to data, all
original data were provided by either Jonathan or Andrew which were initially downloaded from
websites or servers or were sent from other companies. Once I had the data, I would start with
preprocessing to make the data useful in the following analysis. During the summer, I was
partially involved in two large projects, the first one was creating new variables for a new model
of housing value prediction project, and the second one was processing FEMA fire datasets and
RealtyTrac datasets for the second version of structure fire assessment model project. The first
project was in the full development stage, and the second one was only in the pre-development
stage. In the following section, I will give more details about the work I did for the first project.
Location-based Modeling and Statistics Internship with Location, Inc.
Page 8
3.2 Samples of Work
During the internship period, I completed a number of tasks, some of them were
relatively simple and several of them were challenging. Here I will describe three tasks that were
relatively time consuming and challenging.
3.2.1 Processing TransUnion Datasets
The first task of my internship was to process TransUnion datasets. Dr. Schiller handed
over a “black box” to me on my first day, which was a book-size external hard drive that
contained TransUnion datasets including over 500 credit variables for the entire US. The
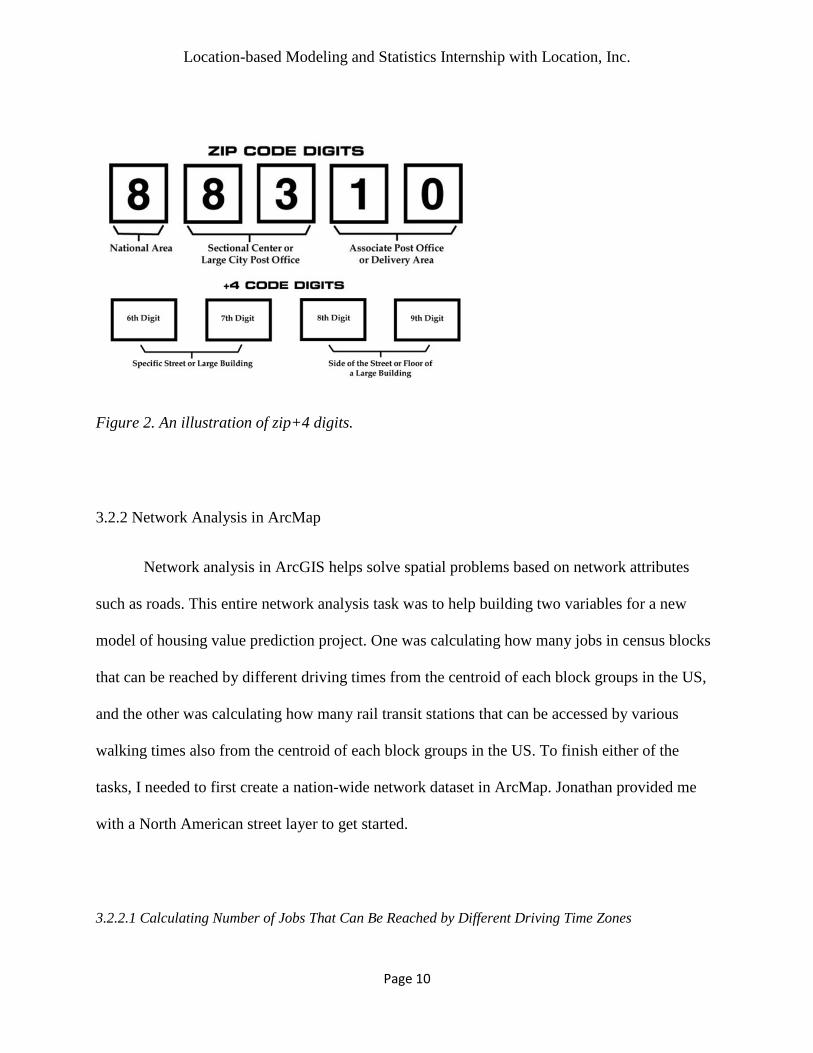
assignment was examining and familiarizing myself with the datasets and then aggregating it
from current zip+4 level (see Figure 2) into both block level and block group level. The original
datasets were extremely large and separated into 101 sub files. Each file was approximately 2
gigabytes with no file-type extensions. The entire tabular dataset had about 550 columns and
over 39 million rows. The file type was fixed width text format, which is not very friendly to
data processing. I noticed that the first step was to convert the fixed width text format into the
comma delimited csv format which is a very common and friendly tabular data format. With the
help of the web engineering team, I learned how to operate the Terminal in the Linux Operation
System installed in the Virtual box software. The csv kit, which is a command tool in the
Terminal, is able to convert fixed width text format into the comma delimited csv format. A lay
out reference schema file which recorded how many spaces for each column was required in
order to complete format change. Fortunately, this layout sheet was provided along with the
original data. A single line Shell Script to execute csv converting function in the Terminal was
Location-based Modeling and Statistics Internship with Location, Inc.
Page 9
needed to convert all original files into comma delimited csv files. Due to the size of the data,
this process took about 2 hours to finish. After transformation, the next step was to merge all sub
files. Another single line of command would do the merging. In order to aggregate from zip+4
level into either block level or block group level, I first needed such georeferencing data to be
joined. Dr. Schiller also provided me with that zip+4 georeferencing data which contained the
block ID field and the block group ID field from GeoLytics database. This georeferencing data
was relatively small, only about 4 gigabytes. The ideal technique was to join this smaller
georeferencing data into the big TransUnion table with the same unique key field: zip+4 ID. The
size of the data was too large so that I could not find an efficient way to perform merging. After
some research, experiment, and failure, I finally found a relatively fast and simple, but may not
be the smartest way to merge them. I imported both of the datasets into SPSS and first sorted
them based on the zip+4 ID. It is always a good idea to sort first when dealing with big data
process because it could save a number of time in later data process such as merge or aggregate.
Next, I only extracted the sorted zip+4 ID field from the TransUnion datasets and joined the
georeferencing data into it. In this case, I kept all records of zip+4 ID from the TransUnion data
and only joined matched georeferencing data with common zip+4 ID. Then, I hard-joined this
semi-joined georeferencing data into the large TransUnion data with all the variables since they
have the same order of the zip+4. Finally, I aggregated this joined data by choosing median
values into block level as well as block group level by using the aggregate tool in SPSS. After
aggregating, I performed the data process evaluation and found that about 70 percent of the
original data were successfully aggregated at the end. The reason why some of the original data
were not able to be aggregated was that there were some differences in the zip+4 field between
the datasets.
Location-based Modeling and Statistics Internship with Location, Inc.
Page 10
Figure 2. An illustration of zip+4 digits.
3.2.2 Network Analysis in ArcMap
Network analysis in ArcGIS helps solve spatial problems based on network attributes
such as roads. This entire network analysis task was to help building two variables for a new
model of housing value prediction project. One was calculating how many jobs in census blocks
that can be reached by different driving times from the centroid of each block groups in the US,
and the other was calculating how many rail transit stations that can be accessed by various
walking times also from the centroid of each block groups in the US. To finish either of the
tasks, I needed to first create a nation-wide network dataset in ArcMap. Jonathan provided me
with a North American street layer to get started.
3.2.2.1 Calculating Number of Jobs That Can Be Reached by Different Driving Time Zones
Location-based Modeling and Statistics Internship with Location, Inc.
Page 11
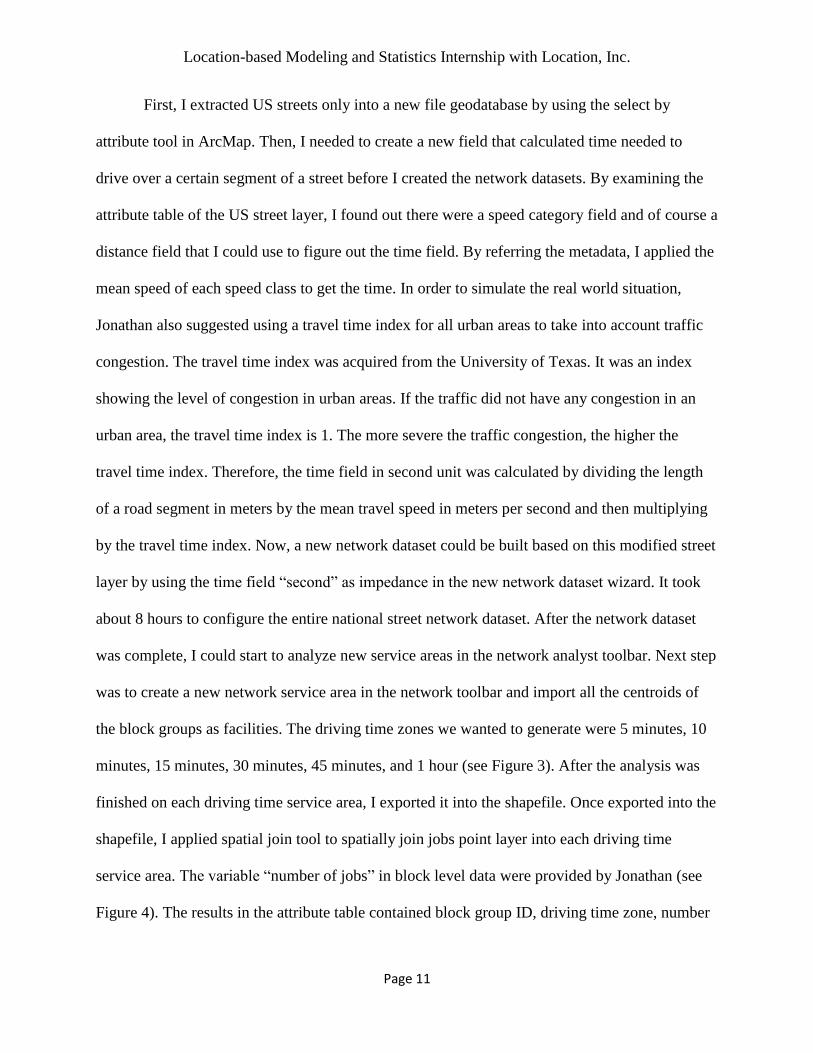
First, I extracted US streets only into a new file geodatabase by using the select by
attribute tool in ArcMap. Then, I needed to create a new field that calculated time needed to
drive over a certain segment of a street before I created the network datasets. By examining the
attribute table of the US street layer, I found out there were a speed category field and of course a
distance field that I could use to figure out the time field. By referring the metadata, I applied the
mean speed of each speed class to get the time. In order to simulate the real world situation,
Jonathan also suggested using a travel time index for all urban areas to take into account traffic
congestion. The travel time index was acquired from the University of Texas. It was an index
showing the level of congestion in urban areas. If the traffic did not have any congestion in an
urban area, the travel time index is 1. The more severe the traffic congestion, the higher the
travel time index. Therefore, the time field in second unit was calculated by dividing the length
of a road segment in meters by the mean travel speed in meters per second and then multiplying
by the travel time index. Now, a new network dataset could be built based on this modified street
layer by using the time field “second” as impedance in the new network dataset wizard. It took
about 8 hours to configure the entire national street network dataset. After the network dataset
was complete, I could start to analyze new service areas in the network analyst toolbar. Next step
was to create a new network service area in the network toolbar and import all the centroids of
the block groups as facilities. The driving time zones we wanted to generate were 5 minutes, 10
minutes, 15 minutes, 30 minutes, 45 minutes, and 1 hour (see Figure 3). After the analysis was
finished on each driving time service area, I exported it into the shapefile. Once exported into the
shapefile, I applied spatial join tool to spatially join jobs point layer into each driving time
service area. The variable “number of jobs” in block level data were provided by Jonathan (see
Figure 4). The results in the attribute table contained block group ID, driving time zone, number
Location-based Modeling and Statistics Internship with Location, Inc.
Page 12
of jobs, and number of high pay jobs (see Figure 5). For each output, I also preformed quality
checks to make sure the results are reliable and correct. Once all analysis was completed, I
uploaded all results in shapefiles into Dropbox.
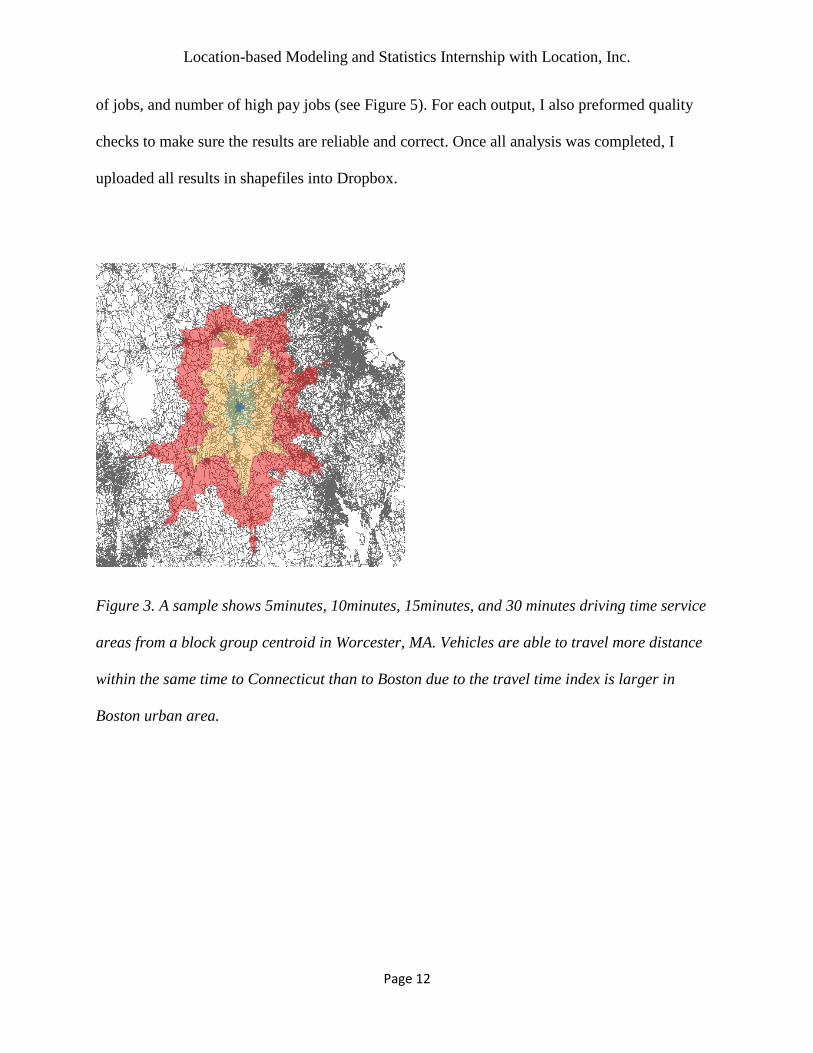
Figure 3. A sample shows 5minutes, 10minutes, 15minutes, and 30 minutes driving time service
areas from a block group centroid in Worcester, MA. Vehicles are able to travel more distance
within the same time to Connecticut than to Boston due to the travel time index is larger in
Boston urban area.
Location-based Modeling and Statistics Internship with Location, Inc.
Page 13
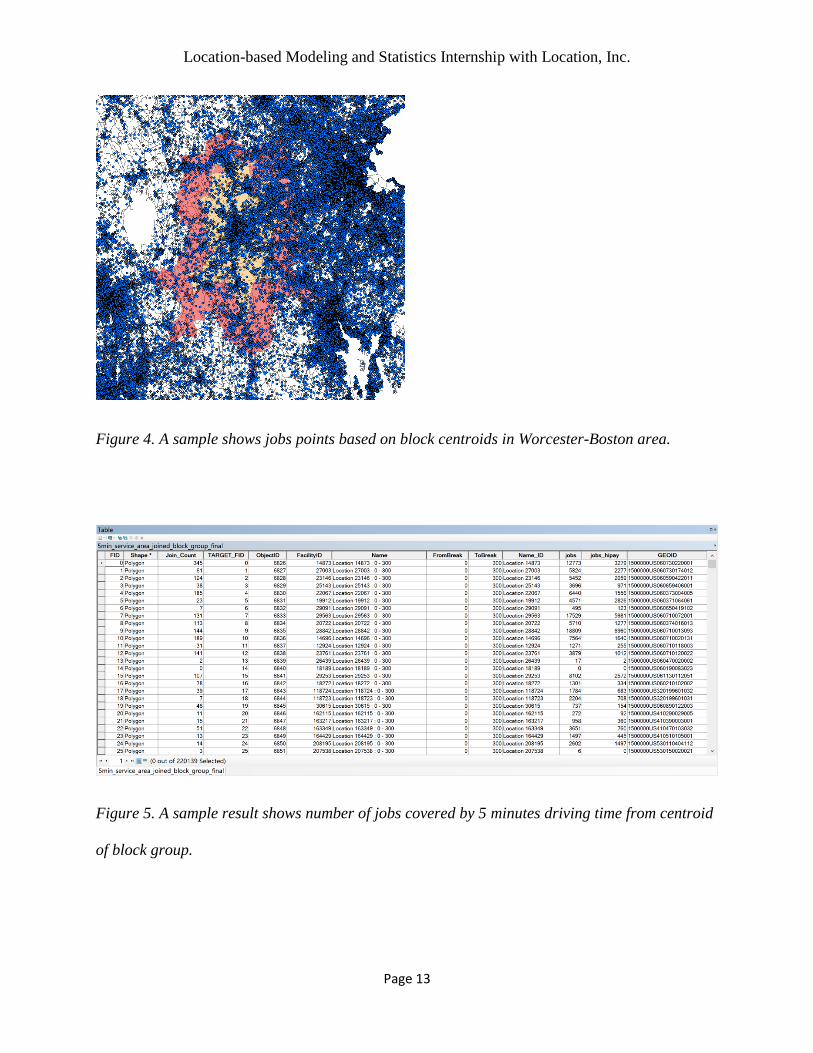
Figure 4. A sample shows jobs points based on block centroids in Worcester-Boston area.
Figure 5. A sample result shows number of jobs covered by 5 minutes driving time from centroid
of block group.

Location-based Modeling and Statistics Internship with Location, Inc.
Page 14
3.2.2.2 Calculating Number of Rail Transit Stations That Can Be Reached by Different Walking Time
Zones
After the driving times zones had been completed, I was tasked with calculating the
number of rail transit stations that can be reached by different walking time zones, including 5
minutes, 10 minutes, 15 minutes, 20 minutes, as well as 30 minutes. This process was very
similar to the previous one. First, I needed to calculate a new time field in the built network
dataset. I needed to calculate how much time persons need to travel through each segment of
roads. Based on the research found online, the average human walking speed is 3 miles per hour,
which is about 1.34 meters per second. Therefore, the time field is calculated by dividing the
length of a road segment in meter by the average human walking speed in meters per second.
After finishing the configuration, the network dataset needed to be rebuilt in order to update it. It
took a much shorter time to rebuild the network dataset than to create a new one. Once the
updated network dataset was complete, I created a new service area and import all the centroids
of the block groups just like the previous one. I computed 5 minutes, 10 minutes, 15 minutes, 20
minutes, and 30 minutes walking zones. The national rail transit station shapefile provided by
Jonathan, which contains all Amtrak stations, local light railway stations, and subway stations
was used to be spatially joined with each walking zone. At the end, I preformed quality checks as
well to check the reliability of the results. The results were uploaded into Dropbox after the
results were determined as reasonable.
3.3 Connection to the Mission
My responsibilities and work I accomplished were all connected to the company’s
mission. The data science team is always dedicating to improve and design algorithms, analysis,

Location-based Modeling and Statistics Internship with Location, Inc.
Page 15
and models. As a member in the data science team, developing new datasets or making new
variables for a new model were definitely counted as the dedication. The work I have done and
my daily responsibilities were all efforts to create better location-based technologies that help
businesses to make well-informed decisions.
Location-based Modeling and Statistics Internship with Location, Inc.
Page 16
Chapter 4. Assessment of the Internship
4.1 Learning during the Internship
In general, I did have a great learning experience in the internship period at Location, Inc.
I learned how to utilize Linux Shell Scripts to process tabular data in batch and got familiar with
the csv kit operated in the Terminal. They were very handy for dealing with big data. Also, I
learned basic SPSS syntax which was very useful in importing and analyzing data. In addition,
because of some very large shapefiles, I figured out how to download and use the ArcGIS 64-bit
Background Geoprocessing Tool. This tool was able to let the computer use all available
memory when dealing with big data in ArcMap. This was a big saver when I encountered
memory limit errors running the spatial join tool. Moreover, our company trained us to use JIRA
software to manage and track tasks or projects, which was a very useful platform. In addition, I
learned how to work with other teams, and how to work for a supervisor that is always working
remotely.
4.2 Useful Skills Acquired at Clark University
Most classes I took in my first year at Clark University were environment and raster
analysis related such as Landscape Ecology or Wildlife Conservation Seminar. However, the
internship I participated in was more focused on demographic and vector analysis. So I have to
say that most of the hard skills learned at Clark University were not applied during this
internship. Yet, I did get some useful soft skills at Clark University that were able to help in the
internship. For example, I learned how to participate in a large projects and cooperate with team
members in the Wildlife Conservation Seminar instructed by Dr. John Rogan and Dr. Florencia
Location-based Modeling and Statistics Internship with Location, Inc.
Page 17
Sangermano, which I found very important in the internship. Furthermore, my experience at
Clark has taught me to think and solve problems differently and smartly. This ability allowed me
working through the difficult tasks smoothly during the internship.
4.3 Relating to Studies and Goals
In general, my study focuses on GIS applications and my goal is applying geospatial
techniques to let more people realize the power of GIS. Therefore, this internship was quite
appropriate for my study interests and goals. The internship allowed me to touch and process big
data and even enjoy dealing with them. It also lets me realize that these location-based data are
quite powerful. Moreover, I realized the importance of scripting when dealing with either tabular
data processing or spatial analysis. Therefore, I took Dr. Jie Tian’s Python class as well as
Computer Programming for GIS class in the fall 2016 semester. Since this internship, I have
come to enjoy Vector GIS and demographic data. In the future studies, I would like to work on
both environmental GIS and demographic GIS.
4.4 Recommendation to Others
Location, Inc. is a local company and its atmosphere is harmonious. It would always be a
pleasure for me to work here. It is a great place for a GISDE or geography student to apply
concepts to solve real world problems, and a unique place to practice skills on big data
processing. I would definitely recommend this internship opportunity to other GISDE students.

Location-based Modeling and Statistics Internship with Location, Inc.
Page 18
Chapter 5. Conclusion
I appreciate that Dr. Andrew Schiller, the CEO of Location, Inc. offered me this
wonderful opportunity to work as a GIS & statistics intern at Location, Inc. this summer. I have
learned many new and useful skills in terms of tabular data processing as well as spatial analysis.
This internship provided me a full angle of view to look at the challenge of big data processing
and the power of location-based data. I was glad that I was able to apply my 4 years of GIS
experience and skills to real world situations. This internship was a different way of learning
which afforded me abundant new experience that would be very valuable for future studies as
well as careers.

Location-based Modeling and Statistics Internship with Location, Inc.
Page 19
Reference
Location, Inc. Location, Inc. www.locationinc.com. Accessed 20 Sep. 2016.