Embed Size (px)
Citation preview
0
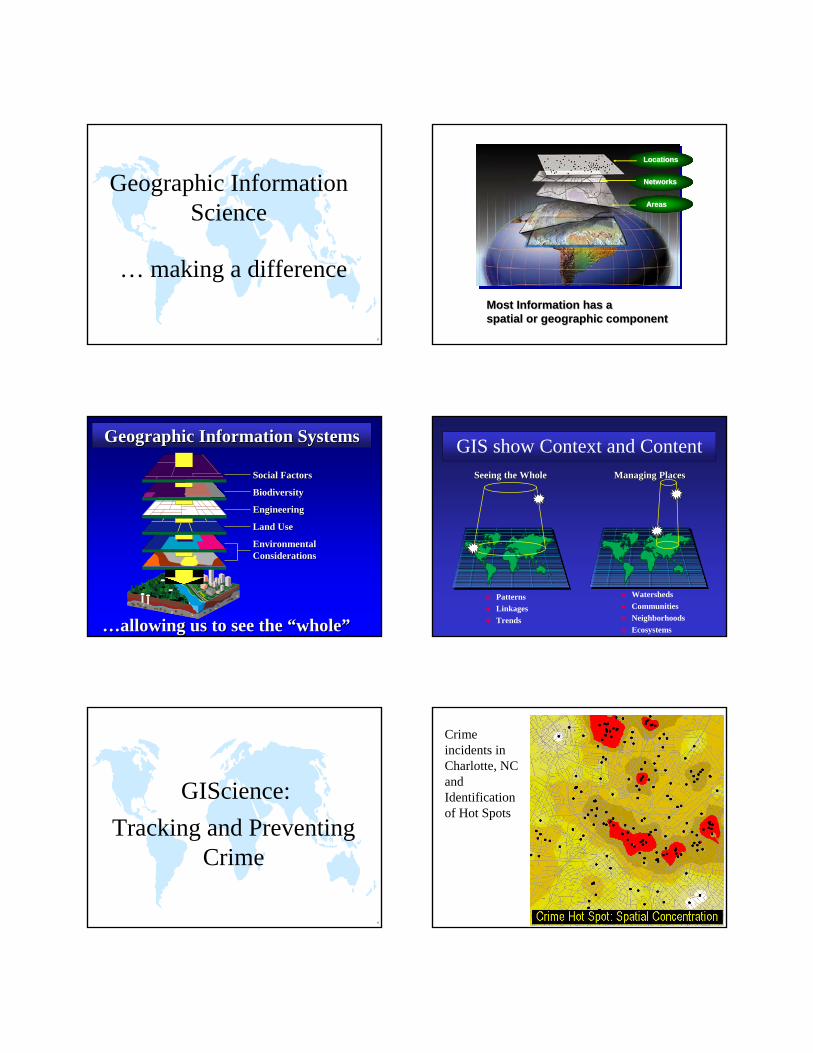
Geographic Information Science
… making a differenceMost Information has a spatial or geographic componentMost Information has a Most Information has a spatial or geographic componentspatial or geographic component
LocationsLocations
NetworksNetworks
AreasAreas
Geographic Information SystemsGeographic Information Systems
Social FactorsSocial Factors
BiodiversityBiodiversity
EngineeringEngineering
Land UseLand Use
EnvironmentalEnvironmentalConsiderationsConsiderations
……allowing us to see the “whole”allowing us to see the “whole”
WatershedsCommunitiesNeighborhoodsEcosystems
GIS show Context and Content
PatternsLinkagesTrends
Seeing the WholeSeeing the Whole Managing PlacesManaging Places
0
Tracking and PreventingCrime
GIScience:
Crime incidents in Charlotte, NC and Identification of Hot Spots
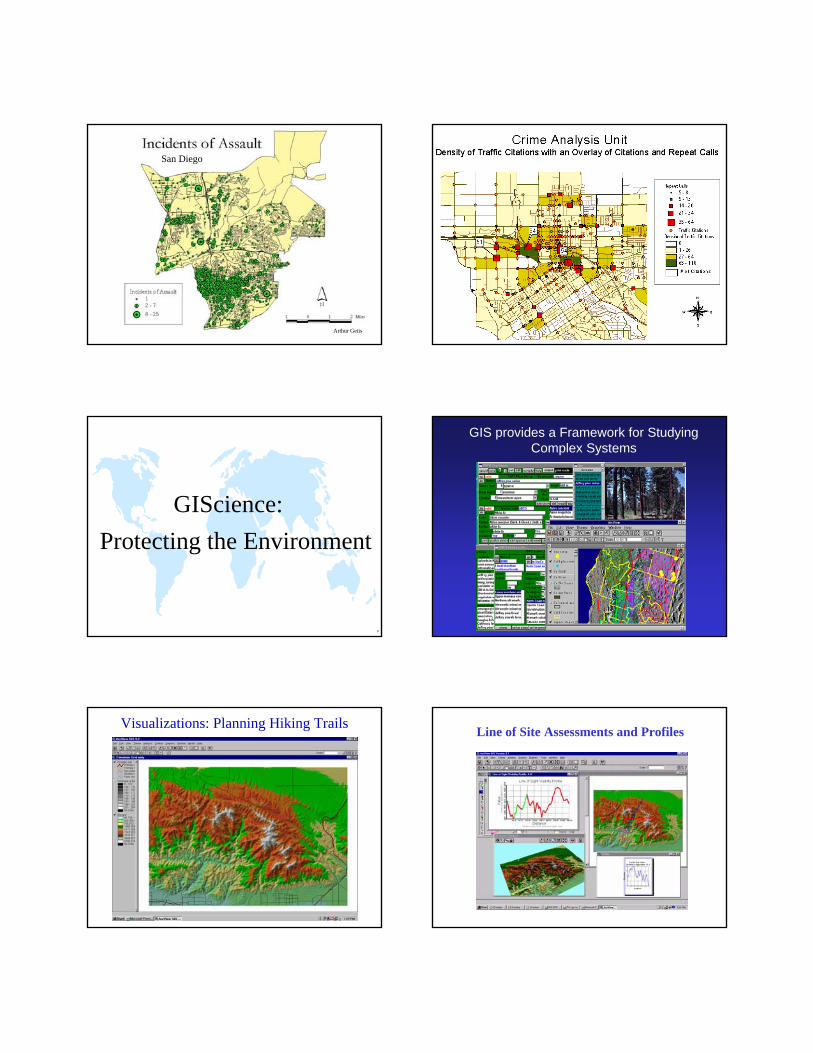
San Diego
Arthur Getis
0
Protecting the EnvironmentGIScience:
GIS provides a Framework for Studying Complex Systems
Visualizations: Planning Hiking Trails Line of Site Assessments and Profiles
Chesapeake Bay: Community Group Tracking of Nitrogen Levels
Chesapeake Bay: Community Group Tracking of Nitrogen Levels
156 Metropolitan AreasReal-Time Environmental Data for Decision-makingPartnering of US EPA and EMPACT Grantees
Chesapeake Bay Nitrogen• pollution
distribution in space and
time
Sediment Transport:• analyzing erosion risk • designing controls
University of Illinois at U-C
0 0.4 0.8 1.2 1.5 mg/l QuickTime™ and a decompressor
are needed to see this picture.
QuickTime™ and a decompressor
are needed to see this picture.
QuickTime™ and a decompressor
are needed to see this picture.
QuickTime™ and a decompressor
are needed to see this picture.
QuickTime™ and a decompressor
are needed to see this picture.
QuickTime™ and a decompressor
are needed to see this picture.
Tracking Boll Weevil InfestationsJackson State Community College
Remote Sensing -detecting damage from thehemlock wooly adelgid...
Classifying land cover to improve hydrodynamic modeling
Mapping and Tracking Air Quality
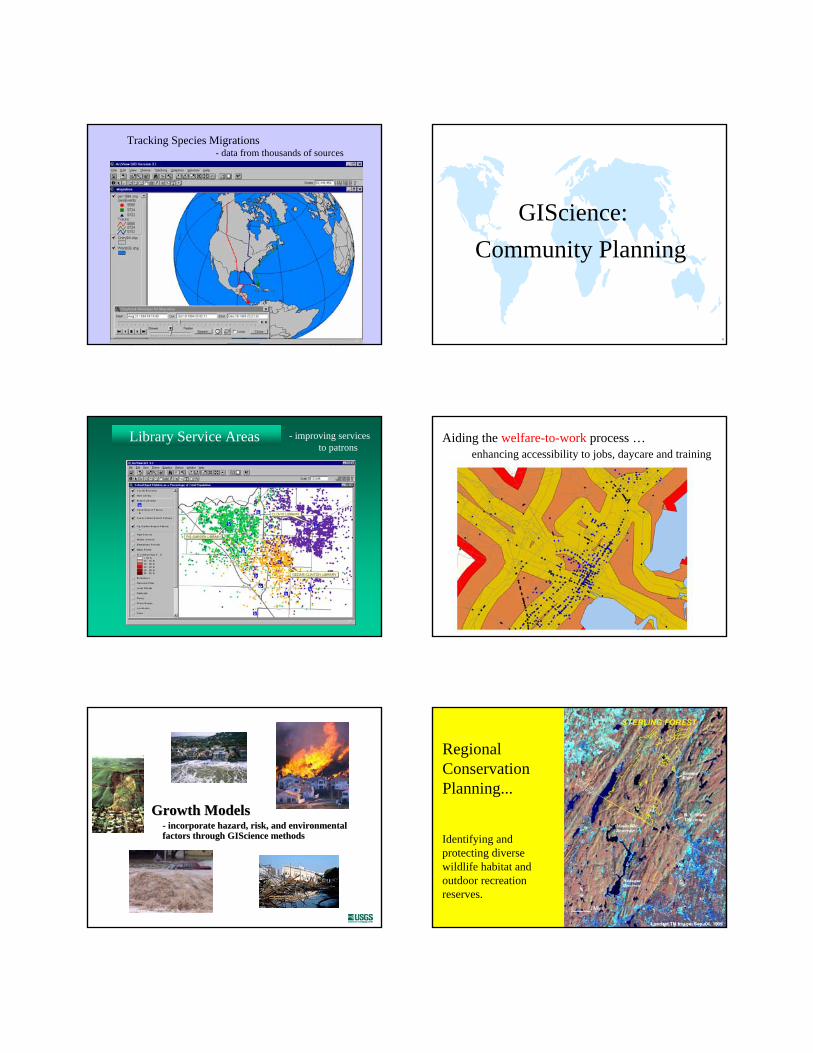
Tracking Species Migrations- data from thousands of sources
0
Community PlanningGIScience:
Library Service Areas - improving services to patrons
Aiding the welfare-to-work process … enhancing accessibility to jobs, daycare and training
Growth Models Growth Models -- incorporate hazard, risk, and environmental incorporate hazard, risk, and environmental factors through factors through GIScienceGIScience methodsmethods Identifying and
protecting diverse wildlife habitat and outdoor recreation reserves.
Regional Conservation Planning...
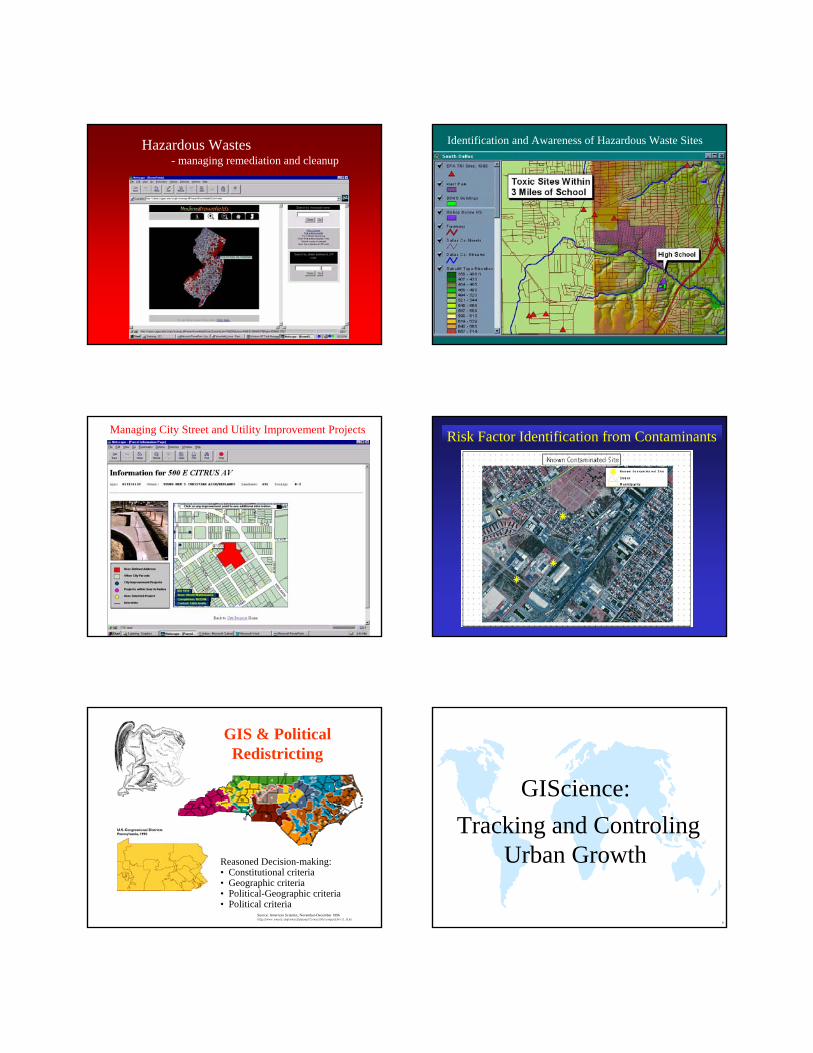
Hazardous Wastes- managing remediation and cleanup
Identification and Awareness of Hazardous Waste Sites
Managing City Street and Utility Improvement Projects Risk Factor Identification from Contaminants
GIS & Political Redistricting
Source: American Scientist, November-December 1996http://www.amsci.org/amsci/issues/Comsci96/compsci96-11.html
Reasoned Decision-making:• Constitutional criteria• Geographic criteria• Political-Geographic criteria• Political criteria
0
Tracking and ControlingUrban Growth
GIScience:
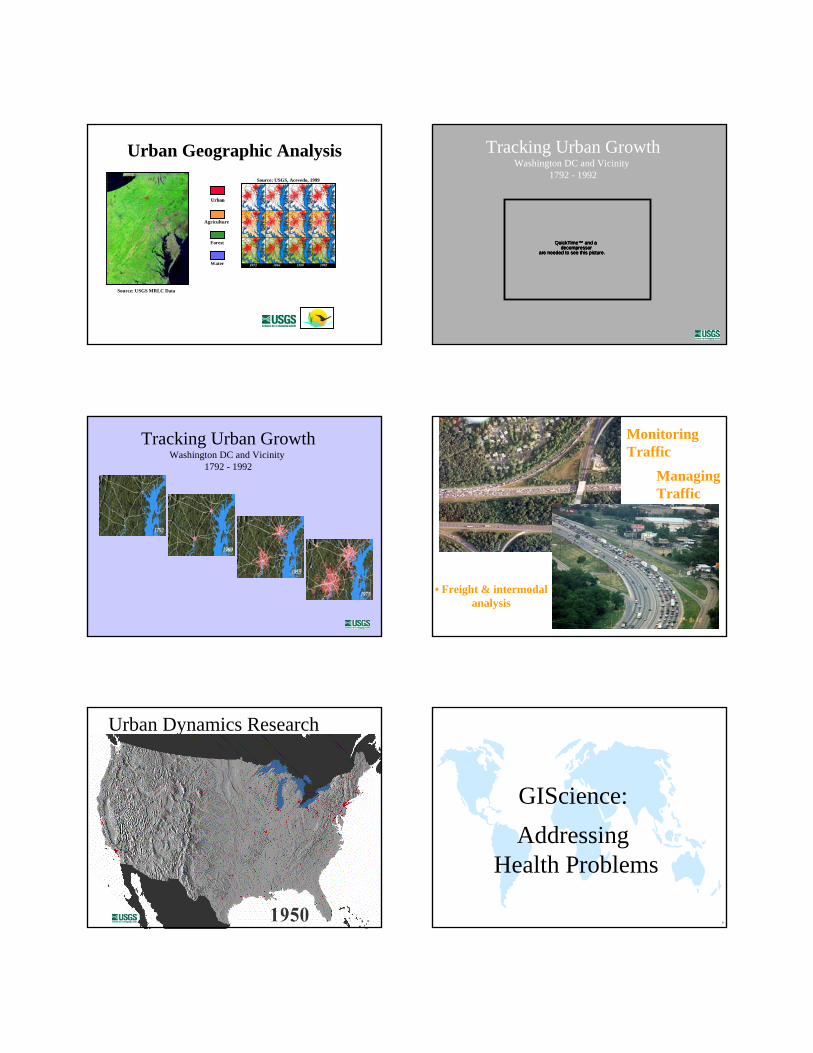
Water
Agriculture
Forest
UUrbanban
Source: USGS, Acevedo, 1999
Urban Geographic Analysis
Source: USGS MRLC Data
Tracking Urban GrowthWashington DC and Vicinity
1792 - 1992
QuickTime™ and a decompressor
are needed to see this picture.
QuickTime™ and a decompressor
are needed to see this picture.
QuickTime™ and a decompressor
are needed to see this picture.
QuickTime™ and a decompressor
are needed to see this picture.
Tracking Urban GrowthWashington DC and Vicinity
1792 - 1992
• Freight & intermodalanalysis
Monitoring Traffic
Managing Traffic
Urban Dynamics ResearchSocial Processes Affecting Land SurfaceSocial Processes Affecting Land SurfaceChanges at the Local and Regional LevelsChanges at the Local and Regional Levels
-- USGSUSGS
May 26, 2000
San Francisco Bay Area Washington-Baltimore
0
Addressing Health Problems
GIScience:
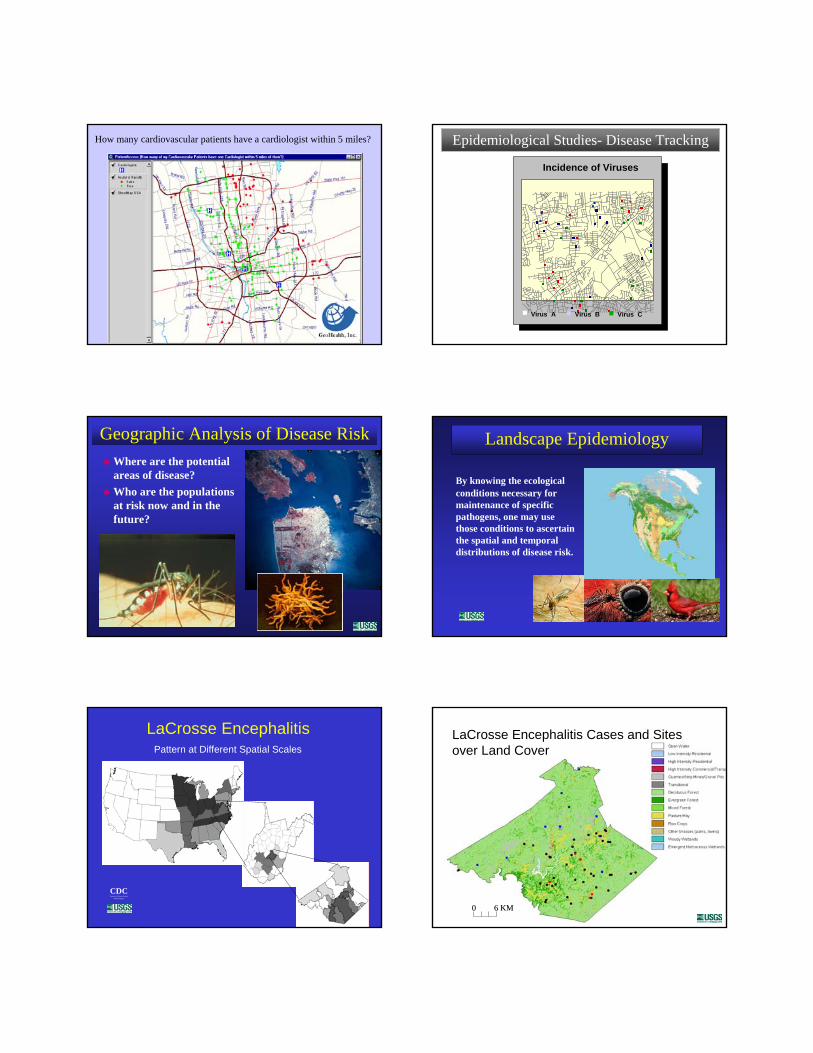
How many cardiovascular patients have a cardiologist within 5 miles? Epidemiological Studies- Disease Tracking
Virus CVirus BVirus A
Incidence of Viruses
Geographic Analysis of Disease RiskWhere are the potential areas of disease?Who are the populations at risk now and in the future?
Landscape Epidemiology
By knowing the ecological conditions necessary for maintenance of specific pathogens, one may use those conditions to ascertain the spatial and temporal distributions of disease risk.
Pattern at Different Spatial Scales
CDCCenters for Disease Control
and Prevention
LaCrosse Encephalitis LaCrosse Encephalitis Cases and Sitesover Land Cover
00 6 KM6 KMUSGS
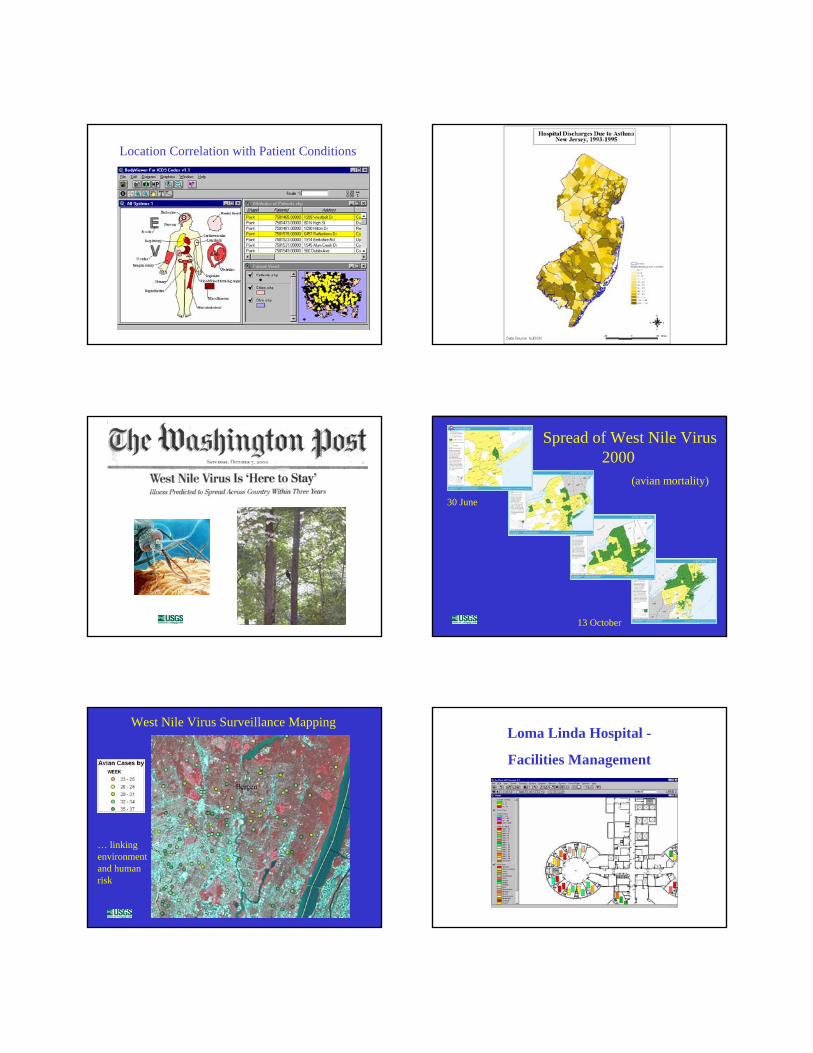
Location Correlation with Patient Conditions
30 June
13 October
Spread of West Nile Virus 2000
(avian mortality)
West Nile Virus Surveillance Mapping
… linking environment and human risk
Loma Linda Hospital -
Facilities Management

0
Responding to Emergencies
GIScience:
Oil Spill Response SystemOil Spill Response System
Oil Spill Contingency PlanningIntegration of GIS and Environmental Sensitivity Index DataOil Spill Response Decision Support
- Florida Department of Environmental Protection
Predicting Locations of Power Outages Dispatching and Routing Repair Crews
Overview MapShowing Outage
Locations
Current Outages Double Click
to Go to
Detail Map
Simulated Radioisotope Release in Washington D.C.Simulated Radioisotope Release in Washington D.C.5000 Ci of Cesium, 100% aerosolized by a conventional explosion
Pop 360,000Housing: 220,000
Contamination2 Hospitals31 miles of local streets 1 mile railroad
0.1 - 0.5
0.5 - 2.0
2.0 - 5.0
5.0 - 30
>30 REM
0
Educating ChildrenGIScience:
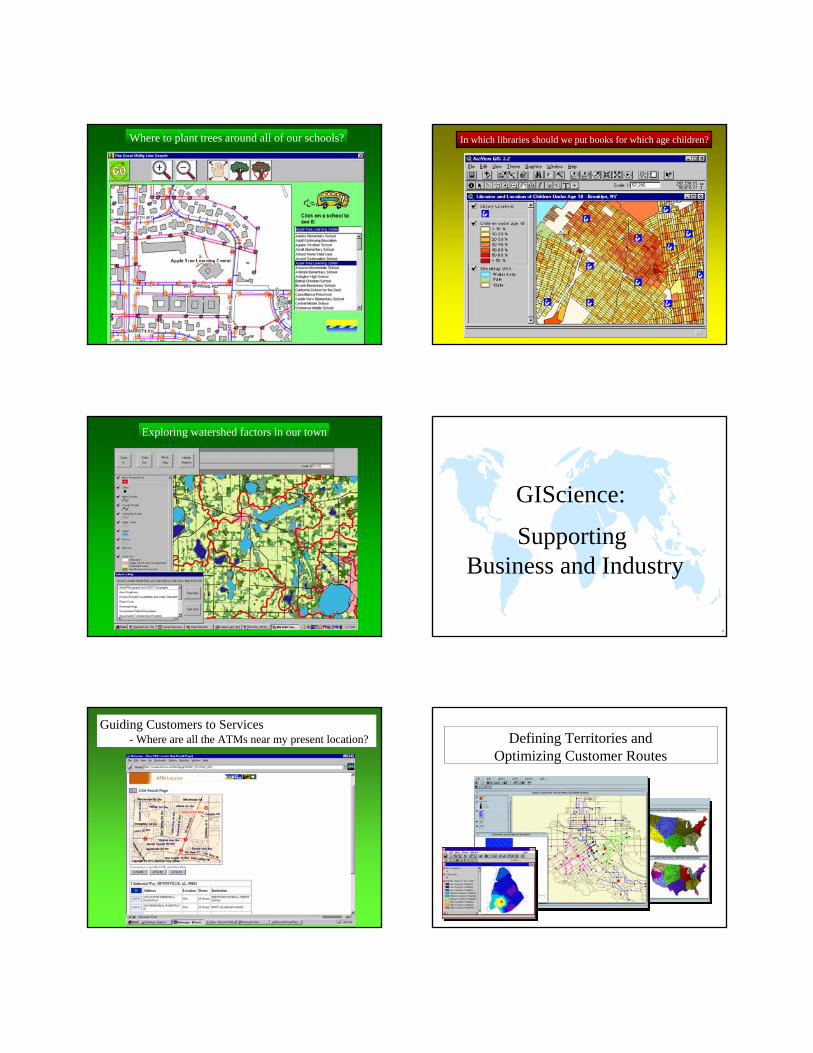
Where to plant trees around all of our schools? In which libraries should we put books for which age children?
Exploring watershed factors in our town
0
Supporting Business and Industry
GIScience:
Guiding Customers to Services- Where are all the ATMs near my present location?? Defining Territories and
Optimizing Customer Routes
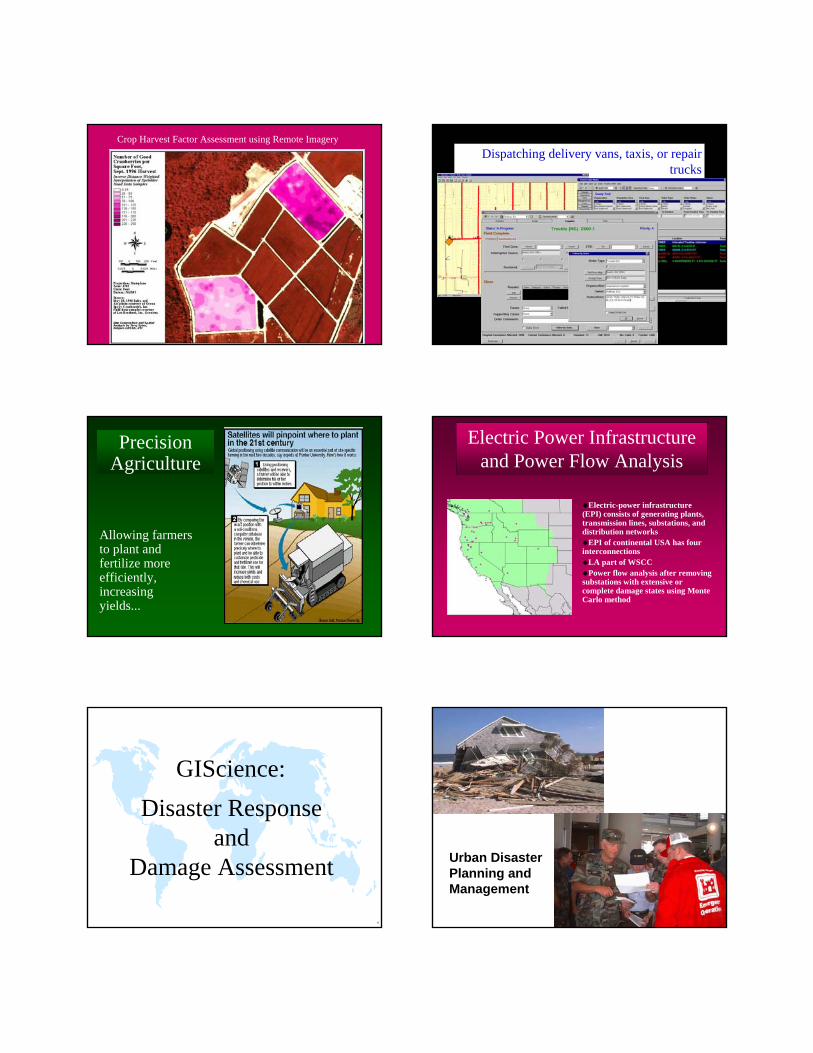
Crop Harvest Factor Assessment using Remote ImageryDispatching delivery vans, taxis, or repair
trucks
Precision Agriculture
Allowing farmers to plant and fertilize more efficiently,increasing yields...
Electric Power Infrastructure and Power Flow Analysis
Electric-power infrastructure (EPI) consists of generating plants, transmission lines, substations, and distribution networks
EPI of continental USA has four interconnections
LA part of WSCCPower flow analysis after removing
substations with extensive or complete damage states using Monte Carlo method
0
Disaster Responseand
Damage Assessment
GIScience:
Urban DisasterPlanning andManagement
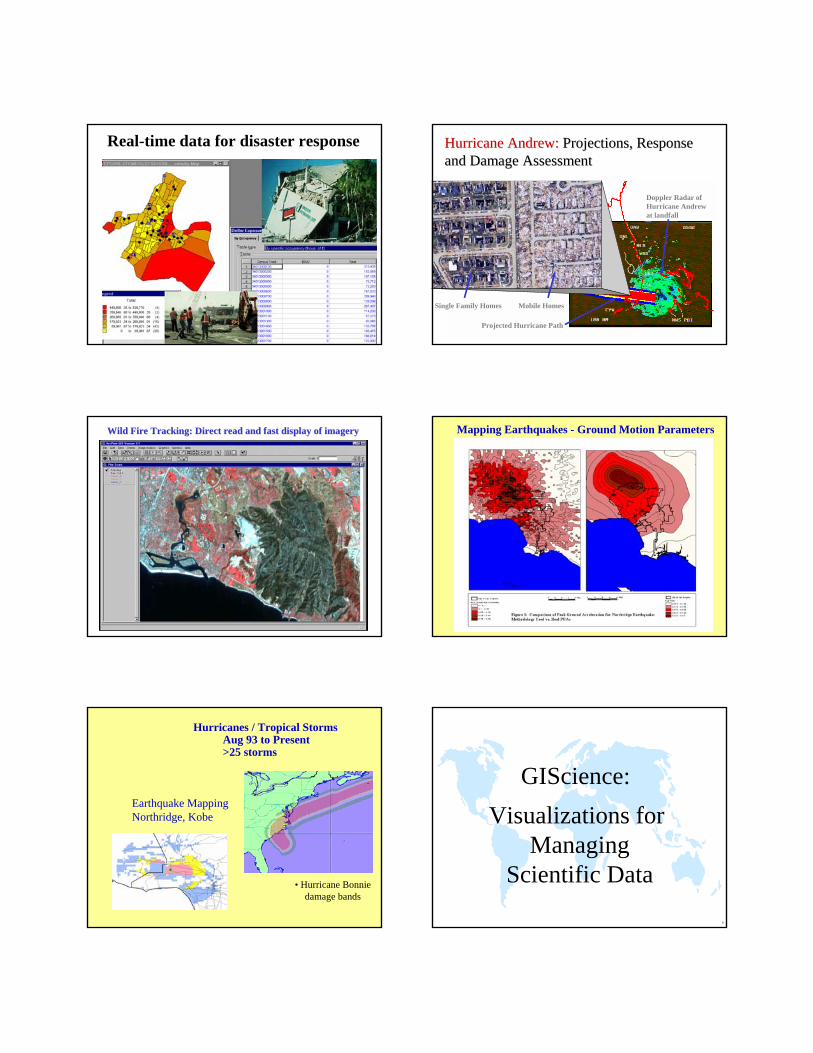
Real-time data for disaster response Hurricane Andrew:Hurricane Andrew: Projections, Response Projections, Response and Damage Assessmentand Damage Assessment
Single Family Homes Mobile Homes
Doppler Radar of Hurricane Andrew at landfall
Projected Hurricane Path
Wild Fire Tracking: Direct read and fast display of imageryWild Fire Tracking: Direct read and fast display of imagery Mapping Earthquakes - Ground Motion Parameters
Hurricanes / Tropical StormsAug 93 to Present>25 storms
• Hurricane Bonnie damage bands
Earthquake MappingNorthridge, Kobe
0
Visualizations for Managing
Scientific Data
GIScience:
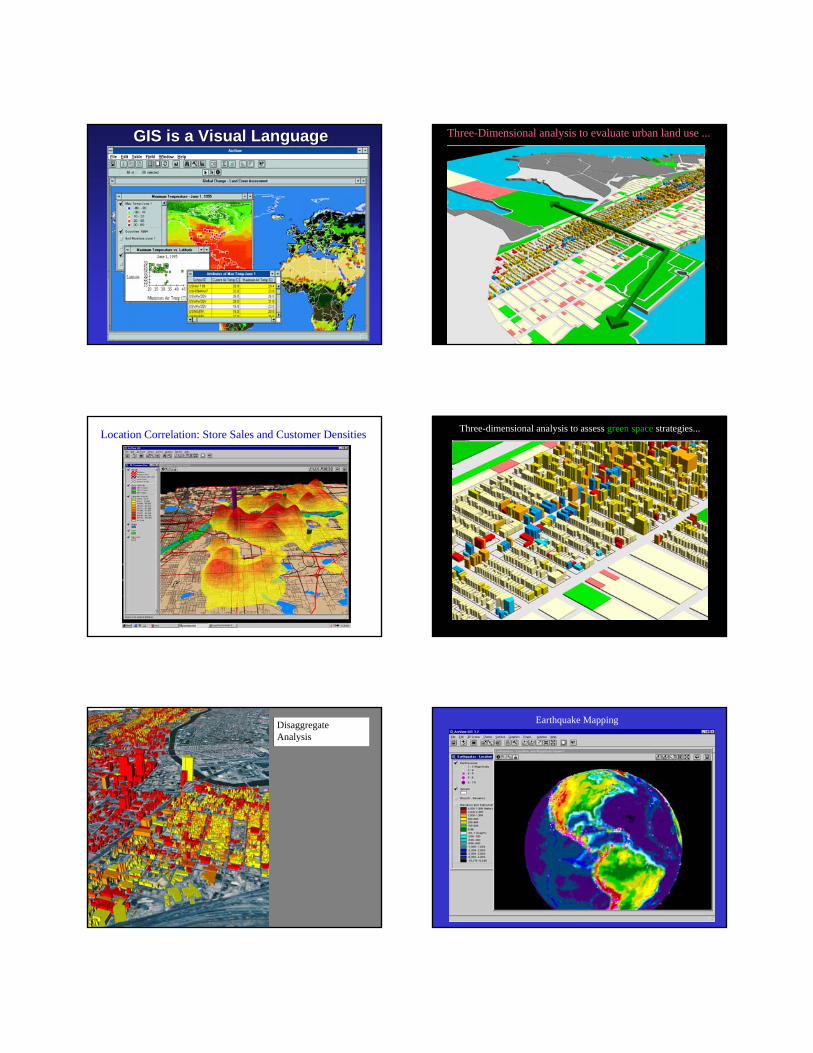
GIS is a Visual LanguageGIS is a Visual Language Three-Dimensional analysis to evaluate urban land use ...
Location Correlation: Store Sales and Customer Densities Three-dimensional analysis to assess green space strategies...
Disaggregate Analysis
Earthquake Mapping
JDJD--UC97 MISC#2UC97 MISC#2--JRJR 770
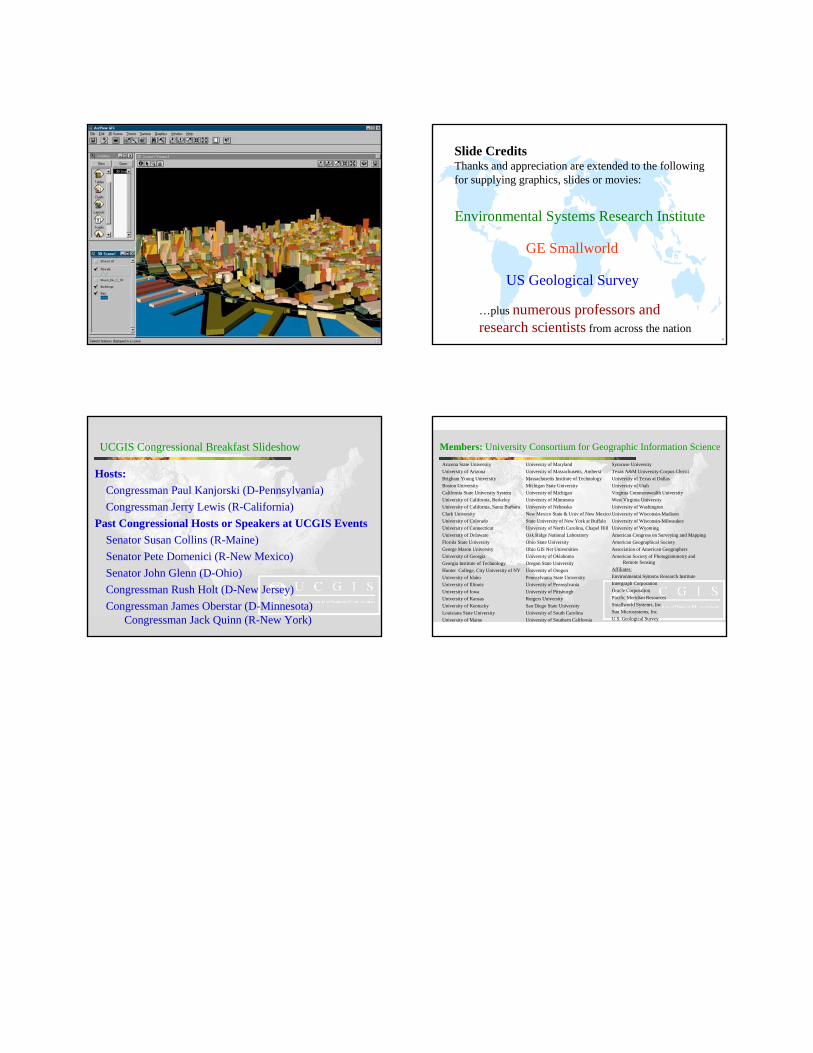
Slide CreditsThanks and appreciation are extended to the following for supplying graphics, slides or movies:
US Geological Survey
Environmental Systems Research Institute
GE Smallworld
…plus numerous professors and research scientists from across the nation
UCGIS Congressional Breakfast Slideshow
Hosts:Congressman Paul Kanjorski (D-Pennsylvania) Congressman Jerry Lewis (R-California)
Past Congressional Hosts or Speakers at UCGIS EventsSenator Susan Collins (R-Maine)Senator Pete Domenici (R-New Mexico)Senator John Glenn (D-Ohio)Congressman Rush Holt (D-New Jersey)Congressman James Oberstar (D-Minnesota)
Congressman Jack Quinn (R-New York)
Members: University Consortium for Geographic Information ScienceArizona State UniversityUniversity of Arizona Brigham Young University Boston University California State University SystemUniversity of California, Berkeley University of California, Santa Barbara Clark University University of Colorado University of Connecticut University of DelawareFlorida State UniversityGeorge Mason University University of Georgia Georgia Institute of Technology Hunter College, City University of NYUniversity of IdahoUniversity of Illinois University of IowaUniversity of KansasUniversity of KentuckyLouisiana State University University of Maine
University of MarylandUniversity of Massachusetts, Amherst Massachusetts Institute of Technology Michigan State University University of Michigan University of Minnesota University of Nebraska New Mexico State & Univ of New MexicoState University of New York at Buffalo University of North Carolina, Chapel Hill Oak Ridge National Laboratory Ohio State University Ohio GIS Net UniversitiesUniversity of Oklahoma Oregon State University University of OregonPennsylvania State University University of PennsylvaniaUniversity of Pittsburgh Rutgers University San Diego State University University of South CarolinaUniversity of Southern California
Syracuse University Texas A&M University-Corpus Christi University of Texas at DallasUniversity of Utah Virginia Commonwealth University West Virginia University University of Washington University of Wisconsin-Madison University of Wisconsin-Milwaukee University of Wyoming American Congress on Surveying and Mapping American Geographical Society Association of American GeographersAmerican Society of Photogrammetry and
Remote Sensing Affiliates:Environmental Systems Research Institute Intergraph CorporationOracle CorporationPacific Meridian ResourcesSmallworld Systems, Inc.Sun Microsystems, Inc.U.S. Geological Survey