Embed Size (px)
Citation preview

INVESTIGACION REVISTA MEXICANA DE FISICA 51 (3) 274–283 JUNIO 2005
Lock-in amplifier-based rotating-analyzer spectroscopic ellipsometer withmicro-controlled angular frequency
J.M. Flores-Camacho∗, O.F. Nunez-Olvera, G. Rodrıguez-Pedroza, A. Lastras Martınez, and L.F. Lastras-Martınez∗∗
Instituto de Investigacion en Comunicacion Optica, Universidad Autonoma de San Luis Potosı,Alvaro Obregon 64, 78000 San Luis Potosı, S.L.P., Mexico
Recibido el 6 de octubre de 2004; aceptado el 22 de febrero de 2005
We report on the development of a full operational rotating analyzer spectroscopic ellipsometer. This instrument employs a phase-sensitiveamplifier to process the optical signal as an alternative to Fast Fourier Transform analysis. We describe electronic hardware designed tostabilize the rotation frequency of the analyzer prism as well as to drive the device for the positioning of the polarizer prism azimuth. Theellipsometer allows for dielectric function measurement in the energy range from 1.7-5.5 eV, in both ambient air and Ultra High Vacuum(UHV). UHV measurements can be carried out at a temperature as low as 150 K. To evaluate the ellipsometer performance we present resultsof the determination of the complex dielectric function of a number of semiconductors, namely, GaSb, GaAs, InGaAs, CdTe and CdHgTe.
Keywords: Ellipsometers; control systems; dielectric function; optical properties of thin films
Se describen el diseno, la construccion y la operacion de un elipsometro espectroscopico de analizador rotante. El instrumento hace uso de unamplificador sensible a la fase para procesar la senal optica; esto como una alternativa al analisis de la misma por la tecnica de TrasformadaRapida de Fourier. Cuenta con dispositivos electronicos disenados para controlar la frecuencia de rotacion del prisma analizador, ası comopara posicionar elangulo azimutal del prisma polarizador. El elipsometro permite la medicion de la funcion dielectrica en el rango deenergıas desde 1.7 eV hasta 5.5 eV, tanto en aire como en condiciones de Ultra Alto Vacıo (UHV). En UHV es posible realizar mediciones atemperaturas tan bajas como 150 K. Para evaluar la operacion del elipsometro, se presentan resultados de la medicion de la funcion dielectricade un numero de semiconductores, en forma especıfica, de GaSb, GaAs, InGaAs, CdTe y CdHgTe.
Descriptores: Elipsometros; sistemas de control; funcion dielectrica; propiedadesopticas de pelıculas delgadas.
PACS: 07.60.Fs, 07,05.Dz; 78.20.-e; 78.66.-w
1. Introduction
The precise determination of the complex dielectric func-tion [1] of a semiconductor, and thus of its optical proper-ties [2], is of fundamental importance for both basic and ap-plied points of view. First of all, this determination is essen-tial in order to understand the physics underlying the opticalresponse of semiconductors [3–5]. Knowledge of the dielec-tric function of a semiconductor, for instance, allows for thedetermination of its critical point energies, which played aprominent role in the understanding of the electronic struc-ture of semiconductors. The experimental determination ofthe dielectric function plays a prominent role as well in thedevelopment of new materials and devices. In this regard,among the information we may obtain from the dielectricfunction, we include epilayer thickness and composition insemiconductor heterostructures [6,7], epilayer strain inducedby lattice mismatch [8, 9], and quantum confinement effectsin low-dimensional structures [10–12].
Spectroscopic ellipsometry (SE) is a well-known non-destructive technique for the experimental determination ofthe complex dielectric response of semiconductors [1, 13].Photometric-dynamic ellipsometers, which rely on the time-modulation of the polarization of light, have many advan-tages with respect to those of null design; they may, for in-stance, operate with relatively weak light sources and can beinstrumentally automated [6, 14, 15]. Ellipsometry providestwo parameters in a single measurement, thus allowing for
the simultaneous determination of both the real and imag-inary parts of the dielectric function with no need for fur-ther Kramers-Kronig analysis. SE presents advantages oversingle-parameter techniques, such as spectroscopic reflectiv-ity, as it allows for the possibility of numerically removingsurface overlayers and roughness effects [4].
Ellipsometry is based on the fact that linearly-polarizedlight incident on a medium at an oblique angle is in generalreflected with an elliptic polarization [1]. The change in lightpolarization upon reflection carries information of the opticalproperties of the medium under consideration [4]. Two kindsof automatic photometric ellipsometers have been developed:
1) instruments employing a photoelastic modulator toswitch between parallel and perpendicular polariza-tions of the incident, light which are characterized bytheir high speed [16], and
2) rotating-analyzer ellipsometers (RAE), which offerboth a simpler design and data interpretation. RAEsare the preferred choice when both accuracy and preci-sion are required [14,17].
In this paper, we report on the development of a spec-troscopic ellipsometer of the rotating-analyzer type. This in-strument is based on the use of a phase-sensitive amplifier forthe processing of the optical signal as an alternative to FastFourier Transform analysis [14]. This results in a somewhatsimpler procedure for the determination of the ellipsometricparameters [14].
LOCK-IN AMPLIFIER-BASED ROTATING-ANALYZER SPECTROSCOPIC ELLIPSOMETER WITH. . . 275
We further describe electronic hardware designed forboth the determination of the optical plane of incidence, andthe frequency stabilization of the rotating analyzer prism.As is well known, an accurate measurement of the dielec-tric function calls for an accurate determination of the opticalplane of incidence. To enhance the signal-to-noise ratio, onthe other hand, it is crucial to stabilize the analyzer rotationfrequency.
The rest of the paper is organized as follows. In Sec. 2we describe the optical arrangement and instrumental imple-mentation of the ellipsometer. Alignment calibration and ex-perimental data acquisition are described in Sec. 3. In Sec. 4,we present measurements of dielectric functions for a num-ber of semiconductors in order to evaluate the operation ofthe instrument. Finally, conclusions are given in Sec. 5.
2. Instrument description
2.1. Optical setup
The configuration of the ellipsometer described here is of thepolarizer-sample-analyzer (PSA) type. In Fig. 1 we showa schematic diagram of this configuration. Monochromaticlight is passed through a linear polarizer with an azimuth an-gleP and focused on a sample surface. After reflection, lightis passed through a rotating linear polarizer and finally is de-tected by a photomultiplier tube. This set up produces a time-dependent signal at the output of the photodetector.
Two light sources are employed in the ellipsometer set up,a 75 W Xe short-arc lamp suitable for measurements in theenergy range from2.7 to 5.5 eV and a150 W tungsten lampfor the1.7− 3.0 eV energy range. By using a tungsten lampin the near IR range we avoid the energy range of the Xe lampthat is dominated by line spectra [18]. Both light sources arelocated in the same housing. Lamps are selected by a simplemechanism and only a small realignment is necessary uponshifting them.
The light beam exiting from the source lamp is focusedby means of twof/6 spherical mirrors at the entrance slitof a 0.5 −meter focal length monochromator (Jobin-Yvon-Spex, model HR-460, f/5.3). Two diffraction gratings (1200and600 lines/mm) allows for photon energy scanning from1.7 to 5.5 eV. Light exiting the monochromator is collimatedwith a 4′′ focal lengthf/2 mirror. Two corrected Rochonquartz prisms (Optics for Research, model PUR-10-2-X-Zwith less than10 sec ordinary ray beam deviation) were usedas polarizer and analyzer devices. Light reflected by the sam-ple impinges on the analyzer prism wedge that linearly po-larizes the elliptic beam. The second wedge works as a de-polarizer, thus a time dependent modulated signal reaches thedetector [19]. The extraordinary ray beam at the output of thepolarizer is blocked by an iris diaphragm that is also usefulin reducing the light spot to fit the sample surface area (lessthan1×1 cm2).
Upon reflection on the sample surface, light becomes ingeneral elliptically polarized due to the different phase shift
betweens andp polarizations. It is the aim of ellipsometry todetermine the parameters (azimuth and ellipticity) of the po-larization ellipse. This is done through the Fourier analysisof the time-dependent photodetector output signal. Details ofthis analysis are discussed in the next section.
The azimuth angle of the polarizer was set toP = 30 [14]. We used an angle of incidence of67. Thisangle is close to Brewster’s angle for most semiconductors inthe wavelength range of interest, and maximizes the differ-ence in phase shift that thes andp beam components experi-ence upon reflexion.
The instrument allows for measurements in both ambi-ent air and Ultra-High-Vacuum (UHV). In the latter case, thesample is placed inside UHV chamber with a base pressurein the low 10−10 Torr range. Light is introduced/extractedthrough strain-free fused quartz optical ports (Fig. 2). Thesample manipulator permits heating up to 1200K, thus allow-ing for the removal of either the surface oxide or the protec-tive layer arsenic that is sometimes deposited to avoid oxida-tion. The sample holder allows as well for sample coolingdown to 150K.
Light is detected by means of a Hamamatsu R1464 end-on photomultiplier with a GaAs photocathode. This photo-multiplier was selected because of its high sensitivity and rel-atively low polarization dependence [14].
FIGURE 1. Schematics of the PSA ellipsometer with the angle con-vention used in this work.
FIGURE 2. Basic set up of the rotating-analyzer ellipsometeradapted to a UHV chamber. S is the sample,φ0 is the angle ofincidence,ω is the angular frequency of the analyzer and [VP1],[VP2] are the strain-free optical ports. RA and LP stand for rotat-ing analizer and linear polarizer prisms, respectively.
Rev. Mex. Fıs. 51 (3) (2005) 274–283

276 J.M. FLORES-CAMACHOet al.
2.2. Optical analysis
Light polarization is conveniently specified in terms of thecomplex variableχ defined as
χ =Es
Ep(1)
whereEs andEp are, respectively, the perpendicular and par-allel electric field complex components of the electromag-netic wave (Fig. 1).
In terms of the polarizations of the reflected wave,χ0,and the wave exiting the analyzerχA, where
A = ωt + A0 (2)
is the angle of the analyzer prism, the light intensity reachingthe photodetector may be obtained from the squared mag-nitude of the projection of the incoming polarization on theanalyzer orientation
I =
∣∣∣∣(E∗Ax E∗
Ay)(
E0x
E0y
)∣∣∣∣2
| ~EA|2| ~E0|2. (3)
From Eqs. (1) and (3) we may write
I(t) = I0χ0χ
∗0χAχ∗A + χ0χ
∗A + χAχ∗0 + 1
χ0χ∗0χAχ∗A + χ0χ∗0 + χAχ∗A + 1, (4)
whereI0 is the light intensity reflected by the sample.If the reference of the analyzer is arbitrarily chosen as in
Eq.(2), the polarization state at the output of the analyzer is
χA =tanA + χA0
1− χA0 tan A, (5)
whereχA0 is the polarization state atA(t = 0). However,this expression can be simplified by assuming a time refer-ence so thatA0 = 0 [20], asχA = tan A (see Fig. 1). Ac-cordingly, we may write Eq. (4) in the form
I(t) =I0
2(1 + α cos 2A + β sin 2A) (6)
whereα andβ are the normalized Fourier coefficients givenby
α =1− |χ0|21 + |χ0|2 (7)
and
β =2Re(χ0)1 + |χ0|2 (8)
From Eqs. (7) and (8) the polarization of the light reflectedby the sample is given by
χ0 =1
1 + α
[β ± i(1− α2 − β2)
12
], (9)
where the± sign indicates that the handedness of the ellip-tic polarization is not determined,i.e., both polarizationsχ0
andχ∗0 lead to the sameα andβ Fourier coefficients [20].
Taking into account that the state of polarization of theincident light for a PSA system is given byχi = tan P , thecomplex reflectance ratioρ = χi/χ0 [21,22] is
ρ =(1 + α) tanP
β ± i(1− α2 − β2)12. (10)
Eq.(10) is valid only for ideal polarizers; consequently, it isapplicable when precision rather than accuracy is of primaryimportance, otherwise the effects of the optical activity ofboth polarizer and analyzer prisms must be taken into ac-count [23].
The sample complex dielectric response is given as afunction of the ratioρ as [1]
ε = sin2 φi
[1 + tan2 φi
(1− ρ
1 + ρ
)2]
, (11)
whereφi is the angle of incidence.
3. Instrumental Implementation
3.1. Mechanical system
An accurate control of the polarizer angular position of thepolarizer prism is essential for the determination of the opti-cal plane of incidence. To achieve this control, the polariz-ing prism is mechanically coupled to a stepping motor with a10 : 1 gear ratio. This ratio leads to a resolution of the polar-izer angular position of∼ 0.09o /step. The stepping motoris controlled by the ellipsometer computer.
The sample-holders for both ambient air and UHV op-eration allow for a precise sample alignment,i.e, x−y−zmotions, quantification of the angle of incidence and opti-cal plane correction. The sample holder for ambient air is ahome-made plate similar to the one described in Ref. 24. Forthe UHV chamber the manipulator is equipped with a heater,an NL cooling system and a K-type thermocouple.
The analyzer prism rotor is one of the critical componentsof the ellipsometer. It must allow for prism rotation, bothvibration and precession-free, at a mechanical frequency ofaround45 Hz. In our case, the analyzer prism ([A] Fig. 3) isheld in place inside a hollow steel cylinder [D] with the helpof six adjusting screws [E]. These screws, three at each endof the prism cylinder, permit the prism to be aligned concen-trically with the rotation axis. The analyzer prism is drivenby a D.C. electric motor [M] with a3300 rev/min maxi-mum speed. The motor shaft is coupled to the prism rotorwith the help of a transmission band [B] and a pulley [C].The rotor is mounted on two sealed bearings [G] fastenedto the rotor housing [F]. The reference signal for the phase-sensitive amplifier is provided by an arrangement consistingof an emitter-photodetector pair [I] and a rotating half-plateblade [H]. The motor rotation frequency is controlled througha micro-encoder [J] as detailed in the next subsection.
Rev. Mex. Fıs. 51 (3) (2005) 274–283

LOCK-IN AMPLIFIER-BASED ROTATING-ANALYZER SPECTROSCOPIC ELLIPSOMETER WITH. . . 277
FIGURE 3. Mechanical assembly for the rotating analyzer of the el-lipsometer. The analyzer prism [A] is mechanically coupled to theD.C. electric motor [M] by means of a transmission band [B] anda pulley [C]. The prism is held inside a cylindrical steel carrier [D]with three screws [E] fastened to a concentric exterior cylinder.This system is held in its housing [F] by two sealed bearings [G]. Ahalf plate blade [H], passing between the emitter and the detectorof the opto-pair [I] provides the lock-in amplifier reference signal.The motor velocity is measured and controlled through a micro-encoder [J].
3.2. Angular control of the polarizer
In order to control the angular position of the polarizer prism,we have used a two-winding stepping motor. The electroniccircuit of the stepping motor comprises control and powerstages as shown in Fig. 4. The control stage is configuredby means of the integrated circuit (IC)L297 [25]. This ICgenerates the byte sequence to move the motor accordingto the input signals:CLOCK (clock), ENABLE (enable),CW/CCW (direction) andHALF/FULL (mode). Thesecontrol signals are supplied by the PC through the data linesD0−D3 of the parallel port.ENABLE turns on and off theoutput signals of theL297, CLOCK controls the speed of ro-tation,HALF/FULL sets the mode of rotation in half on fullsteps, andCW/CCW the direction of rotation, clockwise orcounterclockwise.
The output signals of theL297 are connected to the powerstage, designed on the basis of the H-bridgeL298N [25]. Thewindings of the motor are connected to pins2, 3, 13, and14 in theL298N bridge. We have also connected eight fastdiodes(2A, time response < 200ns) to protect theL298NIC as is it shown in Fig. 4.
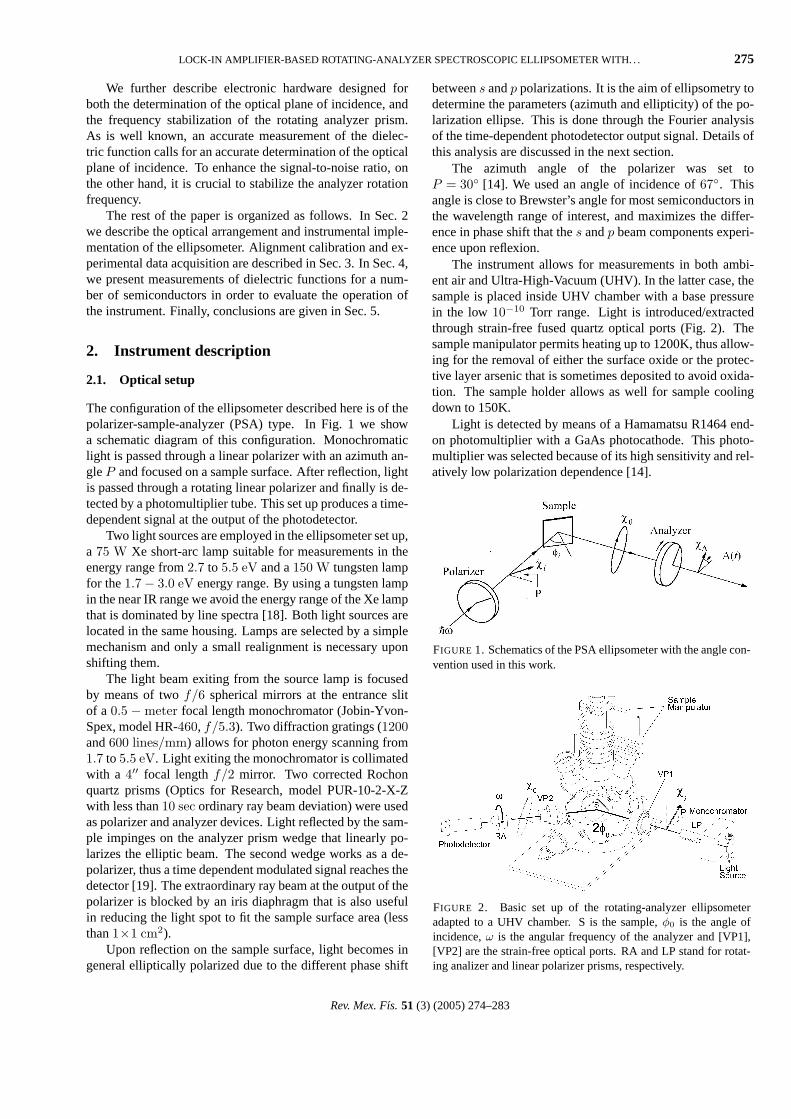
FIGURE 4. Electronic diagram of the stepper motor control. Thecontrol is formed by two parts: a control(L297) and a power(L298N) stages. We have used the values:Vref = 1.8 V andRs1 = Rs2 = 0.3 Ω.
3.3. Speed control of the analyzer
In order to preserve calibration constants throughout the dataacquisition period, the analyzer frequency must be kept sta-ble; otherwise, it is known that frequency fluctuations leadto significant errors that cause a phase shift in the modulatedsignal [14], thus reducing the correlation between consecu-tive experimental points.
The analyzer prism is driven by a DC motor that isfrequency-stabilized by aLM629 precision DC motor con-troller. TheLM629 controller is configured by
1) a host I/O block (IOB),
2) a trapezoidal velocity profile generator block (TGB),
3) a feedback position block (FB) and
4) a digital PID filter (PID).
The IOB receives commands and motion parameters fromthe PC via the data lines D0-D7. With this information theTGB calculates the required trajectory. The motor position isdetected by means of an optical incremental micro-encoder(MES-20-200P of MTL) with a resolution of 200 pulses perrevolution, coupled to the motor shaft (see Fig. 3[J]). The Aand B signals of the encoder are the input signals for the FBand provides feedback for closing the position servo loop by
Rev. Mex. Fıs. 51 (3) (2005) 274–283

278 J.M. FLORES-CAMACHOet al.
means of the quadrature signal method. TheLM629 sub-stracts the actual position (FB position) from the desired po-sition (TGB position) and the resulting error is processed bythe signal PID filter to drive the motor to the desired position.The PID generates, according to error signal and control pa-rameters, pulse width modulation (PWM) and rotating direc-tion signals. These signals drive the power supplied to themotor through the H-bridgeLMD18200T [26].
The speed control system is mounted on two electriccards:
a) a holding control stage which is inserted into a ISA PCslot and
b) a power stage, as is shown in Fig. 5 and Fig. 6, respec-tively.
The interconnection between both cards is opto-coupled inorder to isolate the PC from the motor power supply.
FIGURE 5. Electronic diagram of the speed control of the DCmotor. The system comprises two parts: (a) the address decoder74LS688N and (b) the microprocessorLM629. The control boardis inserted in the ISA slot of the PC. The ISA signals used in the de-sign are:ST1 A0− ST1 A9 (address),ST1 AEN (address en-able),ST1 D0− ST1 D7 (data),ST1 IOR (Input/Output read),ST1 IOW (Input/Output write).
FIGURE 6. Power board diagram of the speed control of the rotat-ing analyzer. The LMD18200 H-bridge receives the control signalsDIR and MAG from the LM629 and sends the controlled voltageto the DC motor through its outputs 1 and 2.
An 8-bit magnitude comparator74LS688 is used as ad-dress decoder in the control stage [27]. When the address—selected by the dip switch SV1—is sent by the PC, the74LS688, enables theLM629 to receive and send data orcommands.
3.4. Light detection and signal processing
We employed a photomultiplier tube (PMT) for light detec-tion. The high voltage bias required by the photomultiplieris provided by a Kepco Operational Power Supply, modelOPS 2000B with a2.0 MΩ internal feedback resistance. Thepower supply is driven by a Keithley programmable currentsource model220, controlled by the PC via the IEEE port.The PMT housing allows for PMT cooling to temperaturesdown to−20C. The PMT DC output voltage is kept con-stant along the entire wavelength scan by varying the PMTbias through the programmable current source.
The PMT output is fed to an operational amplifier inlow-pass filter configuration [14, 28]. Two selectable10kΩand25kΩ feedback resistors allow for flat amplifier response(3dB) for frequencies up to340Hz and135Hz, respectively.The operational amplifier DC and AC outputs are measuredwith the help of a Keithley 2002 voltimeter and aSR530Stanford Research lock-in amplifier, respectively. We havechosen a synchronous detection technique to determine theAC signal amplitude due to its band-pass filtering capabil-ity at the reference frequency. This frequency is provided byan optical encoder synchronously rotating with the analyzerprism.
Rev. Mex. Fıs. 51 (3) (2005) 274–283

LOCK-IN AMPLIFIER-BASED ROTATING-ANALYZER SPECTROSCOPIC ELLIPSOMETER WITH. . . 279
In terms of the output voltages provided by the light de-tection system, Eq. (6) may be written as [14]
I=kV [1+ηa cos 2(A+AF )+ηb sin 2(A+AF )] , (12)
whereV is the average DC voltage,AF is the signal phasedelay due to signal-processing circuit,1/η is the relative at-tenuation of the AC signal with respect to the DC component,andk is a constant of proportionality. We also have
a =√
2V
ν1 (13)
and
b =√
2V
ν2 (14)
whereν1 andν2 are respectively, the rms phase and quadra-ture signal amplitudes as measured by the lock-in amplifier.We note that, so defined,a andb correspond to the normal-ized signal Fourier coefficients.
4. Operation
4.1. Calibration routine
As discussed in Sec. 2.2, it is convenient to choose the timereference of the rotating analyzer in order to getA0 = 0.To do so, the polarizer prism is loosened from its holder androtated to make the zero-azimuth angle position to approxi-mately coincide with the onset of an optical encoder pulse. Amore preciseA0 = 0 setting is used out during the calibrationprocedure.
The use of a synchronous detection technique to measurethe signal amplitudes AC leads to a relatively simple calibra-tion routine. The aim of this routine is to determine param-etersAF andη in Eq. (12). These parameters are necessaryto obtain the complex reflectance ratioρ from the measureda andb coefficients. The calibration procedure is based onthe fact that the state of polarization of the reflected light islinear if and only if the incident light is linearly polarized ei-ther parallel or perpendicular to the plane of incidence. Cal-ibration is initiated by manually placing the polarizer at itsapproximate zero-azimuth anglePs (that will be set equal tozero). The lock-in reference phase angle is then selected sothat a zero reading is obtained in one of the two signal chan-nels. Through this zero-reading adjustment we compensatefor phase angleAF as well as for some prism alignment er-ror that may have occurred when first attempting to establishthe conditionA0 = 0. Next, by varying the polarizer anglearoundPs = 0, we compute the set of residualsr(P ) definedby
rj(Pj) = 1− a2j − b2
j , (15)
wherej is an integer,Pj is the azimuth angle of the polarizerprism andaj andbj are the normalized signal Fourier coeffi-cients. In terms of theα andβ coefficients Eq. (15) is writtenas
r(P ) = 1− 1η2
(α2 + β2). (16)
We note thatr(P ) has a minimum atP = P (0), whereP (0) isthe true zero azimuth angle of the polarizer. Thus, by makinga power expansion ofr(P ) aroundP (0) and by noting thatα = −1 andβ = 0 at P = P (0), we obtain the approximateexpression
r(P ) =(
1− 1η2
)+ γ(P − P (0))2. (17)
Finally, by fitting Eq. 17 to the parabola [14]:
r(P ) = c0 + c1P + c2P2 (18)
we obtain
P (0) = − c1
2c2(19)
and
η =(
1− c0 +c21
4c2
)− 12
(20)
An example of a calibration parabola is shown in Fig. 7.Typical values forη are in the range from 1.04-1.21 while forAF we found a value of 15.
The calibration procedure employed in the ellipsometerdescribed here allows for a simple determination of the phasedelayAF as well as for a simple setting of the condition
FIGURE 7. Calibration parabola used to obtain the polarizer az-imuth reference angle for an n-doped GaSb(001) sample (opencircles). The solid line is the best fit obtained by using Eq. (18).The fit leads to the valuesη = 1.157 andP (0) = 0.95.
Rev. Mex. Fıs. 51 (3) (2005) 274–283

280 J.M. FLORES-CAMACHOet al.
FIGURE 8. Dielectric function of n-doped (001) GaSb (open cir-cles) compared with the results of a chemically etched surface ofintrinsic GaSb (solid line) [2].
A0 = 0. This leads to a somewhat simpler calibration routinethan that employed by Aspnes and coworkers [14].
The calibration routine, in short, determines the actualplane of incidence given by the optics alignment and the ref-erence analyzer prism azimuthA0 and corrects the effects ofthe processing electronics on the amplitude and phase of thesignal.
4.2. Data acquisition
The relation between intensity and voltage-related quantitiesis obtained by comparing Eqs. (6) and (12). Through thiscomparison we may write for parametersα andβ
α = η√
2∑N
i=1 ν(i)1 − ν10∑N
i=1 V(i) − V 0
(21)
and
β = η√
2∑N
i=1 ν(i)2 − ν20∑N
i=1 V(i) − V 0
(22)
whereN is the number of experimental sample data at eachwavelength and,ν10, ν20 andV 0 correspond to residual volt-ages due to environmental light, taken at the beginning of theexperiment.
FIGURE 9. First energy-derivative of (a) real and (b) imaginaryparts of the spectra shown in Fig. 8.
Discernment on the assignment of lock-in channels toαand β depends on calibration phase selection and analyzerprism direction. For the measurement of the spectra shownin Sec. 4, the ellipsometer was calibrated by using the condi-tion α = −1 andβ = 0 of the Eq. (17) and the rotation ofthe analyzer prism was set as indicated in Fig. 2. Finally, thecomplex ratioρ is calculated using the plus sign in Eq. (10)and then the dielectric function is obtained with Eq. (11).
5. Results
To evaluate instrument performance we have measured thedielectric function of a number of semiconductors. In Fig. 8we show the dielectric function of a GaSb(001) cristal dopedwith 5×1017 cm−3 donors. The measurement was under-taken at room temperature in the energy range from1.7 to4.8 eV. We corrected for the surface oxide layer by usinga three phase model (air/oxide/GaSb) [29] and the refractiveindex of the native oxide reported in the literature [30]. Thereal and imaginary dielectric function spectra obtained (cor-responding to a 6 nm thick oxide layer) are shown with opencircles in Fig. 8, along with dielectric function spectra (con-tinuous lines) reported in the literature [2]. The values of thelabeled critical pointsE1 andE1 + ∆1, 2.047 and2.488eV,respectively, were taken from Ref. 31, while the values ofE2
and of the points ofΓ symmetry E′0 and E′0 + ∆′0 are
Rev. Mex. Fıs. 51 (3) (2005) 274–283

LOCK-IN AMPLIFIER-BASED ROTATING-ANALYZER SPECTROSCOPIC ELLIPSOMETER WITH. . . 281
FIGURE 10. Comparison of the pseudo-dielectric functions ofCdTe and a Cd.18Hg.82Te (1µm thick epilayer grown on CdTe).
FIGURE 11.(a) The dielectric function of a0.5 µm thickIn0.3Ga0.7As epilayer extracted from the measured pseudo-dielectric function of an InGaAs/GaAs heterostructure grown byMBE (circles) and In0.27Ga0.73As from Ref. 8 (continuous line).(b) Comparison of first energy derivatives ofε2.
FIGURE 12. Real (open circles) and imaginary (filled circles) partsof the dielectric function of intrinsic (001)GaAs at (a) 300K and(b) 150 K aroundE1 andE1 +∆1, measurements were carried outin ultra-high-vacuum.
from Ref. 31. We note the excellent agreement between ourspectra with those previously reported.
In Fig. 9 we show the first energy-derivative of the spec-tra of Fig. 8. As can be seen, the signal-to-noise ratio ishigh enough for the derivative spectra to show a well-definedstructure, allowing for a precise determination of interbandtransition energies.
In Fig. 10 we plot the measured pseudo-dielectric func-tions of CdTe (dashed lines) and CdxHg1−xTe (continuouslines). Measurements were performed by using a tungstenlamp for energies below 2.7 eV and a Xe lamp for higher en-ergies. By assuming a quadratic dependence of the E1 energywith CdTe compositionx [32] we have determinedx ≈ 0.18.We note that the presence of a native oxide layer [33] changesthe relative amplitude between E1 and E1 + ∆1 and dimin-ishes the high energy peaks (4.5− 5.5 eV) of 〈ε2〉.
As an example of the determination of the dielectric func-tion of thin heteroepitaxial layers, in Fig. 11 we show thedielectric function of an In0.3Ga0.7As thin film grown byMolecular Beam Epitaxy (MBE) on a GaAs substrate. Byusing a three-phase model (air/epitaxial-layer/substrate) andthe measured epitaxial layer thickness we could subtract the
Rev. Mex. Fıs. 51 (3) (2005) 274–283

282 J.M. FLORES-CAMACHOet al.
GaAs contribution from the measured pseudodielectric func-tion. The resultingIn0.3Ga0.7As dielectric function is shownwith open circles in Fig. 12(a), along with the dielectric func-tion of In0.27Ga0.73As (continuous lines) reported in the lit-erature [8]. As it can be seen, the agreement of our spectrawith those of the literature is excellent.
As a final result, we would like to report on the measure-ment of the dielectric function of a non-doped MBE GaAs(001) epilayer, at both room temperature and at T=150K.Results are shown in Fig. 12(a) (room temperature) andFig. 12(b) (T=150K). The measurements were carried out in-side the UHV chamber. The samples were covered with anAs2 film in order for them to be transferred form the growthchamber to the ellipsometer chamber. Once inside this lastchamber the As2 film was thermally desorbed previously tomeasurement. The chamber pressure was kept in the lower10−10 range after desorption. Notice that the energy peaksare narrowed and shifted to higher energies as the tempera-ture decreases. Both the energy shift (∼ 90 meV) and broad-enings observed in our experiments are consistent with thosereported in the literature [34].
Finally, by using Eqs.(5a-b) and (8b) of Ref. 23 we cal-culated the effect of the analyzer and polarizer prisms optical
activity on the spectra shown in Figs. 8-12, we found a neteffect in ε of the order of1% as estimated by Aspnes [23].We share the conclusion of Ref. 23 that sample preparation ismore important than correction of prisms optical activity.
6. Conclusions
We have designed and constructed a full operative spectro-scopic ellipsometer. The accurate control of the polarizer an-gle and of the analyzer angular frequency, allow us to mea-sure the spectroscopic dielectric function of several semicon-ductors with high precision and with a high signal-to-noiseratio.
Acknowledgments
The authors would like to thank to Dr. R.E. Balderas-Navarrofor helpful discussions, M.C.J. Nieto-Navarro, E. Ontiverosand J. Ramırez for their expert technical support and R.A.Flores for the drawing of Fig. 3. This work was partially sup-ported by CONACyT through grant No. 41248-F.
∗. CONACyT fellow
∗∗. Corresponding author: Phone: +52-444-825-0183; fax: +52-444-825-01-98; e-mail: [email protected]
1. P. Yu and M. Cardona,Fundametals of Semiconductors.Physics and Material Properties(Springer-Verlag, Berlin,1996) p. 237.
2. D.E. Aspnes and A.A. Studna,Phys. Rev. B27(2) (1983) 985.
3. M. Munozet al., J. Appl. Phys.87(4) (2000) 1780.
4. A.B. Djurisic, Y. Chan, and E. Hebert Li,Materials Science andEngineering R38(6) (2002) 237.
5. S. Adachi,J. Appl. Phys.66(12) (1989) 6030.
6. D.E. Aspnes,SPIE proc.946(1988) 84.
7. D.E. Aspnes, S.M. Kelso, R.A. Logan, and R. Bhat,J. Appl.Phys.60 (1986) 754.
8. Pickering, R.T. Carline, T. Emeny, N.S. Garawal, and L.K.Howard,Appl. Phys. Lett.60(19) (1992) 2412.
9. J.H. Bahnget al., Solid State Communications120(2001) 343.
10. M. Garrigaet al., Phys. Rev. B36 (1987) 3254.
11. R.P. Vasquez, R.T. Kuoda, and A. Madhukar,J. Appl. Phys.61(8) (1987) 2973.
12. U. Schmid, N.E. Christensen, M. Cardona, F. Lukes, and K.Ploog,Phys. Rev. B45(7) (1992) 3546.
13. R.M. A Azzam and N.M. Bashara,Ellipsometry and PolarizedLight (North Holland, Amsterdam, 1987) p. vi.
14. D.E. Aspnes and A.A. Stunda,Appl. Optics14(1) (1975) 220.
15. P.S. Hauge and F.H. Dill,IBM J. Res. Devel.17 (1973) 472.
16. S.N. Jasperson and S.E. Schnatterly,Rev. Sci. Instrum.40(1969) 761.
17. B.D. Cahan and R.F. Spanier,Surface Science16 (1969) 166.
18. H. Kuzmani, Solid State Spectroscopy. An Introduction(Springer, Germany, 1998) p. 101.
19. D. Kliger, J. Lewis, and, C. Randall,Polarized Light in Opticsand Spectroscopy(Academic Press, USA, 1990) 92.
20. See Ref. 13, p. 257.
21. H. Tompkins,A Users Guide to Ellipsometry(Academic Press,USA, 1993) 17.
22. Definition of ρ after Drude, the inverse also can be used byregarding consistency. R.H. MullerSurface Science16 (1969)14.
23. D.E. Aspnes,J. Opt. Soc. Am. 64(6) (1974) 812.
24. L.F. Lastras, R.E. Balderas, and A. Lastras,Rev. Sci. Instrum.64 (1993) 2147.
25. SGS-Thomson Microelectronics L297/A/D Stepper motor con-trollers.
26. National Semiconductor Linear Data-book (1999).URL:http://cache.national.com/ds/LM/LM628.pdf
27. TEXAS INSTRUMENTS INCORPORATED. SemiconductorGroup,The TTL Data-book.
28. L.F. Lastras,Master Degree ThesisUnpublished.
29. O. S. Heavens,Optical Properties of Thin Solid Films(Dover,USA, 1991) 63.
30. D.E. Aspnes, B. Schwartz, A.A. Studna, L. Derick, and L.A.Koszi,J. Appl. Phys.48(8) (1977) 3510.
Rev. Mex. Fıs. 51 (3) (2005) 274–283

LOCK-IN AMPLIFIER-BASED ROTATING-ANALYZER SPECTROSCOPIC ELLIPSOMETER WITH. . . 283
31. Elements and III-V Compounds, edited by O. Madelung, M.Schultz and H. Weiss, Landolt-Bornstein, New Series, Vol.III/17a (Springer-Verlag Berlin 1982).
32. L. Vi na, C. Umbach, M. Cardona, and L. Vodopyanov,Phys.
Rev. B29 (1984) 6752.
33. H. Arwin and D.E. AspnesJ. Vac. Technol. A2(3) (1984) 1316.
34. P. Lautenschlager, M. Garriga, S. Logothedis, and M. CardonaPhys. Rev. B35(17) (1987) 9174.
Rev. Mex. Fıs. 51 (3) (2005) 274–283