Embed Size (px)
Citation preview

Recovery of locomotion after injury in Drosophila depends on proprioception
Alexander Isakov 1,2,†, Sean M. Buchanan 3,†, Brian Sullivan 2,4, Akshitha Ramachandran 2,4, Joshua K. S. Chapman 3, Edward S. Lu 2,4, L. Mahadevan 1,2,4,5,*, Benjamin de Bivort2,3,4,*
1 Department of Physics, Harvard University, Cambridge, MA 02138, USA.
2 Center for Brain Science, Harvard University, Cambridge, MA 02138, USA.
3 Rowland Institute at Harvard, Cambridge, MA 02142, USA.
4 Department of Organismic and Evolutionary Biology, Harvard University, Cambridge, MA 02138, USA.
5 School of Engineering and Applied Sciences, Harvard University, Cambridge, MA 02138, USA.
† These authors contributed equally.
* To whom correspondence should be addressed: [email protected]; [email protected]

AbstractLocomotion is necessary for survival in most animal species. However, injuries to the appendages mediating locomotion are common. We assess the recovery of walking in Drosophila melanogaster following leg amputation. Whereas flies pre-amputation explore open arenas in a symmetric fashion, foreleg amputation induces a strong turning bias away from the side of the amputation. However, we find that unbiased walking behavior returns over time in wild type flies, while recovery is significantly impaired in proprioceptive mutants. To identify the biomechanical basis of this locomotor impairment and recovery, we then examine individual leg motion (gait) at a fine scale. A minimal mathematical model that links neurodynamics to body mechanics during walking shows that redistributing leg forces between the right and left side enables the observed recovery. Altogether, our study suggests that proprioceptive input from the intact limbs plays a critical role in the behavioral plasticity associated with locomotor recovery after injury.
Key Words: insects, locomotion, plasticity, proprioception, feedback, recovery, leg injury, amputation, gaits
Introduction
In a world where locomotion is critical for survival and reproduction, a wide range of motor strategies are present: walking, swimming, crawling, gliding, and flying (Dickinson et al., 2000). Of course, the specific behavioral details of movement vary wildly even in the case of a specific modality such as legged locomotion, as seen in bipeds (Vaughan, 2003), quadrupeds (Alexander, 1984), various hexapods (Cruse, 1976; Full and Tu, 1991; Grabowska et al., 2012; Mendes et al., 2013; Couzin-Fuchs et al., 2015), and octopods (Blichkan and Full, 1987). Even when the number of limbs is held constant the pattern of limb placement during locomotion (gait) can vary greatly within and between species, as reviewed in (Holmes et al., 2006) and (Borgmann and Buschges, 2015).
Given the varied environment in which organisms move, injury to locomotor systems is very common in nature (movie M1 in supplementary material). Therefore, it is not surprising that animals will often prioritize leg safety in locomotor strategies (Birn-Jeffery et al., 2014). However, damage can be unavoidable; if locomotor systems were not robust to damage, or were incapable of plasticity, limb injury would pose an insurmountable challenge to survival. In humans, a number of studies have shown that damage to the control mechanism (e.g. spinal cord injury) can be overcome to an extent by training using manually assisted signals to the limbs which reorganize the spinal
�2

network and allow it to adapt (Harkema, 2001; Dietz et al., 2009). Plasticity leading to locomotor recovery after spinal cord injury is seen in animal models such as rats as well (Ballerman and Fouad, 2006). After direct injury or amputation of a limb itself, animals including mammals (Kirpensteijn et al., 1999) can recover mobility over time – indeed, three legged dogs and cats walking and even running are familiar images. In humans, a number of medical interventions such as prosthetic limbs after amputation or reconstructive surgery (Bosse et al., 2002) can help patients recover mobility. Thus, the locomotor system is remarkably robust. Moreover, the idea of plasticity after limb injury is not limited to the animal world: even in engineered systems such as legged robots, instilling the ability to recover locomotion after injury is an active research topic (Christensen et al., 2013; Cully et al., 2015).
A suite of experimental and theoretical studies has highlighted the importance of proprioception in locomotion in cats (Lam and Pearson, 2001), mice (Akay et al., 2014; Takeoka et al., 2014), and insects (Bässler, 1977; Bässler et al, 2007; Borgmann et al., 2009; Mendes et al., 2013), as well as nematodes (Wen et al., 2012; Paoletti and Mahadevan, 2014). Here we investigate the role of proprioception in recovery from injury in fruit flies, using Drosophila melanogaster as a model organism due to the rich collection of genetic and transgenic tools available in this species for mechanistic inquiry.
In particular, we ask the questions of (a) whether and (b) how the recovery of locomotion takes place after a significant biomechanical injury (leg amputation). While many walking parameters have been characterized for freely walking Drosophila (Strauss and Heisenberg, 1990; Mendes et al., 2013; Berman et al., 2014), fewer studies have considered recovery of walking after injury. A notable exception is (Wosnitza et al., 2013) – even immediately after amputation of a fly’s back leg, these authors observed several important changes in an amputated fly’s behavior that allowed it to continue walking but at a slower speed and with a shift in leg stepping patterns (gait coordination). Whereas here we examine both the immediate effects of injury as well as recovery in locomotion over time, Wosnitza et al. focused on behavior immediately after back leg amputation. Intriguingly, a study where fly walking was impeded by adding weights to the body (Mendes et al., 2014) found evidence for adaptation of step parameters over time to maintain coordinated walking, as well as increased sensitivity to load and other locomotor defects in proprioceptive mutants. These observations beg for the exploration of recovery after amputation over longer times.
Therefore, we examined the immediate and days-long recovery of walking behavior after leg amputation in Drosophila melanogaster. By using video recording before and after injury, we show that amputation impairs exploratory locomotion, i.e. the navigational paths followed in an open
�3

arena. Specifically, amputation of the right foreleg induces a counter-clockwise bias to exploratory locomotion. Interestingly, unbiased locomotion recovers well over time in wild type flies, but this recovery is significantly hampered in proprioceptive mutants. To understand how this might happen, we start by considering individual leg motion (gaits), quantifying them from high speed video of walking flies before, immediately after, and for several days after amputation. Typically, gaits in hexapods are categorized into three distinct patterns, “tripod”, “tetrapod”, and “wave” or “non-canonical” (Hughes, 1952). The tripod gait is considered to be the alternating movement of two groups of three legs, with the legs in each group simultaneous taking off. These groups are traditionally defined as legs (135)(246) – with groups separated by parentheses and leg numbering as in Fig. 1A. The tetrapod gait consists of three groups of two moving legs each, with the legs again taking off simultaneously. Here, the groups can be arranged as either (15)(26)(34) or (24)(35)(16), due to a left-right symmetry. In a traditional wave gait, the legs proceed forward along a side before switching to the next side, as in (3)(2)(1)(6)(5)(4), though a number of sources such as (Mendes et al., 2013; Kain et al., 2013) label gaits only as “tripod,” “tetrapod” or “non-canonical”.
We observed all of these gaits in our video analysis and found that injury resulted in permanent changes to their relative frequency during walking. This presents a puzzle: if injury permanently alters gaits, what mechanism explains the recovery in exploratory locomotion turning bias? Using a neuromechanical model strongly informed by experimental data, we show that amputated flies may redistribute the forces applied by the legs to enable the observed recovery in the absence of gait recovery, suggesting that a consequence of proprioceptive defects is the inability to precisely control leg forces. Altogether, combining behavioral observations and gait analysis of normal and proprioception deficient flies with a physical model provides us with a mechanistic description of recovery of locomotion after injury in Drosophila.
Materials and methods
All raw data, data collection, and analysis scripts are available at http://lab.debivort.org/recovery-of-locomotion-after-injury/. Fly strains and care Flies were housed on modified CalTech medium in temperature controlled incubators on a 12-h/12-h light/dark cycle. Flies mutant for nanchung and inactive were procured from the Bloomington Drosophila Stock Center (nan36a BDSC #24902 and iav3621 BDSC #24768; Bloomington, IN, USA). Canton-S was our wild type strain. Flies were 4-8 days post-eclosion when experiments began. All experimental flies were female.
�4
Experimental apparatus Three-by-three arrays of 5.08 cm (2 inch) diameter arenas were fabricated from clear acrylic cut with a laser engraver (Epilog, Golden, CO, USA). 10 cm high walls between neighboring arenas were frosted with a random orbital sander to prevent flies from viewing each other. Arenas were uniformly illuminated from below by an array of LEDs (5500K, LuminousFilm, Shreveport, LA, USA) covered by a diffuser fabricated from two sheets of 0.64 cm (1/4 inch) thick clear acrylic frosted on both sides by sanding. Arenas were imaged from above by 2MP digital cameras (Logitech, Newark, CA, USA, and Point Grey, Richmond, BC, Canada) and the X-Y position of individual flies’ centroids were identified and tracked by custom software written in LabView (National Instruments, Austin, TX, USA).
Arena experiments Four day old wing-clipped flies were placed into circular 50mm diameter arenas and allowed to walk freely for 2 hours. Their centroids were tracked and recorded. The next day, the right foreleg was amputated within the femur and flies were tested again 1 hour, 24 hours, 48 hours and 72 hours post-injury. The direction of motion was inferred as the angle between centroids of successive frames. To exclude edge artifacts, data collected within 80% of the radius of the arena was analyzed.
Computation Image analysis was implemented using Matlab2012a with the Image Processing and Statistics Toolboxes (The MathWorks, Inc., Natick, MA, USA). Scripts for determining locomotion turning bias, the calibration curve path simulation and the physical model simulation were also implemented in Matlab. All other analyses were performed using the statistical software R3.0.3 (R Foundation for Statistical Computing, 2014) with the packages “ggplot2”, “plyr”, “reshape2”, “grid”, “HMM”, “gridExtra”, “R.matlab”, and “stringr” (package descriptions, including full author information, are available at: http://cran.r-project.org/web/packages/).
Gait experiments Amputation trials started with four day old females of wild type (N = 56), inactive (N = 17), and nanchung (N = 15). For gait experiments, the camera was refocused on a region roughly 2x3 cm within a single, lidded circular arena. Video was collected at 60 Hz using the FlyCap software (Point Grey). Wings were not clipped for gait experiments. The data collected from each trial consisted of two videos per fly, taken when the fly was performing a quick, straight run segment (subjectively assessed during data collection). In post-processing, the faster and straighter of the
�5

two videos was chosen for analysis. Both videos were rejected if the straight run segment had fewer than 3 full strides uninterrupted by pauses or large angular reorientations (this occurred for fewer than 6 total videos).
Before each assay, flies were anesthetized with CO2 and then allowed at least 45 minutes of recovery. On the first experimental day, each fly performed two assays. First, a pre-amputation assay was performed. Flies were subsequently anesthetized and amputated. Leg amputation was within the femur, or at the tibia-femur joint. Amputation higher on the leg resulted in high mortality. Lower amputation risked leaving the animal with enough leg to support itself. On subsequent days (1 day post-amputation to 3 days post-amputation) each fly performed one assay.
Gait video analysis Video analysis was performed in several steps, as schematized in Fig. S1 in supplementary material. Movies were first temporally cropped to encompass the full straight run and exclude all other frames. The cropped movie was then run through a semi-automated tracking algorithm to determine the fly centroid and the endpoints of the legs (see Fig. S2 in supplementary material). We then went through every frame and either accepted the automatic recommendation or hand-corrected the leg endpoints. Then, an algorithm automatically sorted legs and numbered them as shown in Fig. 1A by calculating the angle between the centroid to head vector and the centroid to leg vector. See movies M2-M4 in supplementary material (wild type: pre-amputation, day 0 post-amputation, day 3 post-amputation) for examples of final video output with tracked legs.
Finally, we binarized leg motions into “stride” (off the ground) and “stance” (on the ground) for determining gaits. To choose the motion threshold, we started by noting that apparent motion in the end position of a leg has two components: true leg motion (expected to be on the order of 10 pixels between two frames) and experimenter error when clicking on leg endpoints (expected to be <~5px pixels between two frames). So, we modeled the data using a Gaussian mixture model with two underlying distributions (“mixtools” package in R) on all the data and choose a threshold of 8 to remove the experimental noise background (mean = 0.51, s.d. = 2.70) slightly below the 3 standard deviation mark. We also excluded frames that indicate four legs moving (<1%) from analysis.
Hidden Markov Model A Hidden Markov Model (Baum and Petrie, 1966) assumes unobserved (“hidden”) internal states for a system (e.g. gait), each of which results in emitting a measured signal from a set (e.g. number of observed legs moving) with some probability. We used 3 hidden states (1-leg, 2-leg, and 3-leg
�6

gaits) and four observed states (0-3 legs moving). To fit the parameters of this model, we used the Baum-Welch algorithm. First, we aggregated all fly information by strain, stratifying into pre- and post-amputation and found emission probabilities. Then, we obtained transition probabilities for each strain and day. Finally, we fit internal states using the Viterbi algorithm to obtain gaits. We verified the results of the HMM on a frame-by-frame analysis of leg motion in the pre-amputation case and found qualitative consistency.
Neuromechanical model The physical model takes into account body motion, leg motion, and a neural controller. Capital letter variables correspond to the body, n represents neural modules, and other lowercase letters represent the legs. Indices run from 1-6 (1-5 in the post-amputation case). Without loss of generality, we let module 1, corresponding to the front left leg, be the “clock” relative to which all other leg phases were measured. When a module is excited beyond a threshold, it drives its corresponding leg to lift off the ground (enter stride phase). Legs relax quickly (relative to the excitation duration) to their respective forward-most position relative to the body. When the module activity drops below the threshold, the leg is placed down on the substrate and exerts force on the body until the next neuronal excitation lifts the leg. Body dynamics obey Newton’s laws (forces determine translational motion in 2-dimensional space and torques determine rotational motion).
Following the notation used in Table 1 and Fig. S3 in supplementary material, we can then write the governing equations coupling the neurodynamics to the body and limb mechanics, as
(1)
(2)
(3)
; i=1,…,6 (4)
(5)
(6)
(7)
(8)
�7
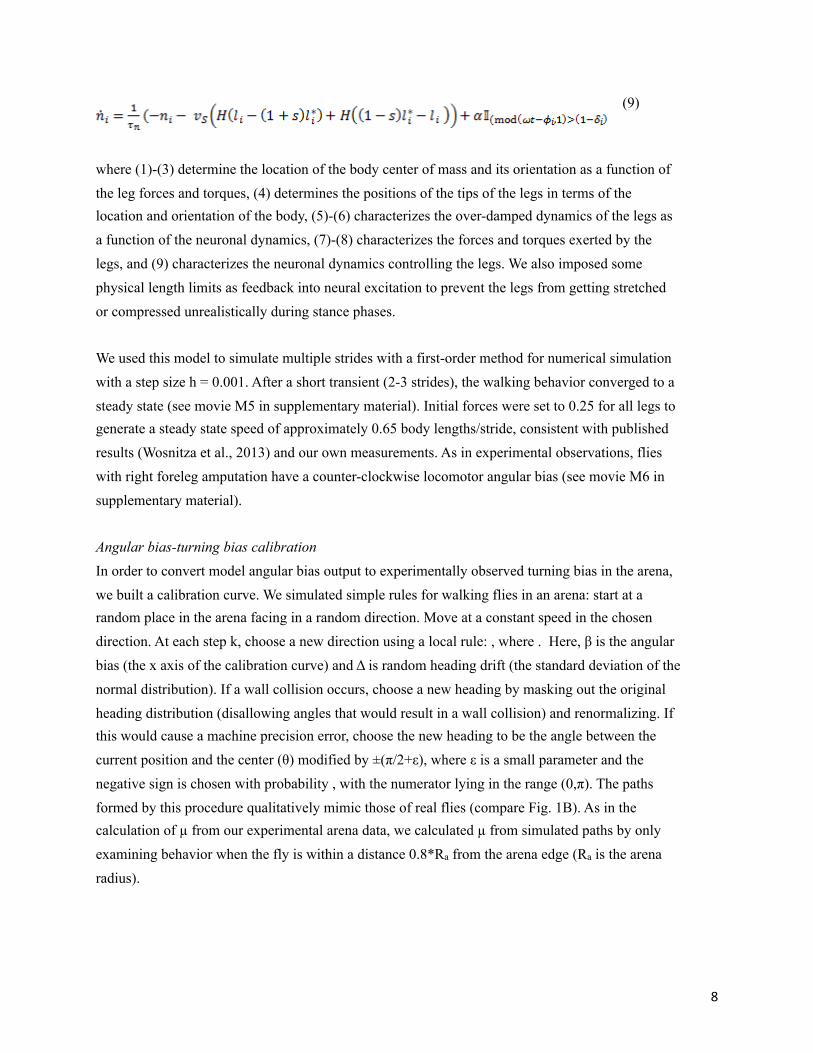
(9)
where (1)-(3) determine the location of the body center of mass and its orientation as a function of the leg forces and torques, (4) determines the positions of the tips of the legs in terms of the location and orientation of the body, (5)-(6) characterizes the over-damped dynamics of the legs as a function of the neuronal dynamics, (7)-(8) characterizes the forces and torques exerted by the legs, and (9) characterizes the neuronal dynamics controlling the legs. We also imposed some physical length limits as feedback into neural excitation to prevent the legs from getting stretched or compressed unrealistically during stance phases.
We used this model to simulate multiple strides with a first-order method for numerical simulation with a step size h = 0.001. After a short transient (2-3 strides), the walking behavior converged to a steady state (see movie M5 in supplementary material). Initial forces were set to 0.25 for all legs to generate a steady state speed of approximately 0.65 body lengths/stride, consistent with published results (Wosnitza et al., 2013) and our own measurements. As in experimental observations, flies with right foreleg amputation have a counter-clockwise locomotor angular bias (see movie M6 in supplementary material).
Angular bias-turning bias calibration In order to convert model angular bias output to experimentally observed turning bias in the arena, we built a calibration curve. We simulated simple rules for walking flies in an arena: start at a random place in the arena facing in a random direction. Move at a constant speed in the chosen direction. At each step k, choose a new direction using a local rule: , where . Here, β is the angular bias (the x axis of the calibration curve) and Δ is random heading drift (the standard deviation of the normal distribution). If a wall collision occurs, choose a new heading by masking out the original heading distribution (disallowing angles that would result in a wall collision) and renormalizing. If this would cause a machine precision error, choose the new heading to be the angle between the current position and the center (θ) modified by ±(π/2+ε), where ε is a small parameter and the negative sign is chosen with probability , with the numerator lying in the range (0,π). The paths formed by this procedure qualitatively mimic those of real flies (compare Fig. 1B). As in the calculation of µ from our experimental arena data, we calculated µ from simulated paths by only examining behavior when the fly is within a distance 0.8*Ra from the arena edge (Ra is the arena radius).
�8

To build the calibration curve, we first matched heading drift by fitting simulated histograms at a fixed bias β = 0
to the corresponding wild type pre-amputation histogram from experiment and minimized least
square error. Since the fitted heading drift (Δ = 0.035) did not give a large enough dynamic range for µ to recapture all experimental results, we shifted it to be as close as possible to the fit while capturing the necessary dynamic range (Δ = 0.029). The paths generated by this compromise heading drift value are still qualitatively reasonable (Fig. S4 in supplementary material). Finally, we built the curve (Fig. S5 in supplementary material) by sweeping β and plotting µ (averaged over Nr = 50 runs, each run consisting of NS = 104 simulation steps). Fitting a quadratic function over the range of interest gives an almost perfect fit (R2 = 0.999). We used the analytical expression for the fit as the final calibration curve.
Optimization The optimization goal was to find a set of leg forces acting on a fly with averaged parameters to match the experimental µ from the calibration curve (for each of the three strains and each day determined separately). We ran the model to 5 strides (to steady state) and took the angular bias in the last stride to calculate the energy of the proposed solution. We ran a simulated annealing optimization procedure using a normalized annealing schedule with initial temperature T1 = 1, an annealing interval of Ia = 75 steps, and a multiplicative cooling factor Ca = 0.9. A full simulation was run without re-heating to Na = 1.5*103 steps, which was found to be sufficient to consistently converge. At each step k, the number of forces that were changed for the proposal was . Starting with force magnitudes of 0.25 units on each leg, we allowed the forces on the left side to change (allowing all forces to change leads to similar results but takes longer to converge): , where and is a parameter that makes the proposal distribution tighter. Proposals for each leg were constrained to lie in the interval fa = [0.1,0.25] (again for faster convergence – in practice, the average optimal forces on the left side were not even close to the lower bound even for the lowest target µ).The energy of a proposed solution was the distance between the absolute values of the target bias given the real µ (from the calibration curve) and the angular bias as calculated from model output (angle difference during the last stride/distance moved during the last stride). The acceptance probability was a Boltzmann function with normalized energy and a multiplicative “convergence factor” γ:
Symbols used in the calibration curve procedure and simulated annealing are summarized in Table S1 in supplementary material.
Results
�9

Proprioception mediates locomotor recovery after injury First, we investigated path-level behavior of adult Drosophila before and after amputation of the right foreleg. Fig. 1A shows a schematic of the amputation protocol. Individual flies were allowed to explore circular arenas for 2 hours, and the X-Y positions of their centroids were tracked and recorded. Approximately 24 hours later, the right foreleg was amputated and flies were recorded in the arena 1 hour, 24 hours, 48 hours and 72 hours post-injury (all sample sizes were between 9 and 30). Visual inspection of characteristic paths of wild type flies (Fig. 1B) suggests that injury caused behavior to change from 1) paths composed of roughly equal portions of clockwise and counterclockwise segments to 2) highly biased, slow walking in the direction opposite to the leg that was removed immediately post-amputation and then 3) back to a largely unbiased walk three days post-amputation. For all strains, speed immediately post-amputation decreased relative to the pre-amputation value (by 34% for wild type, 14% for inactive, and 56% for nanchung). While there was an upward trend in wild type and nanchung flies over three days, speed did not return close to baseline at the end of the three days for any of the strains (Fig. S6 in supplementary material). To provide a quantitative characterization of locomotor bias, we measured the weighted average direction of the tangential component of the velocity relative to the center of the arena (Fig. 1C). The vast majority of paths were around the edges of the arena rather than directly inwards or outwards. We call this the “mu score (µ)” (Buchanan et al., 2015). A score of µ = 0 corresponds to perfectly unbiased locomotion (flies moving clockwise and counterclockwise to the same extent) while -1 < µ < 0 corresponds to an overall counterclockwise bias and 0 < µ < 1 corresponds to an overall clockwise bias. For wild type animals, we find that on average they start unbiased before amputation (µ = -0.006), develop a very strong bias immediately post-amputation (µ = -0.410), and steadily recover towards an unbiased state over the next three days (µ = -0.031) (Fig. 1D). In general, all observed paths were predominantly composed of segments that were largely clockwise or counterclockwise, with little strictly inward or outward navigation.
We next sought to further characterize the mechanosensory basis of motor recovery. Since proprioception allows the fly to learn about the stretch and location of its limbs and thus control them and the forces they exert, we hypothesized that disrupting proprioceptive feedback would hinder a fly’s ability to adapt its locomotor behavior post-injury. The TRPV ion channels Inactive and Nanchung are co-expressed in the proprioceptive organs of the fly, including the chordotonal organs of the femur, tarsi, and antenna, and are required for wild type locomotion and hearing (Kim et al., 2003; Gong et al., 2004). As with wild type animals, flies mutant for inactive (iav3621) exhibited little clockwise/counterclockwise bias while exploring the arena pre-amputation (µ = -0.026), and biased walking immediately following injury (µ = -0.247) (Fig. 1D). However, unlike wild type animals, iav3621 flies failed to recover close to their baseline (µ = -0.129 after 3 days). In
�10

nanchung mutants (nan36a), the recovery failure is even more pronounced (µ = -0.250 after 3 days) (Fig. 1D). In nanchung mutants, we observed a larger bias in the days following amputation than immediately post-amputation, with the bias on day 3 post-amputation being the same as that on day 1 post-amputation. Overall, while mutants did not exhibit as large a bias as wild type flies immediately post-amputation, their turning bias persisted for the entire duration observed, in contrast to wild type. Together, the behavior of the wild type and mutants before and after amputation implicate proprioception as important for recovery. How this happens requires a detailed analysis at the level of individual legs.
Injury alters gait permanently In order to gain insight into the biomechanical processes underlying recovery, we turned to a finer-grained analysis of leg motion. We recorded flies walking several hours before amputation, followed by recordings 1 hour, 24 hours, 48 hours, and 72 hours after amputation. For the gait data, we started with N = 56 (wild type), N = 17 (inactive), and N = 15 (nanchung) flies, though the total number of walking bouts analyzed at each time-point varied slightly due to fly death or post-processing rejection of runs (see Materials and methods). Instead of measuring locomotion across entire circular arenas, we captured bouts of fast, straight walking through the middle of arenas at 60 Hz. Using custom semi-automated leg-detection software (see Materials and methods) we recorded the position of all 6 (or 5 post-amputation) legs frame by frame. Fig. 2A shows annotated frames of a fly moving in a typical (135)(246) tripod gait. Movies M2-M4 in supplementary material show representative examples of tracked movies pre-, 1 hour and 72 hours after amputation, respectively. The patterns of leg motion can be visualized in stride-stance plots (Fig. 2B) which show the legs on the ground (white) and off the ground (blue) as a function of time. The pre-amputation stride stance plot shows a typical tripod pattern. Immediately post-amputation, we see a non-canonical gait with what may be residual hints of tripod or tetrapod gait. On day 3 post-amputation we see an apparent tetrapod-like gait.
One way of characterizing gaits is on a frame-by-frame basis by considering the number of legs that are concurrently in stride phase (Mendes et al., 2013; Kain et al., 2013). However, this approach is not always satisfactory for several reasons (Wosnitza et al., 2013) – it does not capture the view of gaits as persistent states and can introduce potential artifacts due to imaging, e.g. by misclassifying gaits due to imperfect simultaneity in take-off. It is also not immediately apparent how to apply these gait categorization rules to flies with 5 legs. Therefore, to estimate the frequency of internal gait states, we assigned a gait label to each movie frame that is not based on the observed pattern set of legs in stride phase in that exact frame, but is instead the state of a Hidden Markov Model (HMM) (see Materials and methods). This captures the spirit of gaits as persistent states which have
�11

respective probabilities of showing 1, 2 or 3 legs moving simultaneously. To avoid ambiguity, we refer to these hidden states as “3-leg”, “2-leg”, and “1-leg” gaits, without distinguishing between which groups of legs move. A schematic of the HMM with emission and transition probabilities for wild type flies pre-amputation is shown in Fig. 2C.
As expected, the HMM approach (Fig. 2D) revealed more frequent 3-leg gaits than frame-by-frame annotation (Fig. S7 in supplementary material). We found that the state transition probabilities from 1-leg, 2-leg, and 3-leg gaits to the 3-leg gait from the HMM were high, suggesting that this gait was both more common and more persistent when it occurred (Fig. S8 in supplementary material). This is not surprising, since we selected for fast locomotor bouts and higher speed is associated with greater persistence of an alternating tripod (Mendes et al., 2013; Strauss and Heisenberg, 1990). Intuitively, the most frequent pattern of leg striding during 3-leg gaits is the standard alternating tripod (135)(246) and the most frequent patterns of 2-leg and 1-leg gaits correspond respectively to traditional tetrapod and wave patterns (Fig. S9 in supplementary material).
This allowed us to consider the relative frequencies of 1-leg, 2-leg, and 3-leg gaits (Fig. 2D). In all three genotypes – wild type, inactive, and nanchung – we observed that the 3-leg gait frequency drops dramatically from pre-amputation to immediately post-amputation. In all three genotypes 3-leg gait frequency did not return close to baseline by day 3 post-amputation, remaining near 0. Interestingly, wild type flies showed some gait plasticity (there was a steady increase post-amputation in the frequency of 2-leg gait), whereas both 2-leg gait and 1-leg gait did not change discernibly over the three day recovery period in either inactive or nanchung. Leg coordination pattern is correlated with walking speed, and hence the lack of recovery seen in both walking speed and gait may be related. However, neither of these phenomena follow the pattern seen in turn bias recovery. Thus, the mechanism of turning bias recovery could also lie elsewhere.
Many leg parameters vary little through amputation and recovery Turning back to the frame-by-frame analysis, we searched for other leg parameters (Fig. 2E) that displayed dynamics matching those of turning bias, i.e. those responding to amputation in all genotypes (with a larger effect in wild type), and largely recovering by day 3 (relative to 1 hour post-amputation) in the direction of pre-amputation levels only in wild type animals.
We found that the mean distance of the legs from the body centroid, at step placement, becomes lopsided (splayed to the left) after amputation and fails to recover discernibly for both wild type and inactive. In the case of nanchung mutants, it does not change significantly from pre-amputation. The average distance moved by the tarsi on each side per stride changes even more slightly.
�12

Similarly, the proportion of time a leg is down in stance on the right side vs. the left side stays essentially constant for all strains from pre-amputation through three days of recovery. Thus, none of these parameters on its own follows the qualitative pattern of turn bias recovery. However, it remains a possibility that the changes in a combination of these parameters in the action of walking could collectively explain turn bias recovery. To examine this, we now turn to a neuromechanical model of fly walking. If the virtual fly’s turn bias follows the experimental turn bias pattern after fitting parameters from experiment, they may be sufficient to explain turn bias recovery.
Neuromechanical modeling implicates force modulation in recovery The model framework (Fig. 3A) featured three essential components: the brain which controls the legs, the body, and interaction with the environment mediated by the forces applied by the legs. We treated the neural component as a central pattern generator with 6 neuronal modules (one per leg) – see (Ijspeert, 2008) for an overview. We fit geometric and kinematic parameters with values reported in the literature (e.g. Mendes et al., 2013) and observed in our experiments (i.e. Fig. 2D,E), leaving only leg forces as free fitting parameters. The neuronal modules send a signal to the legs after reaching a threshold, which causes the legs to respond by exerting forces on the ground, so that the body moves according to the forces and torques it feels from the legs. This motion drives sensorimotor proprioceptive feedback to the neuronal module and the cycle repeats (see Materials and methods and Fig. S3 in supplementary material for model details).
In order to compare the angular velocity output of the model (angular bias) to the arena locomotion turning bias, we determined a calibration curve (Fig. S5 in supplementary material). To do so, we used a simple arena path simulation (see Materials and methods) that had angular bias as a tunable parameter and also captured realistic arena-scale behavior (Fig. S4 in supplementary material).
When we ran the model using all empirical parameters but held the force applied by each leg constant, all three genotypes exhibited no recovery in turn bias post-amputation (Fig. 3B). If anything, all three lines exhibited increased bias with time, implying that the parameters we have measured so far (i.e. Fig. 2D,E) are insufficient to explain recovery. Therefore, we examined whether force modulation would allow the model to exhibit turn bias recovery.
A Monte Carlo optimization approach (see Materials and methods) allowed us to find a ratio of leg forces between right and left legs which yielded the appropriate angular bias. We did this for each strain and day using averages of the measured parameters. For example, to determine the leg forces needed to generate the locomotor turning bias observed in nanchung flies on day 2 post-amputation, we supplied the average time between strides, proportion of time each leg is down per
�13

stride, and leg phases, as measured directly from the corresponding video recordings. Leg forces that yielded µ values matching experimental values were then determined over the course of recovery.
This approach was able to recapitulate the overall trajectory of fly locomotor behavior in response to injury (mean discrepancy < 1%) (Fig. 3C). By tuning the leg forces, the strong turning bias induced immediately after amputation could be undone. Thus, modulation of force appears to be sufficient to recapitulate turn bias recovery. As there was no recovery in its absence (Fig. 3B), force modulation appears to be necessary for turn bias recovery.
Fig. 3D shows the ratio of leg forces that yield simulated locomotion matching observed turn bias values, when force is modulated exclusively in one leg at a time (across all 5 legs, there are many combinations of force modulation that succeed.) The model suggests that the middle and back legs require smaller force changes than the front leg to achieve a particular navigation bias profile.
Discussion
Our results provide evidence for the importance of proprioception in the recovery of a locomotor behavior (in this case, walking without a mean turning bias) in Drosophila melanogaster. We see that wild type flies initially spend equal portions of time exploring in clockwise and counter-clockwise directions. After amputation of the right foreleg, they exhibit a strong counter-clockwise bias. However, after three days, their behavior is largely unbiased. By contrast, inactive mutants recover approximately half-way from the maximum bias post-amputation and nanchung mutants do not recover at all. Moving from a behavioral assay to a gait analysis, we also considered the motion of individual legs. While the 3-leg gait never completely vanishes (either in the wild type or in the mutants), it is nonetheless marginalized starting immediately post-amputation and does not recover over three days even as turning bias does. Intriguingly, wild type flies appear to exhibit a “strategy searching” behavior post-amputation, starting with a 1-leg gait being employed with frequency slightly greater than 0.5 and gradually giving way to the 2-leg gait, which is employed with frequency 0.75 by the third day post-amputation. This searching behavior is absent in the proprioceptive mutants: inactive appears to favor a 2-leg gait immediately post-amputation while nanchung favors the 1-leg gait, but the abundance of each type of gait remains constant throughout the post-amputation period in both of these genotypes. This suggested that gait learning and recovery itself may be tied to proprioception.
�14

The simple fact of a predominant 2-leg gait at the end of the experiment (which occurs in both wild type and inactive) is unlikely to explain the observed recovery. After all, both wild type and inactive exhibit predominantly 2-leg gait three days after recovery (and indeed, the inactive mutants reach it first). While it could be argued that a combinational/mixed gait would provide better results (that is, “inactive mutants take it too far”), the post-amputation invariance of inactive gait composition does not match the partial recovery seen in those mutants. Further, as we saw in the model, unbiased walking could not be achieved without force modulation; phase modulation alone was insufficient.
We then considered measures of several other parameters on a leg-by-leg basis, but found that they were insufficient to explain turn bias recovery. For instance, it is known that in cockroaches legs play different roles in locomotion: front legs are used more for steering and back legs more for propulsion (Mu and Ritzmann, 2005). However, even for wild type flies, the difference in the remaining front leg distance from the centroid between 1 hour and 72 hours post amputation was <1%. While several potential parameters of interests such as the average distance legs moved per stride and the proportion of time spent in the air during a stride are likely to be relevant, examining both individual leg and comparisons between the right and left side averages for all of these parameters did not yield a satisfactory explanation for the observed recovery of turning bias in walking; for instance, none showed the same qualitative pattern as Fig. 1D. However, it remained a possibility that the small differences in these parameters could, in combination, explain turn bias recovery.
To test this, we developed a minimal Newtonian physical model for leg and body motion. After fitting all parameters directly from experiments, we were left with one tuning parameter: force. Holding force constant at pre-amputation levels yielded no turn bias recovery (Fig. S10 in supplementary material). Tuning the forces exerted on each leg through a Monte Carlo optimization procedure to match the average angular bias of flies within each experimental group, we found that we were able to recapitulate observed turning bias scores. Therefore, force modulation appears to be necessary and sufficient to explain turn bias recovery, given the measured values of all other biophysical parameters and gait patterns. Fig. 3C shows two locomotion metrics (angular bias and persistence of 3-leg gaits), with forces matching observed angular bias found from a run of the optimization procedure (averaged fly parameters - large solid points, individual fly parameters - small transparent points). By allowing force to vary only in one leg at a time, we found that modulating force even in a single leg could be sufficient to recover turn bias (Fig. 3D). Smaller modulations of force were required in the middle legs because they extended farther from the body and are on average closer to perpendicular to the direction of motion. However, many
�15

combinations of force modulation across all 5 legs can balance average forces between the left and right sides of the animal, and flies likely change forces in all their legs as part of recovery.
This suggests that the coordination of forces exerted by each leg is a general mechanism which an animal can control to achieve unbiased walking. The implied dependence of recovery on force modulation in our system suggests a broader hypothesis that could be tested in other systems, from other insects to mice to humans, or even engineered into robotic systems. Second, this observation posits a fine-grained behavioral manifestation of proprioceptive defects. A number of studies have shown that deciphering forces and proprioceptive feedback are important in generating stable patterns/gaits (Pearson, 1972; Ridgel et al., 2000; Ekeberg et al., 2004; Fuchs et al., 2012) (for a more complete overview see (Holmes et al., 2006)) and may “directly influence [central pattern generators] and motoneurons to maintain phase relations in a decentralized, peripheral manner” (Holmes et al., 2006) through feedback. Our study points to proprioception as a critical player in mediating navigational plasticity by determining how well an animal can control the individual forces it exerts. In other words, perhaps a proprioception-defective fly “wants” to exert more force on the right-hand side to counteract the effect of an amputated leg, but it cannot sense exactly how much force it is actually applying and is therefore doomed to continue making the same ineffectual exertions.
We note that the TRP channel mutants we considered have defects in various sensory structures, including all chordotonal organs across the body. The most relevant ones to this study are likely the legs, but it is possible other organs are involved, such as those between the abdominal segments. These possibilities could potentially be resolved using the Drosophila transgenic toolkit by, for example, using intersectional genetics to target iav or nan-expressing neurons only in the leg. Inducible promoters could be used to compare the injury response of animals with inhibited chrodotonal neurons to those with normal neuronal activity, while holding genotype constant. This would provide an advantage over the mutant approach which might be confounded by other differences in genetic background. Other proprioceptive organs than the chordotonal organs could be involved as well. For example, the campaniform sensilla (Zill et al., 2004) are known to measure force within the body wall and could be part of post-injury force modulation. Chordotonal organs, by contrast, are generally considered to be stretch rather than force sensors, but if the nervous systems encodes the mass of the animal, the information encoded by a dedicated stretch sensor could be used to compute force.
This study points to a number of avenues for future work. One important direction is a closer experimental analysis of the effects of the proprioceptive defects on locomotion. A natural question
�16

is “how much does each part of the neuronal circuit lead to recovery failure?” Another direction is performing similar experiments e.g. in larger hexapods (where forces are easier to measure) or tetrapods. From a modeling perspective, an interesting extension would be to define a neural network with dynamic connections between neuronal modules in place of a fixed phase, duration, and force. That is, one could treat the neuronal modules as oscillators which are explicitly coupled to each other and self-tune their phase or amplitude. Then, one could ask what simple rules could allow the system to self-tune for recovery after injury (for the case of adaptive networks in a coupled oscillator system, see e.g. (Aoki and Aoyagi, 2011; Isakov and Mahadevan, 2014)). Another extension would be to incorporate “reflexes and preflexes” (Kukillaya et al., 2009; Proctor and Holmes, 2010) to understand what role these play in recovery. Finally, we can ask whether a simple force-balance rule can be used in hexapedal robots such as those suggested in (Saranli et al., 2001; Koditschek et al., 2004; Schilling et al., 2013), thereby encouraging “robotic recovery from injury” and allowing better performance in the field.
List of symbols and abbreviations
Important symbols are listed in Tables 1, 2 in the main text. Abbreviations: s.e.m. (standard error of the mean), s.d. (standard deviation), HMM (Hidden Markov Model), CC (connected components), fps (frames per second).
Acknowledgements
We thank Jamey Kain, Kyobi Skutt-Kakaria and Kyle Honegger for helpful discussion and experimental advice.
Competing interests
The authors declare no competing financial interests.
Author contributions
B.d.B. and S.M.B. conceived and designed the turning bias experiment and data analysis. S.M.B. and J.K.S.C. performed the turning bias experiments. B.S., A.R., E.S.L., and A.I. collected gait analysis data. A.I., L.M., and B.d.B. analyzed data from the gait analysis experiment and developed
�17

the theoretical model. A.I., S.M.B., L.M. and B.d.B. wrote the manuscript. All authors edited and revised the manuscript.
Funding
A.I. was supported under FA9550-11-C-0028 awarded by the Department of Defense, Air Force Office of Scientific Research, National Defense Science and Engineering Graduate Fellowship, 32 CFR 168a. B.d.B. and S.M.B. were supported by the Rowland Junior Fellows Program.
�18

References
Akay, T., Tourtellotte, W. G., Arber, S. and Jessell, T. M. (2014). Degradation of mouse locomotor pattern in the absence of proprioceptive sensory feedback. Proc. Natl. Acad. Sci. 111(47), 16877-16882. DOI: 10.1073/pnas.1419045111
Alexander, R. M. (1984). The gaits of bipedal and quadrupedal animals. Int. J. Robot. Res. 3(2), 49-59. DOI: 10.1177/027836498400300205
Aoki, T. and Aoyagi, T. (2011). Self-organized network of phase oscillators coupled by activity-dependent interactions. Phys. Rev. E 84(6), 066109. DOI: 10.1103/PhysRevE.84.066109
Ballermann, M. and Fouad, K. (2006). Spontaneous locomotor recovery in spinal cord injured rats is accompanied by anatomical plasticity of reticulospinal fibers. Eur. J. Neurosci. 23(8), 1988-1996. DOI: 10.1111/j.1460-9568.2006.04726.x
Bässler, U. (1977). Sensory control of leg movement in the stick insect Carausius morosus. Biol. Cybern. 25(2), 61-72. DOI: 10.1007/BF00337264
Bässler, U., Wolf, H. and Stein, W. (2007). Functional recovery following manipulation of muscle and sense organs in the stick insect leg. J. Comp. Physiol. A 193(11), 1151-1168. DOI: 10.1007/s00359-007-0268-0
Baum, L. E. and Petrie, T. (1966). Statistical inference for probabilistic functions of finite state Markov chains. Ann. Math. Statist. 37(6), 1554-1563. DOI: 10.1214/aoms/1177699147
Berman, G. J., Choi, D. M., Bialek, W. and Shaevitz, J. W. (2014). Mapping the stereotyped behaviour of freely moving fruit flies. J. R. Soc. Interface 11(99), 20140672. DOI: 10.1098/rsif.2014.0672
Birn-Jeffery, A. V., Hubicki, C. M., Blum, Y., Renjewski, D., Hurst, J. W. and Daley, M. A. (2014). Don't break a leg: running birds from quail to ostrich prioritise leg safety and economy on uneven terrain. J. Exp. Biol. 217(21), 3786-3796. DOI: 10.1242/jeb.102640
Blichkan, R. and Full, R. J. (1987). Locomotion energetics of the ghost crab: II. Mechanics of the centre of mass during walking and running. J. Exp. Biol. 130(1), 155-174.
Borgmann, A. and Buschges, A. (2015). Insect motor control: methodological advances, descending control and inter-leg coordination on the move. Curr. Opin. Neurobiol. 33, 8-15. DOI: 10.1016/j.conb.2014.12.010
Borgmann, A., Hooper, S. L. and Buschges, A. (2009). Sensory feedback induced by front-leg stepping entrains the activity of central pattern generators in caudal segments of the stick insect walking system. J. Neurosci. 29(9), 2972-2983. DOI: 10.1523/JNEUROSCI.3155-08.2009
Bosse, M. J., MacKenzie, E. J., Kellam, J. F., Burgess, A. R., Webb, L. X., Swiontkowski, M. F., Sanders, R. W., Jones, A. L., McAndrew, M. P., Patterson, B. M. et al. (2002). An analysis of outcomes of reconstruction or amputation after leg-threatening injuries. New Engl. J. Med. 347(24), 1924-1931. DOI: 10.1056/NEJMoa012604
Buchanan, S. M., Kain, J. S. and de Bivort, B. L. (2015). Neuronal control of locomotor handedness in Drosophila. Proc. Natl. Acad. Sci. 112(21), 6700-6705. DOI: 10.1073/pnas.1500804112
�19

Christensen, D. J., Schultz, U. P. and Stoy, K. (2013). A distributed and morphology-independent strategy for adaptive locomotion in self-reconfigurable modular robots. Robot. Auton. Syst. 61(9), 1021-1035. DOI: 10.1016/j.robot.2013.05.009
Couzin-Fuchs, E. Kiemel, T., Gal, O., Ayali, A. and Holmes, P. (2015). Intersegmental coupling and recovery from perturbations in freely running cockroaches. J. Exp. Biol. 218(2), 285-297. DOI: 10.1242/jeb.112805
Cruse, H. (1976). The function of the legs in the free walking stick insect, Carausius morosus. J. Comp. Physiol. 112(2), 235-262. DOI: 10.1007/BF00606541
Cully, A., Clune, J., Tarapore, D. and Mouret, J.-B. (2015). Robots that can adapt like animals. Nature 521(7553), 503-507. DOI:10.1038/nature14422
Dickinson, M. H., Farley, C. T., Full, R. J., Koehl, M. A. R., Kram, R. and Lehman, S. (2000). How animals move: an integrative view. Science 288(5463), 100-106. DOI: 10.1126/science.288.5463.100
Dietz, V., Grillner, S., Trepp, A., Hubli, M. and Bolliger, M. (2009). Changes in spinal reflex and locomotor activity after a complete spinal cord injury: a common mechanism? Brain 132(8), 2196-2205. DOI: 10.1093/brain/awp124
Ekeberg, O., Blumel, M. and Buschges, A. (2004). Dynamic simulation of insect walking. Arth. Struct. Dev. 33(3), 287-300. DOI: 10.1016/j.asd.2004.05.002
Fuchs, E., Holmes, P., David, I. and Ayali, A. (2012). Proprioceptive feedback reinforces centrally generated stepping patterns in the cockroach. J. Exp. Biol. 215(11), 1884-1891. DOI: 10.1242/jeb.067488
Full, R. J. and Tu, M. S. (1991). Mechanics of a rapid running insect: two-, four-and six-legged locomotion. J. Exp. Biol. 156(1), 215-231.
Gong, Z., Son, W., Chung, Y. D., Kim, J., Shin, D. W., McClung, C. A., Lee, Y., Chang, D. J., Kaang, B. K. et al. (2004). Two interdependent TRPV channel subunits, inactive and Nanchung, mediate hearing in Drosophila. J. Neurosci. 24(41), 9059-9066. DOI: 10.1523/JNEUROSCI.1645-04.2004
Grabowska, M., Godlewska, E., Schmidt, J. and Daun-Gruhn, S. (2012). Quadrupedal gaits in hexapod animals – inter-leg coordination in free-walking adult stick insects. J. Exp. Biol. 215(24), 4255-4266. DOI: 10.1242/jeb.073643
Harkema, S. J. (2001). Neural plasticity after human spinal cord injury: application of locomotor training to the rehabilitation of walking. Neuroscientist 7(5), 455-468. DOI: 10.1177/107385840100700514
Holmes, P., Full, R. J., Koditschek, D. and Guckenheimer, J. (2006). The dynamics of legged locomotion: models, analyses, and challenges. Siam Rev. 48(2), 207-304. DOI: 10.1137/S0036144504445133
Hughes, G. M. (1952). The co-ordination of insect movements 1. The walking movements of insects. J. Exp. Biol. 29(2), 267-285.
�20

Ijspeert, A. J. (2008). Central pattern generators for locomotion control in animals and robots: a review. Neural Networks 21(4), 642-653. DOI: 10.1016/j.neunet.2008.03.014
Isakov, A. and Mahadevan, L. (2014). Synchronization in a stochastic Hebbian network of phase oscillators. arXiv:1404.2328 [cond-mat.stat-mech].
Kain, J., Stokes, C., Gaudry, Q., Song, X., Foley, J., Wilson, R. and de Bivort, B. (2013). Leg-tracking and automated behavioural classification in Drosophila. Nat. Commun. 4, 1910. DOI: 10.1038/ncomms2908
Kim, J., Chung, Y. D., Park, D.-Y., Choi, S., Shin, D. W., Soh, H., Lee H. W., Son, W., Yim, J., Park, C.-S. et al. (2003). A TRPV family ion channel required for hearing in Drosophila. Nature 424(6944), 81-84. DOI: 10.1038/nature01733
Kirpensteijn, J., van den Bos, R. and Endenburg, N. (1999). Adaptation of dogs to the amputation of limb and their owners' satisfaction with the procedure. Vet. Rec. 144, 115-118. DOI: 10.1136/vr.144.5.115
Koditschek, D. E., Full, R. E. and Buehler, M. (2004). Mechanical aspects of legged locomotion control. Arth. Struct. Dev. 33(3), 251-272. DOI: 10.1016/j.asd.2004.06.003
Kukillaya, R., Proctor, J. and Holmes, P. (2009). Neuromechanical models for insect locomotion: stability, maneuverability, and proprioceptive feedback. Chaos 19(2), 026107. DOI: 10.1063/1.3141306
Lam, T. and Pearson, K. G. (2001). Proprioceptive modulation of hip flexor activity during the swing phase of locomotion in decerebrate cats. J. Neurophysiol. 86(3), 1321-1332.
Mendes, C. S., Bartos, I., Akay, T., Marka, S. and Mann, R. S. (2013). Quantification of gait parameters in freely walking wild type and sensory deprived Drosophila melanogaster. Elife 2, e00231. DOI: 10.7554/eLife.00231
Mendes, C. S., Rajendren, S. V., Bartos, I., Marka, S. and Mann, R. S. (2014). Kinematic responses to changes in walking orientation and gravitational load in Drosophila melanogaster. PLos One 9(10), e109204. DOI: 10.1371/journal.pone.0109204
Mu, L. and Ritzmann, R. E. (2005). Kinematics and motor activity during tethered walking and turning in the cockroach, Blaberus discoidalis. J. Comp. Physiol. A 191(11), 1037-1054. DOI: 10.1007/s00359-005-0029-x
Otsu, N. (1975). A threshold selection method from gray-level histograms. Automatica 11, 23-27.
Paoletti, P. and Mahadevan, L. (2014). A proprioceptive neuromechanical theory of crawling. Proc. Roy. Soc. Lond. B Bio. 281(1790), 20141092. DOI: 10.1098/rspb.2014.1092
Pearson, K. G. (1972). Central programming and reflex control of walking in the cockroach. J. Exp. Biol. 56(1), 173-193.
Proctor, J. and Holmes, P. (2010). Reflexes and preflexes: on the role of sensory feedback on rhythmic patterns in insect locomotion. Biol. Cybern. 102(6), 513-531. DOI: 10.1007/s00422-010-0383-9
R Foundation for Statistical Computing (2014) R: A language and environment for statistical computing. Vienna, Austria.
�21

Ridgel, A. L., Frazier, S. F., DiCaprio, R. A. and Zill, S. N. (2000). Encoding of forces by cockroach tibial campaniform sensilla: implications in dynamic control of posture and locomotion. J. Comp. Physiol. A 186(4), 359-374. DOI: 10.1007/s003590050436
Saranli, U., Buehler, M. and Koditschek, D. E. (2001). Rhex: A simple and highly mobile hexapod robot. Int. J. Robot. Res. 20(7), 616-631. DOI: 10.1177/02783640122067570
Schilling, M., Hoinville, T., Schmitz, J. and Cruse, H. (2013). Walknet, a bio-inspired controller for hexapod walking. Biol. Cybern. 107(4), 397-419. DOI: 10.1007/s00422-013-0563-5
Strauss, R. and Heisenberg, M. (1990). Coordination of legs during straight walking and turning in Drosophila melanogaster. J. Comp. Physiol. A 167(3), 403-412. DOI: 10.1007/BF00192575
Takeoka, A., Vollenweider, I., Courtine, G. and Arber, S. (2014). Muscle Spindle Feedback Directs Locomotor Recovery and Circuit Reorganization after Spinal Cord Injury. Cell 159(7), 1626-1639. DOI: 10.1016/j.cell.2014.11.019
Vaughan, C. L. (2003). Theories of bipedal walking: an odyssey. J. Biomech. 36(4), 513-523. DOI: 10.1016/S0021-9290(02)00419-0
Wen, Q., Po, M. D., Hulme, E., Chen, S., Liu, X., Kwok, S. W., Gershow, M., Leifer, A. M., Butler, V., Fang-Yen, C. et al. (2012). Proprioceptive coupling within motor neurons drives C. elegans forward locomotion. Neuron 76(4), 750-761. DOI: 10.1016/j.neuron.2012.08.039
Wosnitza, A., Bockemuhl, T., Dubbert, M., Scholz, H. and Buschges, A. (2013). Inter-leg coordination in the control of walking speed in Drosophila. J. Exp. Biol. 216(3), 480-491. DOI: 10.1242/jeb.078139
Zill, S., Schmitz, J. and Buschges, A. (2004). Load sensing and control of posture and locomotion (2004). Arth. Struct. Dev. 33(3), 273-286. DOI: 10.1016/j.asd.2004.05.005
�22

Figures
Fig. 1. Amputation and turn bias recovery. A. Amputation protocol: the right foreleg is removed between mid-femur and the femur-tibia joint. The given leg numbering is used throughout the paper. B. Top) Representative sample fly paths over time. Gray is pre-amputation, yellow is day 0 post-amputation, green is day 3 post-amputation. Bottom) Paths divided into segments of equal length, and aligned to start all in the same direction (arrow). The strong turning bias 0 days post-amputation is evident. C. Schematic of analysis parameters used in constructing histograms of walking bias and calculating µ. The value of θ-δ characterizes the degree of clockwise/counter-clockwise behavior. D. Histograms of turning behavior. Inset numbers indicate average µ value. Histogram symmetry about the center indicates unbiased behavior and µ values close to 0. Shaded regions indicate ±1 s.e.m. (9 < N < 30 for all experimental groups).
�23

Fig. 2. Analysis of parameters that may lead to recovery of unbiased turning. A. Example of a fly with legs moving in alternating tripod gait. Blue circles indicate that a leg will remain stationary in the next frame. B. Examples of stride-stance plots for a wild type fly at pre-amputation (top), immediately post-amputation (middle), and 3 days post-amputation (bottom). Frames are on the horizontal axis and legs are on the vertical axis. White indicates that a leg is in stride in that frame,
�24

blue indicates that a leg is in stance, and gray indicates amputated legs. The top panel shows a typical tripod gait. On day 0 post-amputation, there is a mix of non-canonical gait as well as potentially remnants of tetrapod and tripod. On day 3 post-amputation, a clearer tetrapod-like pattern emerges. C. A schematic of the Hidden Markov Model used to determine gaits. Three hidden states (1-leg, 2-leg, 3-leg gaits) each have a probability of emitting frames with 0, 1, 2, or 3 legs in stride phase. Weights correspond to probabilities for wild type flies pre-amputation. See Fig. S8 in supplementary material for transition probabilities. D. Frequencies of gaits for wild type, inactive, and nanchung mutants found from the HMM. See Fig. S7 in supplementary material for comparison to frequencies on a frame-by-frame basis and Fig. S9 in supplementary material for specific leg motion patterns. N ≥ 50 (wild type), N ≥ 16 (inactive), and N ≥ 13 (nanchung) across all time-points. The frequency of 3-leg gait decreases dramatically from pre-amputation and never recovers. Wild type flies may exhibit some post-amputation gait plasticity, as seen in an upward trend in 2-leg gait. The gaits of the proprioceptive mutants do not clearly show such plasticity: inactive predominantly uses a 2-leg gait while nanchung prefers a 1-leg gait with 2-leg gait remaining relatively minor. These results may be correlated with walking speed. E. Ratio of right side average to the left side average of various measures (leg distance moved per stride, proportion of time legs spend in on the ground, and leg distance from centroid at placement; see Table S6 in supplementary material). The mean distance of the legs from the body centroid, at step placement, becomes lopsided (splayed to the left) after amputation and fails to recover discernibly for both wild type and inactive. In nanchung mutants, it does not change from baseline. The average distance moved by the tarsi on each side per stride changes even more slightly. The proportion of time a leg is down in stance on the right side vs. the left side stays almost constant for all strains.
�25

Fig. 3. Neuromechanical model of walking. A. Schematic of the theoretical model. Data was used to fit all relevant parameters except leg forces (Table 1), which were fit through an optimization procedure. A central pattern generator sends a signal to the excitable system (neuronal module). Once the neuron reaches a threshold, it fires and the leg that it controls lifts up and follows its own dynamics relative to the body to prepare for the next step. When the neuron drops below the threshold, the leg exerts forces on the body, which undergoes Newtonian dynamics in (x,y,θ). A joint parameter, coupling back to the neural
�26

system, prevents infinite stretch. A full stride occurs when all 6 legs (5 in the amputated case) and the central pattern generator repeats its pattern. Fig. S3 in supplementary material shows a sketch of several model parameters and of the central pattern generator; see methods for equations and details. B. Turn bias (µ, determined using an turn bias-angular bias calibration curve Fig. S4 in supplementary material) determined from angular bias of simulated flies without force modulation. With force held constant, the model predicts that there would be little change in turn bias from immediately post-amputation to day 3 post-amputation for all strains. Wild type: brown, inactive: light gray, nanchung: dark gray. Thick lines: simulated values; thin lines: observed values. C. Model output with force modulation used as a fitting parameter. Large opaque dots represent a fly simulated with averaged parameters from that experimental group – precisely the parameters for which forces were optimized to have model output match experiment. Smaller transparent dots represent individual flies, simulated based on their individual behavioral parameters and average optimal leg forces for the relevant strain and day. Wild type animals show recovery in angular bias over 3 days, the mutants have impaired recovery (y-axis). No genotype shows recovery in the stability of 3-leg gaits (x-axis). D. Force change required in each leg separately to fit recovery profile. The dashed line is a visual guide indicating no force change. The middle leg (red) requires the least change to fit a target recovery profile, followed by the back (yellow) and front leg (blue).
�27

Tables
Table 1: Model symbols and descriptions. Grey background denotes variables, light yellow background represents mathematical functions, dark yellow background denotes parameters that either set an overall scale/threshold, blue background denotes derived variables/parameters, light green background denotes parameters found from literature/experiment, red background denotes tuning parameters.
Symbol Description Initial condition, Definition, Value
Center of mass position (x, y coordinates)
Body angle (from vertical)
Leg endpoint (x, y coordinates)
Neuron activity
Time 0
Heaviside function
Left/right index function
Clockwise rotation matrix, where is positive in the counterclockwise direction (for rotating between body frame and lab frame)
Indicator variable
Mass 1
Body length 1
Leg relaxation timescale 0.01
Neuron relaxation timescale 0.01
Neuron relaxation amplitude if stretch exceeds bounds
1
Neuron firing threshold 0.9
Neuron excitation amplitude when excited by the central pattern generator
1
Inertia 0.01
Torque from leg
Force from leg in the x, y direction
�28

Relaxed leg length, relaxed leg angle (relative to body)
Leg length
Body width 0.34
Translational damping. Body is in over-damped regime
1.5
Rotational damping. Body is in over-damped regime
1.5
Position of leg-body attachment point (x, y coordinates)
Relaxed leg endpoint position (x, y coordinates)
Maximum stretch ratio (“physical joint”) 2
Excitation pulse frequency Varies
Proportion of time leg is down per stride Varies
Excitation pulse phase (when leg is lifted) relative to )
Varies
Force magnitude Varies
�29

Supplementary Material
Fig. S1. Video analysis process. Starting with an 8-bit grayscale movie, we perform an automatic rough temporal crop to remove the frames before the fly appears. Then, a fine-grained crop is performed by manually looking at still frames and determining the first and last frames that constitute the run. Then, we run the movie through an automatic tracking algorithm (Fig. S2 in supplementary material) and perform hand verification/correction on each frame. The final result is a movie with all leg positions tracked (e.g. movies M2-M4 in supplementary material).
�30

Fig. S2. Automatic tracking algorithm logic flow chart. The algorithm takes a grayscale movie and applies the Otsu method (Otsu, 1975) to quickly find a preliminary threshold for converting the frames to binary images. It then sets a maximum and minimum threshold based on the preliminary threshold. Using the most aggressive threshold to remove all “non-body” points (including legs), we find the centroid of the body and the major axis by fitting an ellipse. Front/back symmetry is broken by computing centroid motion and choosing the head as the extremal point on the axis in the direction of centroid motion. Then, we use a dynamic thresholding approach by sweeping through the acceptable threshold values from maximum (least aggressive) to minimum (most aggressive)
�31

and automatically identifying the connected component (CC) of interest as the one containing the centroid. The acceptance criterion is based on the number of pixels retained in the CC with the fly being reasonably close to what is expected of a fly (acceptable parameter values were found by testing). Once the threshold is set, we keep only the CC containing the fly centroid. We then use what we term “dynamic masking” to find leg endpoints. The major axis becomes the first mask (the pixels are removed) and we count the number of CC. Until the number of connected components is equal to the required number of legs (6 pre-amputation, 5 post-amputation), expand the mask by adding the closest parallel axis to the central axis at either end of the current mask and recalculate. That is, remove more and more of the fly body in “slices” parallel to the major axis until the appropriate number of connected components remains. Then, calculate the minimum geodesic distance from the mask to all points within each CC. The leg endpoints are chosen to be the pixels with the maximal distance measure on each connected component (if several pixels share the same distance within one connected component, choose randomly). This algorithm can yield accuracies greater than 95%, but only with high resolution images. In the case of our camera, the algorithm tracked <10% of frames (i.e. all 5 or 6 legs) sufficiently accurately, so most frames were hand-corrected.
�32

Fig. S3. Schematic showing model notation corresponding to Figure 3, Equations (1)-(9), and Table 1. A signal from the central pattern generator (located in the fly’s ventral nerve cord in the thorax) to one limb is shown in the inset and mediates the neuronal dynamics that control that limb. See Table 1 for description of all symbols used in the model that is described in Equations (1)-(9).
�33

Fig. S4. Typical simulated paths from the random walk simulation. Typical simulated paths (Panel A: angular bias = 0, Panel B: angular bias = 0.03). Blue indicates a clockwise path segment and red indicates a counterclockwise segment. Thus, tuning the angular bias parameter allows us to mimic the turning bias imparted by amputation.
�34

Fig. S5. Calibration curve for converting between model output (angular bias) and arena locomotion turning bias (µ). Heading drift was chosen to be closest to a best fit to pre-amputation wild type turning bias histogram data (with bias = 0 in the simulation) while permitting the necessary dynamic range for µ. The blue curve is average value over 50 runs for each value of angular bias. The red curve is a quadratic line of best fit (R2 = 0.999).
�35

Fig. S6. Speed recovery over time. Speed by strain by day, normalized by the pre-amputation value. While speed never recovers to the pre-amputation value, wild type and nanchung show a clear upward trend which is not present in inactive.
�36

Fig. S7. Gait frequency frame by frame. Frequency of 1, 2, 3-leg gaits from “frame by frame” analysis of moving legs (rather than HMM analysis). We see a qualitatively similar pattern to Fig. 2D, though some details differ, e.g. the frequency of 2-leg gait on day 3 post amputation is lower than the frequency of the 1-leg gait for wild type flies in this analysis.
�37

Fig. S8. Transition probabilities between gaits by strain by day from the HMM. Numbers with gray background correspond to gait type (that is, “1 to 2” means “1-leg gait to 2-leg gait”).
�38

Fig. S9. Frequency of specific leg patterns in the frame by frame basis. Six-digit label indicates which legs are moving. Digits are ordered the same way as the legs in Fig. 1A from bottom to top. A 1 represents leg in stride phase while a 0 represents leg in stance phase. E.g. 101010 indicates that legs 1, 3 and 5 are in stride phase and legs 2, 4 and 6 are in stance phase - an instance of alternating tripod gait. The dashed line is a visual guide at 5%. We see that largely canonical gaits are exhibited pre-amputation.
�39

Table S1: Calibration curve and simulated annealing symbols and descriptions. Green background is for symbols used in calibration curve simulation and blue background is for symbols used in simulated annealing.
Symbol Description Value
Number of runs 50
Number of simulation steps 104
Heading direction Varies
Heading bias Varies
Heading drift 0.029
Ra Arena radius 10.2
Number of steps in annealing 1.5*103
Annealing interval 75
Cooling factor 0.9
Temperature Varies
Proposal interval [0.1, 0.25]
Proposal tuning parameter 0.15
Energy of solution Varies
Acceptance tuning parameter 5
Acceptance probability Varies
�40

Movie Titles
Movie M1. Insect with five legs in the wild. Locomotor injury (including losing a limb) occurs in nature.
Movie M2. Representative example of wild type fly pre-amputation with legs tracked. Movie was recorded at 60 fps, playback at 15.
Movie M3. Representative example of wild type fly 1 hour post-amputation with legs tracked. Movie was recorded at 60 fps, playback at 15.
Movie M4. Representative example of wild type fly 72 hours post-amputation with legs tracked. Movie was recorded at 60 fps, playback at 15.
Movie M5. Simulation of the physical walking model for a fly pre-amputation with a tripod gait. There is no visible turning bias.
Movie M6. Simulation of the physical walking model for a fly post-amputation. There is visible turning bias.
�41