Embed Size (px)
Citation preview

LOG OF MEETING DIRECTORATE FOR ENGINEERING SCIENCES
SUBJECT: Recreational Off-Highway Vehicles (ROVs) – Meeting requested by the U.S. Consumer Product Safety Commission (CPSC) staff to discuss test methodology and test results of static and dynamic testing of ROVs by SEA Limited for CPSC staff and Carr Engineering Inc. (CEI) for the Recreation Off-Highway Vehicle Association (ROHVA). DATE OF MEETING: July 19, 2012 PLACE OF MEETING: U.S. Consumer Product Safety Commission, Bethesda, MD LOG ENTRY SOURCE: Caroleene Paul, ESME COMMISSION ATTENDEES: See attached attendance list NON-COMMISSION ATTENDEES: See attached attendance list SUMMARY OF MEETING:
CPSC staff presented staff’s motivation for testing recreational off-highway vehicles (ROVs), summarized the conclusions from the extensive testing performed by SEA Limited, and introduced Dr. Gary Heydinger to discuss the test methodologies, data, and results of the ROV test effort. Presentation is attached. Dr. Gary Heydinger of SEA Limited presented the test methodologies used in performing static and dynamic tests of 10 different ROVs. The presentation included SEA’s data quality checks and discussion of the results of the dynamic tests. SEA believes their laboratory and dynamic test results are both very accurate and very repeatable. Presentation attached. Dr. Gary Heydinger presented a review of materials related to drop throttle J-turn tests presented to CPSC staff by the Recreational Off-Highway Vehicle Association (ROHVA) in November 2011. SEA’s presentation stressed that the inability of Carr Engineering Inc. (CEI) to duplicate some of the testing results of SEA does not mean that the testing results of SEA are inaccurate or unrepeatable. It was noted that the equation (submitted by ROHVA to CPSC staff) that was used by CEI to calculate the ground plane lateral acceleration is incorrect and does not conform to the equation cited in ROHVA’s voluntary standard, ANSI/ROHVA 1-2011, or to the National Highway Traffic Safety Administration (NHTSA) Final Rule on the New Car Assessment Program; Rollover Resistance. In particular, the submitted CEI equation does not use measured vertical acceleration in calculating ground plane lateral acceleration and, per SAE sign convention, the equation adds to the magnitude of lateral acceleration instead of subtracting. It was also noted that SEA was able to measure peak lateral acceleration at vehicle rollover in over 200 dynamic tests because the data plots for each test clearly show the peak acceleration. Conversely, the exemplar lateral acceleration plot presented by CEI (in November 2011) indicates a lateral acceleration that is physically impossible based on the static stability of the vehicle. SEA believes CEI’s lack of adherence to exacting test methodologies and/or errors in

processing data are the likely reason for the variation in test results between SEA and CEI. Presentation attached. James Walker of CEI presented additional data on J-turn repeatability tests that were performed by CEI. CEI performed 15 J-turn test runs on the same vehicle and found variations in the peak lateral acceleration measured at vehicle rollover and variations in the steering wheel angle measured at vehicle rollover. CEI was also unable to find correlation between understeer gradient and lateral acceleration. CEI uses a body roll correction factor in calculating the ground plane lateral acceleration and the resultant equation differs from the equation cited in ANSI/ROHVA 1-2011 and in NHTSA’s Final Rule on the New Car Assessment Program. CEI also uses a different sign convention for the body roll angle that is not consistent with the Society of Automotive Engineers (SAE) sign convention. CEI believes their method of calculating ground plane lateral acceleration is equivalent to the method used by NHTSA and is therefore appropriate. Presentation attached.

MEETING ATTENDANCE RECORD ROHVA / CPSC Staff – July 19, 2012 COMMISSION ATTENDEES:
NAME ORGANIZATION PHONE E-MAIL
George Borlase CPSC 301-987-2472 [email protected] Robert Franklin CPSC 301-504-7708 [email protected] Sarah Garland CPSC 301-504-7331 [email protected] Carrae Green CPSC 301-504-7532 [email protected] Jason Goldsmith CPSC 301-504-7262 [email protected] Ian Hall CPSC 301-987-2323 [email protected] Justin Jirgl CPSC 301-504-7814 [email protected] Kevin Lee CPSC 301-987-2486 [email protected] Barbara Little CPSC 301-504-7879 [email protected] Caroleene Paul CPSC 301-987-2225 [email protected] Sarah Newens CPSC 301-504-7791 [email protected] Anthony Teems CPSC 301-504-2329 [email protected]
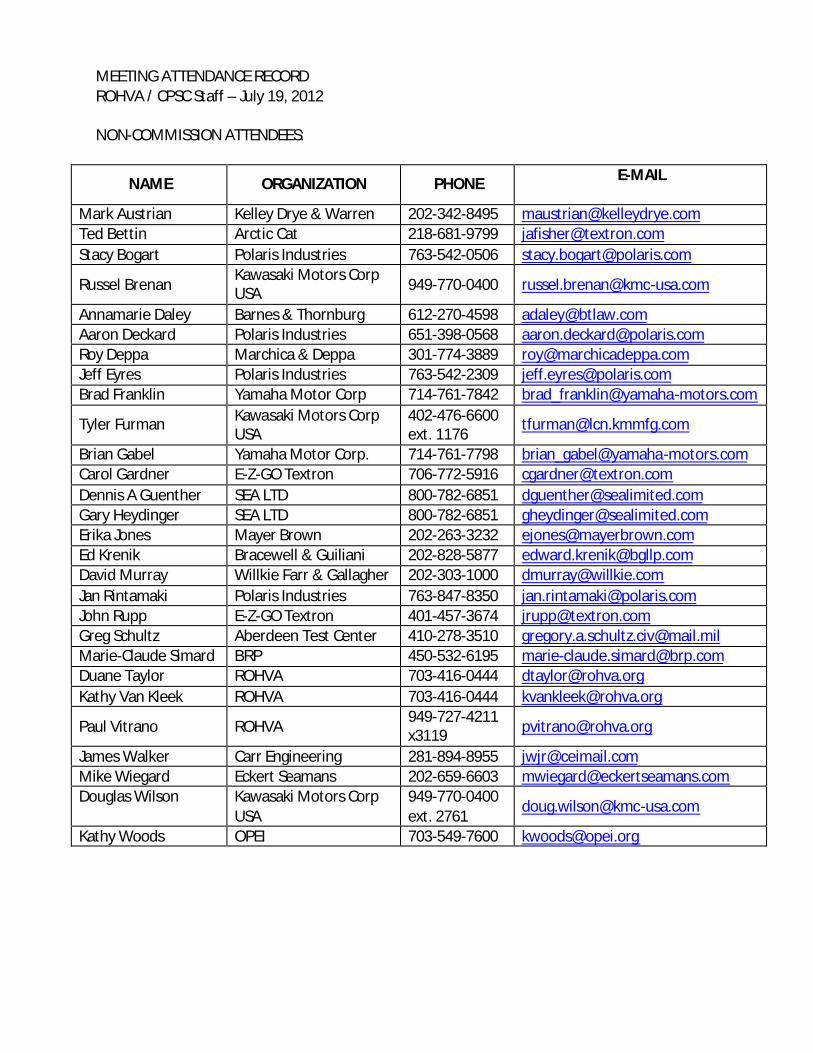
MEETING ATTENDANCE RECORD ROHVA / CPSC Staff – July 19, 2012 NON-COMMISSION ATTENDEES:
NAME ORGANIZATION PHONE E-MAIL
Mark Austrian Kelley Drye & Warren 202-342-8495 [email protected] Ted Bettin Arctic Cat 218-681-9799 [email protected] Stacy Bogart Polaris Industries 763-542-0506 [email protected]
Russel Brenan Kawasaki Motors Corp USA 949-770-0400 [email protected]
Annamarie Daley Barnes & Thornburg 612-270-4598 [email protected] Aaron Deckard Polaris Industries 651-398-0568 [email protected] Roy Deppa Marchica & Deppa 301-774-3889 [email protected] Jeff Eyres Polaris Industries 763-542-2309 [email protected] Brad Franklin Yamaha Motor Corp 714-761-7842 [email protected]
Tyler Furman Kawasaki Motors Corp USA
402-476-6600 ext. 1176 [email protected]
Brian Gabel Yamaha Motor Corp. 714-761-7798 [email protected] Carol Gardner E-Z-GO Textron 706-772-5916 [email protected] Dennis A Guenther SEA LTD 800-782-6851 [email protected] Gary Heydinger SEA LTD 800-782-6851 [email protected] Erika Jones Mayer Brown 202-263-3232 [email protected] Ed Krenik Bracewell & Guiliani 202-828-5877 [email protected] David Murray Willkie Farr & Gallagher 202-303-1000 [email protected] Jan Rintamaki Polaris Industries 763-847-8350 [email protected] John Rupp E-Z-GO Textron 401-457-3674 [email protected] Greg Schultz Aberdeen Test Center 410-278-3510 [email protected] Marie-Claude Simard BRP 450-532-6195 [email protected] Duane Taylor ROHVA 703-416-0444 [email protected] Kathy Van Kleek ROHVA 703-416-0444 [email protected]
Paul Vitrano ROHVA 949-727-4211 x3119 [email protected]
James Walker Carr Engineering 281-894-8955 [email protected] Mike Wiegard Eckert Seamans 202-659-6603 [email protected] Douglas Wilson
Kawasaki Motors Corp USA
949-770-0400 ext. 2761 [email protected]
Kathy Woods OPEI 703-549-7600 [email protected]

MEETING ATTENDANCE RECORD ROHVA / CPSC Staff – July 19, 2012 COMMISSION ATTENDEES:
NAME ORGANIZATION PHONE E-MAIL
George Borlase CPSC 301-987-2472 [email protected] Robert Franklin CPSC 301-504-7708 [email protected] Sarah Garland CPSC 301-504-7331 [email protected] Carrae Green CPSC 301-504-7532 [email protected] Jason Goldsmith CPSC 301-504-7262 [email protected] Ian Hall CPSC 301-987-2323 [email protected] Justin Jirgl CPSC 301-504-7814 [email protected] Kevin Lee CPSC 301-987-2486 [email protected] Barbara Little CPSC 301-504-7879 [email protected] Sarah Newens CPSC 301-504-7791 [email protected]

MEETING ATTENDANCE RECORD ROHVA / CPSC Staff – July 19, 2012 NON-COMMISSION ATTENDEES:
NAME ORGANIZATION PHONE E-MAIL
Mark Austrian Kelley Drye & Warren 202-342-8495 [email protected] Ted Bettin Arctic Cat 218-681-9799 [email protected] Stacy Bogart Polaris Industries 763-542-0506 [email protected]
Russel Brenan Kawasaki Motors Corp USA 949-770-0400 [email protected]
Annamarie Daley Barnes & Thornburg 612-270-4598 [email protected] Aaron Deckard Polaris Industries 651-398-0568 [email protected] Roy Deppa Marchica & Deppa 301-774-3889 [email protected] Jeff Eyres Polaris Industries 763-542-2309 [email protected] Brad Franklin Yamaha Motor Corp 714-761-7842 [email protected]
Tyler Furman Kawasaki Motors Corp USA
402-476-6600 ext. 1176 [email protected]
Brian Gabel Yamaha Motor Corp. 714-761-7798 [email protected] Carol Gardner E-Z-GO Textron 706-772-5916 [email protected] Dennis A Guenther SEA LTD 800-782-6851 [email protected] Gary Heydinger SEA LTD 800-782-6851 [email protected] Erika Jones Mayer Brown 202-263-3232 [email protected] Ed Krenik Bracewell & Guiliani 202-828-5877 [email protected] David Murray Willkie Farr & Gallagher 202-303-1000 [email protected] Jan Rintamaki Polaris Industries 763-847-8350 [email protected] John Rupp E-Z-GO Textron 401-457-3674 [email protected] Greg Schultz Aberdeen Test Center 410-278-3510 [email protected] Marie-Claude Simard BRP 450-532-6195 [email protected] Duane Taylor ROHVA 703-416-0444 [email protected] Kathy Van Kleek ROHVA 703-416-0444 [email protected]
Paul Vitrano ROHVA 949-727-4211 x3119 [email protected]
James Walker Carr Engineering 281-894-8955 [email protected] Mike Wiegard Eckert Seamans 202-659-6603 [email protected] Douglas Wilson
Kawasaki Motors Corp USA
949-770-0400 ext. 2761 [email protected]
Kathy Woods OPEI 703-549-7600 [email protected]

CPSC Staff Meeting WithRecreational Off-Highway Vehicle Association
Dynamic and Static TestingJuly 19, 2012
Introduction
Purpose: Communicate test methods and results used by CPSC staff to evaluate ROV vehicles
Agenda• Participant introductions• CPSC - Staff motivation for testing ROVs• Dr. Gary Heydinger of SEA Limited
• Test Methods and Results• Q & A

CPSC Staff Initiated Dynamic and Static Tests to:• Document, evaluate, and compare stability and handling of typical
ROVs• Support rulemaking• Assess characteristics affecting rollover
– Rollover is a significant incident factor• Gather consistent facts
– Dynamic characteristics– Static measures
• Compare alternative performance measures
Recreational Off-Highway VehiclesDynamic and Static Testing
Independent Testing Conducted BySEA Limited
• Dynamic Tests• Drop and Constant Throttle J-Turn• Constant Radius Circle• Slowly Increasing Steer• Sinusoidal Sweep Steering• Flick Steering Input
• Vehicle Inertial Measurement Facility (VIMF)• Center of Gravity (CG) Location• Pitch, Roll, and Yaw Moments of Inertia
* Five also tested at AberdeenTest Center (A, B, D, F, H)
Ten Market Representative Vehicles Evaluated*
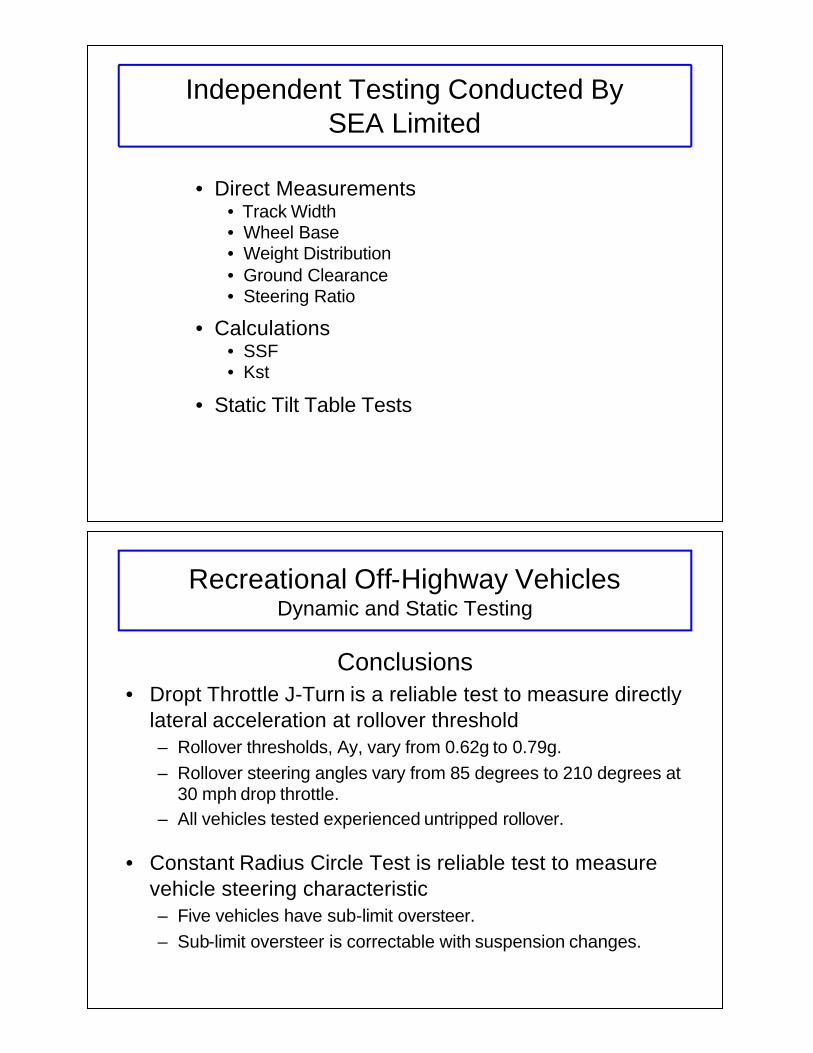
Independent Testing Conducted BySEA Limited
• Direct Measurements• Track Width• Wheel Base• Weight Distribution• Ground Clearance• Steering Ratio
• Calculations• SSF• Kst
• Static Tilt Table Tests
Conclusions• Dropt Throttle J-Turn is a reliable test to measure directly
lateral acceleration at rollover threshold– Rollover thresholds, Ay, vary from 0.62g to 0.79g.– Rollover steering angles vary from 85 degrees to 210 degrees at
30 mph drop throttle.– All vehicles tested experienced untripped rollover.
• Constant Radius Circle Test is reliable test to measure vehicle steering characteristic– Five vehicles have sub-limit oversteer.– Sub-limit oversteer is correctable with suspension changes.
Recreational Off-Highway VehiclesDynamic and Static Testing
1
S-E-A, Ltd. Presentation to CPSC and ROVHAon Methodologies used to Generate
Static (Laboratory) and Dynamic (Field Testing)Test Data and Summary of Test Results
July 19, 2012
Gary J. Heydinger, Ph.D., P.E.Director Vehicle Dynamics Division
2
To obtain vehicle characteristic data that is accurate and repeatable using measurement and test methods that are proven and accepted in the academic and industrial communities.
To document, study, and compare the dynamic performance characteristics of commonly available recreational off-highway vehicles (ROV’s).
Objectives of CPSC Testing Program

3
present methodologies used by S-E-A to generatestatic (laboratory) and dynamic (field testing) test data
• To provide an overview and partial summary of test results obtained by S-E-A
Objectives of This Presentation
4
S-E-A, Ltd. Reports to CPSC
Vehicle Characteristics Measurements Of Recreational Off-Highway Vehicles, April 2011
http://www.cpsc.gov/library/foia/foia11/os/rov.pdf
Vehicle Characteristics Measurements Of Recreational Off-Highway Vehicles – Additional Results for Vehicle J, August 2011
http://www.cpsc.gov/library/foia/foia11/os/rovj.pdf
5
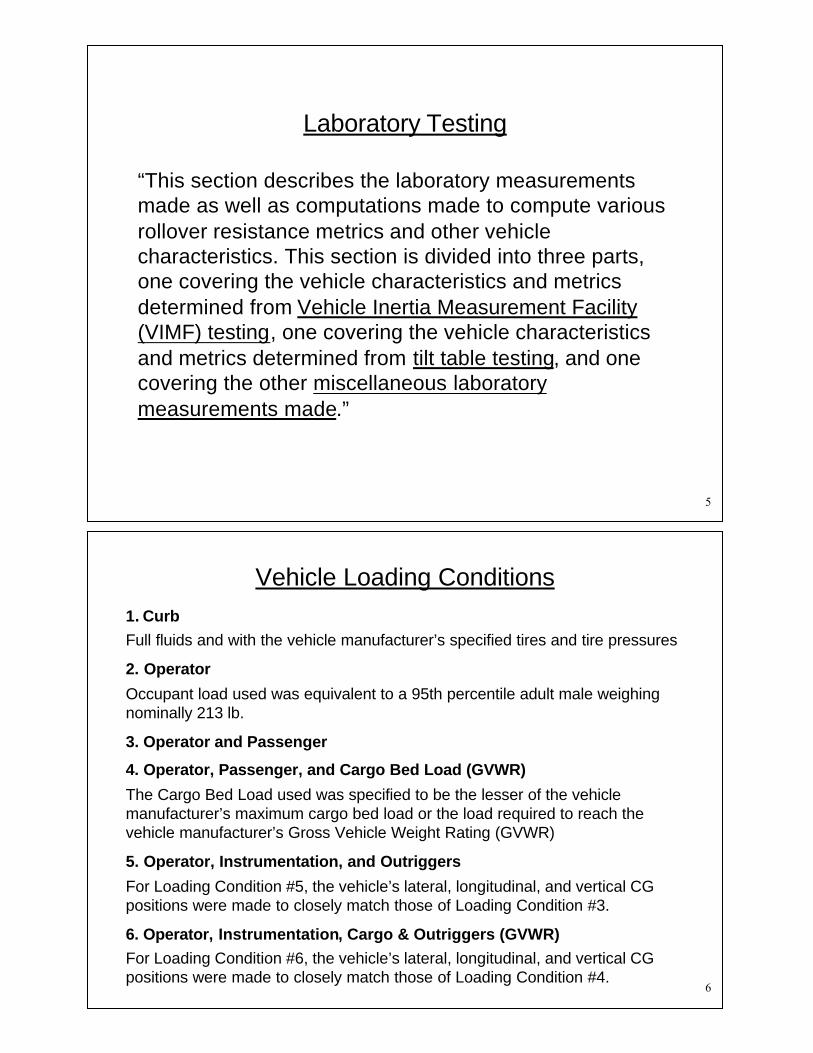
Laboratory Testing
“This section describes the laboratory measurements made as well as computations made to compute various rollover resistance metrics and other vehicle characteristics. This section is divided into three parts, one covering the vehicle characteristics and metrics determined from Vehicle Inertia Measurement Facility (VIMF) testing, one covering the vehicle characteristics and metrics determined from tilt table testing, and one covering the other miscellaneous laboratory measurements made.”
6
Vehicle Loading Conditions1. CurbFull fluids and with the vehicle manufacturer’s specified tires and tire pressures
2. Operator
Occupant load used was equivalent to a 95th percentile adult male weighing nominally 213 lb.
3. Operator and Passenger
4. Operator, Passenger, and Cargo Bed Load (GVWR)
The Cargo Bed Load used was specified to be the lesser of the vehicle manufacturer’s maximum cargo bed load or the load required to reach the vehicle manufacturer’s Gross Vehicle Weight Rating (GVWR)
5. Operator, Instrumentation, and Outriggers
For Loading Condition #5, the vehicle’s lateral, longitudinal, and vertical CG positions were made to closely match those of Loading Condition #3.
6. Operator, Instrumentation, Cargo & Outriggers (GVWR)For Loading Condition #6, the vehicle’s lateral, longitudinal, and vertical CG positions were made to closely match those of Loading Condition #4.

7
Based on detailed error analyses and supported by the results of actual repeat testing, the repeatability of VIMF center of gravity height measurements is within 0.5% of the measured values.
S-E-A Vehicle Inertia Measurement Facility (VIMF) Tests
• Vehicle Weight
• Vehicle Center-of-Gravity Position Longitudinal, Lateral and Vertical (CG Height) Positions
• Vehicle Pitch, Roll and Yaw Moment of Inertias
• Vehicle Roll/Yaw Product of Inertia
8
VIMF Uses a Stable Pendulum Method to Determine CG Height
ISO 10392, Last Revised 2011Road Vehicles – Determination of Centre of Gravity
Another Method is Axle Lift Method(also Called Suspension (Lift) or Balance Angle Method)
SAE J874, Last Revised 1993Earthmoving Machines - Method for Locating the Center of Gravity
Text from Scope of ISO 10392
“The axle lift method can generally provide centre-of-gravity height accuracy in the range of a few percent, while the stable pendulum method can provide accuracy in the range of 0.5%.”
9
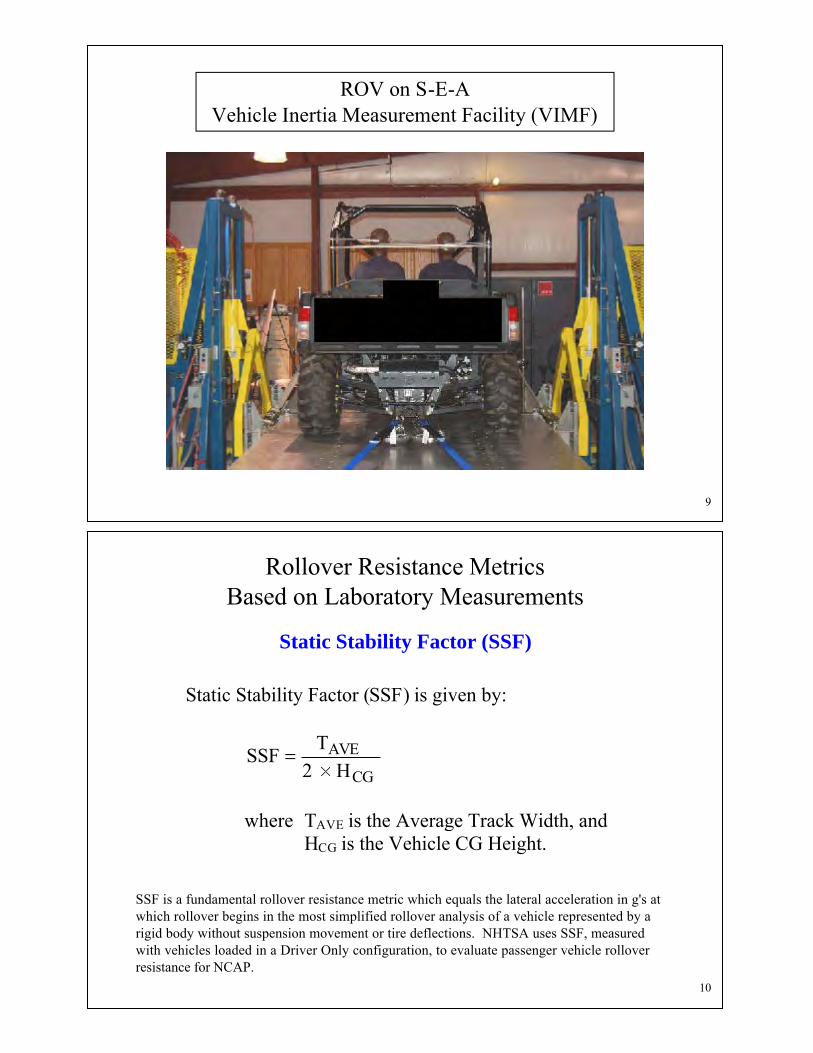
ROV on S-E-AVehicle Inertia Measurement Facility (VIMF)
10
SSF is a fundamental rollover resistance metric which equals the lateral acceleration in g's at which rollover begins in the most simplified rollover analysis of a vehicle represented by a rigid body without suspension movement or tire deflections. NHTSA uses SSF, measured with vehicles loaded in a Driver Only configuration, to evaluate passenger vehicle rollover resistance for NCAP.
Rollover Resistance MetricsBased on Laboratory Measurements
Static Stability Factor (SSF) is given by:
CG
AVEH2
TSSF
where TAVE is the Average Track Width, andHCG is the Vehicle CG Height.
Static Stability Factor (SSF)

11
Lateral stability coefficient (KST)
Lateral stability coefficient (KST) is given by:
CG
RFCGRHL2
)TT(LTLKST
where L is the Vehicle Wheelbase,TF is the Front Track Width,TR is the Rear Track Width, andLCG is the Longitudinal Distance from the Rear Axle to the CG, andHCG is the Vehicle CG Height.
NOTE: If the front track width and rear track widthof a vehicle are equal, then KST is equal to SSF.
Rollover Resistance MetricsBased on Laboratory Measurements
12
Critical Sliding Velocity (CSV) is given by:
CG2
CG2
AVE2
CG
oxx HH4
T
HM
Ig2CSV
where g is the Gravitational Constant,M is the Vehicle Mass,TAVE is the Average Track Width,HCG is the Vehicle CG Height, andIoxx is the Effective Roll Moment of Inertia about the Tip Pivot, given by:
2CG
2AVE
xxoxx H4
TMII
where Ixx is the Vehicle Roll Moment of Inertia about its CG.
Critical Sliding Velocity (CSV)
Rollover Resistance MetricsBased on Laboratory Measurements

13
S-E-A Ltd. Tilt Table Tests
• Driver’s side and passenger’s side tilts were performed.
• S-E-A tilt table set-up provides for smooth tilting at rates as slow as 0.1 deg/sec.
• The S-E-A tilt table platform is very rigid, having deflections of less than 0.1 inch for a vehicle weight up to 10,000 lb. It is also very flat, with a flatness tolerance of +/- 0.1 inch.
• Based on repeatability evaluations conducted using a range of different vehicles, S-E-A believes that the repeatability of the measurements of two-wheel lift is within +/- 0.1 degrees.
14
Section from: ANSI/OPEI B71.9 - 2012American National Standard for Multipurpose
Off-Highway Utility Vehicles
8.7 Tilt Table Stability
8.7.1.4 Required Tools, Instrumentation or Other Devices
a)A device to measure the angle of the test surface with an accuracy of ±0.5 degree (0.87% grade).

15
Tilt Table Angle (TTA) and Tilt Table Ratio (TTR)
TTATTR tan
Tilt Table Angle (TTA) is the angle at which two-wheel lift occurs.
Tilt Table Ratio (TTR) is given by:
Rollover Resistance MetricsBased on Laboratory Measurements
16
ROV on S-E-A Tilt Table

17
Other Laboratory Measurements Made by S-E-A Ltd.
• Front and Rear Ground Clearance in the Operator and Passenger Loading Condition
• Steering Ratio in the Operator and Passenger Loading Condition
• Linear curve fits of the measured data in the range of 180 of steering wheel angle were used to compute the
overall steering ratios.
18
Curb OperatorOperator
&Passenger
Operator,Passenger &
Cargo (GVWR)
Operator,Inst &
Outriggers
Operator, Inst,Cargo &
Outriggers(GVWR)
VIMF Test Number 4180 4181 4182 4183 4184Total Vehicle Weight (lb) 1218.7 1431.7 1644.5 1998.4 1644.2 1998.8
Left Front Weight (lb) 259.8 317.5 343.9 334.5 357.3 341.6Right Front Weight (lb) 278.7 309.4 371.6 357.2 352.2 350.9Left Rear Weight (lb) 319.5 441.2 444.0 629.4 462.4 621.5
Right Rear Weight (lb) 360.7 363.6 485.0 677.3 472.3 684.8Front Track Width (in) 45.20 45.20 45.40 45.25 45.40 45.25Rear Track Width (in) 43.60 43.60 44.25 45.50 44.25 45.50
Average Track Width (in) 44.40 44.40 44.83 45.38 44.83 45.38Wheelbase (in) 75.15 75.15 75.15 75.15 75.15 75.15
CG Longitudinal (in) 41.94 42.24 42.45 49.14 42.72 49.11CG Lateral (in) 1.09 -1.33 0.94 0.80 0.07 0.82CG Height (in) 24.56 25.52 25.35 25.26
Roll Inertia - IXX (ft-lb-s2) 129 155 159 190Pitch Inertia - IYY (ft-lb-s2) 274 286 365 298Yaw Inertia - IZZ (ft-lb-s2) 288 299 376 338Roll/Yaw - IXZ (ft-lb-s2) 9 15 24 12
SSF 0.904 0.878 0.895 0.887KST 0.906 0.880 0.894 0.889
CSV (mph) 7.32 7.17 7.17 7.47Tilt Table: Direction Driver Driver Driver Driver
Tilt Table: First Wheel Lift Rear Rear Rear RearTilt Table Angle (deg) 33.0 32.8 32.7 32.7Tilt Table Ratio (TTR) 0.649 0.645 0.643 0.643Tilt Table: Direction Passenger Passenger Passenger Passenger
Tilt Table: First Wheel Lift Rear Rear Rear RearTilt Table Angle (deg) 37.7 32.1 32.0 33.3Tilt Table Ratio (TTR) 0.773 0.626 0.626 0.658
Average Tilt Table Angle (deg) 35.3 32.4 32.4 33.0Average Tilt Table Ratio (TTR) 0.711 0.635 0.635 0.650Front Ground Clearance (in) 8.60Rear Ground Clearance (in) 10.20
Steering Ratio (deg/deg) 13.2
Vehicle A

19
Dynamic Testing
“This section describes the dynamic testing conducted at TRC between May 3 and October 12, 2010 (for Vehicles A through I) and on May 20, 2011 (for Vehicle J). The dynamic test evaluations included steering maneuvers on the flat dry asphalt surface of the Transportation Research Center’s Vehicle Dynamics Area (VDA).”
20
S-E-A Designed and Fabricated CPSC Safety Outriggers
• S-E-A designed and built triangulated aluminum outriggers that extend on both sides on the tests vehicles.
• CPSC outriggers mount to the ROPS/OPS structures on the ROV’s.
• The standard weight of these outriggers is 106 lb.
• The CG height of the CPSC outriggers is generally close to the test vehicle CG height.
• CPSC outriggers used for all vehicles except Vehicle F.
• For Vehicle F, a single titanium beam with nylon pucks at its ends was mounted securely to the top of the floorboard to serve as the safety outrigger.

21
Side View of ROV withCPSC Safety Outriggers
Front View of ROV withCPSC Safety Outriggers
22
Table 1: TRC Skid Number Measurements
Location VDAPad # V-5, dry
Pavement AsphaltSurface Untreated
Condition Dry
Date PeakPBC
SlideSN
5/5/2010 92.5 82.26/1/2010 98.1 84.7
6/21/2010 92.3 85.07/5/2010 95.7 83.2
7/19/2010 97.0 82.88/2/2010 98.2 84.9
8/23/2010 93.3 83.59/7/2010 96.6 86.5
9/27/2010 94.6 86.35/11/2011 92.7 85.0
TRC’s Vehicle Dynamics Area (VDA)
• Asphalt
• 1% Slope – 0.6 degrees
• All vehicles tested intheir most open drivelineconfiguration

23
Section from: ANSI/OPEI B71.9 - 2012American National Standard for Multipurpose
Off-Highway Utility Vehicles
7.5.2 Test Course for the Dynamic Stability Tests
a) The test course shall be a wide, horizontally flat surface sloping less than 1.0 degree (1.7% grade), …
b) The coefficient of friction for the dynamic stability test shall be 0.8 ± 0.05. A passing test using a surface with a coefficient of friction above 0.85 shall be allowed. Coefficient of friction shall be measured using the procedure found in ASTM E 1337-90 or another scientifically valid method that produces repeatable results comparable to ASTM E 1337-90.
8.5.4 Required Tools, Instrumentation or Other Devices
a) A device to measure the angle of the test surface with an accuracy of ±0.5 degree (0.87% grade).
24
Section from: ANSI/ROHVA 1 - 2011American National Standard for Multipurpose
Off-Highway Utility Vehicles
8.3.1 Test Surface.
8.3.1.1 Test-Surface Preparation. Surface used for dynamic testing shall be constructed of asphalt or concrete having a friction coefficient of at least 0.90 when measured in accordance with ASTM E 1337. The slope of this surface shall be no greater than 1 degree (1.7%).

25
Table 2: Weights of Driver and Test Equipment
Object Weight (lb)
Test Driver with Helmet 182
ASC Handwheel Unit 34
ASC Battery Box 27
ASC Electronics Box and Cables 25
SEA Data Acquisition Computer 10
Auxiliary 12V Battery 25
RT3002 GPS/IMU, Antenna, and Cables 10
SEA Power Distribution Box and Misc. Straps 7
CPSC Triangulated Aluminum Safety Outriggers 106
Total Nominal Weight 426
S-E-A Vehicle Loading: Weights of Driver and Test Equipment
26
S-E-A Vehicle Loading: Weights for GVWR Conditions
Table 3: Weight Difference Between RepresentativeOperator and Passenger and GVWR Loading
Vehicle Weight Difference (lb)
A 355
B 274
C 487
D 983
E 496
F 601
G 911
H 357
I 458
Vehicle J tested in only the RepresentativeOperator and Passenger Loading Condition
27
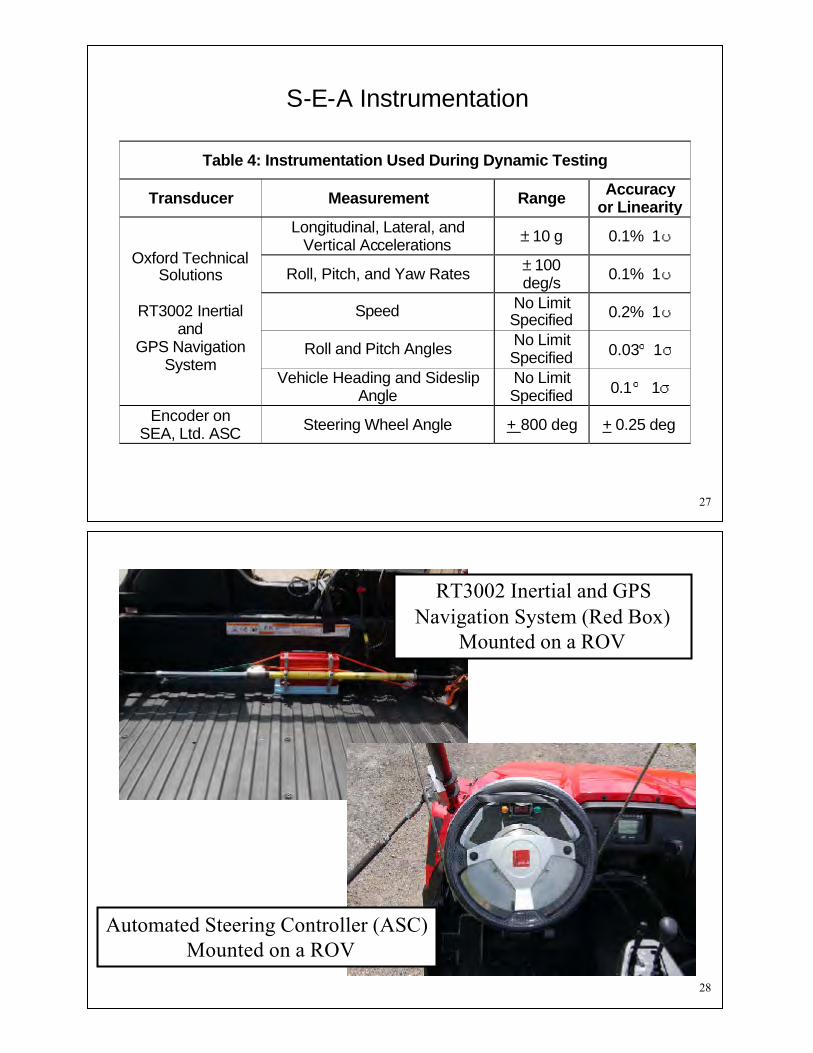
Table 4: Instrumentation Used During Dynamic Testing
Transducer Measurement Range Accuracy or Linearity
Longitudinal, Lateral, and Vertical Accelerations 10 g 0.1% 1
Roll, Pitch, and Yaw Rates 100 deg/s 0.1% 1
Speed No Limit Specified 0.2% 1
Roll and Pitch Angles No Limit Specified 0.03 1
Oxford Technical Solutions
RT3002 Inertial and
GPS Navigation System
Vehicle Heading and Sideslip Angle
No Limit Specified 0.1 1
Encoder onSEA, Ltd. ASC Steering Wheel Angle + 800 deg + 0.25 deg
S-E-A Instrumentation
28
Automated Steering Controller (ASC)Mounted on a ROV
RT3002 Inertial and GPS Navigation System (Red Box)
Mounted on a ROV

29
Translating MeasuredAccelerations to Vehicle CG Location
See equations on following slide and reference:
Consumer Information; New Car Assessment Program; Rollover Resistance; Final Rule,Federal Register, Part II, Department of Transportation, NHTSA, Pg. 59274, October 14, 2003.
• When using a multi-axis inertial sensing system that measures linear accelerations and roll, pitch, and yaw angular rates, the position of the sensor must be accurately measured relative to the CG of the vehicle. These data are required to translate the acceleration quantities measured at the sensor location to those that occur at the actual vehicle CG, in order to remove roll, pitch and yaw effects.
• The equations on the following slide can be used to translate the acceleration data. The equations are derived from equations of general relative acceleration for a translating reference frame and they use the SAE convention for a Vehicle Dynamics Coordinate System.
• Upon entering the displacement information from the sensor location to the vehicle CG, the acceleration sensor used by S-E-A provides for a direct measurement of the accelerations at the CG of the vehicle.
30
Equation for Translating MeasuredAccelerations to Vehicle CG Location
Consumer Information; New Car Assessment Program; Rollover Resistance; Final Rule,Federal Register, Part II, Department of Transportation, NHTSA, Pg. 59274, October 14, 2003.
lyrespective,onacceleratiyawandrateyawandlyrespective,onacceleratipitchandratepitchand
lyrespective,onacceleratirollandraterolland
locationteracceleromethetorespectwithCGtheof,lyrespective,ntsdisplacemeverticaland,lateral,allongitudinzand,y,xlocationteraccelerometheat,lyrespective,onsaccelerativerticaland,lateral,allongitudinzand,y,x
CGs'vehicletheat,lyrespective,onsaccelerativerticaland,lateral,allongitudinzand,y,x
:where
dispdispdisp
accelaccelaccel
correctedcorrectedcorrected

31
Accelerometers rigidly mounted in vehicles sense accelerations in avehicle-body-fixed coordinated system. Ground plane (or so-called“Corrected”) lateral acceleration can be computed from the measuredvehicle-body-fixed lateral acceleration and the vehicle-body-fixed verticalacceleration (both of which sense accelerations caused by the maneuverand by gravity). The ground plane (Corrected) lateral acceleration is theacceleration parallel to the road plane, and it is computed as (using SAEvehicle coordinate sign conventions):
Equation for Planar Ground Plane(Corrected) Lateral Acceleration
See derivation on following slide and two references:
Consumer Information; New Car Assessment Program; Rollover Resistance; Final Rule,Federal Register, Part II, Department of Transportation, NHTSA, Pg. 59274, October 14, 2003.
American National Standard for Recreational Off-Highway VehiclesANSI/ROHVA 1 – 2011, 2011
anglerollbodywhere
) sin(Az Measured-)cos(Ay MeasuredAy Corrected
32

33
• All data channels sampled at 100 Hz (100 samples per second)
• Details on digital filters used as part of processing thedata channels are listed in the April 2011 S-E-A report.
• Details on any calculations used to generate graphs and curvefits of measured data are listed in the April 2011 S-E-A report.
S-E-A Data Processing
34
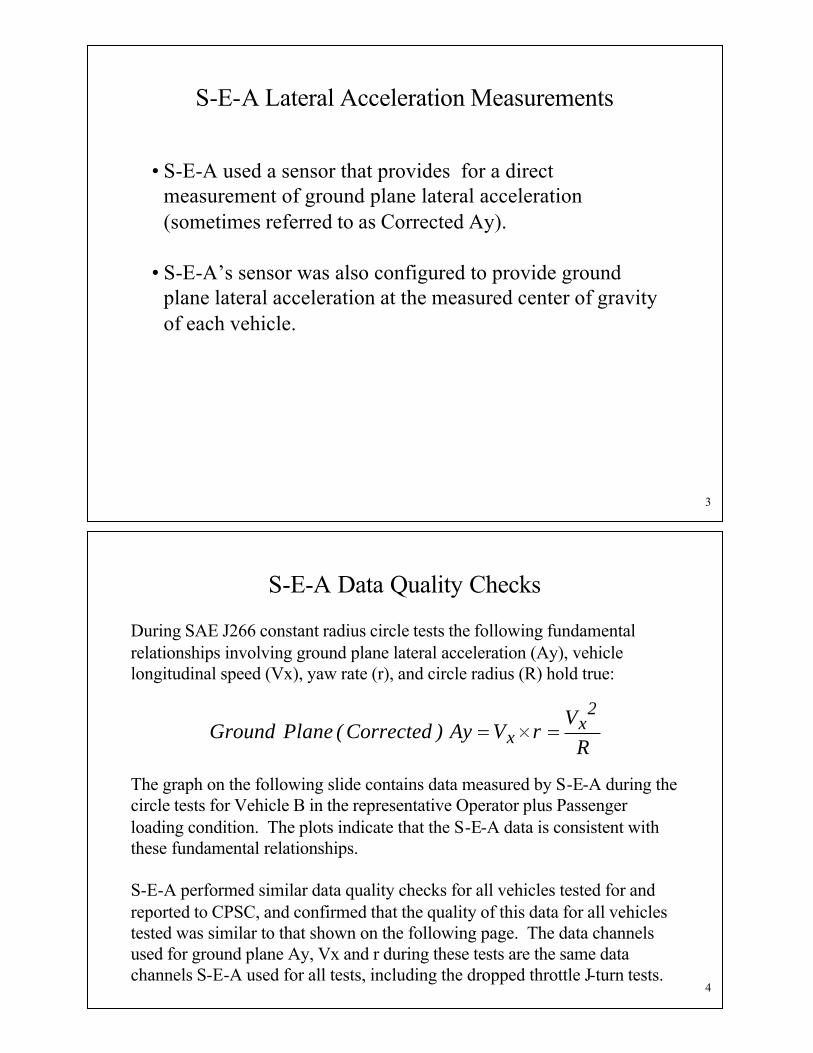
• S-E-A used a sensor that provides for a direct measurement of ground plane lateral acceleration (sometimes referred to as Corrected Ay).
• S-E-A’s sensor was also configured to provide ground plane lateral acceleration at the measured center of gravity of each vehicle.
S-E-A Lateral Acceleration Measurements

35
S-E-A Data Quality Checks
During SAE J266 constant radius circle tests the following fundamental relationships involving ground plane lateral acceleration (Ay), vehicle longitudinal speed (Vx), yaw rate (r), and circle radius (R) hold true:
The graph on the following slide contains data measured by S-E-A during the circle tests for Vehicle B in the representative Operator plus Passenger loading condition. The plots indicate that the S-E-A data is consistent with these fundamental relationships.
S-E-A performed similar data quality checks for all vehicles tested for and reported to CPSC, and confirmed that the quality of this data for all vehicles tested was similar to that shown on the following page. The data channels used for ground plane Ay, Vx and r during these tests are the same data channels S-E-A used for all tests, including the dropped throttle J-turn tests.
RV
rVAy)Corrected(PlaneGround2
xx
36
40 60 80 100 120 140 160 180 200 220-25
-20
-15
-10
-5
0
5
10
15
20
25
Time (sec)
Vehicle B - Circle Tests
Ground Plane Ay(Vx)(r)
(Vx)2/R

37
• Constant Radius (100 ft) Circle Tests
• Constant Speed (30 mph) Slowly Increasing Steer Tests
• Dropped Throttle J-Turn (Step Steer) Tests (Initial Speed of 30 mph)
• Constant Throttle J-Turn (Step Steer) Tests (Initial Speed of 30 mph)
• Sinusoidal Sweep Steering (Frequency Response) Tests (20 mph)
• Constant Speed (30 mph) Steering Flick Tests
• Maximum Speed Tests
Dynamic Tests Conducted by S-E-A
Over 900 Dynamic Tests Were Performed
38
• Tests Conducted in both Clockwise (CW) and Counterclockwise (CCW) Directions
• Tests Conducted in Accordance with:SAE Surface Vehicle Recommended Practice - Steady-State Directional Control Test Procedures For Passenger Cars and Light Trucks, SAE J266, 1996.
• Detailed results from the circle tests are contained in Appendix C of the S-E-A reports.
Constant Radius (100 ft) Circle Tests

39
0 100 200 3000
20
40
0 100 200 300
-100
-50
0
50
100
Vehicle A - Circle Tests
0 100 200 300-1
-0.5
0
0.5
1
Time (sec)
0 100 200 300-10
0
10
0 100 200 300-40
-20
0
20
40
Time (sec)
CW
CCW
40
-0.6 -0.4 -0.2 0 0.2 0.4 0.6-100
-80
-60
-40
-20
0
20
40
60
80
100
Ay (g)
Vehicle A - Circle Tests

41
0 0.1 0.2 0.3 0.4 0.5 0.6-30
-20
-10
0
10
20
30
CW Transition to Oversteer At Ay = 0.24292 g
Ay (g)
Vehicle A - Circle Tests
CCW Transition to Oversteer At Ay = -0.23431 g
Clockwise
Counterclockwise
42
0 100 200 3000
20
40
0 100 200 300
-100
-50
0
50
100
Vehicle C - Circle Tests
0 100 200 300-1
-0.5
0
0.5
1
Time (sec)
0 100 200 300-10
0
10
0 100 200 300-40
-20
0
20
40
Time (sec)
CWCCW

43
-0.6 -0.4 -0.2 0 0.2 0.4 0.6
-100
-80
-60
-40
-20
0
20
40
60
80
100
Ay (g)
Vehicle C - Circle Tests
44
0 0.1 0.2 0.3 0.4 0.5 0.6-10
-5
0
5
10
15
20
25
30
35
40
Ay (g)
Vehicle C - Circle Tests
ClockwiseCounterclockwise

45
0 0.1 0.2 0.3 0.4 0.5
-100
0
100
Vehicle A
CWCCW
Average
0 0.1 0.2 0.3 0.4 0.5
-100
0
100
Vehicle B
CW
CCWAverage
0 0.1 0.2 0.3 0.4 0.5
-100
0
100
Lateral Acceleration (g)
Vehicle C
CW
CCWAverage
46
• Tests Conducted in both Clockwise (CW) and Counterclockwise (CCW) Directions
• Tests Conducted in Accordance with:SAE Surface Vehicle Recommended Practice - Steady-State Directional Control Test Procedures For Passenger Cars and Light Trucks, SAE J266, 1996.
• Detailed results from the slowly increasing steer tests are contained in Appendix D of the S-E-A reports.
Constant Speed (30 mph) Slowly Increasing Steer Tests

47
0 10 20 30-200
-100
0
100
200Vehicle A - SIS
0 10 20 30
-0.5
0
0.5
Time (sec)
0 10 20 3010
20
30
Runs: 139 and 142
0 10 20 30
-10
0
10
0 10 20 30
-50
0
50
Time (sec)
Right Turn
Left Turn
OutriggerContact at End
of Tests
48
-0.8 -0.6 -0.4 -0.2 0 0.2 0.4 0.6 0.8
-60
-40
-20
0
20
40
60
80
Lateral Acceleration (g)
Vehicle A - SIS Runs: 139 and 142
Transition to Oversteer
At Ay = 0.39628 g
Transition to Oversteer
At Ay = -0.32757 g
Right TurnLeft TurnAckermann Steer Angle GradientCurve Fit

49
0 10 20 30-200
-100
0
100
200Vehicle C - SIS
0 10 20 30
-0.5
0
0.5
Time (sec)
0 10 20 3010
20
30
Runs: 535 and 534
0 10 20 30
-10
0
10
0 10 20 30
-50
0
50
Time (sec)
Right Turn
Left Turn
50
-0.8 -0.6 -0.4 -0.2 0 0.2 0.4 0.6 0.8
-100
-80
-60
-40
-20
0
20
40
60
80
100
Lateral Acceleration (g)
Vehicle C - SIS Runs: 535 and 534
Right TurnLeft TurnAckermann Steer Angle Gradient
Curve Fit

51
• Tests Conducted in both Right and Left Turn Directions
• For the dropped throttle J-turn tests, the test driver drove eachvehicle along a straight-line path at a speed slightly above 30 mph.He then dropped the throttle and triggered the ASC to initiate thesteering input precisely when the vehicle speed reached 30 mph.The speed of 30 mph was used because it was believed that at thisspeed all of the vehicles tested, in both loading configurations,would result in a tip-up condition given high enough steeringmagnitudes. This was the case for all of the vehicles tested.
• The steering rate used for all of the J-turn tests was 500 deg/sec.
Dropped Throttle J-Turn (Step Steer) Tests (Initial Speed of 30 mph)
52
• The magnitudes of the steering inputs were varied to identify theminimum steering magnitude required to result in tip-up in the 30mph dropped throttle tests. For this testing, tip-up events areconsidered those that produced significant two-wheel lift and inalmost all cases outrigger contact. These tests provided a measureof the minimum lateral accelerations and minimum steering wheelangles required to cause two-wheel lifts during the tests.
Dropped Throttle J-Turn (Step Steer) Tests (Initial Speed of 30 mph)
53
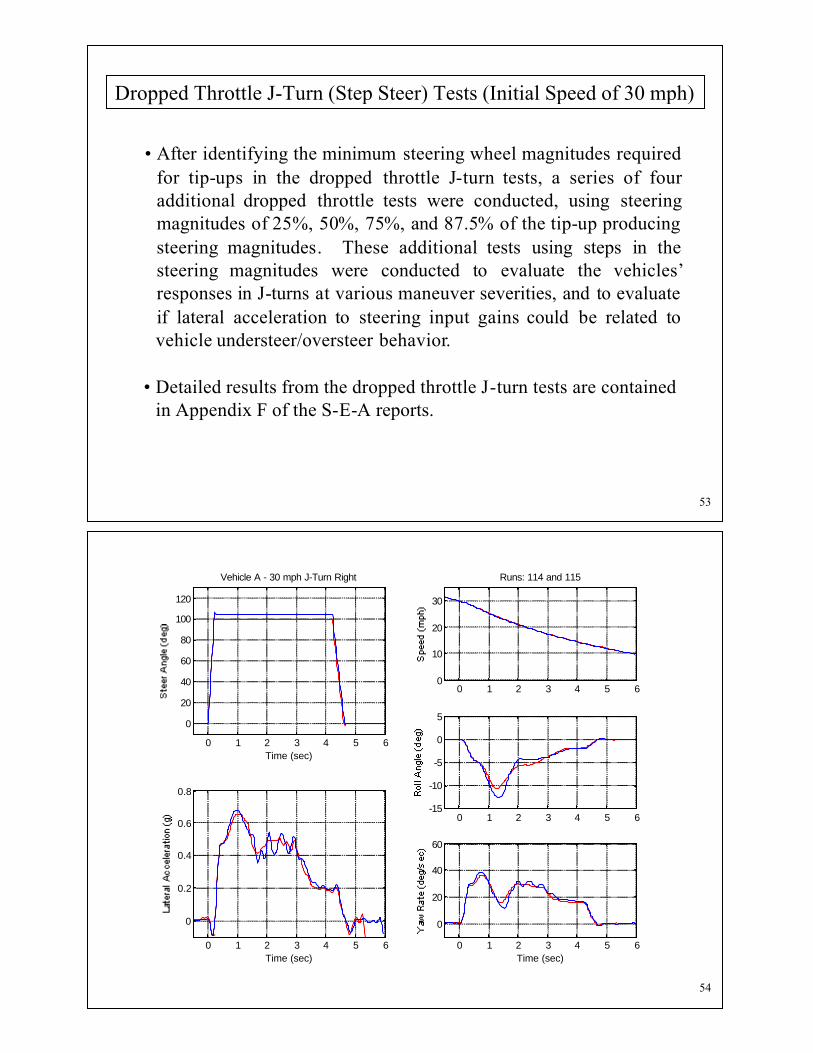
• After identifying the minimum steering wheel magnitudes requiredfor tip-ups in the dropped throttle J-turn tests, a series of fouradditional dropped throttle tests were conducted, using steeringmagnitudes of 25%, 50%, 75%, and 87.5% of the tip-up producingsteering magnitudes. These additional tests using steps in thesteering magnitudes were conducted to evaluate the vehicles’responses in J-turns at various maneuver severities, and to evaluateif lateral acceleration to steering input gains could be related tovehicle understeer/oversteer behavior.
• Detailed results from the dropped throttle J-turn tests are contained in Appendix F of the S-E-A reports.
Dropped Throttle J-Turn (Step Steer) Tests (Initial Speed of 30 mph)
54
0 1 2 3 4 5 6
0
20
40
60
80
100
120
Time (sec)
Vehicle A - 30 mph J-Turn Right
0 1 2 3 4 5 6
0
0.2
0.4
0.6
0.8
Time (sec)
0 1 2 3 4 5 60
10
20
30
Runs: 114 and 115
0 1 2 3 4 5 6-15
-10
-5
0
5
0 1 2 3 4 5 6
0
20
40
60
Time (sec)

55
0 1 2 3 4 5 6-100
-80
-60
-40
-20
0
Time (sec)
Vehicle A - 30 mph J-Turn Left
0 1 2 3 4 5 6-0.8
-0.6
-0.4
-0.2
0
Time (sec)
0 1 2 3 4 5 60
10
20
30
Runs: 116 and 117
0 1 2 3 4 5 6-5
0
5
10
15
0 1 2 3 4 5 6-60
-40
-20
0
Time (sec)
56
0 1 2 3 4 5 6
0
20
40
60
80
100
Time (sec)
Vehicle A - 30 mph J-Turn Right - Steps
0 1 2 3 4 5 6
0
0.2
0.4
0.6
0.8
Time (sec)
0 1 2 3 4 5 60
10
20
30
Runs: 122, 123, 124, 125 and 115
0 1 2 3 4 5 6-15
-10
-5
0
5
0 1 2 3 4 5 6
0
20
40
60
Time (sec)
57
0 1 2 3 4 5 6-100
-80
-60
-40
-20
0
Time (sec)
Vehicle A - 30 mph J-Turn Left - Steps
0 1 2 3 4 5 6-0.8
-0.6
-0.4
-0.2
0
Time (sec)
0 1 2 3 4 5 60
10
20
30
Runs: 118, 119, 120, 121 and 117
0 1 2 3 4 5 6-5
0
5
10
15
0 1 2 3 4 5 6-60
-40
-20
0
Time (sec)
58
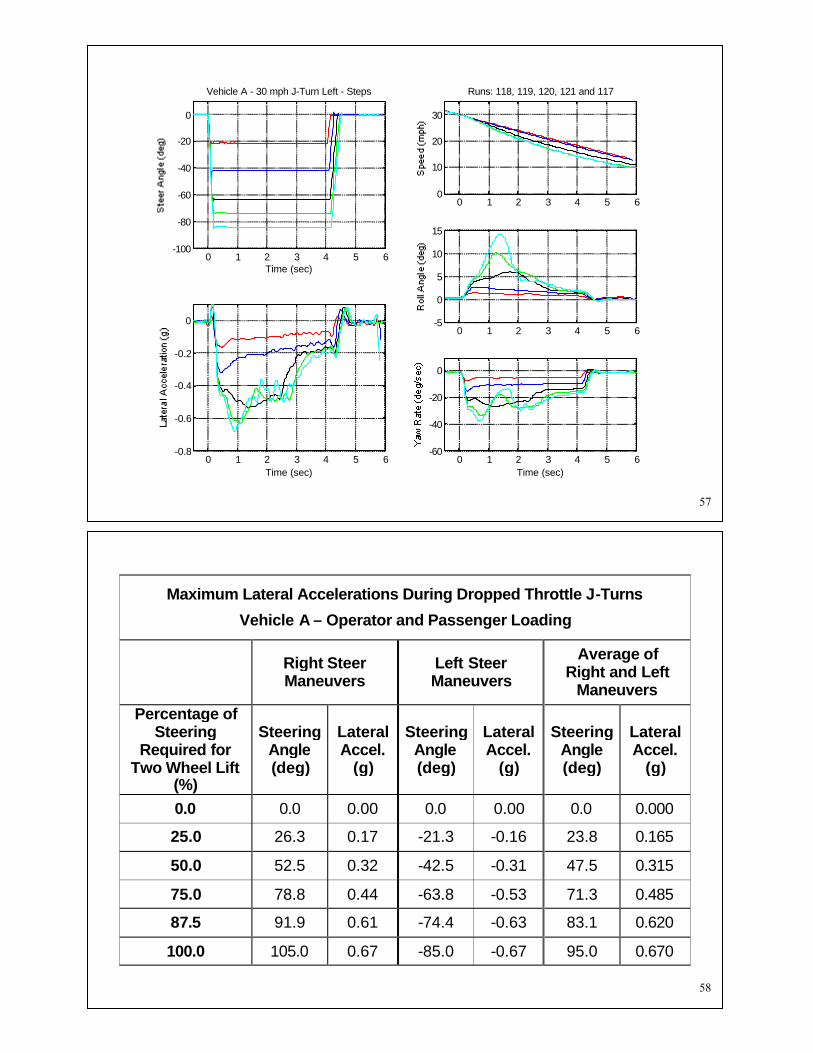
Maximum Lateral Accelerations During Dropped Throttle J-Turns
Vehicle A – Operator and Passenger Loading
Right SteerManeuvers
Left SteerManeuvers
Average ofRight and Left
ManeuversPercentage of
Steering Required for
Two Wheel Lift(%)
SteeringAngle(deg)
LateralAccel.
(g)
SteeringAngle(deg)
LateralAccel.
(g)
SteeringAngle(deg)
LateralAccel.
(g)
0.0 0.0 0.00 0.0 0.00 0.0 0.000
25.0 26.3 0.17 -21.3 -0.16 23.8 0.165
50.0 52.5 0.32 -42.5 -0.31 47.5 0.315
75.0 78.8 0.44 -63.8 -0.53 71.3 0.485
87.5 91.9 0.61 -74.4 -0.63 83.1 0.620
100.0 105.0 0.67 -85.0 -0.67 95.0 0.670

59
0 1 2 3 4 5 6
0
50
100
150
Time (sec)
Vehicle C - 30 mph J-Turn Right
0 1 2 3 4 5 6
0
0.2
0.4
0.6
0.8
Time (sec)
0 1 2 3 4 5 60
10
20
30
Runs: 513 and 512
0 1 2 3 4 5 6-15
-10
-5
0
5
0 1 2 3 4 5 6
0
20
40
60
Time (sec)
60
0 1 2 3 4 5 6-150
-100
-50
0
Time (sec)
Vehicle C - 30 mph J-Turn Left
0 1 2 3 4 5 6-0.8
-0.6
-0.4
-0.2
0
Time (sec)
0 1 2 3 4 5 60
10
20
30
Runs: 516 and 517
0 1 2 3 4 5 6-5
0
5
10
15
0 1 2 3 4 5 6-60
-40
-20
0
Time (sec)

61
0 1 2 3 4 5 6
0
50
100
150
Time (sec)
Vehicle C - 30 mph J-Turn Right - Steps
0 1 2 3 4 5 6
0
0.2
0.4
0.6
0.8
Time (sec)
0 1 2 3 4 5 60
10
20
30
Runs: 522, 523, 524, 525 and 512
0 1 2 3 4 5 6-15
-10
-5
0
5
0 1 2 3 4 5 6
0
20
40
60
Time (sec)
62
0 1 2 3 4 5 6-150
-100
-50
0
Time (sec)
Vehicle C - 30 mph J-Turn Left - Steps
0 1 2 3 4 5 6-0.8
-0.6
-0.4
-0.2
0
Time (sec)
0 1 2 3 4 5 60
10
20
30
Runs: 518, 519, 520, 521 and 517
0 1 2 3 4 5 6-5
0
5
10
15
0 1 2 3 4 5 6-60
-40
-20
0
Time (sec)

63
Maximum Lateral Accelerations During Dropped Throttle J-Turns
Vehicle C – Operator and Passenger Loading
Right SteerManeuvers
Left SteerManeuvers
Average ofRight and Left
ManeuversPercentage of
Steering Required for
Two Wheel Lift(%)
SteeringAngle(deg)
LateralAccel.
(g)
SteeringAngle(deg)
LateralAccel.
(g)
SteeringAngle(deg)
LateralAccel.
(g)
0.0 0.0 0.00 0.0 0.00 0.0 0.000
25.0 35.0 0.25 -33.8 -0.25 34.4 0.250
50.0 70.0 0.51 -67.5 -0.46 68.8 0.485
75.0 105.0 0.70 -101.3 -0.66 103.1 0.680
87.5 122.5 0.73 -118.1 -0.72 120.3 0.725
100.0 140.0 0.74 -135.0 -0.74 137.5 0.740
64
• Tests Conducted in both Right and Left Turn Directions
• For the constant throttle J-turn tests, the test driver drove eachvehicle along a straight-line path at a nominal speed of 30 mph.While holding the throttle (gas pedal) constant, he triggered theASC to initiate the steering input. The steering rates used for theconstant throttle J-turn tests were 500 deg/sec. The magnitudes ofthe steering inputs were varied to identify the minimum steeringmagnitude required to result in tip-up.
• Detailed results from the constant throttle J-turn tests are containedin Appendix F of the S-E-A reports.
Constant Throttle J-Turn (Step Steer) Tests (Initial Speed of 30 mph)

65
0 1 2 3 4 5 6 7
0
20
40
60
80
100
120
Time (sec)
Vehicle A - 30 mph J-Turn Right
0 1 2 3 4 5 6 7
0
0.2
0.4
0.6
0.8
Time (sec)
0 1 2 3 4 5 6 70
10
20
30
Runs: 115 and 127
0 1 2 3 4 5 6 7-15
-10
-5
0
5
0 1 2 3 4 5 6 7
0
20
40
60
Time (sec)
Dropped ThrottleConstant Throttle
66
0 1 2 3 4 5 6-100
-80
-60
-40
-20
0
Time (sec)
Vehicle A - 30 mph J-Turn Left
0 1 2 3 4 5 6-0.8
-0.6
-0.4
-0.2
0
Time (sec)
0 1 2 3 4 5 60
10
20
30
Runs: 117 and 131
0 1 2 3 4 5 6-5
0
5
10
15
0 1 2 3 4 5 6-60
-40
-20
0
Time (sec)
Dropped ThrottleConstant Throttle

67
• Nominal constant speed of 20 mph
• Steering in a sinusoidal manner with steering amplitude necessary to generate nominally 0.1-0.3 g of lateral acceleration (steering amplitudes between 35º and 50º were used for these tests)
• Steering input frequencies swept from 0.5 to 3.5 Hz over the course of 40 cycles.
• The sinusoidal sweep steering tests were done to investigate anyissues that might result from exciting a resonant frequency in thevehicles’ responses.
• Detailed results from the sinusoidal sweep steering tests arecontained in Appendix G of the S-E-A reports.
Sinusoidal Sweep Steering (Frequency Response) Tests (20 mph)
68
0 5 10 15 20 25 30-50
0
50Representative Sine Sweep Time Domain Plots - Vehicle C
0 5 10 15 20 25 30-0.5
0
0.5
0 5 10 15 20 25 30-2
0
2
0 5 10 15 20 25 30-20
0
20
0 5 10 15 20 25 30-20
0
20
Time (sec)

69
100
0
2
4
6
8x 10
-3 Vehicle C
100
-300
-200
-100
0
Frequency (Hz)
100
0
0.02
0.04
0.0620 mph Frequency Response
100
-350
-300
-250
-200
Frequency (Hz)
Run 538
Run 539Run 540
70
100
0
0.1
0.2
0.3
0.4Vehicle C
100
-300
-200
-100
0
Frequency (Hz)
100
0
0.1
0.2
0.3
0.420 mph Frequency Response
100
-150
-100
-50
0
Frequency (Hz)
Run 538
Run 539Run 540

71
• Nominal constant speed of 30 mph• Steering in Right and Left Directions• Steering flick tests involve driving the vehicles along a straight-
line path and quickly ‘flicking’ the steering wheel to nominally 90degrees and letting go of the steering wheel.
• The steering flick maneuvers were used to evaluate the stability ofthe vehicles’ responses to open-loop, free control steering inputs.An unstable vehicle may respond with oscillatory or divergentbehavior during a flick test.
• Also, if the vehicle responses do not return to a close-to-zeroposition after the steering is released, this could be an indicationtoo little self aligning steering moment or possibly too muchfriction in the steering system.
• Detailed results from the steering flick tests are contained in Appendix H of the S-E-A reports.
Constant Speed (30 mph) Steering Flick Tests
72
14 15 16 17 1828
29
30
31
32Vehicle C
14 15 16 17 18
-0.5
0
0.5
Time (sec)
14 15 16 17 18-5
0
5Run 543 - Flick Test Right
14 15 16 17 18-40
-20
0
20
40
Time (sec)

73
15 16 17 18 1928
29
30
31
32Vehicle C
15 16 17 18 19
-0.5
0
0.5
Time (sec)
15 16 17 18 19-5
0
5Run 545 - Flick Test Left
15 16 17 18 19-40
-20
0
20
40
Time (sec)
74
• For the maximum speed tests, the test driver drove each vehicle along a straight-line path at maximum throttle until maximum speed was reached. Tests were run in two opposite directions, along the direction up the TRC VDA one percent grade (roughly northward) and along the direction down the TRC VDA one percent grade (roughly southward).
• Detailed results from the maximum speed tests are contained in Appendix I for all vehicles in both loading conditions.
Maximum Speed Tests

75
0 5 10 15 20 25 30-5
0
5
10
15
20
25
30
35
40
Time (sec)
Vehicle A - Maximum Speed
Max South = 39.3 mph
Max North = 38.8 mph
Max Average = 39.1 mph
SouthboundNorthbound
76
Selection of Summary ResultsFrom Appendix B of S-E-A Reports

77
1 2 3 4 5 6 7 8 9 100
500
1000
1500
2000
2500
3000
Veh A Veh B Veh C Veh D Veh E Veh F Veh G Veh H Veh I Veh J
Vehicle Weight
Curb
Operator
Operator & Passenger
Oper., Instr. & Outriggers
Oper., Pass. & Cargo (GVWR) Oper., Instr., Cargo & Outriggers (GVWR)
78
1 2 3 4 5 6 7 8 9 1040
42
44
46
48
50
52
Veh A Veh B Veh C Veh D Veh E Veh F Veh G Veh H Veh I Veh J
Average Track Width
OperatorOperator & PassengerOper., Instr. & OutriggersOper., Pass. & Cargo (GVWR)

79
1 2 3 4 5 6 7 8 9 1070
75
80
85
90
95
100
105
Veh A Veh B Veh C Veh D Veh E Veh F Veh G Veh H Veh I Veh J
Wheelbase
4 P
asse
nger
Veh
icle
80
1 2 3 4 5 6 7 8 9 1012
13
14
15
16
17
18
19
Veh A Veh B Veh C Veh D Veh E Veh F Veh G Veh H Veh I Veh J
Steering Ratio

81
1 2 3 4 5 6 7 8 9 106
7
8
9
10
11
12
13
14
15
16
Veh A Veh B Veh C Veh D Veh E Veh F Veh G Veh H Veh I Veh J
Operator, Instrumentation and Outriggers - Roll Gradient
82
1 2 3 4 5 6 7 8 9 1030
35
40
45
50
55
60
65
70
Veh A Veh B Veh C Veh D Veh E Veh F Veh G Veh H Veh I Veh J
Operator, Instrumentation and Outriggers - Maximum Speed

83
1 2 3 4 5 6 7 8 9 1020
21
22
23
24
25
26
27
28
29
30
Veh A Veh B Veh C Veh D Veh E Veh F Veh G Veh H Veh I Veh J
CG Height
OperatorOperator & PassengerOper., Instr. & OutriggersOper., Pass. & Cargo (GVWR)
84
1 2 3 4 5 6 7 8 9 100.8
0.85
0.9
0.95
1
1.05
1.1
Veh A Veh B Veh C Veh D Veh E Veh F Veh G Veh H Veh I Veh J
Static Stability Factor - SSF
OperatorOperator & PassengerOper., Instr. & Outriggers
Oper., Pass. & Cargo (GVWR)

85
1 2 3 4 5 6 7 8 9 100.8
0.85
0.9
0.95
1
1.05
1.1
Veh A Veh B Veh C Veh D Veh E Veh F Veh G Veh H Veh I Veh J
Lateral Stability Factor - KST
Operator
Operator & PassengerOper., Instr. & Outriggers
Oper., Pass. & Cargo (GVWR)
86
1 2 3 4 5 6 7 8 9 100.8
0.85
0.9
0.95
1
1.05
Veh A Veh B Veh C Veh D Veh E Veh F Veh G Veh H Veh I Veh J
Operator and Passenger - SSF and KST
SSFKST

87
1 2 3 4 5 6 7 8 9 100.55
0.6
0.65
0.7
0.75
0.8
0.85
Veh A Veh B Veh C Veh D Veh E Veh F Veh G Veh H Veh I Veh J
Operator and Passenger - Tilt Table Ratio - TTR
Drivers Side Leading
Passengers Side LeadingAverage
88
1 2 3 4 5 6 7 8 9 1030
32
34
36
38
40
42
44
Veh A Veh B Veh C Veh D Veh E Veh F Veh G Veh H Veh I Veh J
Operator and Passenger - Tilt Table Angle - TTA
Drivers Side LeadingPassengers Side LeadingAverage

89
-0.5 -0.4 -0.3 -0.2 -0.1 0 0.1 0.2 0.3 0.4 0.5
-100
-50
0
50
100
Lateral Acceleration (g)
Summary of Circle Test Results - Operator and Passenger Loading
Vehicle AVehicle B
Vehicle CVehicle D
Vehicle EVehicle FVehicle G
Vehicle HVehicle IVehicle J
90
-0.5 -0.4 -0.3 -0.2 -0.1 0 0.1 0.2 0.3 0.4 0.5-80
-60
-40
-20
0
20
40
60
80
Lateral Acceleration (g)
Summary of Circle Test Results - Operator and Passenger Loading
Vehicle A
Vehicle B
Vehicle C
Vehicle D
Vehicle EVehicle F
Vehicle G
Vehicle H
Vehicle IVehicle J

91
0 0.1 0.2 0.3 0.4 0.5-150
-100
-50
0
50
100
150
200
Lateral Acceleration (g)
Slope: Degrees of Handwheel Angle per g of Lateral Acceleration
Vehicle F
Vehicle J
Vehicle A
Vehicle I
Vehicle D
Vehicle E
Vehicle B
Vehicle C
Vehicle H
Vehicle G
Operator and Passenger
92
Constant Radius (100 ft) Circle TestsLateral Acceleration Level at Point of
Transition from Understeer to Oversteer(Operator and Passenger Loading)
Clockwise(g)
Counterclockwise(g)
Average(g)
Vehicle A 0.24 0.23 0.24Vehicle B NA NA NAVehicle C NA NA NAVehicle D 0.32 0.37 0.35
Vehicle E 0.44 NA NAVehicle F 0.15 0.19 0.17Vehicle G NA NA NAVehicle H NA NA NAVehicle I 0.29 0.30 0.30Vehicle J 0.22 0.24 0.23
OS
OS
OS
OS
OS

93
Constant Speed (30 mph) Slowly Increasing Steer TestsLateral Acceleration Level at Point of
Transition from Understeer to Oversteer(Operator and Passenger Loading)
Right Turn(g)
Left Turn(g)
Average(g)
Vehicle A 0.40 0.33 0.37Vehicle B NA NA NAVehicle C NA NA NAVehicle D 0.35 0.44 0.40Vehicle E NA NA NAVehicle F 0.39 0.42 0.41Vehicle G NA NA NAVehicle H NA NA NAVehicle I 0.43 0.46 0.45Vehicle J 0.34 0.40 0.36
OS
OS
OS
OS
OS
94
0 5 10 15 20 25 300
0.05
0.1
0.15
0.2
0.25
0.3
0.35
0.4
0.45
0.5
Speed (mph)
Vehicle A - Circle Tests
ClockwiseCounterclockwise
0 5 10 15 20 25 300
0.05
0.1
0.15
0.2
0.25
0.3
0.35
0.4
0.45
0.5
Speed (mph)
Vehicle D - Circle Tests
ClockwiseCounterclockwise
0 5 10 15 20 25 300
0.05
0.1
0.15
0.2
0.25
0.3
0.35
0.4
0.45
0.5
Speed (mph)
Vehicle F - Circle Tests
ClockwiseCounterclockwise
0 5 10 15 20 25 300
0.05
0.1
0.15
0.2
0.25
0.3
0.35
0.4
0.45
0.5
Speed (mph)
Vehicle I - Circle Tests
ClockwiseCounterclockwise
0 5 10 15 20 25 300
0.05
0.1
0.15
0.2
0.25
0.3
0.35
0.4
0.45
0.5
Speed (mph)
Vehicle J - Circle Tests
ClockwiseCounterclockwise
SUMMARYVehicles that transitioned
to Oversteer
Vehicle I is longer wheelbase4-Passenger vehicle
Yaw Rate GainsFrom Circle Tests

95
0 5 10 15 20 25 300
0.05
0.1
0.15
0.2
0.25
0.3
0.35
0.4
0.45
0.5
Speed (mph)
Vehicle B - Circle Tests
ClockwiseCounterclockwise
0 5 10 15 20 25 300
0.05
0.1
0.15
0.2
0.25
0.3
0.35
0.4
0.45
0.5
Speed (mph)
Vehicle C - Circle Tests
ClockwiseCounterclockwise
0 5 10 15 20 25 300
0.05
0.1
0.15
0.2
0.25
0.3
0.35
0.4
0.45
0.5
Speed (mph)
Vehicle E - Circle Tests
ClockwiseCounterclockwise
0 5 10 15 20 25 300
0.05
0.1
0.15
0.2
0.25
0.3
0.35
0.4
0.45
0.5
Speed (mph)
Vehicle G - Circle Tests
ClockwiseCounterclockwise
0 5 10 15 20 25 300
0.05
0.1
0.15
0.2
0.25
0.3
0.35
0.4
0.45
0.5
Speed (mph)
Vehicle H - Circle Tests
ClockwiseCounterclockwise
SUMMARYVehicles that did not
transition to Oversteer
Yaw Rate GainsFrom Circle Tests
96
0 0.1 0.2 0.3 0.4 0.50
0.05
0.1
0.15
0.2
0.25
0.3
0.35
0.4
0.45
0.5
|Ay| (g)
Vehicle A - Circle Tests
ClockwiseCounterclockwise
Yaw Rate GainsFrom Circle Tests
SUMMARYVehicles that transitioned
to Oversteer
0 0.1 0.2 0.3 0.4 0.50
0.05
0.1
0.15
0.2
0.25
0.3
0.35
0.4
0.45
0.5
|Ay| (g)
Vehicle D - Circle Tests
ClockwiseCounterclockwise
0 0.1 0.2 0.3 0.4 0.50
0.05
0.1
0.15
0.2
0.25
0.3
0.35
0.4
0.45
0.5
|Ay| (g)
Vehicle F - Circle Tests
ClockwiseCounterclockwise
0 0.1 0.2 0.3 0.4 0.50
0.05
0.1
0.15
0.2
0.25
0.3
0.35
0.4
0.45
0.5
|Ay| (g)
Vehicle I - Circle Tests
ClockwiseCounterclockwise
0 0.1 0.2 0.3 0.4 0.50
0.05
0.1
0.15
0.2
0.25
0.3
0.35
0.4
0.45
0.5
|Ay| (g)
Vehicle J - Circle Tests
ClockwiseCounterclockwise
Vehicle I is longer wheelbase4-Passenger vehicle

97
SUMMARYVehicles that did not
transition to Oversteer
Yaw Rate GainsFrom Circle Tests
0 0.1 0.2 0.3 0.4 0.50
0.05
0.1
0.15
0.2
0.25
0.3
0.35
0.4
0.45
0.5
|Ay| (g)
Vehicle B - Circle Tests
ClockwiseCounterclockwise
0 0.1 0.2 0.3 0.4 0.50
0.05
0.1
0.15
0.2
0.25
0.3
0.35
0.4
0.45
0.5
|Ay| (g)
Vehicle C - Circle Tests
ClockwiseCounterclockwise
0 0.1 0.2 0.3 0.4 0.50
0.05
0.1
0.15
0.2
0.25
0.3
0.35
0.4
0.45
0.5
|Ay| (g)
Vehicle E - Circle Tests
ClockwiseCounterclockwise
0 0.1 0.2 0.3 0.4 0.50
0.05
0.1
0.15
0.2
0.25
0.3
0.35
0.4
0.45
0.5
|Ay| (g)
Vehicle G - Circle Tests
ClockwiseCounterclockwise
0 0.1 0.2 0.3 0.4 0.50
0.05
0.1
0.15
0.2
0.25
0.3
0.35
0.4
0.45
0.5
|Ay| (g)
Vehicle H - Circle Tests
ClockwiseCounterclockwise
98
1 2 3 4 5 6 7 8 9 100.55
0.6
0.65
0.7
0.75
0.8
0.85
Veh A Veh B Veh C Veh D Veh E Veh F Veh G Veh H Veh I Veh J
Oper., Instr. and OR - Ay Required for Tip-Up - 30 mph J-Turn Tests
Right TurnLeft TurnAverage
99
1 2 3 4 5 6 7 8 9 1060
80
100
120
140
160
180
200
220
Veh A Veh B Veh C Veh D Veh E Veh F Veh G Veh H Veh I Veh J
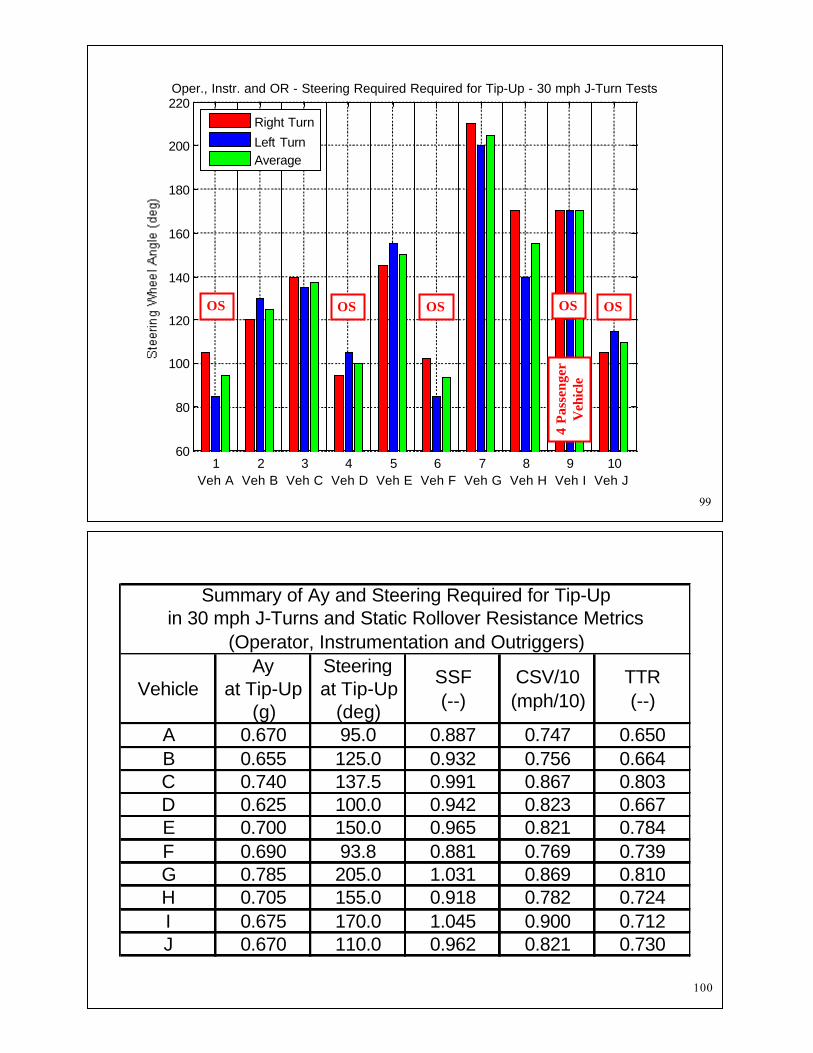
Oper., Instr. and OR - Steering Required Required for Tip-Up - 30 mph J-Turn Tests
Right Turn
Left TurnAverage
OS OS OS OS OS
4 P
asse
nger
Veh
icle
100
VehicleAy
at Tip-Up(g)
Steeringat Tip-Up
(deg)
SSF(--)
CSV/10(mph/10)
TTR(--)
A 0.670 95.0 0.887 0.747 0.650B 0.655 125.0 0.932 0.756 0.664C 0.740 137.5 0.991 0.867 0.803D 0.625 100.0 0.942 0.823 0.667E 0.700 150.0 0.965 0.821 0.784F 0.690 93.8 0.881 0.769 0.739G 0.785 205.0 1.031 0.869 0.810H 0.705 155.0 0.918 0.782 0.724I 0.675 170.0 1.045 0.900 0.712J 0.670 110.0 0.962 0.821 0.730
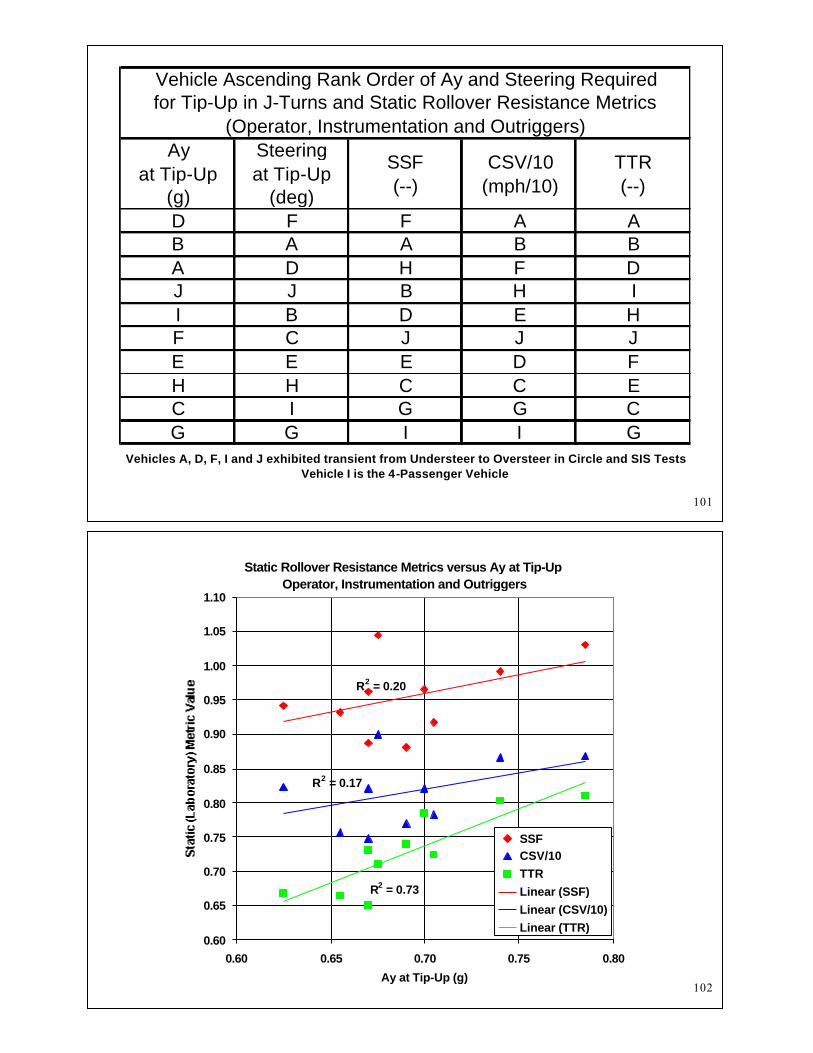
Summary of Ay and Steering Required for Tip-Upin 30 mph J-Turns and Static Rollover Resistance Metrics
(Operator, Instrumentation and Outriggers)
101
Vehicles A, D, F, I and J exhibited transient from Understeer to Oversteer in Circle and SIS TestsVehicle I is the 4-Passenger Vehicle
Ayat Tip-Up
(g)
Steeringat Tip-Up
(deg)
SSF(--)
CSV/10(mph/10)
TTR(--)
D F F A AB A A B BA D H F DJ J B H II B D E HF C J J JE E E D FH H C C EC I G G CG G I I G
Vehicle Ascending Rank Order of Ay and Steering Requiredfor Tip-Up in J-Turns and Static Rollover Resistance Metrics
(Operator, Instrumentation and Outriggers)
102
Static Rollover Resistance Metrics versus Ay at Tip-UpOperator, Instrumentation and Outriggers
R2 = 0.20
R2 = 0.17
R2 = 0.73
0.60
0.65
0.70
0.75
0.80
0.85
0.90
0.95
1.00
1.05
1.10
0.60 0.65 0.70 0.75 0.80
Ay at Tip-Up (g)
SSFCSV/10TTRLinear (SSF)Linear (CSV/10)Linear (TTR)

103
0 20 40 60 80 100 120 140 160 180 200 2200
0.1
0.2
0.3
0.4
0.5
0.6
0.7
0.8
Average Steering Angle (deg)
Oper., Instr. and OR - Average Ay vs Average Steering Magnitude - 30 mph J-Turn Tests
Veh AVeh B
Veh CVeh DVeh EVeh FVeh G
Veh HVeh IVeh J
104
0 20 40 60 80 100 120 140 160 180 200 2200
0.1
0.2
0.3
0.4
0.5
0.6
0.7
0.8
Average Steering Angle (deg)
Oper., Instr. and OR - Average Ay vs Average Steering Magnitude - 30 mph J-Turn Tests
Vehicles that Transitioned to OversteerVehicles that Did Not Transition to OversteerLong Wheelbase 4-Passenger Vehicle

105
Comments Regarding Accuracy and RepeatabilityIn Laboratory and Dynamic Tests
Accuracy
Repeatability
• A measurement can be veryrepeatable and not accurate
• Adherence to exacting test methodologies is needed to have accurate tests
• Adherence to exacting test methodologies is needed to have repeatable tests
• Test-to-test and lab-to-lab variability can have an influence on perceived accuracy and repeatability
106
• Adherence to exacting test methodologies is needed to have accurate tests• Properly calibrated transducers (sensors)• Properly mounted transducers (e.g. making measurements at the
vehicles’ CG locations)• Proper data collection and post-processing• Data quality checks of sensor data
• Adherence to exacting test methodologies is needed to have repeatable tests• Efforts to minimize test-to-test variation
•Control over test inputs (e.g. steering robot, speed control, etc.)•Control over test condition (e.g. surface conditions, wind, etc.)•Control of vehicle conditions (e.g. secure loading, tires, fuel, etc.)
Comments Regarding Accuracy and RepeatabilityIn Dynamic Tests

107
Comments Regarding S-E-A’sLateral Acceleration Measurements:
• S-E-A’s sensor measurements of ground plane lateral acceleration are accurate to 0.001 g. S-E-A’s data indicates that the overall accuracy of selecting a peak Ay value for any given run is 0.01 g.
• S-E-A’s data indicates that the repeatability of their measurements of ground plane lateral acceleration made during their dropped-throttle J–turn tests is 0.02 g.
• The differences between ground plane lateral acceleration in the tests with maximum steering that did not produce two-wheel lift and tests with minimum steering to produce two-wheel lift are generally within 0.01 to 0.03 g.
108
Concluding Comments RegardingAccuracy and Repeatability
of S-E-A’s Data
S-E-A’s laboratory and dynamic test results are both very accurate and very repeatable – representing the state-of-the-art regarding the measurements made.

1
S-E-A, Ltd. Review of ROHVA Materials Related to Dropped Throttle J-Turn Tests Presented to
CPSC Technical Staff on November 10, 2011 andROHVA’s May 1, 2012 Responses to
CPSC Staff Questions dated February 15, 2012
July 19, 2012
Gary J. Heydinger, Ph.D., P.E.Director Vehicle Dynamics Division
2
The fact that Carr Engineering could not duplicate some of the testing results of S-E-A does not mean that the testing results of S-E-A are inaccurate or unrepeatable.
3
• S-E-A used a sensor that provides for a direct measurement of ground plane lateral acceleration (sometimes referred to as Corrected Ay).
• S-E-A’s sensor was also configured to provide ground plane lateral acceleration at the measured center of gravity of each vehicle.
S-E-A Lateral Acceleration Measurements
4
S-E-A Data Quality Checks
During SAE J266 constant radius circle tests the following fundamental relationships involving ground plane lateral acceleration (Ay), vehicle longitudinal speed (Vx), yaw rate (r), and circle radius (R) hold true:
The graph on the following slide contains data measured by S-E-A during the circle tests for Vehicle B in the representative Operator plus Passenger loading condition. The plots indicate that the S-E-A data is consistent with these fundamental relationships.
S-E-A performed similar data quality checks for all vehicles tested for and reported to CPSC, and confirmed that the quality of this data for all vehicles tested was similar to that shown on the following page. The data channels used for ground plane Ay, Vx and r during these tests are the same data channels S-E-A used for all tests, including the dropped throttle J-turn tests.
RV
rVAy)Corrected(PlaneGround2
xx

5
40 60 80 100 120 140 160 180 200 220-25
-20
-15
-10
-5
0
5
10
15
20
25
Time (sec)
Vehicle B - Circle Tests
Ground Plane Ay(V
x)(r)
(Vx)2/R
6
Using a sensor like the one used by Carr Engineering,the magnitude of the measured lateral acceleration isgreater than the magnitude of the ground plane lateralacceleration (Corrected Ay) during a dropped throttle J-turn maneuver.
Carr EngineeringLateral Acceleration Measurements

7
Using a sensor like the one used by Carr Engineering, the ground plane(Corrected) lateral acceleration can be computed from the measuredvehicle-body-fixed lateral acceleration and the vehicle-body-fixed verticalacceleration (both of which sense accelerations caused by the maneuverand by gravity). The ground plane (Corrected) lateral acceleration is theacceleration parallel to the road plane, and it is computed as (using SAEvehicle coordinate sign conventions):
Correct Equation for Planar Ground Plane(Corrected) Lateral Acceleration
See derivation on following slide and two references:
Consumer Information; New Car Assessment Program; Rollover Resistance; Final Rule,Federal Register, Part II, Department of Transportation, NHTSA, Pg. 59274, October 14, 2003.
American National Standard for Recreational Off-Highway VehiclesANSI/ROHVA 1 – 2011, 2011
anglerollbodywhere) sin(Az Measured-)cos(Ay MeasuredAy Corrected
8
9
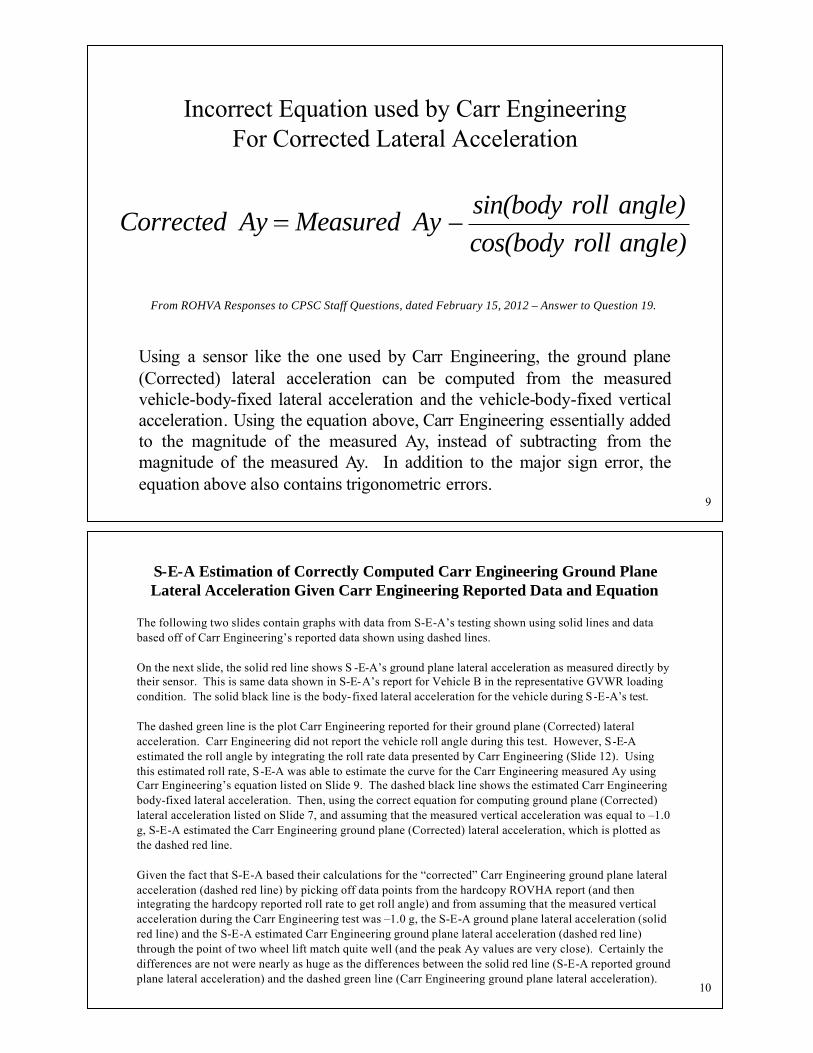
Incorrect Equation used by Carr EngineeringFor Corrected Lateral Acceleration
angle)rollcos(body angle)rollsin(body
–Ay MeasuredAy Corrected
From ROHVA Responses to CPSC Staff Questions, dated February 15, 2012 – Answer to Question 19.
Using a sensor like the one used by Carr Engineering, the ground plane(Corrected) lateral acceleration can be computed from the measuredvehicle-body-fixed lateral acceleration and the vehicle-body-fixed verticalacceleration. Using the equation above, Carr Engineering essentially addedto the magnitude of the measured Ay, instead of subtracting from themagnitude of the measured Ay. In addition to the major sign error, theequation above also contains trigonometric errors.
10
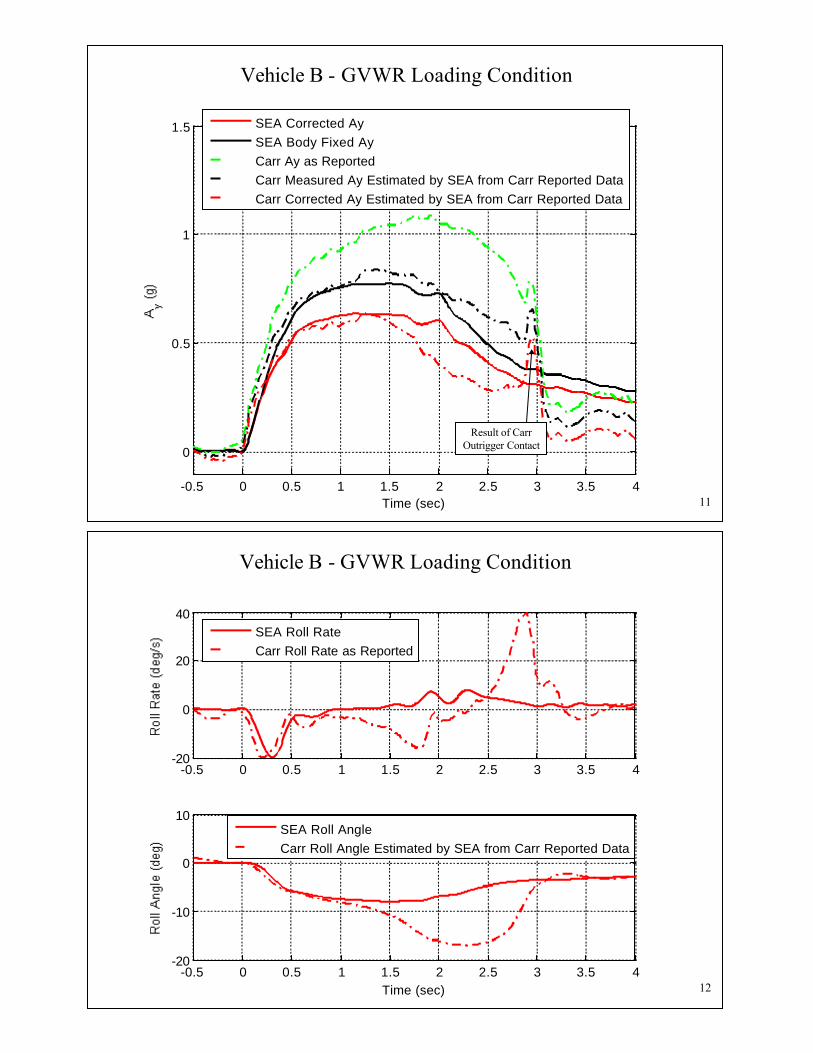
The following two slides contain graphs with data from S-E-A’s testing shown using solid lines and data based off of Carr Engineering’s reported data shown using dashed lines.
On the next slide, the solid red line shows S -E-A’s ground plane lateral acceleration as measured directly by their sensor. This is same data shown in S-E-A’s report for Vehicle B in the representative GVWR loading condition. The solid black line is the body-fixed lateral acceleration for the vehicle during S-E-A’s test.
The dashed green line is the plot Carr Engineering reported for their ground plane (Corrected) lateral acceleration. Carr Engineering did not report the vehicle roll angle during this test. However, S-E-Aestimated the roll angle by integrating the roll rate data presented by Carr Engineering (Slide 12). Using this estimated roll rate, S-E-A was able to estimate the curve for the Carr Engineering measured Ay using Carr Engineering’s equation listed on Slide 9. The dashed black line shows the estimated Carr Engineering body-fixed lateral acceleration. Then, using the correct equation for computing ground plane (Corrected) lateral acceleration listed on Slide 7, and assuming that the measured vertical acceleration was equal to –1.0 g, S-E-A estimated the Carr Engineering ground plane (Corrected) lateral acceleration, which is plotted as the dashed red line.
Given the fact that S-E-A based their calculations for the “corrected” Carr Engineering ground plane lateral acceleration (dashed red line) by picking off data points from the hardcopy ROVHA report (and then integrating the hardcopy reported roll rate to get roll angle) and from assuming that the measured vertical acceleration during the Carr Engineering test was –1.0 g, the S-E-A ground plane lateral acceleration (solid red line) and the S-E-A estimated Carr Engineering ground plane lateral acceleration (dashed red line) through the point of two wheel lift match quite well (and the peak Ay values are very close). Certainly the differences are not were nearly as huge as the differences between the solid red line (S-E-A reported ground plane lateral acceleration) and the dashed green line (Carr Engineering ground plane lateral acceleration).
S-E-A Estimation of Correctly Computed Carr Engineering Ground PlaneLateral Acceleration Given Carr Engineering Reported Data and Equation
11-0.5 0 0.5 1 1.5 2 2.5 3 3.5 4
0
0.5
1
1.5
Time (sec)
SEA Corrected AySEA Body Fixed AyCarr Ay as ReportedCarr Measured Ay Estimated by SEA from Carr Reported DataCarr Corrected Ay Estimated by SEA from Carr Reported Data
Result of CarrOutrigger Contact
Vehicle B - GVWR Loading Condition
12
Vehicle B - GVWR Loading Condition
-0.5 0 0.5 1 1.5 2 2.5 3 3.5 4-20
0
20
40
-0.5 0 0.5 1 1.5 2 2.5 3 3.5 4-20
-10
0
10
Time (sec)
SEA Roll RateCarr Roll Rate as Reported
SEA Roll AngleCarr Roll Angle Estimated by SEA from Carr Reported Data

13
14

15
Lack of adherence to exacting test methodologies and/orimproper data collection or data post processing is likely the
reason for this variation
16
S-E-A had no such inconsistent results

17
SEA Ay PeakVERY Clear
This is Simply aResult of SEA
Outrigger Contact
18
Why (if same steering and same speed)?
Measurement of Ay or Calculation of Ay?
This was not an issue using the S-E-A data.
NO. This was not an issue using the S-E-A data.

19
Plotted Ay greater than 1.0 g.Plotted Ay greater than SSFPlotted Ay greater than peak coefficient of friction
20
Carr Engineering Reports: Unable to Determine Ay Peak
It is generally ALWAYS possible to determine Peak Ay fromvehicle response data from dropped throttle J-turn tests.
S-E-A’s Reports have corrected lateral accelerationplots for over 200 dropped throttle J-Turn tests.
Some of these tests resulted in two-wheel lift andoutrigger contact, and some did not.
For every single one of these tests, S-E-A wasable to determine a peak Ay.
Carr Engineering’s lack of adherence to exacting test methodologies and/or errors in processing their data is likely
the cause of their inability to determine Ay peaks.

21
S-E-A Data – Similar Peak Ay Values for Right and Left Turns
22
Carr Data – Dissimilar Peak Ay Values for Some Right and Left Turns

23
For all vehicles, all of the left turn and right turnaverage values for Ay peak reported by Carr Engineering
are larger than those determined by S-E-A.
Carr Engineering’s lack of adherence to exacting test methodologies and/or errors in processing their data is
likely the reason their reported Ay peak values are higher than those determined by S-E-A.
===================
For several vehicles, Carr Engineering reported Ay peak values in left J-turns that significantly differ from those
they reported in right J-turns.
S-E-A found no such large left-to-right variation in any of the vehicles they tested. It is likely that the
differences reported by Carr Engineering are likely a result of their lack of adherence to exacting test
methodologies and/or errors in processing their data.
24
S-E-A Testing Conductedon the asphalt Vehicle Dynamics Area (VDA)at the Transportation Research Center (TRC),
with the following measured surface properties:
Carr Engineering Testing Conductedon the a concrete surface with
unreported (or unknown) surface properties.
?
Test Surface Condition Variations CanContribute to Variations In SWA Results
Table 1: TRC Skid Number Measurements
Location VDAPad # V-5, dry
Pavement AsphaltSurface Untreated
Condition Dry
DatePeakPBC
SlideSN
5/5/2010 92.5 82.26/1/2010 98.1 84.7
6/21/2010 92.3 85.07/5/2010 95.7 83.2
7/19/2010 97.0 82.88/2/2010 98.2 84.9
8/23/2010 93.3 83.59/7/2010 96.6 86.5
9/27/2010 94.6 86.35/11/2011 92.7 85.0
Slope = 1.0% Slope = ?

25
Concluding Comments RegardingAccuracy and Repeatability
of Carr Engineering’s Dropped-Throttle J-Turn Data
Carr Engineering’s dropped-throttle J-turn test results did not demonstrate that S-E-A’s dropped-throttle J-turn test results are either inaccurate orunrepeatable

ROHVA / CPSCROHVA / CPSCTechnical DiscussionTechnical Discussion
July 19, 2012July 19, 2012Carr Engineering, Inc.Carr Engineering, Inc.

SingleSingle--Vehicle JVehicle J--TurnTurnRepeatability StudyRepeatability Study

7% Variation, 10 Runs Without Overturn
Vehicle EVehicle E

0.623 g w/ Outrigger Contact0.623 g w/ Outrigger Contact

0.649 g w/ Two0.649 g w/ Two--Wheel LiftWheel Lift

0.660 g w/ One0.660 g w/ One--Wheel LiftWheel Lift

0.685 g w/ Outrigger Contact0.685 g w/ Outrigger Contact

MultiMulti--Vehicle JVehicle J--TurnTurnRepeatability StudyRepeatability Study

SWA Results and AnalysisSWA Results and Analysis
+38%
-12%
+12%
+53%
+13%
+13%
+38%
+0%
+25%
+38%
+13%
+25%

Ay Results and AnalysisAy Results and Analysis
+5% +19% +1
0% +18%
+16%+4
%+30%
unab
le to
det
erm
ine
+8% +17% +1
5% +37%

CPSC Responses toCPSC Responses toROHVA QuestionsROHVA Questions

ROHVA Question 4ROHVA Question 4
• Q: A review of the dropped throttle J-turn testing for which results are presented in Appendix E of both the April and August 2011 SEA Reports indicates that data from several tests may not have beenincluded in the original Reports. In addition to the runs numbered 116 and 117, 1128 and 1129, and 1326 and 1328, were there any other tests performed where a vehicle (or vehicles) in the operator and passenger loading configuration showed an Ay variability of 0.03 g or greater between runs when tested in the same direction? If so, please list the machine(s) by identifying letter and provide the test results for all such runs.

CPSC Response CPSC Response –– Question 4Question 4
• A: In Section 4.5 of the April 2011 report SEA states: "...the blue lines are the tests with the minimum steering that resulted in tip-up and the red lines are the tests with the maximum steering that did not result in tip-up." There are no tests with intermediate steering or severity between these two. These blue and red lines are shown for all vehicles in both the right and left steer directions.

SEA Data SEA Data –– Vehicle FVehicle F
0.65 g
0.51 g

Vehicle EVehicle E

ROHVA Question 6ROHVA Question 6
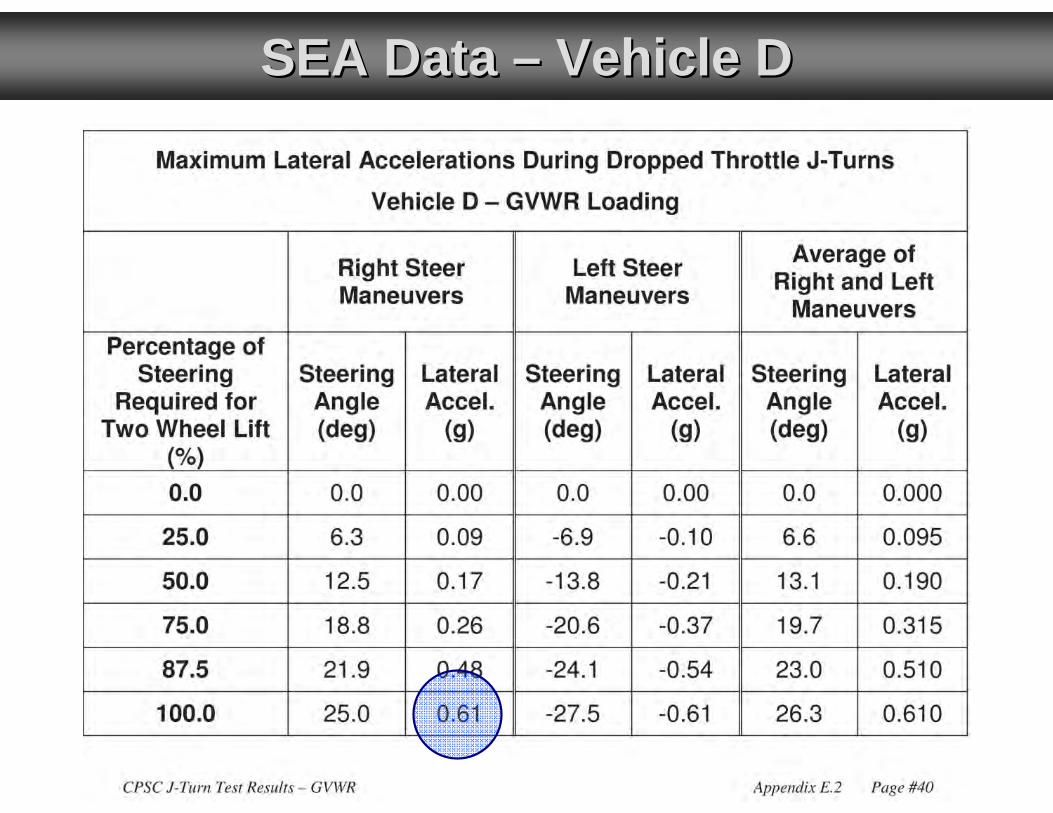
• Q: From page 12 of the SEA report, ROHVA understands that “…tip-up events are considered those that produced significant two-wheel lift and in almost all cases outrigger contact.” Please identify the number of drop throttle J-Turn tests performed by SEA where 2-wheel lift was observed without outrigger contact. Please provide this data, by machine, for both loading conditions tested. If the precise number of runs cannot be provided, please provide an approximate anecdotalanswer rounding to the nearest 10%.

CPSC Response CPSC Response –– Question 6Question 6
• The statement “For this testing, tip-up events are considered those that produced significant two-wheel lift and in almost all cases outrigger contact,” is describing that the lateral threshold testing of these vehicles resulted in two-wheel lift that would have continued into a 90 degree rollover if the outrigger did not prevent the rollover event from occurring. Therefore, to determine the minimum lateral acceleration required to induce rollover, the tests were repeated at smaller and smaller steer angles until the vehicle exhibited just enough two-wheel lift to measure that minimum lateral acceleration but not enough to make outrigger contact (and thereby incorrectly measure the lateral acceleration caused by outrigger impact with the ground).100% of the J-Turn tests that measured the minimum lateral acceleration of the vehicle at rollover threshold exhibited 2-wheel lift without outrigger contact since by definition that was how the value was measured.

SEA Data SEA Data –– Vehicle DVehicle D
0.61 g
0.43 g
SEA Data SEA Data –– Vehicle DVehicle D

Understeer CorrelationUndersteer CorrelationStudyStudy

SEA Report Correlation AnalysisSEA Report Correlation Analysis

SEA Report Correlation AnalysisSEA Report Correlation Analysis

Quantification of USGQuantification of USG
‒ USG

USG Correlation on ConcreteUSG Correlation on Concrete

USG Correlation SummaryUSG Correlation Summary
SEA TwoSEA TwoPassengerPassenger
SEASEAGVW LoadingGVW Loading
USG (Concrete) v. SEA Max AyUSG (Concrete) v. SEA Max Ay 0.400.40 0.200.20
USG (Concrete) v. SEA TTAUSG (Concrete) v. SEA TTA 0.270.27 0.400.40
USG (Concrete) v. SEA SSFUSG (Concrete) v. SEA SSF 0.230.23 0.020.02
USG (Dirt) v. SEA Max AyUSG (Dirt) v. SEA Max Ay 0.000.00 0.040.04
USG (Dirt) v. SEA TTAUSG (Dirt) v. SEA TTA 0.010.01 0.070.07
USG (Dirt) v. SEA SSFUSG (Dirt) v. SEA SSF 0.070.07 0.010.01

Ay Body RollAy Body RollCorrection FactorCorrection Factor
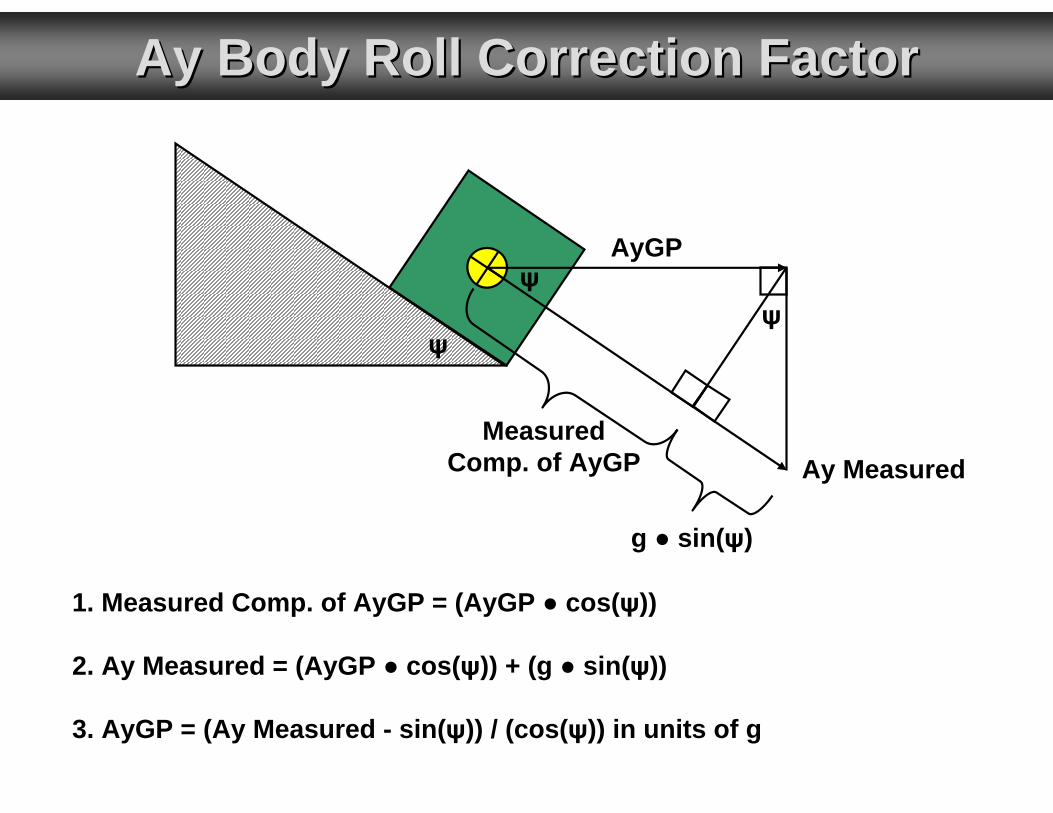
Ay Body Roll Correction FactorAy Body Roll Correction Factor
AyGP
ψψ
ψ
Ay MeasuredMeasured
Comp. of AyGP
g ● sin(ψ)
1. Measured Comp. of AyGP = (AyGP ● cos(ψ))
2. Ay Measured = (AyGP ● cos(ψ)) + (g ● sin(ψ))
3. AyGP = (Ay Measured - sin(ψ)) / (cos(ψ)) in units of g

Ay Body Roll Correction FactorAy Body Roll Correction Factor
1.0 gconvention
0.0 gconvention
(Ay ● cos(ψ)) – (Az ● sin(ψ)) (Ay – sin(ψ)) / (cos(ψ))
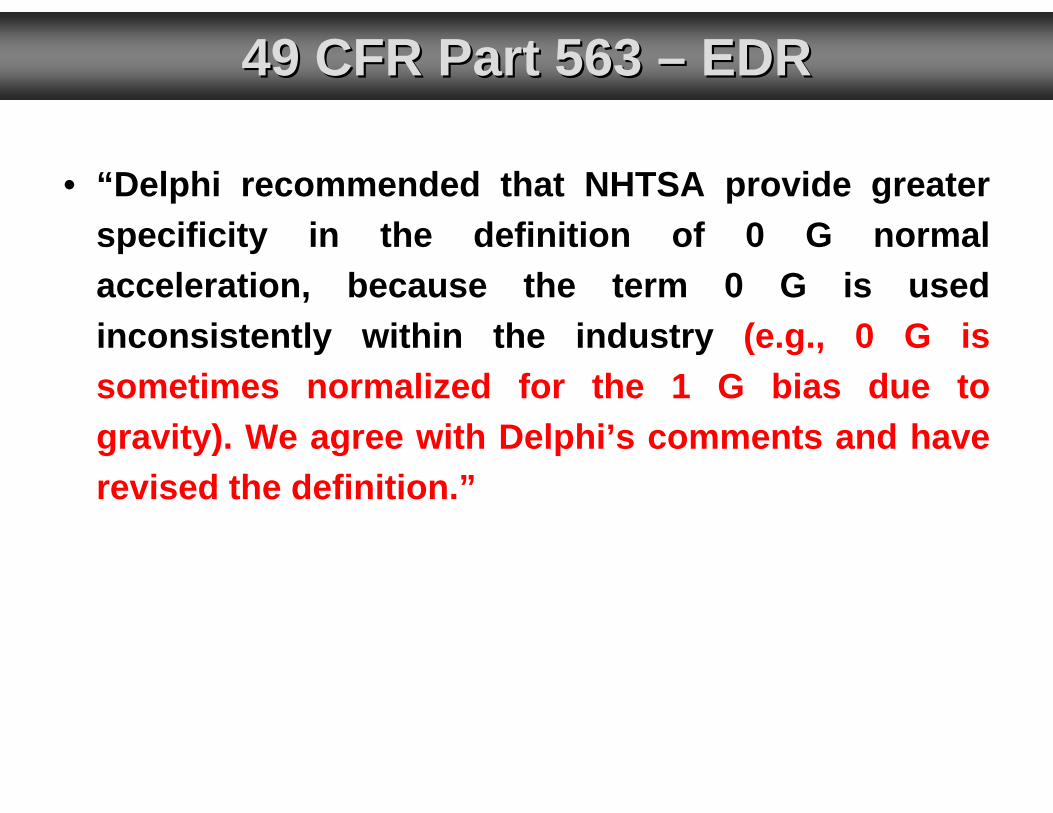
49 CFR Part 563 49 CFR Part 563 –– EDREDR
• “Delphi recommended that NHTSA provide greater specificity in the definition of 0 G normal acceleration, because the term 0 G is used inconsistently within the industry (e.g., 0 G is sometimes normalized for the 1 G bias due to gravity). We agree with Delphi’s comments and have revised the definition.”