Embed Size (px)
Citation preview

Logistic Regression for Survey Data
Professor Ron FrickerNaval Postgraduate School
Monterey, California
1

Goals for this Lecture
• Introduction to logistic regression– Discuss when and why it is useful– Interpret output
• Odds and odds ratios– Illustrate use with examples
• Show how to run in JMP • Discuss other software for fitting linear
and logistic regression models to complex survey data
2

Logistic Regression
• Logistic regression– Response (Y) is binary representing event or not– Model, where pi=Pr(Yi=1):
• In surveys, useful for modeling:– Probability respondent says “yes” (or “no”)
• Can also dichotomize other questions– Probability respondent in a (binary) class
3
0 1 1 2 2ln1
ii i k ki
i
p X X Xp
β β β β⎛ ⎞
= + + + +⎜ ⎟−⎝ ⎠K

Why Logistic Regression?
• Some reasons:– Resulting “S” curve fits many observed
phenomenon– Model follows the same general principles as
linear regression• Can estimate probability p of binary outcome
– Estimates of p bounded between 0 and 1
( )( )
0 1 1 2 2
0 1 1 2 2
ˆ ˆ ˆ ˆexpˆ
ˆ ˆ ˆ ˆ1 expk k
k k
x x xp
x x x
β β β β
β β β β
+ + + +=
+ + + + +
K
K
4

Linear Regression with Binary Ys
• Example: modeling presence or absence of coronary heart disease (CHD) as a function of age
• Data looks like this:– 100 obs– min age = 20– max age = 69– 43 w/ CHD
ID Age CHD1 20 02 23 03 24 04 25 05 25 16 26 07 26 08 28 0
.. . .. . .. . 5

Modeling CHD Existence
• Imagine each subject flips a coin: Heads = CHD Tails = no CHD
• Each coin has a different probability of heads related to subject’s age
• Only observe existence of CHD– y=1, has CHD; y=0, does not
• We want to model the chance of getting CHD as a function of age
6

Proportion with CHD by Age
CHDAge Group n Absent Present Proportion
20-29 10 9 1 0.1030-34 15 13 2 0.1335-39 12 9 3 0.2540-44 15 10 5 0.3345-49 13 7 6 0.4650-54 8 3 5 0.6355-59 17 4 13 0.7660-69 10 2 8 0.80Total 100 57 43 0.43
7

Plotting the Proportions
00.10.20.30.40.50.60.70.80.9
1
20 30 40 50 60 70
Mean Group Age
Prop
ortio
n w
/ CH
D
8

Interpreting Model Results
0
0.2
0.4
0.6
0.8
1
10 30 50 70 90Age
p(C
HD
)
If age is 50 years then the probability of CHD is about 0.56 9

Logistic Regression: The Picture
-0.2
0
0.2
0.4
0.6
0.8
1
1.2
0 10 20 30 40 50 60 70 80 90 100
Age
Prob
abili
ty o
f CHD
datap(age)
10

Where Logistic Regression Fits
Con
tinuo
usC
a teg
ori c
alD
epe n
d ent
or R
e spo
nse
Independent or Predictor VariableContinuous Categorical
Linear regression
Linear reg. w/ dummy variables
Logistic regression
Logistic reg. w/ dummy variables
11

Logistic Regression in JMP
• Fit much like multiple regression: Analyze > Fit Model– Fill in Y with nominal binary dependent
variable – Put Xs in model by highlighting and then
clicking “Add”• Use “Remove” to take out Xs
– Click “Run Model” when done• Takes care of missing values and non-
numeric data automatically12

Estimating the Parameters
• JMP estimates βs via maximum likelihood• Given estimated βs, probabilities
estimated as
• Calculating probabilities in JMP is easy– After Fit Model, red triangle > Save
Probability Formula
( )( )
0 1 1 2 2 3
0 1 1 2 2 3
ˆ ˆ ˆ ˆexpˆ
ˆ ˆ ˆ ˆ1 expk
k
x x xp
x x x
β β β β
β β β β
+ + + +=
+ + + + +
K
K
13
Probability, Odds, and Log Odds
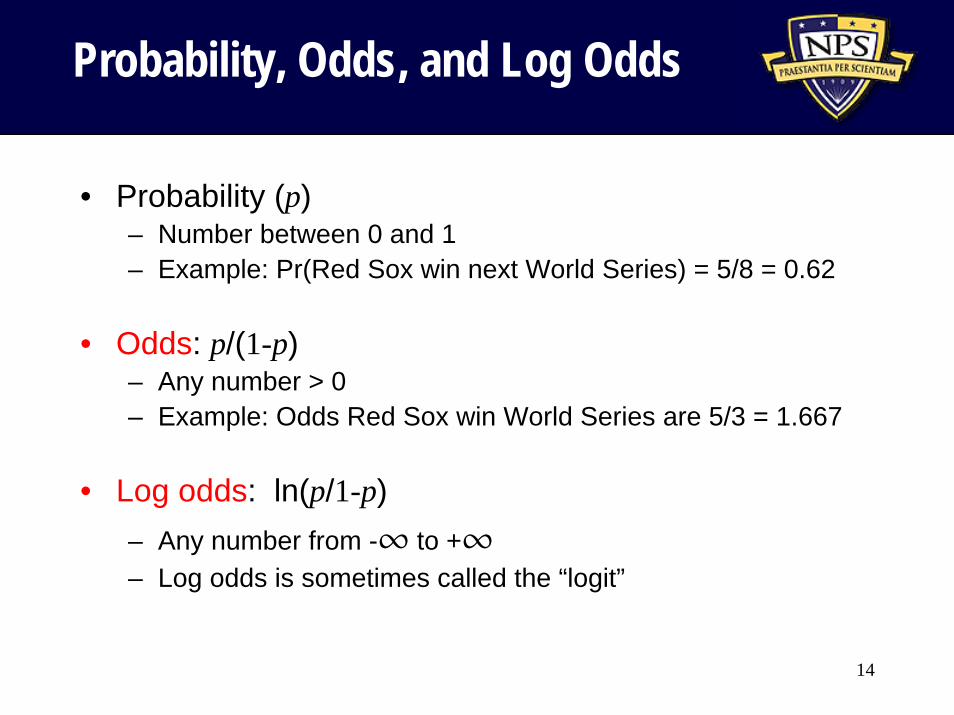
• Probability (p)– Number between 0 and 1– Example: Pr(Red Sox win next World Series) = 5/8 = 0.62
• Odds: p/(1-p)– Any number > 0– Example: Odds Red Sox win World Series are 5/3 = 1.667
• Log odds: ln(p/1-p)– Any number from -¶ to +¶– Log odds is sometimes called the “logit”
14

Interpreting the βs
“slope” p-value
Log odds of having CHD
• Slope is positive and significant– Increasing age means higher probability of
coronary heart disease– Increase Age by 1 year and log odds of CHD
increases by 0.11– No t-test, χ-square test instead
• p-value still means the same thing15

Final Model and Results
Age can be any (positive) number and answer still makes sense
0
0.2
0.4
0.6
0.8
1
10 30 50 70 90
Age
p(C
HD
)
exp( 5.31 0.111 x )ˆ (CHD)1 exp( 5.31 0.111 x )
agepage
− +=
+ − +
16

• An odds ratio is, literally, ratio of two odds – Example from some recent (non-survey) work:
• Odds IAer retained = 2.01• Odds non-IAer retained = 1.55• Odds ratio = 1.30
17
Odds Ratios – An Example

Interpreting the Slope of an Indicator Variable
• Let x1 be an indicator variable– Say, x1=1 means male and x1=0 means female
• Consider the ratio of two logistic regression models, one for males and one for females:
• Exponentiate numerator and denominator:
0 1 2 2
0 2 2
|male |femaleln ln1 |male 1 |female
i k kii i
i i i k ki
X Xp pp p X X
β β β ββ β β
⎛ ⎞ ⎛ ⎞ + + + +=⎜ ⎟ ⎜ ⎟− − + + +⎝ ⎠ ⎝ ⎠
K
K
0 1 2 2
01
2 2
exp( )exp( ) exp( ) exp( )exp( )exp( ) ex
exp( ) O. .)
Rp(
i k ki
i k ki
X XX X
β β ββ
βββ β
==L
L
18

Example: Using Logistic Regression in NPS New Student Survey
• Dichotomize Q1 into “satisfied” (4 or 5) and “not satisfied” (1, 2, or 3)
• Model satisfied on Gender and Type Student
19

Compare the Output to Raw Data
20

Regression in Complex Surveys
• Parameters are fit to minimize the sums of squared errors to the population:
• Resulting estimators:
and
• Still need to estimate standard errors…
1 22
ˆi i i i i i i i
i S i S i S i S
i i i i ii S i S i S
w x y w y w x wB
w x w x w
∈ ∈ ∈ ∈
∈ ∈ ∈
−=
⎛ ⎞− ⎜ ⎟⎝ ⎠
∑ ∑ ∑ ∑
∑ ∑ ∑
1
0
ˆˆ
i i i ii S i S
ii S
w y B w wB
w∈ ∈
∈
−=∑ ∑
∑
[ ]( )20 1
1
N
i ii
SSE y B B x=
= − +∑
21
Using SAS for Regression
• SAS procedures for regression assuming SRS:– PROC REG– PROC LOGISTIC
• In SAS v9.1 for complex surveys– PROC SURVEYREG– PROC SURVEYLOGISTIC
• See http://support.sas.com/onlinedoc/913/docMainpage.jsp
22

Using Stata for Regression
• Stata 9: SVY procedures for regression include– svy:regress– svy:logistic– svy:logit
• See www.stata.com/stata9/svy.html for more detail
23

Using R / S+ for Regression
• ‘survey’ package by Thomas Lumley– Must install as library for S+ or R– Copy up on Blackboard
• Has svyglm for generalized linear models• If like usual glm in S+, can do linear and
logistic modeling– But I need to look more closely at it…
• See http://faculty.washington.edu/tlumley/survey/
24
What We Have Just Learned
• Introduced logistic regression– Discussed when and why it is useful– Interpreted output
• Odds and odds ratios– Illustrated use with examples
• Showed how to run in JMP • Discussed other software for fitting
linear and logistic regression models to complex survey data
25