Embed Size (px)
Citation preview

Logistics Cost and ServiceLogistics Cost and Service 2010

Introduction
The Establish, Inc./Herbert W. Davis and Company Logistics Cost and Service Database was established in 1975 to:
Define appropriate performance measures for logistics functions.
Provide worksheets to record functional costs by facility and in total.
S mmari e the data recei ed from participating companies and aggregate itSummarize the data received from participating companies and aggregate it into a useful database for benchmarking.
Copyright © 2010 Establish, Inc. www.establishinc.com1

Today – 2010North American Status
Database of Logistics Cost and Service maintained and opened to all shippers to participate since 1975.
Participation is achieved by completing a one-page questionnaire on our website.
Each participant is sent a customized benchmark comparing cost and service performance to four peer groups:performance to four peer groups:
– Product category– Product value
– Company size – sales revenuep y– Company size – shipped weight
Copyright © 2010 Establish, Inc. www.establishinc.com2

Timeline
2007
2003
2005
Revised formatRevised definition
2007
2001
1999Davis Insights added
New European Database
Extended options
1992 Made Database form available on line
Restructured Database for globalization of logistics1987
1985
Chemical Manufacturers of America Database
European Database expanded, 10 countries1985
First European Database, FrancePrivate benchmarking system for GE’s 72 divisions
1983
GMA - Grocery Manufacturers of America Database
First private Database for FIEI
1982
1974
Set up Database
yPMA - Pharmaceutical Manufacturers of America DatabaseDTPA - Drug and Toilet Preparations Association Database
Copyright © 2010 Establish, Inc. www.establishinc.com3
Set up DatabaseCompleted first Workbook

Key Findings – 2010
What is happening in terms of logistics costs?
The Economy
Many companies are still in a “wait and see” mode and are focusing on cost cutting instead of developing their supply chain as a competitive advantage.cutting instead of developing their supply chain as a competitive advantage.
Transportation
Negotiating rates with providers to ensure the correct balance between cost, equipment availability and service.
Warehousing
Many third-party providers are seeking longer commitments from clients to justify needed improvements in technology, as well as address deferred maintenance (applies to many asset-based companies).( pp y p )
Inventory
Companies are beginning to hold more inventory with the low cost of capital and ocean capacity constraints, as well as dealing with extreme fluctuations in demanddemand.
Administration and Oversight
Purchasing functions appear to be the drivers in making decisions about supply chain changes.
Copyright © 2010 Establish, Inc. www.establishinc.com4

The Hierarchy of Supply Chain Cost Factors
Corporate PoliciesCorporate PoliciesCorporate Policies
S l Ch i P li iSupply Chain Policies
Logistics Policies
Supply Chain Policies
Logistics Policies
Logistics Procedures
Logistics PracticesLogistics Practices
Transportation Choices
Copyright © 2010 Establish, Inc. www.establishinc.com5

Select Industries
Consumer Electronics
High-Value Industrial Durable
Computers
High-Value Consumer Packaged Goods
Grocery
Produce and Fresh Foods
Peripherals
Telecommunications
Industrial Replacement Parts
Meat and Fish Products
Frozen Food
Beverages
Chemicals
Industrial Supplies
Consumer Replacement Parts
Consumer Household Products
Health and Beauty Aids
High-Value Pharmaceuticals
Small Appliances
Large Appliances
Publishers
Low-Value Pharmaceuticals
Industrial and Consumer Wholesalers/Distributors
Apparel RetailersTires
Consumer Packaged Goods
Building Supplies/Hardware Products
C G
Apparel Retailers
Drug Chains
Mass Merchandisers
Low-Value Industrial Durable
Copyright © 2010 Establish, Inc. www.establishinc.com6
Low-Value Consumer Packaged Goods Low Value Industrial Durable

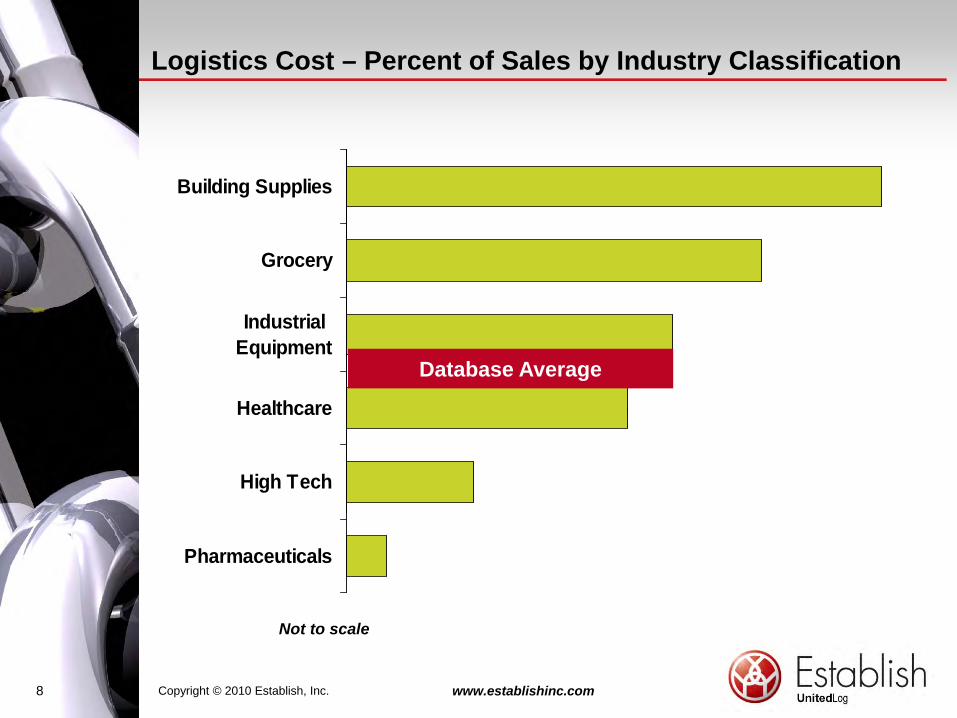
Logistics Cost – Percent of Sales by Industry Classification
Building Supplies
Grocery
g
Healthcare
Industrial Equipment
High Tech
Healthcare
Pharmaceuticals
Copyright © 2010 Establish, Inc. www.establishinc.com7
Not to scale
Logistics Cost – Percent of Sales by Industry Classification
Building Supplies
Grocery
Healthcare
IndustrialEquipment
Database Average
High Tech
Healthcare
Pharmaceuticals
Copyright © 2010 Establish, Inc. www.establishinc.com8
Not to scale

Average Company—2010 Database
Cost In% of Sales $/CWT
Transportation 4.08% $34.15
Warehousing 1.75 12.90
Order Entry/Customer Service 0.43 4.51
Administration 0.23 1.78
Inventory Carrying 1.79 14.63
Total Logistics Costs 8.28% $67.97
Copyright © 2010 Establish, Inc. www.establishinc.com9

Interpretation for Your Company
When comparing your numbers to the overall average, it is often more important to look at the relationship between the numbers and not the actual value. This average includes all industries, many with much higher and lowervalue. This average includes all industries, many with much higher and lower cost characteristics. Any direct comparison with these numbers will be an “apples to oranges” comparison.
Although your costs may be higher or in a different proportion does not il k th b d B h ki h h t d ithnecessarily make them bad. Benchmarking has as much to do with
comparing the numbers as being able to explain the differences. “Our costs are higher because we provide a greater level of ______________” or “Our costs are lower because we _______________.”
What strategies or investments have you undertaken to transform your costs, and have you conducted more in-depth analyses to validate them?
Copyright © 2010 Establish, Inc. www.establishinc.com10

Cost Breakdown Percent of Sales
C t S i /
5% 22%AdministrationWarehousing
Customer Service/Order Entry Inventory Carrying
21% 3%
49%49%Transportation
Copyright © 2010 Establish, Inc. www.establishinc.com11

Product ValueCost declines with higher value
10 9 15
Cost as a% of Sales
8
10 9.158.36 7.94
6.13
4
6
2
4
0<$1.50 $1.50 - $5 $5 - $15 >$15
Product Value in $/Pound
Copyright © 2010 Establish, Inc. www.establishinc.com12
Product Value in $/Pound

Company SizeSmall companies pay more
Cost as a% of Sales
10
12 10.13
7 04 6 94
6
8 7.04 6.94 6.60
2
4
0<$200 $200 - $500 $500 - $1,250 >$1,250
Annual Sales ($ MM)
Copyright © 2010 Establish, Inc. www.establishinc.com13

Trend group average:
Cost as a Percent of Sales Cost per HundredweightCost as a Percent of Sales Cost per Hundredweight
+6.5% +6.5%
Sales Total Costs in Dollars
-5.0% 1 0%
Weight Shipped Product Value
5.0% +1.0%
-5.0% -0.5%
Copyright © 2010 Establish, Inc. www.establishinc.com14

Interpretation for a Hypothetical Company
If you had the following characteristics….
-5.0%2009 2010
Annual Sales – millions $2,000 $1,895
+1 0%
-0.5%
-5.0%Weight Shipped – million lbs. 500 475
Product Value $4.00 $3.98
Logistics Costs in $ – millions $200 $202
+6.5%
+6.5%+1.0%Logistics Costs in $ millions $200 $202
Logistics Costs as a % of Sales 10.0% 10.6%
Logistics Costs per CWT $40.00 $42.53
Copyright © 2010 Establish, Inc. www.establishinc.com15
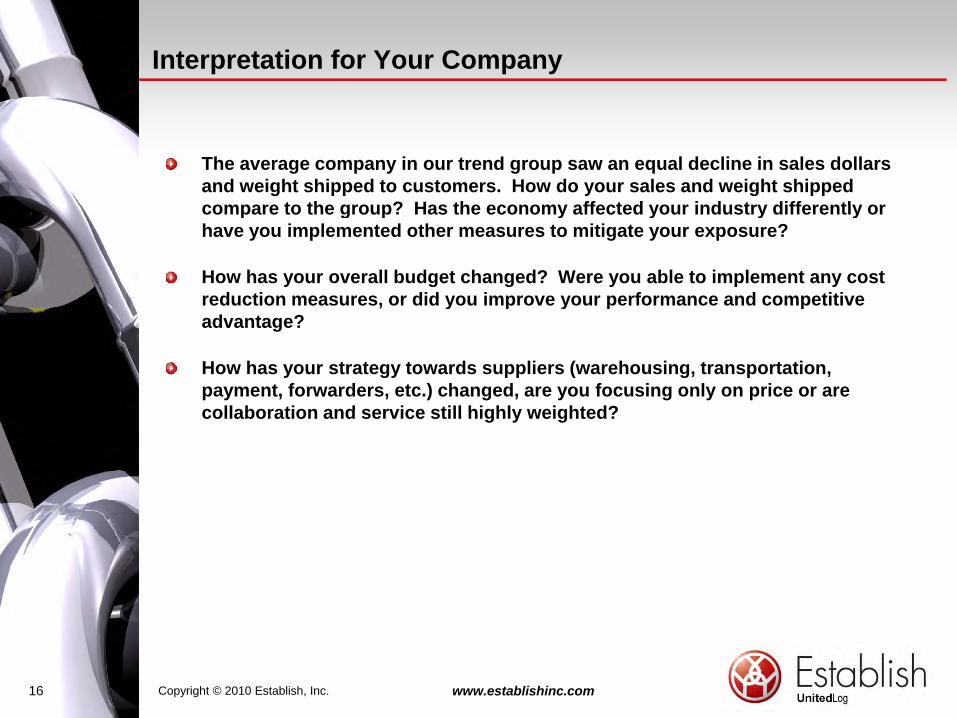
Interpretation for Your Company
The average company in our trend group saw an equal decline in sales dollars and weight shipped to customers. How do your sales and weight shipped compare to the group? Has the economy affected your industry differently orcompare to the group? Has the economy affected your industry differently or have you implemented other measures to mitigate your exposure?
How has your overall budget changed? Were you able to implement any cost reduction measures, or did you improve your performance and competitive , y p y p padvantage?
How has your strategy towards suppliers (warehousing, transportation, payment, forwarders, etc.) changed, are you focusing only on price or are collaboration and service still highly weighted?collaboration and service still highly weighted?
Copyright © 2010 Establish, Inc. www.establishinc.com16

Logistics Cost Change
2010 2009
Transportation + 0.8% + 0.4%
% of Sales $/CWT
2010 versus 2009
Warehousing + 6.2 + 5.5
Order Entry/Customer Service + 7.7 + 6.8
Administration - 8.1 - 8.7
Inventory + 21.1 + 20.2
Total + 6.5% + 6.5%
Copyright © 2010 Establish, Inc. www.establishinc.com17

Annual Functional Cost Change(Percent of Sales)
50
I t
Warehousing25
Transportation
Inventory
-25
0
-50
-75 79 81 83 85 87 89 91 93 95 97 99 01 03 05 07 09
Copyright © 2010 Establish, Inc. www.establishinc.com18
Several Database Trends are Evident
Logistics costs have increased considerably from 2009 to 2010. Transportation, which normally accounts for half of logistics costs, has remained flat in 2010, with many companies focusing their efforts on theremained flat in 2010, with many companies focusing their efforts on the single, largest expense.
Overall, the past year has not been a good one for logistics costs and service. Many companies are experiencing extreme fluctuations in demand, making capacity planning and forecasting even more difficultcapacity planning and forecasting even more difficult.
Copyright © 2010 Establish, Inc. www.establishinc.com19

Logistics Cost—Percent of Sales
10
789
10
3456
0123
1962 1966 1970 1974 1978 1982 1986 1990 1994 1998 2002 2006 2010
Copyright © 2010 Establish, Inc. www.establishinc.com20

Logistics Cost—Percent of Sales
Last Five Years8.0
7.5
7.0
6.5
6.02006 2007 2008 2009 2010
Copyright © 2010 Establish, Inc. www.establishinc.com21

Why are Overall Costs Rising?
The average company in our trend group has incurred a cost increase in almost every cost category except administration and oversight.
Not all increases are necessarily negative. There has been an uptick in warehouse technology improvements in both internal and external operations. These are physical assets and have a capacity based on size and technology. During periods of slower demand, it is easier to justify a disruption to improve operationsdisruption to improve operations.
More companies are shifting to include more direct to consumer order fulfillment adding to the single SKU, single item orders.
Increases in inventory are easier to justify with a lower cost of capital and y j y pcapacity constraints in importing products. With lower returns investing elsewhere, companies are “betting” on themselves.
Companies continually focus on ways to reduce transportation costs by changing modes, negotiating rates and passing on more transportation costschanging modes, negotiating rates and passing on more transportation costs to the customer (when possible). For the first time, many companies are leveraging their total volumes.
Copyright © 2010 Establish, Inc. www.establishinc.com22

Customer Service Levels
Definition
The prompt and complete delivery of goods ordered
Measurements
Prompt = 7 0 days total order cycle timePrompt = 7.0 days total order cycle time
CompleteOrders 92%Lines 95%U it 95%Units 95%
Copyright © 2010 Establish, Inc. www.establishinc.com23

Average Performance Reported
Total Cycle Time (Days) 7 8 7 8 8 8 9 9 8 7
01 02 03 04 05 06 07 08 09 10
FULL DATABASE
Total Cycle Time (Days) 7 8 7 8 8 8 9 9 8 7
Product Availability (% Orders) 87 88 85 91 88 84 83 90 91 92
(% Li ) 92 95 91 94 92 89 93 92 94 95(% Lines) 92 95 91 94 92 89 93 92 94 95
(% Cases) 90 93 93 91 94 90 94 94 95 95
Copyright © 2010 Establish, Inc. www.establishinc.com24

Davis Insights
1. Strongest forces driving decisions in logistics.
2. Most pressing issue in managing a logistics organization.
3. Most pressing issue in operating logistics functions.
4. Most difficult customer service requirement.
5. Most recent changes in logistics network.
6. Most recent change in systems that support logistics.
Copyright © 2010 Establish, Inc. www.establishinc.com25

The Answer to Almost Every Question WAS….
Copyright © 2010 Establish, Inc. www.establishinc.com26

Strongest Forces Driving Decisions in Logistics
% of Responses
100
708090 2010 2009 2008
2007 2006
4050600
203040
010
Copyright © 2010 Establish, Inc. www.establishinc.com27

Most Pressing Issue in Managing Logistics
Costs
Transportation CapacityTransportation Capacity
Data Visibility and Actionability
Copyright © 2010 Establish, Inc. www.establishinc.com28

Most Pressing Issue in Operating Logistics Functions
Controlling and reducing costs.
Managing complexity and variability.
Copyright © 2010 Establish, Inc. www.establishinc.com29
Most Difficult Customer Service Requirement
Extended payment terms and charge backs.p y g
Mass customization while reducing costs.
Labeling and packaging requirements.g g g
Delivery requirements (carriers, appointments, etc.).
Copyright © 2010 Establish, Inc. www.establishinc.com30

Most Recent Changes in Your Logistics Network
% of Responses
602010 2009 2008
40
502010 2009 2008
2007 2006
30
40
10
20
0
Copyright © 2010 Establish, Inc. www.establishinc.com31

Most Recent Change in Systems that Support Logistics
% of Responses
602010 2009 2008 2007 2006
40
502010 2009 2008 2007 2006
30
10
20
0
Copyright © 2010 Establish, Inc. www.establishinc.com32

What are Most Companies Doing to Reduce Costs?
Improving their internal product and information flows to achieve quick wins.
Benchmarking costs and practices to help indentify areas for improvement.
Negotiating with Transportation Providers.
Focusing on tactical projects as companies are still trying to survive.
Copyright © 2010 Establish, Inc. www.establishinc.com33

Improving Flows
Most flow improvement projects have a relatively short payback period.
Many companies are finding that their inbound production/receiving rates no longer match their outbound order characteristics, causing bottlenecks in their facilities.
Inventory turns are being highly scrutinized and evaluated.
I t t b i d i “ ” t h l i t i i tInvestments are being made in “newer” technologies to improve inventory accuracy and improve productivity.
System upgrades are being implemented to eliminate older “work around” methods.
Copyright © 2010 Establish, Inc. www.establishinc.com34

Benchmarking
Two distinct benchmarking groups:
1. The company that just wants to be told they are the “best”, which is difficult when only the 25% are considered best-in-class. There is a 75% chance you are not best-in-class.
2. The company that is interested in improving and further investigating the options; and wants to gain insight on where to focus their efforts and p g gquantify the opportunities.
Copyright © 2010 Establish, Inc. www.establishinc.com35

Carrier Negotiations
Carrier Negotiations have an almost immediate payback.
Companies are trying to leverage all of the spends to obtain the lowest possible rates (companies with multiple business units are now being forced to work together).
Companies are taking a hard look at their internal procedures, the way they pack and tender freight, and are in more of a selling mode to the carriers. p g gSeveral carriers are experiencing significant growth in specific areas and are pricing freight high as a means of turning it down.
UPS and FedEx are taking a hard stance against using any outside assistance when negotiating small parcel rates.g g p
Copyright © 2010 Establish, Inc. www.establishinc.com36

Strategic Projects
Strategic projects generally have a longer payback period.
Companies are modeling more on an as-needed basis, if a lease/service agreement is expiring or as an alternative to an overflow facility.
Many companies have shifted away from trying to improve their competitive advantage and are still in a survival mode.
Copyright © 2010 Establish, Inc. www.establishinc.com37

In Summary
The average company in 2010 has logistics costs of 8.28 percent of sales.
Year-over-year costs rose in 2010 from 2009.
Most companies are focusing on:
– Immediate cost reductions and control.
– Flexibility – is still mentioned but is often sacrificed.
– Transportation – although only modestly increased in 2010 is still a major focus for most companies.
Copyright © 2010 Establish, Inc. www.establishinc.com38

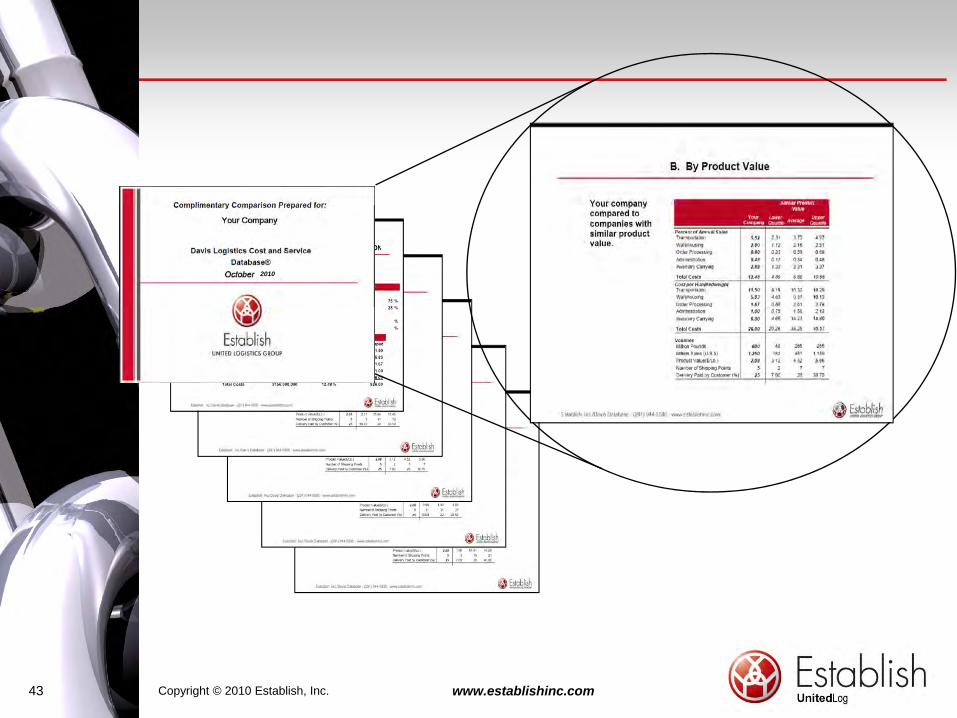
How to Participate
Fill out a short one-page input sheet on line.
No charge for initial comparison.
Confidentiality of your data is assured.
Participants receive custom benchmarks:
Percent of annual sales– Percent of annual sales
– Cost per hundredweight
– Five cost categories: transportation, warehousing, customer service/order entry inventory carrying and administrationentry, inventory carrying, and administration
– Averages and quartiles are provided
– Benchmarks based on product value, weight and revenue
– Customer service performance
Copyright © 2010 Establish, Inc. www.establishinc.com39

20102010
Copyright © 2010 Establish, Inc. www.establishinc.com40

2010
Copyright © 2010 Establish, Inc. www.establishinc.com41

2010
Copyright © 2010 Establish, Inc. www.establishinc.com42
2010
Copyright © 2010 Establish, Inc. www.establishinc.com43

2010
Copyright © 2010 Establish, Inc. www.establishinc.com44

2010
Copyright © 2010 Establish, Inc. www.establishinc.com45

Copyright © 2010 Establish, Inc. www.establishinc.com46


![Hypothetical%20proposition classpresentation[1]](https://img.pdfslide.net/doc/110x75/55a9a50d1a28aba5518b468b/hypothetical20proposition-classpresentation1.jpg)