Embed Size (px)
Citation preview
UNITED STATES DEPARTMENT OF THE INTERIOR
GEOLOGICAL SURVEY
JKPLOT - A device-independent platting system
written in BASICA for an IBM PC
by
John 0. Kork
JKPLOT
o _JQ_
loidxr JKPLOT
L_ 7"^ TJr~ o
Open-File Report 87-159
DISCLAIMER
Although program tests have been made, no guarantee (expressed or implied) is made by the author or the U.S. Geological Survey regarding program correctness, accuracy, or proper execution on all computer systems.
Any use of trade names is -for descriptive purposes only and does not imply endorsement by the U.S. Geological Survey. This report is preliminary and has not been reviewed -for con-formity with the U.S. Geological Survey editorial standards.
Denver, Colorado March 1987
CONTENTS
Page
Section I. - Introduction .............................. 1Section II. - General Graphics Software Considerations .. 1
A. Types of Graphics Software ............. 1B. Device Independence .................... 2C. Graphics Metafiles ..................... 2
Section III. - The JKPLOT Plotting System ................ 3A. General Design Considerations .......... 3B. The Basic Plotting System .............. 4C. The Elementary JKPLOT Instructions ..... 5D. De-fault Scaling ........................ 10
Section IV. - Structure and Use of the JKPLOT Device
A. Direct vs. Metafile Mode ........... 10B. Code Modules ....................... 11C. Direct Mode ........................ 11D. Metafile Mode ...................... 13
Section V. - Examples Using the Elementary Plot System . 14A. Example 1 .......................... 14B. Modification of an Intermediate
Plot File .......................... 16C. Ex ample 2 .......................... 16
Section VI. - Windowing and Zooming By Modifying anIntermediate Plot File .................... 20
Section VII. - Advanced Uses of the JKPLOT System ........ 22Section VIII. - Capabilities and Use of the Three File-
Reading Plot Drivers, FILDRV1.BAS, FILDRV2.BAS, and FILDRV3.BAS .............. 26
Section IX,, - Modifications of the JKPLOT System For useWith Microsoft QuickBasic ................. 29
A. Pr i ntears ............................ 29B. PC Screen with enhanced graphics ... 30C. PC Screen with Herculeas graphics .«. 30
Secti on X. - Conclusi on ................................ 30Sect i on XI. - References ...............a................... 30Sect i on X 11. - - Appendi ces ................................ 32
A. Sessi on Logs ............................. 32B. Modifications for Microsoft QuickBasic . 42
ILLUSTRATIONS
Table 1. Symbols -for standard SYMBOL cal 1 ................ 6
Table 2. Symbols -for special SYMBOL call ................. 7
Table 3. Examples of type o-f line drawn -for selectedvalues of the parameter TKLNTPX .- - » .».,» 8
Table 4. Summary of standard calling sequences ........... 9
Table 5. Device specific code for plot drivers ........... 12
Table 6. Summary of information about interpreter execution,need for assembly language, and linking .... 13
Figure 1. An elementary example showing the use of theJKPLOT system (size reduced) ............... 15
Figure 2, An example showing the result of modifying theintermediate plot file for Figure 1 (size reduced) . . . . . . . . . ... . . . . . . .... . . . . . . 15
Figure 3. An example showing the use of most of the elementary commands available in the JKPLOT system .............................. 20
Figure 4« Plot to be used as a basis for examples of windowing and zooming an intermediate p1 at file .................................. 22
Figure 5. Examples of windowing and zooming by modificationof an intermediate plot file ............... 23
Figure 6. Menu for plot modification selections availableusi ng FILDRV3.BAS .......................... 28
Figure 7. Numerical entry screen for FILDRV3.BAS(shown set for viewport entry) ............. 29
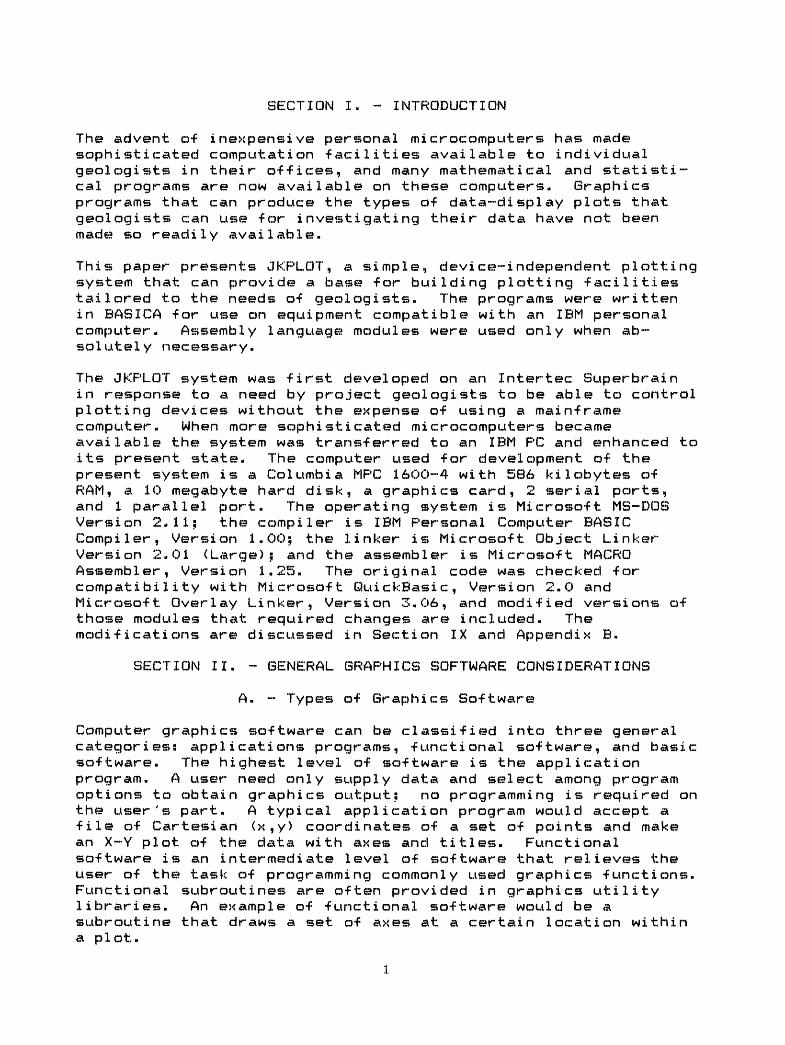
SECTION I. - INTRODUCTION
The advent of inexpensive personal microcomputers has made sophisticated computation -facilities available to individual geologists in their offices, and many mathematical and statisti cal programs are now available on these computers. Graphics programs that can produce the types of data-display plots that geologists can use -for investigating their data have not been made? so readily available.
This paper presents JKPLOT, a simple, device-independent plotting system that can provide a base -for building plotting facilities tailored to the needs o-f geologists. The programs were written in BASICA -for use on equipment compatible with an IBM personal computer. Assembly language modules were used only when ab solutely necessary.
The JKPLOT system was -first developed on an Inter tec Super brain in response to a need by project geologists to be able to control plotting devices without the expense o-f using a main-frame computer. When more sophisticated microcomputers became available the system was transferred to an IBM PC and enhanced to its present state. The computer used for development of the present system is a Columbia MPC 1600-4 with 586 kilobytes of RAM, a 10 megabyte hard disk, a graphics card, 2 serial ports, and 1 parallel port. The operating system is Microsoft MS-DOS Version 2.11; the compiler is IBM Personal Computer BASIC Compiler, Version 1.00; the linker is Microsoft Object Linker- Version 2.01 (Large); and the assembler is Microsoft MACRO Assembler, Version 1.25. The original code was checked for compatibility with Microsoft QuickBasic, Version 2.0 and Microsoft Overlay Linker, Version 3.06, and modified versions of those modules that required changes are included. The modifications are discussed in Section IX and Appendix B.
SECTION II. - GENERAL GRAPHICS SOFTWARE CONSIDERATIONS
A. - Types of Graphics Software
Computer graphics software can be classified into three general categories: applications programs, functional software, and basic software. The highest level of software is the application program. A user need only supply data and select among program options to obtain graphics output; no programming is required on the user's part. A typical application program would accept a file of Cartesian <x,y) coordinates of a set of points and make an X-Y plot of the data with axes and titles. Functional software is an intermediate level of software that relieves the user of the task of programming commonly used graphics functions. Functional subroutines are often provided in graphics utility libraries. An example of functional software would be a subroutine that draws a set of axes at a certain location within a plot.
1
The lowest level of graphics software is called basic software. Basic software accepts only the most primitive plotting commands for controlling a plotter. At this level of programming the type o-f plotting device being used becomes a factor in the programs because different plotters perform different functions within the plotter hardware itself. Typical basic software provides the capability for drawing a line between two locations and for plotting a symbol at a specified location.
B. - Device Independence
Device independence for computer graphics software means that, the programs are applicable on all graphics output devices - pen plotters, ink jet plotters, storage tube displays, raster CRT displays, dot-matrix printers, etc. Unfortunately the different makes and models of plotting devices do not respond to the same instruction protocols, and even when equivalent instructions (e.g. draw a line) are sent to different devices, the resulting images may be quite different. A line on a low resolution raster CRT is just not the same as a fine line drawn by a pen plotter, and a filled polygon on a color CRT is not the same as a cross- hatched polygon drawn with a pen. The goal of producing exactly the same image on all devices is thus unattainable and can only be approximated.
One approach to the problem of device-independence is to define a graphics processing language with which images can be defined abstractly in terms of a set of well-defined primitives. These abstract images can then be approximated as closely as possible by interpreters which generate display processor code to control the individual devices.
Efforts to design standards for graphics processing have produced two quite sophisticated systems, CORE C13 and GKS C33. These standards define graphics languages, data structures, and device characteristics for very general purposes. Other earlier languages, usually associated with a particular manufacturer (e.g. CalComp, Tektronix, Hewlett-Packard), had to suffice for the applications programmer while the comprehensive standards were being developed. The JKPLOT system follows the general direction of the most primitive parts of the CalComp system.
C. - Graphics Metafiles
The most elementary way to control a plotting device is for a program to include graphics language statements that cause a primitive (line, symbol, etc.) to be drawn by the plotter immediately upon execution of that statement. Device indepen dence can be obtained by locating the code for interpreting the graphics statements and producing the particular device protocol (display processor code) in a distinct section of the program or in a separate library linked to the program. To change devices
the programmer merely replaces the graphics interpreter code (or device driver) -for one device with that -for another. This mcathod can be called the direct mode of plotter control.
Another method of plotter control is to translate the graphics image into a representation in an intermediate language and store this representation in a -file, called an intermediate plot -file or graphics metafile. (See Section V for an extended discussion of the JKF'LOT metafile© and examples of their use.) An inter- mediate language interpreter is then used to read this file, translate the intermediate language into display processor code for a particular device, and display the picture. One of the ad vantages of this method is that a small part of a picture can be changed without the need for regenerating the whole plot. This method can be called the metafile mode of plotter control.
The JKPLQT system can be used in either the direct or metafile mode. All references to the plotting system are accomplished by setting certain parameters and then transferring control to line 30000 using a GOSUB instruction. The particular graphics task is then performed and control is returned to the line following the GQSUE* instruction. In the direct mode the device driver for a particular plotter is merged with the application program. When this merged program is executed the plotter instructions are sent directly to the output device. To use the metafile mode the programmer merges a pseudo device driver at line 30000. The pseudo device driver, instead of sending instructions to a plotter, stores the intermediate language instructions in a disk file. Other programs then read these graphics metafile®, manipulate the images, and send the instructions to the plotter.
SECTION III. - THE JKPLOT PLOTTING SYSTEM
A. - General Design Considerations
In order that the system be useful to users who are not sophisticated graphics programmers, design criteria for the plotting system were selected on the basis of simplicity, program transportability, and ease of incorporating program segments into new application programs. File compactness and processing speed were at times sacrificed so that the programming logic would adhere to a straightforward concept of the process of drawing pictures.
The main design criteria are:
i) The programs should be self-contained and require the the incorporation of no commercial software packages.
ii) As much code as possible* should be in a high level programming language rather than assembly language, even at the expense of processing speed.
iii) All source code should be in the public domain.
iv) The basic level of software should be deviceindependent in the sense that the same instructions can be used -for all plotters.
v) Modifications o-f the actual device drivers -for different devices should require a minimum of programming knowledge.
vi) The capacity for generating device-independent plot files should be provided.
B. - The Basic Plotting System
The unit of measurement for use with the basic plotting system was chosen to be inches. This means that pen position (or pseudo pen position in the case of a CRT) is specified in terms of inches of displacement from a fixed position called the plot origin and that character height is specified in inches. If the user wants to plot a large plot on a CRT screen, the plot can be scaled to fit onto the screen. Different versions of the basic plotting system are required for different plotting devices, but the programs are designed so that drivers can be easily modified for a variety of plotters.
The plotting functions included in the basic system were designed to be compatible with a subset of the elementary plotting commands provided with the CalComp Host Computer Basic: Software C43 , a software package which is supplied with CalComp pen plotters. Names of variables in the programs were chosen to match as closely as possible those used in the CalComp documentation. The names of the standard subroutines, which are described in detail in the following section, are PLOTS, PLOT, NUMBER, SYMBOL, LINE, FACTOR, and NEWPEN. An additional command, COMMENT, is included to allow a programmer to include information in an intermediate plot file.
All calls to the basic graphics subroutines are accomplished by using the statement GOSUB 30000. The particular function to be accomplished is specified by setting the value of the variable PRM'/.U). The values used are l-PLOTS, 2-PLOT, 3-SYMBOL, 4- NUMBER, 5-LINE, 6-NEWPEN, 7-FACTOR, and 8-COMMENT. This convention is used so that a programmer can write a program using the device driver for one device, the IBM PC screen for instance, and then change the program to send the output to a different device, a Tektronix CRT for instance, by meres! y replacing the PC driver with the Tektronix driver, which also uses line number 30000 as an entry point for all subroutine calls. Drivers are provided for the PC screen (high resolution, low resolution, enhanced graphics, and Hercules graphics), Tektronix 4014 CRT, Zeta 3600S pen plotter, devices that use the Hewlett Packard GCL (HP 7550A platter), and Epson and Okidata printers with high or
low resolution. A pseudo device driver, CCMAKE.BAS, to write the plot commands to a file -for later plotting is also included.
All variables used in the basic plotting system have names beginning with the letters TK or ITK. The user should avoid using variables beginning with these letters in the main body of the program so that permanent plotting parameters are not changed.
C. - The Elementary JKPLQT Instructions
The -functions performed by the basic software are described in terms of subroutine calls with arguments. (Note that this description is for informative purposes only; it does not follow the BASICA syntax and cannot be used in a program.) The arguments are listed in parentheses after the subroutine name. In order to call a specific subroutine, the user must assign a value to the variable PRIT/. (1) indicating which function is to be performed. Then values of the variables listed in parentheses must be assigned and a subroutine transfer made to line 30000 using the GOSUB instruction. When the* graphics function has been performed, control of the program returns to the statement immediately following the GOSUB instruction. The subroutines are described in the order of the value of PRIT/. (1) that specifies that routine.
1: PLOTS(XPAGE,YPAGE). This routine initializes a plot and is called only once (before a call to any other graphics subroutine). Execution of this command opens the plot output device through the computer's operating system, performs scaling calculations, and sets the clipping window. Values of X (the horizontal coordinate) will be clipped at 0 and XPAGE, and values of Y (the vertical coordinate) will be clipped at 0 and YPAGE.
2: PLOT(TKXP,TKYP,TKIP"/.) . This is the basic pen movement command. TKXP and TKYP are coordinates, in inches, from the current reference point (origin), of the position to which the pen is to be moved, and TKIP"/. is a signed integer which controls the pen status (up or down) and origin definition.
If TKIP/i ~ 2 the pen is down during movement, thus drawing a visible line. If TKIP"/. « 3 the pen is up during the move.
If TKIP/i « -2 or ~-3, a new origin is established at the terminal position after movement is completed as if TKIP7. were positive. In this case the logical X,Y coordinates of the new pen position are set equal to zero, and this position is the reference point for succeeding movements. If TKIP"/. « 999 the effects are the same as if TKIP7. were -3 except that the plot is terminated and the output device is closed.
The values of TKXP, TKYP, TKIP7-, and PRM'/. < 1) are not changed by this subroutine call. If only one of the values is to be changed for the next call, the others need not be reassigned.
3: SYMBOL <TKXP, TKYP, TKHT, TKA* or TKIQX, TKD, TKCH'/.) . There are two formats for the symbol call: 1) the "standard" call, which can be used to draw text such as titles, captions, and legends; and 2) the "special" call, which is used to draw special centered symbols such as a box, octagon, rectangle, etc., for plotting data points. The value of the variable TKCH"/. indicates whether the call is to the "standard" or the "special" form of the subroutine. A non-negative value of TKCH7. indicates a "standard" call for which the fourth parameter should be TKA$, and a negative value of TKCHX indicates a "special" call for which the fourth parameter should be TKIQ7..
For both the? "standard" and "special" calls, the pen is first moved to the position specified by TKXP and TKYP. The size of the symbol in inches is specified by TKHT, and TKD specifies the angle, in degrees from the positive horizontal axis, at which the annotation is to be plotted. If TKD = 0 the character<s) will be platted right side up and parallel to the horizontal axis.
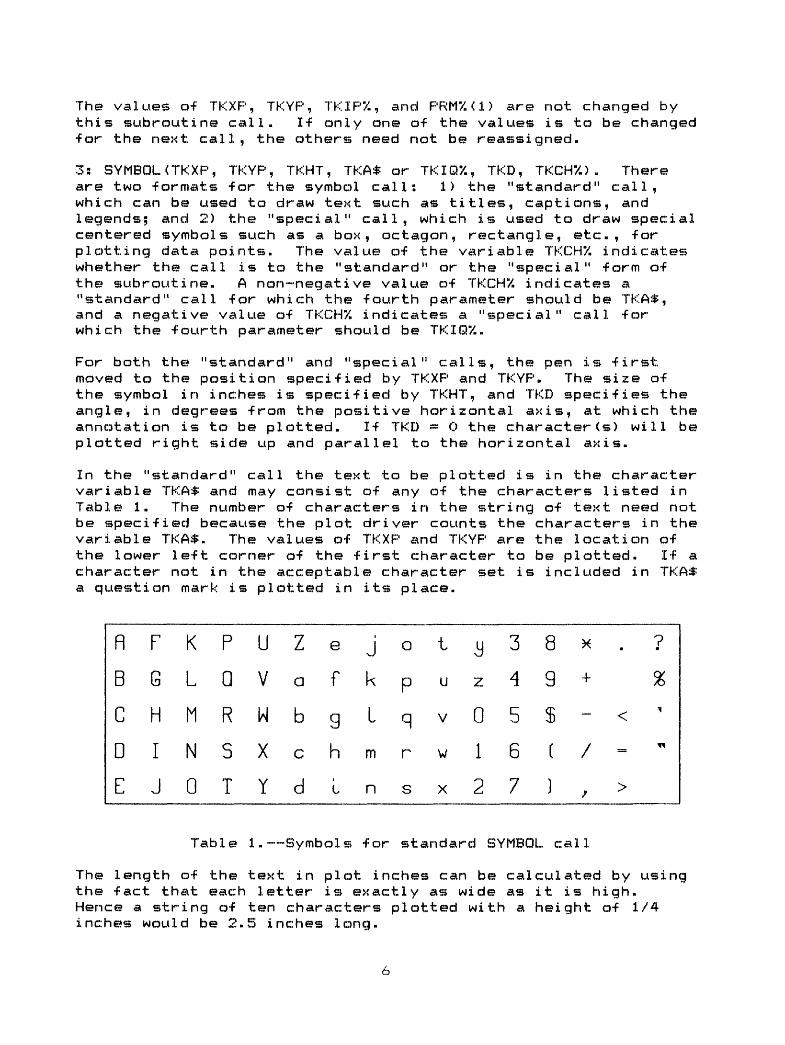
In the "standard" call the text to be plotted is in the character variable TKA$ and may consist of any of the characters listed in Table 1. The number of characters in the string of text need not be specified because the plot driver counts the characters in the variable TKA*. The values of TKXP and TKYP are the location of the lower left corner of the first character to be plotted. If a character not in the acceptable character set is included in TKA$ a question mark is plotted in its place.
flFKPUZejot^38x .
BGLQVofkpuz49 +
CHMRHbglqv05J-<
DINSXchmrwl6t/-
EJOTYdlnsx27) , >
Table 1. Symbols for standard SYMBOL call
The length of the text in plot inches can be calculated by using the fact that each letter is exactly as wide as it is high. Hence a string of ten characters plotted with a height of 1/4 inches would be 2.5 inches long.
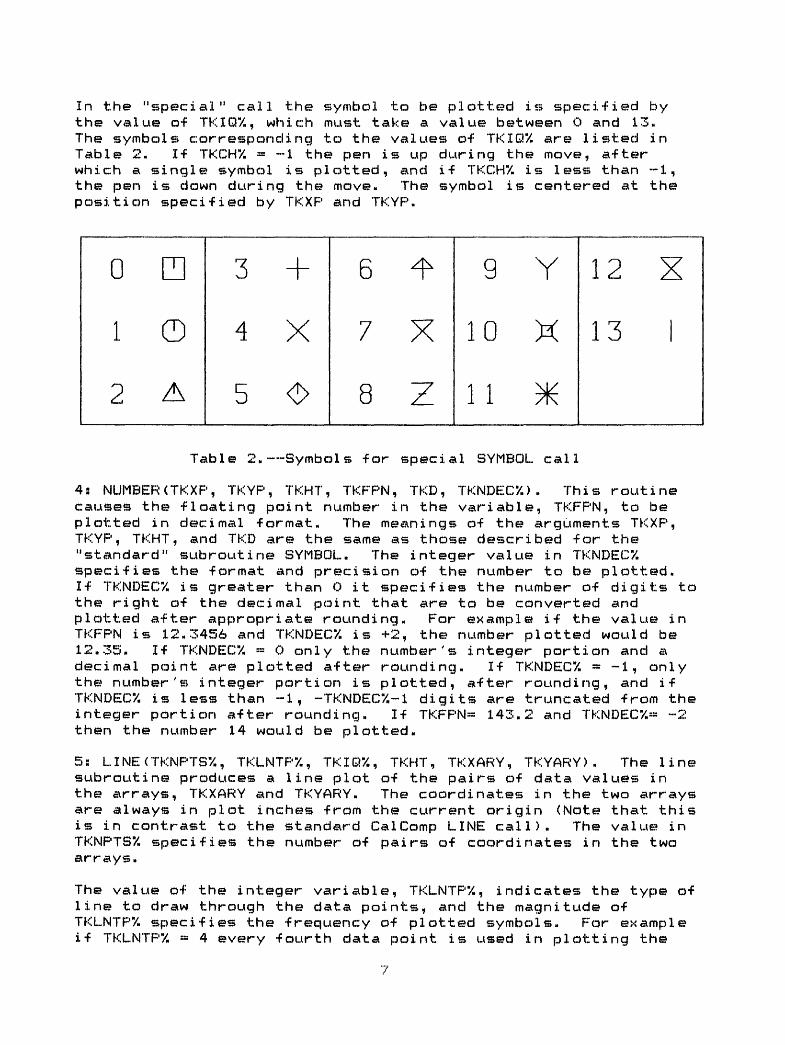
In the "special" call the symbol to be plotted is specified by the value of TKIQ7., which must take a value between 0 and 13. The symbol© corresponding to the values of TKI&r/. are listed in Table 2. If TKCH7. ~ -~1 the pen is up during the move, after which a single symbol is plotted, and if TKCHX is less than -1 , the pen is down during the move. The symbol is centered at the position specified by TKXP and TKYP«
0 ~r
2 A
3 +
4 X
5 O
6 ^
7 X
8 Z
9 Y
10 X
1 1 \l/1 1 7r\
12 X
13
Table 2. Symbols for special SYMBOL call
4s NUMBER (TKXP, TKYP, TKHT, TKFPN, TKD, TKNDEC"/.) . This routine causes the floating point number in the variable, TKFPN, to be plotted in decimal format. The meanings of the arguments TKXP, TKYP, TKHT, and TKD are the same as those described for the "standard" subroutine SYMBOL. The integer value in TKNDECX specifies the format and precision of the number to be plotted. If TKNDECX is greater than 0 it specifies the number of digits to the right of the decimal point that are to be converted and plotted after appropriate rounding. For example if the value in TKFPN is 12.3456 and TKNDECX is +2, the number plotted would be 12.35. If TKNDECX ~ 0 only the number's integer portion and a decimal point are plotted after round!ng. If TKNDECX * -1, only the number's integer portion is plotted, after round!ng, and if
truncated from the 2 and TKNDEC'/.» -2
TKNDECX is less than -1 , -TKNDEC"/.-1 digits are integer portion after rounding. If TKFPN- 143 then the number 14 would be plotted.
5i LINECTKNPTSX, TKLNTPX, TKIQX, TKHT, TKXARY, TKYARY). The linesubroutine produces a line plot of the pairs of data values in the arrays, TKXARY and TKYARY. The coordinates in the two arrays are always in plot inches from the current origin (Note that this is in contrast to the standard CalComp LINE call). The value* in TKNPTSX specifies the number of pairs of coordinates in the two arrays.
The value of the integer variable, TKLNTPX, indicates the type of line to draw through the data points, and the magnitude of TKLNTPX specifies the frequency of plotted symbols. For example if TKLNTPX = 4 every fourth data point is used in plotting the
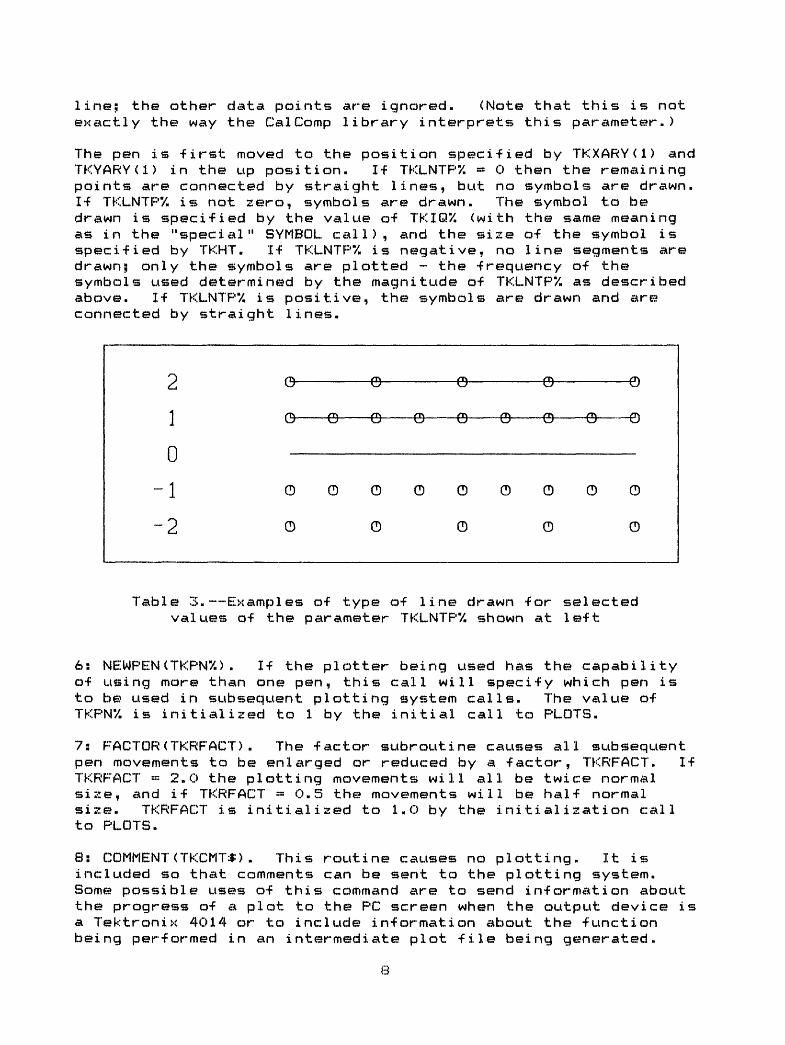
line; the other data points are ignored. (Note that this is not exactly the way the CalComp library interprets this parameter.)
The pen is -first moved to the position specified by TKXARY (1) and TKYARY(l) in the up position. If TKLNTP7. » 0 then the remaining points are connected by straight lines, but no symbols are drawn. If TKLNTP"/. is not zero, symbols are drawn. The symbol to be drawn is specified by the value of TKIQ7. (with the same meaning as in the "special" SYMBOL call), and the size of the symbol is specified by TKHT. If TKLNTP7. is negative, no line segments are drawn; only the symbols are plotted - the frequency of the symbols used determined by the magnitude of TKLNTPX, as described above. If TKLNTP"/. is positive, the symbols are drawn and are connected by straight lines.
2
1
0-1
-2
o e e ©
0 Q 0 0 0 0 0
QOOOQQQ
o o o o
_______ 0
__0 0
o o
o
Table 3. Examples of type of line drawn for selected values of the parameter TKLNTP/i shown at left
6s NEWPEN(TKPN7.) . If the plotter being used has the capability of using more than one pen, this call will specify which pen is to be used in subsequent plotting system calls. The value of TKPN7. is initialized to 1 by the initial call to PLOTS.
7s FACTOR(TKRFACT). The factor subroutine causes all subsequent pen movements to be enlarged or reduced by a factor, TKRFACT. If TKRFACT 2.0 the plotting movements will all be twice normal size, and if TKRFACT - 0.5 the movements will be half normal size. TKRFACT is initialized to l.O by the initialization call to PLOTS.
8s COMMENT<TKCMT$). This routine causes no plotting. It is included so that comments can be sent to the plotting system. Some possible uses of this command are to send information about the progress of a plot to the PC screen when the output device is a Tektronix 4014 or to include information about the function being performed in an intermediate plot file being generated.
8
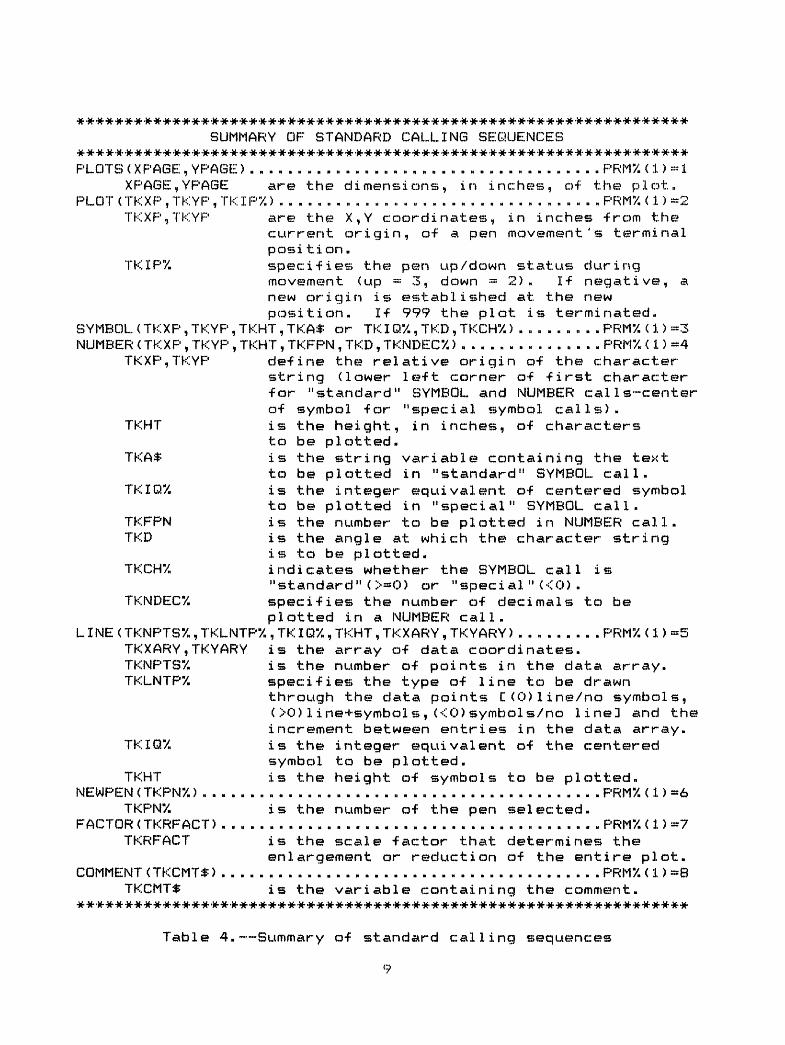
SUMMARY OF STANDARD CALLING SEQUENCES
PLOTS ( XPAGE , YPAGE)..................................... PRM"/. (1) =::: 1XPAGE, YPAGE are the di men sions, i n i nc h es, of the p 1 at.
PLOT (TKXP , TKYP , TKI P"/.>.................................. PRM'/. < 1) =2TKXP,TKYP are the X,Y coordinates, in inches -from the
current origin, of a pen movement's terminal posi tion.
TKIP7. specifies the pen up/down status duringmovement (up ~ 3, down » 2). If negative, a new origin is established at the new position. If 999 the plot is terminated.
SYMBOL (TKXP , TKYP , TKHT , TKA* or TK IQ7., TKD , TKCH7.)......... PRM7. (1) »3NUMBER (TKXP , TKYP , TKHT , TKFPN , TKD , TKNDEC7.) ............... PRM"/. (1) =4
TKXP,TKYP define the relative origin of the character- string (lower left corner of first character for "standard" SYMBOL and NUMBER calls-center of symbol for "special symbol calls).
TKHT is the height, in inches, of characters to be plotted.
TKA* is the string variable containing the text to be plotted in "standard" SYMBOL call.
TKIQ/C is the integer equivalent of centered symbol to be platted in "special" SYMBOL call.
TKFPN is the number to be plotted in NUMBER call.TKD is the angle at which the character string
is to be plotted.TKCH"/. indicates whether the SYMBOL call is
"standard" (>«0) or "special " «0) .TKNDECX specifies the number of decimals to be
plotted in a NUMBER call. LINE < TKNPTS7., TKLNTP"/., TK I Q7», TKHT , TKX ARY, TKYARY)......... PRM7. < 1) -5
TKXARY,TKYARY is the array of data coordinates.TKNPTS7. is the number of points in the data array.TKLNTPX specifies the type of line to be drawn
through the data points C(0)line/no symbols, (>0>1ine-fr-symbols,«0)symbols/no Iine3 and the increment between entries in the data array.
TKIQ7. is the integer equivalent of the centeredsymbol to be plotted.
TKHT is the height of symbols to be plotted. NEWPEN (TKPN7.) .......................................... PRM7. (1) »6
TKPN7. is the number of the pen selected. FACTOR (TKRFACT) ........................................ PRM7. (1) *7
TKRFACT is the scale factor that determines theenlargement or reduction of the entire plot.
COMMENT (TKCMT*) ........................................ PRM7. < 1) =8TKCMT$ is the variable containing the comment.
Table 4. Summary of standard calling sequences
9
The CalComp basic plotting system has a subroutine called WHERE with arguments TKRXPAGE and TKRYPAGE. This routine returns the present position of the pen in plot inches -from the current reference point. There is no need -for such a call in the JKPLOT plotting system because the values o-f the variables TKRXPAGE and TKRYPAGE are global in the sense that they can be used -for calculation anywhere in the calling program. The user must be sure not to modify these values or the results o-f subsequent plot movement commands will be unpredictable.
D. - De-fault Scaling
There are two procedures used in de-fault mode -for scaling a picture. Because the actual size of- a picture produced on the PC screen or Tektronix 4014 terminal depends on the size o-f the monitor, the term "plot inches" is not meaningful for these devices. Default calculations for these drivers scale the plot to produce the largest aspect-preserving image that can be drawn in the CRT screen. The aspect ratio of a rectangle is the ratio of the width to the height. Without aspect-preservation a square might be drawn as a tall, thin rectangle. For "inch-type" plotters, i.e. devices for which the term "plot inches" is meaningful (HP and Zeta plotters, Epson and Okidata printers), the plot produced is the size specified by the parameters XPAGE and YPAGE unless the plot scaled this way would be too big for the plotter. In this case the user is warned that the plot is too big and is being reduced to a size that will fit on the plotter.
More advanced capabilities of the basic plotting system include plot-coordinate windowing, screen-coordinate viewport/clipping, plot rotation, and plot centering and allow the placement of a number of different plots at different locations within a larger plot. These capabilities will be described in Section VII.
SECTION IV. - STRUCTURE AND USE OF THE JKPLOT DEVICE DRIVERS
A. - Direct vs. Metafile Mode
There are two elementary ways to use the plot drivers described in this paper. The most direct way is to write a program in BASICA, accessing the plotting subroutines by setting the parameters described in Section III-C. The driver for a specific plotting device can then be merged with this program, and when the program is executed, the plot will be drawn on the output device. Another way is to write the same BASICA program but merge the pseudo device driver, named CCMAKE.BAS, into the program. This procedure will produce an intermediate plot file of Calcomp-like commands. The intermediate plot file is an ASCII file containing on each line the name of the plot subroutine to be called along with the parameter values to be set before transfer to the plot subroutines.
10
Each method of using the plotting system has advantages. The method that sends the output directly to the plotting device has the advantage of immediacy; the product of the program is immediately available for viewing when the program is run. On the other hand, the method that uses the intermediate plot file allows the user to make a number of plots with the same page size and then send them all to the plotter at the same time - a system for overlaying individual plots. The knowledgeable user can also use a standard ASCII file editor to change aspects of a plot by editing the intermediate plot file. Examples of both of these methods will be given in the following section.
B. - Code Modules
Because the plot drivers for different plotters have much code in common, the programs were written in modular form so that the overlapping parts would not have to be repeatedly listed. The device-independent code is named PLTDRV.BAS. This code contain© the line to which all graphics calls must transfer (line 30000) and does most of the graphics calculations. The device dependent sections of code all start at line 35000 and contain the code that translates the general graphics functional requirements into the proper protocol for a particular device. This device specification code performs three general functionss <1) device initialisation, <2) pen (or pseudo pen) movement, either with pen up or down, and (3) plot termination. It also contains a section that declares the device characteristics.
As mentioned earlier all variables in the plot driver routines start with the letters TK or ITK. The user should be careful not to use variables starting with these letters in an application program. Also, lines 10-100 are reserved for use by the plot driver for driver code that must appear in a program before other executable code. Because the drivers themselves start at lines 30000 and 35000, the user should avoid using line numbers between 10 and 100 or between 30000 and 40000 in an application program.
C. - Direct Mode
To construct a complete device driver for use in the direct plotting mode the user must first load the device independent part of the code, PLTDRV.BAS, and then merge the device specification code. The device driver is thcsn resident in the computer memory and can be saved into a disk file for later merging into an applications program. The names of the device specification subroutines included with this report are listed in Table 5.
When the device-specific code for the high or low resolution PC screen, Tektronix 4014, or Zeta or Hewlett Packard plotters is merged with PLTDRV.BAS, the resulting driver is complete and self contained in the sense that when the applications code is merged with this driver, the program can be executed either through the
11
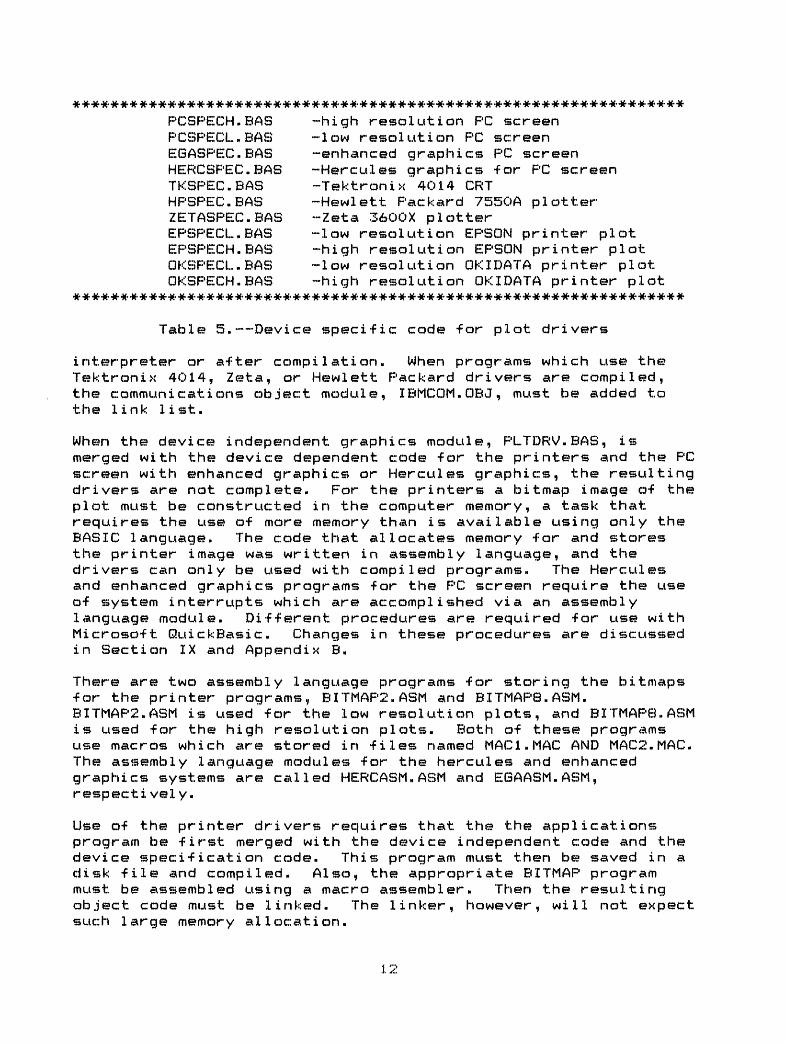
PCSPECH.BAS -high resolution PC screenPCBPECL.BAS -low resolution PC screenEGASPEC.BAS -enhanced graphics PC screenHERCSPEC.BAS -Hercules graphics -for PC screenTKSPEC.BAS -Tektronix 4014 CRTHPSPEC.BAS -Hewlett Packard 7550A plotterZETASPEC.BAS -Zeta 3600X plotterEPSPECL.BAS -low resolution EPSON printer plotEPSPECH.BAS -high resolution EPSON printer plotOKSPECL.BAS -low resolution OKIDATA printer plotOKSPECH.BAS -high resolution OKIDATA printer plot
Table 5. Device specific code for plot drivers
interpreter or after compilation. When programs which use the Tektronix 4014, Zeta, or Hewlett Packard drivers are compiled, the communications object module, IBMCOM.QBJ, must be added to the link list.
When the device independent graphics module, PLTDRV.BAS, is merged with the device dependent code for the printers and the PC screen with enhanced graphics or Hercules graphics, the resulting drivers are not complete. For the printers a bitmap image of the plot must be constructed in the computer memory, a task that requires the use of more memory than is available using only the BASIC language. The code that allocates memory for and stores the printer image was written in assembly language, and the drivers can only be used with compiled programs. The Hercules and enhanced graphics programs for the PC screen require the use of system interrupts which are accomplished via an assembly language module. Different procedures are required for use with Microsoft QuickBasic. Changes in these procedures are discussed in Section IX and Appendix B.
There are two assembly language programs for storing the bitmaps for the printer programs, BITMAP2.ASM and BITMAPS.ASM. BITMAP2.ASM is used for the low resolution plots, and BITMAPS.ASM is used for the high resolution plots. Both of these programs use macros which are stored in files named MACI.MAC AND MAC2.MAC. The assembly language modules for the hercules and enhanced graphics systems are called HERCASM.ASM and EGAASM.ASM, respectively.
Use of the printer drivers requires that the the applications program be first merged with the device independent code and the device specification code. This procjram must then be saved in a disk file and compiled. Also, the appropriate BITMAP program must be assembled using a macro assembler. Then the resulting object code must be linked. The linker, however, will not expect such large memory allocation.
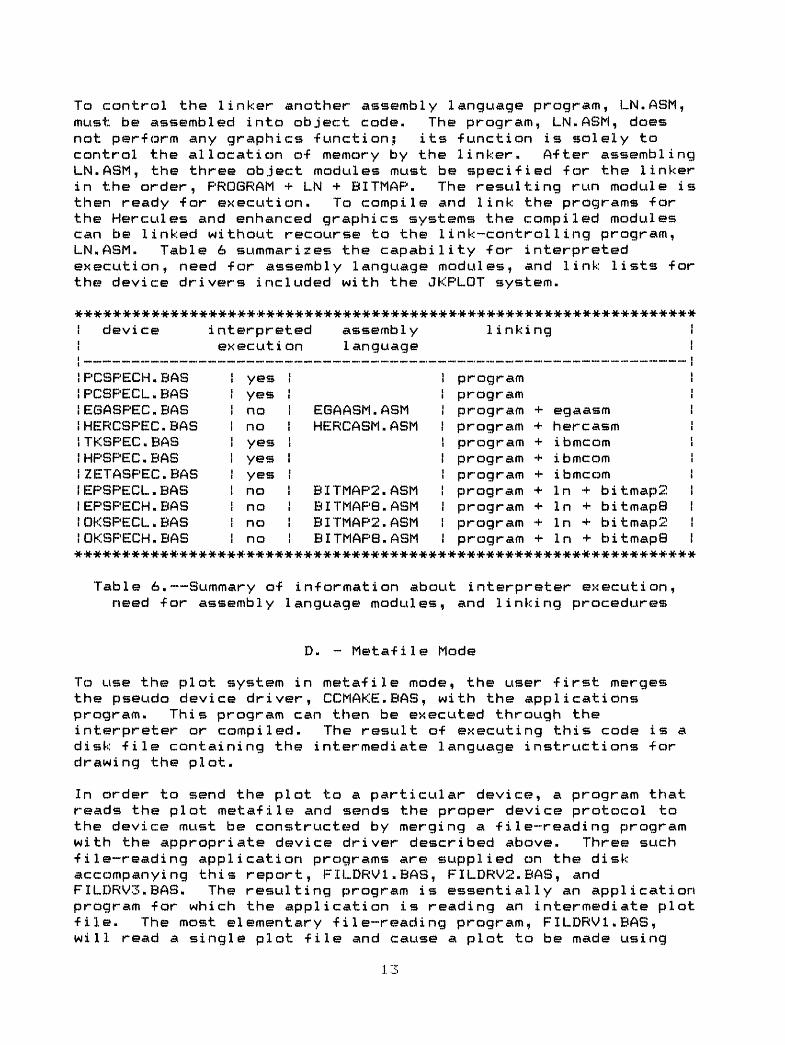
To control the linker another assembly language program, LN.ASM, must be assembled into object code. The program, LN.ASM, does not perform any graphics -function; its -function is solely to control the allocation o-f memory by the linker. A-fter assembling LN.ASM, the three object modules must be specified -for the linker in the order, PROGRAM 4- LN + BITMAP. The resulting run module is then ready -for execution. To compile and link the programs -for the Hercules and enhanced graphics systems the compiled modules can be linked without recourse to the link-controlling program, LN.ASM. Table 6 summarizes the capability -for interpreted execution, need -for assembly language modules, and link lists -for the device drivers included with the JKPLQT system.
device
IPCSPECH.BASIPCSPECL.BASiEGASPEC.BASiHERCSPEC.BASITKSPEC.BASIHPSPEC.BASIZETASPEC.BASIEPSPECL.BAS(EPSPECH.BASIOKSPECL.BASIOKSPECH.BAS
interpreted executi on
assembly language
1i nki ng
yes yes no no yes yes yes no no no
! no
EGAASM.ASM HERCASM.ASM
BITMAP2.ASM BITMAPS.ASM BITMAP2.ASM BITMAPS.ASM
! programprogramprogramprogramprogramprogramprogramprogram
! program! program! program
4-
4-
4- + 4-
4-
4-
4-
4-
egaasmhercasmibmcomibmcomibmcomIn + bitmap2In + bitmapsIn + bitmap2In + bitmaps
Table 6. Summary o-f information about interpreter execution, need for assembly language modules, and linking procedures
D. Metafile Mode
To use the plot system in metafile mode, the user first merges the pseudo device driver, CCMAKE.BAS, with the applications program. This program can then be executed through the interpreter or compiled. The result of executing this code is a disk file containing the intermediate language instructions for drawing the plot.
In order to send the plot to a particular device, a program that reads the plot metafile and sends the proper device protocol to the device must be constructed by merging a file-reading program with the appropriate device driver described above. Three such file-reading application programs are supplied on the disk accompanying this report, FILDRV1.BAS, FILDRV2.BAS, and FILDRV3.BAS. The resulting program is essentially an application program for which the application is reading an intermediate plot file. The most elementary file-reading program, FILDRVl.BAS, will read a single plot file and cause a plot to be made using
de-fault values -for all the plot system parameters. FILDRV2.BAS allows overlaying o-f up to 10 plots with the same page size and also the selection o-f a window to plot only a portion o-f the whole plot. FILDRV3.BAS is a menu-controlled program which exercises many o-f the more sophisticated capabilities o-f the JKPLOT system. Use o-f these drivers is discussed in more detail in Section VIII.
Log -files showing the procedures used to merge and compile drivers, applications programs, and meta-f i le-reading drivers using the elementary BASICA compiler are in Appendix A, and changes in the procedures -for using Microso-ft QuickBasic are discussed in Appendix B.
SECTION v, EXAMPLES USING THE ELEMENTARY PLOT SYSTEM
For the -following examples it will be assumed that the user has constructed a PC screen high resolution driver by merging the programs PLTDRV.BAS and PCSPECH.BAS, saving the merged program in a -file named PCDRVH.BAS. It is also assumed that a program, FILPCH1.BAS, -for reading an intermediate plot -file and drawing the image on the PC screen, has been made by merging the PC driver, PCDRVH.BAS, with the -file-reading program, FILDRV1.BAS. For speedy plotting, the program, FILPCH1.BAS, should be compiled. (See Appendices A and B -for log -files showing procedures -for accomplishing these tasks and -for using the programs in Examples 1 and 2.)
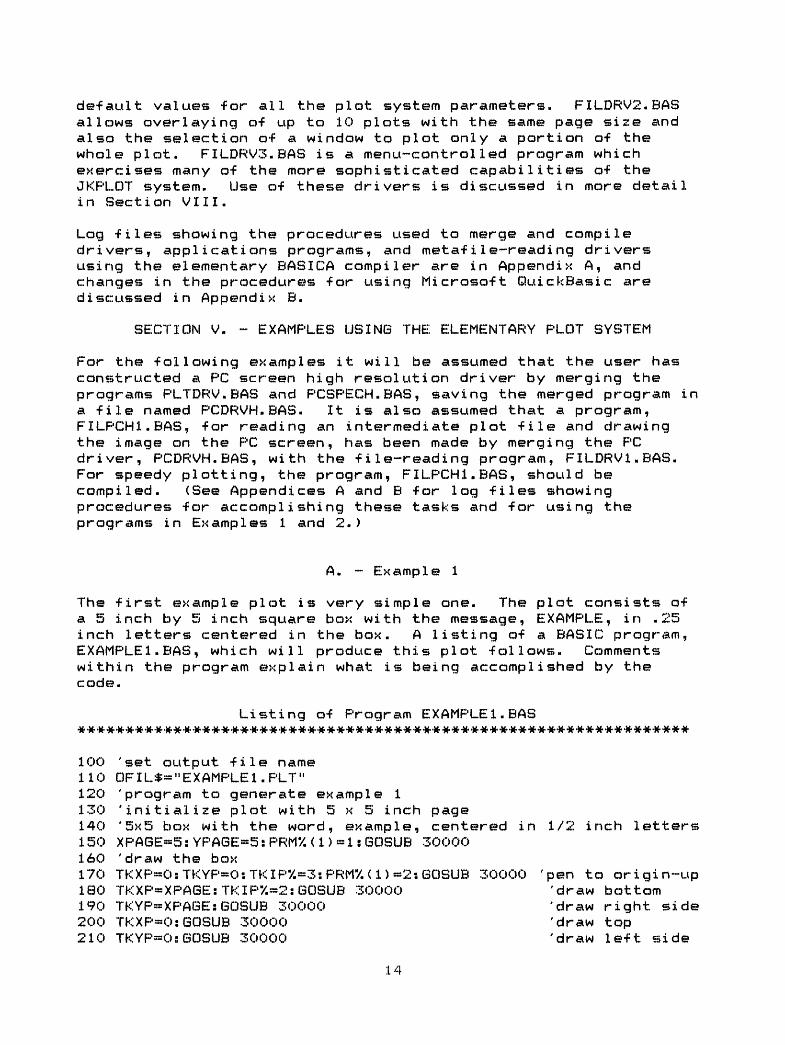
A. - Example 1
The -first example plot is very simple one. The plot consists o-f a 5 inch by 5 inch square box with the message, EXAMPLE, in .25 inch letters centered in the box. A listing o-f a BASIC program, EXAMPLEl. BAS, which will produce this plot -follows. Comments within the program explain what is being accomplished by the code.
Listing o-f Program EXAMPLEl. BAS
100 'set output file name110 OFIL*=»"EXAMPLE1.PLT"120 'program to generate example 1130 'initialize plot with 5 x 5 inch page140 '5x5 box with the word, example, centered in 1/2 inch letters150 XPAGE-5:YPAGE»5:PRM7.<1)«1: GOSUB 30000160 'draw the box170 TK X P»0: TKYP*0: TK I P7.=3: PRM7. < 1) «2: GOSUB 30000180 TKXP« XPAGE: TK I P"/.-~2: GOSUB 30000190 TKYP^XPAGEsGOSUB 30000200 TKXP=0:GOSUB 30000210 TKYPaQ:GOSUB 30000
uppen to origin- 'draw bottom 'draw right side 'draw top 'draw le-ft. side
14
220 'set parameters for standard SYMBOL call230 TKA*»"EXAMPLE"240 TKD-0 s TKHT=». 5: TKCH"/.«0250 'calculate lower left corner of centered message260 TKYP»2.5~TKHT/2270 TKXP-2.5-.5*<TKHT*LEN<TKA*))280 PRM7. <1)=3: GOSUB 30000290 'return pen to origin and terminate plot300 TKXP»Os TKYP-Os TKIP"/.=999: PRM"/. (1) *2: GOSUB 30000310 END
The user can merge the particular device driver (in this example, the PC driver) with the program, EXAMPLE1.BAS, by entering the commands LOAD "EXAMPLE1 BAS" and MERGE "PCDRVH.BAS". The program can then be executed by entering the command, RUN.
The PC screen will clear and the picture will be drawn on the screen. When the picture is complete, the computer will sound a short "beep", indicating the completion. The result of running this program is shown in Figure 1.
To remove the picture from the screen, the user must press the <ESCAPE> key, and computer returns to the BASIC system. The reason for the requirement for pressing the <ESCAPE> key without any screen prompt is that the-? user may want to make a copy of the picture on the printer. If one has the appropriate software, the screen image can be sent to the printer by entering special keyboard entries. Any prompting for the <ESCAPE> key entry would add the prompt message to the picture, and this prompt would be plotted along with the desired picture.
EXRMPLE EXflMPLE
MODIFIED
Figure 1. An elementary example showing the use of the JKPLOT system. (sise reduced)
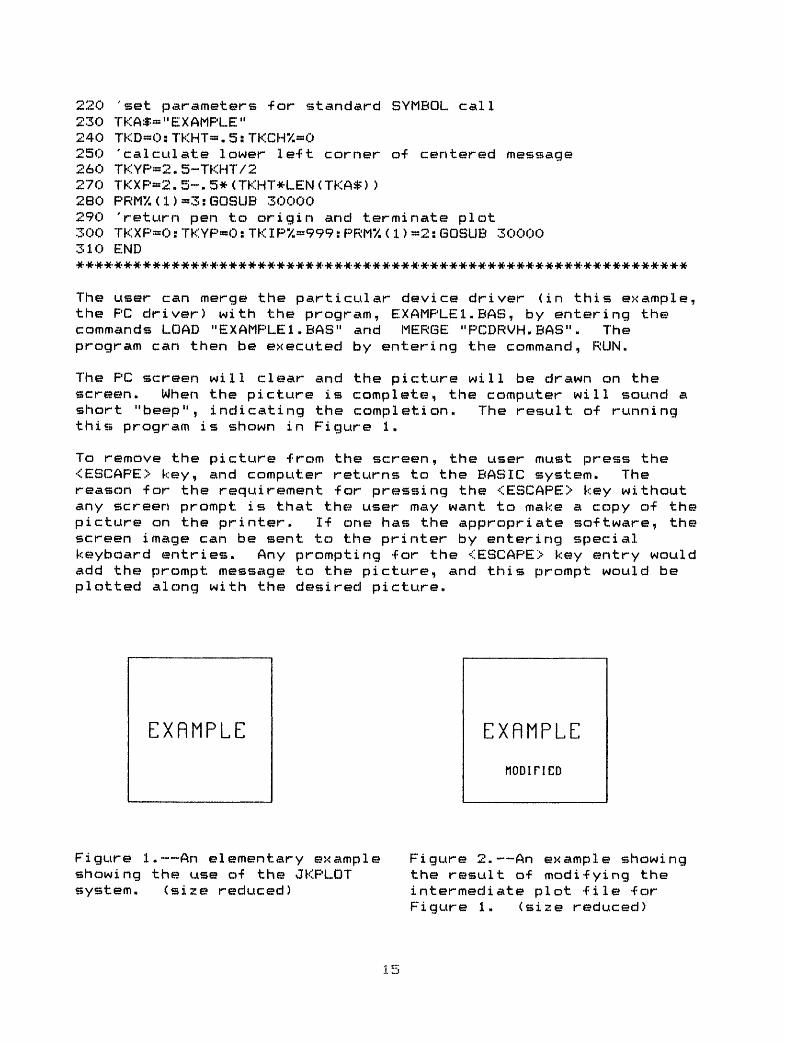
Figure 2. An example showii the result of modifying the intermediate plot file for Figure 1. (size reduced)
Another way to generate the picture on the PC screen is to append the pseudo device driver, CCMAKE.BA8, to program EXAMPLE1 BAS and then run the program. The user is prompted -for an output -file name for the intermediate plot -file, and the program generates an A48CII -file of CalComp-1 i ke commands. The user then executes the program, FILPCH1.EXE, which asks -for the intermediate plot file name and then plots the image on the PC screen. The ASCII file that is produced by this procedure is named EXAMPLE!.PLT.
Intermediate PLot File, EXAMPLEl.PLT
PLOTS, 5 , 5 PLOT, 0 ,0,3 PLOT, 5,0,2 PLOT, 5,5,2 PLOT, 0,5,2 PLOT, 0,0,2 SYMBOL, 0 , .75 , PLOT, 0 , 0 , 999
2.25 , .5 , 0 ,EXAMPLE
A third way to generate the above plot is to use a file editor such as EDLIN to create the intermediate ASCII plot file, EXAMPLEl.PLT, directly. The user then executes the program, FILPCH1.BAS, and the image appears on the screen. If the user understands the construction of the intermediate plot file, many plot, modification possibilities are available.
B. - MODIFICATION OF AN INTERMEDIATE PLOT FILE
An intermediate ASCII plot file is just a sequence of CalCamp- like instructions that can be read by a program like FILPCH1. EiAS. Hence the user can insert plot commands or move images by proper modification of the file. This capability is very valuable if the user has constructed a large, complicated plot and just wants to make a few changes or to add extra documentation without regenerating the whole file.
For example, addition of the line
SYMBOL, 0,1.5,1,.25,0,MODIFIED
immediately after the SYMBOL call in the intermediate plot file for Example 1 causes the text, "MODIFIED", to appear below the original text in the figure, producing the plot shown in Figure 2.
C. - Example 2
A program, EXAMPLE2.BAS, that demonstrates the use of most of the elementary commands available in the basic plotting software follows.
16
Listing o-f the Program, EXAMPLE2.BAS
100 110 120 130 140 ISO 160 170 180 190 200 210 220 230 240 250 260 270 280 290 300 310 320 330 340 350 360 370 380 390 400 410 420 430 440 450 460 470 480490491500510520530535540550560570
'program to demonstrate use o-f basic plot system OFIL*«"EXAMPLE2.PLT" DIM X(100),Y(100),D*(5),QT$<5) 'set page size and initialize plot XPAGE«1Q: YPAGE-10: PRM7. <!)=!: GOSUB 3OOOO 'draw outline and -four subareas TKXP=0: TKYP»0: TKI P'/.«3: PRM7. < 1) =2: GOSUB 30000 TKXP«0: TK YP« 10: TK I P'/.«2: GOSUB 30000 TKXP=10:TKYP«10:GOSUB 30000 TKXP»10:TKYP*Q:GOSUB 30000 TKXP»0:TKYpaO:GOSUB 30000 TK XP«5: TKYP=0: TK I P'/.=3: GOSUB 30000 TKXP-5: TKYP= 10: TK I P'/.«2: GOSUB 30000 TKXP»0: TKYP=5: TK I P7.=3: GOSUB 30000 TKXP»1Q: TKYP=5: TKIP7.-2: GOSUB 30000 'comment call -for user information use TKCMT*« " UPPER LEFT CORNER " : PRM7. < 1) =8: GOSUB 30000 'move origin to upper le-ft subarea TKXP=0: TKYP=5: TK I PX~-3: PRM7. (1) =2: GOSUB 30000 'set parameters -for standard SYMBOL, call TKA**"Example 2"TKHT*.25:TKXP«2.5-LEN(TKA*>*TKHT/2:TKYP=2.5-TKHT/2 TKD«0: TKCH'/.= 1: PRM7. (1 > «3 s GOSUB 30000 'show use o-f FACTOR call TKRFACT». 5: PRM7. (1) =7: GOSUB 30OOO TKA*="Example 2"TKHT-.25:TKXP«2.5-LEN(TKA*)*TKHT/2:TKYP«2.5-TKHT/2 TKD-0: TKCH7.= 1: PRM7. (1) ~3: GOSUB 30000 TKRFACT« 1: PRM7. (1) »7: GOSUB 300OO 'comment call -for user in-for mat ion use TKCMT*« "LOWER LEFT CORNER " : PRM'/. (1) «S: GOSUB 30000 'move origin to lower le-ft sub area TKXP«0: TKYP=~5: TKIP'/.=-3: PRM'/. (1) «2: GOSUB 30000 'draw axis linesTKXP« 1: TKYP= 1: TK I P"/.=3: PRM'/. (1 > «2: GOSUB 30000 TKXP«4: TK I P'/.*2: GOSUB 30000 TK X P= 1: TK I P'/.=3: GOSUB 30000 TKYP=4: TK I P'/.=2: GOSUB 30000 ' 1abel axesTKXP=.7:TKYP«1.9:TKD«90:TKHT».2:TKA*="Y-AXIS" TKCH'/.= 1: PRM7. (1) =3: GOSUB 30000TKXP=1.9:TKYP=.4:TKD-0:TKA*="X-AXIS":GOSUB 30000 'show use o-f LINE callTKNPTS'/.= 10: TKHT». 1: TKLNTP'/.=-l: TKHT-. 1: PRM7. (1) ~5 FOR I«l TO 10:TKXARY(I)=(I-l)/3+l:TKYARY(I)=TKXARY(I) NEXT I:GOSUB 300OO TKIQ'/.»1: TKLNTP7.-1FOR 1=1 TO 10:TKYARY(I)*SQR(TKXARY(I)):NEXT I:GOSUB 30000 TKLNTP'/.«0 FOR 1=1 TO 10
17
571 T-TKYARY (I) : TKYARY (I) ̂ TKXARY (I) : TKXARY (I) =*T: NEXT I572 GOSUB 30000580 'use comment -for information590 TKCMT$«"LOWER RIGHT CORNER" : PRM"/. (1) «8: GOSUB 30000600 'move origin for lower right subarea610 TKXP=5 s TKYP«0: TKI P"/.~~3 s PRM"/. <1)*2:GOSUB 30000620 'simple annotated point plotting630 X<l)«lsY<l)=4sX<2>=4:Y<2>=3:X(3)*2:Y<3)«1640 D* <1>«"PT-1":D* <2> «"PT-2"s D* <3> ="PT-3"650 TK I Q'/.*3: TKD*0 s PRM'/. < 1 > ~3660 FOR 1 = 1 TO 3:TKHT».05:TKXP«X<I> :TKYP=Y<I> :TKIQ'/.»3665 TKCH"/.=-Is GOSUB 30000670 TKHT=. 1 s TKXP-X (I) +. 15: TKYP=Y < I) -. 15: TKA*«D* < I) s TKCH'/.«1675 GOSUB 30000680 NEXT I690 'use comment for information700 TKCMT*»"UPPER RIGHT CORNER" : PRM"/. (1) »8s GOSUB 30000710 'move origin for upper right subarea720 TKXP-0: TKYP-5: TKIP'/.»-3: PRM7. (1) »2s GOSUB 30000730 'show use of angles with SYMBOL call740 TKHT». 13:TKCH"/.«isPRM7. < 1) «3: TKA*»" EXAMPLE 2"750 FOR I«0 TO 7:TKD«45*I:TKXP=2.5:TKYP-2.5:GOSUB 30000s NEXT760 'move origin back to original position770 TKXP«-5: TKYPa-5: TKIP'/.«-3s PRM'/. < 1) »2« GOSUB 30000780 'end plot790 TKXP«5s TKYP=0: TKIP7.«999: PRM"/. (1) «2: GOSUB 30000800 PRINT "DONE":END
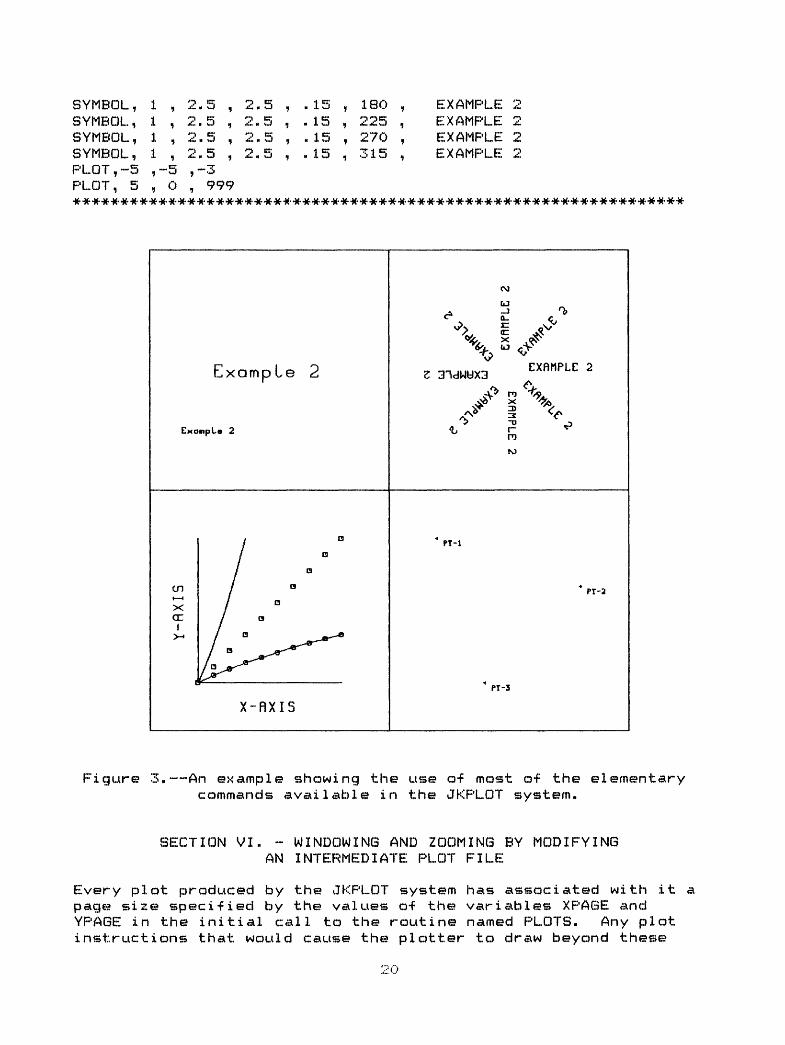
The intermediate plot file produced by running the program in metafile mode (by appending the pseudo device driver, CCMAKE.BAS) follows, and Figure 3 shows the resulting plot.
Intermediate Plot File for Example 2
PLOTSPLOTPLOTPLOTPLOTPLOTPLOTPLOTPLOT
i,»i,iii
t00
101t
10
1010
110 ,0550
1,11
00
10»
1100
105
,,1
1
1
3
i
23
3
22
2
2
PLOT, 10 ,5,2 COMMENT, UPPER LEFT CORNER- PLOT, 0 , 5 ,-3
1 1.375 2.3755
SYMBOL,FACTOR,SYMBOL, 1 , 1.375 , 2.375 ,FACTOR, 1COMMENT,LOWER LEFT CORNERPLOT, 0 ,-5 ,-3
25 , 0 ,Example 2
25 , 0 ,Example 2
18
PLOT , 1 ,PLOT, 4 ,PLOT , 1 ,PLOT , 1 ,SYMBOL, 1SYMBOL , 1LINE, 10
1 , 11 . 3333331 . 6666672 , 22.3333342.6666673 , 33. 3333333. 6666674 , 4
LINE, 10
1 , ZI , 21 , 34 , 2, .7 , 1.9 ,, 1.9 , .4 ,
,-1 , 0 , .1
, 1 . s>0«OOO-J>
, 1 . 666667
, 2.333334, 2.666667
, 3.333333, 3.666667
,!,!,.!
, 90 ,Y-AXIS , U , X *"" A X 15b
1.333333 , 11.666667 , 12 , 1.4142142.333334 , 12.666667 , 13 , 1.7320513.3333333.666667
.154701
.290995
.527525
.632993
.825742
.914854
LINE, 10 , 0 , 1 , . 1
1.154701 , 1.3333331.290995 , 1.6666671.414214 , 21.527525 , 2.3333341.632993 , 2.6666671.732051 , 31.825742 , 3.3333331.914854 , 3.6666672 , 4
COMMENT, LOWER RIGHT CORNERPLOT, 5 , 0 ,-3SYMBOL, -1 , 1 , 4 , .05 , 3 ,SYMBOL, 1 , 1. 15 , 3.85 , . 1SYMBOL ,-1,4, 3,. 05, 3,SYMBOL, 1 , 4.15 , 2.85 , .1SYMBOL, -1 , 2 , 1 , .05 , 3 ,SYMBOL, 1 , 2. 15 , .85 , . 1 ,COMMENT, UPPER RIGHT CORNERPLOT, 0 , 5 ,-3SYMBOL, 1 , 2.5 , 2.5 , .15 ,SYMBOL, 1 , 2.5 , 2.5 , . 15 ,SYMBOL, 1 , 2.5 , 2.5 , . 15 ,SYMBOL, 1 , 2.5 , 2.5 , . 15 ,
0, 0 ,PT-10
, 0 ,FT-200 ,PT-3
0 , EXi45 , E90 , E135 ,
EXAMPLE 2 EXAMPLE 2 EXAMPLE 2 EXAMPLE 2
19
SYMBOLSYMBOLSYMBOLSYMBOLPLOT , -
»tti5
1111»"
>t»,
-5
H? .2.2.2.»""
5555 3
, 2.*"!>
M »' m*7
, *. .
, 2.
5555
ittt
PLOT, 5,0, 999
. 15 ,
.15 ,
.15 ,
.15 ,
180 ,225 ,270 ,315 ,
EXAMPLE 2 EXAMPLE 2 EXAMPLE 2 EXAMPLE 2
Example 2
CxampLa 2
cVy ro
^ >^ 5 r~
nto
on i i xcc
I
pr-i
X-RXIS
Figure 3. An example showing the use of most of the elementary commands available in the JKPLOT system.
SECTION VI. - WINDOWING AND ZOOMING BY MODIFYING AN INTERMEDIATE PLOT FILE
Every plot produced by the JKPLOT system has associated with it a page size specified by the values of the variables XPAGE and YPAGE in the initial call to the routine named PLOTS. Any plot instructions that, would cause the plotter to draw beyond these
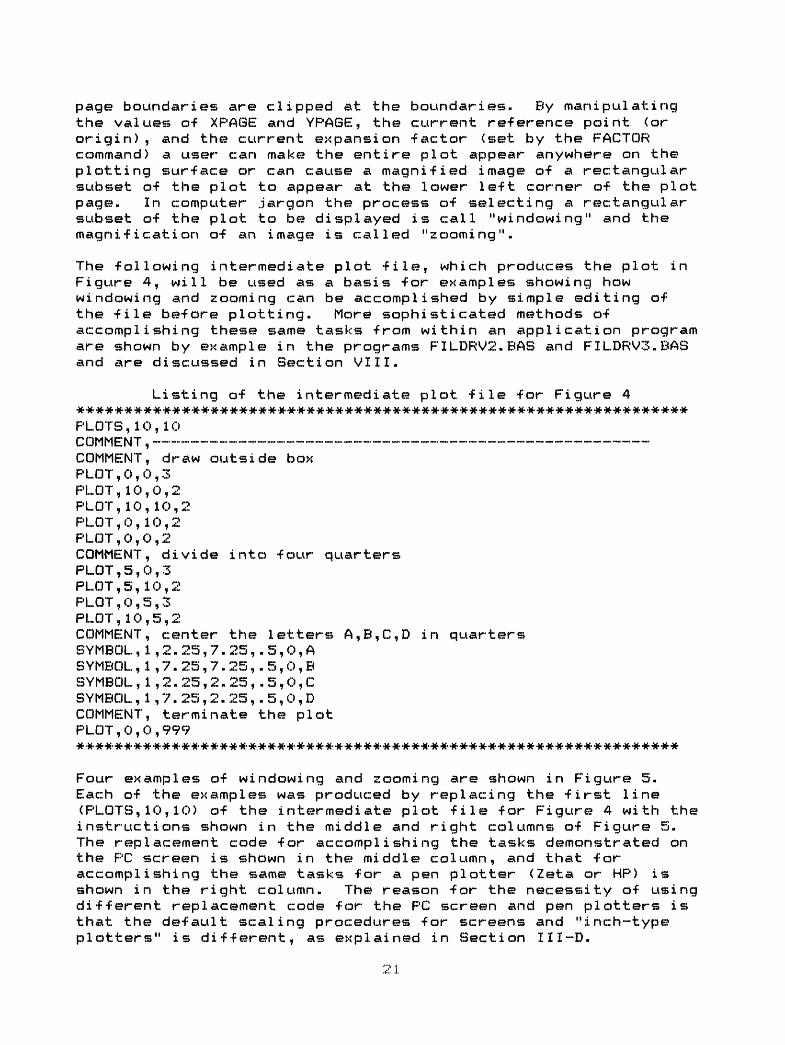
page boundaries are clipped at the boundaries. By manipulating the values of XPAGE and YPAGE, the current reference point (or origin) , and the current expansion -factor (set by the FACTOR command) a user can make the entire plot appear anywhere on the plotting surface or can cause a magnified image o-f a rectangular subset of the plot to appear at the lower left corner of the plot page. In computer .jargon the process of selecting a rectangular subset of the plot to be displayed is call "windowing" and the magnification of an image is called "zooming".
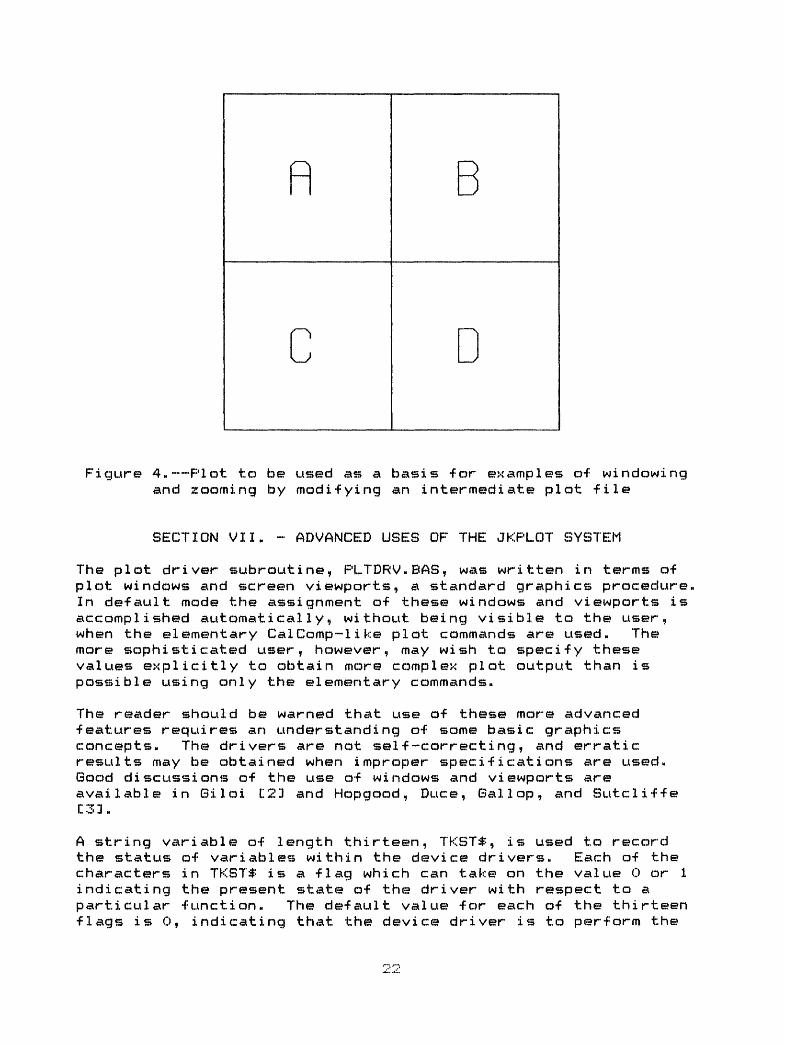
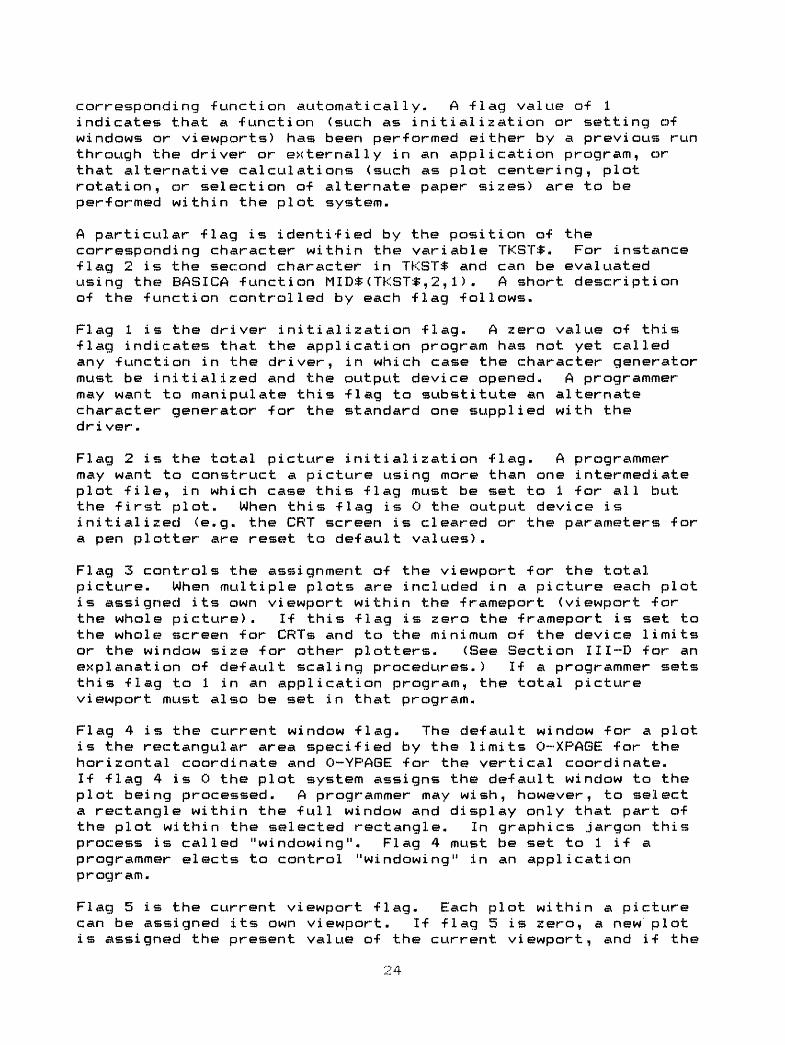
The following intermediate plot file, which produces the plot in Figure 4, will be used as a basis for examples showing how windowing and zooming can be accomplished by simple editing of the file before plotting. More sophisticated methods of accomplishing these same tasks from within an application program are shown by example in the programs FILDRV2.BAS and FILDRV3.BAS and are discussed in Section VIII.
Listing of the intermediate plot file for Figure 4
PLOTS, 10, 10
COMMENT, draw outside boxPLOT , 0 , 0 , 3PLOT, 10,0,2PLOT, 10, 10,2PLOT, 0,1 0,2PLOT, 0,0, 2COMMENT, divide into four quartersPLOT ,5,0,3PLOT, 5, 10, 2PLOT ,0,5,3PLOT, 10, 5, 2COMMENT, center the letters A,B,C,D in quartersSYMBOL , 1 , 2 . 25 , 7 . 25 , . 5 , 0 , ASYMBOL, 1 ,7.25,7.25, .5,0, BSYMBOL,! ,2.25,2.25, .5,0, CSYMBOL , 1 , 7. 25 , 2. 25 , . 5 , 0 , DCOMMENT, terminate the plotPLOT , 0 , 0 , 999
*##***####**###^
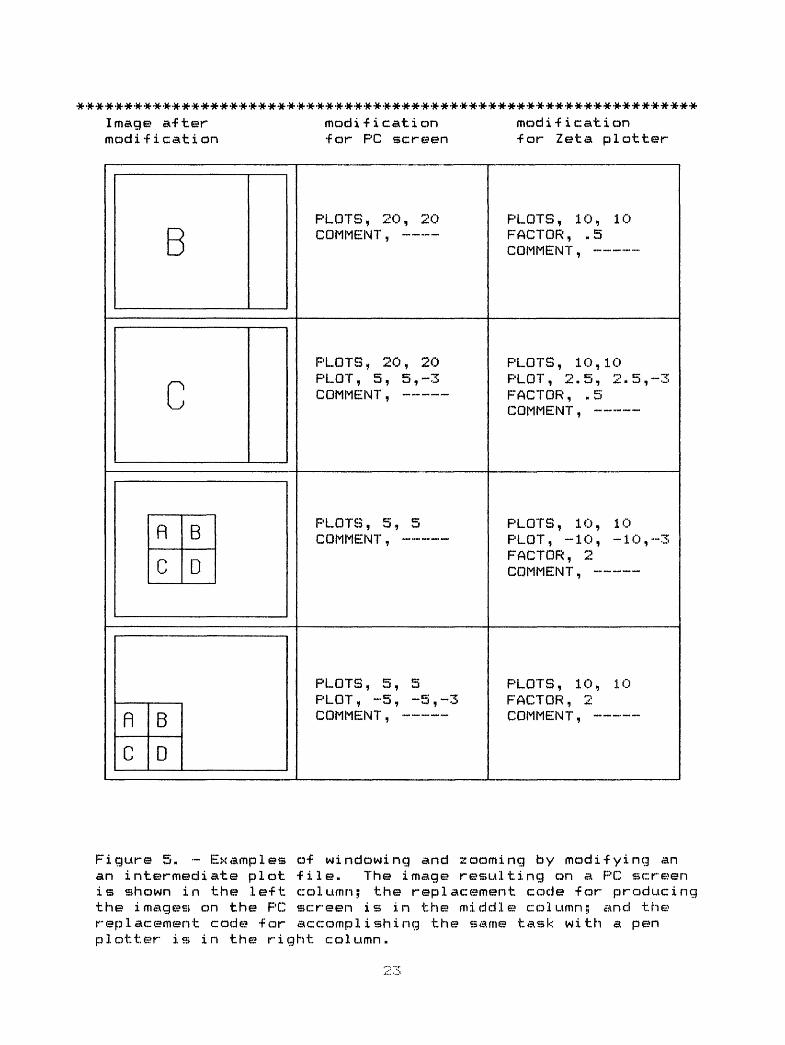
Four examples of windowing and zooming are shown in Figure 5. Each of the examples was produced by replacing the first line (PLOTS, 10, 10) of the intermediate plot file for Figure 4 with the instructions shown in the middle and right columns of Figure 5. The replacement code for accomplishing the tasks demonstrated on the PC screen is shown in the middle column, and that for accomplishing the same tasks for a pen plotter (Zeta or HP) is shown in the right column. The reason for the necessity of using different replacement code for the PC screen and pen plotters is that the default scaling procedures for screens and "inch-type plotters" is different, as explained in Section III-D.
c D
Figure 4. Plot to be used as a basis -for examples of windowing and zooming by modifying an intermediate plot file
SECTION VII. - ADVANCED USES OF THE JKPLOT SYSTEM
The plot driver subroutine, PLTDRV.BAS, was written in terms of plot windows and screen viewports, a standard graphics procedure, In default mode the assignment of these windows and viewports is accomplished automatically, without being visible to the user, when the elementary CalComp~like plot commands are used. The more sophisticated user, however, may wish to specify these values explicitly to obtain more complex plot output than is possible using only the elementary commands.
The reader should be warned that use of these more advanced features requires an understanding of some basic graphics concepts. The drivers are not self-correcting, and erratic results may be obtained when improper specifications are used. Good discussions of the use of windows and viewports are available in Giloi C23 and Hopgood, Duce, Gallop, and Sutcliffe C33.
A string variable of length thirteen, TKST$, is used to recordthe status characters indi cati ng parti cular f 1 ags is 0,
of variables within the device drivers. Each of the in TKST$ is a flag which can take on the value 0 or 1 the present state of the driver with respect to a function. The default value for each of the thirteen indicating that the device driver is to perform the
### *## * * * *## *########### *-a***********^Image after modification modification modification for PC screen for Zeta platter
BPLOTS, 20, 20 COMMENT,
PLOTS, 10, 10 FACTOR, .5 COMMENT, --
CPLOTS, 20, 20 PLOT, 5, 5,~3 COMMENT, -
PLOTS, 10,10 PLOT, 2.5, 2.5, FACTOR, .5 COMMENT,
PLOTS, 5, 5 COMMENT, -
PLOTS, 10, 10 PLOT, -10, -10, FACTOR, 2 COMMENT,
fl B
D
PLOTS, 5, 5 PLOT, ~"5 , o , ->
PLOTS, 10, 10 FACTOR, 2 COMMENT, -
Figure 5. Examples of windowing and zooming by modifying an .ate plot file. The image resulting on a PC screeian intermediate plot file. The image resulting on a PC screen
is shown in the left column; the replacement, code for producing the images on the PC screen is in the middle column;! and the replacement code far accomplishing the same task with a pen p1 atter is in the right co1umn.
corresponding -function automatically. A -flag value o-f 1 indicates that a -function (such as initialization or setting o-f windows or viewports) has been performed either by a previous run through the driver or externally in an application program, or that alternative calculations (such as plot centering, plot rotation, or selection o-f alternate paper sizes) are to be performed within the plot system.
A particular flag is identified by the position of the corresponding character within the variable TKST*. For instance flag 2 is the second character in TKST$ and can be evaluated using the BASICA function MID*<TKST*,2,1). A short description of the function controlled by each flag follows.
Flag 1 is the driver initialization flag. A zero value of this flag indicates that the application program has not yet called any function in the driver, in which case the character generator must be initialized and the output device opened. A programmer may want to manipulate this flag to substitute an alternate character generator for the standard one supplied with the dri ver.
Flag 2 is the total picture initialization flag. A programmer may want to construct a picture using more than one intermediate plot file, in which case this flag must be set to 1 for all but the first plot. When this flag is 0 the output device is initialized (e.g. the CRT screen is cleared or the parameters for a pen plotter are reset to default values).
Flag 3 controls the assignment of the viewport for the total picture. When multiple plots are included in a picture each plot is assigned its own viewport within the frameport (viewport for the whole picture). If this flag is zero the frameport is set to the whole screen for CRTs and to the minimum of the device limits or the window size for other plotters. (See Section III-D for an explanation of default scaling procedures.) If a programmer sets this flag to 1 in an application program, the total picture viewport must also be set in that program.
Flag 4 is the current window flag. The default window for a plot is the rectangular area specified by the limits 0-XPAGE for the horizontal coordinate and 0-YPAGE for the vertical coordinate. If flag 4 is 0 the plot system assigns the default window to the plot being processed. A programmer may wish, however, to select a rectangle within the full window and display only that part of the plot within the selected rectangle. In graphics jargon this process is called "windowing". Flag 4 must be set to 1 if a programmer elects to control "windowing" in an application program.
Flag 5 is the current viewport flag. Each plot within a picture can be assigned its own viewport. If flag 5 is zero, a new plot is assigned the present value of the current viewport, and if the
current viewport has not been assigned (the case -for the -first plot of a picture) it is given the value of the total picture viewport. In other words the default viewports are set equal to the frameport. If a programmer wishes to change the viewport when a new plot is initialized, -flag 5 must be set to 1.
Flag 6 controls the graphics mode initialization of the output device. If flag 6 is 0, the plot driver will set the output device to graphics mode. Otherwise this mode initialization must be accomplished in the application program.
Flag 7 determines whether the plot system will adjust the scale factors to preserve the aspect (or shape) of the plot. If a square window and a horizontally long rectangular viewport are selected for a plot, the raw scaling calculations will cause the square to be stretched in the horizontal direction to fill the viewport. For aspect-preserving scale factors, the viewport must be modified to represent the shape of the window. If flag 7 is 0 the viewport will be modified to preserve shape; otherwise the raw scale factors will not be adjusted. The modified viewport is called the clipping port in the JKPLQT system.
If flag 7 is 1, flag 8 has no function; but if flag 7 indicates that the scale factors are to be modified to preserve shape, the actual area for plotting is a subrectangle of the specified viewport. Two reasonable alternatives for placing this subrectangle within the viewport are to center it or to place it in the lower left corner. A 0 value for flag 7 indicates that the subrectangle is to be placed in the lower left corner of the viewport; a value of 1 indicates it is to be centered.
Flag 9 is the rotation flag. If a user wants to plot a tall, thin plot on a device that has a short, wide page shape, the resulting plot will occupy only a small portion of the output page. If the plot is rotated 90 degrees, however, better utilization of the output page will occur. If flag 9 is 0 no rotation will occur; if flag 9 is 1 the plot will be rotated 90 degrees.
Flag 10 is the paper size flag. Some plotters have more that one paper size available (e.g. the Hewlett Packard 7550A). When this flag is 1 the alternate paper size, as specified in the device specification code, is selected.
Flag 11 is reserved for use with applications of 3-dimensional plotting. A 3~dimensional plotting system should provide the capability for locating a 2-dimensional plot in 3-dimensional space and then projecting the resulting image onto a two dimensional image plane. In the JKPLQT plotting system the only reasonable place to trap the 2-dimensional coordinates for this type of transformation is in the plot driver. Flag 11, which is not used now, allows for expansion of the plotting system to include this type of graphics call.
Flag 12 is the endplot -flag. If a picture consists o-f the overlay o-f more than one subplot, the subplot instruction to terminate plotting must be ignored -for all but the last o-f the subplots. For the last o-f a sequence o-f subplots -flag 12 must be set to 0; otherwise it should have the value 1.
Flag 13 is the clipping enable -flag. When this -flag is 0 any instructions that would cause the pen (or pseudo pen) to move beyond the clipping window calculated by the most recent call to PLOTS are clipped at the boundary. In some cases a user might want to override this de-fault setting and move the pen beyond the clipping boundary. Such a situation would occur i-f the user is sending a number o-f plots to the Zeta plotter and wants to move the pen a -few inches beyond the boundary o-f the present plot in order to prepare the the beginning o-f the next plot. A value o-f 1 -for this -flag disables the clipping.
The system o-f thirteen graphics -function -flags adds great flexibility to the basic plotting system. In default mode, however, all -flag manipulations are handled internally by the plotting system; the applications programmer need not be concerned with them.
SECTION VIII. - CAPABILITIES AND USE OF THE THREE FILE-READING PLOT DRIVERS, FILDRV1.BAS, FILDRV2.BAS, AND FILDRV3.BAS
The most elementary -file-reading plot program included in this report is FILDRV1.BAS. When this program is executed the user is asked -for the name o-f one intermediate plot -file. The program checks to see that the speci-fied -file exists and then sends the plot to the plotter. When the plot is -finished a beep is sounded and the user must press the <ESCAPE> key to terminate the plot.
Up to ten plot -files with the same page size can be plotted using the program, FILDRV2.BAS. The user is prompted the names o-f up to ten plot -files. I-f -fewer than ten -files are required the list can be terminated by entering a blank -file name. As each -file name is entered the program checks to see that the -file exists and that the page size o-f all the -files is the same. The user is then asked i-f a window (subrectangle o-f the total plot) is to be selected. I-f the user enters N (-for no) the program overlays the plots. I-f the user enters Y (-for yes) to the window selection query, the boundaries o-f the window must be entered. The program then plots that portion o-f the total plot within the window, scaled to the default viewport. When the last plot is finished a beep is sounded, and the user must press the <ESCAPE> key to terminate the plot. The program then asks if another plot is to be made. If the answer is N the program ends, and if the answer is Y the user is asked whether the same files are to be used. The user can then enter a new file list and/or a new window and proceed as before.
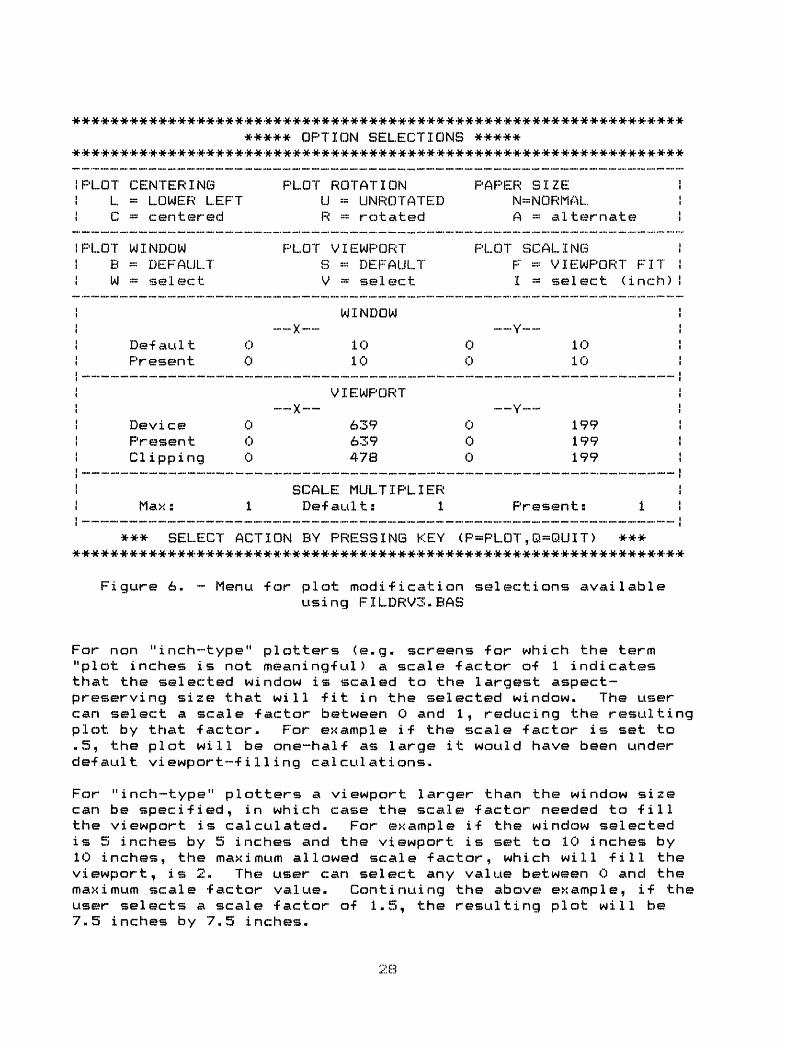
The more advanced driver, FILDRV3.BAS, is menu driven and allows the user to overlay up to teen plot -files, rotate the plot, center the plot, select alternate paper sizes, select windows and viewports, and to de-fine a non-de-fault scaling -factor. The user is -first asked to insert up to 10 plot -file names as in the program FILDRV2.BAS. A-fter the list of files has been entered the menu in Figure 6 (showing numbers used for the PC enhanced graphics screen) appears on the screen. Present selections are shown in upper case in this figure but are in reverse video on the screen.
Because of difficulties using the COLOR command to produce reverse video with the Hercules graphics, this driver will not work with the Hercules driver. Also, an "out of memory" error will occur when a user tries to merge FILDRV3.BAS, PLTDRV.BAS, and ZETASPEC.BAS to make a file-reading plot driver for the Zeta plotter. Enough memory can be made available by removing certain comments from the first two programs. An example in Appendix A shows which comments to remove and how to remove them.
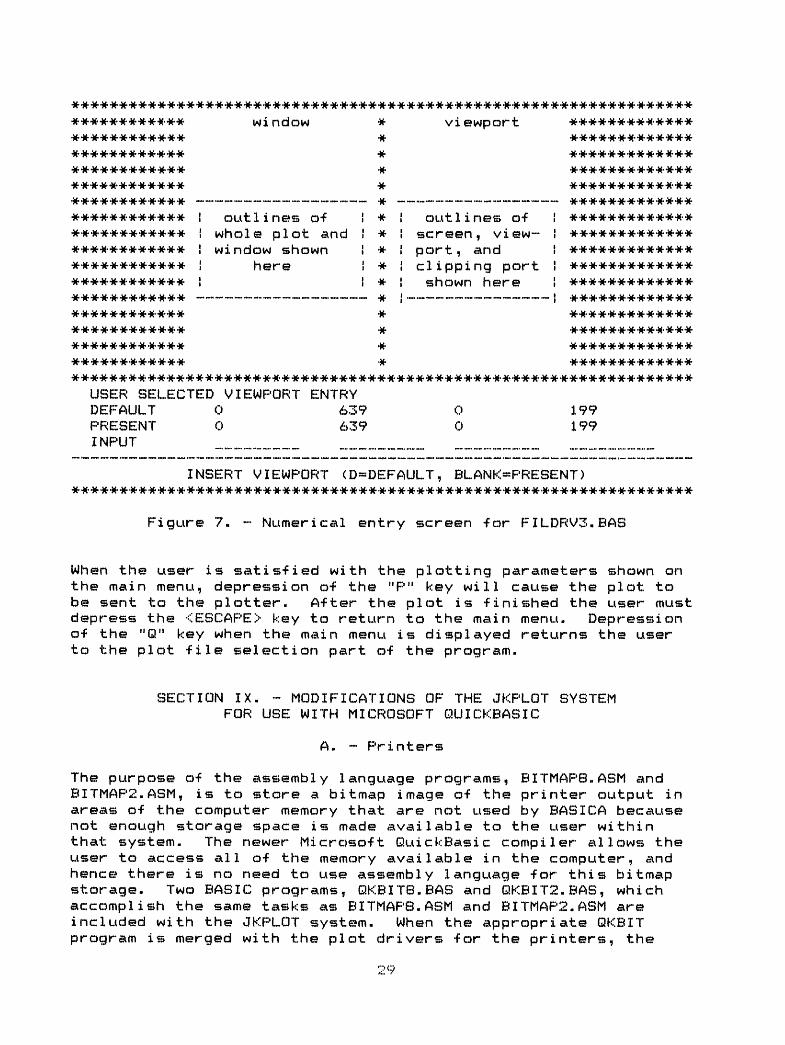
The user selects the function to be performed by pressing the key shown on the menu. The centering, rotation, and paper size selections are toggle type selections requiring no further entries to accomplish the function to be performed. If the user elects to specify a non-default window, viewport, or scale factor further numerical entries are required. In this case the menu is erased and the screen shows the present location of the window, viewport, and clipping boundary. The user is prompted for the numerical entry or entries at the bottom of the screen as shown in Figure 7. The cursor showing the present state of the entry can be moved to the left or right using the numerical keyboard left and right arrow keys respectively. If the user moves the cursor (either to the left or right) beyond the limits of an entry field, the cursor moves to the next field in the chosen direction. If the <RETURN> key is pressed the cursor is moved to the next field to the right. When the cursor is moved to the right of the rightmost field, numerical entry is terminated and the new window, viewport, and clipping port are displayed on the screen. If the user wants to re-enter the values the <ESCAPE> key must be pressed. Depression of any other key accepts the new entries and returns to the main menu.
Interpretation of the window and viewport entries is straightforward, but interpretation of the user-specified scaling entry depends upon which kind of plotter is being used. The window limits are specified in plot inches, and the window must lie within the page limits. The viewport limits are entered in inches if an "inch-type" plotter is being used or in device coordinates for non "inch-type" devices.
***** OPTION SELECTIONS *****
PLOT CENTERINGL = LOWER LEFT C = centered
PLOT WINDOWB = DEFAULT W - select
De-fault Present
Device Present Clipping
Max:
00
PLOT ROTATIONU = UNROTATED R =* rotated
PLOT VIEWPORTS = DEFAULT V ~ select
WINDOW
1010
VIEWPORT
639639478
PAPER SIZEN=NORMALA - alternate
PLOT SCALINGF « VIEWPORT FIT I « select (inch)
Y-
X-
00
000
1010
199199199
SCALE MULTIPLIER De-faults 1 Present:
*** SELECT ACTION BY PRESSING KEY (P»PLOT,Q«QUIT) ***
Figure 6. ~ Menu for plot modification selections availableusing FILDRV3.BAS
For non "inch-type" plotters (e.g. screens for which the term "plot inches is not meaningful) a scale factor of 1 indicates that the selected window is scaled to the largest aspect- preserving size that will fit in the selected window. The user can select a scale factor between 0 and 1, reducing the resulting plot by that factor. For example if the scale factor is set to .5, the plot will be one-half as large it would have been under default viewport-filling calculations.
For "inch-type" plotters a viewport larger than the window size can be specified, in which case the scale factor needed to fill the viewport is calculated. For example if the window selected is 5 inches by 5 inches and the viewport is set to 10 inches by 10 inches, the maximum allowed scale factor, which will fill the viewport, is 2. The user can select any value between 0 and the maximum scale factor value. Continuing the above example, if the user selects a scale factor of 1.5, the resulting plot will be 7.5 inches by 7.5 inches.
28
* sjaq.u-i.-id aqq.
WStf "ZdUNJLia U.DTU.M 'sya'ZJLia^a pu* Qtffl '
tq S-ILJ^. jo^- a6en6u«|; *-ia^.ndujOD aqq. ui axq
jail duo a jasn aujq.
^^ pasn ^.ou
q.o-[d au.q. u,q.TM pa&jauu ST tuaq.sAs loid^P ®M3 MIT pepntaut
awes aqq. U.ST
utpue
asn o^ paau ou st ajaqq. aauaij aqq, j-o tt^ ssaDDp o^. jasn w ^lawau am -uua^sAs
s T aseds a6e^io^s t|6noua Ajouiaw .jaq.nduuoD aqq. q e ajo"4s o^. si *WSy
^.o asodjnd atjj.
HUM asnN31SAS3H1 dO"XI NOI1G3S
jasn aujq. sujn^aj paA^-fdsip ST nuaw uteiw BL|^. uaujM Aa^ ..Q,, aqq. oTSsa-jdaa -nuaui uteiw aq^. oq. Uwin^a^i oq. Aa:^ <3dyoS3> ^M^
-lasn aqq. paLisTUt^ ST ^.oid aq^. jaq.^y 'wia^^oid aL|^ o^. q.uas aq oq. ^o-[d aqq. asnpD 11 TM Aa:^ ..d,, aqq. ^-o uotssajdap 'nuauj utetu
uo UMoqs s-iaq.aiw^j^d butq.^ofd auj^ LJ^TM pat ̂.s T:|.\=>S s T .jasn aqq.
uaajDS Ajq.ua
66 T 66 T
****************************************************************************************************************************************************************************************************************
UMOLJS Butddt ID
pue * q. jod A *uaaJDS
****************
6296£9
0o
lN3S3dd
UMOLJS MOpUTM
q.o-[d a-[OL|M sautfq.no
MOpUTM
Q3JL3313S d3Sn { ********** ************************************************************************************************************************************************************************************************
user can then proceed to use the drivers just as -for the case of using the compiled PC screen driver. The procedure for making a file reading device driver -for an Epson printer in high resolution is shown in Appendix B.
B. PC Screen with enhanced graphics
The SCREEN command available in the BASICA compiler used -for development o-f the JKPLOT system cannot specify the enhanced graphics screen. Access to the EGA screen is available only through the use o-f system interrupts, which requires the use o-f assembly language programs. This access is provided by the program, EGAASM.ASM. The QuickBasic compiler allows the specification of the EGA screen and performs the standard graphics functions on that screen, and thus there is no need to use an assembly language program. The program, QKEGASP.BAS (QuickBasic enhanced graphics specifications), is a device specification program very similar to PCSPECH.BAS and can be utilised in device drivers the same way as that program.
C. - PC SCREEN WITH HERCULES GRAPHICS
In Section IV-C, the procedures for compiling and linking the programs HERCSPEC.BAS and HERCASM.ASM with an application program were explained. In that explanation it was noted that use of the link-controlling program, LN.ASM, was not required; however when using these programs with the QuickBasic compiler a link- controlling program is required. The object module for such a program, PREFIX.OBJ, is provided with the QuickBasic compiler and can be used in the same way as the LN.OBJ abject module is used when compiling the printer drivers using the BASICA compiler.
SECTION X. - CONCLUSION
The JKPLOT basic plot system providers a simple graphics interface between an IBM PC compatible microcomputer and a variety of platting devices. The programs are written in an elementary language and are structured to make it easy for a user to modify the system to fit unique needs.
SECTION XI. - REFERENCES
1. ACM/SIGGRAPH Graphics Standards Planning Committee, First report of the CORE definition subgroup, preliminary draft, 1977.
2. Giloi, Wolfgang K., 1978, Interactive computer graphics,data structures, algorithms, languages: Prentice-Hall, Inc., Englewood Cliffs, New Jersey, 354 p.

3. Hopgood, F. R. A., Duce, D. A., Gallop, J. R., andSutcliffe, D. C., 1983, Introduction to the graphics kernel system <GKS): Academic Press, New York, 200 p.
4. Programming CALCQMP Electromechanical Plotters, 1976, California Computer Products, Inc., 32 p.
31
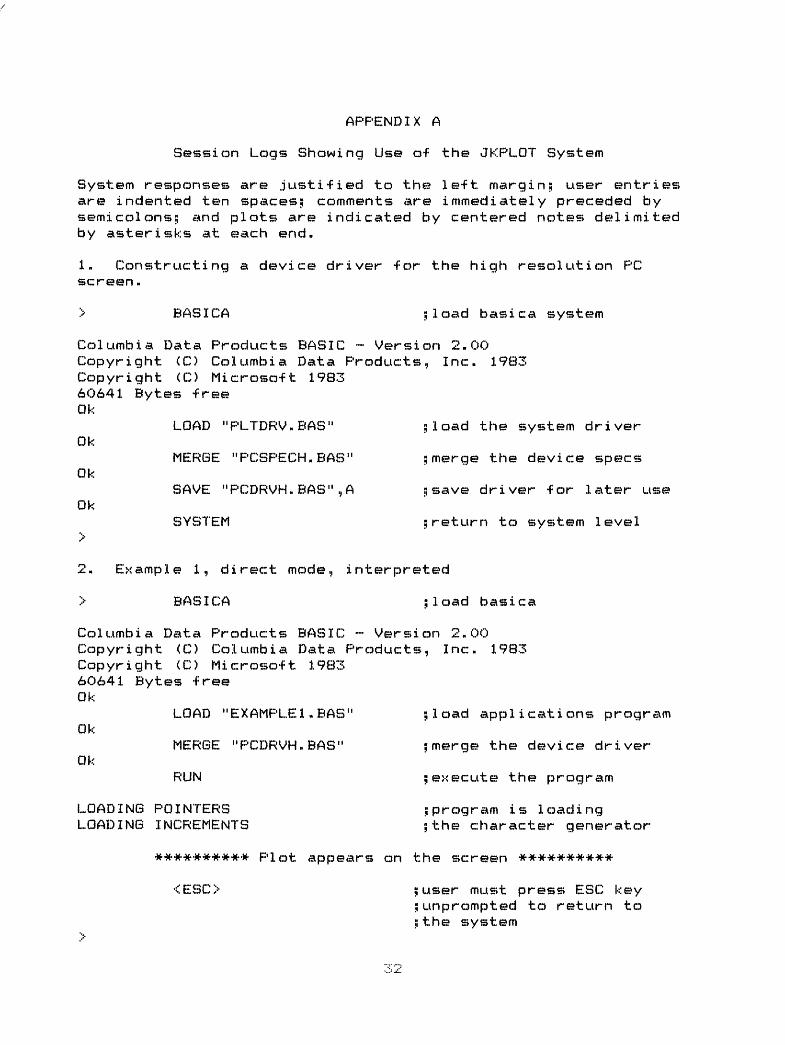
APPENDIX A
Session Logs Showing Use of the JKPLQT System
System responses are justified to the left margin; user entries are indented ten spaces;! comments are immediately preceded by semicolons^ and plots are indicated by centered notes delimited by asterisks at each end.
1. Constructing a device driver for the high resolution PC screen.
> BASICA 5 load basica system
Columbia Data Products BASIC - Version 2.CO Copyright (C) Columbia Data Products, Inc. 1983 Copyright (C) Microsoft 1983 60641 Bytes free Ok
LOAD "PLTDRV.BAS" 51oad the system driver Ok
MERGE "PCSPECH.BA8" 5 merge the device specs Ok
SAVE "PCDRVH.BAS",A 5 save driver for later use Ok
SYSTEM ;return to system level '>
2. Example 1, direct mode, interpreted
> BASICA ijload basica
Columbia Data Products BASIC ~ Version 2.00 Copyright <C) Columbia Data Products, Inc. 1983 Copyright <C) Microsoft 1983 60641 Bytes free Ok
LOAD "EXAMPLE1.BAS" 51oad applications program Ok
MERGE "PCDRVH.BAS" \ merge the device driver Ok
RUN 5 execute the program
LOADING POINTERS 5 program is loading LOADING INCREMENTS 5 the character generator
### * * * *#* * Plot appears on the screen #*# *####* *
<E8C> 5 user must press ESC key;unprompted to return to 5 the system
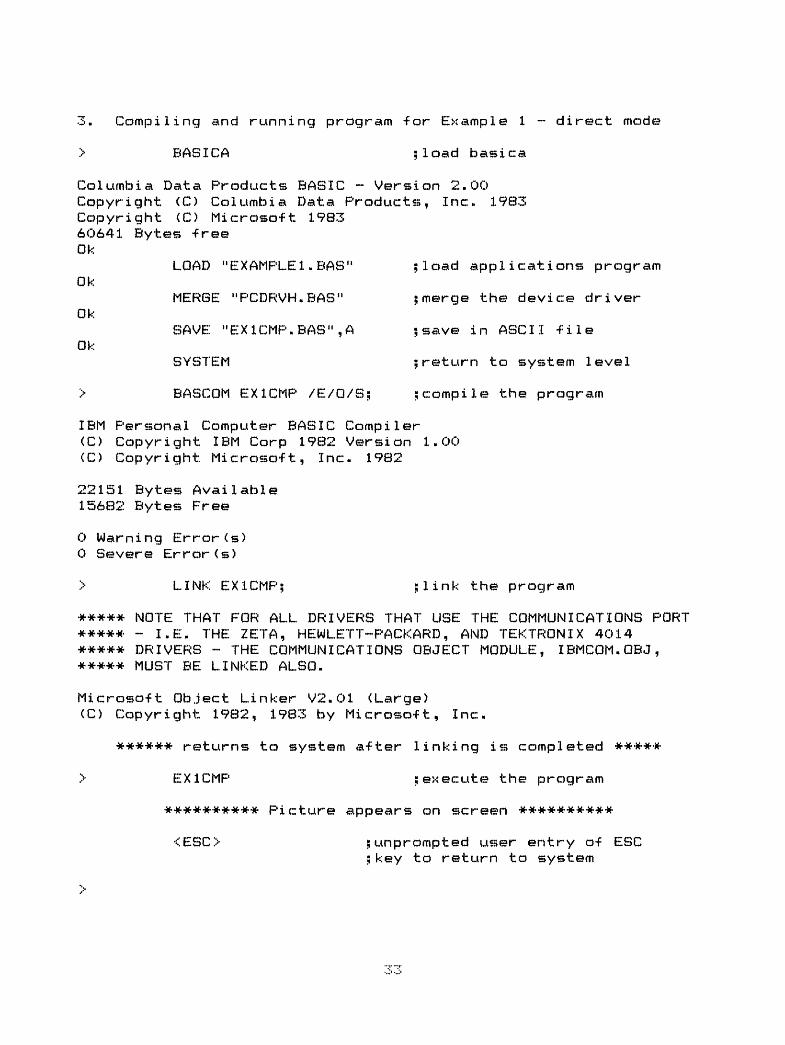
3. Compiling and running program -for Example 1 - direct mode
> BASICA 5 load basica
Columbia Data Products BASIC - Version 2.00 Copyright (C) Columbia Data Products, Inc. 1983 Copyright (C) Microsoft 1983 60641 Bytes -free Ok
LOAD "EXAMPLE 1.BAS" 5 load applications program Ok
MERGE "PCDRVH.BAS" 5 merge the device driver Ok
SAVE "EX1CMP.BAS",A 5 save in ASCII -file Ok
SYSTEM ;return to system level
> BASCOM EX1CMP /E/O/S; ;compile the program
IBM Personal Computer BASIC Compiler<C> Copyright IBM Corp 1982 Version 1.00(C) Copyright Microsoft, Inc. 1982
22151 Bytes Available 15682 Bytes Free
0 Warning Error(s) 0 Severe Error<s)
> LINK EX1CMP; ;link the program
***** NOTE THAT FOR ALL DRIVERS THAT USE THE COMMUNICATIONS PORT***** - I.E. THE ZETA, HEWLETT-PACKARD, AND TEKTRONIX 4014***** DRIVERS - THE COMMUNICATIONS OBJECT MODULE, IBMCOM.OBJ,***** MUST BE LINKED ALSO.
Microsoft Object Linker V2.01 (Large)(C) Copyright 1982, 1983 by Microsoft, Inc.
****** returns to system after linking is completed *****
> EX1CMP ;execute the program
********** Picture appears on screen **********
<ESC> 5 unprompted user entry of ESC5 key to return to system
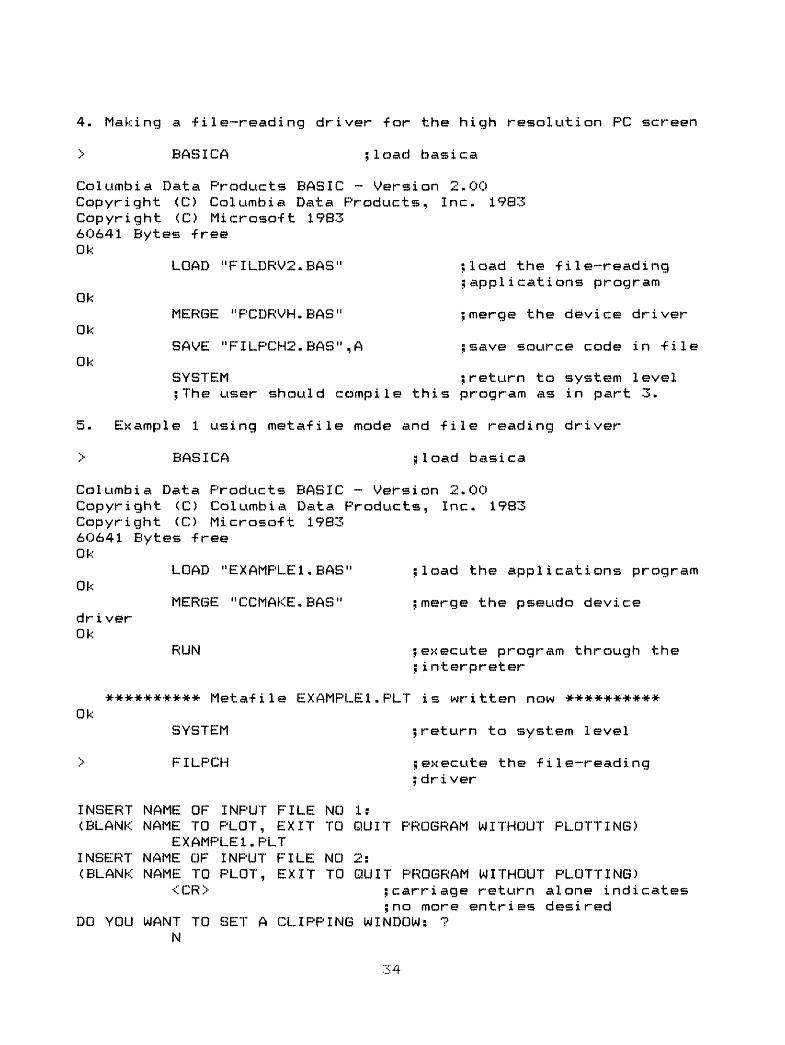
4. Making a -file-reading driver -for the high resolution PC screen
> BASICA ;load basica
Columbia Data Products BASIC ~ Version 2.00 Copyright (C) Columbia Data Products, Inc. 1983 Copyright (C) Microso-ft 1983 60641 Bytes -free Ok
LOAD "FILDRV2.BAS" ; 1 oad the -file-reading;applicat ions program
OkMERGE "PCDRVH.BAS" ;merge the device driver
OkSAVE "FILPCH2.BAS" ,A ; save source code in -file
OkSYSTEM ;return to system level5 The user should compile this program as in part 3.
5. Example 1 using metafile mode and -file reading driver
> BASICA .sload basica
Columbia Data Products BASIC - Version 2.00 Copyright (C) Columbia Data Products, Inc. 1983 Copyright <C> Microso-ft 1983 60641 Bytes free Ok
LOAD "EXAMPLE1.BAS" ;1oad the applications program Ok
MERGE "CCMAKE.BAS" ;merge the pseudo device dri ver Ok
RUN 5 execute program through thej interpreter
********** Metafile EXAMPLE1.PLT is written now ********** Ok
SYSTEM ;return to system level
> FILPCH ;execute the file-reading;dri ver
INSERT NAME OF INPUT FILE NO 1:(BLANK NAME TO PLOT, EXIT TO QUIT PROGRAM WITHOUT PLOTTING)
EXAMPLEl.PLTINSERT NAME OF INPUT FILE NO 2: (BLANK NAME TO PLOT, EXIT TO QUIT PROGRAM WITHOUT PLOTTING)
<CR> ;carriage return alone indicates5 no more entries desired
DO YOU WANT TO SET A CLIPPING WINDOW: ?N
34
*# *###*### plot appears on screen *#**#**#*#
<ESC> ; unprompted user entry of ESC; key clears the screen
DO YOU WANT ANOTHER PLOT: ? N
6. Making a file-reading plot driver for the EPSON printer in high resolution
> BASICA 5 load basica
Columbia Data Products BASIC - Version 2.00 Copyright (C) Columbia Data Products, Inc. 19S3 Copyright (C) Microsoft 1983 60641 Bytes free Ok
LOAD "FILDRV2.BAS" ; 1 oad the file-reading; application program
OkMERGE "PLTDRV.BAS" ; merge the plot system driver
OkMERGE "EPSPECH.BAS" 5 merge the specification for
;for the EPSON printer in high ; resolution
OkSAVE "FILEPH2.BAS" ,A ; save source code in ASCII file
OkSYSTEM ; return to system level
> BASCOM FILEPH2 /E/O/Sii ; compile the program
IBM Personal Computer BASIC Compiler(C) Copyright IBM Corp 1982 Version 1 . OO(C) Copyright Microsoft, Inc. 19S2
22151 Bytes Available 12584 Bytes Free
0 Warning Error <s) 0 Severe Error <s)
> MASM BITMAPS. ASM; ; assemble the bitmap programjfor high resolution plot
The Microsoft MACRO Assembler, Version 1.25 Copyright (C) Microsoft Corp 19S1,S2,83
47404 Bytes free
Warning Severe Errors Errors 0 0 ;assembly complete
> MASM LN.ASM; ; assemble dummy program for;control ling the linker
The Microsoft MACRO Assembler, Version 1.25 Copyright (C) Microsoft Corp 1981,82,83
49722 Bytes free
Warning Severe Errors Errors 0 0 ;assembly complete
> LINK FILEPH2H-LNH-BITMAP8; ;Link object files
Microsoft Object Linker V2.01 (Large)(C) Copyright 1982, 1983 by Microsoft, Inc.
> ;execution module, FILEPH2.EXE, has now been made
7. Drawing upper left quarter of Example 2 plot (zooming), interpreted metafile mode, using compiled file-reading driver for the EPSON printer in high resolution
> BASICA ;load basica
Columbia Data Products BASIC - Version 2.00 Copyright (C) Columbia Data Products, Inc. 1983 Copyright (C) Microsoft 1983 60641 Bytes free Ok
LOAD "EXAMPLE2.BAS" ?load the applications program Ok
MERGE "CCMAKE.BAS" ;merge the pseudo device driver Ok
> RUN ;execute the program through;the interpreter
INSERT PLOT FILE NAME:EXAMPLE2.PLT ;output file name was not
;specified in applications ;program
UPPER LEFT CORNER 5 driver is printing comment LOWER LEFT CORNER ;lines on the screen LOWER RIGHT CORNER UPPER RIGHT CORNER
DONE 5 metafile is now finished
> FILEPH2 5 execute the file-reading; driver for the EPSON printer
INSERT NAME OF INPUT FILE NO 1:(BLANK NAME TO PLOT, EXIT TO QUIT PROGRAM WITHOUT PLOTTING)
EXAMPLE 2.PLT ; enter plot file name INSERT NAME OF INPUT FILE NO 2: (BLANK NAME TO PLOT, EXIT TO QUIT PROGRAM WITHOUT PLOTTING)
<CR> 5 carriage return alone; terminates filename entry
DO YOU WANT TO SET A CLIPPING WINDOW?Y
THE PLOT PAGE DIMENSIONS ARE: 10 10
ENTER LOWER AND UPPER X VALUES:0,5
ENTER LOWER AND UPPER Y VALUES:5,10
CONSTRUCTING BITMAP IMAGE ON COMPUTER MEMORY; the program now constructs the bitmap image of the ; picture in the computer memory
UPPER LEFT CORNER ; comment lines are printed on LOWER LEFT CORNER ;the screen as the bitmap is LOWER RIGHT CORNER ; being constructed UPPER RIGHT CORNER-
SENDING IMAGE TO PRINTER ;the printer now begins to receive; the image
DO YOU WANT ANOTHER PLOT? ;plot is finishedN 5 terminate the program
7. Making a file-reading plot driver for Hercules graphics
> BASICA 5 load basica
Columbia Data Products BASIC ~ Version 2.00 Copyright (C) Columbia Data Products, Inc. 1983 Copyright (C) Microsoft 1983 60641 Bytes free Ok
LOAD "FILDRV2.BAS" ;load the file-reading;application program
OkMERGE "PLTDRV.BAS" 5 merge the plot system driver
Ok
MERGE "HERCSPEC.BAS" ; merge the specification for;for Hercules graphics
OkSAVE "FILHERC2.BAS",A ; save source code in ASCII file
OkSYSTEM 5 return to system level
> BASCOM F1LHERC2 /E/O/S; ;compile the program
IBM Personal Computer BASIC Compiler(C) Copyright IBM Corp 1982 Version 1.00(C) Copyright Microsoft, Inc. 1982
22151 Bytes Available 12328 Bytes Free
0 Warning Error<s) 0 Severe Error(s)
> MASM HERCASM.ASM? ;assemble the bitmap program;far high resolution plot
The Microsoft MACRO Assembler, Version 1.25 Copyright (C) Microsoft Corp 1981,82,83
49694 Bytes free
Warning Severe Errors Errors 0 0 ;assembly complete
> LINK FILHERC2H-HERCASM; 5 Link object files
Microsoft Object Linker V2.01 (Large)(C) Copyright 1982, 1983 by Microsoft, Inc.
> 5 execution module, FILHERC2.EXE, has now been made
8. Making a file-reading plot driver for enhanced graphics
> BAS1CA ;load basica
Columbia Data Products BASIC - Version 2.00 Copyright <C) Columbia Data Products, Inc. 1983 Copyright (C) Microsoft 1983 60641 Bytes free Ok
LOAD "FILDRV2.BAS 11 ;load the file-reading;application program
OkMERGE "PLTDRV.BAS" 5 merge the plot system driver
OkMERGE "EGA8PEC.BA8" ; merge the specification -for
;-for the enhanced graphics Ok
SAVE "FILEGA2.BAS",A 5 save source code in ASCII *iI e Ok
SYSTEM ;return to system level
> BASCOM FILEGA2 /E/O/S; ;compile the program
IBM Personal Computer BASIC Compiler(C) Copyright IBM Corp 1982 Version 1.00(C) Copyright Microso-ft, Inc. 1982
22151 Bytes Available 12584 Bytes Free
0 Warning Error(s) 0 Severe Error(s)
> MASM EGAASM.ASM; ;assemble the bitmap programjj-for high resolution plot
The Microso-ft MACRO Assembler, Version 1.25 Copyright (C) Microso-ft Corp 1981,82,83
49694 Bytes -free
Warning SevereErrors Errors0 0 ;assembly complete
> LINK FILEGA2+EGAASM; ;Link object -files
Microso-ft Object Linker V2.01 (Large)(C) Copyright 1982, 1983 by Microso-ft, Inc.
> ;execution module, FILEGA2.EXE, has now been made
9. Drawing upper le-ft quarter o-f Example 2 plot (zooming), interpreted meta-file mode, using compiled -file-reading driver for the PC screen with enhanced graphics.
> BASICA ;load basica
Columbia Data Products BASIC - Version 2.00 Copyright (C) Columbia Data Products, Inc. 1983 Copyright (C) Microso-ft 1983 60641 Bytes -free Ok
LOAD "EXAMPLE2.BAS" 51oad the applications program
OkMERGE "CCMAKE.BAS" ; merge the pseudo device driver
Ok
> RUN 5 execute the program through; the interpreter
INSERT PLOT FILE NAME:EXAMPLE2.PLT ; output -file name was not
5 specif i ed in applications ; program
UPPER LEFT CORNER 5 driver is printing comment LOWER LEFT CORNER -lines on the screen LOWER RIGHT CORNER- UPPER RIGHT CORNER
DONE ; met a-f i 1 e i s now f i n i shed
> F 1 L E! G A 2 5 (s x e cute t h e f i 1 e - r e a d i n gj driver for the EPSON printer
INSERT NAME OF INPUT FILE NO Is(BLANK NAME TO PLOT, EXIT TO QUIT PROGRAM WITHOUT PLOTTING)
EXAMPLE 2.PLT ; enter plot file name INSERT NAME OF INPUT FILE NO 2: (BLANK NAME TO PLOT, EXIT TO QUIT PROGRAM WITHOUT PLOTTING)
<CR> 5 carriage return alone; terminates filename entry
DO YOU WANT TO SET A CLIPPING WINDOW?Y
THE PLOT PAGE DIMENSIONS ARE: 10 10
ENTER LOWER AND UPPER X VALUES:0,5
ENTER LOWER AND UPPER Y VALUES:5, 10
CONSTRUCTING BITMAP IMAGE ON COMPUTER MEMORYlithe program now constructs the bitmap image of the ; picture in the computer memory
UPPER LEFT CORNER ; comment lines are printed on LOWER LEFT CORNER ; the screen as the bitmap is LOWER RIGHT CORNER i being constructed UPPER RIGHT CORNER
SENDING IMAGE TO PRINTER ; the printer now begins to receive; the image
DO YOU WANT ANOTHER PLOT? 5 pi at is finishedN ;terminate the program
40
10. Removing comments -from FILDRV3. BAS and PLTDRV.BAS to make room in memory -for 2ETASPEC. E<AS to be merged.
>BASICA ;load basica
Columbia Data Products BASIC - Version 2.00 Copyright (C) Columbia Data Products, Inc. 1983 Copyright (C) Microsoft 1983 60641 Bytes free Ok
LOAD "FILDRV3.BAS"Ok
Ok
Ok
MERGE "PLTDRV.BAS"
SAVE "TMP.BAS"
MERGE "ZETASPEC.BAS"
Out of memory
Ok
Ok
Ok
Ok
Ok
Ok
1774 Ok
Ok
LOAD "TMP.BAS"
DELETE 1-10
DELETE 1000-1170
DELETE 30005-30090
DELETE 30200-30370
MERGE "ZETASPEC.BAS"
PRINT FRE(O)
SAVE "FILZT3.BAS",A
;load the file reader
;merge the device independent ; code
; save for later use
5 try to merge the device ;dependent Zeta code
;too much code - must try to ;make space by removing ;comments
;load judiciously saved ;previous merge
;deleting unneeded comments
5 try merge again
;see how much space is left
;save for compiling
41
APPENDIX B
Modi -fi cat ions For Microsoft QuickBasic
1. - General
Microso-ft QuickBasic is a compiler -for the BASIC language, very similar in -function to the IBM BASIC compiler used -for development o-f the JKPLQT system. Most o-f the examples shown in Appendix A can be translated -for use with QuickBasic by simply replacing the compiler program name, BASCQM, with the QuickBasic compiler program name, QB. The communications object module is named GWCOM.OBJ in the QuickBasic system and must be substituted for the IBMCQM.QBJ module used when linking drivers for the Zeta, Hewlett-Packard, and Tektronix 4014 drivers. The QuickBasic compiler, however, utilizes much more of the capacity of the computer, and when there is need -for interfaces to assembly language programs, changes in the procedures may be necessary. Drivers in the JKPLQT system for which changes are necessary are the printer drivers (Epson and Okidata high and low resolution), the Hercules driver, and the enhanced graphics driver.
Loading, merging, and saving BASIC programs with the interpreter are all accomplished exactly as shown in Appendix A. The QuickBasic system has a file editor that can be used for entering programs, and one might erroneously think that this editor can be used to accomplish the merging previously done with the interpreter. The QuickBasic editor, however, can only insert an external file into the one being edited; it cannot merge BASIC programs in the same way the interpreter does because the order of the program statements after merging with the interpreter is determined by the line numbers in the merged parts. The QuickBasic editor pays no attention to line numbers when inserting or appending programs.
2. - Printer Drivers
The drivers for the Epson and Okidata printers construct a bitmap image of what is to be plotted within the computer memory before sending anything to the printer. Because of the sise of the bitmap and the limited use of memory made by the IBM Compiler the bitmap construction programs were written in assembly language. The QuickBasic compiler can access all of available memory - enough to hold the bitmap - and thus there is no need for assembly language when using QuickBasic. Included with the JKPLOT system are two programs, QKBIT8.BAS and QKBIT2.BAS, which take the place of the assembly language programs, BITMAPS.ASM and BITMAP2.ASM. The appropriate QKBIT program must be merged with the BASIC printer driver, and compilation then proceeds in the standard way. The following example shows the procedure for constructin a file reading plot driver for the Epson printer with high resolution.
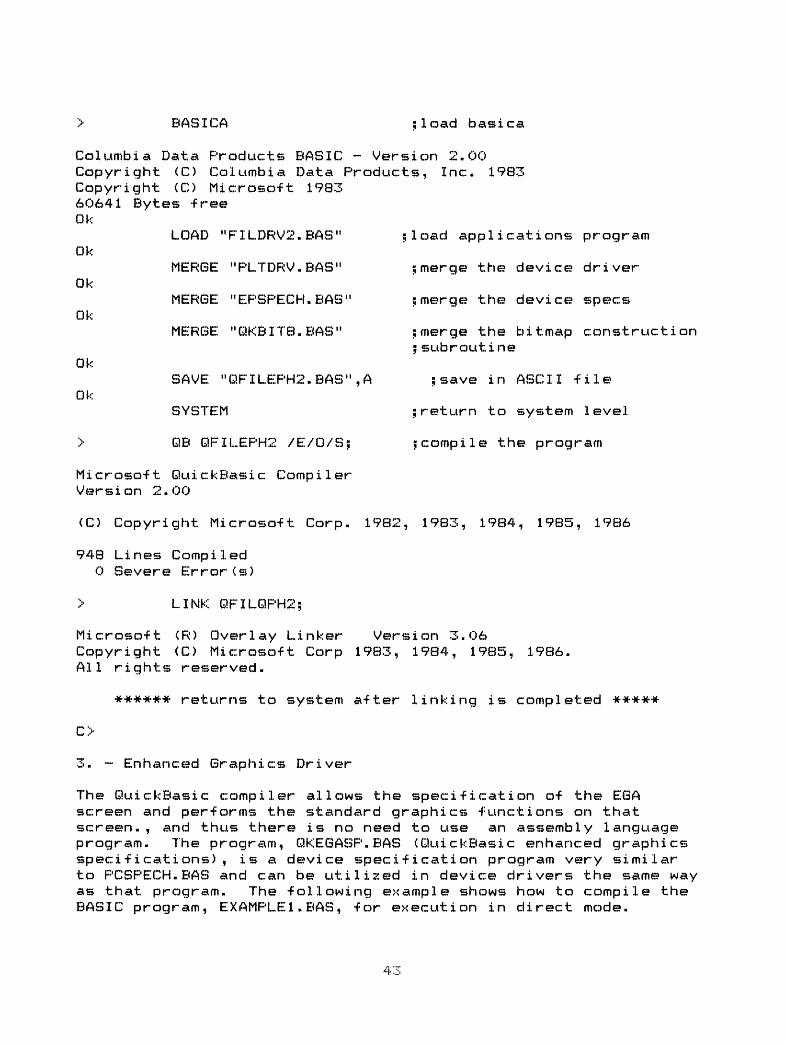
> BASICA jjload basica
Columbia Data Products BASIC - Version 2.00 Copyright (C) Columbia Data Products, Inc. 1983 Copyright (C) Microsoft 1983 60641 Bytes -free Ok
LOAD "FILDRV2.BAS" 5 1 oacl applications program Ok
MERGE "PLTDRV.BAS" ;merge the device driver Ok
MERGE "EPSPECH.BAS" ;merge the device specs Ok
MERGE "QKBIT8.BAS" ;merge the bitmap construction;subroutine
OkSAVE "QFILEPH2.BAS",A ;save in ASCII file
OkSYSTEM ;return to system level
> QB QFILEPH2 /E/O/S; ;compile the program
Microsoft QuickBasic Compiler- Version 2.00
(C) Copyright Microsoft Corp. 1982, 1983, 1984, 1985, 1986
948 Lines Compiled 0 Severe Error(s)
> LINK QFILQPH2;
Microsoft (R) Overlay Linker Version 3.06 Copyright (C) Microsoft Corp 1983, 1984, 1985, 1986. All rights reserved.
### **# returns to system after linking is completed ###*#
C>
3. - Enhanccsd Graphics Driver
The QuickBasic compiler allows the specification of the EGA screen and performs the standard graphics functions on that screen., and thus there is no need to use an assembly language program. The program, QKEGASP.BAS (QuickBasic enhanced graphics specifications), is a device specification program very similar to F'CSPECH.BAS and can be utilised in device drivers the same way as that program. The following example shows how to compile the BASIC program, EXAMPLE1 BAS, for execution in direct mode.
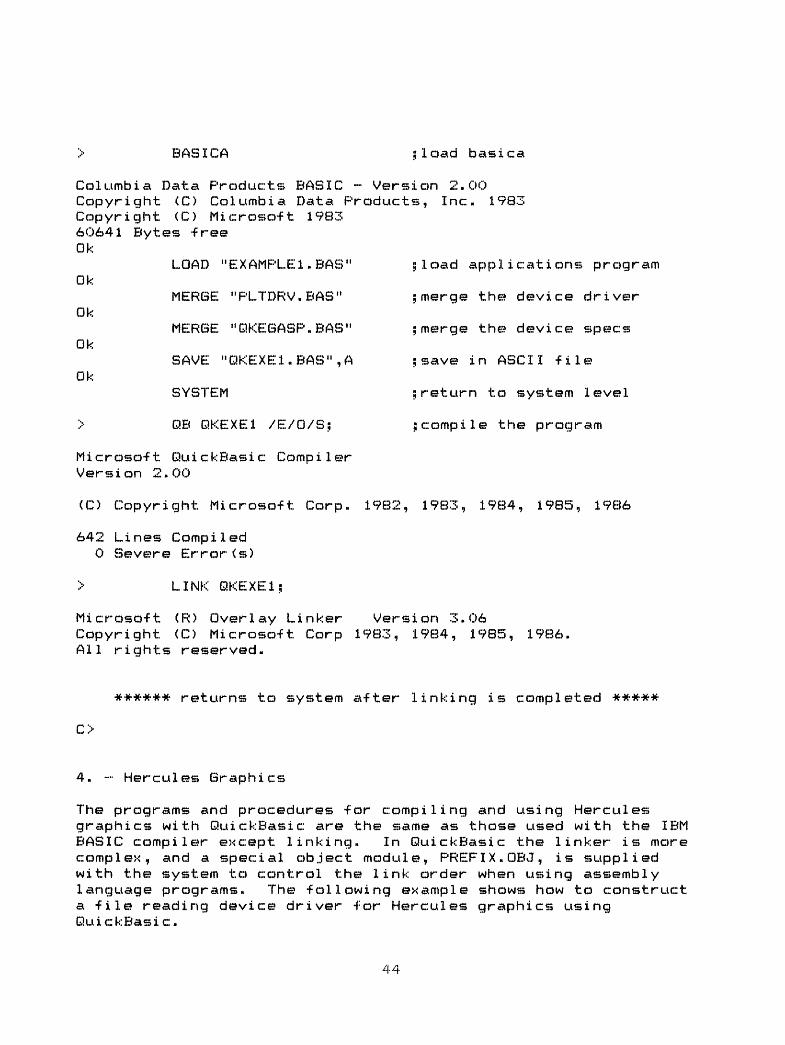
> BASICA ;load basica
Columbia Data Products BASIC - Version 2.GO Copyright (C) Columbia Data Products, Inc. 1983 Copyright (C) Microsoft 1983 60641 Bytes -free Ok
LOAD "EXAMPLE1.BAS" 5 load applications program Ok
MERGE "PLTDRV.BAS" ;merge the device driver Ok
MERGE "QKEGASP.BAS" ; merge the device specs Ok
SAVE "QKEXE1.BAS" ,A ; save in ASCII -file Ok
SYSTEM ;return to system level
> QB QKEXE1 /E/O/S; ;compile the program
Microsoft QuickBasic Compiler Version 2.00
(C) Copyright Microso-ft Corp. 1982, 1983, 1984, 1985, 1986
642 Lines Compiled 0 Severe Error <s)
> LINK QKEXE1;
Microso-ft <R> Overlay Linker Version 3.06 Copyright (C) Microsoft Corp 1983, 1984, 1985, 1986. All rights reserved.
# * * *# * returns to system after linking is completed # * * *#
C>
4. - Hercules Graphics
The programs and procedures for compiling and using Hercules graphics with QuickBasic are the same as those used with the IBM BASIC compiler except linking. In QuickBasic the linker is more complex, and a special object module, PREFIX.OBJ, is supplied with the system to control the link order when using assembly language programs. The fallowing example shows how to construct a file reading device driver for Hercules graphics using QuickBasic.
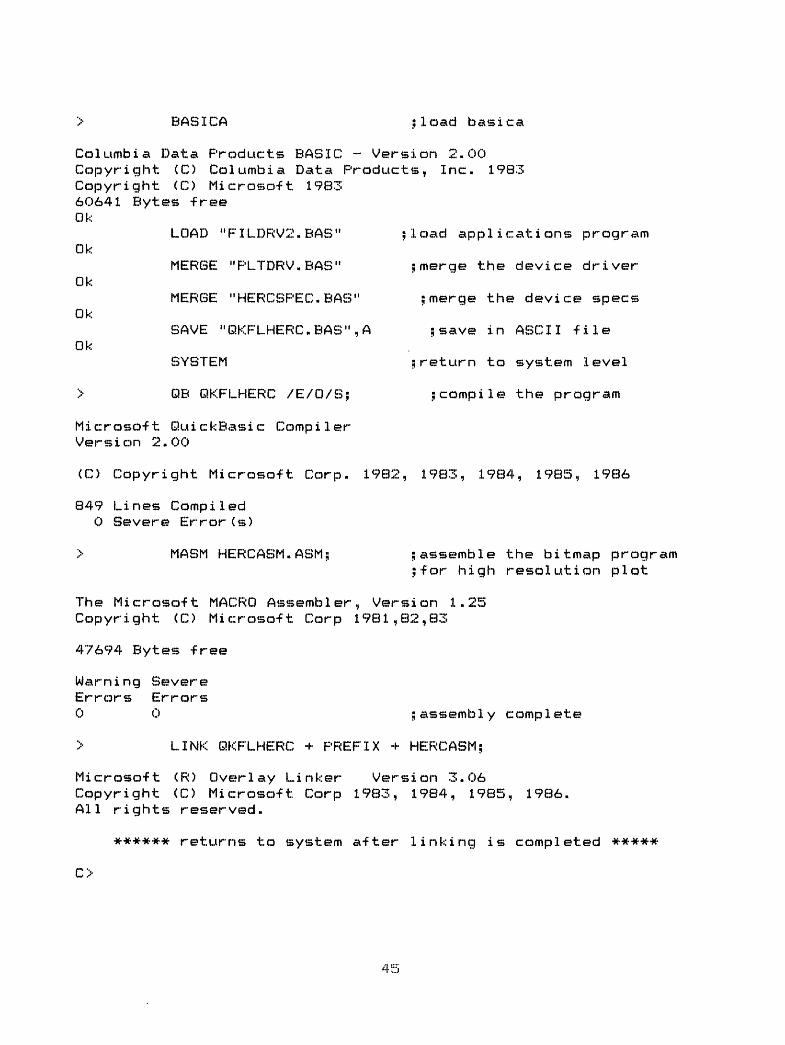
> BASICA ;load basica
Columbia Data Products BASIC - Version 2.00 Copyright (C) Columbia Data Products, Inc. 1983 Copyright (C) Microsoft 1983 60641 Bytes -free Ok
LOAD "FILDRV2.BAS" 51oad applications program Ok
MERGE "PLTDRV.BAS" ;merge the device driver Ok
MERGE "HERCSPEC.BAB" 5 merge the device specs Ok
SAVE "QKFLHERC.BAS",A ; save in ASCII -file Ok
SYSTEM ;return to system level
> QB QKFLHERC /E/O/S; ;compile the program
Microsoft QuickBasic Compiler Version 2.00
(C) Copyright Microso-ft Corp. 1982, 1983, 1984, 1985, 1986
849 Lines Compiled 0 Severe Error(s)
> MASM HERCASM.ASM; ;assemble the bitmap program;for high resolution plot
The Microso-ft MACRO Assembler, Version 1.25 Copyright (C) Microso-ft Corp 1981,82,83
47694 Bytes free
Warning SevereErrors Errors0 0 ;assembly complete
> LINK QKFLHERC + PREFIX + HERCASM;
Microsoft <R) Overlay Linker Version 3.06 Copyright <C> Microsoft. Corp 1983, 1984, 1985, 1986. All rights reserved.
****** returns to system after linking is completed *****