Embed Size (px)
Citation preview
London road show - November 2010
President and CEO Mikael Mäkinen

Strategy and financial targets
Nov 2010 3
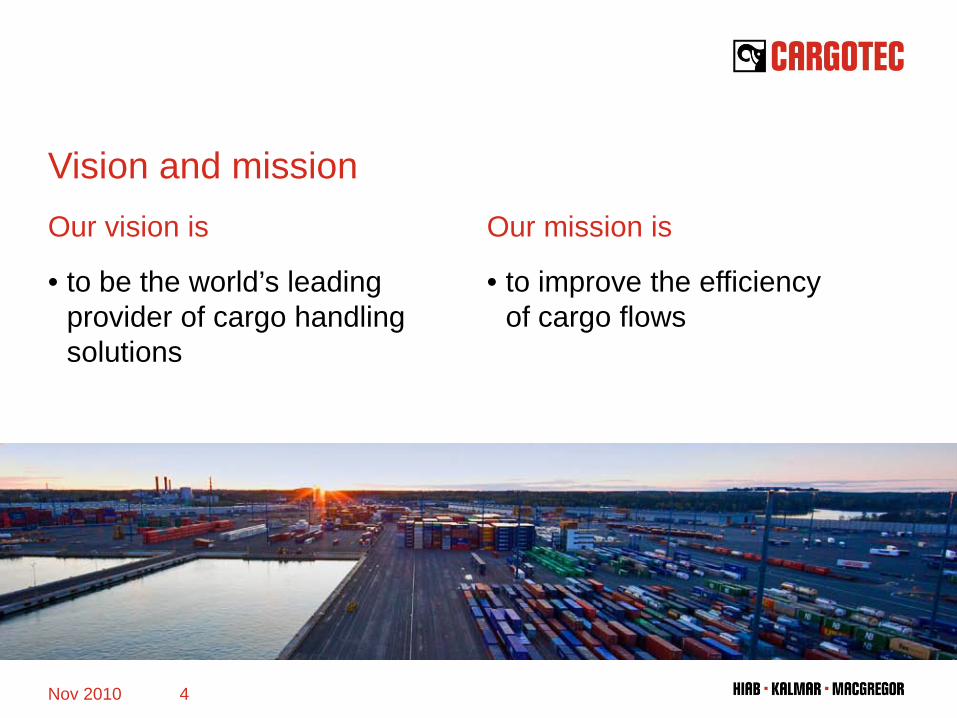
Vision and missionOur vision is
• to be the world’s leading provider of cargo handling solutions
Our mission is
• to improve the efficiencyof cargo flows
Nov 2010 4
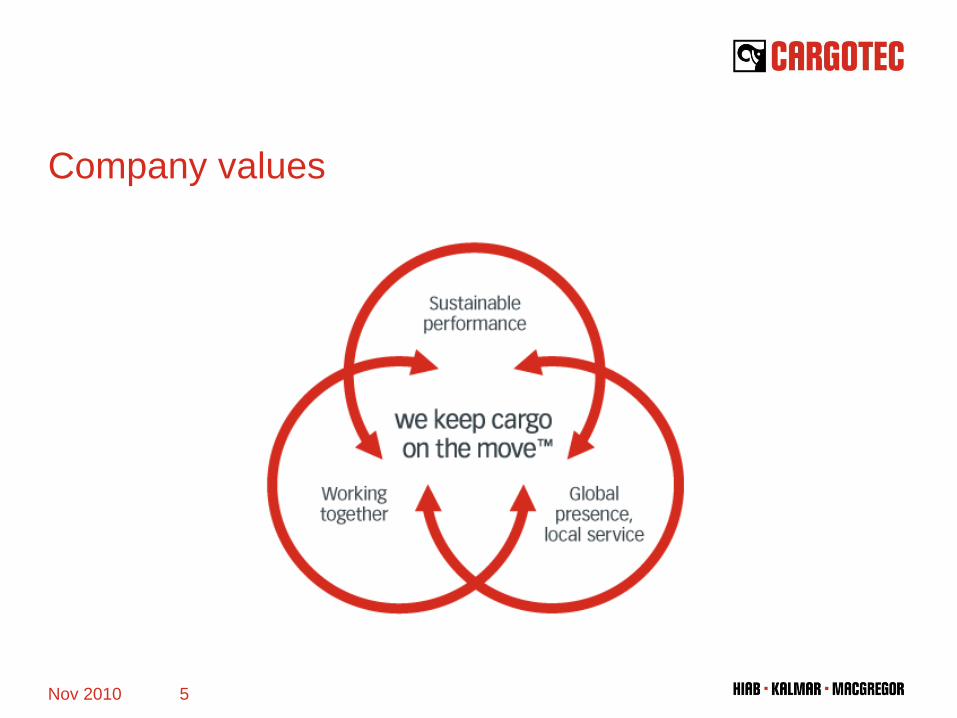
Company values
Nov 2010 5
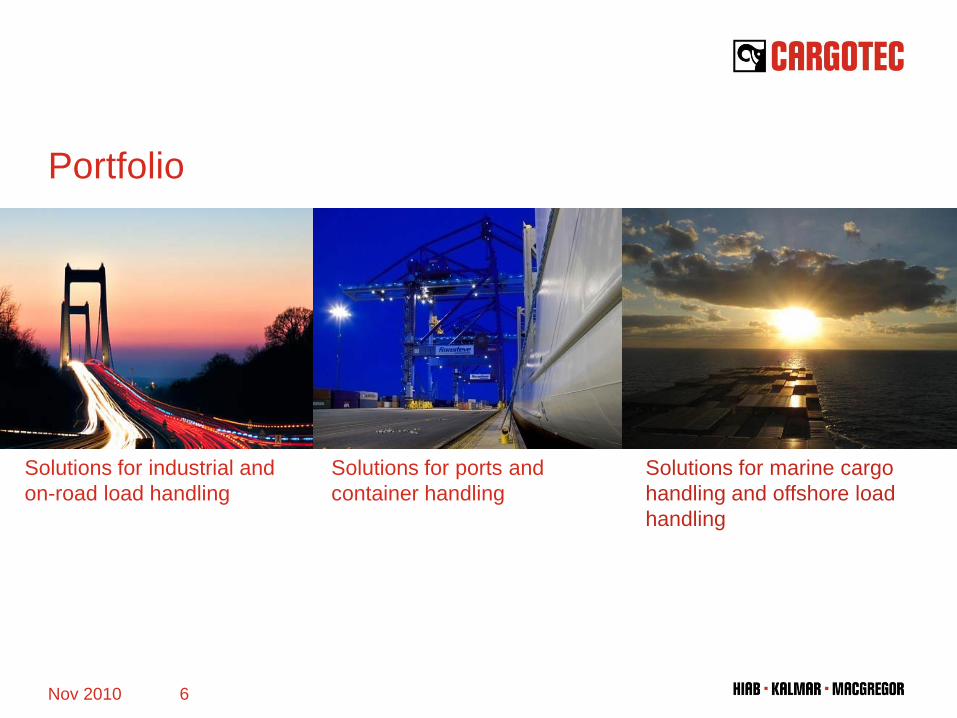
Solutions for ports and container handling
Portfolio
Solutions for marine cargo handling and offshore load handling
Solutions for industrial and on-road load handling
Nov 2010 6
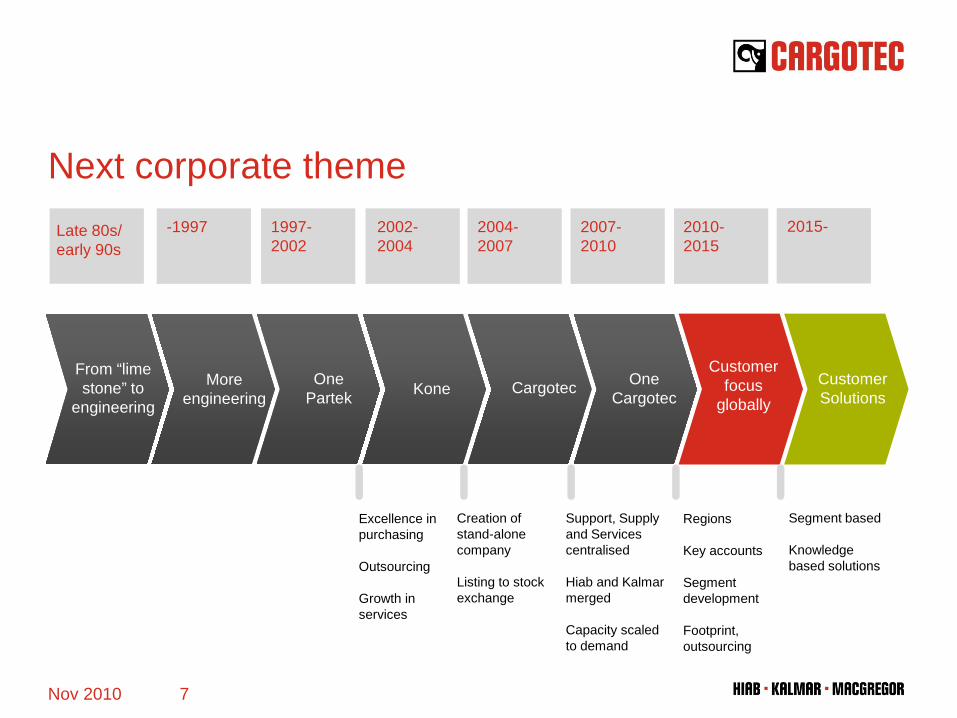
Next corporate theme
Nov 2010 7
2007-2010
2010-2015
Late 80s/ early 90s
-1997 1997-2002
2004-2007
2002-2004
2015-
From “lime stone” to
engineering
More engineering
One Partek Kone Cargotec One
Cargotec
Customer focus
globallyCustomerSolutions
Excellence in purchasing
Outsourcing
Growth in services
Creation of stand-alone company
Listing to stock exchange
Support, Supply and Services centralised
Hiab and Kalmar merged
Capacity scaledto demand
Regions
Key accounts
Segment development
Footprint, outsourcing
Segment based
Knowledge based solutions
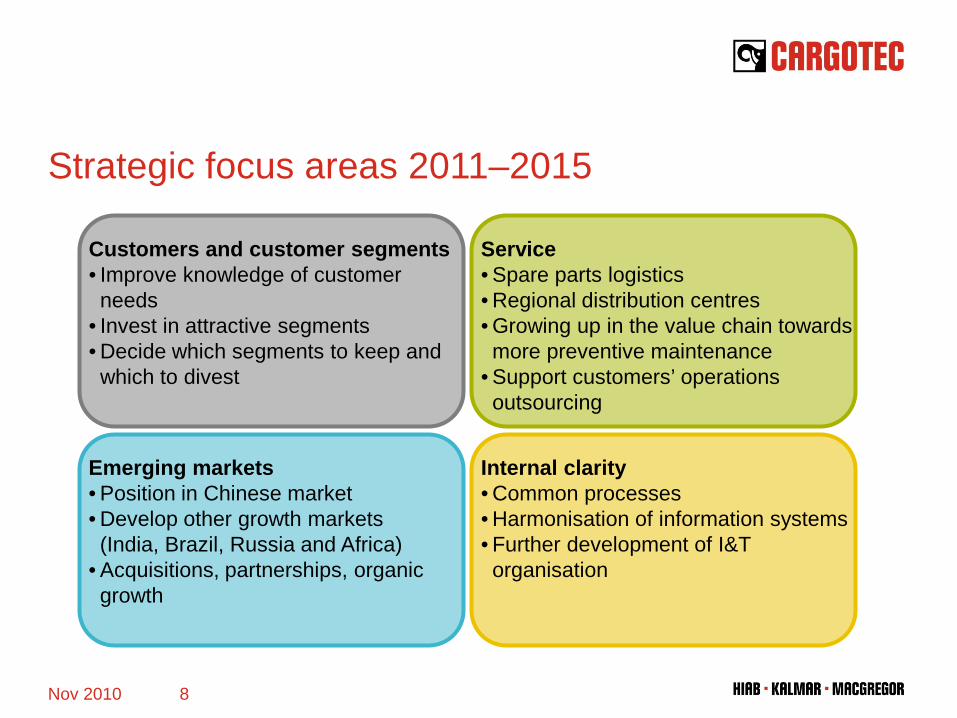
Strategic focus areas 2011–2015
Nov 2010 8
Customers and customer segments• Improve knowledge of customer needs
• Invest in attractive segments• Decide which segments to keep and which to divest
Service• Spare parts logistics• Regional distribution centres• Growing up in the value chain towards more preventive maintenance
• Support customers’ operations outsourcing
Emerging markets• Position in Chinese market• Develop other growth markets (India, Brazil, Russia and Africa)
• Acquisitions, partnerships, organic growth
Internal clarity• Common processes• Harmonisation of information systems• Further development of I&T organisation
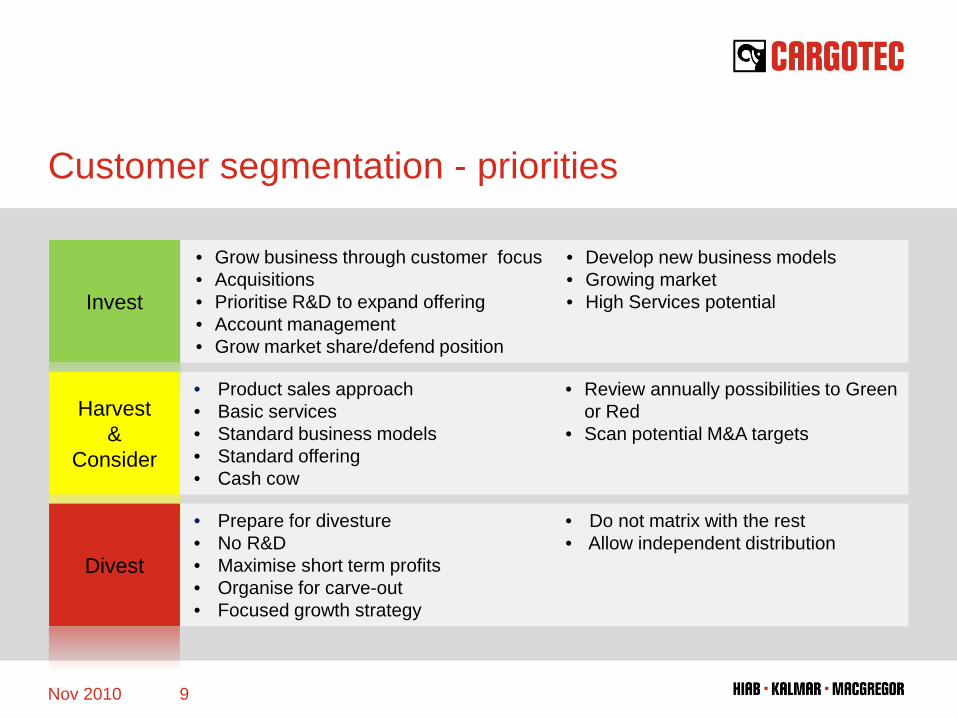
Customer segmentation - priorities
• Grow business through customer focus• Acquisitions• Prioritise R&D to expand offering• Account management• Grow market share/defend position
• Develop new business models• Growing market• High Services potential
• Product sales approach• Basic services• Standard business models• Standard offering• Cash cow
• Review annually possibilities to Green or Red
• Scan potential M&A targets
• Prepare for divesture• No R&D• Maximise short term profits• Organise for carve-out• Focused growth strategy
• Do not matrix with the rest• Allow independent distribution
Invest
Harvest &
Consider
Divest
Nov 2010 9
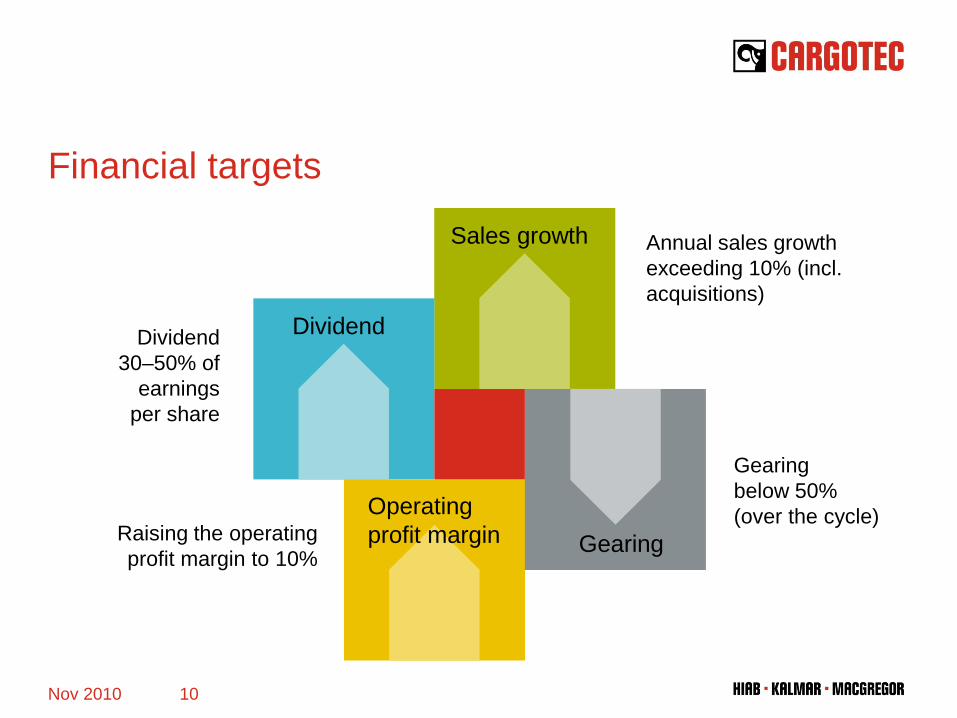
Financial targets
Annual sales growth exceeding 10% (incl. acquisitions)
Raising the operating profit margin to 10%
Gearingbelow 50% (over the cycle)
Dividend30–50% of
earningsper share
Nov 2010 10
Dividend
Sales growth
GearingOperating profit margin
January–September 2010 financials
Nov 2010 11
Highlights of January–September 2010 report
• Market recovery continued in all segments
• Q3 order intake 56% up y-o-y
• Q3 sales grew 14% y-o-y, seasonality visible in Q3 figures when comparing with Q2
• Industrial & Terminal’s profitability improving
• Marine’s profitability still strong
• Cash flow continued healthy
Nov 2010 12
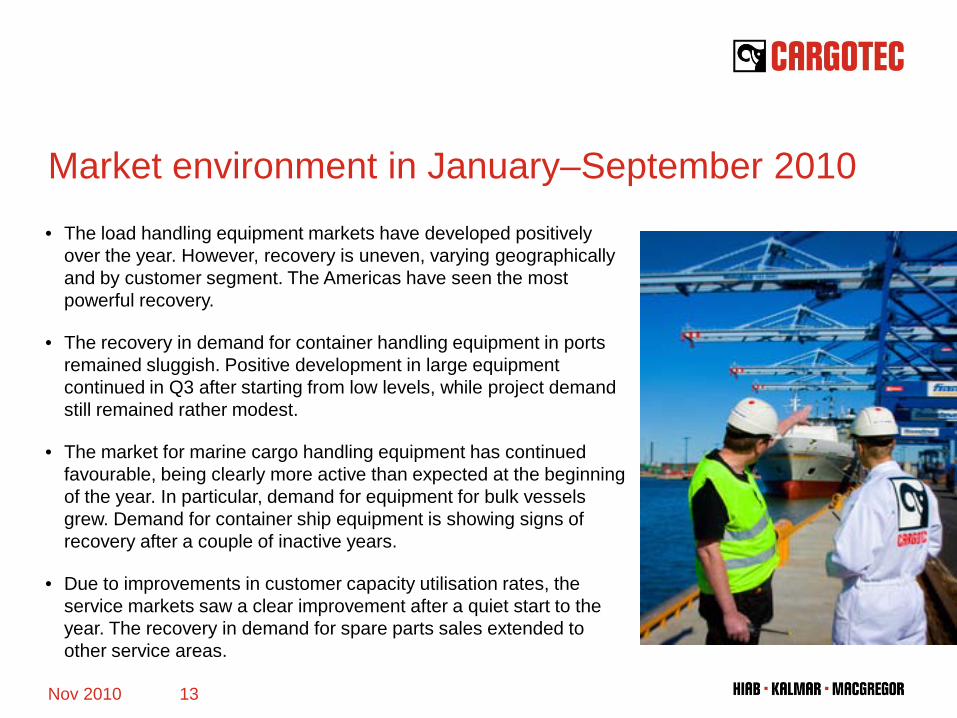
Market environment in January–September 2010• The load handling equipment markets have developed positively
over the year. However, recovery is uneven, varying geographically and by customer segment. The Americas have seen the most powerful recovery.
• The recovery in demand for container handling equipment in ports remained sluggish. Positive development in large equipment continued in Q3 after starting from low levels, while project demand still remained rather modest.
• The market for marine cargo handling equipment has continued favourable, being clearly more active than expected at the beginning of the year. In particular, demand for equipment for bulk vessels grew. Demand for container ship equipment is showing signs of recovery after a couple of inactive years.
• Due to improvements in customer capacity utilisation rates, the service markets saw a clear improvement after a quiet start to the year. The recovery in demand for spare parts sales extended to other service areas.
Nov 2010 13
Key figures in January–September 2010
Nov 2010 14
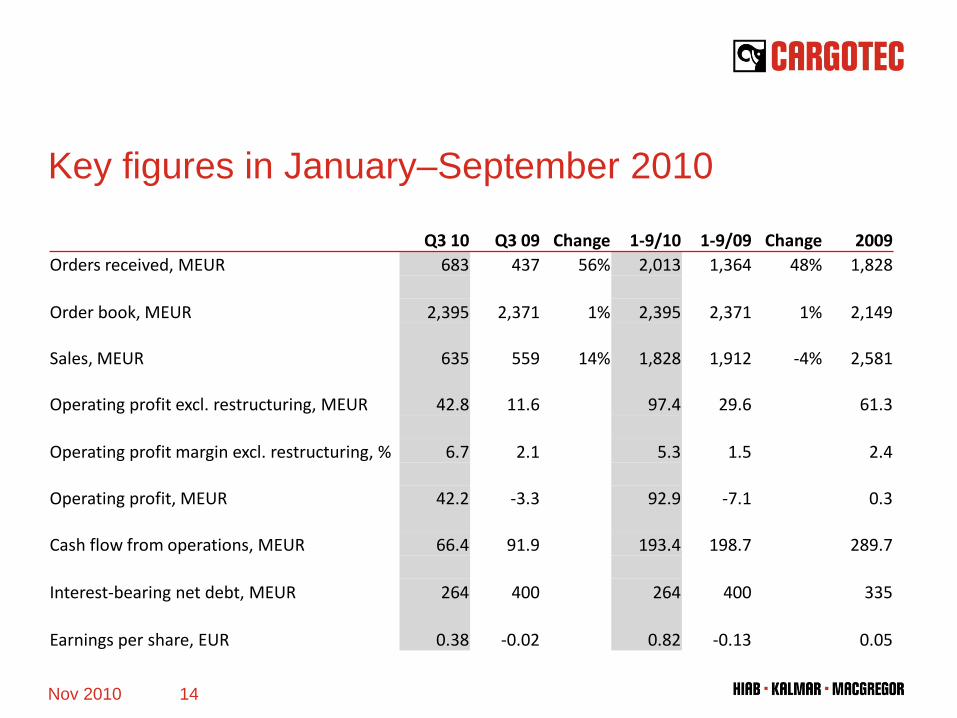
Q3 10 Q3 09 Change 1-9/10 1-9/09 Change 2009Orders received, MEUR 683 437 56% 2,013 1,364 48% 1,828
Order book, MEUR 2,395 2,371 1% 2,395 2,371 1% 2,149
Sales, MEUR 635 559 14% 1,828 1,912 -4% 2,581
Operating profit excl. restructuring, MEUR 42.8 11.6 97.4 29.6 61.3
Operating profit margin excl. restructuring, % 6.7 2.1 5.3 1.5 2.4
Operating profit, MEUR 42.2 -3.3 92.9 -7.1 0.3
Cash flow from operations, MEUR 66.4 91.9 193.4 198.7 289.7
Interest-bearing net debt, MEUR 264 400 264 400 335
Earnings per share, EUR 0.38 -0.02 0.82 -0.13 0.05
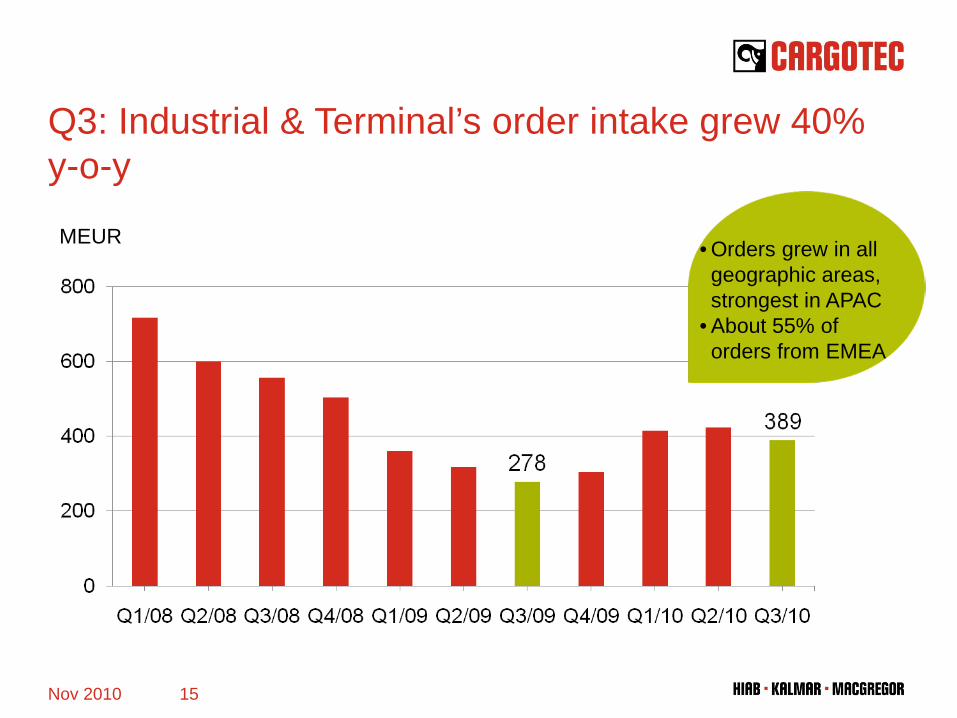
Q3: Industrial & Terminal’s order intake grew 40% y-o-y
Nov 2010 15
MEUR • Orders grew in all geographic areas, strongest in APAC
• About 55% of orders from EMEA
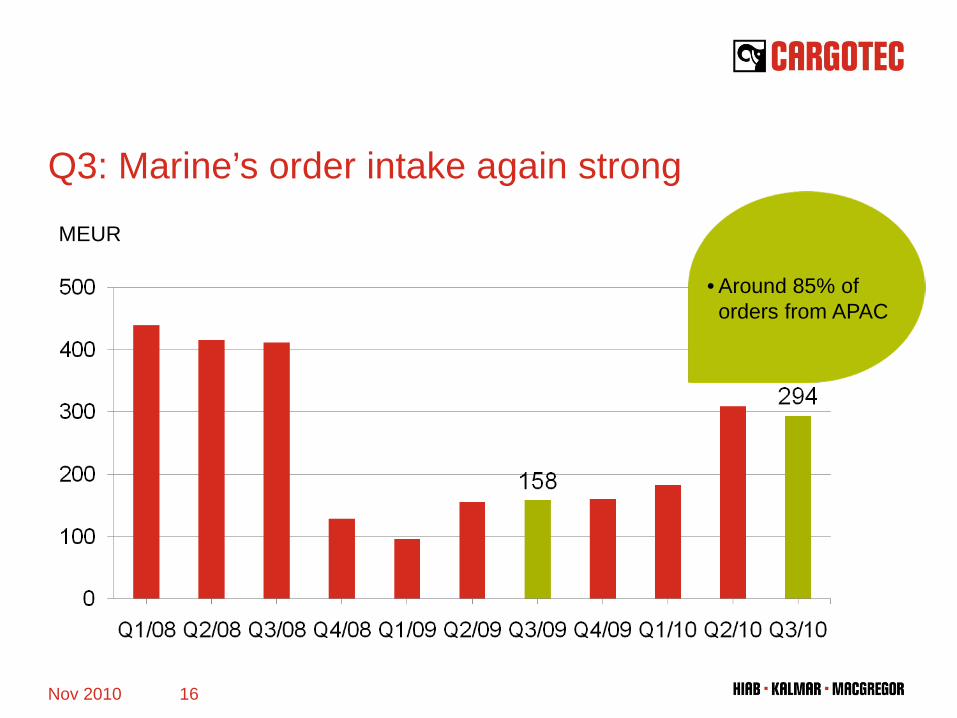
Q3: Marine’s order intake again strong
Nov 2010 16
MEUR
• Around 85% of orders from APAC
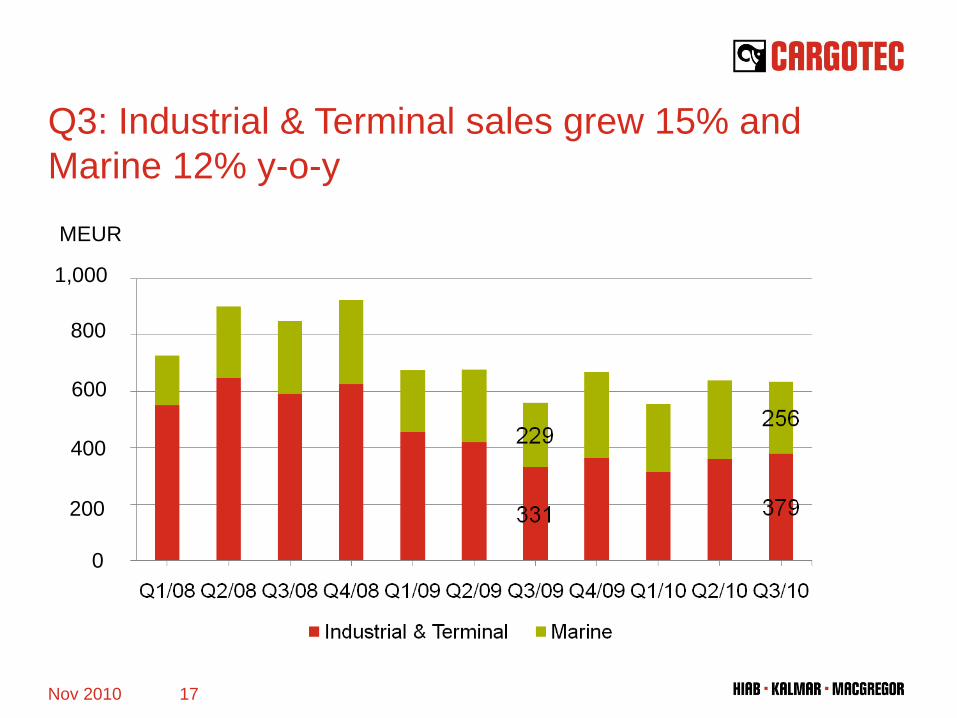
Q3: Industrial & Terminal sales grew 15% and Marine 12% y-o-y
Nov 2010 17
MEUR
800
1,000
600
400
200
0
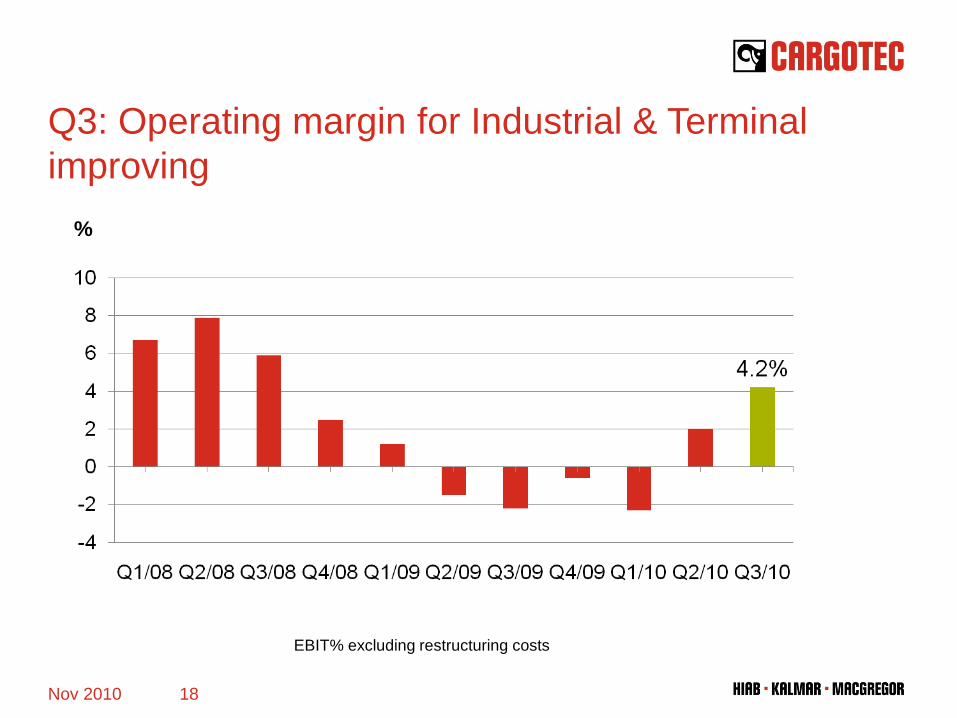
Q3: Operating margin for Industrial & Terminal improving
Nov 2010 18
%
EBIT% excluding restructuring costs
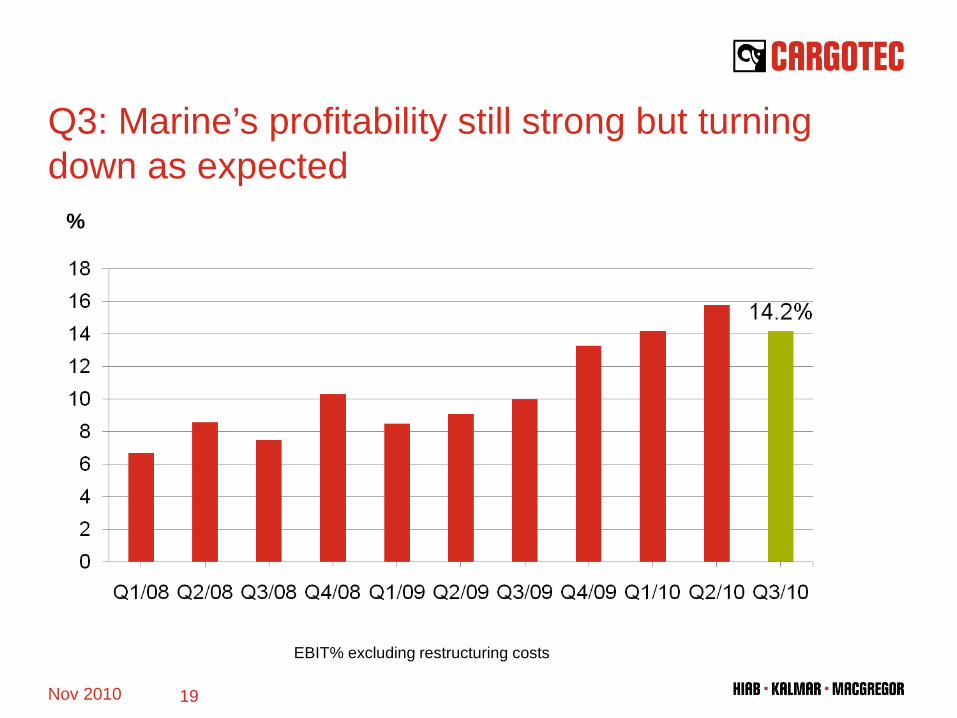
Q3: Marine’s profitability still strong but turning down as expected
Nov 2010 19
%
EBIT% excluding restructuring costs
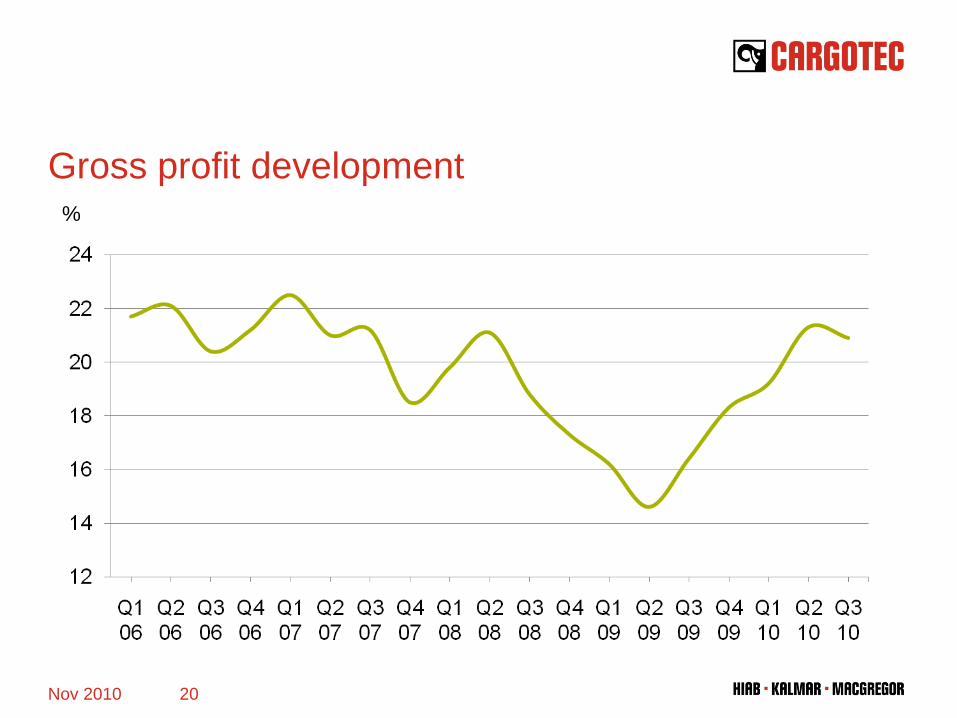
Gross profit development
Nov 2010 20
%
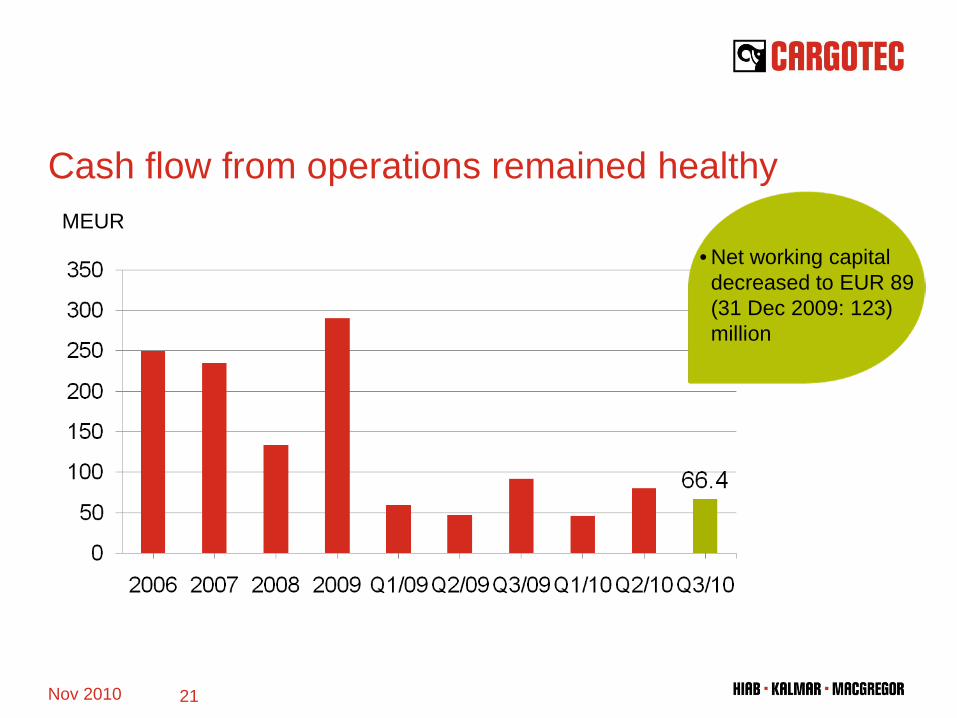
Cash flow from operations remained healthy
Nov 2010 21
MEUR
• Net working capital decreased to EUR 89 (31 Dec 2009: 123) million
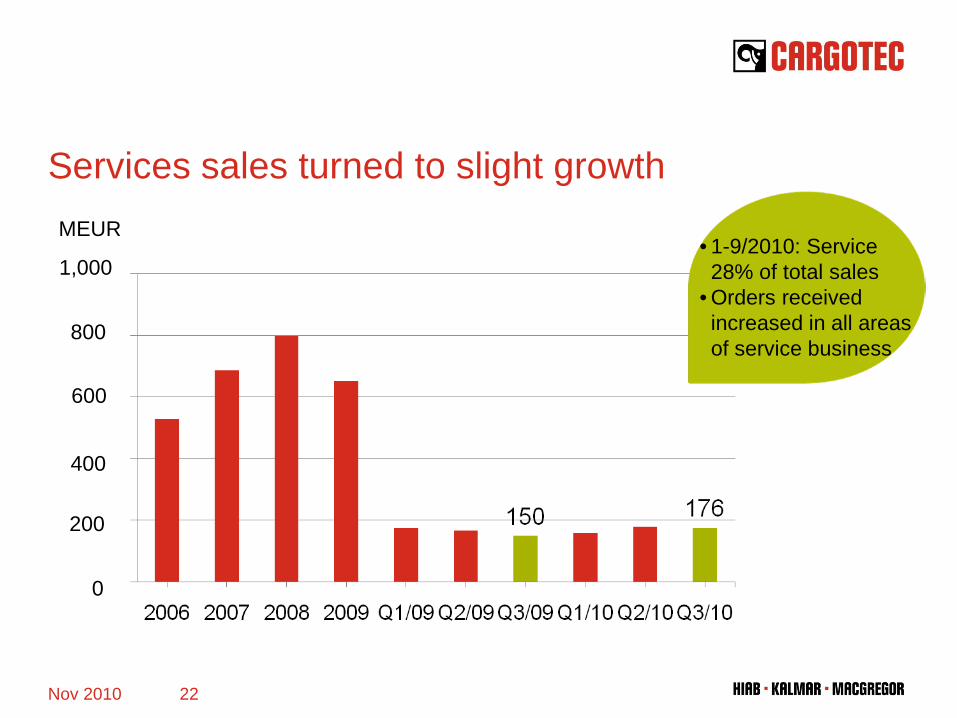
Services sales turned to slight growth
Nov 2010 22
MEUR• 1-9/2010: Service 28% of total sales
• Orders received increased in all areas of service business
800
1,000
600
400
200
0
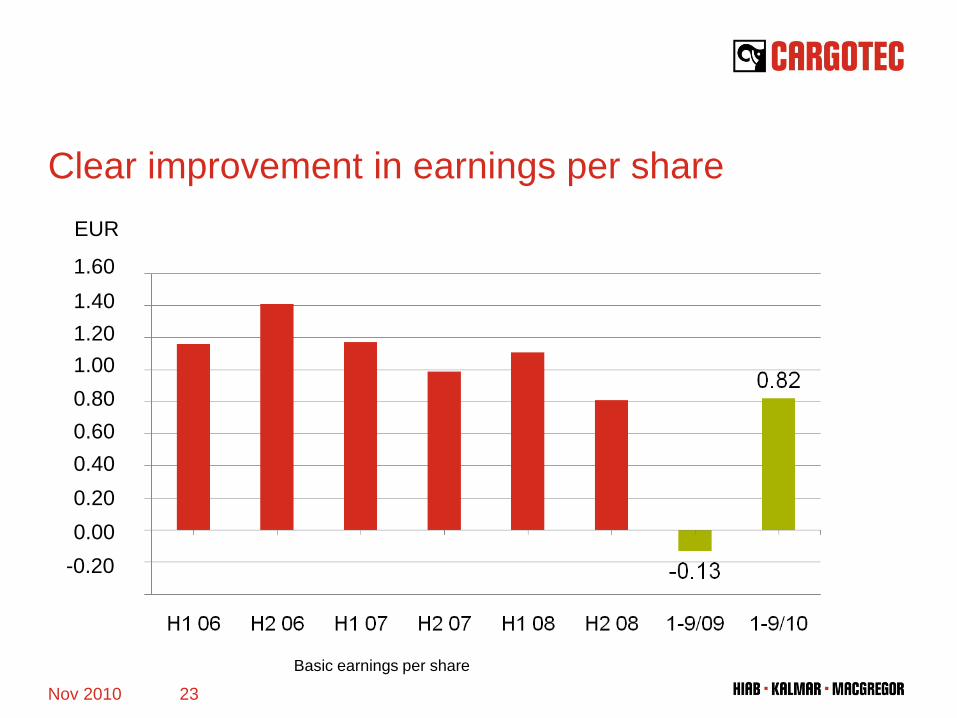
Clear improvement in earnings per share
Nov 2010 23
EUR
Basic earnings per share
1.60
0.800.600.400.200.00
-0.20
1.001.201.40
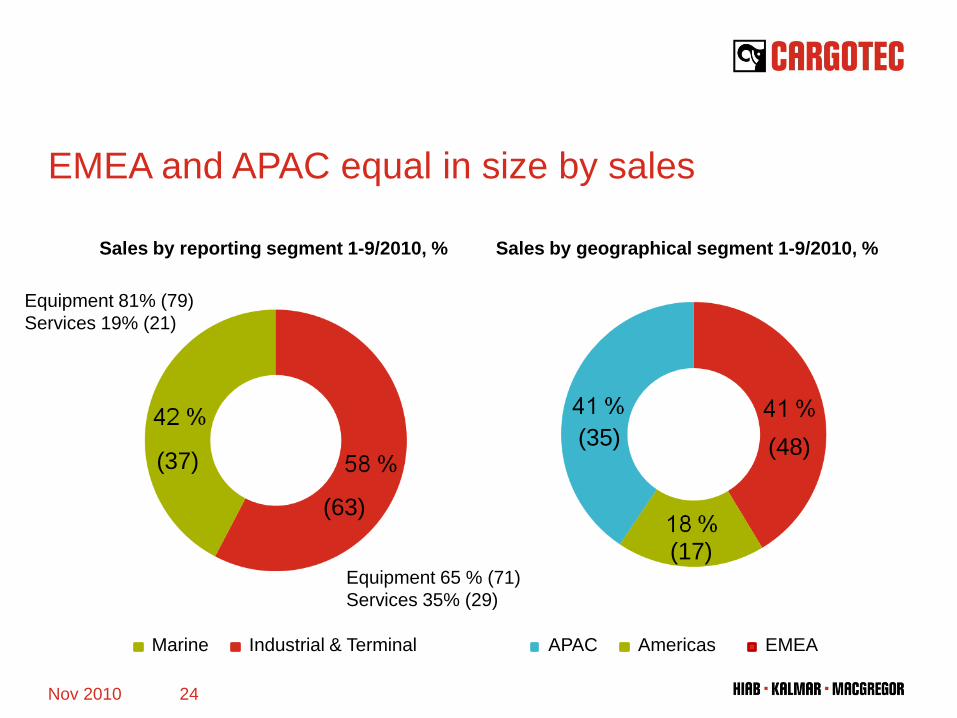
EMEA and APAC equal in size by sales
Nov 2010 24
Sales by reporting segment 1-9/2010, % Sales by geographical segment 1-9/2010, %
Equipment 81% (79)Services 19% (21)
Equipment 65 % (71)Services 35% (29)
(37)
(63)
(48)
(17)
(35)
Marine Industrial & Terminal APAC Americas EMEA
Cargotec’s key priorities in 2010• Preparing for growth strategy
• Focused research & development
• Service concept development
• Ensuring accomplishment of efficiency targets
Nov 2010 25
Outlook
• Cargotec continues to estimate 2010 sales to be on 2009 level for both Industrial & Terminal and Marine segments.
• Operating profit for 2010 is expected to be in the range of EUR 120–130 million including one-time restructuring costs.
• The recovery in the market environment and the resulting growth in order volumes support growth in Industrial. The sales of Terminal are expected to fall short of 2009 levels due to the slower recovery of these markets, as second half orders will not have an effect on full-year sales due to delivery times.
• Based on the healthy nine-month development, strong order book and new orders received still to be delivered during 2010, sales in Marine will reach year 2009 level.
Nov 2010 26
Appendices
Nov 2010 27
-10 %
-5 %
0 %
5 %
10 %
15 %
2006 2007 2008 2009 2010 2011 2012
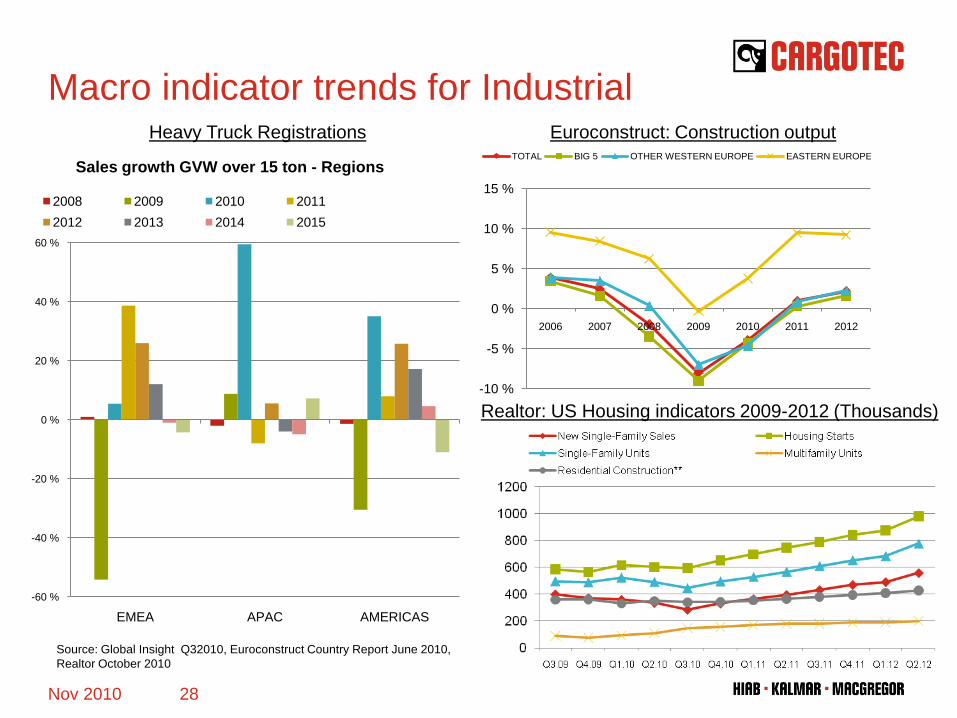
TOTAL BIG 5 OTHER WESTERN EUROPE EASTERN EUROPE
Macro indicator trends for IndustrialHeavy Truck Registrations Euroconstruct: Construction output
Realtor: US Housing indicators 2009-2012 (Thousands)
Source: Global Insight Q32010, Euroconstruct Country Report June 2010,Realtor October 2010
-60 %
-40 %
-20 %
0 %
20 %
40 %
60 %
EMEA APAC AMERICAS
Sales growth GVW over 15 ton - Regions
2008 2009 2010 20112012 2013 2014 2015
28Nov 2010
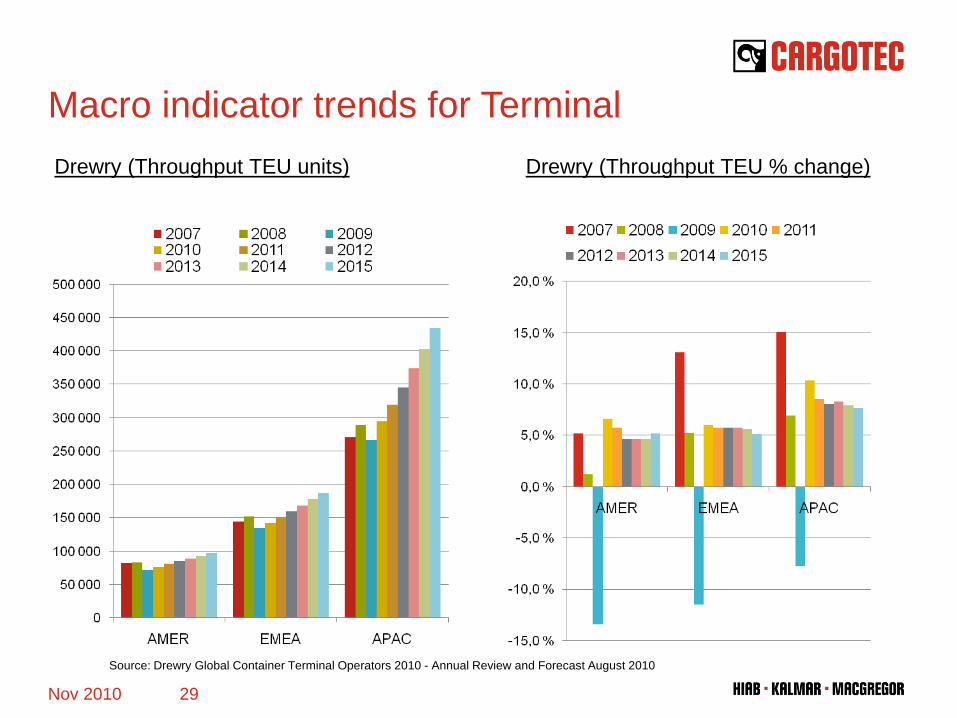
Macro indicator trends for TerminalDrewry (Throughput TEU % change)Drewry (Throughput TEU units)
Source: Drewry Global Container Terminal Operators 2010 - Annual Review and Forecast August 2010
29Nov 2010
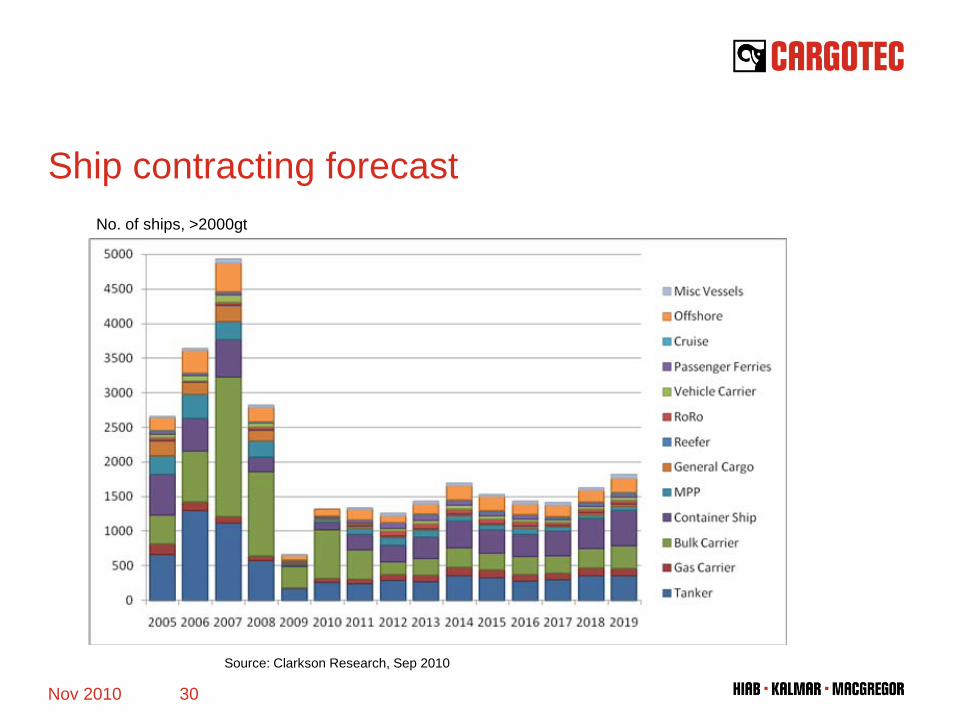
Ship contracting forecast
Nov 2010 30
Source: Clarkson Research, Sep 2010
No. of ships, >2000gt
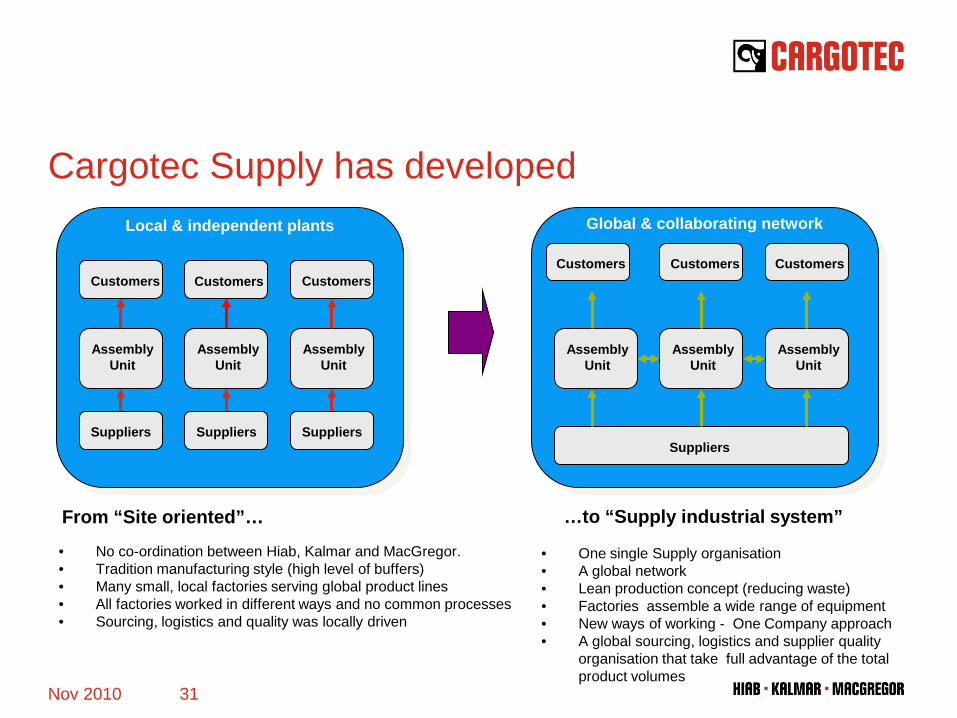
Cargotec Supply has developed
Nov 2010 31
Suppliers Suppliers Suppliers
Assembly Unit
Assembly Unit
Assembly Unit
Customers Customers Customers
Local & independent plants
• No co-ordination between Hiab, Kalmar and MacGregor.• Tradition manufacturing style (high level of buffers)• Many small, local factories serving global product lines• All factories worked in different ways and no common processes• Sourcing, logistics and quality was locally driven
• One single Supply organisation• A global network• Lean production concept (reducing waste)• Factories assemble a wide range of equipment• New ways of working - One Company approach• A global sourcing, logistics and supplier quality
organisation that take full advantage of the total product volumes
Suppliers
Assembly Unit
Assembly Unit
Assembly Unit
Global & collaborating network
From “Site oriented”… …to “Supply industrial system”
CustomersCustomers Customers
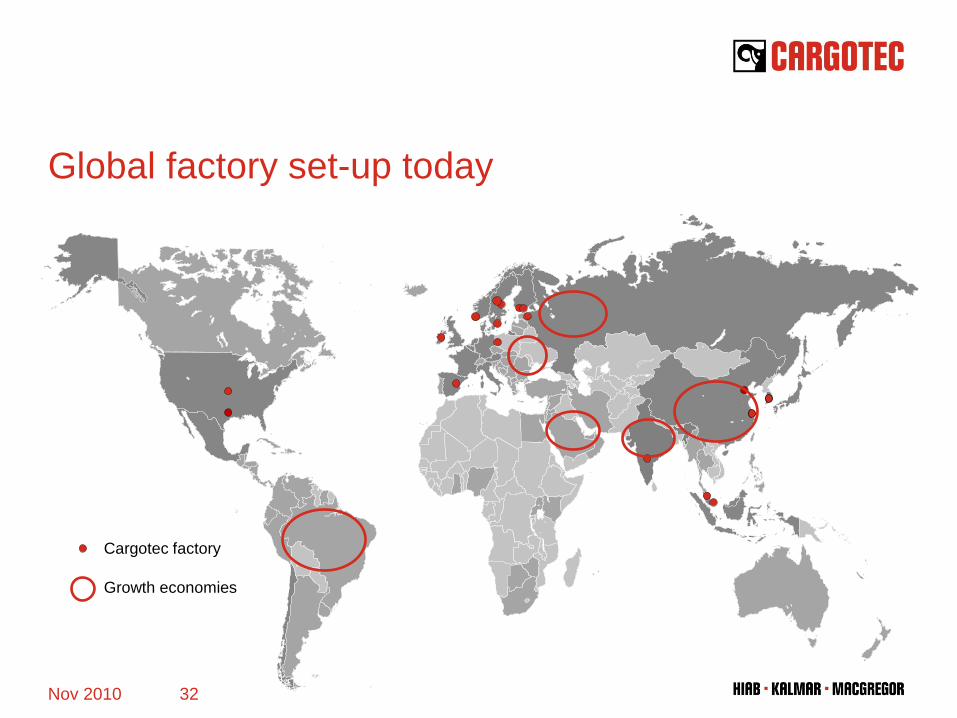
Global factory set-up today
Nov 2010 32
Cargotec factory
Growth economies
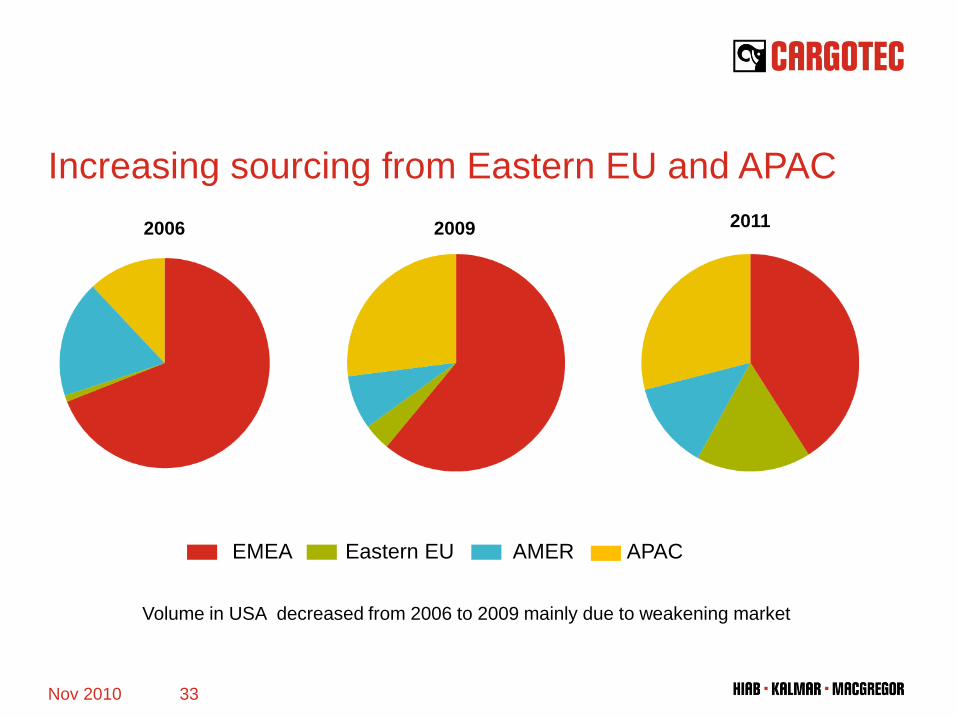
EMEA Eastern EU AMER APAC
2006 2009
Volume in USA decreased from 2006 to 2009 mainly due to weakening market
2011
Increasing sourcing from Eastern EU and APAC
33Nov 2010
Nov 2010 34
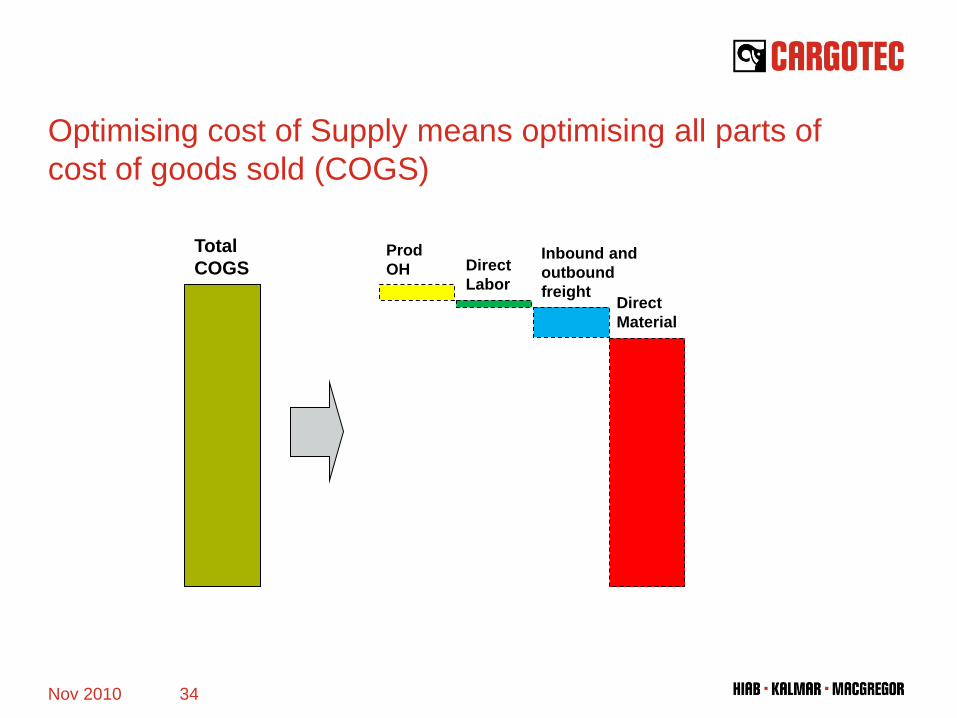
ProdOH Direct
Labor
Inbound and outbound freight
Direct Material
Total COGS
Optimising cost of Supply means optimising all parts of cost of goods sold (COGS)
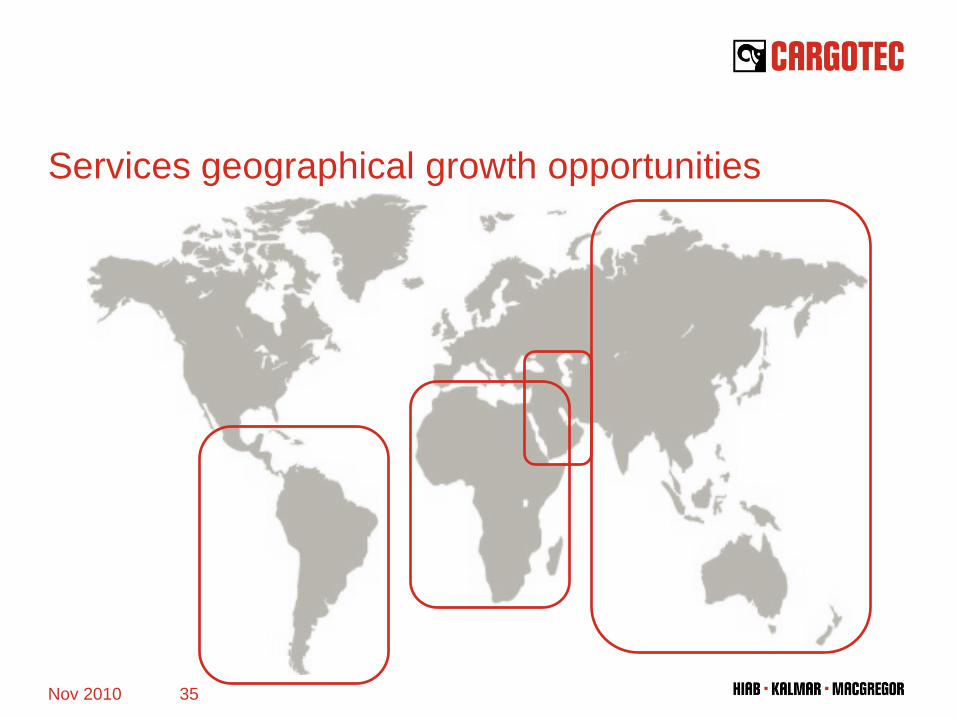
Services geographical growth opportunities
Nov 2010 35
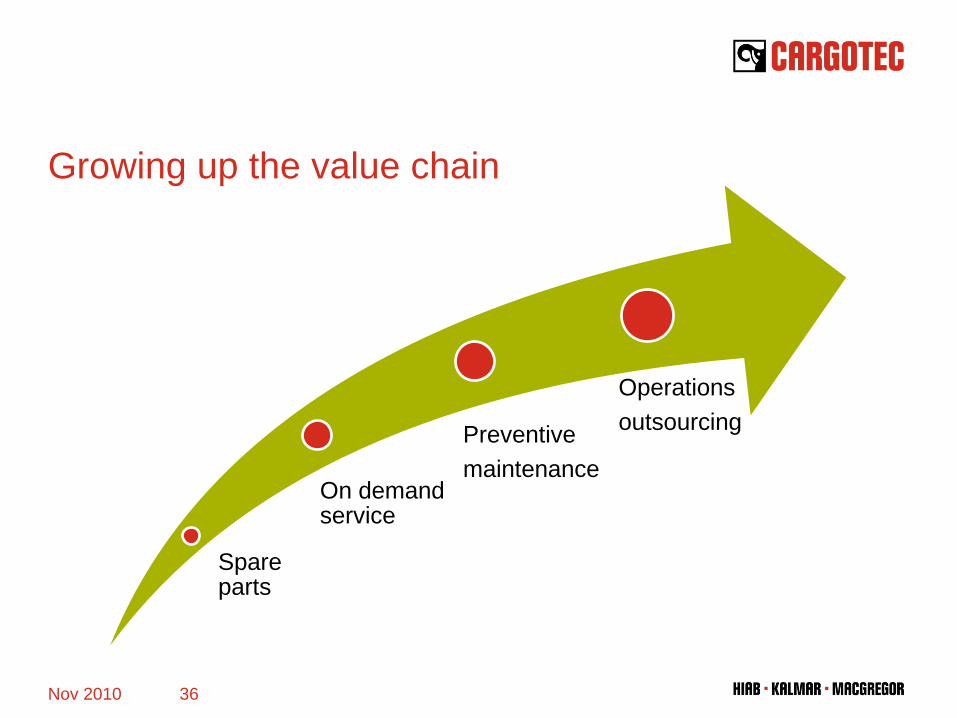
Growing up the value chain
Spare parts
On demand service
Operations outsourcingPreventive
maintenance
Nov 2010 36
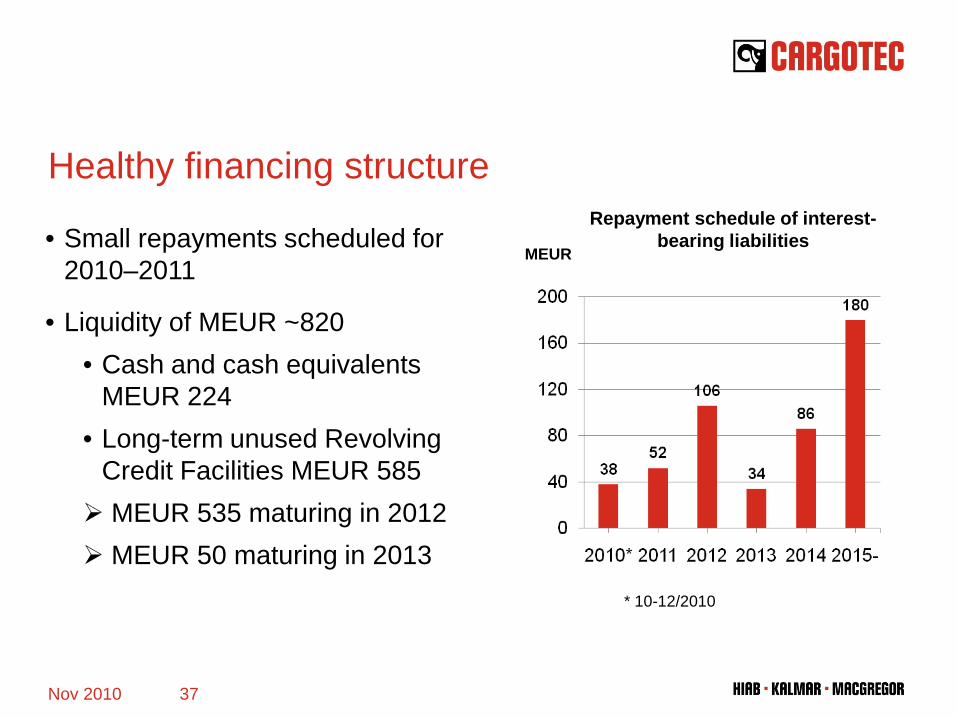
Healthy financing structure
• Small repayments scheduled for 2010–2011
• Liquidity of MEUR ~820• Cash and cash equivalents
MEUR 224• Long-term unused Revolving
Credit Facilities MEUR 585 MEUR 535 maturing in 2012 MEUR 50 maturing in 2013
MEUR
Repayment schedule of interest-bearing liabilities
Nov 2010 37
* 10-12/2010
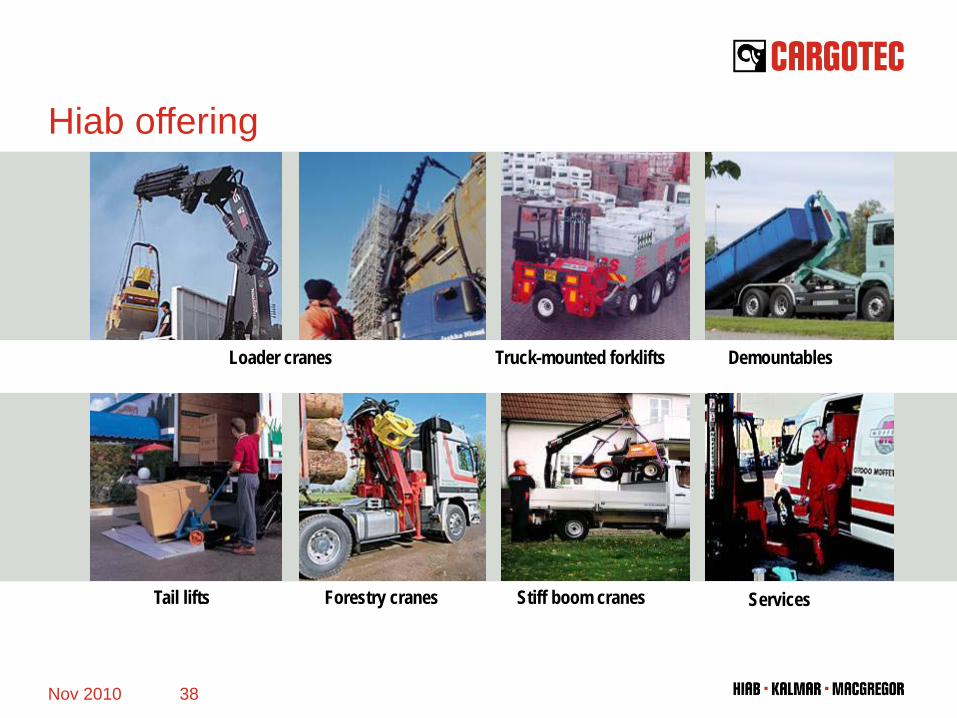
Services
Truck-mounted forklifts DemountablesLoader cranes
Forestry cranes Tail lifts Stiff boom cranes
Hiab offering
38Nov 2010
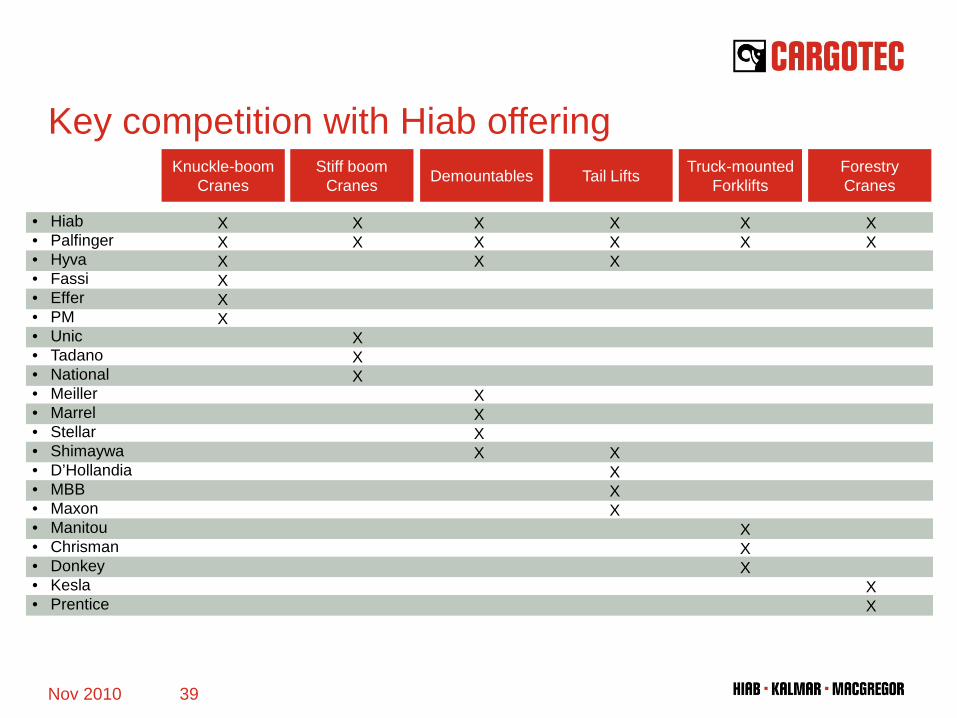
Key competition with Hiab offeringKnuckle-boom
Cranes Demountables Truck-mountedForklifts
ForestryCranesTail LiftsStiff boom
Cranes
XXXXXX
XXX
XXXX
XXX
X XXX
XX
XX
XX
XXX
XX
XXX
• Hiab• Palfinger• Hyva• Fassi• Effer• PM• Unic• Tadano• National• Meiller• Marrel• Stellar• Shimaywa• D’Hollandia• MBB• Maxon• Manitou• Chrisman• Donkey• Kesla • Prentice
39Nov 2010
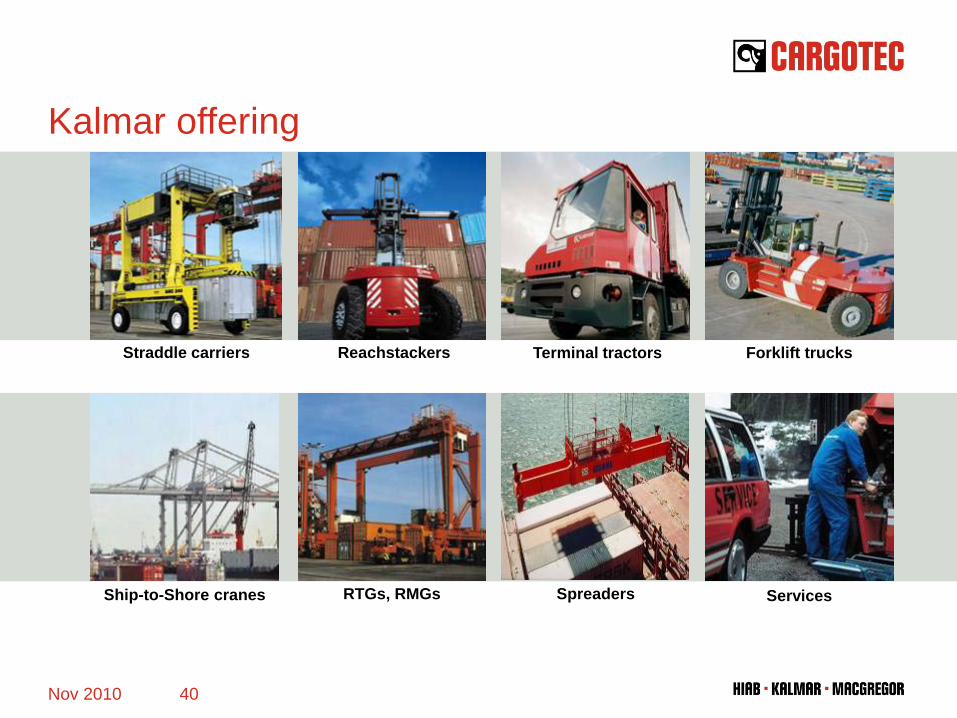
Terminal tractors Forklift trucksReachstackersStraddle carriers
Ship-to-Shore cranes RTGs, RMGs ServicesSpreaders
Kalmar offering
40Nov 2010
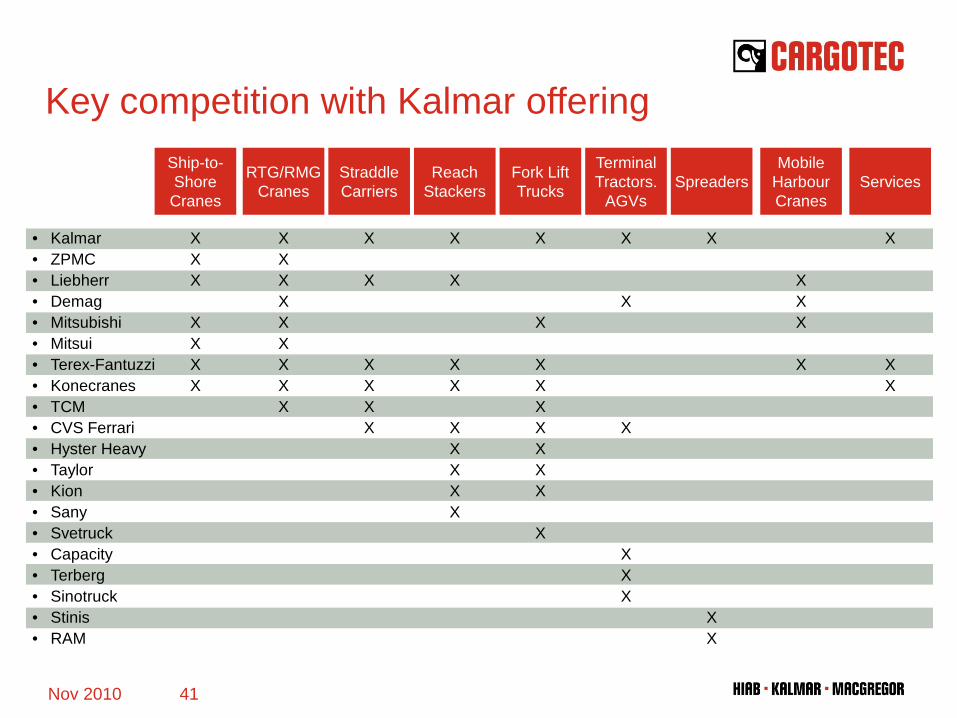
Key competition with Kalmar offeringShip-to-ShoreCranes
MobileHarbourCranes
RTG/RMGCranes
StraddleCarriers
ReachStackers
Fork LiftTrucks
TerminalTractors.
AGVsServicesSpreaders
XXX
XXXX
XXX
X
X
XX
XXXXXXXXX
X
X
XXXX
X
X
XX
XXXXX
X
X
XXXXXXX
X
X
X
X
XXX
• Kalmar• ZPMC• Liebherr• Demag• Mitsubishi• Mitsui• Terex-Fantuzzi• Konecranes• TCM• CVS Ferrari• Hyster Heavy• Taylor• Kion• Sany• Svetruck• Capacity• Terberg• Sinotruck• Stinis• RAM
X
XX
41Nov 2010
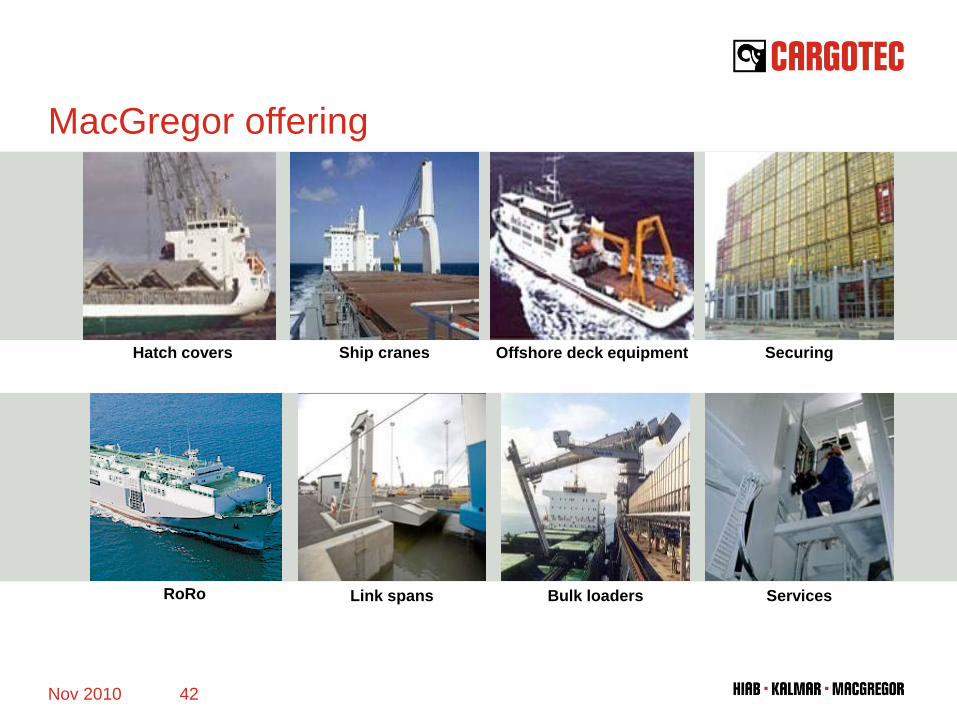
Link spans
Ship cranes SecuringHatch covers
RoRo ServicesBulk loaders
Offshore deck equipment
MacGregor offering
42Nov 2010
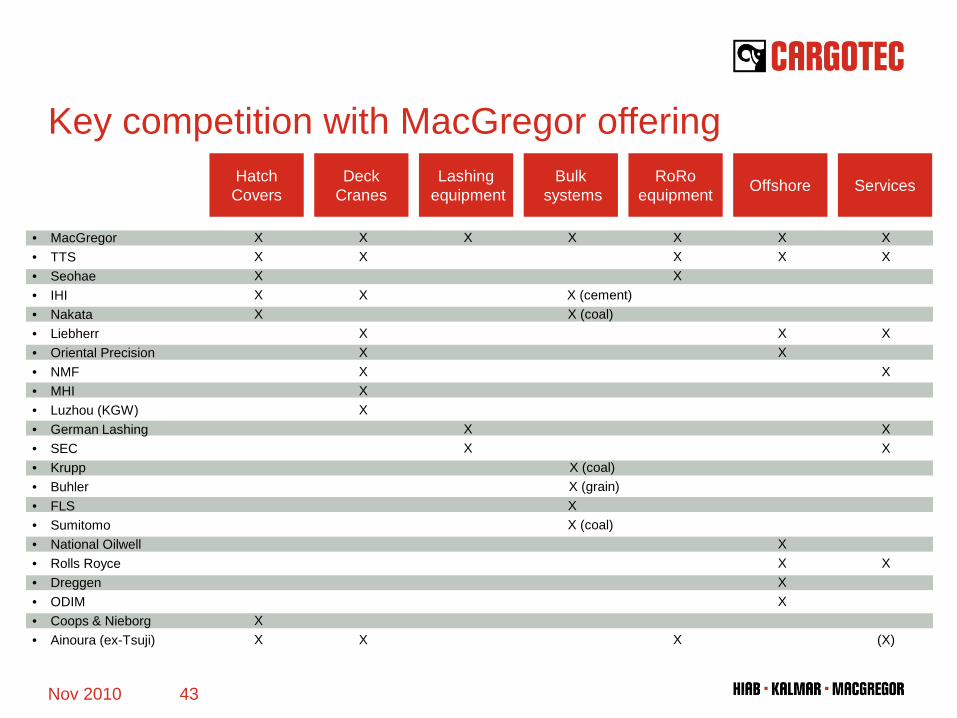
Key competition with MacGregor offering
• MacGregor• TTS• Seohae• IHI• Nakata• Liebherr• Oriental Precision• NMF• MHI• Luzhou (KGW)• German Lashing• SEC• Krupp• Buhler• FLS• Sumitomo• National Oilwell• Rolls Royce• Dreggen• ODIM• Coops & Nieborg• Ainoura (ex-Tsuji)
HatchCovers
DeckCranes OffshoreLashing
equipment Services
XXXXX
XX
XX
X
XXXXX
X
X
X (cement)X (coal)
X (coal)X (grain)XX (coal)
XX
XX
XXXX
XX
X
X
XX
X
(X)
RoRoequipment
XXX
X
Bulksystems
X
XX
43Nov 2010