Embed Size (px)
Citation preview

London Stock Exchange Group plc
Doug Webb Chief Financial Officer
June 2009

2
Agenda
Full Year Results – summary
Operational Highlights
Outlook
Initial comments from new CEO
Q&A

3
Key financial highlights
•
Good underlying performance in difficult markets – reflects overall resilience and diversification
•
Revenue up 23% (up 1% pro forma)
•
Adjusted operating profit up 17% (down 1% pro forma)
•
Strong focus on cost control – at pro forma constant currency down 5%
•
Strong cash flow from operations – up 20% to £353m: free cash flow after dividends £100m
•
Adjusted EPS up 2% to 74.2p
•
Dividend per share up 2% to 24.4p; £52m share buy back in H1
•
Cost synergies increased 60% from £20m to £32m

4
A diversified exchange group
Information Services
27%
Post Trade16%
Issuer Services
13%
Trading Services
41%
UK Cash equities23%
Italian cash equities
4%
Derivatives4%
Fixed Income4%
Other trading6%
Annual6%Admission
4%
Other issuer3%
Data17%
Other information10%
Clearing8%
Settlement3%
Other revenues3%Custody
5%
Year end 31 March 2009

5
Markets remain active – record equity capital raising
• Companies raised a record £99 billion of further money• Total money raised a record £106 billion • Clear lead as the international market of choice
Further money raised (£ billion)
2820
99
FY 2007 FY 2008 FY 2009
Number of international IPOs
1
5
6
6
21
Deutsche Börse
NASDAQ
Euronext
NYSE
London StockExchange
6
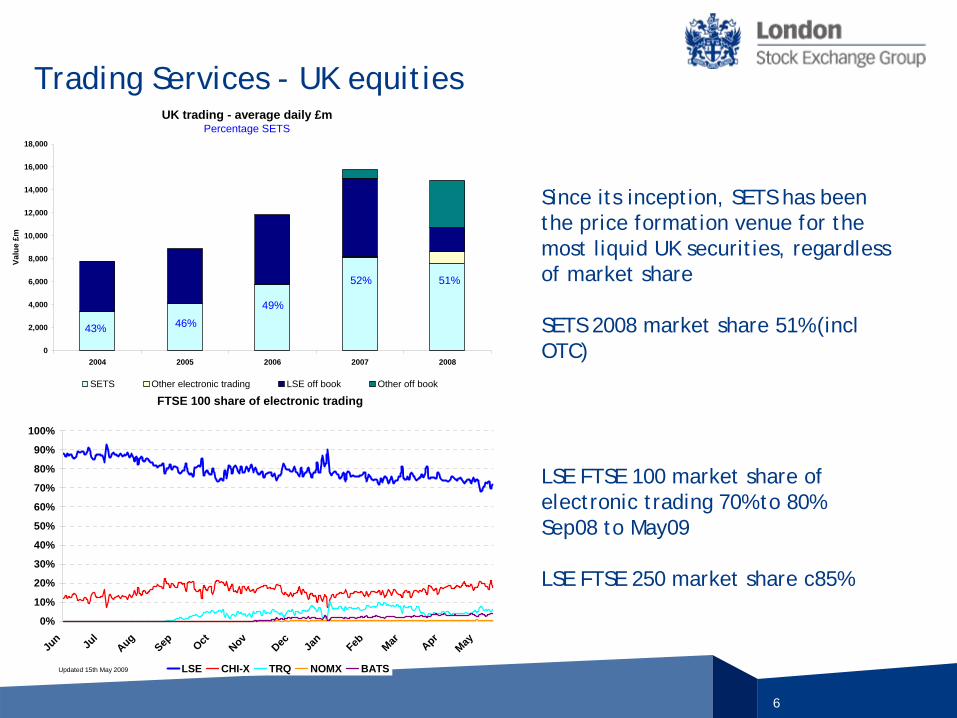
Trading Services - UK equities
LSE FTSE 100 market share of electronic trading 70% to 80%Sep08 to May09
LSE FTSE 250 market share c85%
Since its inception, SETS has been the price formation venue for the most liquid UK securities, regardless of market share
SETS 2008 market share 51% (incl OTC)
UK trading - average daily £mPercentage SETS
0
2,000
4,000
6,000
8,000
10,000
12,000
14,000
16,000
18,000
2004 2005 2006 2007 2008
Valu
e £m
SETS Other electronic trading LSE off book Other off book
43% 46%
49%
52% 51%
FTSE 100 share of electronic trading
0%
10%
20%
30%
40%
50%
60%
70%
80%
90%
100%
Jun Jul
Aug
Sep Oct Nov
Dec Jan
Feb Mar Apr
May
LSE CHI-X TRQ NOMX BATSUpdated 15th May 2009

7
Information Services – diversified product range
• Data Sales – real-time, price forming data
– 104,000 LSE professional terminals, of which 62,000 non-UK
– 151,000 Italian professional terminals
• Other revenues
– FTSE Group – 50% owned by LSE, contributed over £10m to Group profits
– Extranex network – firms upgrading to 100mb lines (from 10mb)
– Proquote - cost effective financial market software and real-time data services over the internet to almost 5,000 users
– SEDOL – reference data for over 5m global instruments (equities, derivatives and bonds)
– Hosting service provides customers with direct connectivity

8
Post Trade – multi assets• Cassa di Compensazione e
Garanzia (CC&G) acts as a central counterparty eliminating counterparty risk on trades for:
– Italian cash equities
– Equity derivatives
– Government bonds
– Energy derivatives
– CC&G will soon clear pan-European equities for Baikal MTF
• Monte Titoli, provides routing, netting and settlement services. Recognized as the lowest cost provider in the Eurozone1
1 European Central Bank study 2007

9
Delivering benefits from merger
• Major strategic assets in Post Trade Services
• £19 million of cost synergies delivered in FY 2009
• Total cost synergies of at least £32 million, up 60 per cent – implementation costs of £42m (up £2m from original plan)
• Successful migration of Italian cash equities and MOT trading to TradElect – and launch of AIM Italia
• The Italian economy is the 7th largest in the world

10
Operating expenses – good cost control
351
333
19
13
27
65
3
324
FY08 FX FY08constantcurrency
Synergies Variable staffcosts
Lehman baddebt
Depreciation Other FY09
£ million
• 5% cost reduction in pro forma constant currency

11
Current trading• Market conditions remain challenging: some signs of improvement since
financial year end:
−
London SETS trading
−
Average daily trades in April up 4% on the first quarter of 2009,
−
Average daily value traded in April up 2% on the first quarter of 2009.
−
May at similar levels of trading to April.
−
Italian cash equities trading
−
Average daily trades up 34% in April on the first quarter of 2009.
−
May at similar levels of trades to April.
−
Value traded in May up c100% on the first quarter of 2009.
−
Good primary markets pipeline but market subdued, Secondary issues remain strong
−
Demand for real time data resilient, but expected to decline further
−
Post Trade - CC&G continues to perform well with open interest at record levels of 5.1m contracts as at end of April, up 11% on March
• The Group is well placed for the future

12
Initial impressions - Xavier Rolet, CEO
• Tremendous opportunities for the Group in a dynamic exchange sector:“Customers are demanding ever more efficient, sophisticated and fast services to help them find liquidity…. I understand the challenge and know we will need to keep moving fast to meet these changing needs. And we will”
• Undertaking a thorough analysis of the Group’s business“I am open-minded and nothing has been ruled out…. there is everything to play for”
• Baikal is an exciting opportunity“a neutral, pan-European dark pool with smart order-routing to other exchanges, as well as order matching and sophisticated strategy matching, Baikal will offer customers a new option for transacting business”
• Borsa Italiana provides the Group with a number of very efficient, extremely well designed products “combination of the London Stock Exchange and Borsa Italiana provides the Group with a portfolio of strategic assets which not only provide diversification of revenues but important platforms for growth”

13
Summary
• Good underlying performance in difficult markets
• Diversified Group with mix of UK and Italian operations
• Good cost control and increased merger synergies
• Strong international brand and London market position
• Robust free cash flow and sound balance sheet
• New CEO forming views
Appendix
Preliminary results
Financial Year ended 31 March 2009

15
Overview of results - statutory
See notes in Appendix for basis of preparation
2009 2008 Change£m £m %
(restated)Revenue 671.4 546.4 23%
Operating costs (before exceptionals) (332.8) (257.4) 29%
Operating profit (before exceptionals) 338.6 289.0 17%
Operating margin 50% 53%
Impairment of goodwill (484.0) -Exceptional items and amortisation (64.6) (23.8)Operating (loss) / profit (210.0) 265.2
Net finance expense (44.9) (40.4)
(Loss) / profit for year (332.8) 173.0
Basic earnings per share (p) (126.1) 70.8
Adjusted earnings per share (p) 74.2 73.1 2%
Dividend per share (p) 24.4 24.0 2%
Year ended31 March

16
Exceptional items
Exceptional items Integration £15.2mFinance expense £6.9m
Amortisation £49.4m
Goodwill impairment £484m
• Borsa Italiana and Proquote goodwill impaired by £473m and £11m respectively, reflecting deterioration in market conditions and increased uncertainty about the future
• No impact on cash flows, regulatory capital requirements or debt covenants
In sterling terms the value in use of Borsa is comfortably higher today than the £1.3bn when we merged (even after taking the impairment)

17
Overview of results – pro forma
See notes in Appendix for basis of preparation
Change atconstant
2009 2008 Change currency£m £m % %
RevenueIssuer 90.4 97.1 (7%) (12%)Trading 275.3 310.0 (11%) (16%)Information 182.9 161.9 13% 8%Post Trade 104.0 82.0 27% 7%Other income 18.8 15.8 19% 8%Total revenue 671.4 666.8 1% (6%)
Operating costs (332.8) (323.8) 3% (5%)
Operating profit (before exceptionals) 338.6 343.0 (1%) (7%)
Operating margin 50.4% 51.4%
Year ended31 March

18
Issuer Services
Key metrics
Central role in linking companies to capital
Revenues (pro forma)
£41m
£41m
£34m
£28m
£22m
£21m£90m
£97mFY 2008
FY 2009
Annual fees Admission fees RNS, other
• Difficult market for new issues• Strong further issues• Record £106bn raised via equity issues
2009 2008New IssuesMain Market, PSM & SFM 65 116AIM 87 262Blt 8 33Total 160 411
Company Numbers (as at 31 March)Main Market, PSM & SFM 1,530 1,592AIM 1,478 1,681Blt 296 306Total 3,304 3,579
Market capitalisation (as at 31 March)Main Market (UK only) (£bn) 1,170 1,707AIM (£bn) 38 89Borsa Italiana (€bn) 314 604Borsa Italiana (£bn) 289 482Total (£bn) 1,497 2,278
Year ended31 March

19
£191m
£156m
£28m
£28m
£32m
£26m
£24m
£26m
£35m
£40m
£275m
£310mFY 2008
FY 2009
UK cash equities Italian cash equities Fixed IncomeDerivatives Other
Trading Services Solid performance in weaker markets
Key metricsRevenues (pro forma)
• Value traded reflects fall in markets: FTSE 100 down average 22%; S&P MIB down average 35%
• Derivatives performed well, Fixed Income faced difficult markets (stable market share)
2009 2008EquityLSE average daily bargains ('000) 740 642LSE average daily value traded (£bn) 6.9 9.1
Borsa Italiana average daily bargains ('000) 256 290Borsa Italiana average daily value traded (€bn) 3.3 6.1
DerivativesEDX contracts (m) 61.1 48.6IDEM contracts (m) 37.0 37.2
Fixed IncomeMTS (€bn nominal) 18,310 20,279Borsa Italiana MOT (€bn) 197 152Borsa Italiana MOT number of trades (m) 3.4 2.7
31 MarchYear ended
20
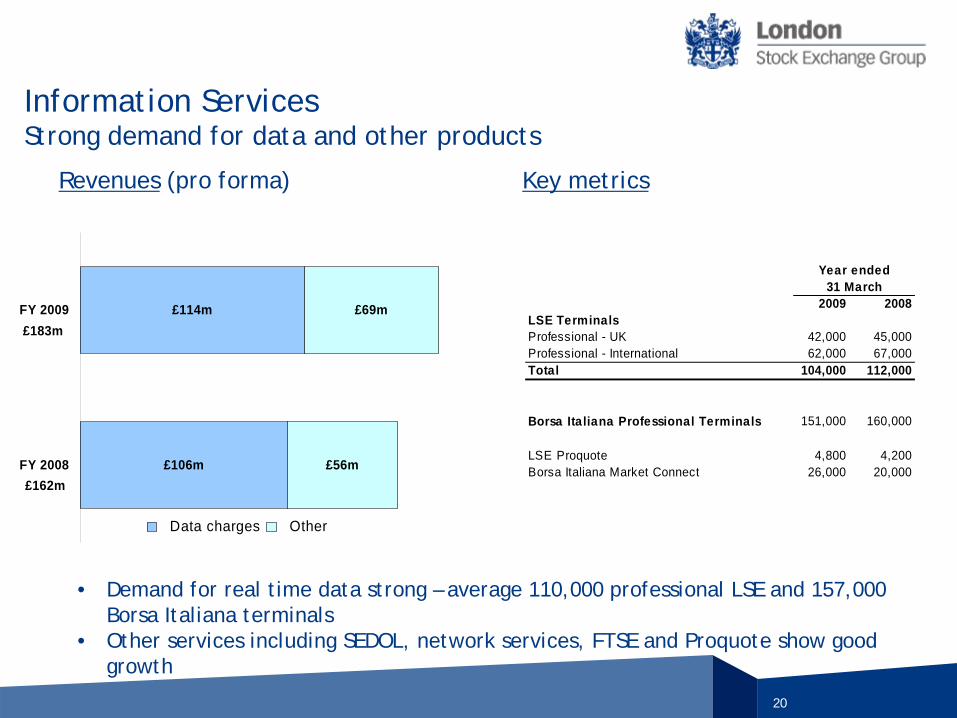
£106m
£114m
£56m
£69m
£162m
£183m
FY 2008
FY 2009
Data charges Other
Information Services Strong demand for data and other products
Key metricsRevenues (pro forma)
• Demand for real time data strong – average 110,000 professional LSE and 157,000 Borsa Italiana terminals
• Other services including SEDOL, network services, FTSE and Proquote show good growth
2009 2008LSE Terminals Professional - UK 42,000 45,000Professional - International 62,000 67,000Total 104,000 112,000
Borsa Italiana Professional Terminals 151,000 160,000
LSE Proquote 4,800 4,200Borsa Italiana Market Connect 26,000 20,000
Year ended31 March

21
£37m
£53m
£15m
£17m
£30m
£34m
£82m
£104m
FY 2008
FY 2009
Clearing Settlement Custody
Post Trade Clearing at heart of risk management in volatile markets
Key metricsRevenues (pro forma)
•
Clearing revenues benefited from strong treasury management of higher margin calls•
Custody revenue stable reflecting an increase in quantum of corporate and Government bonds assets
2009 2008CC&G Clearing:Equity Clearing (m) 66.3 73.8Derivative Clearing (m) 37.0 37.2Total Contracts (m) 103.3 111.0Open interest (m) (as at 31 March) 4.6 3.0
Monte Titoli:Settlement Instructions (m) 45.6 52.7Custody assets under management (€tn) 2.7 2.8
Year ended31 March

22
£120m
£113m
£88m
£100m
£86m
£84m
£30m
£36m£333m
£324m
FY 2008
FY 2009
Staff Property/marketing/other IT/Network Depreciation
Operating costs (pro forma)
• Pro forma costs down 5% in constant currency
• Headcount down 6% to 1,135 including Baikal headcount of 12
Excluding goodwill impairment, amortisation of purchased intangibles and exceptional items
Cost : Income ratio 50% (FY08 49%)

23
Summarised cash flowRobust cash generation from enlarged group operations
£ million
353
100
45
83
53
72
Cash generated from operations
Net interest expense
Corporation andwitholding tax paid
*Investment activities
Dividends
Free cash flow
*excluding acquisition or disposal of minority stakes

24
Net debt and borrowings• Gross borrowing £625m at 31 March 2009, reduced by £67m in FY2009 (or c £90m at
constant currency) – £905m committed facilities; £700m to 2012 or beyond
– £250m 5 year syndicated revolving credit facility at rate of Libor +80bps
– £25m 3 year bi-lateral revolving credit facility at a rate of Libor +80bps
– £200m revolving credit facility and £180m bridge facility – both mature beyond FY2010
– £250m Bond 2016 at a rate of 6.375%, reducing to 6.125% July 2009 (rating upgrade)
• £125m cash reserved for regulatory and operational purposes
0100200300400500600700800900
1000
2009 2010 2011 2012* 2013 2014 2015 2016
£m
Committed bank facilities (£655m)
Bond £250m 2016
£625m drawn 31 March 2009
Financial year:
*£200m RCF matures Feb 2012

25
Sound financial position
31 March 31 March2009 2008
(restated)£m £m £m
Non-current assets 1,679.9 1,921.5 (241.6)
Current assets - Debtors 35,794.0 17,442.1 18,351.9of which CCP 35,674.5 17,303.3 18,371.2
- cash 143.7 200.6 (56.9)
Total assets 37,617.6 19,564.2 18,053.4
Current liabilities - Bank borrowings - (436.0) 436.0
- Other (35,807.4) (17,482.7) 18,324.7of which CCP (35,679.2) (17,307.7) 18,371.5
Non-current liabilities - Bond (252.6) (256.1) 3.5 - Bank borrowings (369.9) - (369.9)
- Other (134.5) (126.5) (8.0)
Net assets 1,053.2 1,262.9 (209.7)
Change

26
Notes
Adjusted earnings per shareExcludes goodwill impairment, amortisation of purchased intangibles and exceptional integration and finance expense, to enable comparison of the underlying earnings of the business with prior periods. Based on number of shares 268.1m, excludes ESOP.
Free Cash FlowNet cash flow from operating activities minus capital expenditure, tax and dividends paid and net finance expense.
Exchange rates
Pro formaAs if merger with Borsa Italiana and Borsa Italiana’s acquisition of MBE Holding S.p.A occurred on 1 April 2007
FY 2009 FY 2008Average 1.20 1.42
Year end 1.08 1.25Constant currency growth rates calculated bytranslating prior year performance at currentyear monthly exchange rates

27
No representation or warranty, expressed or implied, is made or given by or on behalf of London Stock Exchange Group plc (the “Company”) or any of its directors or any other person as to the accuracy, completeness or fairness of the information or opinions contained in this presentation and no responsibility or liability is accepted for any such information or opinions. This presentation does not constitute an offer of securities by the Company and no investment decision or transaction in the securities of the Company should be made on the basis of the information or opinions contained in this presentation.
The content of this presentation includes statements that are, or may deemed to be, "forward-looking statements". These forward-looking statements can be identified by the use of forward-looking terminology, including the terms "believes", "estimates", "anticipates", "expects", "intends", "may", "will" or "should". By their nature, forward-looking statements involve risks and uncertainties and readers are cautioned that any such forward-looking statements are not guarantees of future performance. The Company's actual results and performance may differ materially from the impression created by the forward-looking statements. The Company undertakes no obligation to update or revise any forward-looking statements, except as may be required by applicable law and regulation (including the Listing Rules).
This presentation and its contents are confidential and should not be distributed, published or reproduced (in whole or in part) or disclosed by recipients to any other person.
Disclaimer