Embed Size (px)
Citation preview
© 2008 Smead Capital Management, All Rights Reserved. www.smeadcap.com
Long Duration Common Stock Investing A Contrarian Manifesto
Presented by: Chief Investment Officer Bill Smead
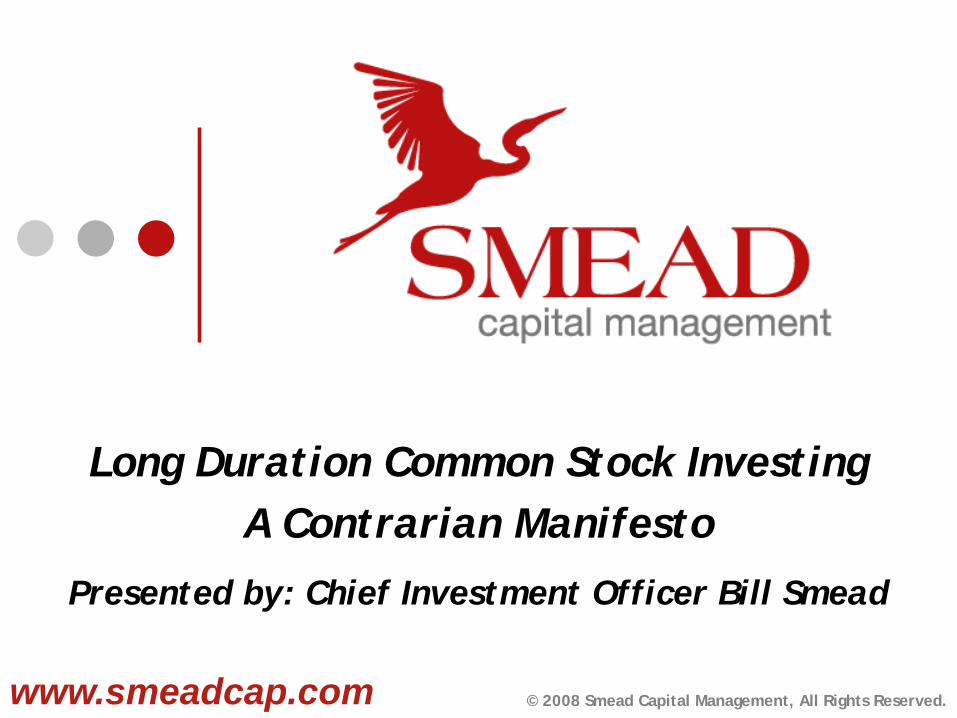
Source: http://www.stanford.edu/~wfsharpe/art/talks/indexed_investing.htm
Long Duration Common Stock Investing A Contrarian Manifesto
Should everyone index everything? The answer is resoundingly no. In fact, if everyone indexed, capital markets would cease to provide the relatively efficient security prices that make indexing an attractive strategy for some investors. All the research undertaken by active managers keeps prices closer to values, enabling indexed investors to catch a free ride without paying the costs. Thus there is a fragile equilibrium in which some investors choose to index some or all of their money, while the rest continue to search for mispriced securities. Should you index at least some of your portfolio? This is up to you. I only suggest that you consider the option. In the long run this boring approach can give you more time for more interesting activities such as music, art, literature, sports, and so on.
William F. Sharpe, 2002
Long Duration Common Stock Investing A Contrarian Manifesto
Passive Investing vs. Active Investing
Valuation Matters
Long-Duration & High-Quality
Why extend duration now?
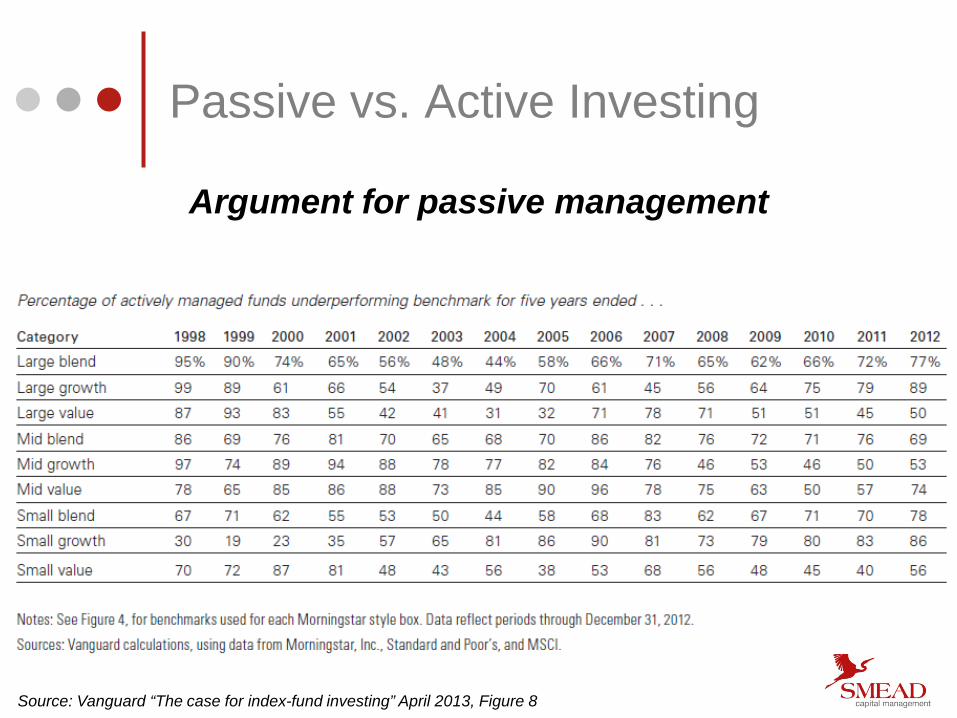
Source: Vanguard “The case for index-fund investing” April 2013, Figure 8
Passive vs. Active Investing
Argument for passive management
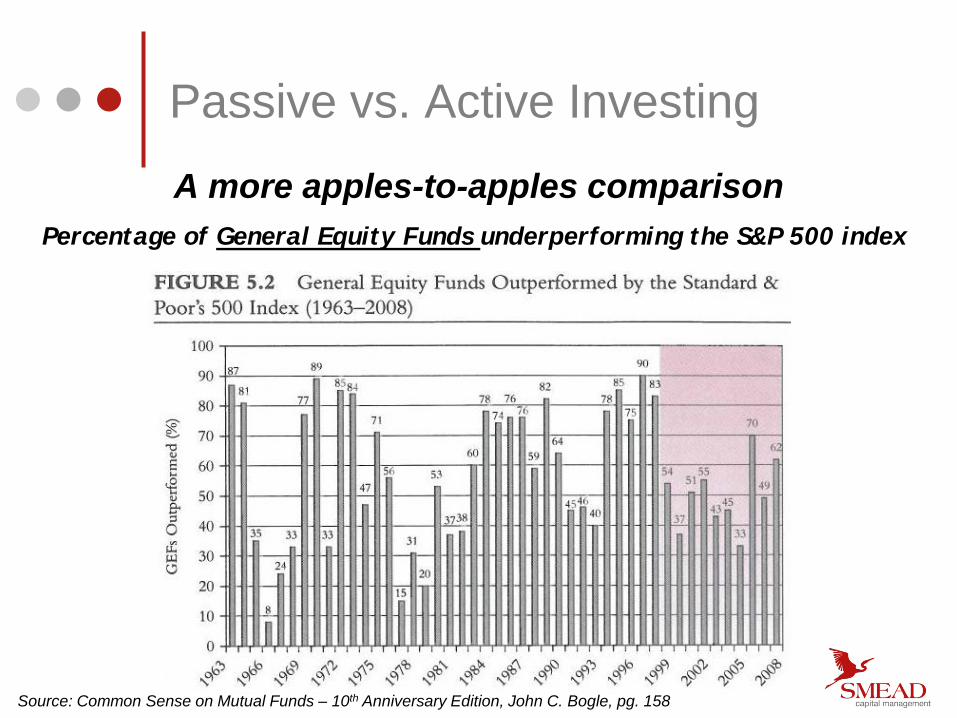
Source: Common Sense on Mutual Funds – 10th Anniversary Edition, John C. Bogle, pg. 158
Passive vs. Active Investing
Percentage of General Equity Funds underperforming the S&P 500 index
A more apples-to-apples comparison
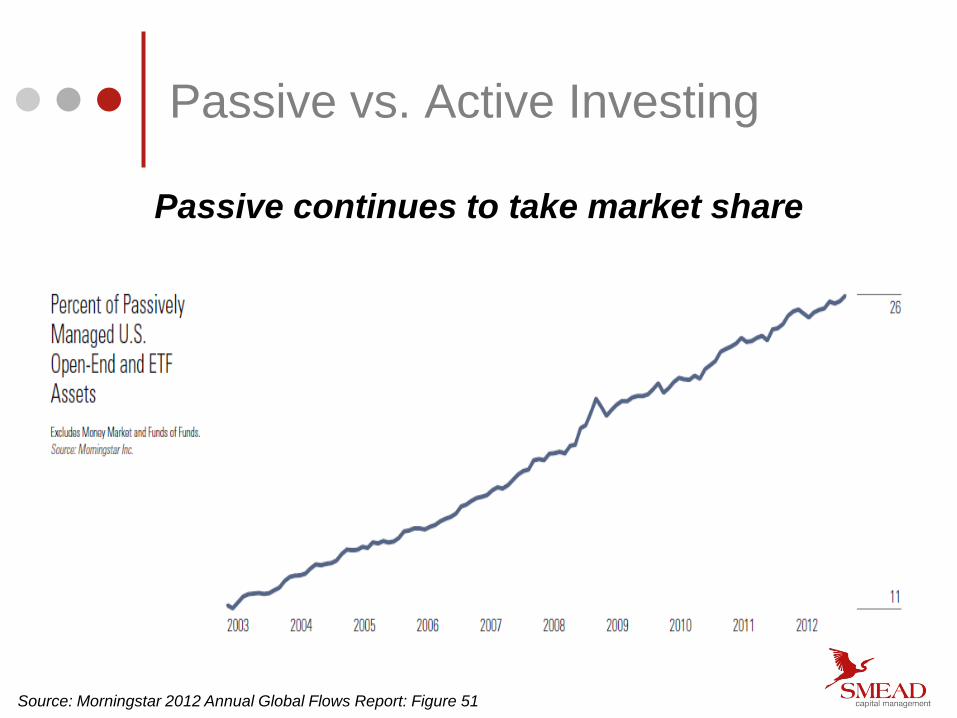
Source: Morningstar 2012 Annual Global Flows Report: Figure 51
Passive vs. Active Investing
Passive continues to take market share
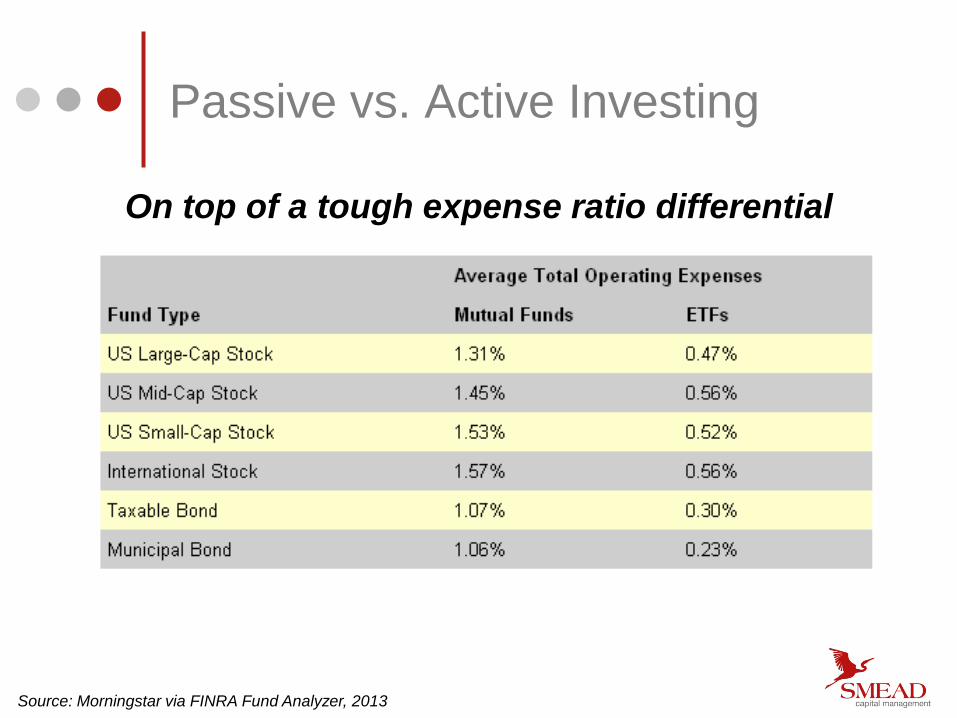
Source: Morningstar via FINRA Fund Analyzer, 2013
Passive vs. Active Investing
On top of a tough expense ratio differential
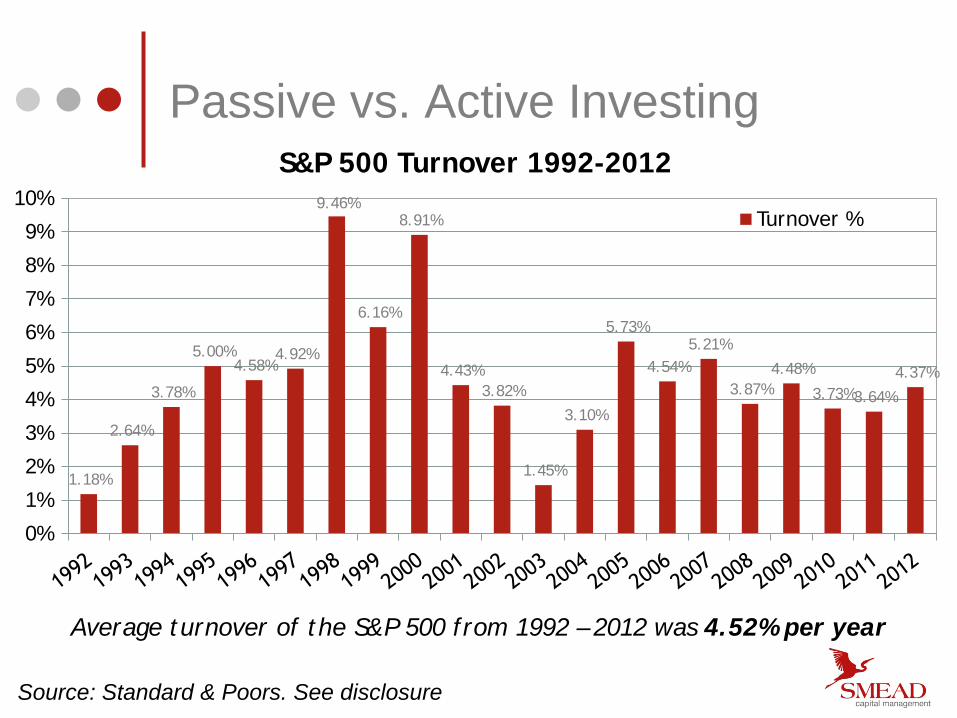
Average turnover of the S&P 500 from 1992 – 2012 was 4.52% per year
Source: Standard & Poors. See disclosure
Passive vs. Active Investing
1.18%
2.64%
3.78%
5.00% 4.58%
4.92%
9.46%
6.16%
8.91%
4.43% 3.82%
1.45%
3.10%
5.73%
4.54% 5.21%
3.87% 4.48%
3.73% 3.64%
4.37%
0%
1%
2%
3%
4%
5%
6%
7%
8%
9%
10%
S&P 500 Turnover 1992-2012
Turnover %
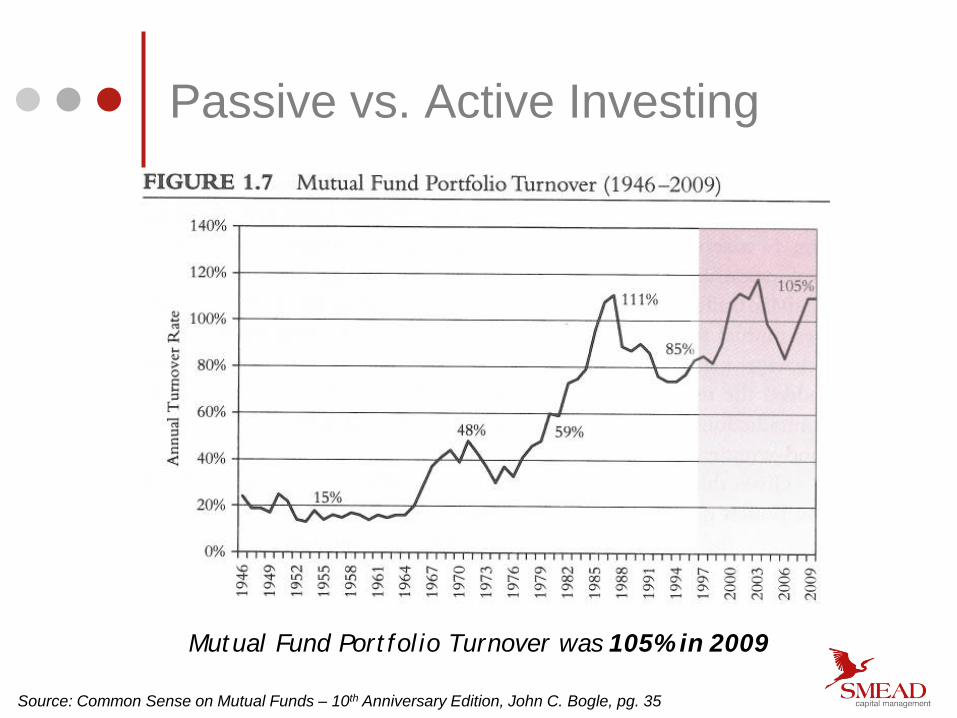
Mutual Fund Portfolio Turnover was 105% in 2009
Passive vs. Active Investing
Source: Common Sense on Mutual Funds – 10th Anniversary Edition, John C. Bogle, pg. 35
Source: WSJ “The Hidden Costs of Mutual Funds”, March 1st 2010
Passive vs. Active Investing
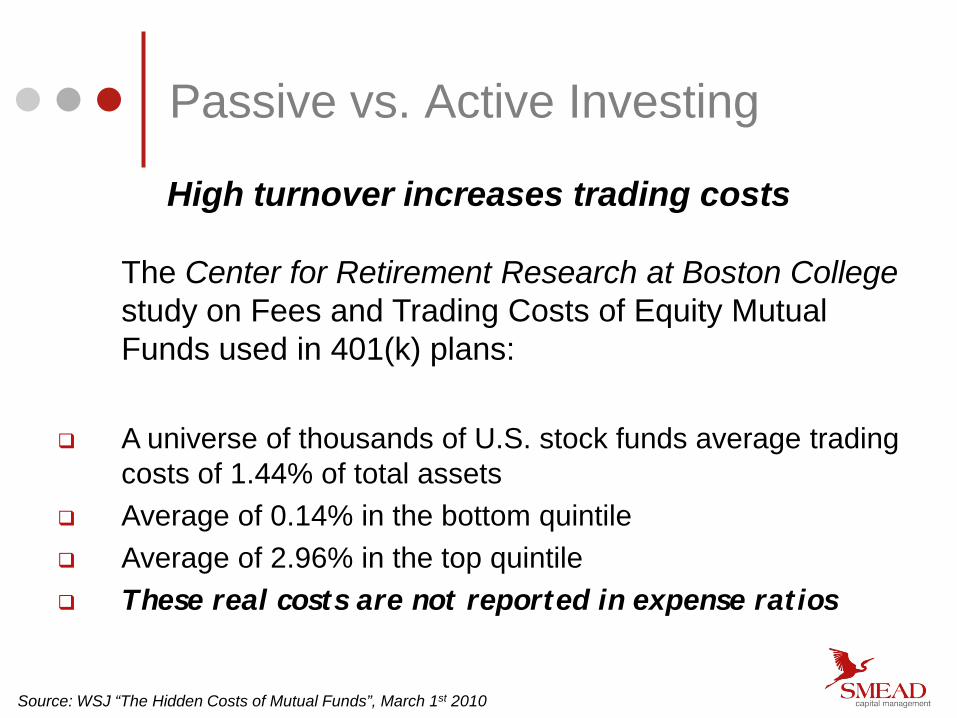
High turnover increases trading costs
The Center for Retirement Research at Boston College study on Fees and Trading Costs of Equity Mutual Funds used in 401(k) plans:
A universe of thousands of U.S. stock funds average trading costs of 1.44% of total assets
Average of 0.14% in the bottom quintile Average of 2.96% in the top quintile These real costs are not reported in expense ratios
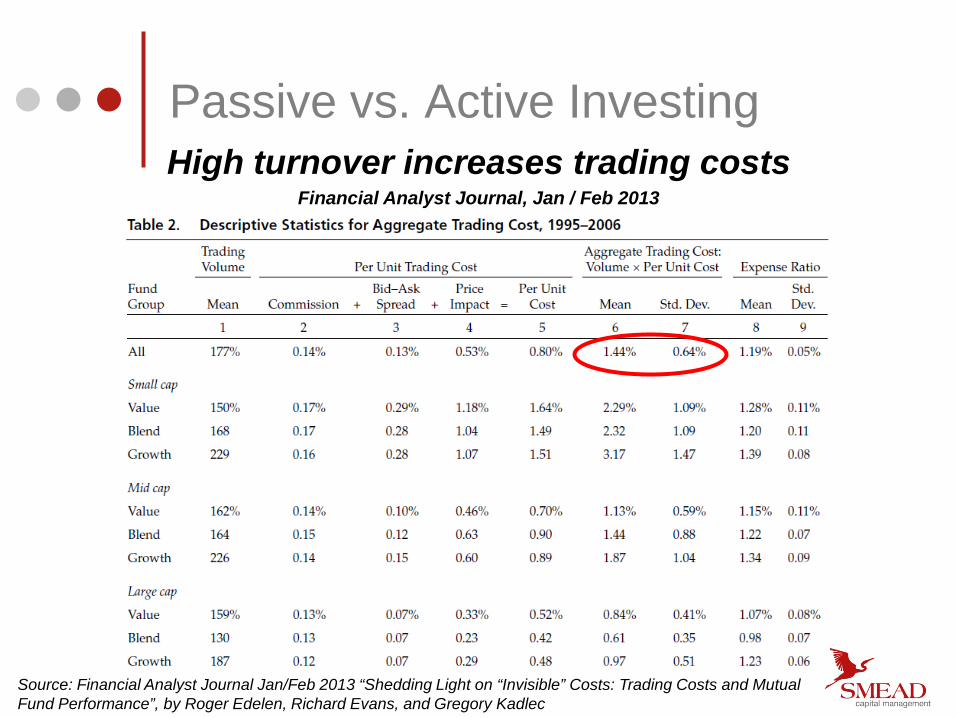
Source: Financial Analyst Journal Jan/Feb 2013 “Shedding Light on “Invisible” Costs: Trading Costs and Mutual Fund Performance”, by Roger Edelen, Richard Evans, and Gregory Kadlec
Passive vs. Active Investing High turnover increases trading costs
Financial Analyst Journal, Jan / Feb 2013
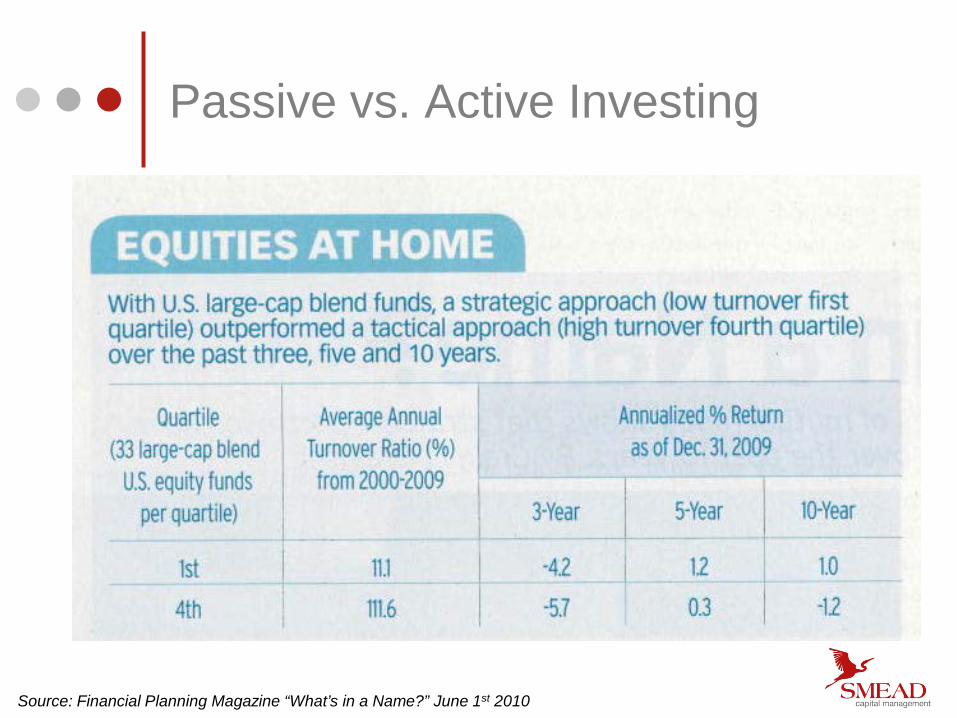
Passive vs. Active Investing
Source: Financial Planning Magazine “What’s in a Name?” June 1st 2010

Passive vs. Active Investing
Investors of Stock Portfolios Benefit from Long Holding Periods
S&P 500 Risk and Return Characteristics for select holding periods 1950-2009
Source – Oppenheimer Asset Management Investment Strategy March 8, 2010
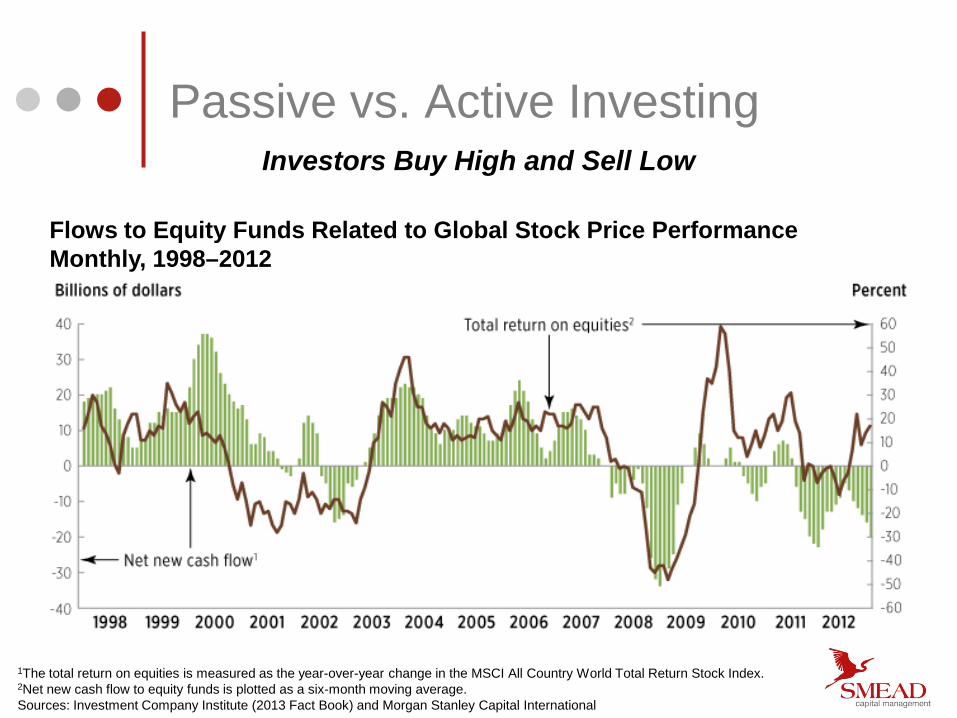
1The total return on equities is measured as the year-over-year change in the MSCI All Country World Total Return Stock Index. 2Net new cash flow to equity funds is plotted as a six-month moving average. Sources: Investment Company Institute (2013 Fact Book) and Morgan Stanley Capital International
Passive vs. Active Investing Investors Buy High and Sell Low
Flows to Equity Funds Related to Global Stock Price Performance Monthly, 1998–2012
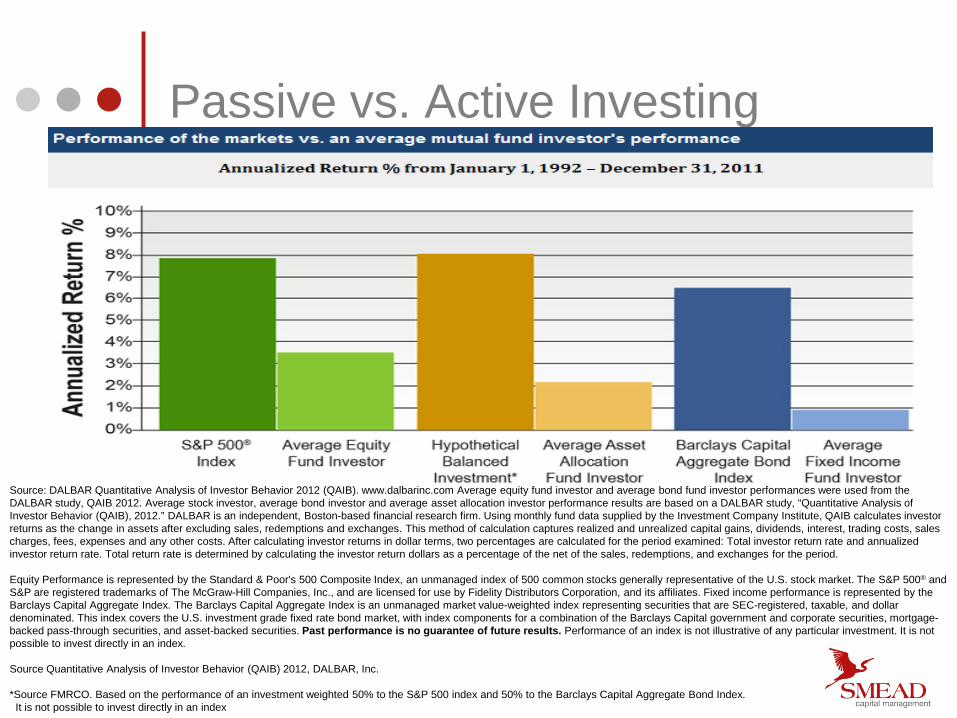
Passive vs. Active Investing
Source: DALBAR Quantitative Analysis of Investor Behavior 2012 (QAIB). www.dalbarinc.com Average equity fund investor and average bond fund investor performances were used from the DALBAR study, QAIB 2012. Average stock investor, average bond investor and average asset allocation investor performance results are based on a DALBAR study, “Quantitative Analysis of Investor Behavior (QAIB), 2012.” DALBAR is an independent, Boston-based financial research firm. Using monthly fund data supplied by the Investment Company Institute, QAIB calculates investor returns as the change in assets after excluding sales, redemptions and exchanges. This method of calculation captures realized and unrealized capital gains, dividends, interest, trading costs, sales charges, fees, expenses and any other costs. After calculating investor returns in dollar terms, two percentages are calculated for the period examined: Total investor return rate and annualized investor return rate. Total return rate is determined by calculating the investor return dollars as a percentage of the net of the sales, redemptions, and exchanges for the period. Equity Performance is represented by the Standard & Poor's 500 Composite Index, an unmanaged index of 500 common stocks generally representative of the U.S. stock market. The S&P 500® and S&P are registered trademarks of The McGraw-Hill Companies, Inc., and are licensed for use by Fidelity Distributors Corporation, and its affiliates. Fixed income performance is represented by the Barclays Capital Aggregate Index. The Barclays Capital Aggregate Index is an unmanaged market value-weighted index representing securities that are SEC-registered, taxable, and dollar denominated. This index covers the U.S. investment grade fixed rate bond market, with index components for a combination of the Barclays Capital government and corporate securities, mortgage-backed pass-through securities, and asset-backed securities. Past performance is no guarantee of future results. Performance of an index is not illustrative of any particular investment. It is not possible to invest directly in an index. Source Quantitative Analysis of Investor Behavior (QAIB) 2012, DALBAR, Inc. *Source FMRCO. Based on the performance of an investment weighted 50% to the S&P 500 index and 50% to the Barclays Capital Aggregate Bond Index. It is not possible to invest directly in an index
Long Duration Common Stock Investing A Contrarian Manifesto
Passive Investing vs. Active Investing
Valuation Matters
Long-Duration & High-Quality
Why extend duration now?
Valuation Matters
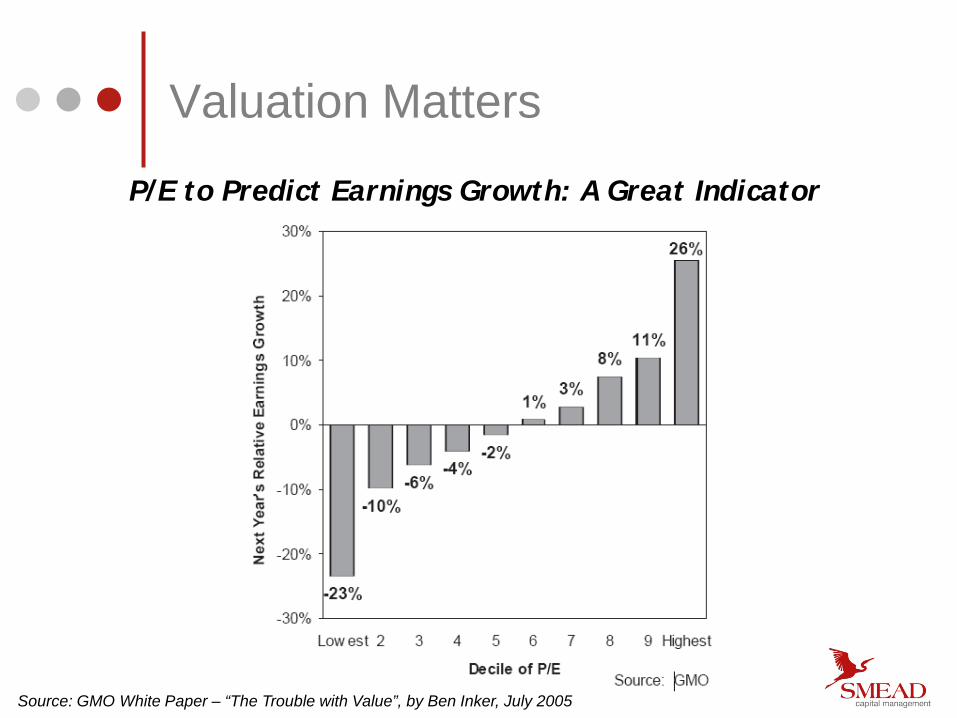
P/E to Predict Earnings Growth: A Great Indicator
Source: GMO White Paper – “The Trouble with Value”, by Ben Inker, July 2005
Valuation Matters
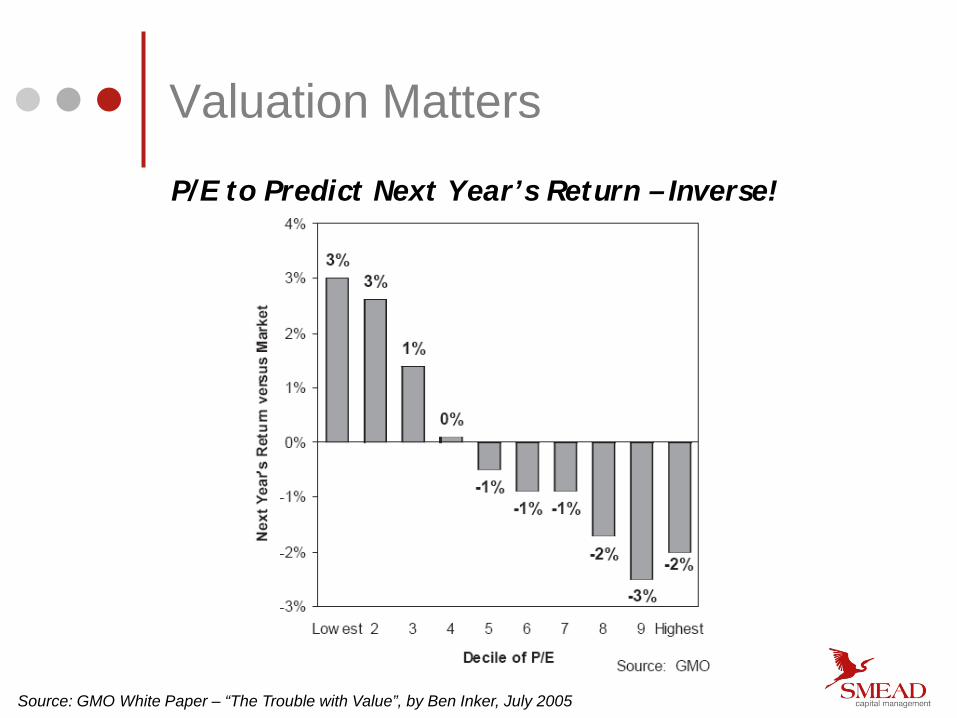
P/E to Predict Next Year’s Return – Inverse!
Source: GMO White Paper – “The Trouble with Value”, by Ben Inker, July 2005
Valuation Matters
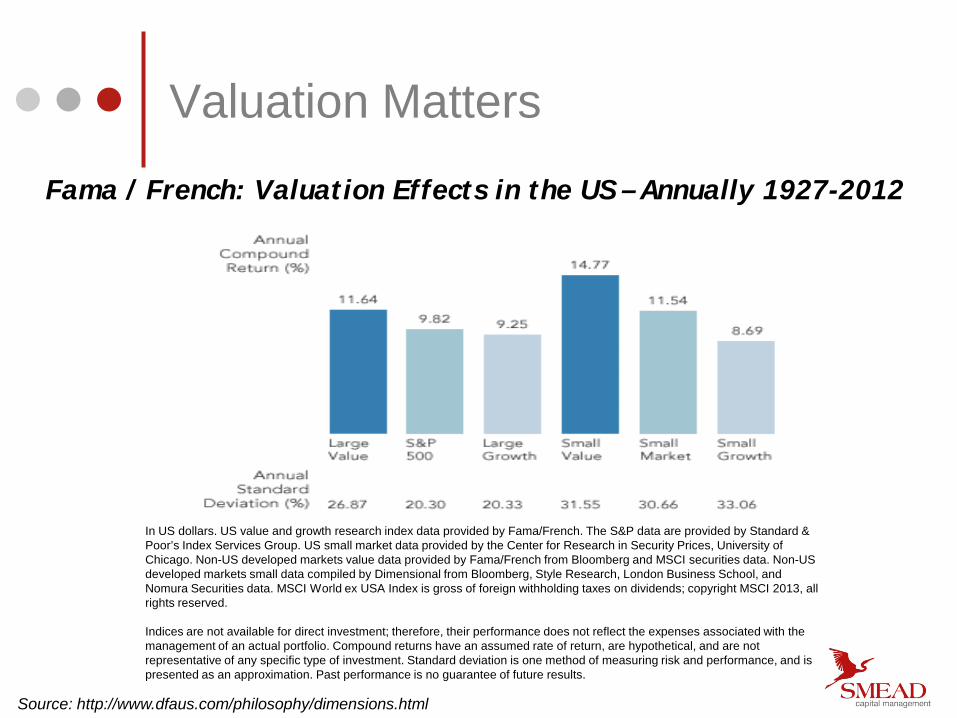
Fama / French: Valuation Effects in the US – Annually 1927-2012
Source: http://www.dfaus.com/philosophy/dimensions.html
In US dollars. US value and growth research index data provided by Fama/French. The S&P data are provided by Standard & Poor’s Index Services Group. US small market data provided by the Center for Research in Security Prices, University of Chicago. Non-US developed markets value data provided by Fama/French from Bloomberg and MSCI securities data. Non-US developed markets small data compiled by Dimensional from Bloomberg, Style Research, London Business School, and Nomura Securities data. MSCI World ex USA Index is gross of foreign withholding taxes on dividends; copyright MSCI 2013, all rights reserved. Indices are not available for direct investment; therefore, their performance does not reflect the expenses associated with the management of an actual portfolio. Compound returns have an assumed rate of return, are hypothetical, and are not representative of any specific type of investment. Standard deviation is one method of measuring risk and performance, and is presented as an approximation. Past performance is no guarantee of future results.
Valuation Matters
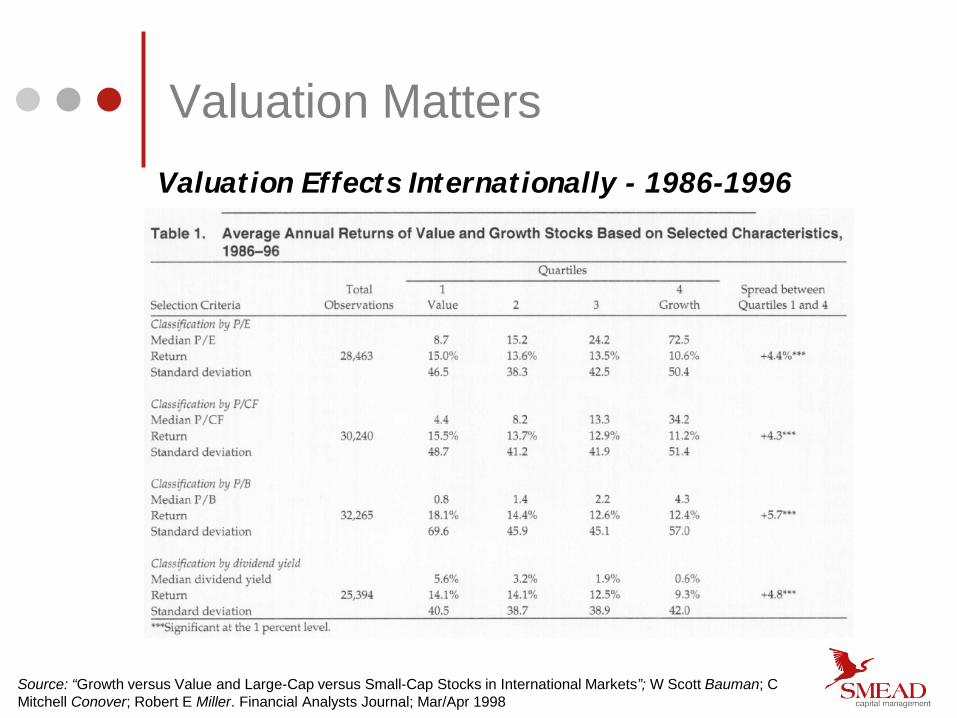
Source: “Growth versus Value and Large-Cap versus Small-Cap Stocks in International Markets”; W Scott Bauman; C Mitchell Conover; Robert E Miller. Financial Analysts Journal; Mar/Apr 1998
Valuation Effects Internationally - 1986-1996
Valuation Matters
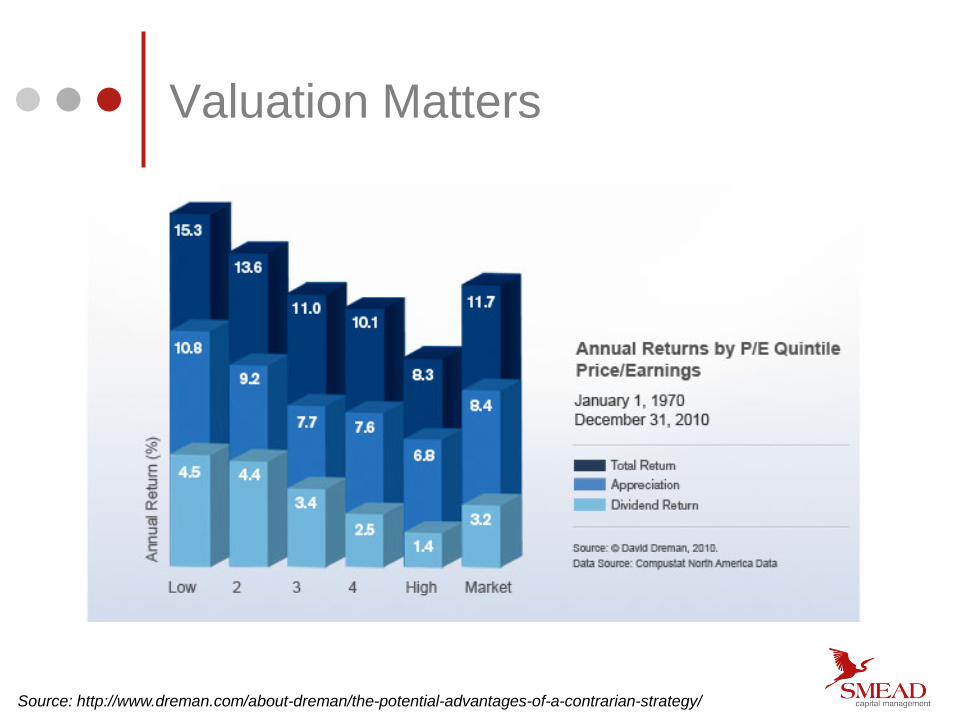
Source: http://www.dreman.com/about-dreman/the-potential-advantages-of-a-contrarian-strategy/
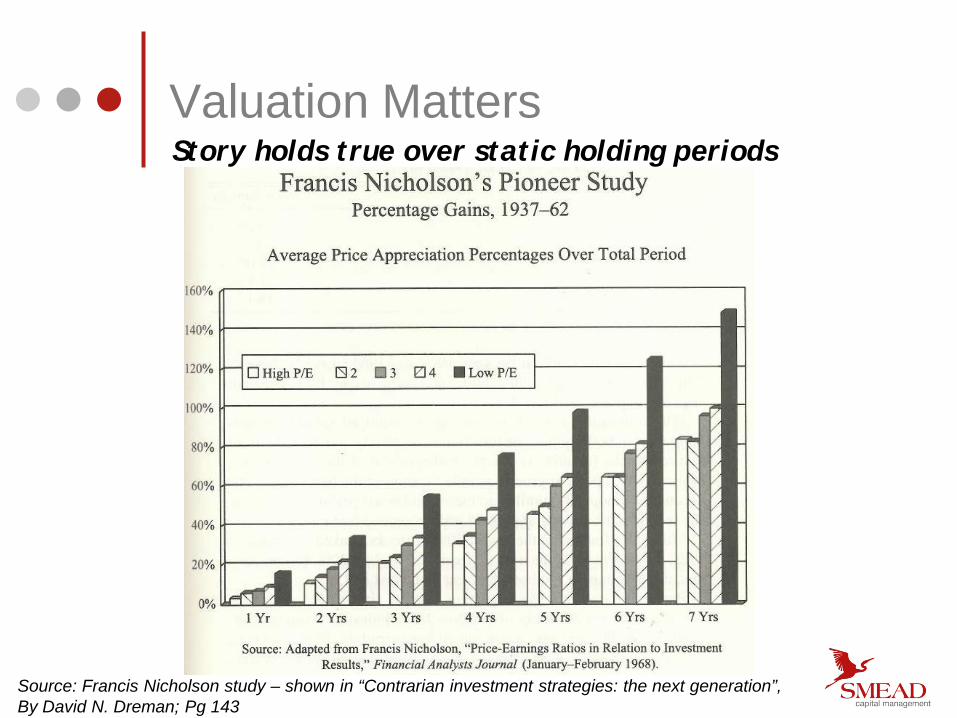
Source: Francis Nicholson study – shown in “Contrarian investment strategies: the next generation”, By David N. Dreman; Pg 143
Valuation Matters Story holds true over static holding periods
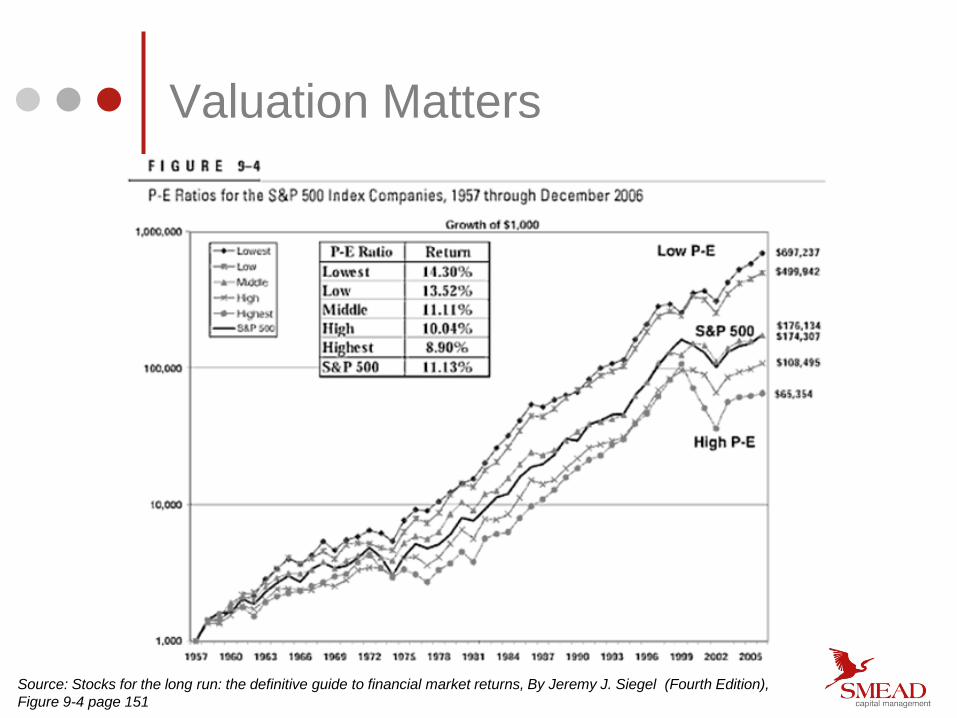
Source: Stocks for the long run: the definitive guide to financial market returns, By Jeremy J. Siegel (Fourth Edition), Figure 9-4 page 151
Valuation Matters
Long Duration Common Stock Investing A Contrarian Manifesto
Passive Investing vs. Active Investing
Valuation Matters
Long-Duration & High-Quality
Why extend duration now?
Long-Duration & High Quality
SCM’s Definition Meets an Economic Need Strong Moat High and Consistent Profitability High levels of Free Cash Flow Strong Balance Sheet
Long-Duration & High Quality
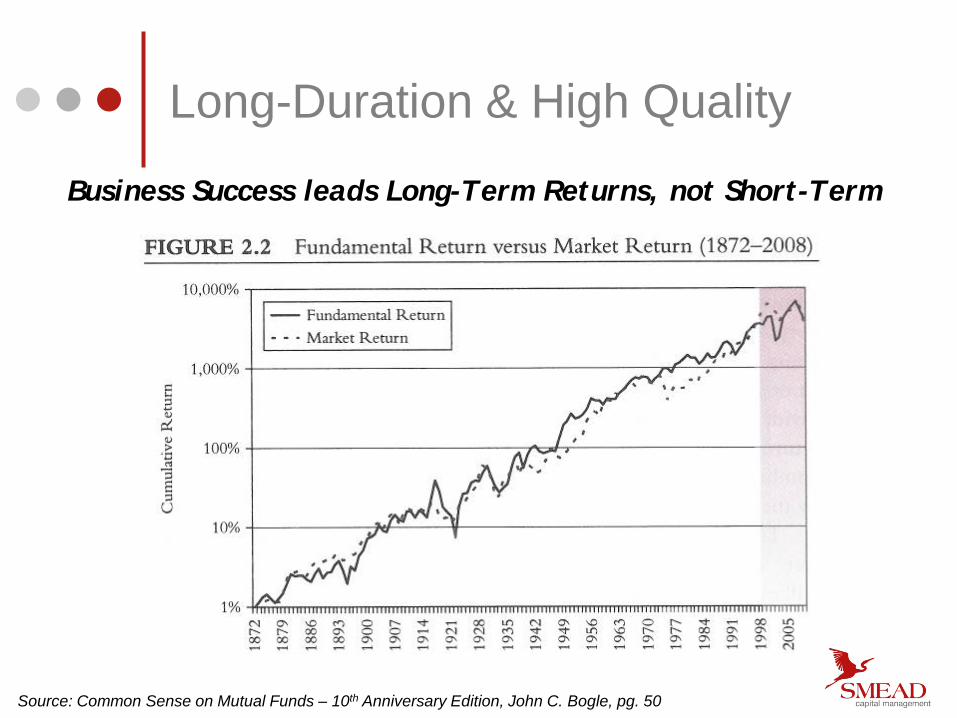
Business Success leads Long-Term Returns, not Short-Term
Source: Common Sense on Mutual Funds – 10th Anniversary Edition, John C. Bogle, pg. 50
Long-Duration & High Quality
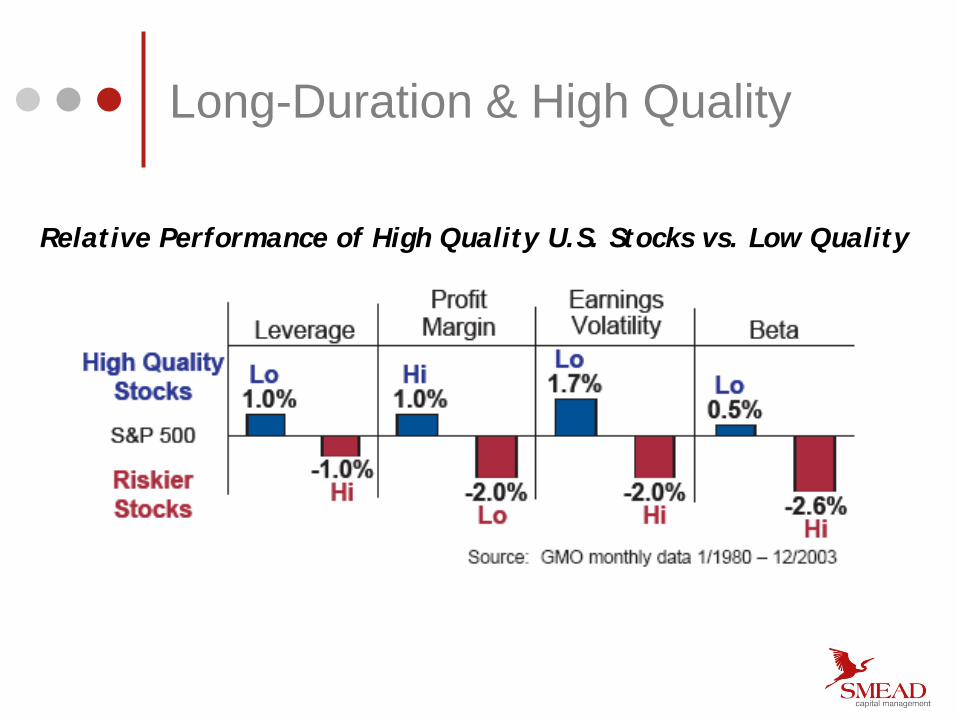
Relative Performance of High Quality U.S. Stocks vs. Low Quality
Long-Duration & High Quality
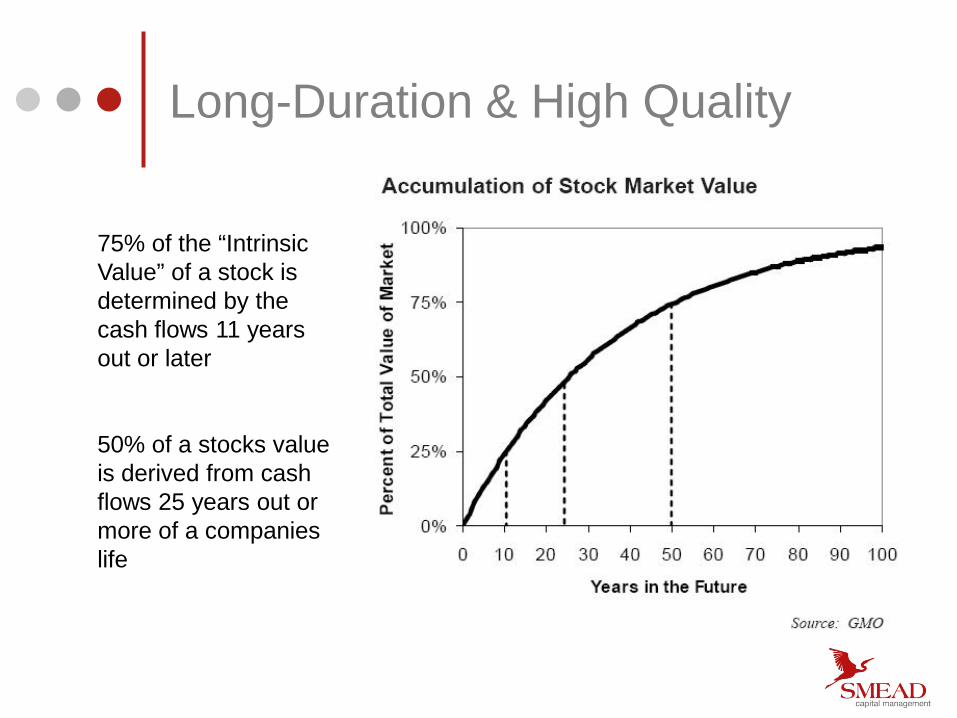
75% of the “Intrinsic Value” of a stock is determined by the cash flows 11 years out or later 50% of a stocks value is derived from cash flows 25 years out or more of a companies life
Long Duration Common Stock Investing A Contrarian Manifesto
Passive Investing vs. Active Investing
Valuation Matters
Long-Duration & High-Quality
Why extend duration now?
Why extend duration now?
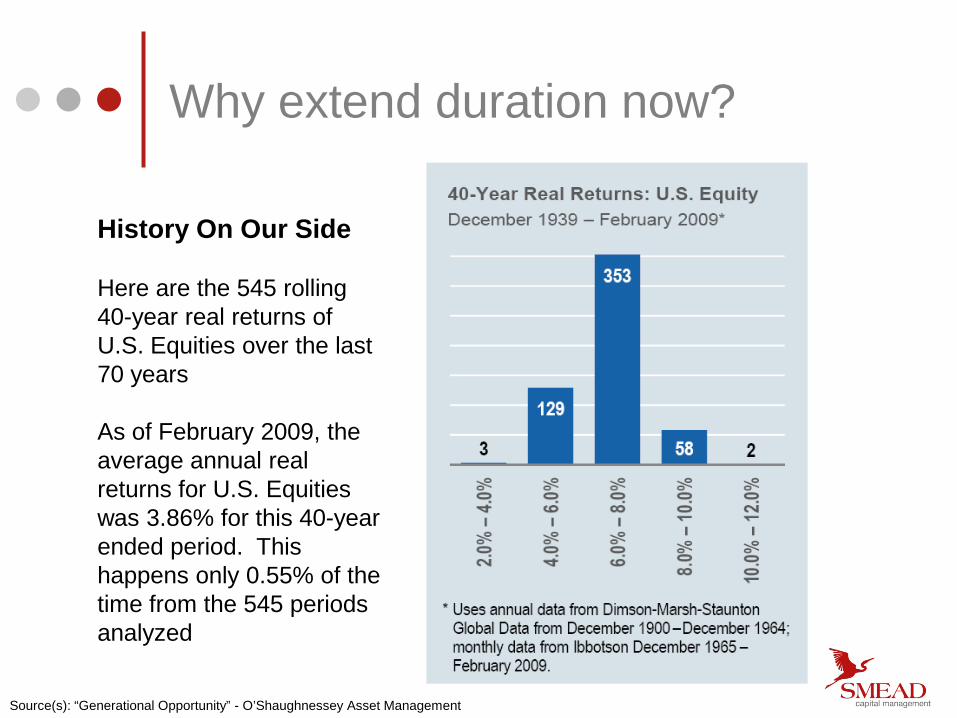
History On Our Side Here are the 545 rolling 40-year real returns of U.S. Equities over the last 70 years As of February 2009, the average annual real returns for U.S. Equities was 3.86% for this 40-year ended period. This happens only 0.55% of the time from the 545 periods analyzed
Source(s): “Generational Opportunity” - O’Shaughnessey Asset Management
Why extend duration now?
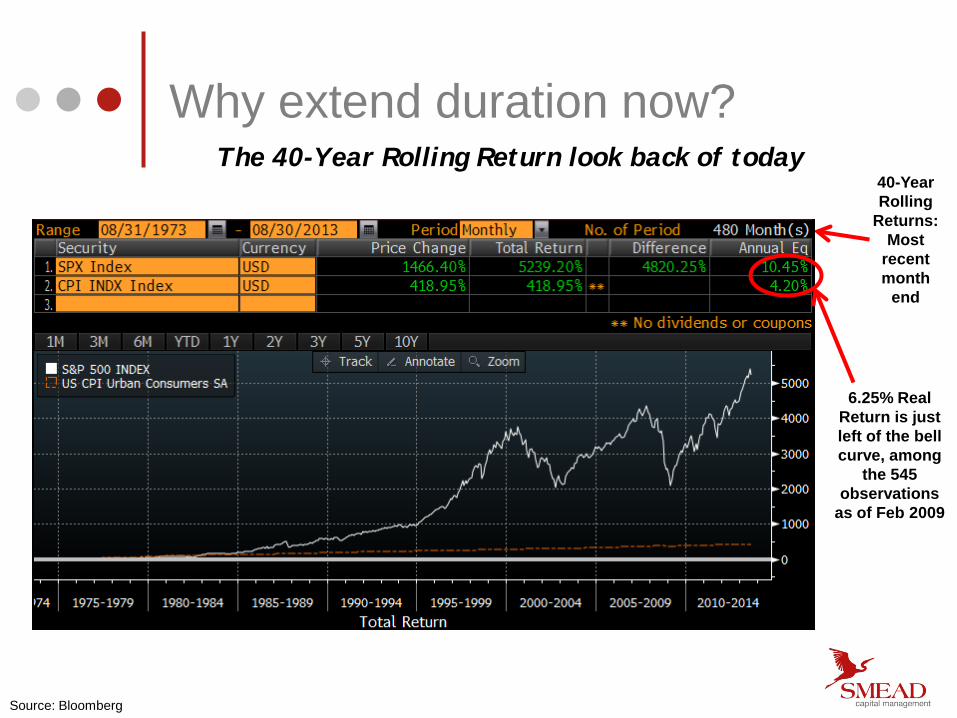
Source: Bloomberg
The 40-Year Rolling Return look back of today 40-Year Rolling
Returns: Most
recent month
end
6.25% Real Return is just left of the bell curve, among
the 545 observations
as of Feb 2009
Why extend duration now?
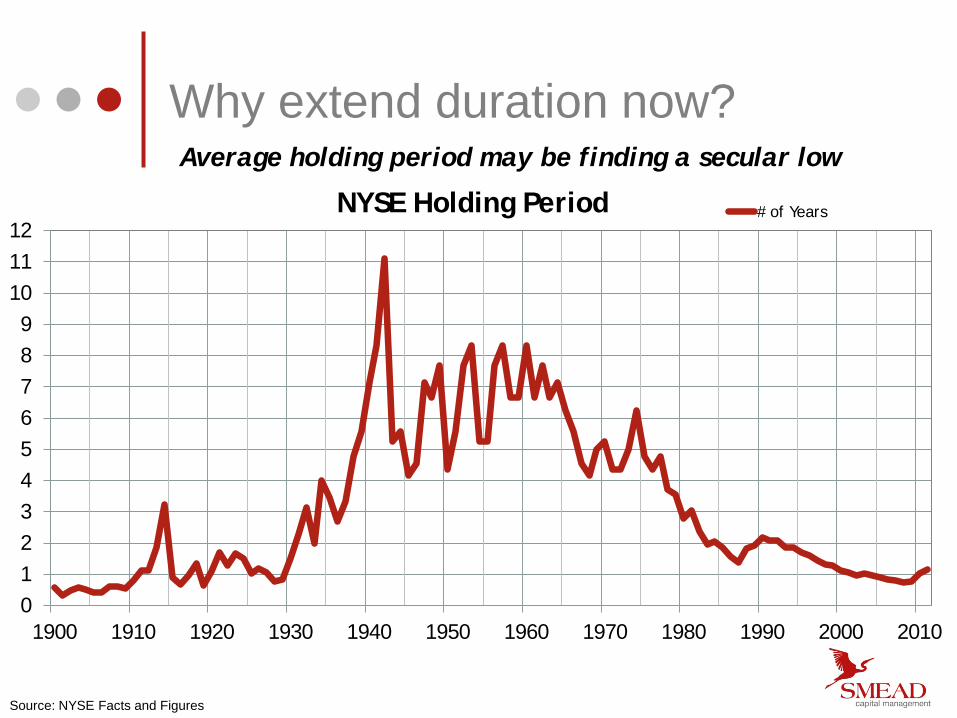
Source: NYSE Facts and Figures
Average holding period may be finding a secular low
0 1 2 3 4 5 6 7 8 9
10 11 12
1900 1910 1920 1930 1940 1950 1960 1970 1980 1990 2000 2010
NYSE Holding Period # of Years

Why extend duration now?
Source: High-Frequency Trading, Stock Volatility, and Price Discovery, page 41, by X. Frank Zhang / Yale University December 2010
High-Frequency Trading in Dollar Volume from 1995 Q1 – 2009 Q2
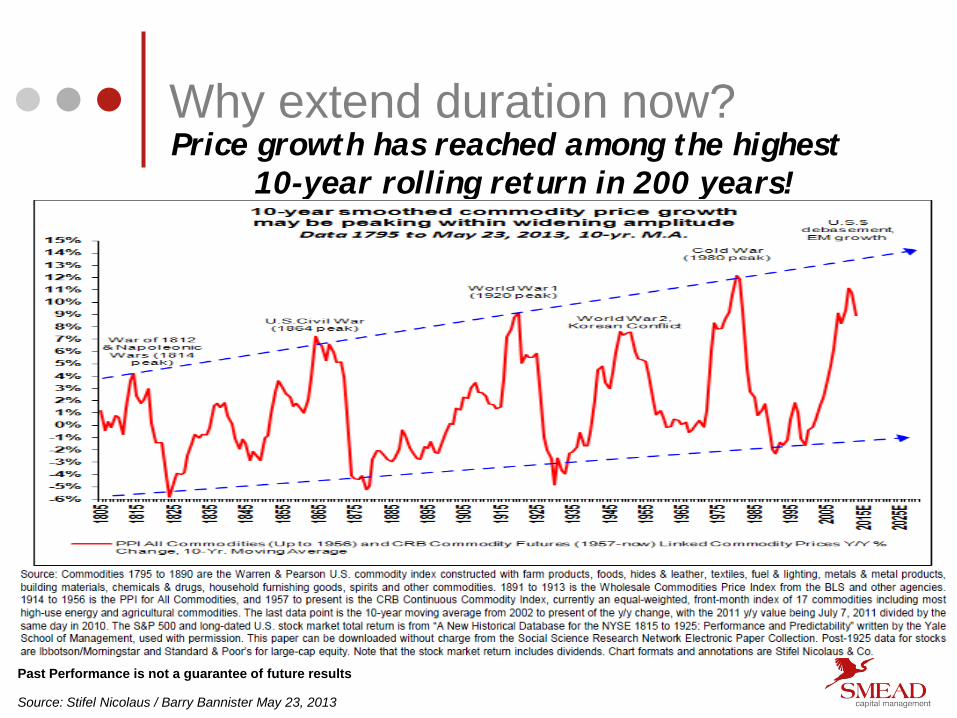
Why extend duration now? Price growth has reached among the highest
10-year rolling return in 200 years!
Past Performance is not a guarantee of future results
Source: Stifel Nicolaus / Barry Bannister May 23, 2013
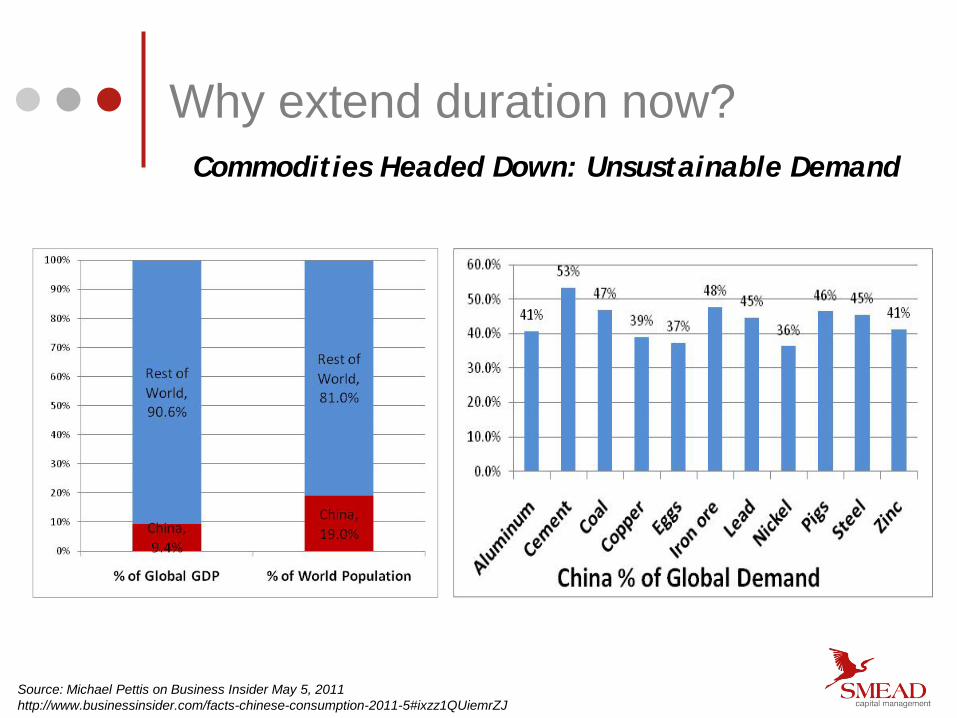
Source: Michael Pettis on Business Insider May 5, 2011 http://www.businessinsider.com/facts-chinese-consumption-2011-5#ixzz1QUiemrZJ
Commodities Headed Down: Unsustainable Demand
Why extend duration now?
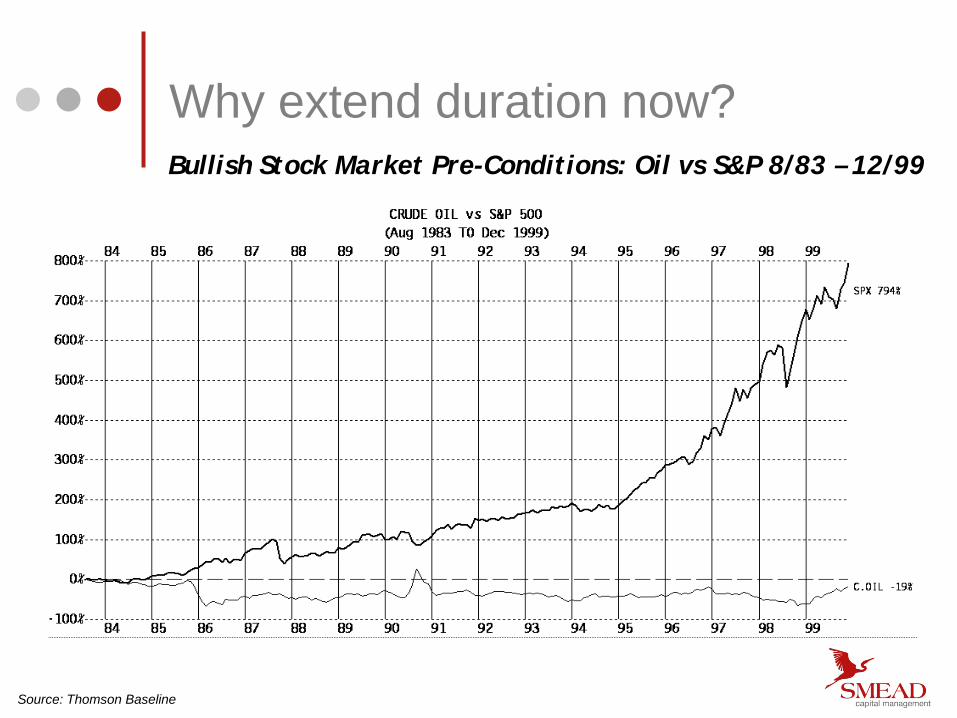
Source: Thomson Baseline
Bullish Stock Market Pre-Conditions: Oil vs S&P 8/83 – 12/99
Why extend duration now?
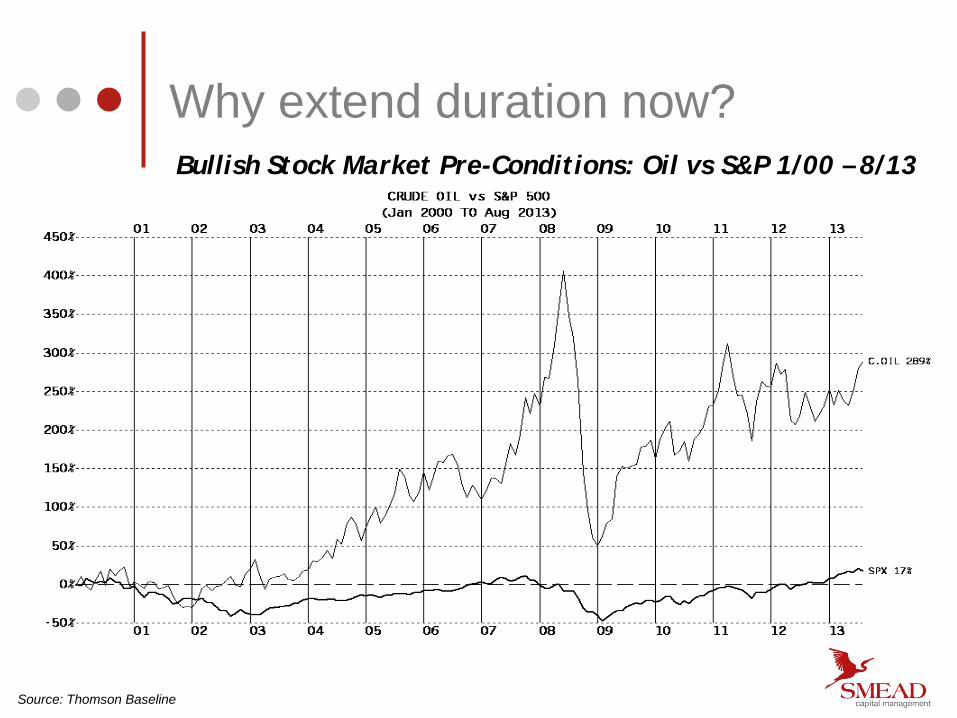
Source: Thomson Baseline
Bullish Stock Market Pre-Conditions: Oil vs S&P 1/00 – 8/13
Why extend duration now?
Source: Thomson Baseline
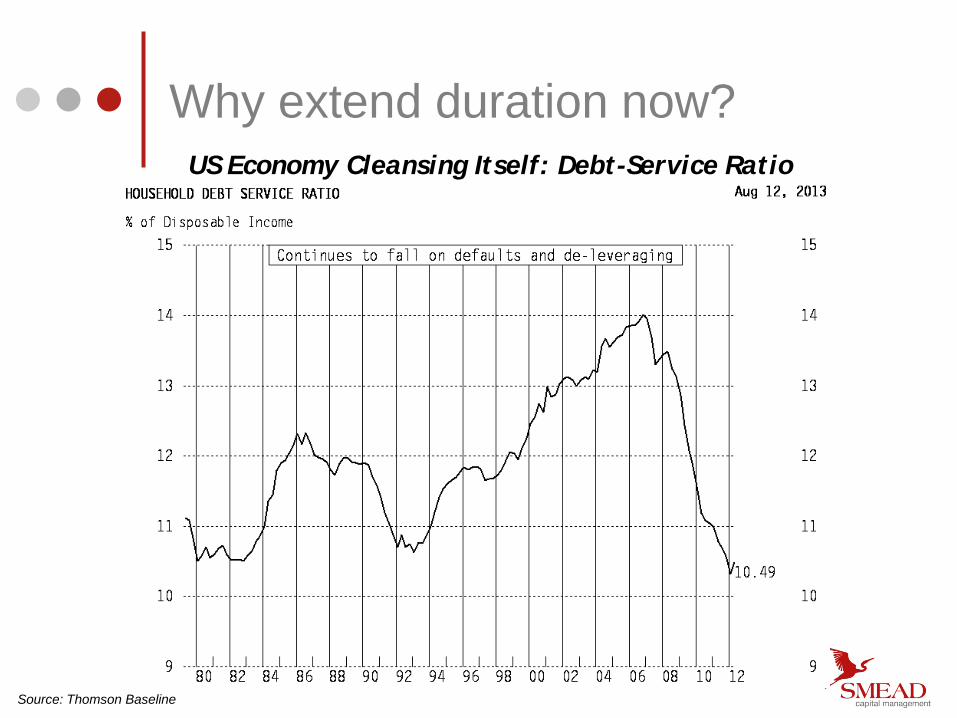
Why extend duration now? US Economy Cleansing Itself: Debt-Service Ratio
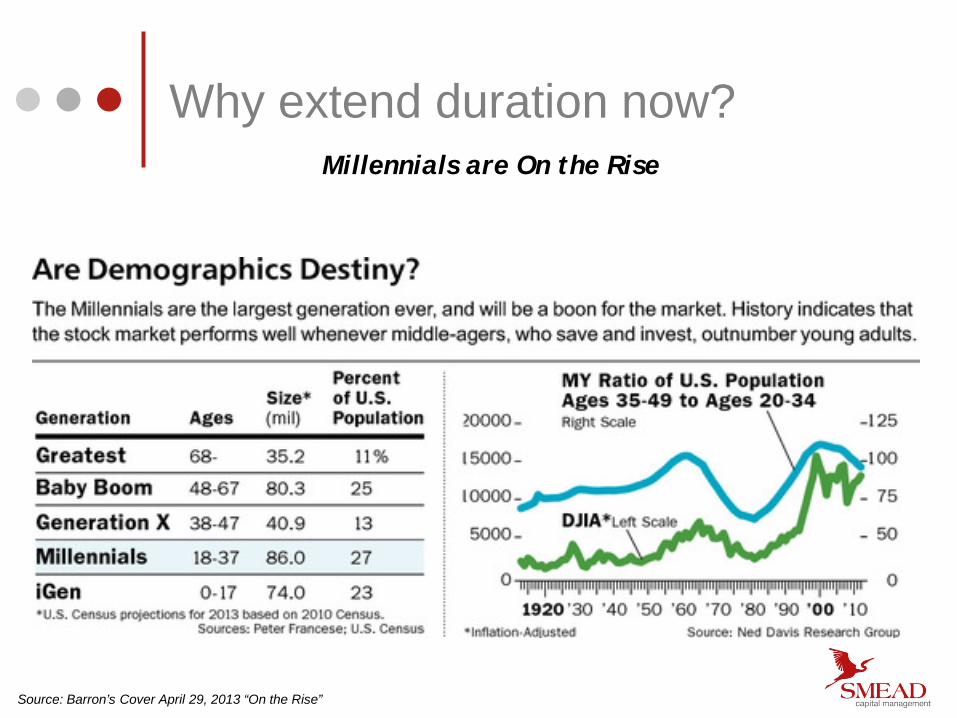
Source: Barron’s Cover April 29, 2013 “On the Rise”
Why extend duration now? Millennials are On the Rise
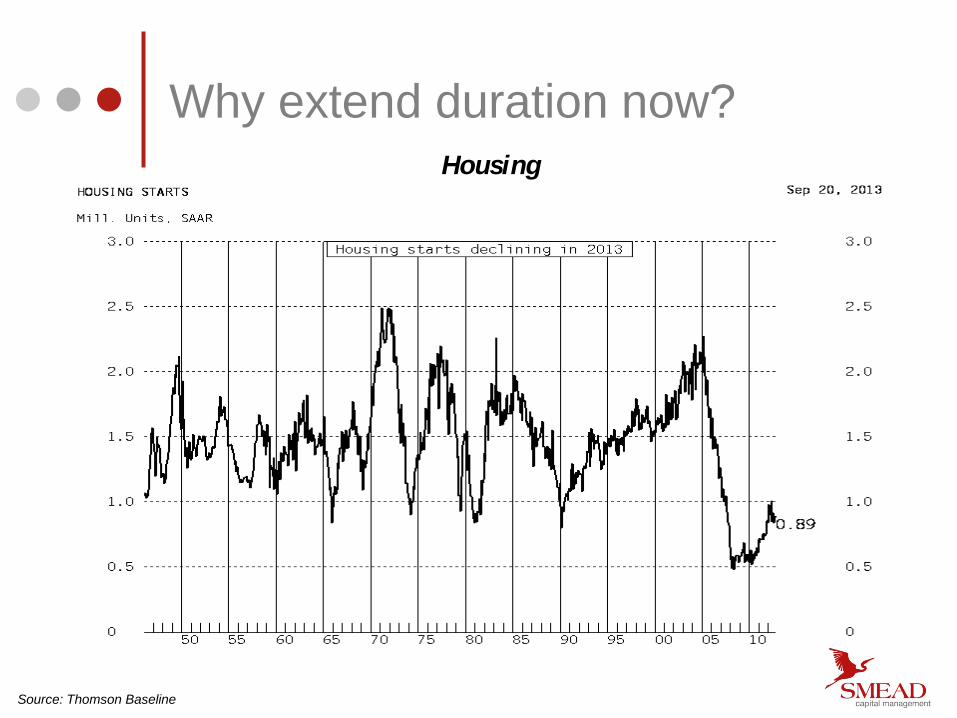
Why extend duration now? Housing
Source: Thomson Baseline
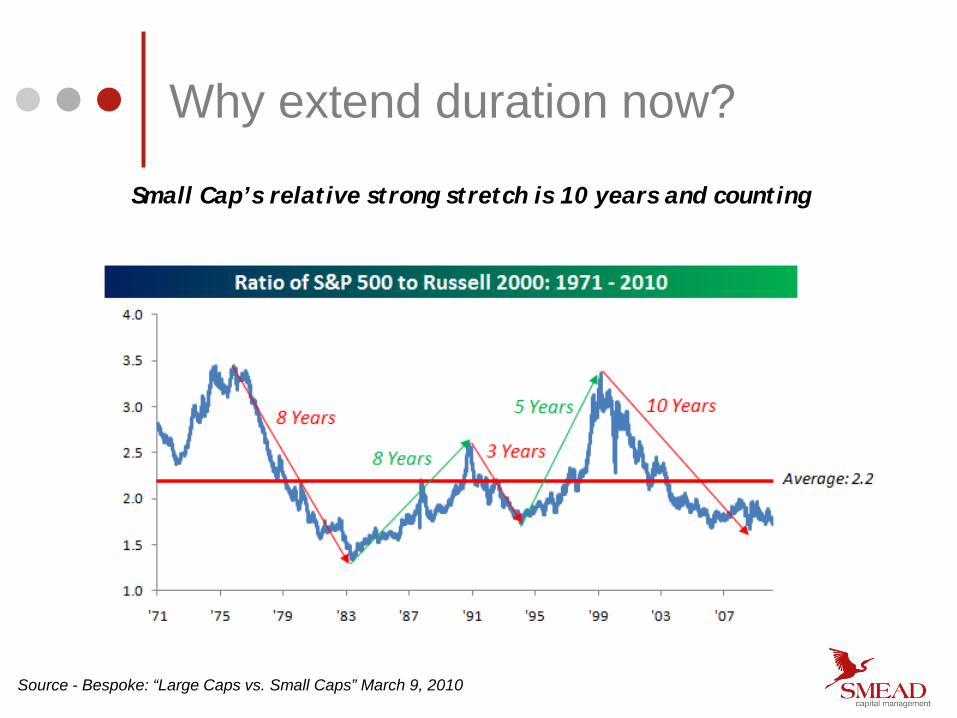
Small Cap’s relative strong stretch is 10 years and counting
Source - Bespoke: “Large Caps vs. Small Caps” March 9, 2010
Why extend duration now?
Why extend duration now?
Source: Thomson Baseline
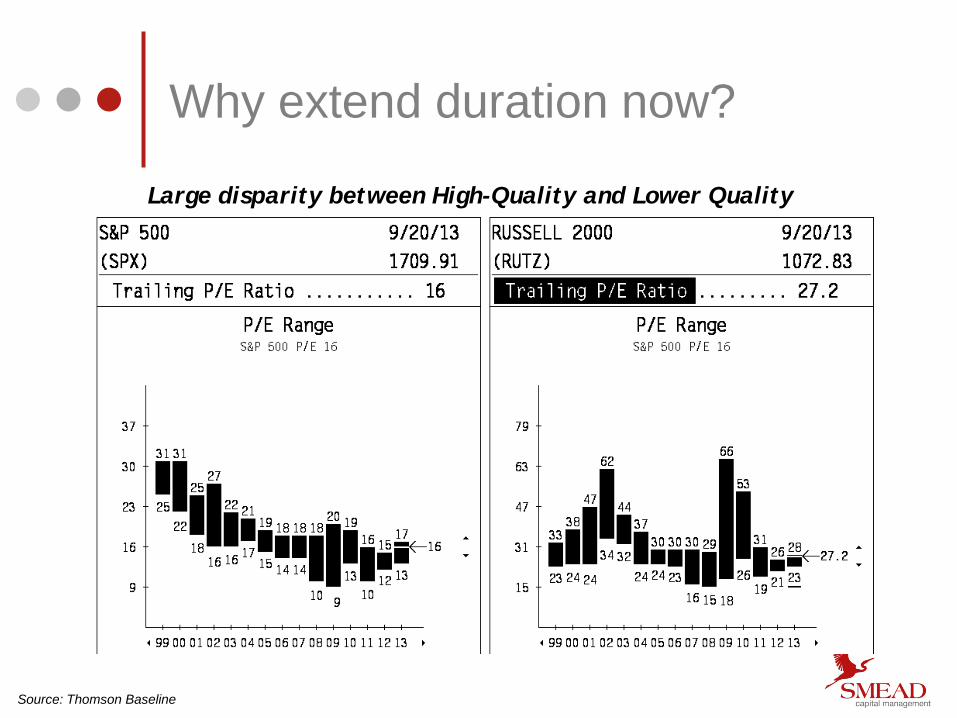
Large disparity between High-Quality and Lower Quality
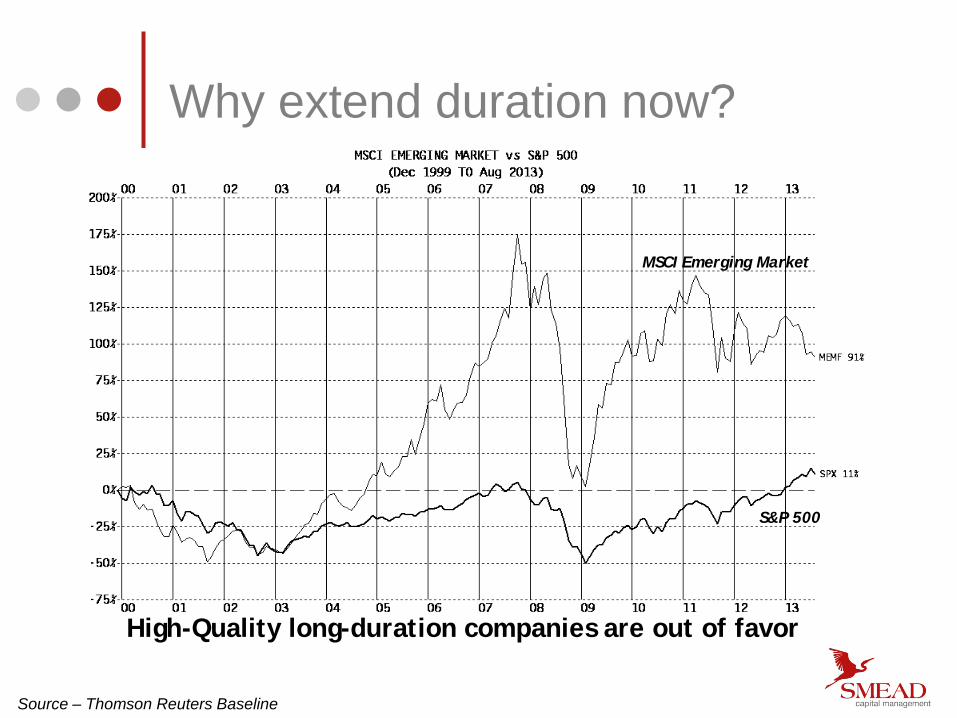
High-Quality long-duration companies are out of favor
Why extend duration now?
Source – Thomson Reuters Baseline
S&P 500
MSCI Emerging Market
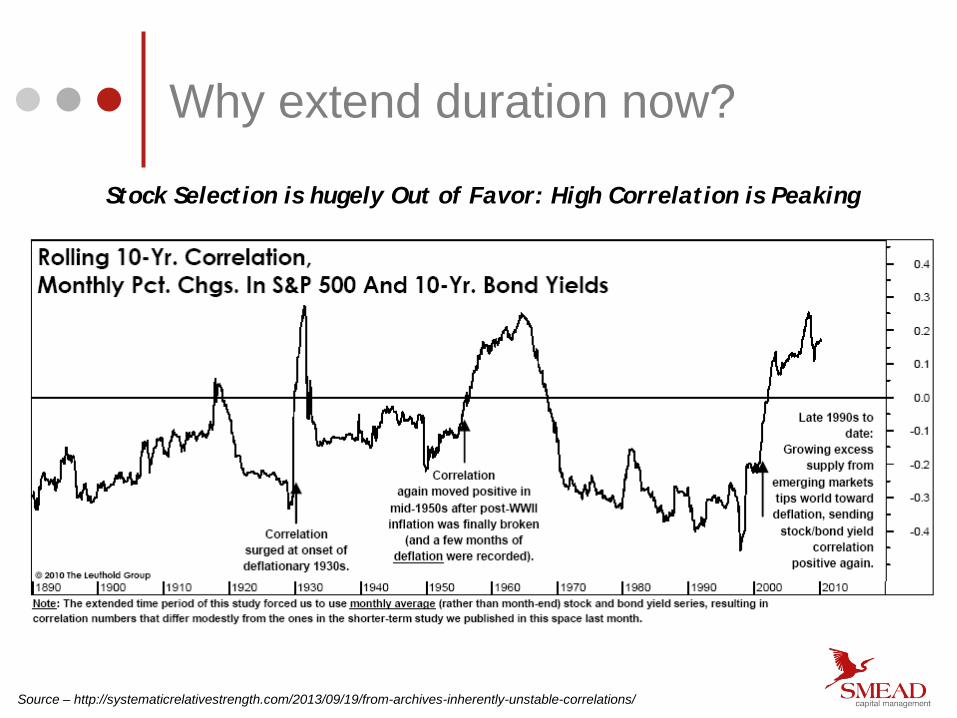
Stock Selection is hugely Out of Favor: High Correlation is Peaking
Source – http://systematicrelativestrength.com/2013/09/19/from-archives-inherently-unstable-correlations/
Why extend duration now?
Long Duration Common Stock Investing A Contrarian Manifesto
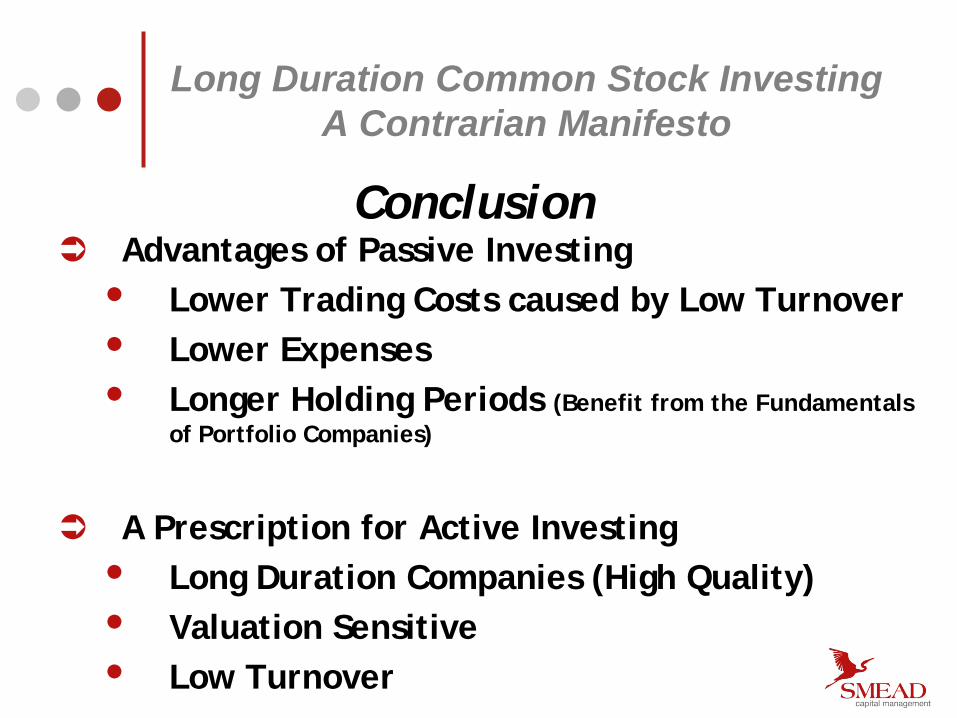
Advantages of Passive Investing • Lower Trading Costs caused by Low Turnover • Lower Expenses • Longer Holding Periods (Benefit from the Fundamentals
of Portfolio Companies)
A Prescription for Active Investing
• Long Duration Companies (High Quality) • Valuation Sensitive • Low Turnover
Conclusion
Definitions S&P 500 Index: A market-value weighted index consisting of 500 stocks chosen for market size, liquidity, and industry group representation. MSCI Emerging Markets Index: An index created by Morgan Stanley Capital International (MSCI) that is designed to measure equity market performance in global emerging markets. The Emerging Markets Index is a float-adjusted market capitalization index. Fama French U.S. Large Value Index: Provided by Fama/French from CRSP securities data. Simulated strategy of the upper-half market cap, upper 30% book-to-market NYSE, excluding utilities. Fama French U.S. Large Growth Index: Provided by Fama/French from CRSP securities data. Simulated strategy of the upper-half market cap, lower 30% book-to-market NYSE, excluding utilities. Leverage: The relationship of debt to equity. Beta: A measure of return volatility. Earnings Volatility: A measure of earnings consistency. Profit Margin: The ratio of net income to net sales of a company expressed as a percentage Price/Earnings (P/E): the ratio of a firm’s closing stock price & its trailing 12 months’ earnings/share. Price/Book (P/B): the ratio of a firm’s closing stock price & its fiscal year end book value/share. Book value: is the net asset value of a company, calculated by subtracting total liabilities from total assets. Free Cash flow: measures the cash generating capability of a company by adding non-cash charges (e.g. depreciation) and interest expense to pretax income. Price to sales ratio (P/S): is a tool for calculating a stock's valuation relative to other companies, calculated by dividing a stock's current price by its revenue per share. Book Value: A company's common stock equity as it appears on a balance sheet, equal to total assets minus liabilities, preferred stock, and intangible assets such as goodwill. Sharpe Ratio: A measure or reward-to-variability ratio is a measure of the excess return (or Risk Premium) per unit of risk in an investment asset.

Definitions (cont.) Dow Jones 30: This is the Dow Jones Industrial Average which is a price-weighted average of 30 actively traded blue chip stocks, primarily industrials. It is one of the most widely used stock market indicators. S&P 500 Growth Index: Each stock of the S&P 500 Index is categorized as being either value or growth companies based on its price-to-book ratio and growth estimates. The S&P 500 Value Index contains those securities with higher price-to-book ratios and growth estimates. S&P 500 Value Index: Each stock of the S&P 500 Index is categorized as being either value or growth companies based on its price-to-book ratio and growth estimates. The S&P 500 Value Index contains those securities with lower price-to-book ratios and growth estimates. Cash Flow: A revenue or expense stream that changes a cash account over a given period. Debt/Equity: A measure of a company's financial leverage calculated by dividing its total liabilities by stockholders' equity. ETF: a mutual fund that is traded on a stock exchange Mutual Fund Portfolio Turnover: A measure of the trading activity in the fund's portfolio of investments. In other words, how often securities are bought and sold. Trading Costs: The amount of brokerage commissions paid for buying and selling securities. Dividend Yield: The dividend per share expressed as a percentage of the share price. Price to Cash Flow (P/CF): The price/cash flow ratio is a ratio used to compare a company's market value to its cash flow. It is calculated by dividing the company's market cap by the company's operating cash flow in the most recent fiscal year (or the most recent four fiscal quarters); or, equivalently, divide the per-share stock price by the per-share operating cash flow. Russell 2000 Index: The Russell 2000 Index is a small-cap stock market index of the bottom 2,000 stocks in the Russell 3000 Index. Cap-Weighted Turnover: Portfolio turnover that is computed by taking the total market value change in a portfolio/index and dividing that by the index/porfolio’s total market value.
Definitions (cont.) Sharpe Ratio: A measure of the excess return (or Risk Premium) per unit of risk in an investment asset. Standard Deviation: The statistical measure of variance from the mean representing the dispersion of data (distance) from the mean. Correlation: A measure of relationship between two mathematical variables or measured data values. MSCI All Country Total Return Stock Index: The index includes a collection of stocks of all the developed and emerging markets in the world, as defined by MSCI. S&P 500 Turnover: Capitalization weighted turnover is calculated by adding the market value of company additions, company deletions, share issuances, share repurchases, special dividends, quarterly share and investable weight factor changes in the index during the year, divided by 2 and then divided by the average market value of the index over the year. From 2009 inclusive the turnover calculation is slightly changed. All remains as was described above only the calculation is done on a daily basis and summed for the period. The average of close and adjusted close market cap for the day immediately preceeding the market capitalization change date is used in the denominator to calculate that day's turnover. 200 day Commodity Chart: Source: Commodity prices are from Historical Statistics of the United States, a U.S. Census publication, and Moody’s Economy.com (Thompson/Reuters CRB Futures). We use the PPI for All. Commodities from 1795 to 1956 (12-mo. Avg.) and the CRB Futures for 1957 to present (12-mo. avg.). The last data point is the 10-year moving average from 2002 to 2011 of the y/y change, with the 2011 value being Feb-16, 2011 divided by Feb-16, 2010. The S&P 500 and long-dated U.S. stock market total return is from “A New Historical Database for the NYSE 1815 to 1925: Performance and Predictability” written by the Yale School of Management, used with permission. This paper can be downloaded without charge from the Social Science Research Network Electronic Paper Collection. Post-1925 data for stocks are from Ibbotson/Morningstar and Standard & Poor’s. Note that the stock market return included dividends. Chart formats and annotations are Stifel Nicolaus & Co.

Smead Capital Management 1420 5th Avenue, Suite 2625 Seattle, WA 98101 (877) 701-2883 www.smeadcap.com