Embed Size (px)
Citation preview
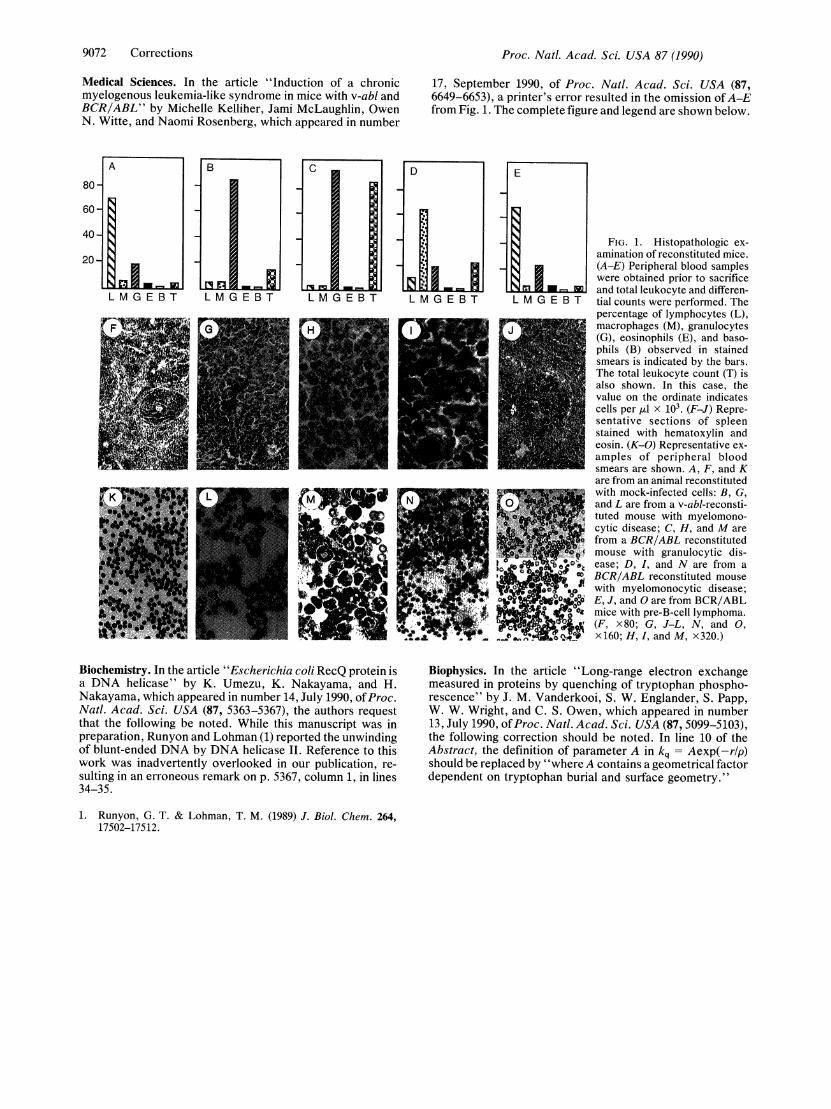
Proc. Natl. Acad. Sci. USAVol. 87, pp. 5099-5103, July 1990Biophysics
Long-range electron exchange measured in proteins by quenchingof tryptophan phosphorescence
(tunneling)
J. M. VANDERKOOI*, S. W. ENGLANDER*, S. PAPPt, W. W. WRIGHT*, AND C. S. OWENt*Department of Biochemistry and Biophysics, School of Medicine, University of Pennsylvania, Philadelphia, PA 19104; tDepartment of Biophysics, UniversityMedical School of Debrecen, H4012 Debrecen 12, Hungary; and *Biochemistry Department, School of Medicine, Jefferson Medical College,Philadelphia, PA 19107
Communicated by Mildred Cohn, April 20, 1990
ABSTRACT Ten proteins that span a wide range of phos-phorescence lifetimes were examined for sensitivity to quench-ing by four agents of disparate chemical nature. The resultsshow that quenching efficiency is relatively independent of thequencher and is highly correlated with depth of burial of thephosphorescent tryptophan. The bimolecular quenching rateconstants (kq) measured for the different proteins, spanning 5orders of magnitude in kq, are found to decrease exponentiallywith the distance (r) of the tryptophan in angstroms from theprotein surface-i.e., kq = Aexp(-r/p), where A is the effec-tive area of the protein. Theoretical analysis shows that thisbehavior can be expected for an electron-exchange reactionbetween the buried tryptophans and quenchers in solution inthe rapid diffusion limit. Therefore, the results obtained pro-vide evidence for an exponential dependence of electron-transfer rate on distance in a protein environment and evaluatethe distance parameter, p, for electron transfer through thegeneral protein matrix at 1.0 A. For a unimolecular donor-acceptor pair with ket = k~exp(-r/p), ko 109 sec'1.
In earlier work, we showed that the phenomenon of room-temperature protein phosphorescence, though previouslyseen only rarely (1, 2), in fact can be found in the greatmajority of proteins (3). Of 40 proteins surveyed, 29 werefound to exhibit phosphorescence in aqueous solution atroom temperature with a wide range of lifetimes-betweenabout 0.5 msec and 2 sec. The central requirement for theobservation of protein phosphorescence in solution is toreduce dissolved oxygen to a sufficiently low level, sinceoxygen can efficiently quench the excited tryptophan tripletstate, even when the tryptophan is buried in the proteinmatrix (3-6).A subsequent study (7) revealed that a variety of small-
molecule agents in addition to dioxygen can quench thephosphorescence of protein tryptophans. Surprisingly, eventhough the phosphorescent tryptophans are well buriedwithin the protein, the quenching efficiency of most of theagents tested (those larger than three atoms in size) was foundto be independent of the size and polarity of the quenchingagent. This indicates that the quenching process does notinvolve the penetration of these quenchers through the pro-tein matrix to the position of the buried tryptophan. Althoughthe sensitivity of the different proteins to quenching wasfound to be spread over a wide range, the various agentstested all quenched any given protein with similar efficiency,indicating that the quenching reaction is determined by someproperty of the individual tryptophan or the protein itselfrather than by the particular quenching agent used. Finally,the quenching rate was essentially independent of solutionviscosity. This rules out the possibility of a protein-opening
reaction that might transiently bring the buried tryptophaninto contact with solvent and the added quenchers. All theseproperties might be explained, it was noted, if the quenchingprocess involves long-range electron transfer occurring on along time scale, so that the quenchers in solution are effec-tively in the rapid diffusion limit.The present work represents an attempt to identify the
protein parameters that determine the sensitivity of its tryp-tophans to the quenching process. We compared variousstructural parameters of 10 different proteins with theirability to be quenched by four different small-moleculeagents. The results show that quenching rate constantsdecrease exponentially with the distance of the tryptophanfrom the protein surface, consistent with an electron-exchange reaction in the rapid diffusion limit. Analysis of thedata then provides an estimate of the dependence of electron-transfer rate on distance when the intervening space is filledwith averaged protein matrix.
MATERIALS AND METHODSGlyceraldehyde-3-phosphate dehydrogenase (GAPDH) fromporcine muscle, Pronase type XIV from Streptomyces gri-seus, and protease type X from Bacillus thermoproteolyticusrokko were obtained from Sigma. Nuclease from Staphylo-coccus aureus was a gift of E. E. Lattman (Baltimore). Thesources of other proteins and supplies were as listed (7).Protein concentrations were typically 1-2 mg/ml.Oxygen was removed from the samples, and protein phos-
phorescence lifetimes were measured as described (7, 8).Quenching rate constants were obtained from the depen-dence of phosphorescence lifetimes on quencher concentra-tion as indicated in Results and ref. 7.
Solution conditions used were as follows: 0.034 M sodiumpyrophosphate at pH 8.6 for alkaline phosphatase, azurin,aldolase, Pronase, liver alcohol dehydrogenase (LADH), andthermolysin; 0.1 M NaCl/0.01 M sodium phosphate at pH 7.0for GAPDH and RNase T1; 0.01 M CAPSO [3-(cyclohexyl-amino)-2-hydroxy-1-propanesulfonic acid]/1 mM CaC12 atpH 9.2 for staphylococcal nuclease; and 0.1 M NaCl/1 mMCaCl2/0.01 M Tris at pH 7.0 for parvalbumin. Temperaturewas =22°C.
Coordinates for alkaline phosphatase were obtained fromH. W. Wyckoff(New Haven, CT). Other protein coordinateswere obtained from the Brookhaven Protein Data Bank (9).Protein structures were analyzed by using the BIOGRAFmolecular graphics program (BioDesign, Pasadena, CA) on amicroVAX II computer to obtain the distance of the emittingtryptophans from the protein surface. The coordinates ofsolvent water were added by using the solvation option ofBIOGRAF, and structured water molecules inside the proteinwere excluded. Distances between the tryptophan indole ring
Abbreviations: LADH, liver alcohol dehydrogenase; GAPDH, glyc-eraldehyde-3-phosphate dehydrogenase.
5099
The publication costs of this article were defrayed in part by page chargepayment. This article must therefore be hereby marked "advertisement"in accordance with 18 U.S.C. §1734 solely to indicate this fact.
5100 Biophysics: Vanderkooi et al.
1.2+
cJ 0.90)
0.6w
0.3-
fn-0 2 4 6 lo1 12 14 16
NaN3, mM
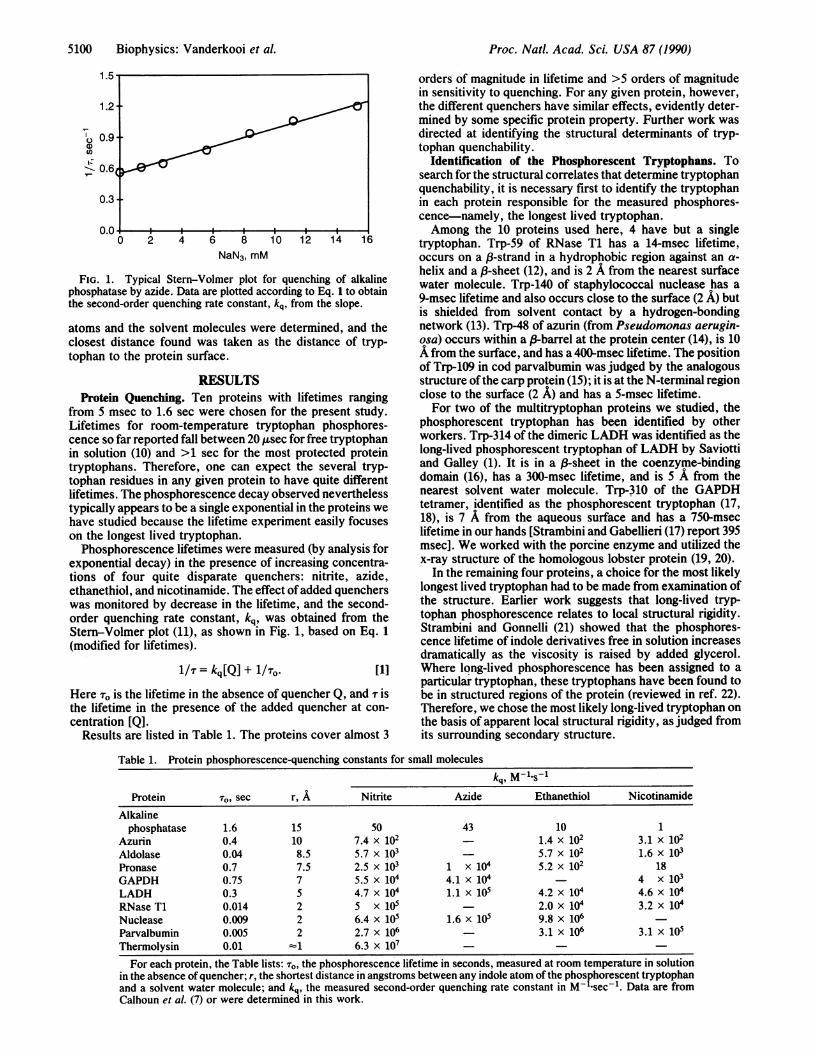
FIG. 1. Typical Stern-Volmer plot for quenching of alkalinephosphatase by azide. Data are plotted according to Eq. I to obtainthe second-order quenching rate constant, kq, from the slope.
atoms and the solvent molecules were determined, and theclosest distance found was taken as the distance of tryp-tophan to the protein surface.
RESULTSProtein Quenching. Ten proteins with lifetimes ranging
from 5 msec to 1.6 sec were chosen for the present study.Lifetimes for room-temperature tryptophan phosphores-cence so far reported fall between 20 jusec for free tryptophanin solution (10) and >1 sec for the most protected proteintryptophans. Therefore, one can expect the several tryp-tophan residues in any given protein to have quite differentlifetimes. The phosphorescence decay observed neverthelesstypically appears to be a single exponential in the proteins wehave studied because the lifetime experiment easily focuseson the longest lived tryptophan.Phosphorescence lifetimes were measured (by analysis for
exponential decay) in the presence of increasing concentra-tions of four quite disparate quenchers: nitrite, azide,ethanethiol, and nicotinamide. The effect ofadded quencherswas monitored by decrease in the lifetime, and the second-order quenching rate constant, kq, was obtained from theStem-Volmer plot (11), as shown in Fig. 1, based on Eq. 1(modified for lifetimes).
1/T = kq[Q] + 1/To. [1]
Here To is the lifetime in the absence of quencher Q, and T isthe lifetime in the presence of the added quencher at con-
centration MQI.Results are listed in Table 1. The proteins cover almost 3
orders of magnitude in lifetime and >5 orders of magnitudein sensitivity to quenching. For any given protein, however,the different quenchers have similar effects, evidently deter-mined by some specific protein property. Further work was
directed at identifying the structural determinants of tryp-tophan quenchability.
Identification of the Phosphorescent Tryptophans. Tosearch for the structural correlates that determine tryptophanquenchability, it is necessary first to identify the tryptophanin each protein responsible for the measured phosphores-cence-namely, the longest lived tryptophan.Among the 10 proteins used here, 4 have but a single
tryptophan. Trp-59 of RNase T1 has a 14-msec lifetime,occurs on a (-strand in a hydrophobic region against an a-
helix and a (-sheet (12), and is 2 A from the nearest surfacewater molecule. Trp-140 of staphylococcal nuclease has a
9-msec lifetime and also occurs close to the surface (2 A) butis shielded from solvent contact by a hydrogen-bondingnetwork (13). Trp-48 of azurin (from Pseudomonas aerugin-osa) occurs within a 3-barrel at the protein center (14), is 10A from the surface, and has a 400-msec lifetime. The positionof Trp-109 in cod parvalbumin was judged by the analogousstructure ofthe carp protein (15); it is at the N-terminal regionclose to the surface (2 A) and has a 5-msec lifetime.For two of the multitryptophan proteins we studied, the
phosphorescent tryptophan has been identified by otherworkers. Trp-314 of the dimeric LADH was identified as thelong-lived phosphorescent tryptophan of LADH by Saviottiand Galley (1). It is in a (3-sheet in the coenzyme-bindingdomain (16), has a 300-msec lifetime, and is 5 A from thenearest solvent water molecule. Trp-310 of the GAPDHtetramer, identified as the phosphorescent tryptophan (17,18), is 7 A from the aqueous surface and has a 750-mseclifetime in our hands [Strambini and Gabellieri (17) report 395msec]. We worked with the porcine enzyme and utilized thex-ray structure of the homologous lobster protein (19, 20).
In the remaining four proteins, a choice for the most likelylongest lived tryptophan had to be made from examination ofthe structure. Earlier work suggests that long-lived tryp-tophan phosphorescence relates to local structural rigidity.Strambini and Gonnelli (21) showed that the phosphores-cence lifetime of indole derivatives free in solution increasesdramatically as the viscosity is raised by added glycerol.Where long-lived phosphorescence has been assigned to a
particular tryptophan, these tryptophans have been found tobe in structured regions of the protein (reviewed in ref. 22).Therefore, we chose the most likely long-lived tryptophan onthe basis of apparent local structural rigidity, as judged fromits surrounding secondary structure.
Table 1. Protein phosphorescence-quenching constants for small molecules
kq, M-1ls'lProtein To. sec r, A Nitrite Azide Ethanethiol Nicotinamide
Alkalinephosphatase 1.6 15 50 43 10 1
Azurin 0.4 10 7.4 x 10² _ 1.4 x 10² 3.1 x 10²Aldolase 0.04 8.5 5.7 x 10³ 5.7 x 10² 1.6 x 10³Pronase 0.7 7.5 2.5 x 10³ 1 x 10⁴ 5.2 x 10² 18GAPDH 0.75 7 5.5 x 10⁴ 4.1 x1- 4 x 10³LADH 0.3 5 4.7 x 10⁴ 1.1 x 10⁵ 4.2 x 10⁴ 4.6 x 10⁴RNase T1 0.014 2 5 x 10⁵ 2.0 x 10⁴ 3.2 x 10⁴Nuclease 0.009 2 6.4 x 10⁵ 1.6 x 10⁵ 9.8 x 10⁶Parvalbumin 0.005 2 2.7 x 10⁶ - 3.1 x 10⁶ 3.1 x 10⁵Thermolysin 0.01 "'1 6.3 x 10⁷For each protein, the Table lists: To, the phosphorescence lifetime in seconds, measured at room temperature in solution
in the absence of quencher; r, the shortest distance in angstroms between any indole atom ofthe phosphorescent tryptophanand a solvent water molecule; and kq, the measured second-order quenching rate constant in M'1 sec1. Data are fromCalhoun et al. (7) or were determined in this work.
Proc. Natl. Acad. Sci. USA 87 (1990)
Proc. Natl. Acad. Sci. USA 87 (1990) 5101
C -
6-- 00
2j 00 2 4 6 8 10 12 14 16
Distance, A
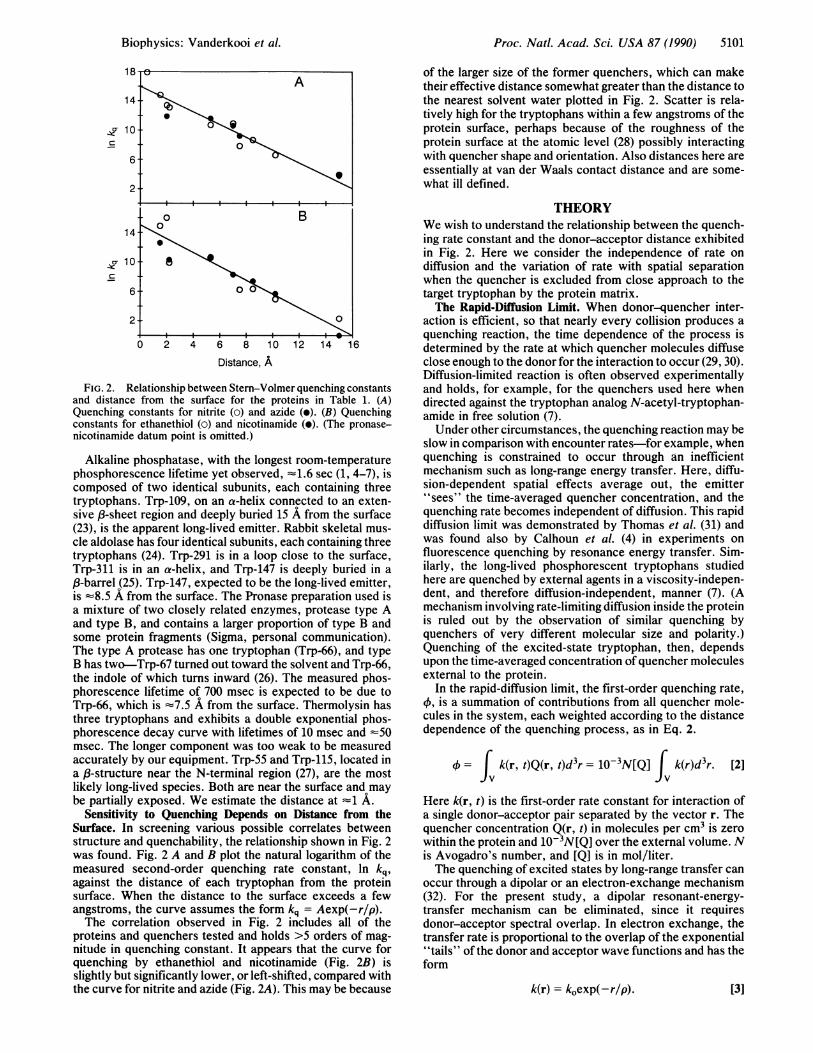
FIG. 2. Relationship between Stern-Volmer quenching constantsand distance from the surface for the proteins in Table 1. (A)Quenching constants for nitrite (0) and azide (e). (B) Quenchingconstants for ethanethiol (o) and nicotinamide (e). (The pronase-nicotinamide datum point is omitted.)
Alkaline phosphatase, with the longest room-temperaturephosphorescence lifetime yet observed, -1.6 sec (1, 4-7), iscomposed of two identical subunits, each containing threetryptophans. Trp-109, on an a-helix connected to an exten-sive p-sheet region and deeply buried 15 A from the surface(23), is the apparent long-lived emitter. Rabbit skeletal mus-cle aldolase has four identical subunits, each containing threetryptophans (24). Trp-291 is in a loop close to the surface,Trp-311 is in an a-helix, and Trp-147 is deeply buried in a,p-barrel (25). Trp-147, expected to be the long-lived emitter,is x8.5 A from the surface. The Pronase preparation used isa mixture of two closely related enzymes, protease type Aand type B, and contains a larger proportion of type B andsome protein fragments (Sigma, personal communication).The type A protease has one tryptophan (Trp-66), and typeB has two-Trp-67 turned out toward the solvent and Trp-66,the indole of which turns inward (26). The measured phos-phorescence lifetime of 700 msec is expected to be due toTrp-66, which is -7.5 A from the surface. Thermolysin hasthree tryptophans and exhibits a double exponential phos-phorescence decay curve with lifetimes of 10 msec and -50msec. The longer component was too weak to be measuredaccurately by our equipment. Trp-55 and Trp-115, located ina,8-structure near the N-terminal region (27), are the mostlikely long-lived species. Both are near the surface and maybe partially exposed. We estimate the distance at -1 A.
Sensitivity to Quenching Depends on Distance from theSurface. In screening various possible correlates betweenstructure and quenchability, the relationship shown in Fig. 2was found. Fig. 2 A and B plot the natural logarithm of themeasured second-order quenching rate constant, In kq,against the distance of each tryptophan from the proteinsurface. When the distance to the surface exceeds a fewangstroms, the curve assumes the form kq = Aexp(-r/p).The correlation observed in Fig. 2 includes all of the
proteins and quenchers tested and holds >5 orders of mag-nitude in quenching constant. It appears that the curve forquenching by ethanethiol and nicotinamide (Fig. 2B) isslightly but significantly lower, or left-shifted, compared withthe curve for nitrite and azide (Fig. 2A). This may be because
of the larger size of the former quenchers, which can maketheir effective distance somewhat greater than the distance tothe nearest solvent water plotted in Fig. 2. Scatter is rela-tively high for the tryptophans within a few angstroms of theprotein surface, perhaps because of the roughness of theprotein surface at the atomic level (28) possibly interactingwith quencher shape and orientation. Also distances here areessentially at van der Waals contact distance and are some-what ill defined.
THEORYWe wish to understand the relationship between the quench-ing rate constant and the donor-acceptor distance exhibitedin Fig. 2. Here we consider the independence of rate ondiffusion and the variation of rate with spatial separationwhen the quencher is excluded from close approach to thetarget tryptophan by the protein matrix.The Rapid-Diffusion Limit. When donor-quencher inter-
action is efficient, so that nearly every collision produces aquenching reaction, the time dependence of the process isdetermined by the rate at which quencher molecules diffuseclose enough to the donor for the interaction to occur (29, 30).Diffusion-limited reaction is often observed experimentallyand holds, for example, for the quenchers used here whendirected against the tryptophan analog N-acetyl-tryptophan-amide in free solution (7).Under other circumstances, the quenching reaction may be
slow in comparison with encounter rates-for example, whenquenching is constrained to occur through an inefficientmechanism such as long-range energy transfer. Here, diffu-sion-dependent spatial effects average out, the emitter"sees" the time-averaged quencher concentration, and thequenching rate becomes independent of diffusion. This rapiddiffusion limit was demonstrated by Thomas et al. (31) andwas found also by Calhoun et al. (4) in experiments onfluorescence quenching by resonance energy transfer. Sim-ilarly, the long-lived phosphorescent tryptophans studiedhere are quenched by external agents in a viscosity-indepen-dent, and therefore diffusion-independent, manner (7). (Amechanism involving rate-limiting diffusion inside the proteinis ruled out by the observation of similar quenching byquenchers of very different molecular size and polarity.)Quenching of the excited-state tryptophan, then, dependsupon the time-averaged concentration ofquencher moleculesexternal to the protein.
In the rapid-diffusion limit, the first-order quenching rate,X, is a summation of contributions from all quencher mole-cules in the system, each weighted according to the distancedependence of the quenching process, as in Eq. 2.
= | k(r, t)Q(r, t)d3r = 10-3N[Q] f k(r)d3r. [2]
Here k(r, t) is the first-order rate constant for interaction ofa single donor-acceptor pair separated by the vector r. Thequencher concentration Q(r, t) in molecules per cm3 is zerowithin the protein and 10-3N[Q] over the external volume. Nis Avogadro's number, and [Q] is in mol/liter.The quenching of excited states by long-range transfer can
occur through a dipolar or an electron-exchange mechanism(32). For the present study, a dipolar resonant-energy-transfer mechanism can be eliminated, since it requiresdonor-acceptor spectral overlap. In electron exchange, thetransfer rate is proportional to the overlap of the exponential"tails" of the donor and acceptor wave functions and has theform
k(r) = k~exp(-r/p). [3]
Biophysics: Vanderkooi et al.
5102 Biophysics: Vanderkooi et al.
Here k. is the first-order quenching rate when donor andquencher are in van der Waals contact, and p is the incre-mental distance between donor and acceptor for a l/e -attenuation of the transfer rate (33). For separations r that are °large in comparison with p, we make the approximation that c
r is measured center-to-center and then substitute Eq. 3 into .°Eq. 2 to obtain the second-order rate constant, 4/Q:
a)Cu
kq = 4O/Q = 103Nk0 exp(-r/p)d3r. [4] C
fv
Protein Models. To obtain kq for any given protein, theintegral of Eq. 4 can be evaluated by numerical methods overall solvent space outside of the protein by using the protein'sx-ray coordinates. For certain model cases with simplegeometrical shape, the integration can be performed to yieldresults in closed form. Pertinent examples are the sphericallysymmetric case (kqPh) with the tryptophan at the center andthe planar case (kAP) with the tryptophan buried at a fixeddistance below a protein surface having effectively infiniteradius (Fig. 3). The distance of closest approach we denoteby a.The spherical protein of radius a with a tryptophan at its
center leads to Eq. 5.
kqph = 4r10-3Nkko r2exp(-r/p)dr
= 41rO-3NkO[a2p + 2ap2 + 2p3]exp(-a/p) [Sa]
Distance, A
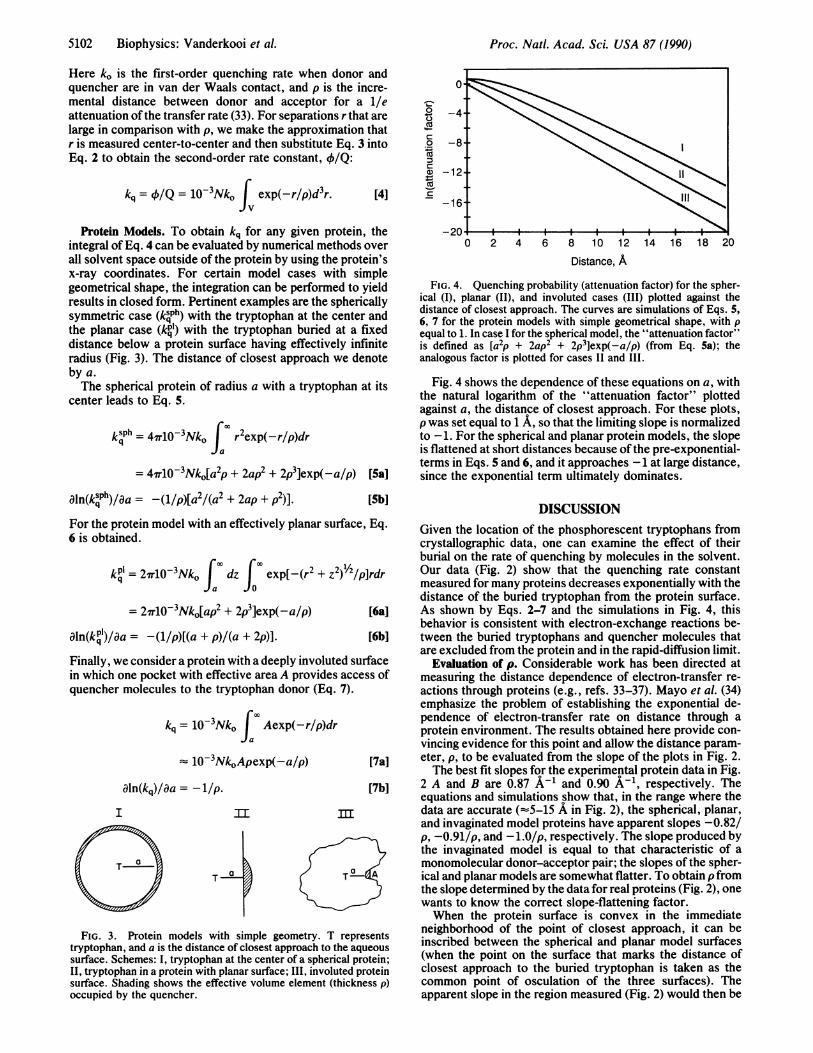
FIG. 4. Quenching probability (attenuation factor) for the spher-ical (I), planar (II), and involuted cases (III) plotted against thedistance of closest approach. The curves are simulations of Eqs. 5,6, 7 for the protein models with simple geometrical shape, with pequal to 1. In case I for the spherical model, the "attenuation factor"is defined as [a2p + 2ap2 + 2p3]exp(-a/p) (from Eq. 5a); theanalogous factor is plotted for cases II and III.
Fig. 4 shows the dependence of these equations on a, withthe natural logarithm of the "attenuation factor" plottedagainst a, the distance of closest approach. For these plots,p was set equal to 1 A, so that the limiting slope is normalizedto -1. For the spherical and planar protein models, the slopeis flattened at short distances because ofthe pre-exponential-terms in Eqs. 5 and 6, and it approaches -1 at large distance,since the exponential term ultimately dominates.
aln(ksPh)/aa = -(1/p)[a'/(a' + 2ap + p2)].Foqh rti oe iha fetvl lnrsrae q[Sb]
For the protein model with an effectively planar surface, Eq.6 is obtained.
kP-= 2r10-3Nko dz exp[-(r2 + z2) /2/p]rdr
= 27rlO-3Nko[ap2 + 2p3]exp(-a/p) [6a]
aln(kO')/aa = -(l/p)[(a + p)/(a + 2p)]. [6b]
Finally, we consider a protein with a deeply involuted surfacein which one pocket with effective area A provides access ofquencher molecules to the tryptophan donor (Eq. 7).
rxkq = 10-3Nko Aexp(-r/p)dr
10-3NkoApexp(-a/p) [7a]
aln(kq)/aa =-1/p. [7b]
I
Ta
mI
FIG. 3. Protein models with simple geometry. T representstryptophan, and a is the distance of closest approach to the aqueoussurface. Schemes: I, tryptophan at the center of a spherical protein;II, tryptophan in a protein with planar surface; III, involuted proteinsurface. Shading shows the effective volume element (thickness p)occupied by the quencher.
DISCUSSIONGiven the location of the phosphorescent tryptophans fromcrystallographic data, one can examine the effect of theirburial on the rate of quenching by molecules in the solvent.Our data (Fig. 2) show that the quenching rate constantmeasured for many proteins decreases exponentially with thedistance of the buried tryptophan from the protein surface.As shown by Eqs. 2-7 and the simulations in Fig. 4, thisbehavior is consistent with electron-exchange reactions be-tween the buried tryptophans and quencher molecules thatare excluded from the protein and in the rapid-diffusion limit.
Evaluation of p. Considerable work has been directed atmeasuring the distance dependence of electron-transfer re-actions through proteins (e.g., refs. 33-37). Mayo et al. (34)emphasize the problem of establishing the exponential de-pendence of electron-transfer rate on distance through aprotein environment. The results obtained here provide con-vincing evidence for this point and allow the distance param-eter, p, to be evaluated from the slope of the plots in Fig. 2.The best fit slopes for the experimental protein data in Fig.
2 A and B are 0.87 A-' and 0.90 A-', respectively. Theequations and simulations show that, in the range where thedata are accurate (S5-15 A in Fig. 2), the spherical, planar,and invaginated model proteins have apparent slopes -0.82/p, -0.91/p, and -1.0/p, respectively. The slope produced bythe invaginated model is equal to that characteristic of amonomolecular donor-acceptor pair; the slopes of the spher-ical and planar models are somewhat flatter. To obtain p fromthe slope determined by the data for real proteins (Fig. 2), onewants to know the correct slope-flattening factor.When the protein surface is convex in the immediate
neighborhood of the point of closest approach, it can beinscribed between the spherical and planar model surfaces(when the point on the surface that marks the distance ofclosest approach to the buried tryptophan is taken as thecommon point of osculation of the three surfaces). Theapparent slope in the region measured (Fig. 2) would then be
Proc. Natl. Acad. Sci. USA 87 (1990)
Proc. Natl. Acad. Sci. USA 87 (1990) 5103
less than -i/p by a factor between 0.82 and 0.91, the factorspertinent for spherical and planar models. Similarly, whenthe general protein surface is concave about the point ofclosest approach, the surface can be inscribed between theplanar and invaginated model cases, and the slope-flatteningfactor would be between 0.91 and 1.0. Since the processdescribed by k(r) (Eq. 3 et seq.) is exceedingly short range,quenching molecules near the point of closest approach canbe expected to dominate the behavior. Thus, as the localprotein surface diverges from sphericity at one extreme orfrom the invaginated shape at the other extreme, it quicklyapproaches the planar case, and we expect the averageslope-flattening factor to be close to 0.91. For the manyproteins studied here, differences in surface shape about thepoint of closest approach may add to the variance observedin the data (Fig. 2), but this is overwhelmed by the 5 ordersof magnitude in kq covered by the values in Fig. 2. Theseconsiderations indicate that the slope measured in Fig. 2,-0.89 A-1, should be approximated by the value -0.91/p andleads to a best estimate for p of 1.0.
In electron-tunneling theory, the distance parameter p is asensitive function of the height of the energy barrier associ-ated with tunneling through protein (38). This measure ofhowstrongly forbidden it is for an electron to be found in theprotein dictates the probability of transfer by tunneling. Ourmeasurement of 1.0 A for p can be compared with theprediction of Hopfield (38), who estimated 0.75 A for p, withgreater values predicted when the donor is an excited-statewave function. A small amount of experimental data pres-ently available for electron transfer from excited states inproteins, generally in reactions involving porphyrins, givesvalues for p between 1.1 and 1.4 A [summarized by Mayo etal. (34)]. In those experiments, single donor-acceptor pairs atfixed distances were used, so that the transfer rate may beinfluenced by specific intervening residues. Our measure-ments use many proteins to determine p, so that the valueobtained refers specifically to electron exchange when theintervening medium is represented by averaged protein ma-trix.
Evaluation of k0. An extrapolation of the data for the rateconstant kq back to zero separation distance allows anestimation of the closest-contact unimolecular rate constantkl. The data in Fig. 2 point to an intercept value for kq = e15.5and thus estimate ko, the rate constant at van der Waalscontact distance, at -i0l sec1 (using Eqs. 5a, 6a, or 7a withthe parameter A set at perhaps 10 A2). This value for k. is inagreement with the results cited by Mayo et al. (34) and ismuch smaller than the value 1013 sec1 obtained from theo-retical estimates for spin-allowed transitions. The value of kois likely to be influenced by the redox character of thereaction, geometrical factors, and the triplet nature of thedonor wave function (38, 39).
This work was supported by research grants GM 21487 (to J.V.)and DK 11295 (to S.W.E.) from the National Institutes of Health andDCB-8718274 (to C.S.O.) from the National Science Foundation.
1. Saviotti, M. L. & Galley, W. C. (1974) Proc. Natl. Acad. Sci.USA 71, 4154-4158.
2. Kai, Y. & Imakubo, K. (1979) Photochem. Photobiol. 29,261-265.
3. Vanderkooi, J. M., Calhoun, D. B. & Englander, S. W. (1987)Science 236, 568-569.
4. Calhoun, D. B., Vanderkooi, J. M., Woodrow, G. V. & En-glander, S. W. (1983) Biochemistry 22, 1526-1532.
5. Calhoun, D. B., Vanderkooi, J. M. & Englander, S. W. (1983)Biochemistry 22, 1533-1539.
6. Strambini, G. B. (1987) Biophys. J. 52, 23-28.7. Calhoun, D. B., Englander, S. W., Wright, W. W. & Vander-
kooi, J. M. (1988) Biochemistry 27, 8466-8474.8. Englander, S. W., Calhoun, D. B. & Englander, J. J. (1987)
Anal. Biochem. 161, 300-306.9. Bernstein, F. C., Koetzle, T. F., Williams, G. J. B., Meyer,
E. F., Jr., Brice, M. D., Rodgers, J. R., Kennard, O., Shiman-ouchi, T. & Tasumi, M. (1977) J. Mol. Biol. 112, 535-542.
10. Eftink, M. R. & Hagaman, K. A. (1986) Biophys. Chem. 25,277-282.
11. Stern, 0. & Volmer, M. (1919) Phys. Z. 20, 183-188.12. Heinemann, V. & Saenger, W. (1982) Nature (London) 299,
27-31.13. Cotton, F. A., Bier, C. J., Day, V. W., Hazen, E. E., Jr., &
Larsen, S. (1971) Cold Spring Harbor Symp. Quant. Biol. 36,243-255.
14. Adman, E. T., Stenkamp, R. E., Sieker, L. C. & Jensen, L. H.(1978) J. Mol. Biol. 123, 35-47.
15. Kretsinger, R. H. & Nockolds, C. E. (1973) J. Biol. Chem. 248,3313-3326.
16. Eklund, H., Nordstrom, B., Zeppezauer, E., Soderlund, G.,Ohlsson, I., Boiwe, T., Soderberg, B. O., Tapia, O., Branden,C. I. & Akeson, A. (1976) J. Mol. Biol. 102, 27-59.
17. Strambini, G. B. & Gabellieri, E. (1989) Biochemistry 28,160-166.
18. Gabellieri, E. & Strambini, G. B. (1989) Biophys. Chem. 33,257-264.
19. Moras, D., Olsen, K. W., Sabesan, M. N., Buehner, M., Ford,G. C. & Rossmann, M. G. (1975) J. Biol. Chem. 250, 9137-9162.
20. Harris, J. I. & Waters, M. (1976) Enzymes 13, 1-49.21. Strambini, G. B. & Gonnelli, M. (1985) Chem. Phys. Lett. 115,
1%-200.22. Papp, S. & Vanderkooi, J. M. (1989) Photochem. Photobiol.
49, 775-784.23. Sowadski, J. M., Handschumacher, M. D., Murthy,
H. M. K., Foster, B. A. & Wyckoff, H. W. (1985) J. Mol. Biol.186, 417-433.
24. Lai, C. Y., Nakai, N. & Chang, D. (1974) Science 183, 1204-1206.
25. Sygusch, J., Beaudry, D. & Allaire, M. (1987) Proc. Natl.Acad. Sci. USA 84, 7846-7850.
26. Delbaere, L. T. J., Hutcheon, W. L. B., James, M. N. G. &Thiessen, W. E. (1975) Nature (London) 257, 758-763.
27. Colman, P. M., Jansonius, J. N. & Matthews, B. W. (1972) J.Mol. Biol. 70, 701-724.
28. Richards, F. M. (1977) Annu. Rev. Biophys. 6, 151-176.29. Smoluchowski, M. (1918) Z. Physik. Chem. (Leipzig) 92, 129-
168.30. Collins, F. C. & Kimball, G. E. (1949) J. Colloid Sci. 4,
425-437.31. Thomas, D. D., Carlsen, W. F. & Stryer, L. (1978) Proc. Natl.
Acad. Sci. USA 75, 5746-5750.32. Turro, N. J. Modern Molecular Photochemistry, ed. (Benja-
min/Cummings, Menlo Park, CA), pp. 296-361.33. Dexter, D. L. (1953) J. Chem. Phys. 21, 836-850.34. Mayo, S. L., Ellis, W. R., Jr., Crutchley, R. J. & Gray, H. B.
(1986) Science 233, 948-952.35. McLendon, G. (1988) Acc. Chem. Res. 21, 160-167.36. Bechtold, R., Kuehn, C., Lepre, C. & Isied, S. S. (1986)
Nature (London) 322, 286-288.37. Natan, M. J. & Hoffman, B. M. (1989) J. Am. Chem. Soc. 111,
6468-6470.38. Hopfield, J. J. (1974) Proc Natl. Acad. Sci. USA 71, 3640-
3644.39. Marcus, R. A. (1956) J. Chem. Phys. 24, 966-978.
Biophysics: Vanderkooi et al.


![Ceramics based on calcium pyrophosphate nanopowders 19 02.pdf · 9 Processing and Application of Ceramics 7 [1] (2013) 9–14 Ceramics based on calcium pyrophosphate nanopowders Tatiana](https://img.pdfslide.net/doc/110x75/5eda4b32b3745412b571196b/ceramics-based-on-calcium-pyrophosphate-19-02pdf-9-processing-and-application.jpg)


![Review Phosphate/Pyrophosphate and MV-related Proteins in ...lation of PPi in the extracellular matrix [7], suggesting that TNSALP is required to promote calcification by removing](https://img.pdfslide.net/doc/110x75/608c128f6831c178dd1a6b7a/review-phosphatepyrophosphate-and-mv-related-proteins-in-lation-of-ppi-in-the.jpg)