Embed Size (px)
Citation preview
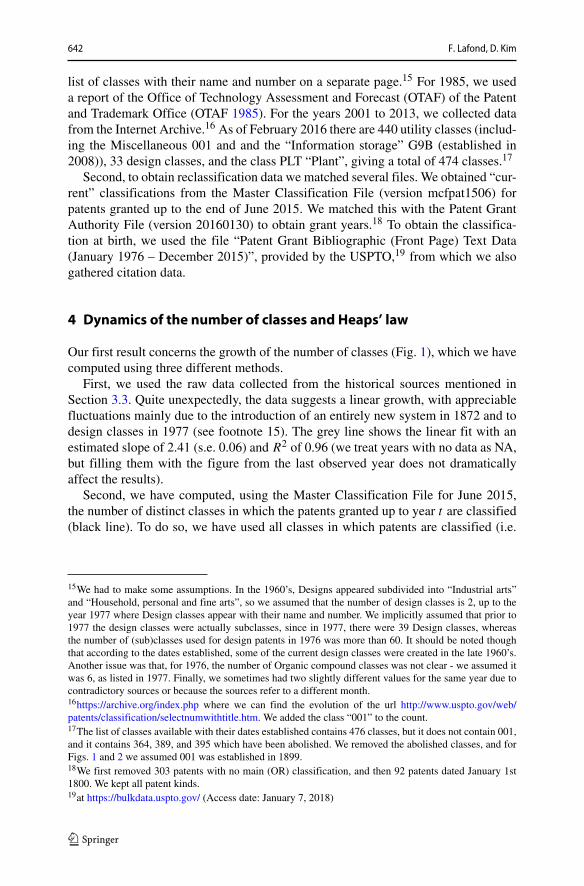
Journal of Evolutionary Economics (2019) 29:631–664https://doi.org/10.1007/s00191-018-0603-3
REGULAR ARTICLE
Long-run dynamics of the U.S. patent classification system
Francois Lafond1,2,3 ·Daniel Kim4
Published online: 4 January 2019© The Author(s) 2019
AbstractAlmost by definition, radical innovations create a need to revise existing classifica-tion systems. In this paper, we argue that classification system changes and patentreclassification are common and reveal interesting information about technologi-cal evolution. To support our argument, we present three sets of findings regardingclassification volatility in the U.S. patent classification system. First, we study theevolution of the number of distinct classes. Reconstructed time series based on thecurrent classification scheme are very different from historical data. This suggeststhat using the current classification to analyze the past produces a distorted viewof the evolution of the system. Second, we study the relative sizes of classes. Thesize distribution is exponential so classes are of quite different sizes, but the largestclasses are not necessarily the oldest. To explain this pattern with a simple stochas-tic growth model, we introduce the assumption that classes have a regular chance tobe split. Third, we study reclassification. The share of patents that are in a differentclass now than they were at birth can be quite high. Reclassification mostly occursacross classes belonging to the same 1-digit NBER category, but not always. We alsodocument that reclassified patents tend to be more cited than non-reclassified ones,even after controlling for grant year and class of origin.
Keywords Patents · Classification · Reclassification
JEL Classification O30 · O39
� Francois [email protected]
Daniel [email protected]
1 Institute for New Economic Thinking at the Oxford Martin School,University of Oxford, Oxford, England
2 Smith School for Enterprise and the Environment, University of Oxford, Oxford, England
3 Oxford Martin School Programme on Technological and Economic Change,University of Oxford, Oxford, England
4 Natural Science Research Institute, Korea Advanced Institute of Science and Technology,Daejeon, South Korea

632 F. Lafond, D. Kim
1 Introduction
The U.S. patent system contains around 10 million patents classified in about 500main classes. However, some classes are much larger than others, some classes aremuch older than others, and more importantly none of these classes can be thoughtof as a once-and-for-all well defined entity. Due to its important legal role, theU.S. Patent and Trademark Office (USPTO) has constantly devoted resources toimprove the classification of inventions, so that the classification system has greatlyevolved over time, reflecting contemporaneous technological evolution. Classifica-tions evolve because new classes are created but also because existing classes areabolished, merged and split. In fact, all current classes in 2015 have been establishedin the U.S. Patent Classification System (USPCS) after 1899, even though the firstpatent was granted in 1790 and the first classification system was created in 1829-1830. To give just another example, out of all patents granted in 1976, 40% are in adifferent main class now than they were in 1976.
To maintain the best possible level of searchability, the USPTO reclassifies patentsso that, at any single moment in time, the patents are classified according to a coher-ent, up-to-date taxonomy. The downside of this is that the current classification is notmeant to reflect the historical description of technological evolution as it unfolded.In other words, while the classification system provides a consistent classificationof all the patents, this consistency is not time invariant. Observers at different pointsin time have a different idea of what is a consistent classification of the past, evenwhen classifying the same set of past patents. In this paper, we focus on the historicalevolution of the U.S. patent classification. We present three sets of findings.
First we study the evolution of the number of distinct classes, contrasting currentand historical classification systems. Recent studies (Strumsky et al. 2012; Strumskyand Lobo 2015; Youn et al. 2015) have shown that it is possible to reconstruct thelong-run evolution of the number of subclasses using the current classification sys-tem. This allowed them to obtain interesting results on the types of recombinationsand on the relative rates of introduction of new subclasses and new combinations. Analternative way to count the number of distinct categories is to go back to the archivesand check how many classes did actually exist at different points in the past. We findimportant differences between the historical and reconstructed evolution of the clas-sification system. In particular, we find that historically the growth of the number ofdistinct classes has been more or less linear, with about two and a half classes addedper year. By contrast, the reconstructed evolution – which considers how many cur-rent classes are needed to classify all patents granted before a given date – suggests adifferent pattern with most classes created in the 19th century and a slowdown in therate of introduction of novel classes afterwards. Similarly, using the historical classeswe find that the relationship between the number of classes and the number of patentsis compatible with Heaps’ law, a power law scaling of the number of categories withthe number of items, originally observed between the number of different words andthe total number of words in a text (Heaps 1978). Using the reconstructed evolutionHeaps’ law does not hold over the long run.
Knowing the number of distinct classes, the next question is about their growthand relative size (in terms of the number of patents). Thus our second set of

Long-run dynamics of the U.S. patent classification system 633
findings concerns the size distribution of classes. We find that it is exponen-tial, confirming a result of Carnabuci (2013) on a much more restricted sub-sample. We also find that there is no clear relationship between the size and theage of classes, which rules out an explanation of the exponential distribution interms of simple stochastic growth models in which classes are created once andfor all.
Third, we hypothesize that new technology fields and radical innovations tend tobe associated with a higher reclassification activity. This suggests that the history ofreclassification contains interesting information on the most transformative innova-tions. Our work here is related to Wang et al. (2016) who study how a range of metrics(claims, references, extensions, etc.) correlates with reclassification for three millionutility patents granted since 1994. We used the data since 1976, for which we observethe class of origin and the citation statistics. It appears that reclassified patents aremore cited than non-reclassified patents. We also construct a reclassification flow dia-gram, with aggregation at the level of NBER patent categories (Hall et al. 2001). Thisreveals that a non-negligible share of patents are reclassified across NBER categories.We find that patents in “Computers” and in “Electronics” are often reclassified inother NBER categories, which is not the case with other categories such as “Drugs”.We then discuss three examples of new classes (Fabric, Combinatorial Chemistry andArtificial Intelligence).
Finally, we argue that it is not possible to explain the observed patterns withoutaccounting for reclassification. We develop a simple model in which classes growaccording to preferential attachment but have a probability of being split. The model’sonly inputs are the number of patents and classes in 2015 and the Heaps’ law expo-nent. Despite this extreme parsimony, the model is able to reproduce i) the historicaland reconstructed patterns of growth of the number of classes, ii) the size distribu-tion and (partially) the lack of age-size relationship, and iii) the time evolution of thereclassification rates.
The empirical evidence that we present and the assumptions we need to make forthe model make it clear that the USPCS has evolved considerably and it is hardlypossible to think of patent classes as technological domains with a stable definition.The classification system cannot be well understood as a system in which categoriesare created once-and-for-all and accumulate patents over time. Instead, it is betterunderstood as a system that is constantly re-organized. Because of this, using thecurrent classification system to study a set of older patents is akin to looking at thepast with today’s glasses. In this paper, we not only show the differences betweenthe historical and reconstructed reality, but we also explain how these differencesemerged.
The paper is organized as follows. Section 2 details our motivation, gives somebackground on categorization and reviews the literature on technological categories.Section 3 describes the USPCS and our data sources. Section 4 presents our resultson the evolution of the number of classes. Section 5 discusses the size distributionof classes. Section 6 presents our results on reclassification since 1976. Section 7presents a model that reproduces the main empirical patterns discovered in the pre-vious sections. The last section discusses the results, motivates further research andconcludes.
634 F. Lafond, D. Kim
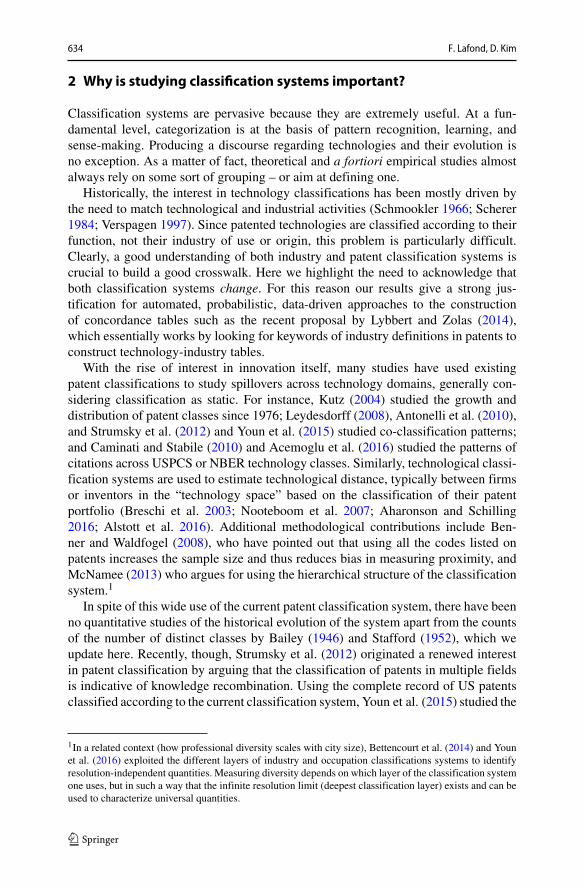
2 Why is studying classification systems important?
Classification systems are pervasive because they are extremely useful. At a fun-damental level, categorization is at the basis of pattern recognition, learning, andsense-making. Producing a discourse regarding technologies and their evolution isno exception. As a matter of fact, theoretical and a fortiori empirical studies almostalways rely on some sort of grouping – or aim at defining one.
Historically, the interest in technology classifications has been mostly driven bythe need to match technological and industrial activities (Schmookler 1966; Scherer1984; Verspagen 1997). Since patented technologies are classified according to theirfunction, not their industry of use or origin, this problem is particularly difficult.Clearly, a good understanding of both industry and patent classification systems iscrucial to build a good crosswalk. Here we highlight the need to acknowledge thatboth classification systems change. For this reason our results give a strong jus-tification for automated, probabilistic, data-driven approaches to the constructionof concordance tables such as the recent proposal by Lybbert and Zolas (2014),which essentially works by looking for keywords of industry definitions in patents toconstruct technology-industry tables.
With the rise of interest in innovation itself, many studies have used existingpatent classifications to study spillovers across technology domains, generally con-sidering classification as static. For instance, Kutz (2004) studied the growth anddistribution of patent classes since 1976; Leydesdorff (2008), Antonelli et al. (2010),and Strumsky et al. (2012) and Youn et al. (2015) studied co-classification patterns;and Caminati and Stabile (2010) and Acemoglu et al. (2016) studied the patterns ofcitations across USPCS or NBER technology classes. Similarly, technological classi-fication systems are used to estimate technological distance, typically between firmsor inventors in the “technology space” based on the classification of their patentportfolio (Breschi et al. 2003; Nooteboom et al. 2007; Aharonson and Schilling2016; Alstott et al. 2016). Additional methodological contributions include Ben-ner and Waldfogel (2008), who have pointed out that using all the codes listed onpatents increases the sample size and thus reduces bias in measuring proximity, andMcNamee (2013) who argues for using the hierarchical structure of the classificationsystem.1
In spite of this wide use of the current patent classification system, there have beenno quantitative studies of the historical evolution of the system apart from the countsof the number of distinct classes by Bailey (1946) and Stafford (1952), which weupdate here. Recently, though, Strumsky et al. (2012) originated a renewed interestin patent classification by arguing that the classification of patents in multiple fieldsis indicative of knowledge recombination. Using the complete record of US patentsclassified according to the current classification system, Youn et al. (2015) studied the
1In a related context (how professional diversity scales with city size), Bettencourt et al. (2014) and Younet al. (2016) exploited the different layers of industry and occupation classifications systems to identifyresolution-independent quantities. Measuring diversity depends on which layer of the classification systemone uses, but in such a way that the infinite resolution limit (deepest classification layer) exists and can beused to characterize universal quantities.

Long-run dynamics of the U.S. patent classification system 635
subclasses (“technology codes”). They found that the number of subclasses used upto a given year is proportional to the cumulative number of patents until about 1870,but grew less and less fast afterwards. Remarkably, however, this slowdown in the“introduction” of new subclasses does not apply to new combinations of subclasses.Youn et al. (2015) found that the number of combinations has been consistentlyequal to 60% of the number of patents. This finding confirms (Strumsky et al. 2012)argument that patent classifications contain useful information to understand tech-nological change over the long-run. Furthermore, the detailed study of combinationscan reveal the degree of novelty of specific patents (Strumsky and Lobo 2015; Kimet al. 2016).
Besides their use for simplifying the analysis and creating crosswalks, technologytaxonomies are also interesting per se. A particularly interesting endeavor would beto construct systematic technology phylogenies showing how a technology descendsfrom others (Basalla 1988; Sole et al. 2013).2
But categories are not simply useful to describe reality, they are often used toconstruct it (Foucault 1966). When categories are created as nouns, they can havea predicate and become a subject. As a result, classification systems are institutionsthat allow agents to coordinate and agree on how things should be called and onwhere boundaries should be drawn. Furthermore, classification systems may createa feedback on the system it describes, for instance by legitimizing the items thatit classifies or more simply by biasing which items are found through search andreused in recombination to create other items. Categorization thus affects the futureevolution of the items and their relation (boundaries) with other items. Along this lineof argument, the process of categorization is performative. In summary, data on theevolution of technological classification systems provides a window on how societyunderstands its technological artefacts and legitimizes them through the process ofcategorization. According to Latour (2005), social scientists should not over imposetheir own categories over the actors that they analyze. Instead, a researcher shouldfollow the actors and see how they create categories themselves.
Nelson (2006) described technological evolution as the co-evolution of a body ofpractice and a body of understanding. The role of the body of understanding is to“rationalize” the practice. According to him, this distinction has important implica-tions for understanding evolutionary dynamics, since each body has its own selectioncriteria. Our argument here is that the evolution of the USPCS reflects how the beliefsof the community of technologists about the mesoscale structure of technological sys-tems coevolves with technological advancements. We consider patent categorizationas a process of codification of an understanding concerning the technological sys-tem. To see why studying patent categories goes beyond studying patents, it is usefulto remember that examiners and applicants do not need to prove that a technologyimproves our understanding of a natural phenomenon; they simply need to show thata device or process is novel and effective at solving a problem. However, to establisha new class, it is necessary to agree that bringing together inventions under this new
2For specific examples, see Temkin and Eldredge (2007) for cornets and Valverde and Sole (2015) forprogramming languages.
636 F. Lafond, D. Kim
header actually improves understanding, and thus searchability of the patent system.In that sense, we believe that the dynamics of patent classes constitute a window onthe “community of technologists”.3
Since classification systems are designed to optimize search, they reflect howsearch takes place which, in turn, is indicative of what thought processes are in place.These routines are an integral part of normal problem-solving within a paradigm. Asa result, classification systems must be affected by paradigm-switching radical inno-vations. As noted by, e.g., Pavitt (1985) and Hicks (2011), a new technology thatfits perfectly in the existing classification scheme may be considered an incremen-tal innovation, as opposed to a radical innovation that challenges existing schemes.A direct consequence is that the historical evolution of the classification systemcontains a great deal of information on technological change beyond the informa-tion contained in the patents.4 We now describe our attempt at reconstructing thedynamics of the U.S. patent classification system.
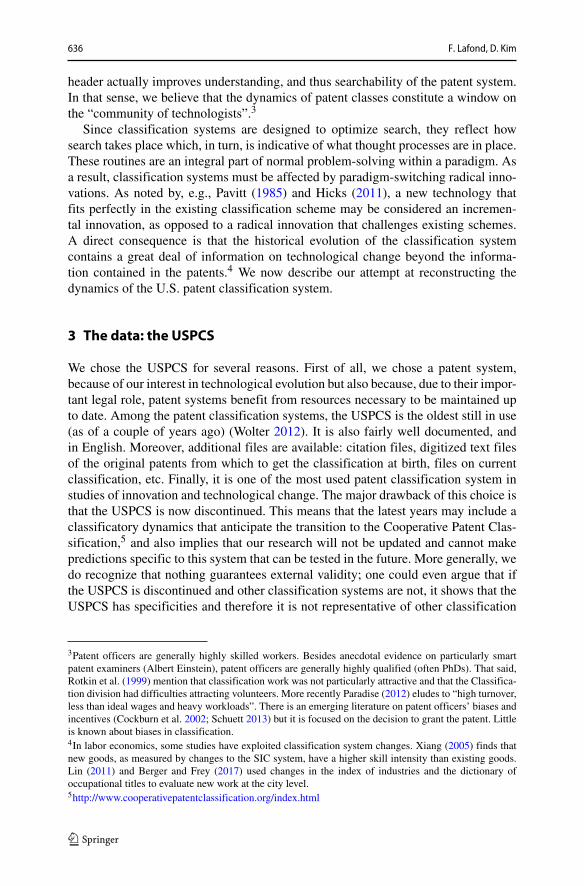
3 The data: the USPCS
We chose the USPCS for several reasons. First of all, we chose a patent system,because of our interest in technological evolution but also because, due to their impor-tant legal role, patent systems benefit from resources necessary to be maintained upto date. Among the patent classification systems, the USPCS is the oldest still in use(as of a couple of years ago) (Wolter 2012). It is also fairly well documented, andin English. Moreover, additional files are available: citation files, digitized text filesof the original patents from which to get the classification at birth, files on currentclassification, etc. Finally, it is one of the most used patent classification system instudies of innovation and technological change. The major drawback of this choice isthat the USPCS is now discontinued. This means that the latest years may include aclassificatory dynamics that anticipate the transition to the Cooperative Patent Clas-sification,5 and also implies that our research will not be updated and cannot makepredictions specific to this system that can be tested in the future. More generally, wedo recognize that nothing guarantees external validity; one could even argue that ifthe USPCS is discontinued and other classification systems are not, it shows that theUSPCS has specificities and therefore it is not representative of other classification
3Patent officers are generally highly skilled workers. Besides anecdotal evidence on particularly smartpatent examiners (Albert Einstein), patent officers are generally highly qualified (often PhDs). That said,Rotkin et al. (1999) mention that classification work was not particularly attractive and that the Classifica-tion division had difficulties attracting volunteers. More recently Paradise (2012) eludes to “high turnover,less than ideal wages and heavy workloads”. There is an emerging literature on patent officers’ biases andincentives (Cockburn et al. 2002; Schuett 2013) but it is focused on the decision to grant the patent. Littleis known about biases in classification.4In labor economics, some studies have exploited classification system changes. Xiang (2005) finds thatnew goods, as measured by changes to the SIC system, have a higher skill intensity than existing goods.Lin (2011) and Berger and Frey (2017) used changes in the index of industries and the dictionary ofoccupational titles to evaluate new work at the city level.5http://www.cooperativepatentclassification.org/index.html
Long-run dynamics of the U.S. patent classification system 637
systems. Nevertheless, we think that the USPCS had a major influence on technologyclassifications and is the best case study with which to start.
3.1 The early history of the USPCS
The U.S. patent system was established on 31st July 1790, but the need for examina-tion was abolished three years later and reestablished only in 1836. As a result, therewas no need to search for prior art and therefore the need for a classification wasweak.
The earliest known official subject matter classification appeared in 1823 as anappendix to the Secretary of State’s report to the Congress for that year (Rotkin et al.1999). It classified 635 patents models in 29 categories such as “Bridges and Locks”,1184 in a category named “For various purposes”, and omitted those that were not“deemed of sufficient importance to merit preservations”.
In 1829, a report from the Superintendent proposed that, with the prospect of thenew, larger apartments for the Patent office, there would be enough room for a sys-tematic arrangement and classification of models. He appended a list of 14 categoriesto the report.6
In 1830 the House of representatives ordered the publication of a list of all patents,which appeared in December 1830/January 1831 with a table of contents organizingpatents in 16 categories, which were almost identical to the 14 categories of 1829plus “Surgical instruments” and “Horology”.7
In July 1836, the requirement of novelty examination came into effect, making thesearch for prior art more pressing. Incidentally, in December the Patent office wascompletely destroyed by a fire. In 1837, a new classification system of 21 classes waspublished, including a Miscellaneous class and a few instances of cross noting.8 Thefollowing year another schedule was published, with some significant reorganizationand a total number of classes of 22.
A new official classification appeared in 1868 and contained 36 main classes.Commenting on this increase in the number of classes, the Commissioner of patentswrote that Rotkin et al. (1999)
“The number of classes has risen from 22 to 36, a number of subjects beingnow recognized individually which were formally merged with others under amore generic title. Among these are builder’s hardware, felting, illumination,paper, and sewing machines, to each of which subject so much attention hasbeen directed by inventors that a division became a necessity to secure a properapportionment of work among the corps of examiners.”
6The main titles were Agriculture, Factory machine, Navigation, Land works, Common trades, Wheelcarriages, Hydraulicks (the spelling of which was changed in 1830), Calorific and steam apparatus, Mills,Lever and screw power, Arms, Mathematical instruments, Chemical compositions and Fine arts.7An interesting remark on this classification (Rotkin et al. 1999) is that it already contained classes basedon industry categories (agriculture, navigation, . . . ) and classes based on a “specific mechanical forcesystem” (such as Lever and screw power).8The first example given by Rotkin et al. (1999) is a patent for a pump classified in both “Navigation” andin “Hydraulics and Hydrostatics”

638 F. Lafond, D. Kim
Clearly, one of the rationale behind the creation and division of classes is to balancethe class sizes, but this was not only to facilitate search. This class schedule wasdesigned with administrative problems in mind, including the assignment of patentapplications to the right examiners and the “equitable apportionment of work amongexaminers” (Rotkin et al. 1999).
Shortly after 1868 a parallel classification appeared, containing 176 classes usedin the newly set up patent subscription service. This led to a new official classificationcontaining 145 classes and, published as a book in 1872. The number of classes grewto 158 in 1878 and 164 in 1880. Rotkin et al. (1999) note that the 1880 classificationdid not contain any form of cross-noting and cross references, by contrast to the 1872classification. In 1882 classification reached 167 classes and introduced indentationof subclasses at more than one level. The classification of 1882 also introduced aclass called “Electricity”, long before this general purpose technology fully reachedits potential.
In 1893 it was made clear in the annual report that a Classification division wasrequired “so that [the history of invention] would be readily accessible to searchersupon the novelty of any alleged invention”. After that, the need for a classificationdivision (and the associated claim for extra budget) was consistently legitimated bythis need to “oppose the whole of prior art” to every new application. In 1898 the“Classification division” was created with a head, two assistants and two clerks,with the purpose of establishing clearer classification principles and reclassifiyingall existing patents. This marked the beginning of professional classification at theUSPTO.
Since then the classification division has been very active and the patent classifica-tion system has evolved considerably, as we document extensively in this paper. Butbefore this, we need to explain the basic organizing principles of the classificationsystem.
3.2 Rationale and organization of themodern USPCS
The USPCS attributes to each patent at least one subject matter. A subject matterincludes a main class, delineating the main technology, and a subclass, delineatingprocesses, structural features and functional features. All classes and most subclasseshave a definition. Importantly, these are the patent claims that are classified, notthe whole patent itself. The patent inherits the classification of its claims; its mainclassification is the classification of its main (“most comprehensive”) claim.
There are different types of patents, and they are translated into different types ofclasses. According to the USPTO,9 “in general terms, a utility patent protects the wayan article is used and works, while a design patent protects the way an article looks.”The “classification of design patents is based on the concept of function or intendeduse of the industrial design disclosed and claimed in the Design patent.”.10
During the 19th century classification was based on which industry or professionwas using the invention, for instance “Bee culture” (449) or “Butchering” (452). The
9http://www.uspto.gov/web/offices/pac/mpep/s1502.html10http://www.uspto.gov/page/seven-classification-design-patents
Long-run dynamics of the U.S. patent classification system 639
example of choice (Falasco 2002a; USPTO 2005; Strumsky et al. 2012) is that ofcooling devices, which were classified separately if they were used to cool differentthings, such as beer or milk. Today’s system would classify both as cooling devicesinto the class “Heat exchange” (165), which is the utility or function of the inven-tion. Another revealing example (Schmookler 1966; Griliches 1990) is that a subclassdealing with the dispensing of liquids would contain both a patent for a water pis-tol and one for a holy water dispenser. This change in the fundamental principles ofclassification took place at the turn of the century with the establishment of the Clas-sification division (Falasco 2002a; Rotkin et al. 1999). Progressively, the divisionundertook to redesign the classification system so that inventions would be classi-fied according their utility. The fundamental principle that emerged is that of “utilityclassification by proximate function” (Falasco 2002a), where the emphasis on “prox-imate” means that it is the fundamental function of the invention, not some exampleapplication in a particular device or industry. For instance, “Agitating” (366) is therelevant class for inventions that perform agitation, whether this is to wash clothes,churn butter, or mix paint (Simmons 2014). Another classification by utility is theclassification by effect or product, where the result may be tangible (e.g. Semicon-ductors device and manufacture, 438) or intangible (e.g. Audio signal system, 381).Finally, the classification by structure (“arrangement of components”) is sometimesused for simple subject matter having a general function. This rationale is the mostoften used for chemical compounds and stock material. It is rarely used for classesand more often used at the subclass level (USPTO 2005).
Even though the classification by utility is the dominant principle, the three classi-fication rationales (by industry, utility and structure) coexist. Each class “reflects thetheories of classification that existed at the time it was reclassified” (USPTO 2005).In addition, the system keeps evolving as classes (and even more so subclasses) arecreated, merged and split. New categories emerge when the need is felt by an exam-iner and approved by the appropriate Technology Center; in this case, the USPCS isrevised through a “Classification order” and all patents that need to are reclassified(Strumsky et al. 2012). An example of how subclasses are created is through alphasubclasses. Alpha subclasses were originally informal collections created by patentexaminers themselves to help their work, but were later incorporated into the USPC.They are now created and used as temporary subclasses until they become formalized(Falasco 2002b; USPTO 2005). When a classification project is completed, a classi-fication order is issued, summarizing the changes officially, and all patents that needto are, in principle, reclassified.
One of the latest classes to have been created is “Nanotechnology (977)”, in Octo-ber 2004. As noted by Strumsky et al. (2012), using the current classification systemone finds that after reclassification the first nanotechnology patent was granted muchearlier.11 According to Paradise (2012), large federal research funding led to the
111986 for Strumsky et al. (2012), 1978 for Paradise (2012) and 1975 according to Strumsky and Lobo(2015) and to the data that we use here (US3896814). Again, these differences reflect the importance ofreclassification.
640 F. Lafond, D. Kim
emergence of “nanotechnology” as a unifying term, which became reflected in sci-entific publications and patents. Because nanotechnologies were new, received lotsof applications and require interdisciplinary knowledge, it was difficult to ensurethat prior art was reviewed properly. The USPTO engaged in a classification projectin 2001, which started by defining nanotechnologies and establishing their scope,through an internal process as well as by engaging with other stakeholders such asusers or other patent offices. In 2004 the Nanotechnology cross-reference digest wasestablished; cross-reference means that this class cannot be used as a primary class.Paradise (2012) argues that class 977 has been defined with a too low threshold of1 to 100 nanometers. Also, reclassification has been encouraged but is not system-atic, so that many important nanopatents granted before 2004 may not be classifiedas such.
Another example of class creation worth mentioning is given by Erdi et al. (2013)who argue that the creation of “Fabric (woven, knitted, or nonwoven textile or cloth,etc.)” (442) created in 1997, could have been predicted based on clustering analysis ofcitations. Kyebambe et al. (2017) recently generalized this approach, by formulatingit as a classical machine learning classification problem: patent clusters are charac-terized by sets of features (citations, claims, etc.), and only some patent clusters arelater recognized as “emerging technology” by being reclassified into a new USPCSmain class. In this sense, USPCS experts are labelling data, and Kyebambe et al.(2017) developed a method to create clusters and train machine learning algorithmson the data labelled by USPCS experts.
Finally, a last example is that of organic chemistry.12 Class 260 used to containthe largest array of patent documents but it was decided that this class needed to bereclassified “because its concepts did not necessarily address new technology andseveral of its subclasses were too difficult to search because of their size.”. To makesmaller reclassification projects immediately available, it was decided to split thelarge class into many individual classes in the range of Classes 518-585. Each of theseclasses is “considered an independent class under the Class 260 umbrella”; many ofthese classes have the same general name, such as “Organic coumpounds – part ofthe class 532-570 series”13
As argued by Strumsky et al. (2012), this procedure of introducing new codesand modifying existing ones ensures that the current classification of patents is con-sistent and makes it possible to study the development of technologies over a longperiod of time. However, while looking at the past with today’s glasses ensures thatwe look at different periods of the past in a consistent way, it is not the same asreporting what the past was in the eyes of those who lived it. In this sense, we believethat it is also interesting to try and reconstruct the classification systems that werein place in the past. We now describe our preliminary attempt to do so, by listingavailable sources and constructing a simple count of the number of classes used inthe past.
12see http://www.uspto.gov/page/addendum-reclassification-classes-518-58513These classes also have a hierarchy indicated by their number, as subclasses within a class scheduleusually do.
Long-run dynamics of the U.S. patent classification system 641
3.3 Dataset construction
Before describing the data construction in detail, let us state clearly three importantcaveats.
First, we focus on main classes, due to the difficulty of collecting historical dataat the subclass level. This is an important omission and avenue for further research.Investigating the complete hierarchy could add significant insight, for instance bycontrasting “vertical” and “horizontal” growth of the classification tree, or by exploit-ing the fact that different layers of system play different roles for search (USPTO2005).
Second, we limit our investigations to Primary (“OR”) classes, essentially forsimplicity. Multiple classifications are indeed very interesting and would thereforewarrant a complete independent study. Clearly, the fact that multiple classificationscan be used is a fundamental feature of the current USPCS. In fact, it is a key fea-ture of its evolution: as noted above, “cross-noting” was common in some periodsand absent in others, and a recent example of a novel class – Nanotechnology - hap-pens to be an XR-only class (i.e., used only as a secondary classification). Here wehave chosen to use only OR classes because it allows us to show the main patternsin a relatively simple way. Of course, some of our results, in particular those ofSection 6, are affected by this choice, and further research will be necessary to eval-uate the robustness of our results. That said, OR classifications, which are used onpatent applications to find the most appropriate examining division (Falasco 2002b),are arguably the most important.
Third, we limit our investigation to the USPCS, as justified in the beginning ofSection 3. We have good reasons for choosing the USPCS in this study, which aimsat giving a long-run picture. However, for studying the details of reclassificationpatterns and firmly establishing reclassification and classification system changesas novel and useful indicators of technological change, future research will need toestablish similar patterns in the IPC or CPC.
As a result of these choices, our aim is to build a database14 of 1) the evolution ofthe USPCS primary classes, and 2) the reclassification of patents from one class tothe other. To do this, we relied on several sources.
First, our most original data collection effort concerns the historical number ofclasses. For the early years, our main sources are Bailey (1946) and Rotkin et al.(1999), complemented by Reingold (1960) and the “Manual of Classification” forthe five years within the period 1908–1923. For the 1950–60’s, we used mostly ayear-specific source named “General information concerning Patents”, which con-tained a sentence like “Patents are classified into x classes”. Unfortunately, starting in1969, the sentence becomes “Patents are classified into more than 310 classes”. Wetherefore switched to another source named “Index of patents issued from the UnitedStates Patent Office”, which contains the list of classes. Starting 1963, it contains the
14Our data is available at https://dataverse.harvard.edu/dataset.xhtml?persistentId=doi:10.7910/DVN/ZJCDCE
642 F. Lafond, D. Kim
list of classes with their name and number on a separate page.15 For 1985, we useda report of the Office of Technology Assessment and Forecast (OTAF) of the Patentand Trademark Office (OTAF 1985). For the years 2001 to 2013, we collected datafrom the Internet Archive.16 As of February 2016 there are 440 utility classes (includ-ing the Miscellaneous 001 and and the “Information storage” G9B (established in2008)), 33 design classes, and the class PLT “Plant”, giving a total of 474 classes.17
Second, to obtain reclassification data we matched several files. We obtained “cur-rent” classifications from the Master Classification File (version mcfpat1506) forpatents granted up to the end of June 2015. We matched this with the Patent GrantAuthority File (version 20160130) to obtain grant years.18 To obtain the classifica-tion at birth, we used the file “Patent Grant Bibliographic (Front Page) Text Data(January 1976 – December 2015)”, provided by the USPTO,19 from which we alsogathered citation data.
4 Dynamics of the number of classes and Heaps’ law
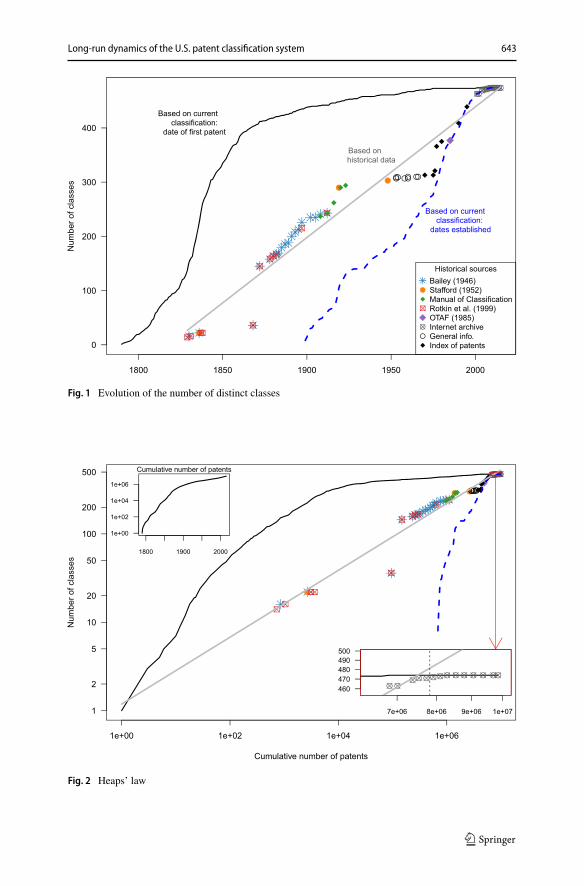
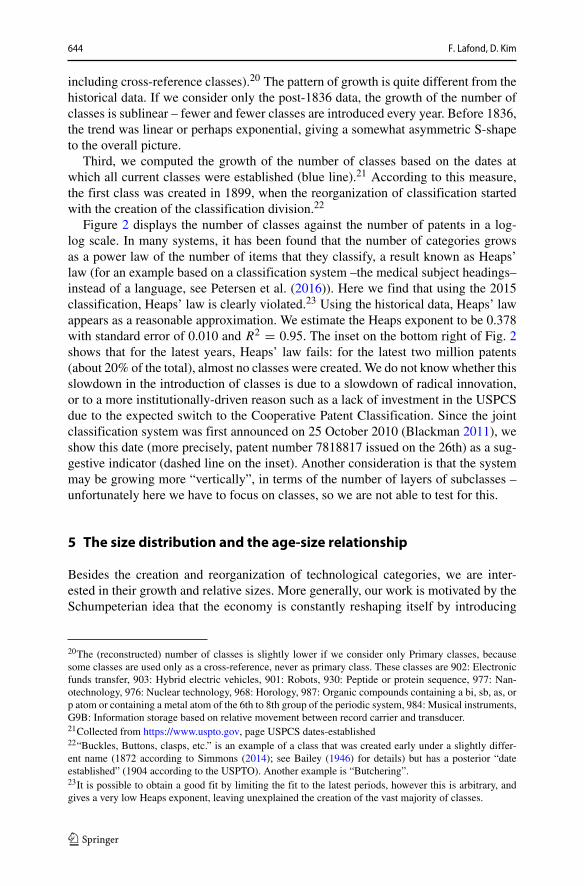
Our first result concerns the growth of the number of classes (Fig. 1), which we havecomputed using three different methods.
First, we used the raw data collected from the historical sources mentioned inSection 3.3. Quite unexpectedly, the data suggests a linear growth, with appreciablefluctuations mainly due to the introduction of an entirely new system in 1872 and todesign classes in 1977 (see footnote 15). The grey line shows the linear fit with anestimated slope of 2.41 (s.e. 0.06) and R2 of 0.96 (we treat years with no data as NA,but filling them with the figure from the last observed year does not dramaticallyaffect the results).
Second, we have computed, using the Master Classification File for June 2015,the number of distinct classes in which the patents granted up to year t are classified(black line). To do so, we have used all classes in which patents are classified (i.e.
15We had to make some assumptions. In the 1960’s, Designs appeared subdivided into “Industrial arts”and “Household, personal and fine arts”, so we assumed that the number of design classes is 2, up to theyear 1977 where Design classes appear with their name and number. We implicitly assumed that prior to1977 the design classes were actually subclasses, since in 1977, there were 39 Design classes, whereasthe number of (sub)classes used for design patents in 1976 was more than 60. It should be noted thoughthat according to the dates established, some of the current design classes were created in the late 1960’s.Another issue was that, for 1976, the number of Organic compound classes was not clear - we assumed itwas 6, as listed in 1977. Finally, we sometimes had two slightly different values for the same year due tocontradictory sources or because the sources refer to a different month.16https://archive.org/index.php where we can find the evolution of the url http://www.uspto.gov/web/patents/classification/selectnumwithtitle.htm. We added the class “001” to the count.17The list of classes available with their dates established contains 476 classes, but it does not contain 001,and it contains 364, 389, and 395 which have been abolished. We removed the abolished classes, and forFigs. 1 and 2 we assumed 001 was established in 1899.18We first removed 303 patents with no main (OR) classification, and then 92 patents dated January 1st1800. We kept all patent kinds.19at https://bulkdata.uspto.gov/ (Access date: January 7, 2018)
Long-run dynamics of the U.S. patent classification system 643
Fig. 1 Evolution of the number of distinct classes
Fig. 2 Heaps’ law
644 F. Lafond, D. Kim
including cross-reference classes).20 The pattern of growth is quite different from thehistorical data. If we consider only the post-1836 data, the growth of the number ofclasses is sublinear – fewer and fewer classes are introduced every year. Before 1836,the trend was linear or perhaps exponential, giving a somewhat asymmetric S-shapeto the overall picture.
Third, we computed the growth of the number of classes based on the dates atwhich all current classes were established (blue line).21 According to this measure,the first class was created in 1899, when the reorganization of classification startedwith the creation of the classification division.22
Figure 2 displays the number of classes against the number of patents in a log-log scale. In many systems, it has been found that the number of categories growsas a power law of the number of items that they classify, a result known as Heaps’law (for an example based on a classification system –the medical subject headings–instead of a language, see Petersen et al. (2016)). Here we find that using the 2015classification, Heaps’ law is clearly violated.23 Using the historical data, Heaps’ lawappears as a reasonable approximation. We estimate the Heaps exponent to be 0.378with standard error of 0.010 and R2 = 0.95. The inset on the bottom right of Fig. 2shows that for the latest years, Heaps’ law fails: for the latest two million patents(about 20% of the total), almost no classes were created. We do not know whether thisslowdown in the introduction of classes is due to a slowdown of radical innovation,or to a more institutionally-driven reason such as a lack of investment in the USPCSdue to the expected switch to the Cooperative Patent Classification. Since the jointclassification system was first announced on 25 October 2010 (Blackman 2011), weshow this date (more precisely, patent number 7818817 issued on the 26th) as a sug-gestive indicator (dashed line on the inset). Another consideration is that the systemmay be growing more “vertically”, in terms of the number of layers of subclasses –unfortunately here we have to focus on classes, so we are not able to test for this.
5 The size distribution and the age-size relationship
Besides the creation and reorganization of technological categories, we are inter-ested in their growth and relative sizes. More generally, our work is motivated by theSchumpeterian idea that the economy is constantly reshaping itself by introducing
20The (reconstructed) number of classes is slightly lower if we consider only Primary classes, becausesome classes are used only as a cross-reference, never as primary class. These classes are 902: Electronicfunds transfer, 903: Hybrid electric vehicles, 901: Robots, 930: Peptide or protein sequence, 977: Nan-otechnology, 976: Nuclear technology, 968: Horology, 987: Organic compounds containing a bi, sb, as, orp atom or containing a metal atom of the 6th to 8th group of the periodic system, 984: Musical instruments,G9B: Information storage based on relative movement between record carrier and transducer.21Collected from https://www.uspto.gov, page USPCS dates-established22“Buckles, Buttons, clasps, etc.” is an example of a class that was created early under a slightly differ-ent name (1872 according to Simmons (2014); see Bailey (1946) for details) but has a posterior “dateestablished” (1904 according to the USPTO). Another example is “Butchering”.23It is possible to obtain a good fit by limiting the fit to the latest periods, however this is arbitrary, andgives a very low Heaps exponent, leaving unexplained the creation of the vast majority of classes.
Long-run dynamics of the U.S. patent classification system 645
novelty (Dopfer et al. 2004; Saviotti and Pyka 2004). The growth of technologi-cal domains has been deeply scrutinized in the economics of technical change anddevelopment (Schumpeter 1934; Dosi 1982; Pasinetti 1983; Pavitt 1984; Freemanand Soete 1997; Saviotti 1996; Malerba 2002). A recurring theme in this literature isthe high heterogeneity among sectors. When sectors or technological domains growat different rates, structural change occurs: the relative sizes of different domains ismodified. To study this question in a parsimonious way, one may opt for a mesoscaleapproach, that is, study the size distribution of categories.
Our work here is most directly related to Carnabuci (2013) who first showed ondata for 1963–1999 that the size distribution of classes is close to exponential. Thisis an interesting and at first surprising finding, because based on the assumption thatall domains grow at the same average rate, stochastic growth models such as Gibrat(1931) or Yule (1925) predict a Log-normal or a Pareto distribution, which are muchmore fat tailed. Instead, we do not see the emergence of relatively very large domains,and this may at first suggest that older sectors do not keep growing as fast as youngerones, perhaps due to technology life-cycles (Vernon 1966; Klepper 1997; Ander-sen 1999). However, as we will discuss, we are able to explain the exponential sizedistribution by keeping Gibrat’s law, but assuming that categories are split randomly.
5.1 The size distribution of categories
In this section, we study the size distribution of classes, where size is the number ofpatents in 2015 and classes are defined using the current classification system. Weuse only the primary classification, so we have only 464 classes. Figure 3 suggestsa linear relationship between the size of a class and the log of its rank, that is, classsizes are exponentially distributed.24 To see this, let p(k) be the probability densityof the sizes k. If it is exponential, it is p(k) = λe−λk . By definition, the rank r(k)
of a class of size k is the number of classes that have a larger size, which is r(k) =N
∫ ∞k
λe−λxdx = Ne−λk , where N is the number of classes. This is equivalentto size being linear in the logarithm of the rank. We estimate the parameter λ bymaximum likelihood and obtain λ = 4.71 × 10⁻⁵ with standard error 0.22 × 10⁻⁵.Note that λ is one over the mean size, 21223. We use this estimate to plot the resultingfit in Fig. 3.
It is interesting to find an exponential distribution, since one may have expecteda power law, which is quite common as a size distribution, and appears often withHeaps’ law (Lu et al. 2010; Petersen et al. 2016). Since the exponential distribu-tion is a good representation of the data, it is worth looking for a simple mechanism
24For simplicity we used the (continuous) exponential distribution instead of the more appropriate (dis-crete) geometric distribution, but this makes no difference to our point. We have not rigorously testedwhether or not the exponential hypothesis can be rejected, because the proper hypothesis is geometricand classical test statistics such as Kolmogorov-Smirnov do not easily apply to discrete distributions.Likelihood ratio tests interpreted at the 5% level showed that it is possible to obtain better fits usingtwo-parameters distributions that extends the exponential/geometric, namely the Weibull and the Negativebinomial, especially after removing the two smallest categories which are outliers (contain 4 and 6 patents)and are part of larger series (532 and 520).

646 F. Lafond, D. Kim
Fig. 3 Rank-size relationship
that generates this distribution, which we will do in Section 7. But since manymodels can generate an exponential distribution we first need to present additionalempirical evidence that will allow us to discriminate between different candidatemodels.
5.2 The age-size relationship
To determine whether older classes contain more patents than younger ones, we firstneed to note that there are two ways of measuring age: the official date at which theclass was established, and the year in which its first patent was granted. As expected,it appears that the year in which a class is established is always posterior to the dateof its first patent.25
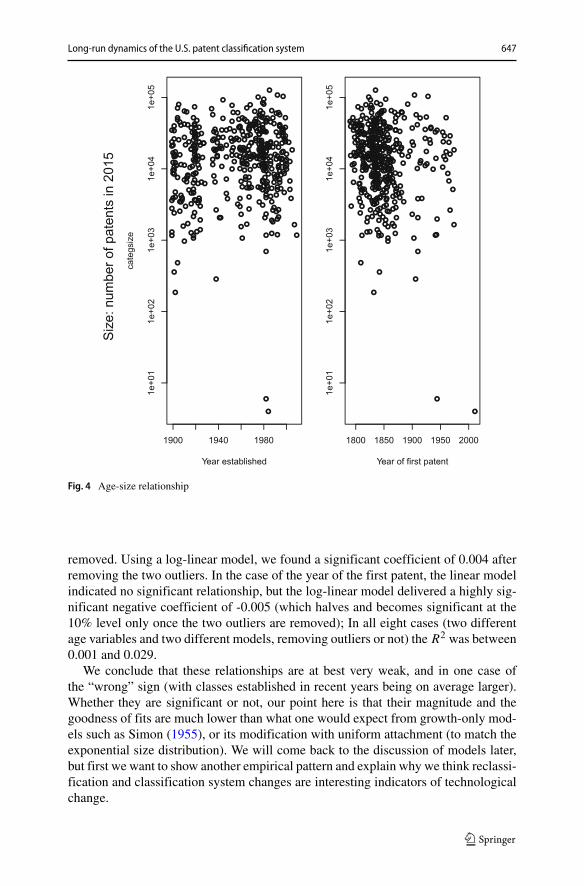
Since these two ways of measuring age can be quite different, we show the age-size (or rather size-birth date) relationship for both in Fig. 4. If stochastic growthmodels without reclassification were valid, we would observe a negative slope, thatis, newer classes should have fewer patents because they have had less time for accu-mulation from random growth. Instead, we find no clear relationship. In the case ofthe year established, linear regressions indicated a positive relationship significant atthe 10% but not at the 5% confidence level, whether or not the two “outliers” were
25Apart from class 532. We confirmed this by manually searching the USPTO website. Class 532 is partof the Organic compound classes, which have been reorganized heavily, as discussed in Section 3.2
Long-run dynamics of the U.S. patent classification system 647
Fig. 4 Age-size relationship
removed. Using a log-linear model, we found a significant coefficient of 0.004 afterremoving the two outliers. In the case of the year of the first patent, the linear modelindicated no significant relationship, but the log-linear model delivered a highly sig-nificant negative coefficient of -0.005 (which halves and becomes significant at the10% level only once the two outliers are removed); In all eight cases (two differentage variables and two different models, removing outliers or not) the R2 was between0.001 and 0.029.
We conclude that these relationships are at best very weak, and in one case ofthe “wrong” sign (with classes established in recent years being on average larger).Whether they are significant or not, our point here is that their magnitude and thegoodness of fits are much lower than what one would expect from growth-only mod-els such as Simon (1955), or its modification with uniform attachment (to match theexponential size distribution). We will come back to the discussion of models later,but first we want to show another empirical pattern and explain why we think reclassi-fication and classification system changes are interesting indicators of technologicalchange.
648 F. Lafond, D. Kim
6 Reclassification activity as an indicator of technological change
It seems almost tautological to say that a radical innovation is hard to categorizewhen it appears. If an innovation is truly “radical”, it should profoundly change howwe think about a technology, a technological domain, or a set of functions performedby technologies. If this is the case, a patent related to a radical innovation is origi-nally hard to classify. It is likely that it will have to be reclassified in the future, whena more appropriate set of concepts has been developed and institutionalized (that is,when the community of technologists have codified a novel understanding about theradical innovation). It is also well accepted that radical innovations may create a newwave of additional innovations, which may or may not cluster in time (Silverberg andVerspagen 2003) but when they are general purpose we do expect a rise in innovativeactivity (Bresnahan and Trajtenberg 1995). A less commented upon consequence ofthe emergence and diffusion of General Purpose Technologies (GPTs) is that bothdue to the sheer increase in the number of patents in this technology, and to theimpact of this technology on others, we should expect higher classification volatility.Classification volatility is to be expected, particularly in relation to GPTs, becauseby definition GPTs interact with existing technologies and create or reorganize inter-actions among existing technologies. From the point of view of the classification,the very definition of the objects and their boundaries is transformed. In short, somecategories become too large and need to be split; some definitions become obsoleteand need to be changed; and the “best” grouping of technologies is affected by thebirth and death of conceptual relationships between the function, industry of originor application, and structural features of technologies.
In this section, we provide a preliminary study. First, we establish that this indi-cator does exist (reclassification rates can be quite high, reaching 100% if we lookfar enough in the past). Second, we show that reclassified patents are more cited.Third, we show that reclassification can take place across fairly distant technolog-ical domains, as measured by 1-digit NBER categories. Fourth, we discuss threeexamples of novel classes.
6.1 Reclassification rates
How many patents have been reclassified? To start with, since no classificationexisted prior to 1829, all patents published before then have been “(re)classified” inthe sense that their categories have been determined several and potentially manyyears after being granted. The same applies to all patents granted at times wherecompletely different classification systems prevailed, which is the case before 1899.In modern times, classification has evolved but as discussed in Section 3, the overallclassification framework put in place at the turn of the century stayed more or less thesame. For the period after 1976, we know the original classification of each patentbecause we can read it on the digitized version of the original paper (see Section 3.3).After extensive efforts in parsing the data and a few manual corrections, we found anoriginal class for 99.45% of the post-1976 patents in the Master Classification Filemcfpat1506. Out of these 5,615,525 patents, 412,724 (7.35%) have been reclassified.There are 789 distinct original classes, including 109 with only one patent (apart from
Long-run dynamics of the U.S. patent classification system 649
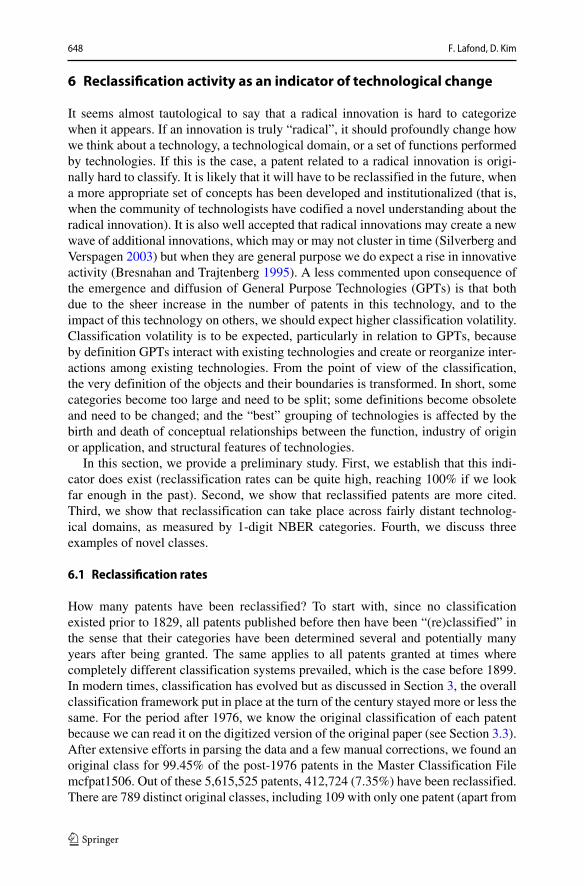
Fig. 5 Share of patents granted in a given year that are in a different class in 2015, as compared to whenthey were granted
data errors, this can come from original classes that had no post-1976 patents clas-sified in them). All current classes have been used as original classes except “001”which is only used as a miscellaneous class in which they are reclassified.26
Figure 5 shows the evolution of the reclassification rate, defined as the share ofpatents granted in year t that have a different classification in 2015 than in t . Itappears that as much as 40% of the 1976’s patents belong to a different class nowthan when they first appeared. This reclassification rate declines sharply after that,reaching about 10% in the 1990’s and almost zero thereafter. This is an expectedresult, since the longer the time since granting the patent, the higher the chances thatthe classification system has changed.
6.2 Are reclassified patents more cited?
Since there is an established relationship between patent value and the number ofcitations received (Hall et al. 2005), it is interesting to check if reclassified patentsare more cited. Of course, we are only observing correlations, and the relationshipbetween citations and reclassification can work in multiple ways. A plausible hypoth-esis is that the more active a technological domain is (in terms of new patents andthus new citations being made), the more likely it is that there will be a need for
26We removed US6481014.
650 F. Lafond, D. Kim
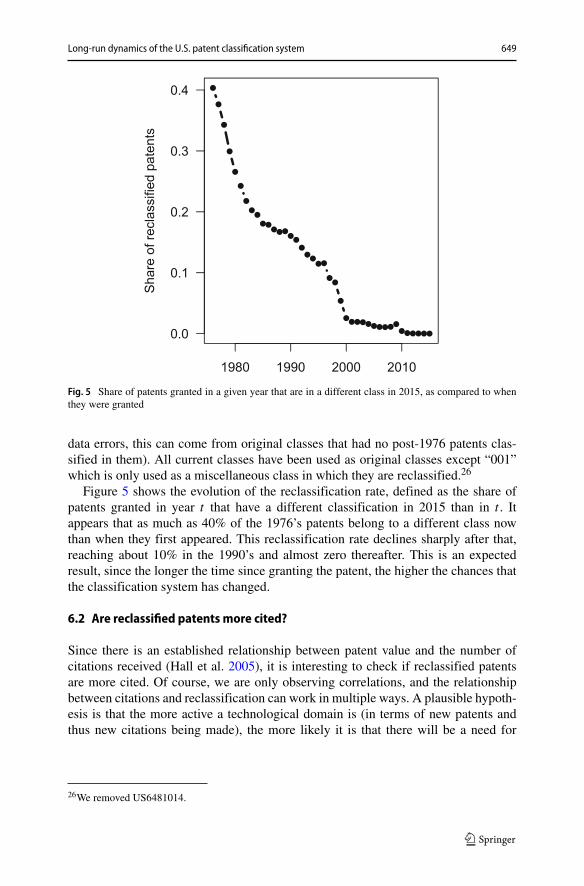
Table 1 Patent citationssummary statistics Share Mean Median s.d.
All 100.00 11.30 4.00 26.64
Non reclassified 92.65 10.27 4.00 23.94
Reclassified 7.35 24.29 11.00 47.40
reclassification, if only to keep the classes at a manageable size.27 Another hypothe-sis is that highly innovative patents are intrinsically ambiguously defined in terms ofthe classification system existing when they first appear. In any case, since we onlyhave the class number at birth and the class number in 2015, we cannot make subtledistinctions between different mechanisms. However, we can check whether reclas-sified patents are on average more cited, and we can do so after controlling for thegrant year and class at birth.
Table 1 shows basic statistics.28 Reclassified patents constitute 7.35% of the sam-ple, and have received on average more than 24 citations, which is more than twiceas much as the non reclassified patents.
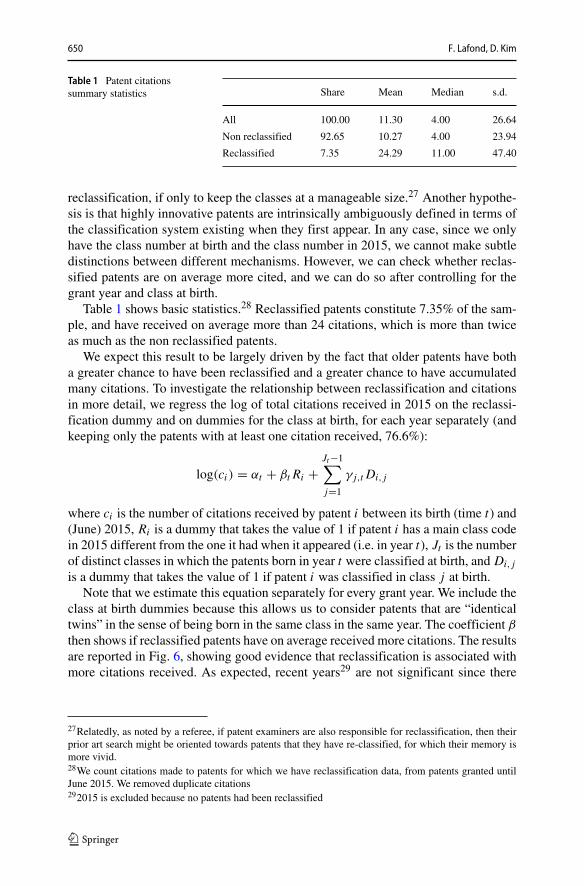
We expect this result to be largely driven by the fact that older patents have botha greater chance to have been reclassified and a greater chance to have accumulatedmany citations. To investigate the relationship between reclassification and citationsin more detail, we regress the log of total citations received in 2015 on the reclassi-fication dummy and on dummies for the class at birth, for each year separately (andkeeping only the patents with at least one citation received, 76.6%):
log(ci) = αt + βtRi +Jt−1∑
j=1
γj,tDi,j
where ci is the number of citations received by patent i between its birth (time t) and(June) 2015, Ri is a dummy that takes the value of 1 if patent i has a main class codein 2015 different from the one it had when it appeared (i.e. in year t), Jt is the numberof distinct classes in which the patents born in year t were classified at birth, and Di,j
is a dummy that takes the value of 1 if patent i was classified in class j at birth.Note that we estimate this equation separately for every grant year. We include the
class at birth dummies because this allows us to consider patents that are “identicaltwins” in the sense of being born in the same class in the same year. The coefficient β
then shows if reclassified patents have on average received more citations. The resultsare reported in Fig. 6, showing good evidence that reclassification is associated withmore citations received. As expected, recent years29 are not significant since there
27Relatedly, as noted by a referee, if patent examiners are also responsible for reclassification, then theirprior art search might be oriented towards patents that they have re-classified, for which their memory ismore vivid.28We count citations made to patents for which we have reclassification data, from patents granted untilJune 2015. We removed duplicate citations292015 is excluded because no patents had been reclassified
Long-run dynamics of the U.S. patent classification system 651
1980 1990 2000 2010
−0.2
0.0
0.2
0.4
0.6
0.8
β^
No controls
Controlling for class of origin
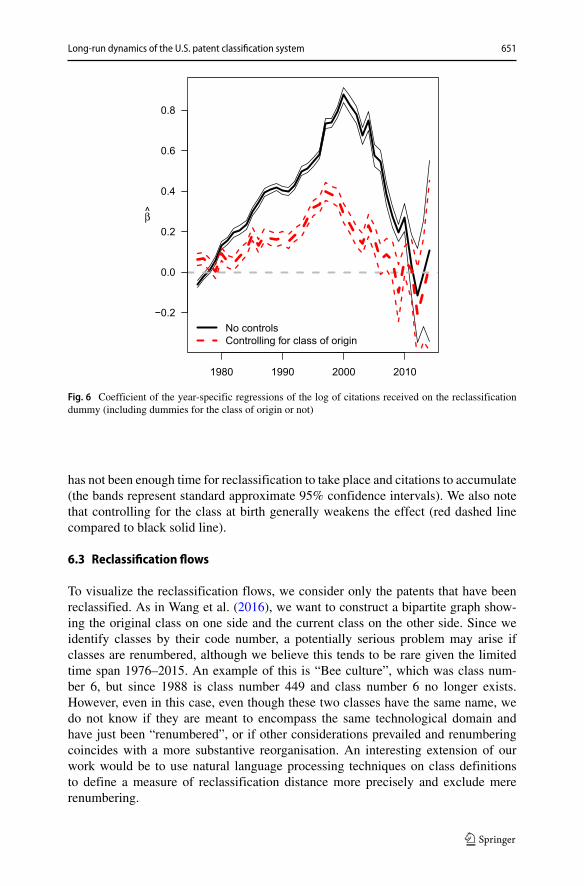
Fig. 6 Coefficient of the year-specific regressions of the log of citations received on the reclassificationdummy (including dummies for the class of origin or not)
has not been enough time for reclassification to take place and citations to accumulate(the bands represent standard approximate 95% confidence intervals). We also notethat controlling for the class at birth generally weakens the effect (red dashed linecompared to black solid line).
6.3 Reclassification flows
To visualize the reclassification flows, we consider only the patents that have beenreclassified. As in Wang et al. (2016), we want to construct a bipartite graph show-ing the original class on one side and the current class on the other side. Since weidentify classes by their code number, a potentially serious problem may arise ifclasses are renumbered, although we believe this tends to be rare given the limitedtime span 1976–2015. An example of this is “Bee culture”, which was class num-ber 6, but since 1988 is class number 449 and class number 6 no longer exists.However, even in this case, even though these two classes have the same name, wedo not know if they are meant to encompass the same technological domain andhave just been “renumbered”, or if other considerations prevailed and renumberingcoincides with a more substantive reorganisation. An interesting extension of ourwork would be to use natural language processing techniques on class definitionsto define a measure of reclassification distance more precisely and exclude mererenumbering.
652 F. Lafond, D. Kim
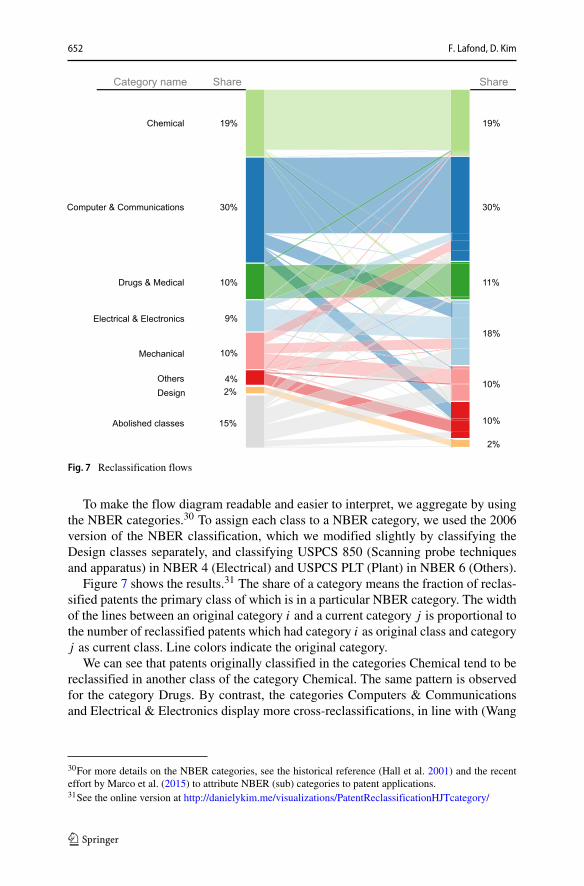
Fig. 7 Reclassification flows
To make the flow diagram readable and easier to interpret, we aggregate by usingthe NBER categories.30 To assign each class to a NBER category, we used the 2006version of the NBER classification, which we modified slightly by classifying theDesign classes separately, and classifying USPCS 850 (Scanning probe techniquesand apparatus) in NBER 4 (Electrical) and USPCS PLT (Plant) in NBER 6 (Others).
Figure 7 shows the results.31 The share of a category means the fraction of reclas-sified patents the primary class of which is in a particular NBER category. The widthof the lines between an original category i and a current category j is proportional tothe number of reclassified patents which had category i as original class and categoryj as current class. Line colors indicate the original category.
We can see that patents originally classified in the categories Chemical tend to bereclassified in another class of the category Chemical. The same pattern is observedfor the category Drugs. By contrast, the categories Computers & Communicationsand Electrical & Electronics display more cross-reclassifications, in line with (Wang
30For more details on the NBER categories, see the historical reference (Hall et al. 2001) and the recenteffort by Marco et al. (2015) to attribute NBER (sub) categories to patent applications.31See the online version at http://danielykim.me/visualizations/PatentReclassificationHJTcategory/

Long-run dynamics of the U.S. patent classification system 653
et al. 2016) findings on a restricted dataset. This may indicate that the NBER cate-gories related to computers and electronics are not as crisply defined as those relatedto Chemical and Drugs, and may be suggestive of the general purpose nature ofcomputers. This could also suggest that these domains were going through a lot ofupheaval during this time period. While there is some ambiguity in interpreting thesepatterns, they are not a priori obvious and point to the same phenomenon as the cor-relation between citations and reclassifications: dynamic, impact-full, really novel,and general-purpose fields are associated to more taxonomic volatility.
6.4 Three examples of novel classes
We now complement the study by providing three examples of novel classes, cho-sen among recently created classes (and excluding cross-reference only classes). Weproceed by looking at the origin of patents reclassified in the new class when it wascreated. We approximate this by looking at the patents that have been granted on ayear preceding the birth year of a class, and now appear as reclassified into it. Notethat we can determine the class of origin only for patents granted after 1976. We alsogive as example the oldest reclassified (utility) patent we can find. We discuss eachclass separately (see Table 2 for basic statistics on each of the three example classes,and Table 3 for the source classes in each case; “Date” is the date at which an “origin”class was established.)
Motivated by the study of Erdi et al. (2013) showing that the emergence of a newclass (442) could have been predicted by citation clustering, we study class 442,“Fabric (woven, knitted, or nonwoven textile or cloth, etc.)”. The class definitionindicates that it is “for woven, knitted, nonwoven, or felt article claimed as a fabric,having structural integrity resulting from forced interassociation of fibers, filaments,or strands, the forced interassociation resulting from processes such as weaving,knitting, needling hydroentangling, chemical coating or impregnation, autogenousbonding (. . . ) or felting, but not articles such as paper, fiber-reinforced plastic matrixmaterials (PPR), or other fiber-reinforced materials (. . . )”. This class is “an inte-gral part of Class 428 [and as such it] incorporates all the definitions and rules asto subject matter of Class 428.” The oldest patent reclassified in it was a patent byCharles Goodyear describing how applying caoutchouc to a woven cloth led to amaterial with “peculiar elasticity” (US4099, 1845, no classification on the paper file).A first remark is that this class was relatively large at birth. Second, an overwhelming
Table 2 Basic information for the three novel classes described in the main text
Class number Date established Size Size post 1976
442 1997 6240 2654
506 2007 1090 1089
706 1998 1270 1217
Size is the number of patents that are classified in a class now but were granted before the class wascreated. Size post 1976 is the same, but excluding all pre-1976 patents, to be compared with the size ofclasses of origin in Table 3

654 F. Lafond, D. Kim
Table 3 Number of patents pre-dating the creation of a class and reclassified into it, by class of origin;only the three largest origin classes are shown, with their class number and date established
Size Title Num. Date
Classes of origins for Class 442
2615 Stock material or miscella-neous articles
428 1975
16 Compositions 252 1940
5 Chemical apparatus andprocess disinfecting,deodorizing, preserving,or steril
422 1978
Classes of origins for Class 506
579 Chemistry: molecular biologyand microbiology
435 1979
127 Chemistry: analytical andimmunological testing
436 1982
69 Chemical apparatus andprocess disinfecting,deodorizing, preserving,or steril
422 1978
Classes of origins for Class 706
966 [NA] Information Process-ing System Organization
395 1991
195 [NA] Electrical Comput-ers and Data ProcessingSystems
364 1977
41 Electrical transmission orinterconnection systems
307 1952
majority of patents came from the “parent” class 428. Our interpretation is that thisis an example of an old branch of knowledge, textile, that, due to continued devel-opment, needs to be more finely defined to allow better classification and retrieval -note that the definition of 442 is not only about what the technologies are, but whatthey are not (paper and PPR).
Our second example is motivated by Kang (2012) qualitative study of the processof creation of an IPC class, to which the USPTO participated. Kang (2012) describesthat the process of class creation was initiated because of a high number of incom-ing patents on the subject matter. Her main conclusion is that disputes regardingclass delineation were resolved by evaluating the size of the newly created categoryunder certain definitions. Class 506, “Combinatorial chemistry technology: method,library, apparatus” includes, in particular, “Methods specially adapted for identify-ing the exact nature (e.g., chemical structure, etc.) of a particular library member”and “Methods of screening libraries or subsets thereof for a desired activity or prop-erty (e.g., binding ability, etc.)”. The oldest reclassified patent is US3814732 (1974),“modified solid supports for solid phase synthesis”. It claims polymeric hydrocarbon

Long-run dynamics of the U.S. patent classification system 655
resins that are modified by the introduction of other compounds. It was reclassi-fied from class 260, “Chemistry of carbon compounds”. In contrast to 442 or 706reviewed below, the reclassified patents are drawn relatively uniformly from sev-eral categories. Our interpretation is that this is an example of a mid-age technology(chemistry), which, due to its interactions with other technologies (computers), devel-ops a novel branch that is largely cross-cutting, but specific enough to warrant thecreation of a new class.
Our last example is 706, “Data processing - Artificial Intelligence”, which is a“generic class for artificial intelligence type computers and digital data processingsystems and corresponding data processing methods and products for emulation ofintelligence (. . . ); and including systems for reasoning with uncertainty (. . . ), adap-tive systems, machine learning systems, and artificial neural networks.”. We choseit because we possess at least some domain knowledge. The oldest reclassified AIpatent is US3103648 (1963), which is an “adaptive neuron having improved output”,nicely echoing the recent surge of interest in neural networks for machine learning(deep learning). It was originally classified in class 340, “Communications: electri-cal”. In contrast to the other two examples, we find that the two largest sources wereclasses that have since been abolished.32 Other classes with the “Data processing”header were created during the period, showing that the USPTO had to completelyre-organize its computer-related classes around the turn of the millennium. Our inter-pretation is that this is an example of a highly novel technology, emerging withinthe broader context of the third and perhaps fourth industrial revolution. Becausecomputers are relatively recent and general purpose, it is very difficult to createtaxonomies with stable boundaries.
These three examples show strikingly different patterns of technological develop-ment and its associated classification volatility. An old branch of knowledge that isdeepening (textile), a mid-age branch of knowledge that develops novel interactionswith others (chemistry), and a new branch of knowledge (computers) for which clas-sification officers strive to find useful organizational schemes. We acknowledge thatthese are only examples - presumably, some other examples of new classes wouldfollow similar patterns, but other patterns may exists. We have found that about twothirds of post-1976 new classes have more than 90% of their pre-birth (and post-1976) reclassified patents coming from a single origin (pre-existing class), suggestingthat a form of “branching” or “class splitting” is fairly common, at least when look-ing at OR classes only. We do not want to put too much weight on these early results,which will have to be systematized, developed further using subclasses and multipleclassifications, and, crucially, compared against results obtained using the IPC/CPC.We do think that such a systematic study of classification re-organizations would tella fairly detailed story of the evolution of technology, but rather than embarking onsuch a detailed study here, we propose to summarize most of what we have learnedso far into a simple theoretical model.
32We recovered the names of 395 and 364 from the “1996 Index to the US patent classification”; their dateestablished was available from the “Date Established” file documented in Section 3.3
656 F. Lafond, D. Kim
7 A simple model
In this section, we propose a very simple model that reproduces several factsdescribed above. As compared to other recent models for size distributions andHeaps’ law in innovation systems (Tria et al. 2014; Marengo and Zeppini 2016;Lafond 2014), the key assumption that we will introduce is that classes are sometimessplit and their items reclassified. We provide basic intuition instead of a rigorousdiscussion.33
Let us start with the well-known model of Simon (1955). A new patent arrivesevery period. The patent creates a new category with probability α, otherwise itgoes to an existing category that is chosen with probability proportional to its size.The former assumption is meaningful, because in reality the number of categoriesgrows over time. The second assumption is meaningful too, because this “preferen-tial attachment”/“cumulative advantage” is related to Gibrat’s law: categories growat a rate independent of their size, so that their probability of getting the next patentis proportional to their size.
There are three major problems with this model. First, it gives the Yule-Simondistribution for the size distribution of classes. This is basically a power law so ithas much fatter tails than the exponential law that we observe. In other words, itover predicts the number of very large categories by a large margin. Second, sinceolder categories have more time to accumulate patents, it predicts a strong correla-tion between age and size. Third, since at each time step categories are created withprobability α and patents are created with probability 1, the relationship betweenthe number of categories αt and the number of patents t is linear instead of Heaps’constant elasticity relation.
A solution to make the size distribution exponential instead of power law is tochange preferential attachment for uniform random attachment, that is, to chooseeach category with equal probability. Besides the fact that this new assumption mayseem less intuitive than Gibrat’s law, this would not solve the second problem becauseit would still be the case that older categories accumulate more patents. The solutionis to acknowledge that categories are not entities that are defined once and for all;instead, they are frequently split and their patents are reclassified.
We therefore turn to the model proposed by Ijiri and Simon (1975). It assumes thatnew categories are introduced over time by splitting existing ones. In its original formthe model postulates a linear arrangement of stars and bars. Each star represents apatent, and bars materialize the classes. For instance, if there are three patents in class1 and one patent in class 2, we have —***—*—. Now imagine that between any twosymbols there is a space. At each period, we choose a space uniformly at random andfill it with either a bar (with probability α) or a star (with complementary probability).When a star is added, it means that an existing category acquires a new patent. Whena bar is added, it means that an existing category is split into two categories. It turns
33For instance, we do not claim that the model in general produces a certain type of pattern such as a lackof age-size relationship. We simply show that, under a specific parametrization taken from the empiricaldata (say ∼10 million patents, 500 classes, and a Heaps exponent of 0.38), it produces patterns similar tothe empirical data.
Long-run dynamics of the U.S. patent classification system 657
out that the resulting size-distribution is exponential, as desired. But before we canevaluate the age-size relationship, we need to decide how to measure the age of acategory. To do this, we propose to reformulate the model as follows.
We start with one patent in one category. At each period, we first select an exist-ing category j with probability proportional to its size kj and add one patent to it.Next, with probability α we create two novel categories by splitting the selected cat-egory uniformly at random; that is, we draw a number s from a uniform distributionranging from 1 to kj . Next, each patent in j is assigned to the new category 1 withthe probability being s/kj , or to the new category 2 otherwise. This procedure leadsto a straightforward interpretation: the patents are reclassified from j to the first orthe second new category. These two categories are established at this step of the pro-cess, and since patents are created sequentially one by one, we also know the date ofthe first patent of each new category. To give a date in calendar years to patents andcategories, we can simply use the dates of the real patents.
Since α is constant, as in Simon’s original model, we are left with the third prob-lem (Heaps’ power law is violated). We propose to make α time dependent to solvethis issue.34 Denoting the number of categories by Ct and the number of patents by t
(since there is exactly one new patent per period), we want to have Ct = C0tb (Heap’s
law). This means that Ct should grow at a per period rate of dCt/dt = C0btb−1.Since we have measured b ≈ 0.378 and we want the number of categories to be 474when the number of patents is 9,847,315, we can calculate C0 = Ct/tb = 1.07. Thisgives αt = 1.07 × 0.378 t0.378−1, which we take to be 1 when t = 1.35
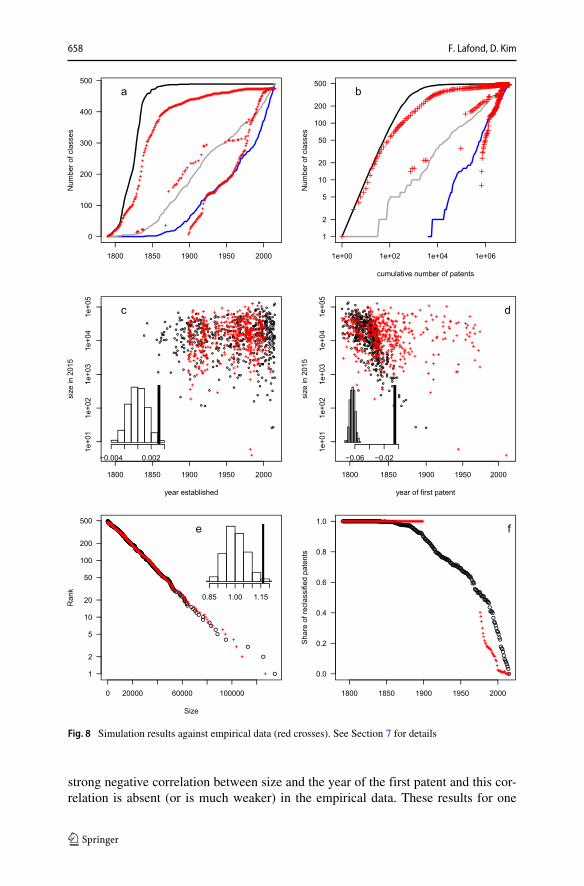
Note how parsimonious the model is: its only inputs are the current number ofpatents and categories, and the Heaps exponent. Here we do not attempt to study itrigorously. We provide simulation results under specific parameter values. Figure 8shows the outcome of a single simulation run (black dots and lines), compared toempirical data (red crosses).
The first pair of panels (a and b) shows the same (empirical) data as Figs. 1 and2 using red crosses. The results from the simulations are the curves. The simulationreproduces Heaps’ law well, by direct construction (the grey middle curve on panelb). But it also reproduces fairly well the evolution of the reconstructed number ofclasses, both the one based on the “date of first patent” and the one based on the“dates established”, and both against calendar time (years) and against the cumulativenumber of patents.
The second pair of panels (c and d) show the age-size relationships, with the sameempirical data as in Fig. 4. Panel c shows that the model seems to produce categoriesof which sizes are not strongly correlated with the year in which they were estab-lished, as in the empirical data. However, in panel d, in our model there is a fairly
34An interesting alternative (instead of using the parameter α) would be to model separately the processby which the number of patents grow and patent classification officers split categories.35There is a small inconsistency arising because the model is about primary classification only, but thehistorical number of classes and Heaps’ law are measured using all classes, because we could not differ-entiate cross-reference classes in historical data. Another point of detail is that we could have used theestimated C0 = 0.17 instead of the calculated one. These details do not fundamentally change our point.
658 F. Lafond, D. Kim
Fig. 8 Simulation results against empirical data (red crosses). See Section 7 for details
strong negative correlation between size and the year of the first patent and this cor-relation is absent (or is much weaker) in the empirical data. These results for one
Long-run dynamics of the U.S. patent classification system 659
single run are confirmed by Monte Carlo simulations. We ran the model 500 timesand recorded the estimated coefficient of a simple linear regression between the logof size and each measure of age. The insets show the distribution of the estimatedcoefficients, with a vertical line showing the coefficient estimated on the empiricaldata.
The next panel (e) shows the size distribution in a rank-size form, as in Fig. 3. Asexpected, the model reproduces this feature of the empirical data fairly well. How-ever, the empirical data are not exactly exponential and may be slightly better fittedby a negative binomial model (which has one more parameter and recovers the expo-nential when its shape parameter equals one). The top right histogram shows thedistribution of the estimated negative binomial shape parameter. The empirical valuedeparts only slightly from the Monte Carlo distribution.
Finally, the last panel (f) shows the evolution of the share of reclassified patents,with the empirical data from Fig. 5 augmented by values of 1 between 1790 and1899 (since no current categories existed prior to 1899, all patents have been reclas-sified). Here again, the model reproduces fairly well the empirical pattern. All oralmost all patents from early years have been reclassified, and the share is fallingover time. That said, for recent years (post 1976), the specific shape of the curve isdifferent.
Overall, we think that given its simplicity the model reproduces a surprisinglyhigh number of empirical facts. It allows us to understand the differences betweenthe different patterns of growth of the reconstructed and historical number of classes.Without a built-in reclassification process it would not have been possible to matchall these empirical facts – if only because without reclassification historical andreconstructed evolution coincide. This shows how important it is to consider reclas-sification when we look at the mesoscale evolution of the patent system. On the otherhand, much more could be done to make the model more interesting and realistic, forinstance by also modelling subclasses and requiring that reclassification takes placewithin a certain distance.
8 Conclusion
In this paper, we have presented a quantitative history of the evolution of the mainpatent classes within the U.S. Patent Classification System. Our main finding is thatthe USPCS incurred regular and important changes. For academic researchers, thesechanges may be perceived as a source of problems, because this suggests that it maynot always be legitimate to think that a given patent belongs to one and the samecategory forever. This means that results obtained using the current classificationsystem may change in the future, when using a different classification system, andeven if the very same set of patent is considered.
That said, we do not think the effect would be strong. Besides, using the currentclassification system is still often the best thing to do because of its consistency. Ourpoint here is not to critique the use of the current classification, but to argue thathistorical changes to the classification system itself contain interesting informationthat has not been exploited.

660 F. Lafond, D. Kim
Our first result is that different methods to compute the growth of the number ofclasses give widely different results, establishing that the changes to the classifica-tion system are very important. Our second result suggests that we do not see verylarge categories in empirical data because categories are regularly split, leading toan exponential size distribution with no relationship between the age and size of acategory. Our third result is that reclassification data contains useful information tounderstand technological evolution. Our fourth result is that a very simple model thatcan explain many of the observed patterns needs to include the splitting of classesand the reclassification of patents. Taken together, these results show that it is bothnecessary and interesting to understand the evolution of classification systems.
An important limitation of our study is that it is highly limited in scope: we studythe US, at the class level, using main classifications only. A contrasting example wehave found is the French patent classification of 1853, which contained 20 groups,and was revised multiple times in the 19th century, but while subclasses were added,it kept a total of 20 classes even in the “modern” classification of 1904. Similarly,while direct comparison is difficult, our preliminary exploration of other classifica-tion systems, such as the IPC and CPC, suggests that they do not feature the same sizedistribution, perhaps pointing to a different mode of evolution than the one proposedin our model.
We believe that our findings are interesting for all researchers working with eco-nomic and technological classifications, because we characterized quantitatively thevolatility of the patent classification system. We do not know whether they areunstable because collective representations of technological artefacts are context-dependent, or because as more items are introduced and resources invested inclassifying them appropriately, collective discovery of the “true” mesoscale partitiontakes place. But clearly, when interpreting the results that rely upon a static snapshotof a classification system, one should bear in mind that classification systems aredynamic.
A case in point is the use of technological classes to produce forecasts: how canwe predict the evolution of a given class or set of classes several decades ahead, whenwe know these classes might not even exist in the future? In this paper, we are notproposing a solution to this forecasting issue - only raising conceptual problems thatclassification system changes pose. Further, even if we consider that today’s catego-rization will not change, a subtle issue arises in the production of correct forecastingmodels. To see this, consider developing a time series model describing the growthof some particular classes. To test the forecasting ability of the model, one shouldperform out-of-sample tests, as, e.g., Farmer and Lafond (2016) did for technologyperformance time series. Part of the past data is used to predict more recent data, andthe data that are not used for estimation are compared to the forecasts. Now, note thatwhen we use the current classification, we effectively use data from the present; thatis, the delineation of categories for past patents uses knowledge from the present, andit is therefore not entirely valid to evaluate forecasts (there is “data snooping” in thesense that one uses knowledge of the future to predict the future).
Classification system changes pose serious problems for forecasting but may alsobring opportunities: if classification changes reflect technological change, then onecan in principle construct quantitative theories of that change. Since the patterns
Long-run dynamics of the U.S. patent classification system 661
described here could be roughly understood using an extremely simple model, it maybe possible to make useful forecasts with more detailed models and data, for instancepredicting new classes (Erdi et al. 2013; Kyebambe et al. 2017). This could be usefulbecause patent classification changes are more frequent than changes to other classi-fication systems such as industries, products and occupations. An interesting avenuefor future research would be to use the changes of the patent classification system topredict the changes of industry and occupation classification systems, thus predictingthe types of jobs of the future.
Beyond innovation studies, with the rising availability of very large datasets, dig-itized and carefully recorded classifications and classification changes will becomeavailable. It will be possible to explore classifications as an evolving network andtrack the splitting, merging, birth and death of categories. This is an exciting new areaof research, but the big data that we will accumulate will only (or mostly) cover recentyears. This makes historical studies such as the present one all the more important.
Acknowledgments This paper reuses material from an unpublished chapter of the first author’s PhD the-sis at UNU-MERIT, Maastricht University. This work was supported by the National Research Foundationof Korea (NRF) funded by the Korean Government [Grants No. NRF-2017R1A2B3006930 (D.K.)], andthe European Commission project FP7-ICT-2013-611272 (GROWTHCOM) (F.L.). We also acknowledgesupport from Partners for a New Economy, the London Institute for Mathematical Sciences, the Institutefor New Economic Thinking at the Oxford Martin School, and the Oxford Martin School Programme onTechnological and Economic Change. We have benefited from excellent comments from two anonymousreferees and many colleagues, including Jeff Alstott, Yuki Asano, Mariano Beguerisse Dıaz, J. DoyneFarmer, Marco Pangallo, Emanuele Pugliese, Giorgio Triulzi and Vilhelm Verendel. We are also gratefulto Diana Greenwald and the USPTO for helping us in locating data sources.
Compliance with Ethical Standards
Conflict of interests The authors declare that they have no conflict of interest.
Open Access This article is distributed under the terms of the Creative Commons Attribution 4.0 Interna-tional License (http://creativecommons.org/licenses/by/4.0/), which permits unrestricted use, distribution,and reproduction in any medium, provided you give appropriate credit to the original author(s) and thesource, provide a link to the Creative Commons license, and indicate if changes were made.
Publisher’s note Springer Nature remains neutral with regard to jurisdictional claims in published mapsand institutional affiliations.
References
Acemoglu D, Akcigit U, Kerr WR (2016) Innovation network, Proceedings of the National Academy ofSciences, pp 201613559
Aharonson BS, Schilling MA (2016) Mapping the technological landscape: Measuring technologydistance, technological footprints, and technology evolution. Res Policy 45(1):81–96
Alstott J, Triulzi G, Yan B, Luo J (2016) Mapping technology space by normalizing patent networks.Scientometrics 110(1):443–479
Andersen B (1999) The hunt for S-shaped growth paths in technological innovation: a patent study. J EvolEcon 9(4):487–526
Antonelli C, Krafft J, Quatraro F (2010) Recombinant knowledge and growth: The case of icts. StructChang Econ Dyn 21(1):50–69
662 F. Lafond, D. Kim
Bailey M (1946) History of classification of patents. J Pat Off Socy 28:463Basalla G (1988) The evolution of technology. Cambridge University Press, CambridgeBenner M, Waldfogel J (2008) Close to you? bias and precision in patent-based measures of technological
proximity. Res Policy 37(9):1556–1567Berger T, Frey CB (2017) Industrial renewal in the 21st century: evidence from US cities. Reg Stud
51(3):404–413Bettencourt L, Samaniego H, Youn H (2014) Professional diversity and the productivity of cities. Sci Rep
4:5393Blackman M (2011) Classification news. World Patent Inf 33(3):294Breschi S, Lissoni F, Malerba F (2003) Knowledge-relatedness in firm technological diversification. Res
Policy 32(1):69–87Bresnahan TF, Trajtenberg M (1995) General purpose technologies engines of growth? J Econ 65(1):83–
108Caminati M, Stabile A (2010) The pattern of knowledge flows between technology fields. Metroeconom-
ica 61(2):364–397Carnabuci G (2013) The distribution of technological progress. Empir Econ 44(3):1143–1154Cockburn IM, Kortum S, Stern S (2002) Are all patent examiners equal? The impact of examiner
characteristics. NBER Working Papers No. w8980Dopfer K, Foster J, Potts J (2004) Micro-meso-macro. J Evol Econ 14(3):263–279Dosi G (1982) Technological paradigms and technological trajectories:: A suggested interpretation of the
determinants and directions of technical change. Res Policy 11(3):147–162Erdi P, Makovi K, Somogyvari Z, Strandburg K, Tobochnik J, Volf P, Zalanyi L (2013) Prediction of
emerging technologies based on analysis of the us patent citation network. Scientometrics 95(1):225–242
Falasco L (2002a) Bases of the united states patent classification. World Patent Inf. 24(1):31–33Falasco L (2002b) United states patent classification: system organization. World Patent Inf. 24(2):111–
117Farmer JD, Lafond F (2016) How predictable is technological progress? Res Policy 45(3):647–665Foucault M (1966) Les mots et les choses, vol 42. Gallimard, ParisFreeman C, Soete L (1997) The economics of industrial innovation, 3rd edn. MIT Press, CambridgeGibrat R (1931) Les inegalites economiques, Recueil SireyGriliches Z (1990) Patent statistics as economic indicators: A survey. J Econ Lit 28(4):1661–1707Hall BH, Jaffe A, Trajtenberg M (2005) Market value and patent citations. RAND J Econ 36(1):16–38Hall B, Jaffe A, Trajtenberg M (2001) The NBER patent citation data file: Lessons, insights and
methodological toolsHeaps HS (1978) Information retrieval: Computational and theoretical aspects. Academic Press, Inc,
CambridgeHicks D (2011) Structural change and industrial classification. Struct Chang Econ Dyn 22(2):93–105Ijiri Y, Simon HA (1975) Some distributions associated with bose-einstein statistics. Proc Natl Acad Sci
72(5):1654–1657Kang HY (2012) Science inside law: The making of a new patent class in the international patent
classification. Sci Context 25(4):551–594Kim D, Cerigo DB, Jeong H, Youn H (2016) Technological novelty profile and inventions future impact.
EPJ Data Science 5(1):1Klepper S (1997) Industry life cycles. Ind Corp Chang 6(1):145–182Kutz DO (2004) Examining the evolution and distribution of patent classifications. In: 2004 Proceedings
8th international conference on information visualisation, 2004. IV. IEEE pp 983–988Kyebambe MN, Cheng G, Huang Y, He C, Zhang Z (2017) Forecasting emerging technologies: A
supervised learning approach through patent analysis. Technol Forecast Soc Chang 125:236–244Lafond F (2014) The evolution of knowledge systems, UNU-MERIT PhD Thesis, Maastricht University
Press, chapter The size distribution of patent categories: USPTO 1976-2006, pp 91—109Latour B (2005) Reassembling the social: An introduction to actor-network-theory. Oxford University
Press, USALeydesdorff L (2008) Patent classifications as indicators of intellectual organization. J Am Soc Inf Sci
Technol 59(10):1582–1597Lin J (2011) Technological adaptation, cities, and new work. Rev. Econ. Stat. 93(2):554–574Lu L, Zhang Z-K, Zhou T (2010) Zipfs law leads to heaps law: Analyzing their relation in finite-size
systems. PloS one 5(12):e14139
Long-run dynamics of the U.S. patent classification system 663
Lybbert TJ, Zolas NJ (2014) Getting patents and economic data to speak to each other: An algorithmiclinks with probabilities approach for joint analyses of patenting and economic activity. Res Policy43(3):530–542
Malerba F (2002) Sectoral systems of innovation and production. Res Policy 31(2):247–264Marco AC, Carley M, Jackson S, Myers AF (2015) The uspto historical patent data files: Two centuries of
innovation, SSRN 2616724Marengo L, Zeppini P (2016) The arrival of the new. J Evol Econ 26(1):171–194McNamee RC (2013) Can’t see the forest for the leaves: Similarity and distance measures for hierarchical
taxonomies with a patent classification example. Res Policy 42(4):855–873Nelson R (2006) Perspectives on technological evolution. In: Dopfer K (ed) The evolutionary foundations
of economics. Cambridge University Press, pp 461–471Nooteboom B, Van Haverbeke W, Duysters G, Gilsing V, Van den Oord A (2007) Optimal cognitive
distance and absorptive capacity. Res. Policy 36(7):1016–1034OTAF (1985) Review and assessment of the otaf concordance between the us patent classification and
the standard industrial classification systems: Final report., Technical report, Office of TechnologyAssessment, USPTO
Paradise J (2012) Claiming nanotechnology: improving uspto efforts at classification of emerging nano-enabled pharmaceutical technologies. Northwest J Technol Intellect Prop 10(42):169–208
Pasinetti LL (1983) Structural change and economic growth: a theoretical essay on the dynamics of thewealth of nations, CUP Archive
Pavitt K (1984) Sectoral patterns of technical change: towards a taxonomy and a theory. Res Policy13(6):343–373
Pavitt K (1985) Patent statistics as indicators of innovative activities: possibilities and problems.Scientometrics 7(1-2):77–99
Petersen AM, Rotolo D, Leydesdorff L (2016) A triple helix model of medical innovation: Supply,demand, and technological capabilities in terms of medical subject headings. Res Policy 45(3):666–681
Reingold N (1960) Us patent office records as sources for the history of invention and technologicalproperty. Technol Cult 1(2):156–167
Rotkin IJ, Dood KJ, Thexton MA (1999) A history of patent classification in the United States Patent andTrademark Office, Patent Documentation Society
Saviotti P (1996) echnological evolution, variety, and the economy. Edward Elgar Pub, CheltenhamSaviotti PP, Pyka A (2004) Economic development by the creation of new sectors. J Evol Econ 14(1):1–35Scherer F (1984) Using linked patent and r&d data to measure interindustry technology flows. In: R&D,
patents, and productivity, University of Chicago Press, pp 417–464Schmookler J (1966) Invention and economic growthSchuett F (2013) Patent quality and incentives at the patent office. RAND J Econ 44(2):313–336Schumpeter JA (1934) The theory of economic development:An inquiry into profits, capital, credit,
interest, and the business cycle. Harvard University Press, HarvardSilverberg G, Verspagen B (2003) Breaking the waves: a poisson regression approach to schumpeterian
clustering of basic innovations. Camb J Econ 27(5):671–693Simmons HJ (2014) Categorizing the useful arts: Part, present, and future development of patent
classification in the united states. Law Libr J 106:563Simon H (1955) On a class of skew distribution functions. Biometrika 42(3/4):425–440Sole RV, Valverde S, Casals MR, Kauffman SA, Farmer J, Eldredge N (2013) The evolutionary ecology
of technological innovations. Complexity 18(4):15–27Stafford AB (1952) Is the rate of invention declining? American journal of sociology 57(6):539–545Strumsky D, Lobo J (2015) Identifying the sources of technological novelty in the process of invention.
Res Policy 44(8):1445–1461Strumsky D, Lobo J, van der Leeuw S (2012) Using patent technology codes to study technological
change. Econ Innov New Technol 21(3):267–286Temkin I, Eldredge N (2007) Phylogenetics and material cultural evolution. Curr Anthropol 48(1):146–
154Tria F, Loreto V, Servedio V, Strogatz S (2014) The dynamics of correlated novelties, Scientific reportsUSPTO (2005) Handbook of classification, Technical report, USPTOValverde S, Sole RV (2015) Punctuated equilibrium in the large-scale evolution of programming
languages. J R Soc Interface 12(107):20150249
664 F. Lafond, D. Kim
Vernon R (1966) International investment and international trade in the product cycle. Q J Econ 80(2):190–207
Verspagen B (1997) Measuring intersectoral technology spillovers: estimates from the european and uspatent office databases. Econ Syst Res 9(1):47–65
Wang C-C, Sung H-Y, Huang M-H (2016) Technological evolution seen from the USPC reclassifications.Scientometrics 107(2):537–553
Wolter B (2012) It takes all kinds to make a world–some thoughts on the use of classification in patentsearching. World Patent Inf 34(1):8–18
Xiang C (2005) New goods and the relative demand for skilled labor. Rev Econ Stat 87(2):285–298Youn H, Bettencourt LM, Lobo J, Strumsky D, Samaniego H, West GB (2016) Scaling and universality in
urban economic diversification. J R Soc Interface 13(114):20150937Youn H, Strumsky D, Bettencourt LMA, Lobo J (2015) Invention as a combinatorial process: evidence
from us patents. J R Soc Interface 12:20150272Yule G (1925) A mathematical theory of evolution, based on the conclusions of Dr JC Willis, FRS. Philo-
sophical Transactions of the Royal Society of London Series B, Containing Papers of a BiologicalCharacter 213:21–87