Embed Size (px)
Citation preview

By Robyn I. Stone
Long-Term Care for the Elderly with Disabilities: Current Policy, Emerging Trends, and Implications for theTwenty-First Century

Long-Term Care for the Elderly with Disabilities: Current Policy, Emerging Trends, and Implications for theTwenty-First Century
Milbank Memorial Fund
By Robyn I. Stone

Foreword . . . . . . . . . . . . . . . . . . . . . . . . . . . . . . . . . . . . . . . . . . . . . . . . . . . . . . . . . . . . . . . . . . . . . . . . . . . . . . iv
Acknowledgments . . . . . . . . . . . . . . . . . . . . . . . . . . . . . . . . . . . . . . . . . . . . . . . . . . . . . . . . . . . . . . . . . . . . . . . v
Introduction . . . . . . . . . . . . . . . . . . . . . . . . . . . . . . . . . . . . . . . . . . . . . . . . . . . . . . . . . . . . . . . . . . . . . . . . . . . . 1
Defining Long-Term Health Care . . . . . . . . . . . . . . . . . . . . . . . . . . . . . . . . . . . . . . . . . . . . . . . . . . . . . . . . . 2
Relationship between Acute and Long-Term Care . . . . . . . . . . . . . . . . . . . . . . . . . . . . . . . . 2
The Role of Residence in Long-Term Care . . . . . . . . . . . . . . . . . . . . . . . . . . . . . . . . . . . . . . 3
Care Settings . . . . . . . . . . . . . . . . . . . . . . . . . . . . . . . . . . . . . . . . . . . . . . . . . . . . . . . . . . . . . . 4
Who Needs and Uses Long-Term Care? . . . . . . . . . . . . . . . . . . . . . . . . . . . . . . . . . . . . . . . . . . 5
Who Provides Care? . . . . . . . . . . . . . . . . . . . . . . . . . . . . . . . . . . . . . . . . . . . . . . . . . . . . . . . . . . 9
Informal Care . . . . . . . . . . . . . . . . . . . . . . . . . . . . . . . . . . . . . . . . . . . . . . . . . . . . . . . . . 9
Formal Care Providers . . . . . . . . . . . . . . . . . . . . . . . . . . . . . . . . . . . . . . . . . . . . . . . . . . . 10
Long-Term Care Financing . . . . . . . . . . . . . . . . . . . . . . . . . . . . . . . . . . . . . . . . . . . . . . . . . . . . . . . . . . . . . 13
Medicaid . . . . . . . . . . . . . . . . . . . . . . . . . . . . . . . . . . . . . . . . . . . . . . . . . . . . . . . . . . . . . . . . . . . . . . . 13
Medicare . . . . . . . . . . . . . . . . . . . . . . . . . . . . . . . . . . . . . . . . . . . . . . . . . . . . . . . . . . . . . . . . 14
Private Long-Term Care Insurance . . . . . . . . . . . . . . . . . . . . . . . . . . . . . . . . . . . . . . . . . . . 17
Long-Term Care Delivery . . . . . . . . . . . . . . . . . . . . . . . . . . . . . . . . . . . . . . . . . . . . . . . . . . . . . . . . . . . . . . . 21
Integration of Acute and Long-Term Care Services . . . . . . . . . . . . . . . . . . . . . . . . . . . . . . . 21
Federal Demonstrations . . . . . . . . . . . . . . . . . . . . . . . . . . . . . . . . . . . . . . . . . . . . . . . . . . . 22
State Initiatives . . . . . . . . . . . . . . . . . . . . . . . . . . . . . . . . . . . . . . . . . . . . . . . . . . . . . . . . . 23
Provider Initiatives . . . . . . . . . . . . . . . . . . . . . . . . . . . . . . . . . . . . . . . . . . . . . . . . . . . . . . 24
Assisted Living . . . . . . . . . . . . . . . . . . . . . . . . . . . . . . . . . . . . . . . . . . . . . . . . . . . . . . . . . . . 25
Consumer-Directed Care . . . . . . . . . . . . . . . . . . . . . . . . . . . . . . . . . . . . . . . . . . . . . . . . . . . . . 28
Workforce Preparation . . . . . . . . . . . . . . . . . . . . . . . . . . . . . . . . . . . . . . . . . . . . . . . . . . . . . . . . . . . . . . . . . 31
The Future of Long-Term Care Demand . . . . . . . . . . . . . . . . . . . . . . . . . . . . . . . . . . . . . . . . . . . . . . . . . 34
The Aging Population . . . . . . . . . . . . . . . . . . . . . . . . . . . . . . . . . . . . . . . . . . . . . . . . . . . . . . . . . . . 34
Increased Longevity: Quantity vs. Quality . . . . . . . . . . . . . . . . . . . . . . . . . . . . . . . . . . . . . . . . . . . 35
Geographic Diversity . . . . . . . . . . . . . . . . . . . . . . . . . . . . . . . . . . . . . . . . . . . . . . . . . . . . . . . . . . . . 36
The Future of Informal Caregiving . . . . . . . . . . . . . . . . . . . . . . . . . . . . . . . . . . . . . . . . . . . . . . . . 40
The Economic Status of the Future Elderly . . . . . . . . . . . . . . . . . . . . . . . . . . . . . . . . . . . . . . . 42
The Future Supply of Long-Term Care Services . . . . . . . . . . . . . . . . . . . . . . . . . . . . . . . . . . . . . . . . . . 47
The Future Supply of Alternative Settings . . . . . . . . . . . . . . . . . . . . . . . . . . . . . . . . . . . . . . . . . . . . . . . . 47
The Future of the Long-Term Care Workforce . . . . . . . . . . . . . . . . . . . . . . . . . . . . . . . . . . . . . . . . 48
(Continued)
T A B L E O F C O N T E N T S

Sinking or Swimming into the Future? . . . . . . . . . . . . . . . . . . . . . . . . . . . . . . . . . . . . . . . . . . . . . . . . . . 50
Implications for Long-Term Care Financing . . . . . . . . . . . . . . . . . . . . . . . . . . . . . . . . . . . . . . . . . 50
Implications for Service Delivery . . . . . . . . . . . . . . . . . . . . . . . . . . . . . . . . . . . . . . . . . . . . . . . . . . . 54
Impact on Workforce Development and Training . . . . . . . . . . . . . . . . . . . . . . . . . . . . . . . . . . . . . . . . . . 57
Conclusion . . . . . . . . . . . . . . . . . . . . . . . . . . . . . . . . . . . . . . . . . . . . . . . . . . . . . . . . . . . . . . . . . . . . . . . . . . . . 60
References . . . . . . . . . . . . . . . . . . . . . . . . . . . . . . . . . . . . . . . . . . . . . . . . . . . . . . . . . . . . . . . . . . . . . . . . . . . . 61
The Author . . . . . . . . . . . . . . . . . . . . . . . . . . . . . . . . . . . . . . . . . . . . . . . . . . . . . . . . . . . . . . . . . . . . . . . . . . . . 72

Milbank Memorial Fundiv
This report arrays evidence and analysis to assist decision makers in the private and public sectors to
address three important and perplexing questions about long-term care for the increasing number of
Americans who are elderly and frail. These questions are who should pay for long-term care services
through what mechanisms; how to design and deliver these services; and how to recruit, train, and
retain a workforce to deliver long-term care services.
The Milbank Memorial Fund commissioned Robyn I. Stone to write this report as a result of
meetings of leading trustees and executives of both nonprofit and investor-owned organizations in
long-term care. The Fund and the American Association of Homes and Services for the Aging
(AAHSA) convened these meetings between 1997 and 1999. AAHSA represents 5,600 nonprofit
organizations that provide health care, housing, and services to more than one million of the nation’s
elderly. The Fund is an endowed national foundation that works with decision makers in the public
and private sectors to study and communicate about significant issues in health policy.
The leaders convened by AAHSA and the Fund deplored the absence of a synthesis of
information and analysis pertinent to developing public and institutional policy for the future. They
welcomed an invitation to Stone to write such a synthesis because of her achievements as a researcher
and senior public official in long-term care.
Many people reviewed Stone’s report in draft. Reviewers included managers and trustees of
organizations that provide long-term care services, executives of associations and advocacy groups,
researchers, and senior officials in the legislative and executive branches of both state and federal
government as well as those in international organizations. Stone made many changes in response to
questions and suggestions from this diverse set of reviewers.
Daniel M. Fox
President
Samuel L. Milbank
Chairman
F O R E W O R D

Milbank Memorial Fundv
The following persons participated in meetings and/or reviewed this report in draft. They are listed in
the positions they held at the time of their participation.
Kevin Anderson, Administrator, Mankato Lutheran Home, Mankato, Minn.; Robert A. Applebaum,
Professor of Sociology, Scripps Gerontology Center, Miami University (Ohio); Robert D. Armitage, Chief
Executive Officer and President, Ebenezer Social Ministries, Shoreview, Minn.; Roger Auerbach,
Administrator, Senior and Disabled Services Division, Oregon Department of Human Resources; Susan
S. Bailis, Co-Chairman and Chief Executive Officer, SolomontBailis Ventures, LLC, Newton, Mass.;
Linda Berglin, Member, Human Resources Finance Committee, Minnesota Senate; Jo Ivey Boufford,
Dean, Robert F. Wagner Graduate School of Public Service, New York University; Laurence G. Branch,
Professor, Center for the Study of Aging, Duke University Medical Center, Durham, N.C.; Richard
Browdie, Secretary, Pennsylvania Department of Aging; James Carlson, Executive Director, Oregon
Health Care Association; Reginald Carter, Executive Vice President, Health Care Association of
Michigan; Rick E. Carter, President, Care Providers of Minnesota; Christine K. Cassel, Professor and
Chairman, Department of Geriatrics and Adult Development, The Mount Sinai Medical Center, New
York, N.Y.; Harriette Chandler, Chair, Joint Health Care Committee, Massachusetts House of
Representatives; Elbert C. Cole, Executive Director and Founder, Shepherd’s Centers of America,
Kansas City, Mo.; John J. Costello, Partner, Byrne, Costello & Pickard, PC, Syracuse, N.Y.; William J. Cox,
Great Falls, Va.; John E. Curley, Jr., Gold River, Calif.; James E. Dewhirst, President and Chief Executive
Officer, The Friendly Home, Rochester, N.Y.; John A. Diffey, President, The Kendal Corporation,
Kennett Square, Pa.; Connie Evashwic, Center for Health Care Innovation, California State University;
Judith Feder, Professor of Public Policy, Institute for Health Care Research & Policy, Georgetown
University Medical Center; Kathleen M. Foley, Chief, Pain Service, Department of Neurology, Memorial
Sloan-Kettering Cancer Center, New York, N.Y., and Director, Project on Death in America, New York,
N.Y.; Iris Freeman, Executive Director, Advocacy Center for Long Term Care, Bloomington, Minn.;
Robert B. Friedland, Director, National Academy on an Aging Society, The Gerontological Society of
America, Washington, D.C.; Susan Gerard, Chair, Health Committee, Arizona House of
Representatives; Ann E. Gillespie, Senior Vice President, Professional and Organizational
Development, American Association of Homes and Services for the Aging (AAHSA), Washington, D.C.;
Sheldon L. Goldberg, President, AAHSA, then President and Chief Executive Officer, The Jewish Home
and Hospital, New York, N.Y.; Maria Gomez, Assistant Commissioner, Aging Initiative: Project 2030,
Minnesota Department of Human Services; Sally Goodwin, Executive Director, Oregon Alliance of
Senior and Health Services, Tigard, Ore.; Lee Greenfield, Chair, Health and Human Services Finance
Division, Minnesota House of Representatives; Jennie Chin Hansen, Executive Director, On Lok Senior
Health Services, San Francisco, Calif.; Mary Harahan, Deputy to the Deputy Assistant Secretary of
Disability, Aging, and Long-term Care Policy, U.S. Department of Health and Human Services; Steve
Hess, President, Florence Home, Omaha, Nebr.; Peter Hicks, Co-ordinator, Policy Implications of
Ageing, Directorate for Education, Employment, Labour and Social Affairs, Organisation for Economic
A C K N O W L E D G M E N T S

Milbank Memorial Fundvi
Co-operation and Development (OECD), Paris, France; James Introne, President, Loretto, Syracuse,
N.Y.; Alexandre Kalache, Chief, Ageing and Health Programme, World Health Organization (WHO),
Geneva, Switzerland; Robert L. Kane, Professor, Minnesota Chair in Long-term Care and Aging,
University of Minnesota, School of Public Health; Rosalie Kane, Professor and Director, National Long-
term Care Center, University of Minnesota; Mark Kator, President, Isabella Geriatric Center, New York,
N.Y.; Sandra Kilde, President and Chief Executive Officer, Michigan Association of Homes and Services
for the Aging; Sheila M. Kiscaden, Ranking Minority Member, Health and Family Security Committee,
Minnesota Senate; Gayle Kvenvold, President and Chief Executive Officer, Minnesota Health and
Housing Alliance; Richard Ladd, Ladd & Associates, Austin, Tex.; Richard R. Lance, Immediate Past
President, National Benevolent Association, Stanley, Kans.; Paul J. Lanzikos, President and Chief
Executive Officer, Massachusetts Aging Services Association; Monte J. Levinson, Vice President,
Medical Affairs, Presbyterian Homes, Evanston, Ill.; Phyllis Lissman, Chair, Governor of Oregon’s
Commission on Senior Services; Marian Lupu, Executive Director, Pima Council on Aging, Tucson,
Ariz.; Robert L. Mollica, Deputy Director, National Academy for State Health Policy, Portland, Maine;
Tom Moore, Executive Director, Wisconsin Health Care Association; William Moyer, Chairman of the
Board, Presbyterian Homes, Inc., Lewisburg, Pa.; Andrew W. Nichols, Member, Health Committee,
Arizona House of Representatives; Charles B. Persell, Chair, Board of Directors Village Center for Care,
New York, N.Y.; Kitty Piercy, Democratic Leader, Oregon House of Representatives; Steve Proctor,
President and Chief Executive Officer, Presbyterian Homes, Inc., Camp Hill, Pa.; Carol Raphael, Chief
Executive Officer, Visiting Nurse Service of New York; Cindy Resnick, Senior Program Coordinator, The
Rural Health Office, University of Arizona; Robert Restuccia, Executive Director, Health Care For All,
Boston, Mass.; Michael Rodgers, Senior Vice President for Government Affairs, AAHSA; Alan G.
Rosenbloom, Acting President/Chief Executive Officer, AAHSA; Peggy A. Rosenzweig, Member, Joint
Finance Committee, Wisconsin Senate; John Rother, Director, Legislation and Public Policy, American
Association of Retired Persons, Washington, D.C.; Paul Rulison, Executive Director, Healthcare
Trustees of New York State; Edward Ryle, Director, Arizona Catholic Conference; Nelson J. Sabatini,
Vice President, Integrated Delivery Systems Operations, University of Maryland Medical System; Dallas
Salisbury, President, Employee Benefit Research Institute, Washington, D.C.; John Sauer, Executive
Director, Wisconsin Association of Homes and Services for the Aging; William Scanlon, Director, Health
Systems Issues, United States General Accounting Office; Laurie Sitton, Chair, Services Committee,
Oregon Disabilities Commission, Independent Living Resources; Robert Smedes, Deputy Director,
Medical Services Administration, Michigan Department of Community Health; Jeanette C. Takamura,
Assistant Secretary for Aging, U.S. Department of Health and Human Services; Dale M. Thompson,
Chief Executive Officer, Health Dimensions, Cambridge, Minn.; Deborah Thomson, Director of Public
Policy, Alzheimer’s Association, Cambridge, Mass.; Joan Van Nostrand, Statistician, National Center for
Health Statistics, Hyattsville, Md.; Bruce Vladeck, Professor of Health Policy and Senior Vice President
for Policy, The Mount Sinai Medical Center, New York, N.Y.; Arthur Y. Webb, Chief Executive Officer,
Village Center for Care, New York, N.Y.; James Weil, Vice President, Mature Market Group,

Milbank Memorial Fundvii
Metropolitan Life Insurance Company, Westport, Conn.; Terrie Wetle, Deputy Director, National
Institute on Aging, Bethesda, Md.; and Chuck Wilhelm, Director, Strategic Finance Office, Wisconsin
Department of Health and Family Services.

Milbank Memorial Fund1
Long-term care has become an increasingly urgent policy issue. The number of elderly Americans and
their proportion of the nation’s population are growing, and Americans who reach age 65 are living
longer. Debate over long-term care by policymakers and members of the public has ebbed and flowed
during the past three decades. More and more Americans and their leaders face the dilemma of how to
meet the needs of elders with chronic disabilities in the United States.
The mass media have highlighted the cost of long-term care and the need to plan for it well in
advance; the burden of long-term care on individuals, families, and society; and concerns about the
quality of care.
Policymakers are struggling to define the roles of the federal and state governments and the
private sector in financing and delivering care to elderly people with disabilities.
Policymakers now face three significant questions: (1) Who should pay for long-term care, and
how? (2) How should services to elders with disabilities and their families be designed, and who should
deliver them? (3) How can the labor force delivering that care be recruited, trained, and maintained? For
long-term care policymakers in the United States, this is the triple knot. Each of these three strands
demands equal attention if sound, appropriate policy is to be developed.
The question of financing has received periodic attention from federal policymakers since the
early 1970s. The potentially high cost and the lack of political will, however, have impeded serious
debate about access to long-term care and about the “right” balance between the roles of the public and
private sectors. Except for some federal demonstration initiatives, policy development related to the
delivery of services has occurred primarily at the state and local levels. At every level, the availability and
quality of the current and future long-term care labor force—both professional and paraprofessional—
have received the least attention of all.
This paper describes the current status of the three key dimensions of long-term care policy—
financing, delivery, and workforce—and identifies some of the major demographic and policy trends that
will affect the demand for, and supply of, long-term care in the future. First I define long-term care,
including its range of services and settings, the populations that need care, and the providers who
comprise the formal and informal workforce. Next I review the major issues that affect financing,
delivery, and workforce development. Then this paper identifies trends and projections that will help
shape the long-term care landscape in the twenty-first century. Finally, I discuss the implications of
current and emerging trends for long-term care financing, delivery, and workforce development.
While recognizing that long-term care is important to people with disabilities of all ages, this
paper focuses on policy for those aged 65 and older—the group most likely to need services. Although the
boundaries between acute and long-term care have blurred during the last decade, this paper does not
address all the issues related to services required by elders with chronic illness and disabilities; its
examination of managed care and integration of services, for instance, is limited to their implications
for the development of long-term care policy and delivery systems. This paper does not offer
recommendations or prescriptions for an ideal system. It is meant instead as a catalyst for dialogue and
debate among policymakers, providers, and consumers at all levels.
I N T R O D U C T I O N

Milbank Memorial Fund2
“Long-term care” is not easy to define. The boundaries among primary, acute, and long-term care
have blurred. Instead of concentrating on acute care in hospitals as before, our health system is
increasingly devoted to chronic care by various providers in various settings.
In acute care, physicians, nurses, and insurance companies choose and deliver treatment. Long-
term care concentrates on helping individuals to function as well as possible; it demands intense
involvement by family members, particularly wives and adult daughters, as providers and decision-
makers. Families are often equal beneficiaries of long-term care interventions, because the care for
the elderly person who is disabled is an important respite for the family caregiver (Stone and
Kemper, 1989).
Long-term care encompasses a broad range of help with daily activities that chronically disabled
individuals need for a prolonged period of time. These primarily low-tech services are designed to
minimize, rehabilitate, or compensate for loss of independent physical or mental functioning. The
services include assistance with basic activities of daily living (ADLs), such as bathing, dressing,
eating, or other personal care. Services may also help with instrumental activities of daily living
(IADLs), including household chores like meal preparation and cleaning; life management such as
shopping, money management, and medication management; and transportation. The services
include hands-on and stand-by or supervisory human assistance; assistive devices such as canes and
walkers; and technology such as computerized medication reminders and emergency alert systems
that warn family members and others when an elder with a disability fails to respond. They also
include home modifications like building ramps and the installation of grab bars and door handles
that are easy to use.
R E L A T I O N S H I P B E T W E E N A C U T E A N D L O N G - T E R M C A R E
Long-term care needs emerge from chronic medical conditions that occur at birth or during
developmental stages, such as arthritis, diabetes, dementia, cerebral palsy, and prolonged mental
illness, or that result from accidents that cause conditions like traumatic brain injury and paraplegia.
Long-term care is not merely an extension of acute care. Because it continues at length and mainly
involves low-tech supportive services, it becomes an integral part of the life of the elder with a
disability (Kane et al., 1998).
People who need long-term care also require primary care and acute care when they are sick, but
these temporary, episodic services focus on curing an illness or restoring an individual to a previous
state of better health. Feder and Lambrew (1996) found that among the five million Medicare
beneficiaries with substantial long-term care needs, as measured by limitations in three or more ADLs,
average Medicare expenditures in 1993 were $8,960, compared with $2,835 for beneficiaries without
substantial long-term care needs. Fifty-one percent of the expenditures were for inpatient hospital
care, 28 percent for physician and outpatient visits, and 21 percent for skilled nursing facility and
home health care. The predominant strategy in long-term care is to integrate treatment and living for
D E F I N I N G L O N G - T E R M H E A LT H C A R E

elders with functional disabilities—not to undervalue health care for those getting long-term care, but
to incorporate health care into the context of the functions of daily life (Kane et al., 1998).
One reason for the blurred boundaries between long-term care and various stages of medical
care—acute, post-acute, and subacute—is the confounding of settings with services. (Post-acute care is
care directly after a hospital intervention; subacute refers to a vague treatment modality that may
bypass hospitals altogether or that focuses on longer-term rehabilitation, ventilation care, and the
like.) More and more acute care and high-tech rehabilitation formerly provided in hospitals is being
provided in nonhospital settings traditionally used for long-term care, such as skilled nursing
facilities, and private homes. It is difficult to know where medically oriented care stops and long-term
care begins. Should medical interventions such as intravenous drug therapy, ventilator assistance, and
wound care that are delivered in a nursing facility, residential care facility, or the home be considered
acute care, subacute care, or long-term care? Should medication management for elders with chronic
disabilities, including the administration of injections and the monitoring of adverse drug
interactions, be considered long-term care or ongoing medical care? Hospitals still provide long-term
care for some patients; as Kane et al. (1998) have noted, perhaps they should do so more often.
Fragmented funding adds to the confusion. Medicaid is the primary public payer for long-term
care, particularly in nursing homes, and Medicare is the major payer for acute care. Because services
follow funding, a given category has tended to be defined by the reimbursement mechanism rather
than by the goals of the care, the skills it requires, or the characteristics of the recipients.
T H E R O L E O F R E S I D E N C E I N L O N G - T E R M C A R E
In long-term care, unlike acute care, housing conditions are as essential as services. The place where
people live, including the physical and social environment, can greatly enhance or impede a person’s
functional disability, independence, and quality of life. Nursing home policies explicitly recognize
the residential needs of the long-term care population by including room and board, as well as care,
in their costs. The importance of housing is less clear in home- and community-based policies.
Housing conditions are often overlooked when care is delivered in an elder’s own residence,
although there is increasing recognition that home modifications may help keep individuals in the
community and reduce their need for formal services. But while housing is crucial to the
development of residential care, there is tremendous variation in the extent to which services are
integrated with housing needs.
In defining long-term care, then, several points are worth emphasizing:
• Long-term care is primarily concerned with maintaining or improving the ability of elderly
people with disabilities to function as independently as possible for as long as possible.
• Long-term care also encompasses social and environmental needs and is therefore broader than
the medical model that dominates acute care.
Milbank Memorial Fund3

Milbank Memorial Fund4
• Long-term care is primarily low-tech, although it has become more complicated as elderly persons
with complex medical needs are discharged to, or remain in, traditional long-term care settings,
including their own homes.
• Services and housing are both essential to the development of long-term care policy and systems.
C A R E S E T T I N G S
Long-term care is provided in a range of settings, depending on the recipient’s needs and preferences,
the availability of informal support, and the source of reimbursement. Much gerontological literature
refers to a continuum of care, identifying the nursing home as the most restrictive and one’s own
home as the least restrictive setting in the spectrum. The literature also stresses the appropriateness of
a setting, assuming that a mechanism exists for judiciously matching the individual and setting. The
“continuum” and “appropriateness” paradigms have been challenged (Kane et al., 1998; Stone, 1999)
by those who argue that services can be delivered in any one of many settings, depending on a
constellation of individual, familial, and policy factors. One’s own home can be as restrictive as a
nursing home, if an individual is homebound and is not getting the services that would facilitate some
independence. In theory, a home-like atmosphere can be created in any environment, including the
nursing home. Furthermore, “appropriateness” is subjective and should not be invoked to prevent
individuals from making their own choices, which are often paramount to them.
Among the care silos that have been created primarily by reimbursement policy, the nursing
home—or nursing facility, as it is referred to by Medicare and Medicaid—is the major institutional
setting for long-term care. In 1996, there were 16,706 certified nursing facilities in the United States
with an estimated 1.8 million beds (AARP, 1998a). A small number of people are receiving care in
other institutions, such as long-term care hospitals and psychiatric facilities.
“Home and community-based care” is a catch-all phrase that refers to a wide variety of
noninstitutional long-term care settings, ranging from various types of congregate living arrangements
to recipients’ own homes. One category of home and community-based care—residential care—includes
assisted living facilities, board and care, and adult foster homes. The boundaries between institutional
and noninstitutional environments are far from clear. Many assisted living and board and care
facilities are large buildings that strongly resemble hotels or nursing homes in physical appearance
and philosophy. Other residential care options are small, homey settings that offer privacy and choice
to residents. Some make services available to disabled residents either directly or through contracts;
many, however, are long on room and board and short on care.
In contrast to nursing homes, which are licensed and regulated by the federal government
because they receive significant Medicare and Medicaid reimbursement, residential care is handled by
state and local jurisdictions. Consequently, there is no consensus on the definition of “residential
care”; the nomenclature, as well as the nature and scope of services, varies tremendously (Mollica,
1998). One recent national study of assisted living reported an estimated 11,472 facilities with
Milbank Memorial Fund5
approximately 650,500 beds and 558,400 residents at the beginning of 1998 (Hawes et al., 1999). The
definition of “assisted living” in this study includes facilities that have 11 or more beds; serve a
primarily elderly population; provide 24-hour oversight, housekeeping, and at least two meals a day;
and supply personal assistance with at least two of the following activities: taking medications,
bathing, and dressing.
Residential care tends to be regarded as an option for individuals who may not require nursing
home assistance but who can no longer remain in their own homes. It is seen as a substitute for living
at home and as the next step in a downward trajectory toward nursing home placement. However,
states such as Oregon and Washington have been using residential care as an alternative to nursing
homes; substantial numbers of elders with severe disabilities have been relocated or placed in assisted
living or adult foster homes.
Several forms of adult day care have been established to meet the needs of the elderly long-term
care population and their families. The most common form is adult day care, in which elders with
moderate disabilities receive supervision and personal care, as well as social integration and
companionship in a group setting, usually during the work week from nine to five. A limited number
of programs also operate on weekends, and a few are experimenting with evening and night hours.
While adult day care serves both physically and cognitively impaired elders, a disproportionate
number of people with Alzheimer’s disease and other dementias use this option. It has been an
important source of respite for family caregivers who would otherwise struggle to maintain their
elderly relatives at home. A less common, and more intensive, form of adult day care is the day health
model. It combines primary care with long-term care and is used by elders with significant disabilities
who often have multiple co-morbidities such as diabetes, heart disease, and stroke. The Program of
All-Inclusive Care for the Elderly (PACE), which will be described later in this paper, builds its
program around the adult day health model.
Most elderly people with long-term care needs live at home, either in their own homes, with or
without a spouse, or in the home of a close relative such as a daughter. In this setting, care may be
defined as “home health care,” which includes some skilled nursing and supervised custodial care,
and “home care,” which includes personal services like bathing, dressing, and toileting as well as
housework such as meal preparation and laundry.
W H O N E E D S A N D U S E S L O N G - T E R M C A R E ?
The long-term care population is diverse in terms of age and level of disability. Of the estimated 12.8
million Americans reporting long-term care needs in 1995, as measured by the need for assistance with
ADLs or IADLs, 57 percent were over the age of 65. Another 40 percent were adults below that age, and
3 percent were children (National Academy on Aging, 1997). Among the 229 million Americans under
the age of 65, only 0.1 percent were institutional residents and 2 percent were living in the community
with limitations in either ADLs or IADLs (Figure 1; Komisar et al., 1996). In contrast, among the 34

Milbank Memorial Fund6
million elderly in 1995, 5 percent were nursing home residents and 12 percent were living in the
community with ADL or IADL limitations. Functional limitations increase substantially with age,
particularly for the oldest old. Among those aged 85 and over, 21 percent were in nursing homes in 1995
and another 49 percent were community residents with long-term care needs (Figure 2; Alecxih, 1997a).
The prevalence of dementia and other forms of cognitive impairment is difficult to assess. Many
cognitively impaired individuals manifest limitations in ADLs or IADLs, but these limitations do not
represent the entire cognitively disabled population. A 1996 consensus panel organized by the Agency
for Health Care Policy and Research concluded that the rate of moderate to severe dementia is about
2 percent in people aged 65–69, 4 percent in people aged 70–74, 8 percent in people aged 75–79, and
16 percent in people over 85. Researchers analyzing data from the 1994 National Long-Term Care
Survey (NLTCS) have reported that almost one million elders are severely cognitively impaired by
Alzheimer’s disease or another form of dementia (ASPE and AoA, 1998). A smaller study of older
people in East Boston, using less restrictive criteria, concluded that 10 percent of the population over
65 and 47 percent of the population over 85 had some degree of dementia (Costa et al., 1996).
The proportion of people aged 65 and older who stay overnight in nursing homes fell by more
than 8 percent from 1985 to 1995 (Bishop, 1999). The decline was most striking for those over age 85,
a population comprising more than half the total elderly nursing home population. This decline may
result from (1) a decline in overall disability rates among the elderly; (2) the increase in Medicare
Figure 1. Prevalence of Functional Limitations among Elderly and Nonelderly Populations: 1995
U N D E R A G E 6 5 ( N = 2 2 9 M I L L I O N ) A G E 6 5 + ( N = 3 4 M I L L I O N )
Community residents with 2% Community residents with 12%
functional limitations functional limitations
Nursing home residents 0.1% Nursing home residents 5%
Other community residents 98% Other community residents 82%
Source: Georgetown University Institute for Health Care Research and Policy. Cited by Komisar et al., 1996.

Milbank Memorial Fund7
home health use from 5 to 9 percent between 1985 and 1995; and (3) the increased use of assisted
living as a substitute for nursing home placement.
Preliminary analyses comparing samples of elderly nursing home residents from the 1987
National Medical Expenditures Survey and the 1996 Medical Expenditure Panel Study (Spillman et
al., 1997) suggest important changes in the characteristics of this population over that period. The
population in 1996 is older: the proportion of those 85 and older increased from 43.5 percent in 1987
to 49.3 percent in 1996. Nursing home residents are also more likely than before to be married—13.3
percent in 1987 and 16.7 percent in 1996. The institutionalized elderly tended to be more severely
disabled: 33.3 percent had five ADL limitations in the earlier study and more than 50 percent in the
later one. In addition, the population appears to be more cognitively impaired: a much lower
proportion of the 1996 cohort recognized staff, and a much higher proportion had difficulty making
decisions compared to the 1987 nursing home residents.
Approximately 81 percent of the elderly with ADL or IADL impairments live in the community.
They tend to be much less disabled than those in nursing homes (Alecxih, 1997a). Sixty percent are
Figure 2. Prevalence of Long-Term Care Need among the Elderly by Age: 1995
P E R C E N T
In Institution
In Community
65–74 75–84 85+
Sources: Lewin-VHI based on data from the 1987 National Medical Expenditure Survey, Institutional Sample;
the 1989 National Long-Term Care Survey; and the 1989 Current Population Survey. Cited by Alecxih, 1997a.
0
10
20
30
40
50
60
70
80
10.9 21.8 48.8
1.2
5.4
21.0

Milbank Memorial Fund8
disabled only in IADLs. Approximately 17 percent are considered severely disabled, with limitations in
three or more ADLs. According to recent unpublished data from the 1994 NLTCS, 37 percent of ADL-
impaired elderly people living in the community report that they need help but do not receive it or
receive less help than necessary (Jackson and Doty, 1997). The vast majority of this group are people
with unmet IADL needs, particularly in the areas of meal preparation, outdoor mobility, and money
management. Only 1.4 percent report unmet ADL needs; another 13.1 percent report undermet ADL
needs. Additional comparative analyses of previous waves of the NLTCS indicate that the proportion
of elderly people who report that they do not receive the ADL help they need has declined, from 5.2
percent in 1984 to 2.6 percent in 1989 and to 1.4 percent in 1994.
These findings are intriguing because they suggest that most elderly people with long-term care
needs believe their needs are being met. It is important to remember, however, that most of the care is
being provided “free” by family and friends; as the availability of such caregivers declines in the
future, unmet needs may grow. This research also identifies a potential way to direct public dollars
toward home- and community-based care, particularly when state and local funds are limited. Most
state programs now use some type of functional disability trigger to determine eligibility for benefits.
If assessment tools could be refined to measure unmet and undermet needs, then funds could be
allocated on a priority basis.
While a minority of all elderly people need long-term care at any given time, the need for services
rises after age 65. The proportion of elders likely to use nursing homes ranges from 39 percent to
49 percent, depending on the database; estimates of those living in a nursing home for at least two
years after age 65 range from 16 percent to 25 percent (Alecxih, 1997a; Murtaugh et al., 1990). One
Table 1. Distribution of Lifetime Long-Term Care Use
N U R S I N G H O M E C A R E P E R C E N T O F E L D E R LY H O M E C A R E P E R C E N T O F E L D E R LY
T U R N I N G A G E 6 5 T U R N I N G A G E 6 5
Any use 48.6 Any use 71.8
Under 1 month 9.9 30 visits or fewer 14.7
1–3 months 6.5 31–60 visits 6.6
3–6 months 4.8 61–90 visits 10.6
6 months–1 year 5.7 91–182 visits 12.1
1–2 years 6.0 183–365 visits 11.2
2–3 years 3.6 366–730 visits 7.8
3–5 years 5.3 731 visits or more 8.8
5 years and over 6.8
Source: Lewin-VHI. Based on the Brookings-ICF Long-Term Care Financing Model. Cited by Alecxih, 1997a.

Milbank Memorial Fund9
recent simulation model found that elderly persons are more likely to use home care than nursing
home care over their remaining lifetime (72 percent versus 49 percent) (Table 1; Alecxih, 1997a). The
average lifetime nursing home use per elderly person is one year, and the average home care use is a
little over 200 visits. Many users receive care for only short periods, while a small proportion uses
substantial amounts of long-term services.
Here again are the key points regarding people who use long-term care:
• At any given time, slightly more than 10 percent of people over age 65 live in the community and
need some degree of long-term care. Another 5 percent are in nursing homes.
• After age 65, almost half of all Americans will spend some time in a nursing home. Almost three
quarters will need some home care.
• The proportion of elderly people spending one or more nights in a nursing home dropped over
the past decade, but those in nursing homes are more cognitively impaired than before.
• Among elderly people living in the community, more than one in three report unmet or
undermet needs, although most of these problems involve the less intense instrumental activities
of daily living (IADLs) rather than activities of daily living (ADLs).
• The demand for long-term care increases dramatically with age, underscoring the need to pay
special attention to people aged 85 and over.
W H O P R O V I D E S C A R E ?
Much long-term care, in contrast to more medically oriented services, is unpaid assistance provided by
family and friends, as already noted. This has been true in the past, and despite the persistent myth of
family abandonment fostered by many policymakers, it remains true today. Paid providers include
both professional and paraprofessional workers.
Informal Care
The major long-term care provider is the family and, to a lesser extent, other unpaid “informal”
caregivers. According to the 1994 National Long-Term Care Survey, more than seven million Americans—
mostly family members—provide 120 million hours of unpaid care to elders with functional disabilities
living in the community. If these caregivers were paid, the cost would run from $45 billion to $94 billion a
year (ASPE and AoA, 1998). The overwhelming majority of noninstitutionalized elders with disabilities—
about 95 percent—receive at least some assistance from relatives, friends, and neighbors. Almost 67
percent rely solely on unpaid help, primarily from wives or daughters. As disability increases, elders
receive more and more informal care. Eighty-six percent of elders at greatest risk for nursing home
placement—those with three or more ADL limitations—live with others and receive about 60 hours of
informal care per week, supplemented by a little over 14 hours of paid assistance.

Milbank Memorial Fund10
Although statistics are unavailable, we know that many additional relatives assist disabled family
members living in nursing homes. Still others engage in long-distance caregiving, arranging for the
care of a parent or other relative who lives far away. The importance of an informal support system is
underscored by the fact that 50 percent of elderly people with long-term care needs who lack a family
network live in nursing homes, compared to only 7 percent of those who do have family caregivers
(National Academy on Aging, 1997).
Experts on long-term care typically refer to the person who regularly provides the most assistance
as the “primary” informal caregiver. Most elders with disabilities have a primary caregiver who
provides the bulk of the care and obtains and coordinates additional help from other, “secondary”
caregivers, unpaid and paid. Data from the 1989 Informal Caregivers Survey—the most recent
national survey of informal caregivers for the elderly long-term care population—indicate that almost
75 percent of primary caregivers are women (ASPE and AoA, 1998). Thirty-six percent of informal
caregivers are adult children. Forty percent are spouses; the prevalence of spousal caregiving increases
with the level of the recipient’s disability. Other relatives and friends are most often secondary
helpers, assuming primary responsibility only when spouses or adult children are not available.
The average age of the informal caregiver is 60. The great majority of primary informal caregivers
do not hold paying jobs, either because they have retired or because they belonged to a generation of
women who “stayed at home,” out of the paid workforce. Among the 31 percent who are in the labor
force, 66.6 percent work full time. Employed caregivers provide fewer weekly hours of assistance than
nonemployed caregivers, but they still invest, on average, 18 hours per week. They are able to assume
the primary caregiver’s role by relying on additional unpaid help from other family members and
friends and by purchasing care, usually to supplement secondary informal assistance. Even with that
supplemental help, employed primary caregivers of elders with severe disabilities—those with three or
more ADL limitations—provide between 32 and 39 hours of care per week.
Two-thirds of caregivers with paying jobs report conflicts between jobs and caregiving that caused
them to rearrange their work schedules, to work fewer paid hours than they otherwise would have, or
to take unpaid leaves of absence from work. Nearly half of female caregivers with part-time paid jobs
report working less because of elder care responsibilities. Sixteen percent of caregivers with full-time
jobs say that caregiving has caused them to work fewer paid hours than they otherwise would have.
Formal Care Providers
While the physician is the primary health professional in acute care, nurses provide the majority of
professional long-term care to the elderly. Physicians are directly involved in long-term care as medical
directors of nursing homes or home health agencies; they also are required to sign off on home health
care plans. According to the 1996 National Sample Survey of Registered Nurses, nursing homes or
other extended care facilities employed 170,856 registered nurses (RNs) or 8.1 percent of all RNs
(BHPr, 1998). More than 87 percent of RNs working full time in nursing homes serve as head or

Milbank Memorial Fund11
assistant head nurse, director of nursing, or assistant director of nursing (IOM, 1996). The Bureau of
Labor Statistics (BLS) reports that 112,217 RNs were employed by home health agencies in 1994
(NAHC, 1997). In addition, 182,110 licensed practical nurses (LPNs) worked in nursing homes in 1994,
and another 39,774 LPNs worked in home health care. Although LPNs are not allowed to assess or
formally plan for care, they often serve as charge nurses in nursing facilities (IOM, 1996). Their major
responsibilities include supervising the care by nursing assistants, passing medications and doing
treatments, and monitoring residents’ conditions.
Rehabilitation in long-term care is most often supplied by therapists. In 1996 there were
approximately 115,000 employed physical therapists (PTs), three-quarters of whom were working full
time (BLS, 1999d). According to statistics from the American Physical Therapy Association (1999),
almost 11 percent of PTs were working in skilled nursing or extended care facilities, 4 percent in
outpatient rehabilitation centers, and 10 percent in home care. Only 314 physical therapists were
certified in geriatrics in 1998 (American Physical Therapy Association, 1998). Another 73,000
individuals were working as occupational therapists or assistants in 1996 (BLS, 1999b; BLS, 1999c),
with an estimated 29 to 31 percent of them employed in freestanding or hospital-based skilled nursing
facilities or related long-term care settings (Shank, 1999).
Most paid providers of long-term care are paraprofessional workers—certified nursing assistants
in the nursing home or home care workers who deliver the largest share of the primarily low-tech
personal care and the assistance with managing daily life. After unpaid caregivers, these workers are
the key to helping elders with disabilities maintain their independence and quality of life. According
to the Bureau of Labor Statistics, an estimated 643,080 nursing assistants were employed in nursing
homes in 1994 (IOM, 1996). Estimates of home care aides are more difficult to obtain because many
aides are hired privately and may not be included in official statistics; many work part time and may
hold more than one job during the same period. The BLS (1999a) reported that approximately
697,000 homemaker–home health aides were employed by home health agencies, hospitals, and
others in 1996.
Not surprisingly, the majority of paraprofessionals are women. In 1997, an estimated 89.4 percent
of nursing aides were female (BLS, 1998a). A 1995 survey of home care workers reported that 96
percent of those employed by agencies, and 100 percent of the self-employed, were female (Leon and
Franco, 1998). Nursing home aides tend to be younger than home care aides, with mean ages of 36.6
years and 46.7 years, respectively (Crown et al., 1995). The main points regarding providers are these:
• Both formal and informal long-term care providers are overwhelmingly female.
• The vast majority of long-term care providers are unpaid family members—primarily wives and
adult daughters—and friends. Sometimes they must juggle competing demands and cut down
their paid employment to provide care.
• Unlike the acute care system, in which physicians direct most care, nurses and ancillary
therapists are the dominant professional providers of long-term care.

Milbank Memorial Fund12
• The most important formal long-term care providers are paraprofessionals—the certified nursing
assistants, home health aides, and home care or personal care workers. They have the most
direct, continuing contact with the elderly person with disabilities.

Milbank Memorial Fund13
Financing is the first element of the triple knot that also includes delivery and workforce preparation.
Long-term care costs make up a small but growing proportion of personal health care expenditures,
having increased from less than 4 percent in 1960 to more than 11 percent in 1993 (Alecxih, 1997b).
The financing of long-term care services is a patchwork of funds from the federal, state, and local
levels and private dollars, primarily paid from the consumer’s own pocket.
In 1995, approximately $106.5 billion was spent on long-term care. Public resources accounted for
57.4 percent of it. The largest part of public funds, 37.8 percent, came from Medicaid (including 21.1
percent federal and 16.7 percent state dollars). Medicare paid 17.8 percent. Other federal and state
funds supplied lesser amounts (e.g., Veterans Affairs, Older Americans Act, Social Services Block Grant,
state general assistance). Private insurance accounted for only 5.5 percent of the expenditures, with
one out of three of those dollars attributable to out-of-pocket expenses (Figure 3; National Academy on
Aging, 1997). These estimates do not place a dollar value on the vast amount of unpaid care, including
the value of wages forgone by caregivers (Stone and Short, 1990). One recent study reported that $196
billion a year is contributed to the U.S. health and long-term care systems by family and friends who
provide care at home to people of all ages with chronic disabilities (Arno et al., 1999).
M E D I C A I D
Medicaid, the federal/state health insurance program for the poor, is the major public program covering
long-term care for the elderly and for disabled people of all ages. Despite the public’s tremendous
interest in, and demand for, care in the home, Medicaid continues to exhibit a strong bias toward
institutional services. Of the almost $50 billion that Medicaid spent on long-term care services in 1995,
$40 billion supported nursing homes and institutions for the mentally retarded (intermediate care
L O N G - T E R M C A R E F I N A N C I N G
Figure 3. Expenditures on Nursing Home and Home Health Care by Source of Funds: 1995
T O TA L = $ 1 0 6 . 5 B I L L I O N
1. Out-of-pocket 32.5%
2. Medicaid (federal) 21.1%
3. Medicare 17.8%
4. Medicaid (state) 16.7%
5. Private insurance 5.5%
6. Other private funds 4.6%
7. Other public 1.8%
Source: Health Care Financing Administration. Cited by National Academy on Aging, 1997.
1
765
4
32

Milbank Memorial Fund14
facilities for the mentally retarded, or ICF-MRs); only $9.9 billion paid for home and community-based
care. Even so, the home and community-based care sector has grown tremendously. While total Medicaid
spending for long-term care increased by just 8.6 percent between 1993 and 1994, Medicaid waivers for
noninstitutional spending on home and community-based care and personal care grew by 26 percent.
In contrast to the large federal role in financing acute care for the elderly, the states are
major financiers of long-term care. There are wide variations among states, and within individual
states, in funding for institutional, home, and community-based care. Montana had the highest
Medicaid nursing home expenditures per capita in 1994, Arizona the lowest. Arizona also had the
lowest per capita expenditures for home and community-based care, New York the highest (Graves and
Bectel, 1996). In fact, 35 percent of all Medicaid spending on home care in the United States in 1995
occurred in New York (Kenney et al., 1998).
While the bias toward nursing homes prevails in most states, there have been significant
efforts to expand the options of home and community-based care. Besides overall increases in home
care spending, several states, notably Oregon and Washington, have explicitly recognized nursing
homes as the setting of last resort, and have intentionally reduced the number of nursing home beds;
in Oregon the ratio declined from 47 beds per 1000 elderly in 1982 to 35 per 1000 elderly in 1995.
Having had an aggressive home and community-based care policy since the early 1980s, Oregon has
successfully placed many elders with serious disabilities and younger people with disabilities in
alternative assisted living facilities and adult foster homes. Oregon also supports a strong case
management program that allows many beneficiaries with disabilities to remain in their own homes.
In addition to the federal Medicaid dollars that states match, and the relatively modest sums
available for personal care through the Older Americans Act and the Social Services Block Grant,
many states augment or create their own separate programs with state funds. Pennsylvania and New
Jersey, for example, have relatively large home and community-based care programs, which are
supported mainly by lottery revenues. A number of local communities have also been successful in
raising funds for long-term care services. In the Cincinnati area, Hamilton County, Ohio, supports
elderly people with disabilities through a county levy enacted under the leadership of the local area
agency on aging (AAA) (Council on Aging of the Cincinnati Area, 1997). In 1997, the AAA’s Elderly
Services Program spent $17 million for homemaker services, personal care, home-delivered meals,
case management, adult day care, and transportation for frail elderly people living in 88
neighborhoods throughout Hamilton County. This AAA convinced elderly and nonelderly citizens
that the levy for long-term care services was necessary, given continuing cuts in federal funds, and that
the dollars would benefit the entire community.
M E D I C A R E
Medicare has not been considered a major payer for long-term care. Many observers have argued that
elderly people are unprepared for long-term care expenses because they believe that Medicare will

Milbank Memorial Fund15
cover them. In reality, Medicare primarily covers acute care costs. Its skilled nursing facility and home
health care benefits are intended as short-term coverage for post-acute care following a beneficiary’s
hospitalization. However, the belief that Medicare covers long-term care has more validity now than in
the past. Through a series of regulatory and administrative changes since 1989, Medicare has come to
support more long-term, nonskilled personal care (Komisar and Feder, 1998).
Medicare spending for home health services increased nearly tenfold between 1987 and 1995
(Kenney et al., 1998). A lawsuit and administrative changes in 1989 led to lower denial rates and more
liberal interpretations of definitions (like “homebound”) and scope of services (like management and
evaluation) by fiscal intermediaries—regional contractors for the Health Care Financing
Administration (HCFA, the agency that oversees Medicare and the federal part of Medicaid) who
review and approve or deny all Medicare claims submitted by providers. Most of the growth in
spending is attributed to an increase in the number of visits, particularly by home health aides—the
low-tech, personal services usually regarded as long-term care. Komisar and Feder (1998) estimated
that visits per beneficiary represented 49 percent of the growth in Medicare’s home health spending
between 1990 and 1996 (Figure 4). Furthermore, the 10 percent of Medicare home health users who
received more than 200 or more visits in 1994 were responsible for 43 percent of that year’s spending
on home health care (Figure 5). The length of home health care service has increased substantially,
with a small but growing proportion of users receiving continuous care for two years or more. Recent
Figure 4. Sources of Growth in Medicare Spending for Home Health Care: 1990 –1996
Enrollment
Persons served per enrollee
Visits per person served
Average payment per visit
Total Growth
Source: Georgetown University Institute for Health Care Research and Policy. Cited by Komisar and Feder, 1998.
0
20
40
60
80
100
10
30
50
70
90
8
49
36
7

Milbank Memorial Fund16
research has found that these beneficiaries tend to be more ADL-disabled, and to receive more
unskilled, home health aide visits, than beneficiaries receiving short-lived services after an acute care
episode (Komisar and Feder, 1998).
These findings support the contention by some policymakers that a small but expensive
subpopulation of Medicare home health users are receiving long-term care through this program. It is
difficult, however, to ascertain from the data how many of these individuals also need skilled nursing
that truly warrants home health coverage. It is possible that the need for home health care has shifted
since Medicare began in 1965 and that more elderly people with chronic disabilities coming out of
hospitals require more unskilled personal care than in the past.
There is also some evidence to suggest that providers participating in Medicaid home care
programs are being encouraged by states to help their clients become eligible for Medicare home health
benefits in order to reduce state costs for long-term care; states are responsible for part of the Medicaid
payment, while Medicare uses federal funds alone (Kenney et al., 1998). New York and Minnesota have
explicit Medicare “maximization” policies. Medicare maximization was documented by a series of case
studies in which state officials acknowledged that they were under budgetary pressure to help elderly
Figure 5. Distribution of Medicare Home Health Users and Expenditures by Number
of Visits: 1994
200+ visits
100–199 visits
30–99 visits
1–29 visits
Users Expenditures
Source: Komisar and Feder, 1998.
0
20
40
60
80
100
51
28
11
10
10
24
23
43

Milbank Memorial Fund17
Medicaid clients become eligible for Medicare home health benefits (Kenney et al., 1998). In many
southern states, there is strong evidence of maximization; in Mississippi and Tennessee, total Medicare
spending on home health care in 1995 was, respectively, 31 times and 36 times higher than Medicaid
spending on home and community-based care. This maximization, however, is more likely to be caused
by for-profit home health agencies than by the behavior of state officials.
Congress and the Clinton Administration responded to the huge growth in Medicare home
health spending by enacting provisions in the Balanced Budget Act of 1997 that significantly reduced
Medicare payments to home health agencies; implemented an interim payment system, with a new
payment system for reimbursement scheduled for 2000; and cracked down on fraud and abuse.
Public policymakers chose to address the “problem” by trying to retain the post-acute nature of the
home health benefit through significant restructuring of reimbursement. Like others, I believe that
the federal government may have gone too far in its quest to “rein in” home health agencies. Many
home health agencies, particularly the nonprofits, have closed due to insufficient funds to serve their
clients. The ultimate loser in this policy decision may be the elderly with disabilities who need long-
term as well as post-acute care.
Medicare spending has also increased for subacute care, a vague category between acute and
long-term care. There is no consensus about the definition of “subacute.” Proponents describe it as a
set of intensive, coordinated treatments and services provided to post-acute care patients in order to
minimize or even avoid expensive hospital stays; proponents see subacute care as an innovative
service delivery mechanism. Critics consider it a marketing strategy by sophisticated providers trying
to repackage traditional post-acute care services supplied by a skilled nursing facility, rehabilitation
facility, or home health service (Harvell, 1997). “Subacute” may refer to certain types of services, like
rehabilitation (Singleton, 1993); to patients, like those who no longer require acute services (Hyatt,
1993); or to levels of services between acute hospital care and skilled nursing care (Gonzales, 1994).
Medicare spending in nursing facilities increased substantially between 1990 and 1993, from
22 per 1000 beneficiaries to 31 per 1000 beneficiaries (Alecxih, 1997a). Gage et al. (1997) found that
increased Medicare expenditures for these services resulted in part from administrative and legislative
changes and in part from subacute care for medically complex patients in nonacute care settings. The
question remains whether subacute care is an innovative practice somewhere between acute hospital
care and skilled nursing care or, as Manard et al. (1995) concluded after a series of case studies,
strategic repackaging—“old wine in new bottles.”
P R I V A T E L O N G - T E R M C A R E I N S U R A N C E
Private long-term care insurance pays only a small part of the bill. In 1995, such insurance covered
less than 6 percent of nursing home and home care costs (National Academy on Aging, 1997). The
market has grown over the past decade; the total number of policies sold increased from 800,000 in
1987 to almost five million in 1996. A 1997 survey by the Health Insurance Association of America

Milbank Memorial Fund18
(HIAA), a trade organization, indicated that the number of policies purchased increased by more than
600,000 in 1996 alone, the largest number of long-term care policies ever sold in one year (Coronel,
1998). The estimated total of five million, however, is the cumulative number of policies ever sold. The
number in force is a fraction of those sold and could be even smaller, given the high lapse rate seen in
this industry.
The HIAA survey reported some fluctuation in the number of companies marketing long-
term care products, with 120 insurers selling long-term care policies by the end of 1996 (Coronel,
1998). By the end of that year, approximately 80 percent of the five million long-term care policies
that had been sold were individual policies. About 33.3 percent of the 1996 insurers sold policies
either through employer groups or as part of a life insurance package, up from 14 percent in 1988.
These two types of insurance products represented 20 percent of all long-term care policies sold as of
1996, up from less than 3 percent in 1988.
Long-term care insurance markets vary widely across the country. The 1997 HIAA survey
reported that by the end of 1996, half of all individual policies had been sold in only nine states:
California, Florida, Illinois, Iowa, Missouri, Ohio, Pennsylvania, Texas, and Washington. Market
penetration rates, as measured by the number of policies sold to people aged 65 or over in each state,
were highest in Iowa, Montana, Nebraska, North Dakota, and Washington.
Twelve companies sold about 80 percent of all individual and group association policies in
1996. All leading insurers offered plans that cover nursing homes, home health care, adult day care,
respite care, and alternative care services. Ten of the 12 top sellers also offered a separate assisted
living facility benefit. These companies offered plans with an annual 5 percent compounded
inflation rate and with a nonforfeiture benefit; that is, plans that pay some benefits even if the policy
lapsed because of an individual’s failure to pay premiums. The average annual premium for basic
long-term care insurance, covering four years of nursing home or home health care beginning after
the first 20 days of care, purchased at age 65 was $980; the premium rose to $1,321 with
nonforfeiture protection, to $1,829 with 5 percent compounded inflation protection, and to $2,432
with both additional protections.
Controversy has raged around private long-term care insurance for the last decade. The
private sector argues that public programs will never meet the demand. Consumers and regulators
express concern about high premiums and fraudulent marketing practices. It is somewhat academic
to argue about the proportion of income or assets people will, or should, spend for long-term care
insurance (Friedland, 1990). One estimate suggests that a single person ought to have at least $40,000
in liquid assets to consider purchasing insurance (Polniaszek, 1997). A recent Consumer Reports article
suggests that only about 10 to 20 percent of the elderly can afford long-term care insurance and notes
that premiums for two “adequate” policies bought at age 65 cost $3,500 per year, or 13 percent of the
median annual income of elderly married couples (“How Will You Pay for Your Old Age?” 1997).
Whether this is a high or low proportion of a couple’s annual expenditures depends on how much
money the couple has and what else they must buy.
Milbank Memorial Fund19
Many observers have suggested that private long-term care insurance might play a major role
in financing these services only if an employer-based group market develops, in which policies are sold
to younger people. Premiums for LTC insurance sold through employers are lower than those sold as
individual products because (1) employers can market to younger people; (2) costs for administration
and agents’ commissions are lower; and (3) employers might use bargaining power to reduce insurers’
profit percentages. Employer-based products also offer less stringent screening criteria or eliminate
screening entirely. Furthermore, a group market offers increased ease and comfort of purchase due to
fewer coverage decisions required.
According to the 1997 HIAA survey, 1,532 employers were offering long-term care insurance
to their employees and retirees by the end of 1996, up from seven in 1988 and 1,260 in 1995. More
than 500 employer-sponsored plans were introduced in 1995 and 1996.
Preliminary findings from a recent study of 39 employers representing 900,000 employees
indicate that most employers required less stringent medical underwriting criteria or guaranteed
coverage, at least to current full-time employees (Lutzky et al., 1999). Most also offered coverage to at
least one group in addition to current full-time workers, like parents or in-laws, spouses, and retired
employees. Nearly all employers used a single long-term care insurer. Most offered no more than three
options for benefit amounts. All employers surveyed offered inflation protection. Just over half
offered some type of nonforfeiture benefit. All but two of the employers surveyed required the
employee to pay the entire premium.
One interesting experiment in combining public and private policies is the Partnership for
Long-Term Care, a demonstration program sponsored by the Robert Wood Johnson Foundation to
promote the development of private funding sources for long-term care (Cohen, 1997; McCall, 1997).
The Partnership, implemented in four states—California, Connecticut, Indiana, and New York—uses
private insurance to cover the initial costs of long-term care (Meiners and McKay, 1989); Medicaid
pays for services after private insurance coverage is exhausted. Two models have been developed: a
Dollar-for-Dollar Disregard model in California, Connecticut, and Indiana and a Total Asset Disregard
model in New York. In the first model, consumers purchase private insurance coverage equal to the
amount of assets they wish to protect. When the private benefits are exhausted, those assets are
disregarded in determining eligibility for Medicaid. The New York model requires that consumers
purchase three years of private nursing home or six years of home care coverage, and all of the
insured’s assets are protected once the private benefits have been exhausted.
One major limitation of this demonstration program—and of the development of the private
long-term insurance market as a whole—is the time lag between the purchase of a policy and the filing
of a claim. Consequently, the Partnership demonstration has yet to obtain empirical evidence of its
successes or failures. But interesting information on the purchasers of these products is already
available (McCall et al., 1997). Partnership purchasers were older, had smaller families, and were
much more highly educated than the comparison sample of individuals aged 55 to 75 who were not
covered by Medicaid. They were also more likely to be female, white, in reportedly good or excellent

Milbank Memorial Fund20
health, and in a relatively high income bracket. The Partnership sample was also more likely than the
comparison group to disagree with the statement “Medicare currently provides sufficient coverage for
long-term care” and was much less likely to believe that government will pay for long-term care if they
need it in the future. This study identified the Partnership purchasers as a self-reliant group, whose
decisions to purchase insurance were based upon the desire to maintain independence and preserve
income and choice, rather than upon a desire to leave an inheritance.
This discussion of long-term care financing in the United States underscores the
complicated, confusing nature of our fragmented system:
• Long-term care financing is a patchwork of public and private dollars. More than one-third (37
percent) of the $106.5 billion spent on long-term care is paid by the consumer.
• The value of informal caregiving, worth $45 to $95 billion annually, is not included in the
estimates of long-term care costs.
• Private insurance pays a small fraction of long-term costs. Without significant growth in a group
market, it is unlikely ever to cover more than a small population.
• Medicaid is the primary public payer for long-term care. Despite expanded coverage of home and
community-based services, it remains biased in favor of institutions.
• Due to the blurring of the lines between acute care and long-term care, such as home health care
and subacute care, and efforts by states to substitute federal dollars for their own, Medicare now
pays more of the costs than before. The extent to which this trend will continue is uncertain,
given the changes in reimbursement for Medicare home health and skilled nursing facility care
under the 1997 Balanced Budget Act and a federal crackdown on fraud and abuse.

Milbank Memorial Fund21
Policymakers, practitioners, and consumers recognize the dual, and sometimes conflicting, needs to
finance long-term care while maintaining or improving the quality of care. These two objectives have
contributed to several trends in the delivery of care that have important implications for the new
century, when aging baby boomers will probably increase the demand for an array of services.
I N T E G R A T I O N O F A C U T E A N D L O N G - T E R M C A R E S E R V I C E S
A number of initiatives at the federal, state, and provider levels seek to manage acute and long-term
care by integrating services in various ways. There is no consensus on the definition of “integration.”
Some people insist funding as well as delivery must be integrated. Others argue that the goal of
integration is to coordinate all services in order to meet the broad needs of individuals and their
families (Stone and Katz, 1996).
Most observers agree that integrated services demand the following elements:
• broad and flexible benefits, including primary, acute, and long-term care;
• far-reaching delivery systems that go beyond traditional hospital, physician, and post-acute
services to community-based long-term care, care management, and specialty providers;
• adoption of mechanisms that actually integrate care, such as care management and care planning
protocols, interdisciplinary care teams, centralized records, and integrated information systems;
• overarching quality-control systems with a single point of accountability; and
• flexible funding with incentives to integrate funding streams and minimize cost shifting (Booth
et al., 1997).
Despite the rhetoric of integration, the dearth of experimentation and successful innovation is
not surprising. A primary barrier to integration of acute and long-term care is the fragmentation of
funding sources, particularly Medicare and Medicaid. While a single source of financing is not
essential, integration is impeded when providers lack financial incentives to develop a package of
services in various settings that meets the needs of the elderly person with disabilities.
Furthermore, Medicare and Medicaid have different eligibility requirements and coverage rules
that may impede the development of a rational plan of care for a disabled person who needs acute
and long-term care.
A second barrier is the fear of financial risk on the part of plans and providers involved in
integrating acute and long-term care. There is no valid and reliable risk-adjustment methodology, or
other technique, to ensure that payments will cover the costs of providing care to people with chronic
illness and disability. The 1997 Balanced Budget Act attempted to stimulate the Medicare managed
care market by introducing Medicare+Choice. But the availability and diversity of managed care
options have not expanded. On the contrary, HMOs have been cutting back on attractive benefits,
such as prescription drug coverage and plans with no premiums. There are numerous reports of plans
L O N G - T E R M C A R E D E L I V E RY

Milbank Memorial Fund22
leaving many Medicare markets. Given these trends, managed care plans are unlikely to offer long-
term care benefits to their enrollees.
Perhaps the most neglected barrier is the lack of knowledge, information, and training that
health and long-term care providers need in order to offer, coordinate, and manage an array of
services. There is no recognized authority in our current health care system for managing care across
time, place, and profession, and little acknowledgment that individuals with chronic disabilities shift
among physicians, hospitals, nursing homes, and their own homes. Acute and post-acute care
providers generally do not communicate with long-term care providers, even though an elderly
person may be getting services from both sectors. The absence of management information systems
and patient databases that span time and place is another obstacle to the integration of acute and
long-term care.
Federal Demonstrations
Most of the research on integration of acute and long-term care has been conducted through several
federal demonstration projects. The Social HMO (SHMO), which began in 1985, adds community care
services and short-term nursing home care to a Medicare-HMO acute care plan. Under this program, a
broad cross-section of people eligible for Medicare receive acute care and limited community-based
long-term care coverage. The Program of All-Inclusive Care for the Elderly (PACE) is a publicly funded
approach to long-term care for frail elders who are eligible for Medicaid and nursing home certifiable.
This program began as a demonstration project funded by HCFA and the Robert Wood Johnson
Foundation to replicate an integrated model of care in San Francisco’s Chinatown called On-Lok. The
distinguishing features of PACE are: (1) integrated funding and providers’ financial risk through
capitated Medicare and Medicaid reimbursements; (2) integrated service delivery with adult day care
as the focal point; (3) case management through interdisciplinary care teams, from the physician to
the van driver; and (4) a vigorous attempt to keep individuals in community care and out of nursing
homes (Branch et al., 1995; Cohen, 1997).
The findings from these demonstrations have been equivocal at best, despite their long history
(Newcomer et al., 1995a; Wiener and Skaggs, 1995). Researchers have pointed out the failure of the
first generation of SHMOs to integrate services by acute and long-term care providers (Manton et al.,
1994). Gruenberg et al. (1993), who compared PACE enrollee costs with a national sample of fee-for-
service Medicare beneficiaries, found that PACE provides Medicare with a 9 percent to 34 percent
saving, depending on the analytical assumptions and sites selected. Shen (1993) has shown that
inpatient hospital use rates for frail elderly PACE enrollees are much lower than a comparable frail
population. But others have referred to PACE as a “boutique” model that has tended to serve an
average of 200 clients per site and that may have engaged in client “skimming” (Branch et al., 1995).
At the same time, these models are intuitively appealing and have helped shed light on better
ways to coordinate care across a broad range of services and systems. The Balanced Budget Act of

Milbank Memorial Fund23
1997 makes PACE a permanent Medicare provider; many state officials, often without much empirical
evidence, have expressed the desire to create systems like PACE in their own communities. HCFA is
currently supporting a second generation of SHMOs designed to improve on the first generation (Kane
et al., 1997). Rather than controlling for adverse selection by proportional enrollment at various
disability levels, the new models will establish reimbursement rates based on an individual’s
impairment and illness profile at the time of enrollment and annually thereafter. In addition, the new
generation will establish geriatric health programs for all enrollees, not just those with long-term care
needs. This demonstration will focus on coordinating acute care with a set of flexible, user-friendly,
efficient long-term care services.
The EverCare model of managed care for nursing home residents, originally a subsidiary of the
United Health Care Corporation, also shows promise for an integrated approach to serving the
institutionalized population. Through Medicare and Medicaid waivers, HCFA is currently testing this
model in nine sites. The program enrolls nursing home residents in a risk-based HMO, with the
nursing home costs covered by Medicaid or private insurance. Teams of geriatricians and nurse
practitioners provide more intensive primary care services than usual to nursing home residents and
coordinate this care with the long-term care services provided by nurses and nurses’ assistants.
Because EverCare pays for all medical services incurred by the nursing home resident, regardless of
the site where they are delivered, there is no incentive for the nursing home provider to shift costs to
Medicare by hospitalizing a resident. The intent is to maintain enrollees’ health and functioning, to
treat enrollees holistically, and to prevent medical crises that could lead to unnecessary
hospitalizations (Shield, 1996). While no HCFA evaluations have been completed yet, the program
appears to save money by shortening the length of hospital stays and paying the nursing homes for the
additional costs associated with caring for residents who would otherwise be hospitalized (Malone et
al., 1993). Nursing homes participate because they see the marketing advantage in the improved,
coordinated health care their residents receive (Kane et al., 1998).
State Initiatives
Motivated by escalating Medicaid budgets and growing numbers of aged, blind, and disabled
enrollees, many states have expressed interest in the integration of acute and long-term care. They are
particularly concerned about their “dual eligible” population—those eligible for Medicare and
Medicaid who account for about 17 percent of the states’ Medicaid enrollees and 30 to 35 percent of
program expenditures (Booth et al., 1997). As of 1995, 19 states had some type of integration initiative.
Several are experimenting with innovative financing and service delivery of acute and long-term care
for elderly people on Medicaid and younger people with disabilities. Arizona’s long-term care system is
part of a mandatory Medicaid managed care program begun in the late 1980s. Medicaid acute, long-
term, and behavioral health services are included in the Arizona package, but Medicare funding is not
explicitly integrated into the program. The program, however, implicitly achieves a degree of

Milbank Memorial Fund24
integration at the contractor level, because Medicare services are usually delivered through the
organization that provides the capitated long-term care services; Medicare reimburses the contractor
on a fee-for-service basis.
Minnesota was the first state to receive Medicare and Medicaid waivers to explicitly integrate
acute and long-term care for elders eligible for both programs in seven counties in the
Minneapolis–St. Paul area. The Minnesota Senior Health Options (MSHO) program offers a package
of acute and long-term services through a choice of three managed care plans, with voluntary
enrollment. Plans pay for the first 180 days of nursing home costs and then are reimbursed on a fee-
for-service basis with the plan continuing to provide all services. MSHO includes financial incentives
for plans to use home and community-based care in lieu of institutional services.
Texas Star+Plus has enrolled 60,000 aged, blind, and disabled beneficiaries, including 31,000
people eligible for Medicare and Medicaid, into one of three managed care plans in the Houston area.
Two have established Medicare risk mechanisms. Medicaid enrollment is mandatory; beneficiaries
may also choose to receive their Medicare coverage through one of the two Medicare risk plans
participating in this pilot project. As an incentive to enroll in the full acute and long-term care
package, they will receive an unlimited prescription drug benefit.
The Robert Wood Johnson Foundation and HCFA are sponsoring evaluations of these programs
and demonstrations in other states, but the results of these studies will not be available for some time.
Meanwhile, the rhetoric of integration will continue, as policymakers, providers, and researchers
struggle to implement the details.
Provider Initiatives
Despite the lack of financial incentives to integrate a continuum of care for elders with chronic
disabilities, a number of providers are attempting to create integrated service systems. The motivation
is not purely altruistic, although these providers do, for the most part, represent organizations and
health professionals that have traditionally cared for the elderly and that understand the need to
coordinate and manage care. There are also strong market incentives to develop such systems.
Hospitals trying to fill beds, and skilled nursing facilities looking to expand beyond traditional long-
term care, see integration as a way to develop business. Hospitals are integrating vertically—buying
nursing homes, rehabilitation centers, and home health agencies—in an effort to become an all-
purpose provider in the community. Skilled nursing facilities and, to a lesser extent, home health
agencies, are more likely to be integrating horizontally—building alliances with hospitals, physicians’
groups, assisted living developers, and other community-based providers.
The National Chronic Care Consortium (NCCC) is a strategic alliance of 31 nonprofit health
systems in the United States and Canada that share a vision of integrated care for individuals with
chronic health conditions and disabilities. The NCCC aims to enable member organizations to serve
as laboratories for establishing chronic care networks. Networks are defined as “a set of primary,

Milbank Memorial Fund25
acute and long-term care providers in a given community committed to working together to
collectively prevent, delay, and reduce the progression of disability associated with serious and
disabling chronic conditions.” To achieve this goal, the NCCC advocates the creation of integrated
administration, information, financing, and care management arrangements to help providers work
together in minimizing costs while maximizing the long-term health and well-being of the population
being served.
One of the major contributions by the NCCC is the development of the Self-Assessment for
Systems Integration (SASI) tool, a set of guidebooks and training materials supported by a grant from
the John A. Hartford Foundation. SASI identifies nine key objectives essential for chronic care
integration and addresses these objectives through sections on goal-setting, planning, self-
measurement, and resources. To date, SASI has been used internally by selected NCCC members to
assess their progress toward integration. No evaluations have been published, so it is difficult to assess
SASI’s effectiveness. The NCCC intends to market this package to provider groups interested in
developing integrated systems, but SASI has not yet been used by non-NCCC members.
A S S I S T E D L I V I N G
Another trend that is attracting attention from policymakers, private developers, and consumers is
assisted living. One significant problem with this trend is the lack of a consistent definition used by
providers, regulators, and policymakers. Some argue that “assisted living” is just a 1990s label for a
long-term care setting that has been around for centuries—another example of “old wine in new
bottles.” Homes for the aged, frequently associated with nonprofit fraternal and religious
organizations, proliferated in the nineteenth and early twentieth centuries to supply room and board
for poor, infirm elderly people. Over the past three decades, sporadic attention has focused on
scandalous mistreatment of residents in board and care homes, a version of homes for the aged that
also became a refuge for the people with chronic mental illness in response to the
deinstitutionalization frenzy of the 1960s.
In the 1980s the term “residential care facility” became fashionable as a catch-all label for places
providing room, board, and some level of protective oversight. Hawes et al. (1993) have estimated that
about a half million people live in residential care facilities or board and care homes in the United
States. Perhaps twice that number are living in unlicensed facilities (Newcomer et al., 1997).
It is somewhat ironic that homes for the aged, board and care homes, and other types of
residential care were replaced in the late 1960s and 1970s by nursing homes modeled after hospitals.
“Nursing homes” have delivered far less nursing care than the name suggests. Today residential care
is again in fashion. It is viewed as a desirable alternative to nursing homes because of its ostensibly
less institutional character and its emphasis on a social, rather than a medical, model. A number of
states, including Oregon, Washington, Florida, and Colorado, have aggressively tried to use residential
care as a less costly substitute for institutions. One recent study estimates that anywhere between 15

Milbank Memorial Fund26
and 70 percent of the nursing home population, nationwide, could live in residential care instead
(Spector et al., 1996). Kane (1997) has questioned the judgment of hospital discharge planners who
refer elders with disabilities to nursing homes, rather than alternative arrangements, because 24-hour
care is supposedly available. She notes that remarkably little nursing care is provided in nursing
homes. For example, a survey of nursing home residents in six states found that 39 percent of the
residents received no care from a registered nurse in 24 hours; residents who did receive such care
received an average of only 7.9 minutes; and care by a nursing assistant averaged 76.9 minutes daily
(Friedlob, 1993). Despite these arguments, empirical research has been equivocal on the issue of the
“substitutability” and cost savings of residential care compared to nursing home placement (Kane et
al., 1991; Newcomer et al., 1995b; Sherwood and Morris, 1983). In fact, residential care is more likely
to be a substitute for living in one’s own home than in a nursing home.
What appears to distinguish assisted living from residential care in general and from the
somewhat pejorative “board and care” is a matter of philosophy and emphasis on care, not just
housing (Kane, 1997). Some have also suggested that assisted living is the rich person’s residential care
while board and care is for poor people who rely on federal Supplemental Security Income (SSI) and
state supplements (SSP) to cover the costs. A recent survey of assisted living regulations in 50 states
indicates that four states—Alabama, Rhode Island, South Dakota, and Wyoming—use the terms
“assisted living” and “board and care” interchangeably (Mollica and Snow, 1996). For the other states,
key characteristics differentiating assisted living from other types of residential care are:
• an explicit focus on privacy, autonomy, and independence, including the ability to lock doors and
use a separate bathroom;
• an emphasis on apartment settings in which residents may choose to share living space; and
• the direct provision of, or arrangement for, personal care and some nursing services, depending
on degrees of disability.
As noted in an earlier section on care settings, Hawes et al. (1999) recently completed the first
national survey of assisted living, using a national probability sample of facilities that met several
criteria. These include having 11 or more beds; primarily serving an elderly population; and
providing 24-hour staff oversight, housekeeping, at least two meals a day, and personal assistance
with two or more activities of daily living (ADLs). According to preliminary findings from a
telephone survey, most facilities offer consumers a range of privacy options. Single rooms were the
most common residential unit (52 percent); the rest of the units were apartments. The most common
type of single room was a private room with a full bathroom; the most common apartment was a one-
bedroom for single occupancy.
While most facilities reported a general willingness to serve residents with moderate physical
limitations, fewer than half were willing to admit or retain residents who needed assistance with
transfers from a bed or chair. Furthermore, fewer than half of participating facilities would admit (47

Milbank Memorial Fund27
percent) or retain (45 percent) residents with moderate to severe cognitive impairment; only 28
percent would admit or retain residents with behavioral symptoms such as wandering.
In assessing the extent to which these facilities’ characteristics match the philosophy of assisted
living, Hawes et al. (1999) concluded that only 11 percent offered high privacy and high service.
Another 18 percent provided high privacy but low service. Twelve percent offered low privacy but high
service. The researchers noted that residents of these assisted living facilities had considerably more
privacy and choice than residents in most nursing homes and in the board and care homes they had
investigated in a previous study. Nevertheless, facilities varied widely. A substantial segment of the
industry provided environments that did not reflect the philosophy of assisted living. Furthermore,
the many facilities whose admission or retention policies excluded people with the cognitive
impairments or severe physical disabilities suggest that assisted living is not an environment where
those who experience significant functional decline can “age in place.”
While assisted living does warrant serious consideration by policymakers, providers, and
consumers, a number of impediments to its development need attention. Today, the assisted living
market is primarily composed of the well-off elderly, with little available to moderate- or low-income
consumers, as the recent study by Hawes et al. (1999) confirms. This gap is due, in part, to the limited
sources and inadequate amounts of public financing (primarily SSI and SSP), which could help
subsidize room, board, and care for financially strapped individuals and their families. The most
common monthly rate for facilities offering either high service or high privacy was approximately
$1,800 in 1998.
Other impediments to assisted living include concerns, expressed by state policymakers and
potential private providers, about balancing consumer choice and privacy on the one hand with
health, safety, and liability considerations on the other. One major issue reflecting this concern is the
degree to which states are willing to moderate their nurse practice acts to allow the delegation of
certain tasks, such as administering medication, caring for wounds, and changing catheters (Kane,
1997). A number of states, such as Oregon, Kansas, Texas, Minnesota, and New York, have included
nurse delegation provisions, but the latitude and interpretations of the provisions vary tremendously.
Not surprisingly, they have met serious resistance by many nurses’ organizations, for whom
professional turf is as significant as care issues.
The motives of the assisted living industry have also been questioned. The industry includes more
real estate developers and hotel managers than care providers. Furthermore, as nursing homes look
for new markets and reimbursement strategies that circumvent government regulation, many skilled
nursing facilities may simply lay carpet, install door locks, and hang out the “assisted living” shingle.
Finally, there are questions about the amount of assistance that these facilities actually provide.
According to the study by Hawes et al., 65 percent of the participating facilities supplied “low service”;
that is, they did not have an RN on staff or did not provide nursing care, although they did provide 24-
hour staff oversight, housekeeping, two meals, and personal assistance. Another 5 percent,
categorized as “minimal service,” supplied no personal assistance with ADLs. Given that many

Milbank Memorial Fund28
facilities do not admit or retain people with severe physical disabilities or cognitive impairment, the
level of care is additional cause for concern.
C O N S U M E R - D I R E C T E D C A R E
The 1990s may someday be referred to as the period when the health care and long-term care
consumer came of age. Consumer choice is a relatively recent phenomenon in acute care. It has a
lengthier history in long-term care, due primarily to the disability rights and independent living
movements that started in the 1960s and 1970s. Catalyzed by younger people with physical disabilities
who strongly oppose institutionalization and want a range of home and community-based options
controlled by consumers, a trend toward more consumer involvement and direction has begun to
emerge among the elderly.
The care of consumer direction includes the ability of people with long-term care needs to take
an active part in choosing that care. Consumer direction emphasizes privacy, autonomy, and the right
to “manage one’s own risk.” In long-term care, it is seen as a way to level the playing field between
institutional care and home and community-based care. A growing number of policymakers also see it
as a potential way to save money through more efficient allocation of resources and delivery of care.
Policy options range from consumer involvement in planning and decision-making to the
ultimate in consumer direction—providing cash benefits to beneficiaries and letting them purchase
their own services. Except for one program administered by the U.S. Department of Veterans Affairs,
most consumer direction has occurred at the state level, through Medicaid home and community-
based waivers and state-funded personal assistance service programs. California, for example, has a
large independent provider component to its In-Home Supportive Services (IHSS) program, which is
funded by Medicaid, for elderly and younger disabled home care clients. Rather than receiving case-
managed services through an agency, participants can choose to hire and fire their own workers. As
employers, they can direct their care and be more responsible for its quality. The state supports a
registry of home care workers and also allows clients to hire their own family caregivers.
A recent study funded by the Department of Health and Human Services compared client and
worker outcomes for those participating in IHSS’s independent provider program with those receiving
case-managed services from a county agency (Doty et al., 1999). The study’s principal finding is that
clients in the consumer-directed model had more desirable outcomes than those receiving
professionally managed services within three broadly defined areas: satisfaction with services, feelings
of empowerment, and perceived quality of life. No significant differences were found between the two
models in client safety and unmet needs. Workers in the agency-based programs received, on average,
higher hourly wages and were also more likely than independent providers to receive health insurance
coverage and other job-related benefits. A significantly higher percentage of independent providers as
compared to agency employees had jobs in addition to the IHSS work. However, workers in both
models reported generally high levels of job satisfaction and there were no significant differences

Milbank Memorial Fund29
between the two worker categories on this measure. The independent providers reported better
relationships with their clients than did the agency-based workers.
At least 35 of the 50 states have programs that provide some form of financial payment to
relatives and other informal caregivers who perform homemaking, chores, and personal services
(Linsk et al., 1992). The programs may compensate for caregivers’ work or only for their out-of-pocket
expenses (Keigher and Stone, 1992). Wage programs provide compensation directly to the caregiver,
although most programs provide neither full-time employment nor fringe benefits to persons caring
for one or two recipients. Allowance programs provide a flat grant geared to the financial needs of the
family or caregiver and the care recipient’s condition. Caregivers may qualify because of their
eligibility for public income assistance, shared household status, or relationship to the recipients.
Direct cash payments for long-term care services, including payments to caregivers, have been
much more controversial in the United States than in other countries. Germany’s 1994 Dependency
Insurance Act, for example, provides universal coverage of long-term care for disabled people of all
ages, with a choice of cash, vendor payments, or a combination of cash and in-kind benefits
(Schneider, 1997). During the first year of operation, 80 percent of care recipients who were least
impaired and nearly 66.6 percent of severely disabled recipients chose cash benefits. Since the value
of the program’s cash payments is considerably lower than the cost of vendor payments, the
overwhelming choice of cash helped Germany’s care funds keep their budgets within the
prescribed limits.
The Medicaid program precludes direct cash payments to care recipients. However, through a
joint planning and evaluation grant from the Department of Health and Human Services and the
Robert Wood Johnson Foundation, three states—New Jersey, Arkansas, and Florida—have received
Medicaid waivers to experiment with “cashing out” the home and community-based care benefit. The
states are now designing their respective programs, including (1) establishing the cash payment rates;
(2) developing the marketing strategy for enrolling people eligible for Medicaid into a treatment group
and a control group, which will receive case-managed agency services; (3) planning a counseling
program to help cash recipients choose how to use the dollars; and (4) creating a quality-monitoring
system that balances consumer autonomy with concerns about safety and potential fraud and abuse.
As new managed care initiatives focus on choices made by the informed consumer, it will be
interesting to see how rhetoric is translated into reality in the long-term care arena. Historically, U.S.
policymakers have been comfortable with cash benefits for certain subpopulations, like veterans and
workers with disabilities. President Clinton proposed a $3,000 nonrefundable tax credit for people
needing long-term care, measured by having at least two ADL limitations, or for family members
caring for them. While modest, this proposal would provide consumer-directed benefits, that is, a cash
refund. Policymakers have been less supportive of direct payments to allegedly “undeserving”
individuals, like those in specific Supplemental Security Income eligibility categories, including
mentally disabled children and substance abusers. Concerns about misuse of dollars as well as
potential liability for unforeseen mishaps, such as abuse of elderly clients by privately hired workers

Milbank Memorial Fund30
or deaths of elders because of insufficient or inappropriate service delivery, have impeded the growth
of this trend in the United States.
Consumer direction is not an option for all people with long-term care needs, but it may prove to
be an effective and efficient way to allocate precious resources to an important part of this population.
Proponents of consumer direction see it as a relatively safe and inexpensive way to meet consumers’
needs and allow payment of relatives and friends for important services. Opponents view it as a vehicle
for depressing wages, exploiting workers, and jeopardizing the health and well-being of vulnerable
consumers who may not be able to supervise their own care adequately (Feldman, 1997). Although
little empirical research has tested either perspective, forthcoming findings from the “cash and
counseling” demonstration and other studies may shed light on the potential and pitfalls of this
emerging trend.
A review of trends in long-term care service delivery suggests the following points:
• A number of federal, state, and provider-based initiatives have experimented with integrating
acute and long-term care services. But integration has been seriously hampered by fragmented
financing; a lack of knowledge of, and training in, how to actually integrate service delivery; and
questions about whether integrated care would really save much money.
• The development of assisted living has been hampered by a lack of consensus on definitions and
variations in regulation and oversight from state to state.
• The assisted living market consists primarily of upper-middle- and high-income elderly, who often
receive little service for their money.
• Several states have aggressively used assisted living as a substitute for nursing home care, opening
up the market to modest- and low-income elders.
• Consumer-directed home and community-based care, while not appropriate for all people who
need long-term care, offers choice and autonomy for those who prefer to hire and fire their own
workers and direct their own care.
• Preliminary studies suggest that the quality of care is not jeopardized when consumer direction is
chosen in lieu of an agency-directed model.
• Significant ethical issues surround consumer direction, including the balance between autonomy
and safety, the potential exploitation of personal care workers, the appropriateness of this option
for cognitively impaired older adults, and the potential for fraud and abuse by family members.
• Other countries, such as Germany and Austria, provide natural laboratories for studying the
advantages and disadvantages of consumer direction.

Milbank Memorial Fund31
Financing mechanisms and delivery systems are essential to sound long-term care policy. A third
factor is the most important and the most often overlooked: the adequacy and availability of a trained
workforce to deliver care. Today’s professional and paraprofessional workforce is woefully
unprepared to meet the long-term care needs of an aging society. This problem is likely to worsen as
the baby boomers age in the first half of the new century.
While physicians are not primarily responsible for the provision of long-term care, their
involvement is essential for linking primary, acute, and long-term care delivery. In order to treat
elderly persons with comorbidities and functional limitations, physicians should know what long-term
care resources are available in the local community to meet their patients’ medical needs. Finally, they
should be sensitive to the needs of family members, who are often the primary caregivers and decision
makers for elderly parents.
Unfortunately, most physicians in the United States have no training in long-term care and do not
understand the relationships among their patients’ health conditions and their physical, social, and
psychological needs. Some physicians are exposed to long-term care when their patients are
discharged from hospitals to home health agencies, but most simply sign off on care plans rather than
helping to provide and monitor care.
Medical directors of nursing homes generally have formal or on-the-job training in geriatrics, but
few physicians choose this specialty, which trains health professionals to understand the unique yet
diverse needs of elderly patients. Only 8,800 of the 684,000 American physicians (1.2 percent) in the
United States today are certified in geriatric medicine (Larson, 1998). Only 14 of the nation’s 126
medical schools offered courses in geriatric medicine in 1992, and fewer than 3 percent of recent
medical school graduates have taken electives in geriatrics. In 1992, a survey of primary care
residencies found that long-term care experience in geriatrics was required in 86 percent of family
practice residency programs, compared with 25 percent of internal medicine programs (Counsell et
al., 1994). Most geriatric curricula in the programs surveyed were taught in nursing homes, with little
emphasis upon rehabilitation, home care, and coordination of acute and chronic care.
Of the 98,000 medical residencies and fellowships supported by Medicare in 1998, only 324 were
in geriatric medicine or geriatric psychiatry. Furthermore, more than 20 percent of slots in the top 16
geriatric fellowship programs went unfilled from 1991 to 1994 for lack of qualified applicants
(Besdine, 1994). Only about 500 geriatric specialists now teach in American medical schools. This
faculty shortage is exacerbated because these academic geriatricians spend most of their time treating
patients. Clinical care, not teaching, makes money.
The shortage of paraprofessional workers—certified nursing aides in nursing homes and home
care aides—is currently a crisis for long-term care providers. Ironically, much of this crisis can be
attributed to booming local economies, where unemployment rates are low and where nursing
homes and home care agencies compete with fast food restaurants that pay higher wages and offer
better benefits. Paraprofessionals are among the worst paid workers in the service sector (“Who
Makes What,” 1998). Unattractive job features include low wages and benefits, lack of career
W O R K F O R C E P R E PA R AT I O N

Milbank Memorial Fund32
advancement, high potential for injury, and exposure to much emotional stress. According to
National Occupational Employment and Wage Data for 1996 (BLS, 1997), the median hourly wage
was $7.46 for nursing assistants, $7.51 for home health aides, and $6.48 for personal and home care
aides. Furthermore, Crown et al. (1995) reported that 28.5 percent of nursing home aides had no
health insurance coverage; the comparable estimate for home care aides was 38.9 percent. Only
35.7 percent of nursing home aides and 24.6 percent of home care aides had employer-sponsored
pension plans.
Despite federal requirements that nursing home and home care aides working in
organizations certified by Medicare or Medicaid receive at least 75 hours of training (Simpkins,
1997; IOM, 1996), the content and quality of paraprofessional training vary widely across the
United States (Feldman, 1994). Nursing aides’ incidence rate of injuries and illness that involved
loss of work days is one of the highest among all categories of service industry employees (OSHA,
1998); the injury incidence rate per 100 full-time workers in 1996 was 16.2 percent for nursing
home aides and 8.6 percent for home health care workers. The most common problems were back
injuries resulting from inappropriate lifting and transferring of patients. Workers also suffer
abuse in both institutions and homes, often inflicted by cognitively impaired clients with severe
behavior problems. Racial tensions between white care recipients and aides who are people of
color may exacerbate the situation.
Heavy workloads; a lack of respect, autonomy, and opportunities for career advancement; a
lack of extrinsic rewards, such as adequate wages and health benefits; and the availability of other
job opportunities lead to high burnout rates. Annual turnover far exceeds that of other types of
employees in the service industry (Atchley, 1996; Banaszak-Holl and Hines, 1996). High turnover
has significant financial and psychological costs for providers. It also increases the workload and
lowers the morale of remaining staff members. Several large studies have confirmed that
recruitment and retention would be improved by initiatives that: (1) provide competitive salaries; (2)
create opportunities for career advancement; (3) explicitly recognize aides’ contributions; (4)
involve aides in care planning; and (5) foster a good working relationship with nursing staffs
(Feldman, 1994; Banaszak-Holl and Hines, 1996). Research findings suggest that wages, while
important, are not the key to recruiting and retaining workers. Many caregivers derive immense
satisfaction from caring and nurturing; most respond well to professional recognition and career
opportunities within the long-term care system. Salary and benefits, however, are likely to become
major factors in this strong economy.
Several key points can be drawn from this discussion:
• The lack of a well-trained, well-qualified workforce for long-term care is an even graver problem
than financing and delivery problems.
• Despite the aging of the population, a demographic imperative, few physicians or other health
professionals are trained in geriatrics. There are few financial or cultural incentives to obtain

Milbank Memorial Fund33
training or pursue careers in the care of older adults with chronic illness and disabilities. The
shortage of paraprofessionals and the high turnover rates are caused by inadequate wages,
benefits, professional recognition, and career advancement opportunities. The shortage has been
exacerbated by the strong economy, in which competition from other service industries like fast
food chains is fierce.

Milbank Memorial Fund34
In the future, a number of factors will converge to shape the magnitude, scope, and nature of the
demand for long-term care: changing demographics and the health and functional status of the
population; the availability of family members and other unpaid, “informal” caregivers; the financial
status of various generations and the degree to which they plan in advance for long-term care; and the
availability and cost of institutional care and community-based alternatives. A crystal ball is invariably
inaccurate. Projections must therefore be examined cautiously. Major progress in the treatment of
Alzheimer’s disease, for example, or a pandemic that wipes out a large subpopulation could
significantly influence the size and character of the long-term care population.
T H E A G I N G P O P U L A T I O N
The new century will bring an unprecedented increase in the size of the elderly population as the large
baby boom generation ages. While most elderly people are not disabled, the likelihood of their needing
long-term care increases with age. The population aged 65 and over is expected to increase substantially
between now and 2040. Different assumptions about mortality, fertility, and immigration, however,
T H E F U T U R E O F L O N G - T E R M C A R E D E M A N D
Figure 6. Racial and Ethnic Composition of the Population Aged 65 and Older, 1995 and 2050
1 9 9 5 2 0 5 0
Non-Hispanic White 84.7% Non-Hispanic White 66%
Black 8% Black 10%
Hispanic 5% Hispanic 16%
Asian Pacific Islander 2% Asian Pacific Islander 7%
American Indian 0.4% American Indian 1%
N = 3 3 , 6 4 9 , 0 0 0 N = 8 0 , 1 0 9 , 0 0 0
Source: Treas, 1995. Cited by Friedland and Summer, 1999.

Milbank Memorial Fund35
create widely disparate estimates of the size of that increase (Friedland and Summer, 1999), ranging
from 59 million to 92 million elders living in the United States (U.S. Bureau of the Census, 1996).
Estimates for those aged 85 years or older—those most likely to need long-term care—range from 8.3
million to 20.9 million in 2040. Older women will continue to outnumber men, although in recent
years women have not seen the marked decline in deaths from heart disease that have benefited men
(Treas, 1995). If trends like this continue, the gender gap in longevity may shrink somewhat.
The change in the number and proportion of elderly population will be affected, as well, by racial
and ethnic diversity. In 1995, 85 percent of the U.S. population aged 65 and over was non-Hispanic
white, 8 percent was black, and 5 percent was Hispanic; the remainder was other races. Projections
for 2050 are 67 percent non-Hispanic white, 10 percent black, 16 percent Hispanic, almost 7 percent
Asian Pacific Islander, and less than 1 percent other races (Figure 6; Friedland and Summer, 1999).
I N C R E A S E D L O N G E V I T Y : Q U A N T I T Y V S . Q U A L I T Y
Part of the projected increase in the number and proportion of elderly people in the twenty-first
century is due to an increase in life expectancy at age 65. In 1995, men could expect to live 15.5 years
beyond that.
Males can expect to live 17.6 more years in 2020 and 18.5 years in 2030. The comparable
estimates for females are 20.6 years in 2020 and 21.2 years in 2030, up from 19 years in 1995 (U.S.
Bureau of the Census, 1996).
The extent to which these added years will be free of disability is subject to debate. Studies have
indicated that life expectancy at birth in the United States was 72.7 years in 1976 and 75.4 years in
1990 (Colves and Blanchet, 1983; Crimmins et al., 1997). But life expectancy free of disability was only
56 years and 58.9 years, respectively; the other 16.7 years and 16.5 years were spent with a limitation
in activity. Some researchers argue that medical advances have increased life expectancy but have not
delayed the onset of illness (GAO, 1994). They predict that declining death rates may actually increase
long-term care needs if, for example, more people live long enough to develop age-related conditions
such as dementia or live longer with existing disabilities.
Researchers have been particularly interested in projecting the size of the long-term care
population in an aging America. One recent analysis, which applied 1994 National Health Interview
Survey data to U.S. Census Bureau projections, estimates that the number of people aged 65 and over
with activity limitations will rise to 22 million in 2020 and to 28 million in 2030; in 1994, the number
was 12 million (Rice, 1996). Kunkel and Applebaum (1992) have emphasized the need to use a
dynamic model, which does not necessarily assume that the rates of disability and mortality will
remain constant over the next half century. Using various scenarios, they note that by the year 2040—
when the baby boomers reach their eighties and nineties—the number of older Americans with
disabilities will have increased significantly. Their estimates of elderly people with a long-term
disability range from 14.8 to 22.6 million people, depending on the assumptions built into the model.

Milbank Memorial Fund36
Manton and colleagues (1997) report that disability rates among the elderly may be declining
(Figure 7). They estimate that the prevalence of disability among older Americans for 1994, as
measured by limitations in ADLs, was 3.6 percent lower than the 1982 standardized rate (21.3 percent,
down from 24.9 percent). According to these researchers, the number of elderly Americans with a
serious chronic disability grew from 6.4 million in 1982 to 7.1 million in 1994. But if the disability rate
had remained at the 1982 level, the number in 1994 would have been 8.4 million. This research team
estimates that the disability decline between 1982 and 1994 reduced the population in institutions by
400,000, saving $17.3 billion in nursing home costs in 1994. Using the constant 1982 disability rate,
the estimated number of elders with disabilities in 2030 would be 17 million; at the constant estimated
1996 disability rate, the number would be 14.6 million; based on a 1.5 percent annual decline
estimated by Manton and colleagues (1997), the number would be 8.5 million.
G E O G R A P H I C D I V E R S I T Y
While estimates of the aging population are usually presented for the nation as a whole, the number
of elderly people, and their impact on the demand for long-term care, vary tremendously from state to
state. As baby boomers start to reach retirement age in 2011, the size of the population aged 65 and
over is expected to increase in all states (Campbell, 1997). California and Florida will continue to rank
Figure 7. Number of Chronically Disabled Americans Aged 65 and Older (in millions)
1982 1989 1994 1996
Total 65+ = 26.9M Total 65+ = 30.8M Total 65+ = 33.7M Total 65+ = 34.1M
Source: Manton, Corder, and Stalland, 1997.
6
8
7
6.4
7.5
7.0
8.3
7.1
8.7
7.3
9
IF DISABILITY RATE DID NOT
CHANGE SINCE 1982
BASED ON DECLINES IN CHRONIC
DISABILITY RATE OCCURING SINCE 1982

Milbank Memorial Fund37
first and second, respectively, in having the most elderly residents. By 2025, Texas will rank third,
passing New York and Pennsylvania.
In 1995, Florida had the largest proportion of elderly (19 percent), and Alaska the smallest (5
percent) (Table 2). By 2025, Florida is expected to remain the oldest state, with more than 26 percent
of its population aged 65 or older. Alaska will remain the youngest state, with 10 percent elderly.
Only five states had populations that were at least 15 percent elderly in 1995. The rapid growth in
the ranks of older people is further illustrated by the fact that by 2025, 48 states will reach or exceed
that proportion. Only Alaska (10 percent), California (13 percent), and the District of Columbia (14
percent) will not meet or exceed 15 percent.
Changes in the geographic distribution of elders are affected by several factors. Growth of the
nonelderly population is one factor. Alaska has a very small proportion of elders because many of its
newcomers are young. Similarly, Utah had relatively few elders in 1994 (9 percent), due to an
Table 2. Percentage of Persons Aged 65 and Older in Selected States: 1995 and 2025
“ O L D E R ” S TAT E S
1 9 9 5 2 0 2 5
S TAT E % O F 6 5 + S TAT E % O F 6 5 +
1. Florida 18.6 1. Florida 26.3
2. Pennsylvania 15.9 2. West Virginia 24.9
3. Rhode Island 15.8 3. Montana 24.4
4. West Virginia 15.3 4. Oregon 24.2
5. Iowa 15.2 5. Arkansas 23.9
“ Y O U N G E R ” S TAT E S
1 9 9 5 2 0 2 5
S TAT E % O F 6 5 + S TAT E % O F 6 5 +
1. Alaska 5.0 1. Alaska 10.4
2. Utah 8.8 2. California 13.0
3. Colorado (tie) 10.0 3. Washington, DC 14.0
Georgia (tie) 10.0 4. Hawaii 15.9
5. Texas 10.2 5. Texas 16.1
Sources: U.S. Administration on Aging, 1998; Campbell, 1997.

Milbank Memorial Fund38
unusually high fertility rate and many young newcomers. Conversely, Iowa ranks fifth in the
proportion of elderly (15.2 percent), chiefly because younger people have moved away. Consequently,
elderly Iowans may face serious long-term care problems because their pool of potential unpaid
caregivers has shrunk.
The migration of younger people has more impact than migration by the elderly (Treas and
Longino, 1997). Older people are more likely to stay put than the nonelderly (Treas and Longino,
1997), although, contrary to conventional wisdom, the United States in general is a country of “non-
movers.” In 1994, 94.4 percent of those 65 or older remained in place, compared with 81.7 percent of
those under 65 (Table 3). The movers in both age groups tended to remain in the same county.
Interstate migration rates have remained stable over four decades, with most migration by older
people concentrated in their early years of retirement (Longino, 1998). Almost two million people
aged 60 or older moved from one state to another during the five-year period ending in 1990. Florida
received the most in-migrants (23.8 percent of the total), followed by California (6.9 percent), Arizona
(5.2 percent), and Texas (4.1 percent) (Table 4).
The 1990 census data show a changing pattern of out-migration by retirees. While it is generally
assumed that the states people leave are all in the “rust belt,” fewer migrants left New York, Illinois,
and Ohio in 1990 than in 1980. Surprisingly, some sunbelt states such as California and Florida were
rising to the top of the list of states that people leave (Table 5).
If the migration rate remains stable and most of the future movers are recent retirees, the
number of elderly who move long distances should grow very little. The median age among current
Table 3. Geographic Mobility of Elderly and Nonelderly Americans: March 1993 to March 1994
P E R C E N TA G E O F A G E G R O U P
T Y P E O F M O V E < 6 5 6 5 + 6 5 – 7 4 7 5 – 8 4 8 5 +
Total 100.0 100.0 100.0 100.0 100.0
Nonmovers 81.7 94.4 94.0 95.1 94.2
Movers 18.3 5.6 6.0 4.9 5.8
Same county 11.4 3.2 3.3 2.9 3.4
Different county,same state 3.5 1.1 1.2 0.9 1.0
Different state 2.8 1.2 1.3 1.0 1.2
From abroad 0.5 0.1 0.1 0.1 0.1
Source: Population Reference Bureau analysis of the March 1994 Current Population Survey. Cited by Treas
and Longino, 1997.

Milbank Memorial Fund39
interstate movers is in the mid-60s. Growth in that median age could affect the demand for long-term
care, particularly for states receiving an influx of retirees. But people who do not migrate can also
affect the need for long-term care. Young retirees who “age in place” in states like Florida and Arizona
can require long-term care as time passes.
A countervailing trend is the “return migrant” phenomenon. Older, widowed, and less-healthy
elderly people may return to their state of origin, like elders with disabilities who move to Florida as
young retirees, then return to the Northeast when they need long-term care. Litwak and Longino
Table 4. Five States Receiving Most In-Migrants Aged 60+ in Five-Year Periods Ending
1980 and 1990
1 9 8 0 1 9 9 0
% O F T O TA L % O F T O TA L
S TAT E N U M B E R M I G R AT I O N S TAT E N U M B E R M I G R AT I O N
1. Florida 437,040 26.3 1. Florida 451,709 23.8
2. California 144,880 8.7 2. California 131,514 6.9
3. Arizona 94,600 5.7 3. Arizona 98,756 5.2
4. Texas 78,480 4.7 4. Texas 78,117 4. 1
5. New Jersey 49,400 3.0 5. North Carolina 64,530 3.4
Source: U.S. Bureau of the Census. Cited by Treas and Longino, 1997.
Table 5. Five States Sending Most Out-Migrants Aged 60+ in Five-Year Periods Ending 1980
and 1990
1 9 8 0 1 9 9 0
% O F T O TA L % O F T O TA L
S TAT E N U M B E R M I G R AT I O N S TAT E N U M B E R M I G R AT I O N
1. New York 242,960 14.6 1. New York 222,781 11.7
2. California 141,440 8.5 2. California 187,240 9.8
3. Illinois 120,160 7.2 3. Florida 128,561 6.8
4. Florida 92,280 5.6 4. Illinois 107,136 5.6
5. New Jersey 86,880 5.2 5. New Jersey 106,556 5.6
Source: U.S. Bureau of the Census. Cited by Treas and Longino, 1997.

Milbank Memorial Fund40
(1987) referred to “amenity-seeking” elderly as young retirees moving for certain features such as better
climate. In contrast, assistance-based migration often follows the onset of a disability. It is projected that
during 2030–2050, amenity migration will be supplanted by assistance-based migration.
All these patterns will influence the future financing and design of long-term care in the United
States, including the amount of formal services that may be needed to replace a diminishing pool of
caregivers in certain states. The future costs of long-term care, like the costs of today, will not be
distributed evenly across the nation.
T H E F U T U R E O F I N F O R M A L C A R E G I V I N G
A number of factors will influence the size and nature of the supply of unpaid “informal” caregivers
in the twenty-first century. People who are married are the most likely to have a strong informal
network. In 1995, 73.4 percent of men aged 65 or older were married; the projected estimates for
2030 and 2050 are 70 percent and 66.8 percent (Table 6; NAIC, 1996). Percentages for men aged 85
and over are expected to rise, then fall. Between 1995 and 2030, the proportion of married men in this
old-old category is expected to increase from 50.5 percent to 56.5 percent; by 2050, that number is
projected to decline to 52.4 percent. Elderly women are considerably less likely than men to be
married, now and in the future. The percentage is expected to grow, then shrink. In 1995, 39.4
percent of women aged 65 or older were married; the comparable estimates for 2030 and 2050 are
44.1 percent and 41.5 percent. The percentage of old-old women who are married is expected to
increase from 13.6 in 1995 to 15.3 percent in 2030, then to 16.6 percent in 2050.
One gross measure of the availability of informal caregivers is the ratio of the population in the
average caregiving range—ages 50 to 64—to the population aged 85 and older. In 1990, that ratio was
11 to 1; by 2050, there will be only four potential caregivers for every elderly person (RWJF, 1996).
Table 6. Projections of the Percentage of Married Persons Aged 65+ and 85+ by Sex, 1995–2050
A G E A N D S E X 1 9 9 5 2 0 0 0 2 0 1 0 2 0 3 0 2 0 5 0
Male
65+ 73.4 73.0 73.2 70.0 66.8
85+ 50.5 53.4 55.0 56.5 52.4
Female
65+ 39.4 39.4 41.0 44.1 41.5
85+ 13.6 11.9 13.3 15.3 16.6
Source: Social Security Administration, 1995. Cited by NAIC, 1996.
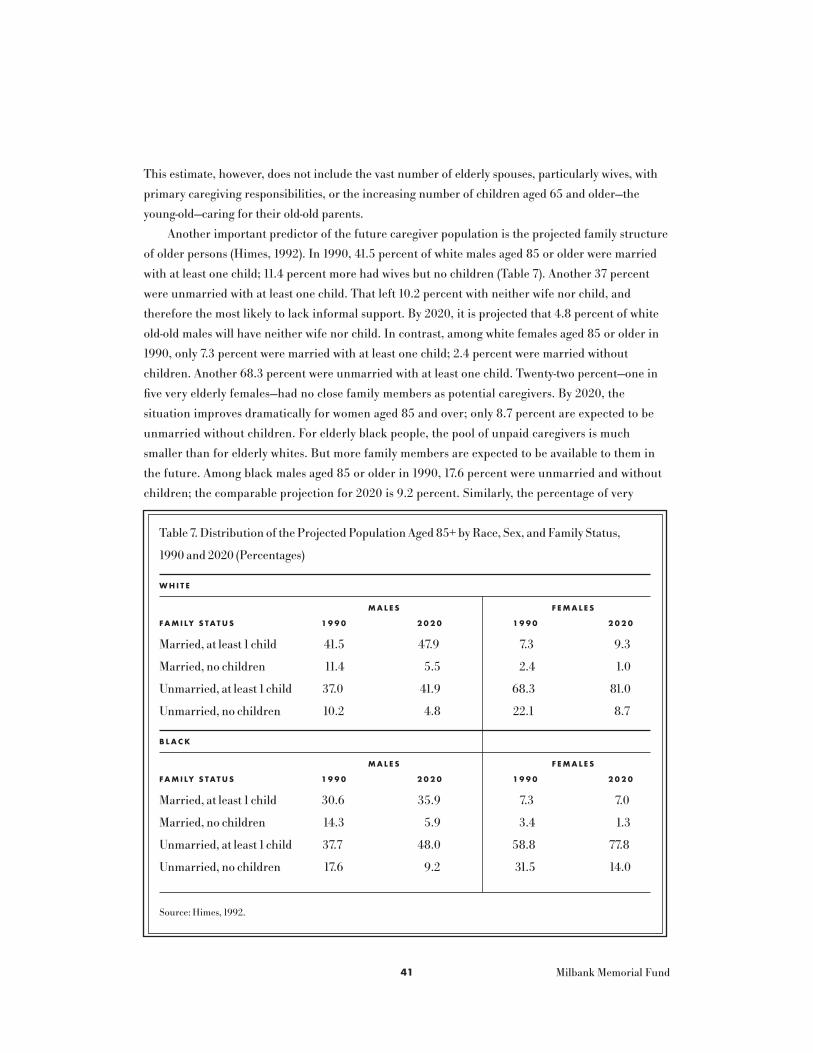
Milbank Memorial Fund41
This estimate, however, does not include the vast number of elderly spouses, particularly wives, with
primary caregiving responsibilities, or the increasing number of children aged 65 and older—the
young-old—caring for their old-old parents.
Another important predictor of the future caregiver population is the projected family structure
of older persons (Himes, 1992). In 1990, 41.5 percent of white males aged 85 or older were married
with at least one child; 11.4 percent more had wives but no children (Table 7). Another 37 percent
were unmarried with at least one child. That left 10.2 percent with neither wife nor child, and
therefore the most likely to lack informal support. By 2020, it is projected that 4.8 percent of white
old-old males will have neither wife nor child. In contrast, among white females aged 85 or older in
1990, only 7.3 percent were married with at least one child; 2.4 percent were married without
children. Another 68.3 percent were unmarried with at least one child. Twenty-two percent—one in
five very elderly females—had no close family members as potential caregivers. By 2020, the
situation improves dramatically for women aged 85 and over; only 8.7 percent are expected to be
unmarried without children. For elderly black people, the pool of unpaid caregivers is much
smaller than for elderly whites. But more family members are expected to be available to them in
the future. Among black males aged 85 or older in 1990, 17.6 percent were unmarried and without
children; the comparable projection for 2020 is 9.2 percent. Similarly, the percentage of very
Table 7. Distribution of the Projected Population Aged 85+ by Race, Sex, and Family Status,
1990 and 2020 (Percentages)
W H I T E
M A L E S F E M A L E S
FA M I LY S TAT U S 1 9 9 0 2 0 2 0 1 9 9 0 2 0 2 0
Married, at least 1 child 41.5 47.9 7.3 9.3
Married, no children 11.4 5.5 2.4 1.0
Unmarried, at least 1 child 37.0 41.9 68.3 81.0
Unmarried, no children 10.2 4.8 22.1 8.7
B L A C K
M A L E S F E M A L E S
FA M I LY S TAT U S 1 9 9 0 2 0 2 0 1 9 9 0 2 0 2 0
Married, at least 1 child 30.6 35.9 7.3 7.0
Married, no children 14.3 5.9 3.4 1.3
Unmarried, at least 1 child 37.7 48.0 58.8 77.8
Unmarried, no children 17.6 9.2 31.5 14.0
Source: Himes, 1992.

Milbank Memorial Fund42
elderly females without husband or children is projected to decrease from 31.5 percent in 1990 to
14 percent in 2020.
One group of elderly people may be most likely to need formal services—individuals who live
alone and have no living children or siblings. Researchers have estimated that 1.2 million people aged
65 or over will be in that group in 2020, up from 682,000 in 1990 (NAIC, 1996). The 288,000 people
who are 85 or over and living alone without close kin are the most likely candidates for formal long-
term care service.
Projections of family structure tell only part of the story. Researchers have observed that while
daughters provide more care to parents than sons do, they also accommodate the needs of others,
including their own children (Wolf et al., 1997). As women delay childbearing, they will be more likely
to try juggling both childrearing and elder care responsibilities; the amount of caregiving they provide
to disabled parents may therefore diminish. On the other hand, recent research also suggests that
caregiving by an adult child is reduced, but on much less than a one-for-one basis, as care by siblings
increases. The more children a frail parent has, the greater the volume of help from children the
parent will receive. The Depression-era mothers, the cohort of elders aged 85 or older, had relatively
low fertility rates. In contrast, the parents of the baby boom generation are aging with a larger average
pool of family members, as measured by numbers of surviving offspring and in-laws. During the next
50 years, however, older people are expected to have few surviving children, on average.
Labor force participation of women who are caring for elderly parents and elderly spouses will
also influence the availability of informal caregivers in the future. Female labor force participation
rates, particularly among the cohorts most likely to be caring for elderly parents, have been rising
since the 1970s. Among those aged 45 to 54, the rate is projected to increase from 75.4 percent in
1996 to 79.9 percent in 2006; the comparable figures for those aged 55 to 64 are 49.6 percent and
55.8 percent (Fullerton, 1997). Changes in the nature of unpaid assistance may include an escalation
in long-distance caregiving. An estimated 3.3 million baby boomers now provide long-distance care,
and this number will more than double over the next 15 years (National Council on Aging, 1997a).
One uncertainty is the extent to which new family structures will affect the size and character of
the pool of informal caregivers. With increases in divorce and remarriage, many elderly individuals
find themselves with a range of step-in-laws and step-grandchildren. It is not clear whether this trend
will increase or decrease the availability of caregivers. On the one hand, divorces may estrange
families and deter caregiving. On the other hand, the new configurations of families may expand the
pool of caregivers in the future.
T H E E C O N O M I C S T A T U S O F T H E F U T U R E E L D E R L Y
One major determinant of the market for long-term care is the extent to which future generations of
elderly people will be able to afford these services. The economic status of the elderly, and their
potential use of formal services, are influenced by education; more highly educated individuals are

Milbank Memorial Fund43
likely to be wealthier and more inclined to purchase care. People aged 65 and over will clearly be
more educated in the twenty-first century than before (Besl and Kale, 1996). In 1997, 40 percent of
those aged 75 and over had no high school diploma; only 13 percent had a bachelor’s or graduate
degree. That same year, only 13 percent of those 45 to 54 years old lacked a high school education; 28
percent had at least a bachelor’s degree (Day and Curry, 1998).
The future educational profile of the elderly will be quite different from that in 1990 (Figure 8;
Hobbs and Damon, 1996). In 1990, nearly half the elderly population had not completed high school;
in 2030, more than four out of five elderly (83 percent) are expected to have at least a high school
education. Those 65 and over with at least a bachelor’s degree are expected to increase from 11
percent in 1990 to 24 percent in 2030. The proportion of college-educated males is expected to rise
from 14 to 26 percent. The rise for females will be even more dramatic—up from 8.5 percent to 22
percent. Future improvements in educational levels among the elderly will be slower for blacks and
Hispanics than for whites.
Today, one out of eight older people has an income below the official poverty line (Smith, 1997)—
although after adjustments for the value of non-cash benefits, such as food stamps, Medicaid, and the
implicit rental value of housing, only one out of 20 elders is poor at present. This should not obscure
Figure 8. Educational Attainment of the Elderly by Sex: 1990 and 2030
Male Female Male Female
1990 2030
Source: Hobbs and Damon, 1996.
0
20
40
60
80
100
46.6
39.3
14.1
46.9
44.6
8.5
17.4
56.6
26.0Bachelor’s degree
or higher
High school/some
college
Not high school
graduate
16.2
61.8
22.0

Milbank Memorial Fund44
the reality that many elderly people remain economically vulnerable. For example, one in every four
nonmarried older women is poor; among elderly widows, poverty rates run as high as 40 percent.
Seven out of ten older black single women live below the poverty line.
There is enormous inequality among older people—far more than any gap between them and the
rest of the American population (Smith, 1997). While the median household income among elders
aged 70 and over is $15,624 in 1996 dollars, the comparable figures for those over age 85—the
population most likely to need long-term care—is $9,439 (Table 8). The average household of a person
over age 70 has less than $9,000 in financial assets (defined as total wealth minus housing and other
real-property assets). Those in the bottom 10 percent have no financial assets at all, while those in the
top five percent have more than $300,000.
Home ownership is an important form of wealth for the elderly. It is also an important part of the
long-term care system, in that most people prefer to remain in their own homes rather than being
institutionalized. In 1997, 79.1 percent of those aged 65 or over owned their homes; among the group
aged 75 and older, the figure is 75.8 percent (U.S. Bureau of the Census, 1998a). The highest
ownership rates were among those aged 55 to 64, four out of five of whom were homeowners. Only
two-thirds of those aged 35 to 44 were homeowners in 1997. The fact that a larger proportion of the
elderly population may not own their homes in the future has several implications for long-term care.
Since one deterrent to spending down in order to qualify for Medicaid is the loss of one’s house,
people who do not own a house in the first place may find Medicaid more appealing that it is now.
However, home ownership also suggests that elderly individuals will have fewer opportunities to use
the equity in their homes to purchase care (although the use of mechanisms like reverse annuity
mortgages has never really become popular in the United States). Finally, decreased home ownership
may create a greater demand for residential care in the future.
Table 8. Mean and Median Household Incomes among Persons Aged 70+
(1996 Dollars)
H O U S E H O L D T Y P E M E D I A N M E A N
All families $15,624 $23,769
Race
White 17,385 25,803
Black 9,467 13,250
Hispanic 8,943 12,922
Married 24,814 36,500
H O U S E H O L D T Y P E M E D I A N M E A N
Female-headed $10,613 $13,960
Age groups
70–74 19,461 27,753
75–80 15,357 24,002
81–85 12,335 19,359
86+ 9,439 13,834
Source: Smith, 1997.

Milbank Memorial Fund45
Assuming reasonable rates of growth in the nation’s economy, baby boomers are expected to have
higher real incomes during retirement than today’s retirees (Manchester, 1997). However, the generation
that is now beginning to retire—people born between 1930 and 1940—has had a unique set of economic
experiences (Friedland and Summer, 1999). They were in the labor force during a period of strong
economic growth in the 1960s, saw their home values increase dramatically in the 1970s, and may have
begun saving for retirement early enough to benefit from the high interest rates of the late 1970s and the
stock market booms of the early 1980s and mid-1990s. They were more likely than workers in previous
generations to participate in insured pension plans with vested rights to pension benefits. People 20
years younger have not directly benefited from these circumstances. The growth in real wages slowed
during their entry into the labor force; they paid higher real prices for homes and did not benefit from
the stock market expansion. They are less likely than the preceding generation to have defined-benefit
pension plans with employer contributions. Yet, they had more schooling and fewer children and are
more likely than their predecessors to have a working spouse. These circumstances may provide financial
advantages in retirement that the current generation of retirees has not experienced.
Contrary to the common belief, most baby boomers have few financial assets. According to data
from the 1993 Survey of Income and Program Participation, those with incomes at the 80th percentile
Figure 9. Financial Assets Held by Boomers by Income Level: 1993
25th Median 75th 80th 90th
PERCENTILE OF INCOME
Source: Survey of Income and Program Population. Cited by AARP, 1998b.
-$10,000
0
10,000
20,000
30,000
40,000
50,000
60,000
70,000
$80,000
-$951 $1,000
$16,759
$25,300
$66,000

Milbank Memorial Fund46
had only $25,300 in financial assets other than housing (Figure 9) (Rother, 1997). For those at the
90th percentile, the average financial assets were $66,000. Furthermore, only one-fifth of boomers
had more than $25,000 in non-housing assets. The lowest one-quarter reported negative financial
assets: their liabilities exceeded their assets. With respect to future financial security, a study
conducted by Lewin-VHI for AARP in 1994 estimated that three-fourths of baby boomers will have all
three major sources of retirement income—Social Security, pensions, and assets—in 2030. However,
from 49 percent to 60 percent of retirees in 2030 will rely on Social Security for at least half of their
income (depending on assumptions about the growth of the Gross Domestic Product).
The incomes within the baby boom generation are more unequal than those of preceding
generations. They have been subject to the economic pressures of slow wage growth and increased
income inequality since the 1970s, because they entered the labor market when wage inequality was
more pronounced. These inequalities will continue into their old age, raising the specter of more
economic disparity among future generations of elderly than before. Given the correlation between
disability and poverty, the very people who need long-term care may be less able to afford it in the
future than the current cohort of elders.
Baby boomers’ perceptions of future long-term care needs may influence the way in which they
prepare financially. A recent survey of Americans aged 42 and over found that only 12 percent think
that they or their spouses are very likely to require long-term care; only 11 percent feel that they are
very likely to require assistance with daily activities (Greenwald, 1998). Ignorance about who pays for
long-term care is still common. Almost three out of four respondents to a recent survey believe that
Medicare is the primary funding source for most older persons’ services, and 48 percent report having
done little or no long-term care planning (National Council on Aging, 1997b).
Several major themes emerge from this discussion:
• The aging of the U.S. population and, in particular, the growth in the proportion of people aged
85 and over, will place increasing demands on our fragmented long-term care system. The extent
to which declining disability rates may mitigate some of these demands is uncertain.
• Long-term care will continue to be a women’s issue for both the care recipient and the caregivers.
• The long-term care population will become more racially and ethnically diverse in the next half
century. Policies and programs will therefore need to be more culturally sensitive and diverse.
• Aging is not geographically uniform. While one in five Americans is expected to be elderly 30
years from now, some states and regions have already reached or surpassed that proportion.
Changing migration patterns of both young and old people will continue to produce states and
regions that are much older, and need much more long-term care, than others.
• Elderly cohorts of the future will be more highly educated and, on average, more financially
secure than today’s cohort. Even so, many Americans will be financially unprepared to pay for
long-term care.

Milbank Memorial Fund47
While projections of the demand for long-term care must be examined with caution, it is nearly
impossible to predict the nature, size, and scope of the future supply. Services will depend not only on
the demand for them but upon their financing and upon what we are willing to pay for. The design of
delivery systems is in flux; managed care may change the ways in which elders with chronic disabilities
receive acute, post-acute, and long-term care. Some observers argue that financing will continue to
shift from the federal government to states, individuals, and families (Cohen, 1998). As consumers rely
less and less on the government to pay for long-term care, they are likely to demand greater flexibility
in how and where they obtain services.
T H E F U T U R E S U P P L Y O F A L T E R N A T I V E S E T T I N G S
One major uncertainty is the extent to which nursing homes will remain the dominant setting for
long-term care. Much depends on the public and private incentives, both financial and regulatory,
to develop more home and community-based alternatives, including assisted living. Currently,
assisted living facilities rarely replace nursing homes. Much of the institutional care is supported
by Medicaid, whose clients are poor or have become poor in order to qualify for coverage. In
contrast, assisted living has been available primarily to wealthy consumers who pay for it
themselves, with little attempt to reach people with modest or low incomes. Industry analysts
estimate that the assisted living market is worth $13 billion to $15 billion; the value is expected to
rise to $20 billion by 2020. But it is not clear whether these facilities will continue to be an
alternative chiefly for the rich or will offer a range of services to elders with disabilities who
are not rich.
The two trade associations representing most assisted living and housing facilities, the Assisted
Living Federation of America and the American Association of Homes and Services for the Aging,
identified affordable housing with services as a major priority for the final decade of the twentieth
century. Recent federal legislation requires the U.S. Department of Health and Human Services and
the U.S. Department of Housing and Urban Development to collaborate on initiatives that will expand
Medicaid-funded home care services in low-income housing. Such promising measures can help
develop affordable assisted living for modest- and low-income elders. But these efforts will be futile
unless private developers and investors support them.
The degree to which other options, such as adult day care, will proliferate throughout the
country is unknown. If new communities adopt universal design concepts, more people will be able
to “age in place” because their homes will be designed to adapt to their changing needs as their
disabilities increase. As telemedicine becomes more sophisticated and available, long distance
caregiving may become more of a reality for both formal and informal caregivers, particularly in
rural areas. Such a development, however, may lessen the “caring” that comes from the hands-on,
personal touch of a family member or home care worker.
T H E F U T U R E S U P P LY O F L O N G - T E R M C A R E S E R V I C E S

Milbank Memorial Fund48
T H E F U T U R E O F T H E L O N G - T E R M C A R E W O R K F O R C E
According to a study supported by the Alliance for Aging Research in 1996, the United States has a
shortage of more than 13,000 doctors trained to treat older patients. The report estimated that this
country currently needs 20,000 geriatricians and will need a total of 36,858 by the year 2030 to care
for graying baby boomers. About 2,100 faculty members in geriatrics, or more than four times the
current number, are needed.
The future demand for, and supply of, paraprofessional long-term care workers should be of
major concern to policymakers, providers, and potential consumers. Paraprofessional workers provide
80 percent of the direct care in nursing homes and over 90 percent of the formal direct services at
home (Atchley, 1996). Factors creating an increasing demand for home care aides include: (1) the
aging of the population; (2) the increased reliance of people of all ages on home care as an alternative
to hospitalization and nursing home placement; (3) the expansion of home care coverage through
Medicare and Medicaid; and (4) the overwhelming preference of most people with disabilities and
their families for home care (BLS, 1999a; Burbridge, 1993). The demand for nursing home aides will
continue, because of increasing financial pressures on hospitals, the development of post-acute care in
skilled nursing facilities, and the trend toward integrated health and long-term care systems. High
turnover rates in both the nursing home and home care industries underscore the need for more
workers in the future.
According to the Bureau of Labor Statistics (1998b), the service industries are expected to grow
by 18.1 percent between 1996 and 2006, compared with 14 percent for all occupations. Personal and
home care aides are the fourth-fastest growing occupation, with a dramatic 84.7 percent growth rate
expected in that same decade. Home health aides are the sixth-fastest growing occupation, expected to
increase 76.4 percent between 1996 and 2006. The nursing home aide industry is expected to increase
25.4 percent during that period.
There is, however, concern about the availability of these workers in the future. By 2010, as
baby boomers reach old age and begin to require assistance, the pool of middle-aged women
available to provide low-skilled basic services will be substantially smaller than it is today (Feldman,
1997). In addition, the educational level among minority women—those most likely to enter the
paraprofessional workforce—is improving significantly. In 1980, 70.1 percent of white women aged 25
or over had at least a high school diploma; 14 percent had completed four or more years of college.
The comparable figures for black women were 51.3 percent and 8.1 percent. The educational status of
women of both races improved by 1998, but the increase was most striking for black women; 76.7
percent have at least a high school education and 15.4 percent have completed four or more years of
college (U.S. Bureau of the Census, 1998b). These more educated minority women may be less willing
to work in the same low wage, low benefit jobs as those who preceded them (Burbridge, 1993).
The availability of paraprofessionals is highly dependent on the local economy (Atchley, 1996).
During the economic boom of the late 1990s, when unemployment rates were very low, providers

Milbank Memorial Fund49
experienced great difficulty in hiring and retaining aides, particularly in the home care industry. This
service sector is very sensitive to the availability of competing low-wage jobs, especially because
workers tend to be paid more for flipping burgers than for providing essential personal care to elders
with disabilities.
The future availability of paraprofessionals may also be affected by U.S. immigration policy. This
is particularly true in states like California, New York, Texas, Florida, and New Jersey, where almost
two-thirds of all immigrants were concentrated in 1996 (Bureau of International Labor Affairs, 1997).
Available data do not identify paraprofessionals by immigrant status, but a large proportion of these
workers are people of color, many of whom are probably immigrants.
Immigration accounts for 40 percent of the labor force growth in the United States today
(“Employment, Inequality,” 1997). Forty percent of immigrants are in two occupational groups—
operator/laborer/fabricator and service worker (Fix and Passel, 1994). Almost two-thirds of
immigrants come to the United States for family reunification and are not seeking high-skilled
employment opportunities. They comprise a current and future labor pool for low-skilled jobs,
including the paraprofessional long-term care workforce. Consequently, policies to control the entry
of low-skilled immigrants, particularly by limiting family-based immigration, may diminish the labor
pool of nursing aide and home care workers in the future (Camarota, 1998).
Some long-term care providers are so concerned about the current labor shortage that they have
suggested liberalizing the immigration laws to allow the entry of foreign workers to become aides.
Other countries that are far “grayer” than the United States have already done so; Italy recruits
workers from Peru, and Japan has begun to import women from the Philippines for these low-skilled
jobs. While this may be one way to expand the labor pool, the ethical, racial, and fiscal implications of
such a strategy, including potential exploitation of these workers and the costs that could accrue to the
nation as a result of increased immigration (such as increased demand for public services and benefits
or competition with American citizens for low-skilled jobs should the economy weaken), need to be
seriously considered.

Milbank Memorial Fund50
Given the rapidly changing health and long-term care environments, it is very difficult to predict what
kind of financing and delivery systems will emerge in the future. There are, however, several givens.
First is the major demographic shift that is about to overtake this country. Clearly, the number and
proportion of elderly people—particularly the very old—will increase dramatically, and with it the
demand for long-term care. Despite a trend toward declining disability rates among the elderly, the
sheer volume of the old-old in the first half of the twenty-first century suggests that we must continue
our quest for more effective and efficient ways to finance and deliver long-term care.
Another clear trend is the pivotal role of family and friends in providing long-term care to elders
with disabilities. Despite the myth of family abandonment, we have seen no diminution of informal
care, and there is no reason to believe that families will act differently in the future. Policy discussions
about financing and delivery will continue to focus on how to support informal caregiving, with the
implicit or explicit objective of avoiding any substitution of formal, paid care for family care.
What may change is the nature and character of the informal networks that provide those
services. In the short term, there will be more adult children than are available to the current
cohort of elders because of the very low fertility rates among Depression-era mothers. As we
approach 2025, however, the potential pool of adult children to be caregivers will begin to decrease.
As more women remain in the workforce and the delay childbearing, a growing “sandwich
generation” will have to juggle the multiple demands of paid work, housework, child care, and
elder care. To date, families have not substantially reduced their contributions to elder care, but if
these trends continue, there may be a greater demand for the formal, paid sector to help adult
daughters, in particular, cope with overwork.
In light of the current fragmentation of long-term care policy in the United States and the
underlying values of rugged individualism and market competition, it is unlikely that we will develop
a unified, comprehensive financing and delivery strategy in the future. My ideal framework for reform
is person-centered and, where relatives are involved in decision making and caregiving, family-
centered. The selection of services, providers, settings, and links among systems should be based on
the need for care of the elder with disabilities and the personal, social, and environmental constraints
within which the elder lives. Together with family members and formal care providers, individuals
should be able to choose the services and settings they prefer, and to choose alternatives if their needs
and circumstances change as time passes.
We are unlikely to develop such a system any time in the near future. However, this framework
provides a tool for assessing financing, delivery, and training strategies as we move into the new century.
I M P L I C A T I O N S F O R L O N G - T E R M C A R E F I N A N C I N G
Based on data from the Long-Term Care Financing Model and the National Long-Term Care Survey,
the Congressional Budget Office (CBO, 1999) estimates that inflation-adjusted expenditures for long-
term care for the elderly will grow by 2.6 percent annually between 2000 and 2040. Expenditures are
S I N K I N G O R S W I M M I N G I N T O T H E F U T U R E ?

Milbank Memorial Fund51
expected to reach $207 billion in 2020 and $346 billion in 2040. Projections beyond the next 20 years
should be viewed with caution, because of uncertainties about demand as well as about the nature,
scope, and costs of services in the future. For example, the estimates assume that the prevalence of
disability will decline, on average, by 1.5 percent per year. If the projected elderly population in 2040
had the same prevalence of disability as that projected for 2000, total long-term care expenditures
would be an estimated $484 billion, about 40 percent higher than the CBO’s estimate of $346 billion.
On the other hand, the CBO’s estimates include Medicare and Medicaid spending for skilled
nursing facility and home health care as well as for nonmedical institutional and home care services.
These medically oriented costs are currently included in our health care spending as well as in our
long-term care spending; in effect, we are counting these expenditures twice. If we separate these
expenses from our long-term care accounting, estimates of future spending on long-term care would
be reduced substantially.
How will we pay for long-term care for an increasingly elderly population? After 30 years of
debate about financing, it is almost certain that the United States will maintain its patchwork
approach by merely tinkering with public and private funding. We will continue to rely on the unpaid
labor of wives and adult daughters to provide the bulk of long-term care to elderly family members
with disabilities. As caregivers are recognized as unsung heroes, and as future generations of
caregivers face competing demands on their time, policymakers may pursue modest approaches to
supporting informal care. President Clinton’s proposed $3,000 tax credit to families caring for elders
with disabilities is such an initiative, one that resonates with Americans across a wide political
spectrum because it uses the tax code, and not social programs, to provide financial assistance.
Another modest effort is the Family and Medical Leave Act of 1993, which lets caregivers working for
employers with at least 50 employees take unpaid leave for up to 12 weeks a year to care for a severely
disabled spouse or parent. These are relatively inexpensive ways to demonstrate that we appreciate the
significant contributions of families.
More substantial benefits for caregivers would include requiring employers to let workers take
time off with pay to care for a disabled family member, and including the accumulated caregiving
years in calculating Social Security benefits. While several European countries already provide such
benefits to their informal caregivers, we are not likely to see such actions soon. Policymakers and
many Americans fear that such measures would lead informal caregivers, primarily women, to shirk
their responsibility to keep providing the “free” care that they have provided for centuries.
Tomorrow’s elderly individuals and families, on average, will be wealthier than today’s, although
there will be much variation within each generation of elders. Baby boomers have more experience
with using formal, paid care, by purchasing long-term care for their parents and grandparents, than
the current cohort of elders. It is likely, therefore, that more elders will be willing and able to
purchase services in the future. But it is important to note that, because of the connection between
low income and disability, those most likely to need long-term care in the future are also least likely to
be able to pay for services themselves.

Milbank Memorial Fund52
Just as we have failed to achieve universal health care coverage for all Americans, it is unlikely
that the United States will follow the lead of other Western industrialized countries, which have
spread the long-term care risk across populations and generations. We have neither the underlying
philosophy of social solidarity nor the political will to create a social insurance program for long-term
care similar to the one that Germany created in 1995. Through a combination of mandatory payments
from workers and employers (1.7 percent of gross income shared equally by employees and
employers), including the sacrifice of one paid holiday annually, disabled Germans of all ages and
incomes have access to a flexible array of home, community-based, and institutional long-term care.
The home and community-based options include a case-managed service package and a discounted
cash benefit that can be used at the discretion of the disabled person, who can choose to pay family
members. Japan passed similar long-term care legislation in 1998, although no cash benefit is offered.
In both countries, the payments are not expected to cover the full costs. Both systems are designed
around informal care, to the extent that it is available. Room and board charges for nursing home and
residential care are expected to be paid for privately.
In this country, Medicaid is likely to continue to play a major role in financing long-term care at
the state level, with increasing flexibility from the federal government for expanded home and
community-based options. If the economic boom of the late 1990s continues, some state and local
governments may augment Medicaid funding by expanding coverage to low- and modest-income elders
who do not financially qualify for Medicaid. As the proportion of older people increases in
communities across the country, we may also see more efforts by elderly advocates to pass local levies
like those being used to support long-term care in several counties in Ohio.
Medicare, on the other hand, is likely to finance less long-term care in the future. The pendulum
has already swung in that direction with the ratcheting back of the home health benefit in the 1997
Balanced Budget Act. A shift in nursing home reimbursement from a cost-based approach to a
prospective payment system that pays a fixed amount for residents in specified severity of
illness/condition categories may also affect the number of people receiving Medicare-covered services.
A similar system is scheduled to be implemented for Medicare home health in October 2000. While
Medicare managed care may continue to enroll more elders, increased coverage for low-tech personal
care provided at home, in assisted living, or in nursing homes is not likely to be a covered service in
the near future. As Medicare limits post-acute and subacute benefits provided through skilled nursing
facilities and home health agencies, it will be interesting to see whether the gaps are filled by the
states’ share of Medicaid and by programs funded entirely by states. Many state budgets are currently
in good shape. In any significant economic downturn, however, states would be hard-pressed to meet
the increasing demands of an aging population at the same time that major changes in welfare law
were putting pressure on their coffers.
The role of private long-term care insurance remains the subject of much debate. One camp
argues that it will never be more than a “niche” market for relatively prosperous young-old. Others
anticipate substantial growth in the market as baby boomers and their children age. Neither camp
Milbank Memorial Fund53
knows the extent to which an employer-based group market will emerge to offer quality, affordable
products to younger people. Assuming that Congress accepts President Clinton’s proposal to let the
federal government experiment with a long-term care policy for its workers and retirees, it will be
interesting to watch the program evolve. It will be particularly important to see whether
participation grows and to note what happens when large numbers of participants file claims and
actually receive services.
A wealthier and more educated population will probably want more choices of services and
settings in the future. Financing strategies that offer flexibility in how dollars are used should appeal
to more elderly Americans and their families. Policymakers in the public and private sectors should,
therefore, be exploring the merits of disability-based financing rather than financing that limits
consumer choices to a defined set of benefits. While I have argued above that purely public financing
through social insurance is not likely to be embraced in the United States, some have suggested that
the Social Security program could be the basis for cash payments to people with long-term care needs
(Rother, 1998). On the private side, a few insurers (like UNUM and Aetna) currently offer a long-term
care product that pays a flat dollar amount tied to the level of disability, rather than access to a set of
discrete services. Because they allow discretion, these policies are more expensive than indemnity
products. However, new versions of these plans could be designed and priced to meet a growing
demand for more flexibility and choice. Such products may appeal to individuals who buy insurance
while relatively young because they are not locked into a set of service options that may not be
available 30 years later when the care is actually needed.
This paper has highlighted the importance of housing, as well as services, in meeting the long-
term care needs of the elderly. Several trends identified in this paper suggest that policymakers should
consider separating, or unbundling, the financing of care from the financing of room and board. This
would certainly help to level the playing field between institutional care and home and community-
based care, since housing costs are now recognized only in regard to nursing home care.
Unbundling would support consumer-directed and family-centered care, because the service
dollars could be used in the most appropriate and preferred setting.
The basis for the separation can become an arbitrary accounting exercise (Kane et al, 1998). Once
a base price for room and board is set—based on real costs or linked to minimum ability to pay—
individuals with varying levels of resources could purchase a range of amenities, as people do in the
general housing market. This is, in essence, what occurs in other countries such as Canada and
Germany, where the basic price for room and board is set within the financial means of the poorest
pensioner. The separation of services from room and board empowers the individual and the family in
the marketplace; the service dollars can be spent wherever the elder with disabilities lives.
Several key points can be drawn from this discussion of long-term care financing:
• Financing in the United States will continue to be a patchwork of public and private sources with
no uniform public policy to provide a framework.

Milbank Memorial Fund54
• Medicaid will continue to be the primary source of public funding for long-term care,
perpetuating wide variation in long-term care options available to elders with disabilities from
state to state.
• Private long-term care insurance will continue to cover a small proportion of those at risk for
needing long-term care. An employer-based group market is not likely to grow substantially in the
near future.
• The federal and state governments will rely increasingly on the tax code to achieve incremental
reform, including tax credits for caregivers and care recipients and tax breaks to encourage the
development of a private insurance market.
• To maximize dollars, minimize administrative costs, and broaden the pool of paraprofessional
workers, state policymakers will expand consumer-directed options through Medicaid and
programs entirely funded by states, allowing individuals and families to choose vouchers or cash
to purchase their own services.
• As the demand for residential care increases, policymakers will begin to explore ways to finance
affordable housing for modest- as well as low-income elders with disabilities.
I M P L I C A T I O N S F O R S E R V I C E D E L I V E R Y
Elders and their families continue to prefer home and community-based care. Despite the elderly
mantra—“I never want to be a burden on my children”—most people, regardless of their level of
disability, do not want to go into a nursing home. Most families do not look forward to nursing home
placement. As the population ages and future generations of elderly become, as a whole, wealthier and
better educated than today’s elders, there will undoubtedly be an increased demand for the right to
choose providers and long-term care settings, with the overarching desire to remain at home for as
long as possible. Furthermore, as more acute and post-acute care shifts from hospitals and other
institutions into the community, we are likely to see an expansion of high-tech as well as low-tech
services being provided at home.
As baby boomers age, housing developers are likely to pay more attention to the physical design
of homes, and there may be more pressure to build homes in which people can “age in place.” Ramps
instead of steps, grab bars in the bathroom, and door handles that accommodate arthritic fingers may
become the norm rather than the exception. Technological advances, ranging from telemedicine in
rural areas to robots performing personal care functions, may enhance the ability of elders with
disabilities to remain independent in their own homes.
The growth of the assisted living industry in the 1990s is expected to continue. Given the fact that
tomorrow’s elderly are less likely to be homeowners than the elderly of today, the development of a
variety of residential options is essential. Information to date suggests that most assisted living is
available only to the well-to-do and that frequently little real assistance is provided. Policymakers will
need to address the question of how to make assisted living affordable for modest- and low-income

Milbank Memorial Fund55
elders. In addition, if residential options are to meet the long-term care, not just the housing needs, of
the elderly with disabilities, policymakers will have to ensure that incentives encourage the provision
of services, particularly for the cognitively impaired.
Despite the desire of many nursing homes to expand into subacute care and assisted living,
demand for traditional long-term custodial care will continue. A minority of elders with severe
disabilities without adequate informal support and housing will rely on nursing homes in the
twenty-first century. One important question that few nursing homes have addressed is how to
create environments that do not mimic hospitals, but that provide homey, inviting living spaces.
Nursing homes also need to pay more attention to the visual and auditory limitations of residents,
to minimize glare, improve acoustics, and create environments that lessen confusion and
encourage independence.
This paper has identified the integration of services as an emerging issue in long-term care policy.
To date, rhetoric about integration has been much stronger than reality. The extent to which rhetoric
becomes reality depends, in part, on the degree to which funding for services becomes more
streamlined. The incremental approach to policymaking perpetuates fragmentation. But the
movement toward managed care for the elderly may provide an infrastructure that permits better
coordination and integration of services for the chronically disabled. This can happen, however, only
if the initiatives move beyond integration of governance and administration to integration of
providers and services.
As noted earlier, the first generation of SHMO experiments failed to integrate care because of a
lack of communication and coordination between acute and long-term care providers. We have a lot to
learn from the PACE programs, which have successfully integrated care for elders with chronic
disabilities living in the community. The challenge will be to figure out how to expand integrated
models of service delivery to a larger population, which includes both disabled and nondisabled
individuals. There, integration may delay or minimize further deterioration of elders’ ability to
function and lessen their need for more costly interventions.
With the increased focus on measurements of outcome and evidence-based medicine in order to
judge the quality of care supplied by providers, researchers in academic and clinical settings have
been developing protocols for managing the treatment of chronically disabled patients. Most activity
has been in the management of diseases like diabetes. But a number of providers, including several
members of the National Chronic Care Consortium, are developing protocols that recognize multiple
comorbidities and functional limitations; these protocols assess and monitor the social, as well as the
medical, needs of the chronically disabled. These tools, however, are only as good as the information
they are based upon. While managed care organizations and provider organizations talk a lot about
the need to manage patients, they are loath to invest substantial sums in data systems that will not
significantly enhance quarterly earnings. Policymakers in the private and public sectors must consider
integrated management information systems as essential investments that may be costly in the short
run but that can cut costs and improve the quality of care later on.

Milbank Memorial Fund56
One unresolved issue is the extent to which services can be integrated when one entity is
responsible for both funding and clinical outcomes, as in some type of capitated, managed care
system. I believe that good coordination of services and systems, with regular communication
between providers, shared data, and involvement of the individual and family in care planning, can
indeed be achieved without fully integrated financing. Management of transitions—from the
hospital to a nursing facility to the individual’s home, or even from formal home health care to
informal care at home—must be coordinated and monitored to ensure continuity of care in
appropriate settings. This may be hard to achieve when no one is sure who bears responsibility
for what. Effective care management and linked information systems, however, may make it
possible to coordinate acute, post-acute, and long-term care service delivery successfully without
formal integration.
The concept of elderly people as health consumers will probably continue. As new generations of
elders are better educated and more sophisticated about the health and long-term care marketplace, a
demand for more consumer-directed care is likely to grow. Long-term care policymakers have been
ambivalent about this movement. On one hand, the prospect of less bureaucracy and lower
administrative costs, coupled with a philosophy that reflects the “rugged individualism” of the
American psyche, is appealing. On the other, policymakers have been concerned about consumer
control. If the ultimate in consumer-direction—cash payments—were allowed, many fear that the
dollars would be misused by the elders or their families. The belief still prevails that elderly
individuals, including those who are cognitively intact, are not willing or able to make prudent
choices. Providers with a vested interest in care industries are reluctant to give up clients who may
prefer to hire and fire their own workers or pay a family member to provide care. Many providers, and
some consumer advocates, argue that poorer care with less oversight and monitoring may jeopardize
the health and well-being of elders with disabilities.
More flexibility and choice for the consumer also mean more personal responsibility. The
expansion of consumer-directed care requires a serious educational campaign so that elders and their
families understand the tradeoffs and risks involved in choice. At the same time, they need guidance
in how to become an empowered consumer, including how to select the best and most cost-effective
service, how to be an employer, and when to consider giving up some consumer control.
One controversial aspect of this emerging trend is its challenge to regulations that are meant to
improve care in nursing facilities and at home. Strict regulatory standards are difficult, if not
impossible, to enforce in a consumer-directed environment. Furthermore, many advocates view this
strict regulation as antithetical to the philosophy of consumer direction, which is built on individual
autonomy and choice, including the chance to make mistakes. A consumer-directed service delivery
system must encourage the development of new ways to ensure high-quality care. This includes
empowering individuals and their families to monitor the quality of care, providing avenues for
rectifying problems through government authorities and other intermediary organizations, and
making information on quality outcomes available to elderly consumers.

Milbank Memorial Fund57
One successful approach to monitoring quality in nursing homes and, to a lesser extent, in board
and care and individual homes has been the long-term care ombudsman program. Initially authorized
by the Older Americans Act in the 1980s, this program established an ombudsman office in each state
to develop a nonregulatory approach to monitoring care in nursing homes, including identification of
potential resident abuse. The LTC ombudsman program has suffered from insufficient funding and
relies heavily on a volunteer network. Strengthening this program, both politically and financially,
would help the development of a consumer-directed delivery system.
The future of long-term care service delivery suggests these points:
• Families and friends, especially women, will remain the primary long-term care providers and the
mainstay of long-term care delivery into the foreseeable future.
• The growth in the number, proportion, and diversity of elderly people with disabilities calls for
the development of a range of delivery options to meet the individual’s needs and to continue
meeting them as needs and family situations change.
• Technological advances and the adoption of universal design principles in housing will encourage
the expansion of the formal home care market.
• Policymakers will have to develop affordable residential care options that offer a broad range of
services, as well as room and board.
• The nursing home will remain a necessary option for elders with severe disabilities with
insufficient informal support and inadequate living arrangements.
• Policymakers and providers will continue to struggle to integrate primary, acute, and long-term
care services needed by elderly individuals with disabilities. This effort must include more
experimentation with models that coordinate services without requiring full financial and clinical
integration.
• Future cohorts of elders will be more educated about long-term care options. Many consumers
will prefer to organize and manage their own care and will seek information to guide
their choices.
I M P A C T O N W O R K F O R C E D E V E L O P M E N T A N D T R A I N I N G
The lack of a trained workforce is the biggest problem in long-term care policy. The graying of
America and the growth of a more chronically, rather than an acutely, disabled population, cry out for
health and long-term care professionals who understand how to treat the whole individual and the
family. This paper has pointed out the current dearth of physicians, nurses, therapists, and social
workers who have geriatric training. In their zeal to encourage primary care expertise, policymakers
have woefully neglected skills that will be essential for meeting the needs of tomorrow’s elderly. This
indifference to geriatrics is exemplified by the small geriatric branch in the Health Resources and
Services Administration of the U.S. Department of Health and Human Services.
Milbank Memorial Fund58
More resources must be devoted to the development of geriatric training at professional schools,
in residency and fellowship programs, and as part of in-service programs. As policymakers debate
whether to cut the money for graduate medical education provided through Medicare, it will be
difficult to argue that some of that money should be redirected toward geriatrics. On the other hand,
future generations of health professionals will be ill-equipped to care for elders with disabilities if we
continue to ignore the problem.
We also need more research and demonstration projects that develop and test new curricula to
attract trainees entering the health and long-term care professions into geriatrics. This includes
more model development and evaluations of training materials and techniques that work best in
different settings. Acute and long-term care providers must jointly offer integrated settings where
physicians, nurses, and therapists can learn how to coordinate services and manage care across time
and care environment. Most of the limited federal support for geriatric training comes from the
National Institute on Aging; the John A. Hartford Foundation is currently the only major nonprofit
source of funding for experimentation in this area. A major educational campaign is required to
encourage other funders in the public and private sectors to invest in this critical area of
professional development.
Perhaps the most important implication of this paper is the looming crisis in the availability of
committed, qualified paraprofessionals to provide basic long-term care services to elders with
disabilities in institutions and in the community. The trends that warrant the most serious attention
include the increased educational status of women, particularly minority women, in the new century
and the tightening of federal policies to limit immigrants coming to the United States for family
unification. These combined trends could significantly reduce the pool of potential workers
interested in being employed by nursing homes, home care agencies, or individuals and their
families. While there is no way to predict the future health of local economies across the country,
when unemployment is low, the competition for low-wage workers will also affect the pool of
potential caregivers.
To ensure an adequate workforce, priorities must include incentives for recruitment and
retention of paraprofessional workers—monetary incentives like wages and benefits and intrinsic
incentives like opportunities for career advancement. In addition, we must begin to explore the
development of alternative labor pools, including older women and men who may want to continue
working following formal retirement, former welfare recipients who see this opportunity as a prudent
career move, and employees of temporary agencies. We must also develop continuing training
programs that periodically update paraprofessionals about new advances and technologies that will
improve the efficiency and quality of their work. A special emphasis on culturally sensitive caring
techniques will be required as intra- and intergenerational relationships become more racially and
ethnically diverse.
Finally, in this new age of the consumer, we must not forget that individuals also need
information and training in how to manage their own care and the work of caregivers. As more elders

Milbank Memorial Fund59
become computer-proficient, it may be possible to develop software and interactive programs that
provide training to people with disabilities in their own homes. Families too will require better
training about the aging process and the management of long-term care services, as well as training in
how to be an effective caregiver without burning out. Policymakers must understand that creating an
informed consumer has budgetary consequences. Resources will be required to develop and
disseminate training materials and programs for consumers.
These issues surrounding workforce development and training are compelling:
• The demand for a trained professional and paraprofessional workforce to address the long-term
care needs of elders with disabilities will increase dramatically in the future.
• Policymakers must work with educators in the health professions to develop and disseminate
geriatric training programs—formal and in-service—for physicians, nurses, social workers, and
others in allied health fields.
• Financial incentives must accompany a fundamental shift in training so that people seeking
careers in the health professions choose to work in geriatrics.
• The shortage of paraprofessional long-term care workers will continue. Policymakers must
encourage and assist providers in developing incentives—better wages and benefits, career
ladders, and worker empowerment—to attract, train, and retain qualified people for these jobs.
• Policymakers must work with the public and private sectors to offer training to unpaid,
“informal” caregivers and to individuals with disabilities who want to manage their own care.

Milbank Memorial Fund60
While there is no clear recipe for balancing public and private financing, several elements are
essential to the design and implementation of a long-term care system for the future. First, the system
should address the long-term care needs of people of all ages, recognizing that services and other
accommodations must be tailored to people with varying degrees of physical and mental impairment.
Second, the long-term care system must be sensitive to the needs of the family as well as those of the
person who needs long-term care. Although formal care should not, and probably will not, replace the
efforts of family and friends, the repertoire of services should build the family into the process and
ensure that the family is supported.
The future long-term care system should also recognize all the options that can meet the
residential and care needs of the individual and recognize that these needs do not necessarily increase
in neat, predictable steps. The system must be flexible enough to address the acute, chronic, and
nonmedical social needs—such as housekeeping and transportation—of the long-term care client,
which may fluctuate over time. Clients who prefer more autonomy should have that option, although
they should recognize the tradeoffs involved in managing their own care, including the possibility that
their health and safety could be jeopardized.
In the ideal world, public and private dollars would follow the person, rather than the provider.
Individuals and their families would have the ability to make choices that reflect their preferences
and values, within the financial constraints set by public programs and their private resources. Such
a system would require major restructuring of our current public programs so that funding sources,
including Medicare, Medicaid, and state funds, become truly seamless. While not essential, it would
also be beneficial for individuals, their families, and other surrogate decision makers to have access
to care managers or intermediaries who could assist them in navigating the system and making the
best choices.
Whether we like it or not, long-term care is coming of age. It will be one of the major challenges
of the twenty-first century. We can wait for the crisis to hit, or we can actively develop financing,
delivery, and training strategies that build on the lessons learned from the successes and failures in
our own country and other nations—strategies that strike the right balance between public and private
resources and that recognize that the long-term client and family must be directly involved in the
process of care.
C O N C L U S I O N
Milbank Memorial Fund61
AARP: American Association of Retired Persons. 1998a. Across the States 1998: Profiles of Long-Term
Care Systems, 3rd ed. Washington, D.C.
AARP. 1998b. Boomers Approaching Midlife: How Secure a Future? Washington, D.C.
Alecxih, L.M. 1997a. What Is It, Who Needs It, and Who Provides It? In Boyd, ed. (1997), 1–17.
Alecxih, L.M. 1997b. Who Pays, How Much? In Boyd, ed. (1997), 19–27.
Alliance for Aging Research. 1996. Will You Still Treat Me When I’m 65? Washington, D.C.
American Physical Therapy Association. 1998. Number of Certified Clinical Specialists in Physical
Therapy, 1985–1998. Alexandria, Va.
American Physical Therapy Association. 1999. PT Membership Demographics: Type of Facility in Which
Members Work. Available at http://www.apta.org/research/pt_fac.html.
Arno, P.S., C. Levine, and M.M. Memmott. 1999. The Economic Value of Informal Caregiving. Health
Affairs 18(2):182–8.
ASPE: The Assistant Secretary for Planning and Evaluation and AoA: The Administration on Aging.
1998. Informal Caregiving: Compassion in Action. Washington, D.C.
Atchley, R.C. 1996. Frontline Workers in Long-Term Care: Recruitment, Retention, and Turnover Issues in
an Era of Rapid Growth. Oxford, Ohio: Scripps Gerontology Center at Miami University.
Banaszak-Holl, J., and M.A. Hines. 1996. Factors Associated with Nursing Home Staff Turnover.
Gerontologist 36(4):512–7.
Besdine, W.B. 1994. Geriatrics Content in Residency Curricula. American Journal of Medicine
97(supplement 4A):10S–12S.
Besl, J.R., and B.D. Kale. 1996. Older Workers in the 21st Century: Active and Educated, A Case Study.
Monthly Labor Review 119(6):18–28.
BHPr: Bureau of Health Professions. 1998. Division of Nursing: Notes from the National Sample Survey
of Registered Nurses, March 1996. Washington, D.C.: U.S. Department of Health and Human Services.
Available at http://158.72.83.3/bhpr/DN/sample.htm.
R E F E R E N C E S

Milbank Memorial Fund62
Bishop, C.E. 1999. Where Are the Missing Elders? The Decline in Nursing Home Use 1985 and 1995.
Health Affairs 18(4):146–55.
BLS: Bureau of Labor Statistics. 1997. 1996 National Occupational Employment and Wage Data:
Service Occupations. Washington, D.C.: U.S. Department of Labor. Available at
http://www.bls.gov/oes/national/oes_serv.htm.
BLS: Bureau of Labor Statistics. 1998a. Annual Average Tables from the January 1998 Issue of
Employment and Earnings: Employed Persons by Detailed Occupation, Sex, Race, and Hispanic Origin.
Washington, D.C.: U.S. Department of Labor: Available at http://stats.bls.gov/cpsaatab.htm.
BLS: Bureau of Labor Statistics. 1998b. Employment Projections. Washington, D.C.: U.S. Department
of Labor. Available at http://stats.bls.gov/emphome.htm.
BLS: Bureau of Labor Statistics. 1999a. 1998-1999 Occupational Outlook Handbook: Homemaker-Home
Health Aides. Washington, D.C.: U.S. Department of Labor. Available at
http://stats.bls.gov/oco/ocos173.htm.
BLS: Bureau of Labor Statistics. 1999b. 1998-1999 Occupational Outlook Handbook: Occupational
Therapists. Washington, D.C.: U.S. Department of Labor. Available at
http://stats.bls.gov/oco/ocos078.htm.
BLS: Bureau of Labor Statistics. 1999c. 1998-1999 Occupational Outlook Handbook: Occupational
Therapy Assistants and Aides. Washington, D.C.: U.S. Department of Labor. Available at
http://stats.bls.gov/oco/ocos166.htm.
BLS: Bureau of Labor Statistics. 1999d. 1998-1999 Occupational Outlook Handbook: Physical
Therapists. Washington, D.C.: U.S. Department of Labor.
Booth, M., J. Fralich, P. Saucie, R. Mollica, and T. Riley. 1997. Integration of Acute and Long-Term Care
for Dually Eligible Beneficiaries through Managed Care. Technical assistance paper prepared by the
Muskie School of Public Service, University of Southern Maine, and the National Academy for State
Health Policy, under a grant from the Robert Wood Johnson Foundation Medicare/Medicaid
Integration Program.
Boyd, B.L., ed. 1997. Long-Term Care: Knowing the Risk, Paying the Price. Washington, D.C.: Health
Insurance Association of America.

Milbank Memorial Fund63
Branch, L.G., R.F. Coulam, and Y.A. Zimmerman. 1995. The PACE Evaluation: Initial Findings.
Gerontologist 35(3):349–59.
Burbridge, L.C. 1993. The Labor Market for Home Care Workers: Demand, Supply, and Institutional
Barriers. Gerontologist 33(1):41–6.
Bureau of International Labor Affairs. 1997. Developments in International Migration to the United
States: 1997. Washington, D.C.: U.S. Department of Labor.
Camarota, S.A. 1998. The Wages of Immigration: The Effect on the Low-Skilled Labor Market.
Washington, D.C.: Center for Immigration Studies.
Campbell, P. 1997. Population Projections: States, 1995–2025 (Current Population Reports, P25–1131).
Washington, D.C.: U.S. Bureau of the Census.
Cohen, M.A. 1997. Future Directions. In Boyd, ed. (1997), 147–65.
Cohen, M.A. 1998. Emerging Trends in the Finance and Delivery of Long-Term Care: Public and
Private Opportunities and Challenges. Gerontologist 38(1):80–89.
Colves, A., and M. Blanchet. 1983. Potential Gains in Life Expectancy Free of Disability: A Tool for
Health Planning. International Journal of Epidemiology 12(2):224–9.
Congressional Budget Office. 1999. CBO Memorandum: Projections of Expenditures for Long-Term Care
Services for the Elderly. Washington, D.C.
Coronel, S. 1998. Long-Term Care Insurance in 1996. Washington, D.C.: Health Insurance Association
of America.
Costa, P.T., T.F. Williams, M.S. Albert, et al. 1996. Recognition and Initial Assessment of Alzheimer’s
Disease and Related Dementias (Clinical Practice Guideline No. 19, AHCPR Publication No. 97-0702).
Washington, D.C.: Agency for Health Care Policy and Research.
Council on Aging of the Cincinnati Area, Inc. 1997. Hamilton County’s Elderly Services Program
(unpublished document).
Counsell, S.R., P.R. Katz, J. Kuruza, and G.M. Sullivan. 1994. Resident Training in Nursing Home
Care: Survey of Successful Educational Strategies. Journal of American Geriatrics Society 42(11):1193–9.

Milbank Memorial Fund64
Crimmins, E.M., Y. Saito, and D. Ingegneri. 1997. Trends in Disability-Free Life Expectancy in the
United States: 1970–1990. Population and Development Review 23(3):555–73.
Crown, W.H., D.A. Ahlburg, and M. MacAdam. 1995. The Demographic and Employment
Characteristics of Home Care Aides: A Comparison with Nursing Home Aides, Hospital Aides, and
Other Workers. Gerontologist 35(2):162–70.
Day, J., and A. Curry. 1998. Educational Attainment in the United States: March 1997 (Current
Population Report, P20-205). Washington, D.C.: U.S. Bureau of the Census.
Doty, P., A.E. Benjamin, R.E. Matthias, and T.M. Franke. 1999. In-home Supportive Services for the
Elderly and Disabled: A Comparison of Client-directed and Professional Management Models of Service
Delivery. Nontechnical Summary Report, U.S. Department of Health and Human Services Assistant
Secretary for Planning and Evaluation, Office of Disability, Aging and Long-Term Care Policy.
Washington, D.C.
Employment, Inequality. 1997. Migration News 4(12). Available at
http://migration.ucdavis.edu/mn/mntxt.html.
Feder, J., and J. Lambrew. 1996. Why Medicare Matters to People Who Need Long-Term Care. Health
Care Financing Review 18(2):99–112.
Feldman, P.H. 1994. “Dead End” Work or Motivating Job? Prospects for Frontline Paraprofessional
Workers in LTC. Generations 23(2):5–10.
Feldman, P.H. 1997. Labor Market Issues in Home Care. In Fox and Raphael, eds. (1997), 155–83.
Fix, M., and J.S. Passel 1994. Immigration and Immigrants: Setting the Record Straight. Washington,
D.C.: Urban Institute.
Fox, D.M., and C. Raphael, eds. 1997. Home-Based Care for a New Century. Malden, Mass.: Blackwell.
Friedland, R.B. 1990. Facing the Costs of Long-Term Care. Washington, D.C: Employee Benefit
Research Institute.
Friedland, R.B., and L. Summer. 1999. Demography is Not Destiny. Washington, D.C.: National
Academy on an Aging Society.

Milbank Memorial Fund65
Friedlob, A. 1993. The Use of Physical Restraints in Nursing Homes and the Allocation of Nursing
Resources (unpublished doctoral dissertation). Minneapolis, Minn.: Health Services Research and
Administration, University of Minnesota. Cited by Kane, R.A. (1997). Boundaries of Home Care: Can a
Home-Care Approach Transform LTC Institutions? In Fox and Raphael, eds. (1997), 23–46.
Fullerton, H.N. 1997. Labor Force 2006: Slowing Down and Changing Composition. Monthly Labor
Review 120(11):23–38.
Gage, B., M. Moon, L. Nichols, et al. 1997. Medicare Savings: Options and Opportunities. Washington,
D.C.: Urban Institute.
GAO: General Accounting Office. 1994. Long-Term Care: Diverse, Growing Population Includes Millions
of Americans of All Ages. Washington, D.C.: U.S. Government Printing Office.
Gonzales, C. 1994. Subacute Care: Preparing for a New Market. Provider 20:55–6.
Graves, N., and R. Bectel. 1996. Across the States 1996: Profiles of Long-Term Care Systems. Washington,
D.C.: American Association of Retired Persons.
Greenwald, M. 1998. Testimony to Senate Special Committee on Aging, March 9, 1998.
Gruenberg, L., A. Rumshiskaya, and J. Kaganova. 1993. An Analysis of Expected Medicare Costs for
Participants in the PACE Demonstration. Presented before the PACE annual demonstration meeting.
Cited by Stone, R.I. (1997). Integration of Home- and Community-Based Services: Issues for the 1990s.
In Fox and Raphael, eds. (1997), 71–98.
Harvell, J. 1997. Subacute Care: Its Role and the Assurance of Quality. In Newcomer, Wilkinson, and
Lawton, eds. (1997), 37–59.
Hawes, C., M. Rose, C.D. Phillips, and V. Iannacchione. 1999. A National Study of Assisted Living for
the Frail Elderly: Results of a National Telephone Survey of Facilities. Beachwood, Ohio: Menorah Park
Center for the Aging.
Hawes, C., J.B. Wildfire, and L.J. Lux. 1993. Regulation of Board and Care Homes: Results of a Survey in
the 50 States and the District of Columbia: National Summary. Washington, D.C.: American Association
of Retired Persons.

Milbank Memorial Fund66
Himes, C.L. 1992. Future Caregivers: Projected Family Structures of Older Persons. Journal of
Gerontology: Social Sciences 47(1):S17–S26.
Hobbs, F.B., and B.L. Damon. 1996. 65+ in the United States. Washington, D.C.: U.S. Bureau of the
Census.
How Will You Pay for Your Old Age? A Special Report on Long-Term Care Insurance. 1997 (October).
Consumer Reports 62(10):36–50.
Hyatt, L. 1993. ASCA Unites Subacute Care Professionals. American Subacute Care Association
Quarterly 3(1).
IOM: Institute of Medicine. 1996. Nursing Staff in Hospitals and Nursing Homes: Is It Adequate?
Washington, D.C.: National Academy Press.
Jackson, B., and P. Doty. 1997. Unmet and Undermet Need for Functional Assistance among the U.S.
Disabled Elderly. Paper presented at the annual meeting of the Gerontological Society of America,
Cincinnati.
Kane, R.A. 1997. Boundaries of Home Care: Can a Home-Care Approach Transform LTC Institutions? In
Fox and Raphael, eds. (1997), 23–46.
Kane, R.A., R.L. Kane, L.H Illston, J. Nyman, and M. Finch. 1991. Adult Foster Care for the Elderly in
Oregon: A Mainstream Alternative to Nursing Homes? American Journal of Public Health 81(9):1113–20.
Kane, R.A., R.L. Kane, and R.C. Ladd. 1998. The Heart of Long-Term Care. New York: Oxford
University Press.
Kane, R.L., R.A. Kane, M. Finch, et al. 1997. S/HMOs, the Second Generation: Building on the
Experience of the First Social Health Maintenance Organization Demonstrations. Journal of the
American Geriatrics Society 45(1):101–7.
Keigher, S., and R.I. Stone. 1992. Payment for Care in the U.S.: A Very Mixed Policy Bag. Paper presented
at the International Meeting on Payment for Dependent Care, Vienna, Austria. Cited by Stone, R.I.
(1997). Integration of Home- and Community-Based Services: Issues for the 1990s. In Fox and Raphael,
eds. (1997), 71–98.

Milbank Memorial Fund67
Kenney, G., S. Rajan, and S. Soscia. 1998. State Spending for Medicare and Medicaid Home Care
Programs. Health Affairs 17(1):201–12.
Komisar, H.L., and J. Feder. 1998. The Balanced Budget Act of 1997: Effects on Medicare’s Home Health
Benefits and Beneficiaries Who Need Long-Term Care. New York: The Commonwealth Fund. Available
at http://www.cmwf.org/fraileld/kobba258.html.
Komisar, H.L., J.M. Lambrew, and J. Feder. 1996. Long-Term Care for the Elderly. New York: The
Commonwealth Fund.
Kunkel, S.R., and R.A. Applebaum. 1992. Estimating the Prevalence of Long-Term Disability for an
Aging Society. Journal of Gerontology: Social Sciences 47(5):S253–S260.
Larson, R. 1998. As America Ages, Physicians Specialize in Care of Elderly. Insight 14(14):40–1.
Leon, J., and S.J. Franco. 1998. Home and Community-Based Workforce. Bethesda, Md.: Project HOPE
Center for Health Affairs.
Linsk, N., S. Keigher, and L.G. Simon-Rusinowitz. 1992. Wages for Caring: Compensating Family Care
of the Elderly. New York: Praeger. Cited by Stone, R.I. (1997). Integration of Home- and Community-
Based Services: Issues for the 1990s. In Fox and Raphael, eds. (1997), 71–98.
Litwak, E., and C.F. Longino. 1987. Migration Patterns among the Elderly: A Developmental
Perspective. Gerontologist 27(3):266–72.
Longino, C.F. 1998. Geographic Mobility and the Baby Boom. Generations 22(1):60–4.
Lutzky, S., J. Corea, L. Alecxih, L. Marburger, and K. Wee. 1999. Preliminary Data from a Survey of
Employers Offering Group Long-Term Care Insurance to Their Employees: Interim Report. Prepared for
the Department of Health and Human Services, Office of Disability, Aging and Long-Term Care.
Washington, D.C.
Malone, J.K., D. Chase, and J.L. Bayard. 1993. Caring for Nursing Home Residents. Journal of Health
Care Benefits 2(3):51–4.
Manard, B., C. Perrone, S. Kaplan, K. Beig, N. Junior, and A. Keiller. 1995. Subacute Care: Policy
Synthesis and Market Area Analysis. Washington, D.C.: Lewin-VHI for Office of the Assistant Secretary
for Planning and Evaluation. Cited by Harvell, J. (1997).

Milbank Memorial Fund68
Manchester, J. 1997. Aging Boomers and Retirement: Who’s at Risk? Generations 21(2):19–22.
Manton, K.G., L. Corder, and E. Stallard. 1997. Chronic Disability Trends in Elderly United States
Populations: 1982–1994. Proceedings of the National Academy of Sciences of the U.S.A. 94:2593–8.
Manton, K.G., R. Newcomer, G. Lowrimore, J. Vertrees, and C. Harrington. 1994. Social Health
Maintenance Organization and Fee-for-Service Health Outcomes over Time. Health Care Financing
Review 15(2):173–202.
McCall, N. 1997. Insurance Regulation and the Partnership for Long-Term Care. Journal of Insurance
Regulation 16(1):73–101.
McCall, N., S. Driver, E. Bauer, and J. Knickman. 1997. The Partnership for Long-Term Care: Who
Are the Partnership Policy Purchasers? Medical Care Research and Review 54(4):472–89.
Meiners, M., and H. McKay. 1989. Developing Public-Private Long-Term Care Insurance Partnerships.
Pride Institute Journal 8(4):35–40.
Mollica, R.L. 1998. State Assisted Living Policy: 1998. Washington, D.C.: Office of the Assistant Secretary
for Planning and Evaluation. Available at http://aspe.os.dhhs.gov/daltcp/reports/98state.htm.
Mollica, R.L., and K.I. Snow. 1996. State Assisted Living Policy: 1996. Report prepared under contract
DHHS-100-94-0044 for the U.S. Department of Health and Human Services, Washington, D.C.
Murtaugh, C.M., P.G. Kemper, and B.C. Spillman. 1990. The Risk of Nursing Home Use in Later Life.
Medical Care 28(10):952–62.
NAHC: National Association for Home Care. 1997. Basic Statistics about Home Care 1997. Washington,
D.C. Available at http://www.nahc.org/Consumer/hcstats.html.
NAIC: National Aging Information Center. 1996. Aging into the 21st Century. Washington, D.C.: U.S.
Administration on Aging.
National Academy on Aging. 1997. Facts on Long-Term Care. Washington, D.C. Available at
http://geron.org/NAA/ltc.html.
National Council on Aging. 1997a. Nearly 7 Million Americans Provide Long-Distance Care to Elders and Make
Sacrifices in Their Work and Personal Lives. Available at http://www.ncoa.org/press/7millLTC031297.htm.

Milbank Memorial Fund69
National Council on Aging. 1997b. Paying for Long-Term Care is Bigger Worry than Paying for
Retirement, Americans Say. Available at http://www.ncoa.org/press/ltc_survey_results0297.htm.
Newcomer, R., K. Manton, C. Harrington, C. Yordi, and J. Vertees. 1995a. Case Mix Controlled Service
Use and Expenditures in the Social/Health Maintenance Organization Demonstration. Journal of
Gerontology: Medical Sciences 50A(1):M35–M44.
Newcomer, R., S. Preston, and S. Roderick. 1995b. Assisted Living and Nursing Unit Use among
Continuing Care Retirement Community Residents. Research on Aging 17(2):149–67.
Newcomer, R.J., A.M. Wilkinson, and M.P. Lawton, eds. 1997. Annual Review of Gerontology and
Geriatrics, vol. 16. New York: Springer.
Newcomer, R., K.B. Wilson, and P. Lee. 1997. Residential Care for the Frail Elderly: State Innovations
in Placement, Financing, and Governance. In Newcomer, Wilkinson, and Lawton, eds. (1997), 162–82.
OSHA: Occupational Safety and Health Administration. 1998. Workplace Injury and Illness Statistics.
Washington, D.C.: U.S. Department of Labor. Available at http://www.osha.gov/oshstats/bls/.
Polniaszek, S.E. 1997. Consumer Issues. In Boyd, ed. (1997), 129–46.
Rice, D. 1996. Beneficiary Profile: Yesterday, Today, and Tomorrow. Health Care Financing Review
18(2):23–46.
Rother, J. 1997. Retirement 2020: Boomer Trends. Presented to the Senate Special Committee on
Aging, July 25, 1997.
Rother, J. 1998. Two-Tier System with Play-or-Pay Option (internal AARP document). Washington,
D.C.: American Association of Retired Persons.
RWJF: Robert Wood Johnson Foundation. 1996. Chronic Care in America: A 21st Century Challenge.
Eatontown, N.J.
Schneider, U. 1997. Germany’s New Long-Term Care Policy: Profile and Assessment of the Social
Dependency Insurance. Policy paper #5 of the American Institute for Contemporary German Studies.
Washington, D.C.: Johns Hopkins University Press.

Milbank Memorial Fund70
Shank, G. 1999. Public Relations at American Occupational Therapy Association
([email protected]). (April 2, 1999). 1997 AOTA Member Composition Survey. E-mail to the author.
Shen, J.K. 1993. Program of All-Inclusive Care for the Elderly (PACE). From Session 9 of Long-Term
Care: A Workshop for Senior State and Local Health Officials, Miami. Cited by Stone, R.I. (1997).
Integration of Home- and Community-Based Services: Issues for the 1990s. In Fox and Raphael, eds.
(1997), 71–98.
Sherwood, S., and R. Morris. 1983. The Pennsylvania Domiciliary Care Experiment: Impact on
Quality of Life. American Journal of Public Health 73(6):646–53.
Shield, R.R. 1996. Managing the Care of Nursing Home Residents: The Challenge of Integration. In
Newcomer, Wilkinson, and Lawton, eds. (1997), 60–77.
Simpkins, R.W. 1997. Using Task Lists with Unlicensed Assistive Personnel. Insight 6(2). Available at
http://www.ncsbn.org/files/insight/vol62/tasklist.html.
Singleton, G.W. 1993. Subacute Care: An Emerging Industry. Brown University Long-Term Care Quality
Letter 5(1).
Smith, J.P. 1997. The Changing Economic Circumstances of the Elderly: Income, Wealth, and Social
Security. Syracuse, N.Y.: Syracuse University Press.
Spector, W.D., J.D. Reschovsky, and J.W. Cohen. 1996. Appropriate Placement of Nursing-Home
Residents in Lower Levels of Care. Milbank Quarterly 74(1):139–60.
Spillman, B., N. Krauss, and B. Altman. 1997. A Comparison of Nursing Home Resident Characteristics:
1987–1996 (unpublished paper). Rockville, Md.: Agency for Health Care Policy and Research.
Stone, R.I., and R.E. Katz. 1996. Thoughts on the Future of Integrating Acute and Long-Term Care. In
Newcomer, Wilkinson, and Lawton, eds. (1997), 217–47.
Stone, R.I., and P. Kemper. 1989. Spouses and Children of Disabled Elders: How Large a Constituency
for Long-Term Care Reform? Milbank Quarterly 67(3–4):485–506.
Stone, R.I., and P.F. Short. 1990. The Competing Demands of Employment and Informal Caregiving
to Disabled Elders. Medical Care 28(6):513–26.
Milbank Memorial Fund71
Treas, J. 1995. Older Americans in the 1990s and Beyond. Population Bulletin 50(2):2–46.
Treas, J., and C.F. Longino. 1997. Demography of Aging in the United States. In Gerontology:
Perspectives and Issues, ed. K. Ferraro, 19–50. New York: Springer.
U.S. Administration on Aging. 1998. Projections of the 65+ Population in States: 1995 to 2025.
Washington, D.C.
U.S. Bureau of the Census. 1996. Population Projections of the United States by Age, Sex, Race, and
Hispanic Origin: 1995 to 2050: Current Population Reports, P25-1130. Washington, D.C.: U.S.
Government Printing Office.
U.S. Bureau of the Census. 1998a. Housing Vacancies and Homeownership: Annual Statistics: 1997.
Available at http://www.census.gov/hhes/www/housing/hvs/annual97/ann97ind.html.
U.S. Bureau of the Census. 1998b. Percent of People 25 Years Old and Over Who Have Completed High
School or College, by Race, Hispanic Origin and Sex: Selected Years 1940–1998. Available at
http://www.census.gov/population/socdemo/education/tablea-02.txt.
Who Makes What: Contemporary Long Term Care’s 1998 Nursing Staff Survey. 1998. Contemporary
Long Term Care 21(5):43–51.
Wiener, J.M., and J. Skaggs. 1995. Current Approaches to Integrating Acute and Long-Term Care
Financing and Services. Washington, D.C.: American Association of Retired Persons.
Wolf, D.A., B. Freedman, and B.J. Soldo. 1997. The Division of Family Labor: Care for Elderly
Parents. Journal of Gerontology: Special Issue 52B:102–9.

Milbank Memorial Fund72
Robyn I. Stone, DrPH, is a noted researcher and internationally recognized authority on health care
and aging policy. In June 1999, she joined the American Association of Homes and Services for the
Aging to establish and oversee the Institute for the Future of Aging Services. She is the Institute’s
executive director.
Dr. Stone has held senior research and policy positions in both the federal government and the
private sector. During the Clinton Administration, she served in the U.S. Department of Health and
Human Services as Deputy Assistant Secretary for Disability, Aging, and Long-term Care Policy from
1993 through 1996 and as Assistant Secretary for Aging in 1997. In the 1980s and early 1990s, she was
a senior researcher at the National Center for Health Services Research and at Project HOPE’s Center
for Health Affairs. Dr. Stone has served on the staff of two national task forces, the 1989 Bipartisan
Commission on Comprehensive Health Care (the Pepper Commission) and the 1993 Clinton
Administration Task Force on Health Care Reform.
Dr. Stone is a distinguished speaker and has been published widely in the areas of long-term care,
chronic care for the disabled, and family caregiving. Her doctorate in public health is from the
University of California, Berkeley.
T H E A U T H O R

Milbank Memorial Fund73
A complete list of the Fund’s reports may be viewed online at www.milbank.org. Reports published
since 1993 are available electronically. Single or multiple copies of reports that have print editions are
available without charge while supplies last.
Emergency Preparedness, Bioterrorism, and the States: The First Two Years after September 11by Gerald Markowitz and David Rosner
2004 92 pages
Evidence-Based Mental Health Treatments and Services: Examples to Inform Public Policyby Anthony F. Lehman, Howard H. Goldman, Lisa B. Dixon, and Rachel Churchill
2004 44 pages
Addressing the HIV/AIDS Pandemic: A U.S. Global AIDS Strategy for the Long Termco-published with the Council on Foreign Relations
2004 44 pages
Evaluating Health Services: A Reporter Covers the Science of Research Synthesisby Ray Moynihan
2004 64 pages
Making Sense of the System: How States Can Use Health Workforce Policies to Increase Access andImprove Quality of Careby Edward Salsberg
co-published with the Reforming States Group
2003
Available electronically only at
http://www.milbank.org/reports/2003salsberg/2003salsberg.html
Food Safety Updated: Developing Tools for a More Science- and Risk-Based Approachby Michael R. Taylor, Margaret O’K. Glavin, J. Glenn Morris, Jr., and Catherine E. Woteki
co-published with Resources for the Future
2003 56 pages
Implementing the Resident Assessment Instrument: Case Studies of Policymaking for Long-Term Care in Eight Countries2003
Available electronically only at
http://www.milbank.org/reports/interRAI/030222interRAI.html
September 11 and the Shifting Priorities of Public and Population Health in New York
S E L E C T E D P U B L I C A T I O N S O F T H EM I L B A N K M E M O R I A L F U N D

by David Rosner and Gerald Markowitz
2003 68 pages
Rebalancing Long-Term Care in New Jersey: From Institutional toward Home and Community Careby Susan C. Reinhard and Charles J. Fahey
2003
Available electronically only at
http://www.milbank.org/reports/030314newjersey/030314newjersey.html
2000-2001 State Health Care Expenditure Reportco-published with the National Association of State Budget Officers and the Reforming States Group
2003 92 pages
Proactive Hazard Analysis and Health Care Policyby John E. McDonough
co-published with ECRI
2002 36 pages
Achieving Better Health Outcomes: The Oregon Benchmark Experienceby Howard M. Leichter and Jeffrey Tryens
2002 60 pages
2001 Robert H. Ebert Memorial Lecture: Health Care Quality and How to Achieve Itby Kenneth I. Shine
2002 24 pages
Informing Judgment: Case Studies of Health Policy and Research in Six Countriesco-published with the Cochrane Collaboration
2001 212 pages
1998-1999 State Health Care Expenditure Reportco-published with the National Association of State Budget Officers and the Reforming States Group
2001 204 pages

Milbank Memorial Fund
645 Madison Avenue
New York, NY 10022
©2000 Milbank Memorial Fund
The Milbank Memorial Fund is an endowed
operating foundation that engages in
nonpartisan analysis, study, research, and
communication on significant issues in
health policy. Since 1905 the Fund has
worked to improve and maintain health by
encouraging persons who make and
implement health policy to use the best
available evidence. The Fund convenes
meetings of leaders in the public and
private sectors and publishes reports,
books, and the Milbank Quarterly, a
multidisciplinary journal of population
health and health policy.
This report may be redistributed electronically
or in print as long as it remains wholly intact,
including this notice and copyright.
ISBN 1-887748-38-5
Design and Typography:
The Boland Design Company