Embed Size (px)
Citation preview
1
This report was commissioned by the Social Protection Department of the WorldBank and financed by the Austrian trust fund. Bernd Dobesberger, Fritz Dorau,Brigitte Mühlböck, Josef Punz and Marius Wilk generously helped with datacollection and insider information. Natalia Pakhomova assisted in dataprocessing. Thanks to Amit Dar, Andrea Ichino, Robert Holzmann, WilhelmKohler, Josef Zweimüller as well as seminar participants in Vienna andWashington, D.C. for helpful comments. The views in this paper are those of theauthor and not necessarily those of the associated institutions.
Long-term consequences of an innovativeredundancy_retraining project:The Austrian Steel Foundation
by
Rudolf Winter-EbmerUniversity of Linz, Austria
WIFO Vienna, CEPR, London and IZA, Bonn
Working Paper No. 0029December 2000
DDEEPPAARRTTMMEENNTT OOFF EECCOONNOOMMIICCSS
JJOOHHAANNNNEESS KKEEPPLLEERR UUNNIIVVEERRSSIITTYY OOFF LLIINNZZ
Johannes Kepler University of LinzDepartment of Economics
Altenberger Strasse 69A-4040 Linz - Auhof, Austria
www.economics.uni-linz.ac.at
*) corresponding author:[email protected]
phone +43 (0)70 2468 -8236, -8238(fax)

2
Abstract
In the late 1980s privatization and down-sizing of nationalized steel mills and related
firms in the metal industry have lead to large-scale redundancy plans. A special Steel
Foundation was created as part of a social plan. This foundation acted like an independent
training center, where displaced workers would spend relatively long training periods
(sometimes several years), obtaining personality and orientation training, as well as formal
education. The last step of the integrative program was placement assistance as well as
assistance for creating one’s own business. The foundation was financed by (higher)
contributions from unemployment insurance funds, by the previous firms themselves, as well
as by a collectively-bargained special tax on the remaining workers in the steel firms.
Moreover the trainees themselves would have to support the foundation by giving up the
interest accruing to their redundancy payments.
I use combined data from Austrian social security records and from the Employment
Service to look at participation decisions and on post-foundation economic performance, i.e.
days worked and wage growth. As a control group I take all displaced workers from the firms
who formed the foundation, using Instrumental Variables to solve the selection problem. The
results show considerable wage gains – even for a period of five years after leaving the
Foundation –as well as improved employment prospects. Finally, a cost-benefit analysis is
performed to assess the long-term success of the Foundation.
JEL: H43, I21, J53, J65, J58.
Keywords: Labor market programs, evaluation, cost-benefit analysis, instrumental variables.

3
1. Introduction
Structural change in industries often leads to mass redundancies. If these layoffs are
concentrated geographically and affect groups of workers with very specific human capital,
serious problems in local labor markets can arise. Governments and firms typically design
special plans to cope with such problems.
A good case in point are steel-workers. Steel as well as iron production has decreased
considerably in the last two decades in most Western European countries. Employment of
steel workers in the European Community decreased by 45 % in the period 1974 - 1985
(Irsigler, 1990, p. III) and by 23 % in Austria. Moreover, steel workers are characterized by a
strong regional concentration and a particular specificity of knowledge and training.1
Considering possible policy measures, one has to distinguish between reactions to
transitory and structural overmanning. Both transitory as well as permanent shock can be seen
from an equity or an efficiency point of view. Efficiency considerations for transitory shocks
might be concerned with excessive costs of workers’ moving back and forth between
industries and regions, whereas in the case of permanent shocks firms might want to avoid the
cost of delaying adjustments. Distributional considerations in both cases rely to displaced
workers social hardships.
In the case of transitory overmanning it can be hoped that the redundant workers can
find a similar job in the near future. Typical policy measures would include temporary
layoffs, cuts in working hours with partial compensation, or even reductions in pay. Within
Europe unilateral reductions in the contractionally negotiated wage are only possible in Spain
(Toharia and Ojeda, 1999). In Germany and Switzerland a similar option is
"Änderungskündigung" which means dismissal of (all) workers with the option of altered
conditions in employment (Heseler and Mückenberger, 1999). In France, and especially in
Italy, the arrangement of temporary short-time work has long been a dominating policy
measure. In the eighties Italian expenditures for short-time earnings compensation have
always been higher than expenditures for unemployment benefits themselves (Carabelli et al.,
1999, p. 342).2
Policies for permanent redundancies have to be different, because due to the underlying
structural shifts, the fall in employment prospects is lasting. Typical measures include early
retirement, social plans, as well as retraining programs and placement assistance. Whereas the
1 See Davis et al. (1996, p. 112 f) for a picture of the restructuring process in the U.S. steel industry.2 See also Mosley and Kruppe (1996) for an evaluation of short-time schemes.

4
former policies can be considered as passive measures, the latter try to improve the
functioning of the local and regional labor market.3
In this paper I portray an innovative policy measure for structural employment problems:
the Austrian Steel Foundation, which started to operate in 1987. The Foundation is unique in
its purpose. It tries to combine job-search assistance with psychological counseling, retraining
and occupational re-orientation. It is also unusual in its broad-based financial structure. Aside
from public money, part of the financing comes from trainees themselves, from the displacing
firm as well as from the remaining part of the work force. Moreover, the Steel Foundation
serves as a role model for other firm-specific regional or industry-specific foundations that
spread out in the 1990s all over Austria. By 1998 more than 90 - mostly small - foundations
had been formed. During the year of 1998 a total of 5596 persons were at one point of time
members of such foundations, most of them only for a short time. The yearly average was
3011 persons (AMS, 1999, 29).
In the next section labor market institutions in Austria are presented, with a special
emphasis on rules governing displacement as well as on social programs towards alleviating
impacts of the severe steel crises on workers. In section 3, the organization of the Steel
Foundation is presented focusing on the funding of the Foundation as well as the training
concept, which stresses the longer-term view. Section 4 discusses previous evaluations of the
Foundation and describes the data to evaluate the labor market effects of the Foundation.
Improvements in employment and wages relative to a control group of displaced workers
from the steel firms are used as the evaluation target. Section 5 aims at a cost-benefit analysis
of the Foundation and section 6 concludes and points towards some deficiencies of the
analysis.
2. Institutions in Austria and labor market policies
In the aftermath of World War 2 the Austrian steel industry - together with major other
parts of industry and banking - was nationalized, in part to prevent expropriation by the
Russian Army. As late as 1987, Austrian nationalized industries employed 18% of all
manufacturing workers (Irsigler, 1990, p. 22). Steel production was heavily concentrated in
the city of Linz and in several places in the province of Styria. Starting in 1975 mounting
3 The U.S. Trade Adjustment Assistance (TAA) program, available since 1962, is one of the first comprehensivepolicy measures which combines job search assistance with re-training for a very specific group of workers(Decker and Corson, 1995).

5
financial losses became a problem, especially in 1984 and 1985 with losses of one billion
Dollars each (Kodré and Buchegger, 1998, p. 33). After a new management took office
considerable and almost permanent re-organization in the firm structure started in 1986,
although substantial privatization of the steel industry (VÖEST-Alpine) did not occur until
1994.
Employment in all nationalized industries in Austria decreased between 1987 and 1991
by 32% - from 95.000 to 64.800 workers (Steininger, 1993, p. 3). In the steel industry itself
the number of employees was reduced by 23% between 1986 and 1988 alone. Relative job
losses were concentrated in the steel centers: job losses in the steel industry in Linz between
1974 and 1994 amounted to 10% of jobs at large (Neuhofer, 1996, p. 465).
The combination of a nationalized firm with heavy influence of politics and the unions,
and a high regional and occupational concentration of the structural crisis made coping with
the necessity of downsizing difficult.4 This explains the large number of passive and active
labor market policies, which have been applied in this case. Moreover, job security provision
is highly regulated in Austria.5
The rules for individual layoff distinguish between cases involving criminal acts and
gross misconduct, on the one hand, and cases based on economic conditions like redundancy
and the professional suitability of the employee, on the other hand. The former category
generally allows summary dismissal without compensation. The latter category involves
statutory procedures, which have to be followed. The Protection Against Dismissal Law
applies to all firms with at least 5 employees and requires the approval of the works council in
case of a layoff. Wrongful termination lawsuits are seldom and mostly result not in
reinstatement but in the payment of a financial compensation. General severance pay in the
case of layoff – which was available only for white-collar workers before - has recently also
been introduced for blue-collar workers and is determined by length of service and the wage
level.
Rules for mass redundancies require 30 days of notification to the employment office. In
general, this obligation exists for a layoff of more than 5% of the workforce, but is more
compelling for larger firms; specifically for firms with more than 1000 workers, any
redundancy concerning more than 50 persons has to be notified. Mass dismissals have
increasingly been accompanied by a social plan agreed upon between management, unions
4 See Kerz (1991) for an analysis of firm strategies in the U.S. and European steel industries concerning subsidylevels, personnel policies and the occurence of social plans.5 Following Emerson (1988) it is amongst the most highly regulated countries in Europe.

6
and sometimes the government. For firms with more than 200 employees, a special arbitration
body has been established for the case of disagreement of management and works council.6
These relatively rigid labor relations called for a concerted action, i.e. an agreement
between the management, the unions and eventually the government. Up to the early 1980s
displacement of workers in Austria’s nationalized industries was very uncommon, temporary
overmanning problems were typically resolved by a combination of voluntary turnover e.g.
exits into retirement, and temporary recruitment stops. From 1983 onwards, special early
retirement programs were designed. Males (females) working in the metal industry - and in
mining - could claim early retirement pensions already at age 57 (52). Due to the acute steel
crisis in 1986 and 1987, the age limits were even reduced to 55 for men and 50 for women. In
exchange for this "publicly-financed social plan" the management had to hire young workers
in a certain proportion (Kodré and Buchegger, 1998, p. 34).
These measures can be seen as company-specific legislation and are therefore - besides
its very high costs for the old-age pension system - highly debatable in terms of politicking
and equity considerations. The following measure tried to avoid these problems by designing
a more general applicable program. Starting in 1988 workers who were above age 50 and
have lived and worked in so-called "crises-counties" could claim unemployment benefits for a
larger period as compared to other job seekers. Their maximum benefit duration was extended
from 52 to 209 weeks. Although this measure was certainly planned and designed as a further
relief program for the restructuring of Austrian nationalized industries, its wider applicability
made it more prone to abuse. In fact, it can be shown that employers - also outside the steel
industry - took advantage of this program by displacing elderly workers by a larger scale
(Winter-Ebmer, 1996, 1998) - which contributed not only to a significant temporary rise in
unemployment rates of the elderly, but also to the final abolishment of the law in 1993.
3. Organization of the Steel Foundation
Following the example of a similar German foundation in Saarland (Saarstahl
Völkingen, 1987) the Steel Foundation was founded in 1987. The organization and the
financial structure of the Foundation were negotiated extensively between management and
the works council. This corporatist character can be seen in subsequent agreements
concerning wage bargaining, but also in the management of the Foundation itself. Three
6 See Winter-Ebmer (2000) for an analysis of displacement risk by firm type.

7
members of the works council together with three managers from the steel firms form the
executive board of the Foundation.
Already in 1987 twelve firms joined the Foundation, by 1988 22 firms had joined.
Owing to restructuring and outsourcing processes, many new firms were founded in the next
decade, so that by 1998 58 firms had participated, some of which are not active any more.7
3.1 Funding and financial organization
The financial organization of the Foundation is unique in a sense that all associated
actors participate in funding: this includes the trainees themselves, the firms and the
remaining workers in these firms as well as the local government. This complicated financial
structure can be understood as a structure to alleviate incentive problems of the associated
groups. For instance, the financial participation of the remaining workforce can be interpreted
as an efficient bargaining of the unions, they accept lower wages in exchange for an
employment guarantee – not necessarily on the shop floor but including the workers in the
Foundation. The firms obviously have an incentive to deviate from this efficient bargaining
solution – back to the labor demand curve; they do not do so, because the involvement of the
local government, as well as the labor office make deviations very visible.
The steel firms contributed a one-time grant of ATS 10 Millions ($ 710,000), a yearly
allowance (see below), as well as a subsidy-in-kind: training facilities and machinery at the
shop floor, as well as educated trainers together with the personnel of the Foundation as such.
Trainees themselves had to deposit 50% of their contractual severance pay - up to a
maximum of ATS 100,000 ($ 7,100). The interest thereof fell to the Foundation. The
remaining workers in the steel firms paid 0.75% (up from 11/1989 only 0.25%) of their gross
wages into the Foundation. Moreover, the firms themselves augmented these "solidarity
contributions" by 50% as a matching grant. (Steininger, 1993, p34).8 The early reduction in
the contributions of the remaining workforce was caused by the relatively low number of
trainees in the first years – which led to significant reserve funds. These contributions of the
7 Bernd Dobesberger, Steel Foundation, personal communication.8 This matching is sensible, because the firms save on the employers’ contributions to social security funds,which are approximately of this order.

8
remaining workforce were negotiated in a collective bargaining agreement, which is binding
for all workers.9
On the other hand, the trainees are allowed to collect unemployment benefits for a
longer period of time while being a member of a foundation. A new law in 1988 has increased
potential unemployment duration from 20, 30, 39, 52 weeks - the maximum duration given a
certain work experience - to a period of 3 years (later 4 years). This extended duration is
possible only for trainees who are members of a foundation, which is formally licensed by the
labor office. On top of this extended benefit duration, trainees receive a special scholarship,
which initially amounted to ATS 2,900 ($ 207) per month. Due to an initiative of the Steel
Firms’ management, in 1993 the scholarship was increased to ATS 5,800 ($ 414) a month.10
The reason was that the management wanted to give incentives also for highly qualified
workers to join the Foundation – which would lead to voluntary quits of more experienced
and therefore highly-paid workers.
Apart from interest from reserves and contributions from the local government, 43% of
the budget in 1998 was contributed by the firms, only approximately 2-3% by the trainees
themselves. 36% came from the solidarity wage restraint by the remaining workers. The rest
(18%) is paid again by the firms, but it corresponds roughly to saved social security
contributions of the employers – owing to the lower wage sum.11
Total costs per trainee and year in 1998 were ATS 66,000 ($4,700) for scholarships and
family allowances plus ATS 80,000 ($ 5,700) as other costs (infrastructure, trainers, seminars,
etc.). These calculations do not include the prolonged duration of unemployment benefits. The
additional costs of trainees in terms of additional unemployment benefits are difficult to
assess: trainees stay on average 18 months with the Foundation. The mean unemployment
benefit (AMS 1999) amounts to ATS 9000 ($ 640, plus 24.5% as contribution to the social
security funds) per month. To calculate the additional costs one would have to estimate the
potential unemployment duration of trainees had they not participated in the Foundation. This
is not done here. A simple comparison of mean Foundation duration (18 months) and mean
unemployment duration of workers coming from the manufacturing sector (5 months) results
9 In fact, in 1987 collective bargaining in the metal industry resulted in a wage raise by 1.75%. For workers inthe Steel Foundation firms this raise was reduced by a special contract between management and works councilto 1.0%.10 A ceiling guarantees that all payments - unemployment benefits, scholarship and a small family allowance -are below 100% of the previous take-home pay. A further ceiling requires benefits plus six seventh of thescholarship to be below 80% of previous take-home pay.11 Financial report of the Foundation, 1998.
9
in 13 additional months, which would bring the total cost of one trainee – during his stay in
the Foundation – to ATS 365,000 ($ 26,100).
It is interesting to see that trainees, on the one hand, contribute money to the Foundation,
but, on the other hand, they obtain a scholarship. Financially, the contribution of trainees can
be considered largely as symbolic. At an interest rate of, say, five percent they pay at a
maximum ATS 5,000 ($ 360) per year, but will receive ATS 35,000 ($ 2500, they received
ATS 70,000 = $5000 after 1992). There are some distributional effects, which are still
financially rather minor: more tenured and higher-paid workers can expect higher severance
pay, which will lead to a larger contribution. On the other hand, financial benefits of the
Foundation are bigger for low-income individuals - because of the flat-rate scholarship and an
upper ceiling for unemployment benefits.
Having said this, it is always financially profitable for all workers to join the Foundation,
once they loose their job. Why are only a small percentage of workers actually joining? I will
give an answer to this question in section 4.2 as well as in the conclusions.
3.2 Training and re-qualification
Apart from the financial attractiveness for potential trainees, the Foundation has a rigid
structure. Laid off workers who are accepted must commit to a full-time re-training program
and obey the rules of the Foundation - otherwise they risk to get expelled. One of the rules is
compulsory attendance in all training courses, which are in principle 38.5 hours a week.12
Other rules govern the choice - and possibly changes - of the educational and professional
plan for the trainee; i.e. a trainee cannot unilaterally choose a professional goal, if the
Foundation's management considers the goal as not marketable. The major difference between
the Steel Foundation and other retraining programs is the sophisticated and long-term oriented
view of re-qualification and occupational reorientation of workers. This is an important point
regarding the permanent and regionally highly concentrated loss of jobs. Simply adding
marginal improvements to the highly specialized skills of redundant steel workers seems
inappropriate in such a situation (Steininger, 1993, 70).
The timing of a typical trainee in the Foundation can be described along the lines of
Figure 1. All workers entering the Foundation undergo a six-week occupational orientation
seminar, which should clarify the further steps: either direct outplacement and job-search,

10
formal education or a project to start a new enterprise. Only 17% of trainees leave the
Foundation very early or opt for outplacement without training. 49% of trainees choose
occupational qualification, whereas 29% start (or continue) a formal education in schools or
universities. Around 3.4% try to start a new firm (see Table 1).
Special features exist for workers above age 50 and those who are hard-to-place because
of health problems. The support from the Foundation can last up to 4 years. Qualification
measures are targeted towards the elderly. It can include practical training in firms, but re-
training is not necessarily full-time – as it is for younger workers. Moreover, the placement
strategies are more often revised. Elderly and hard-to-place workers have also the option to
return to the Foundation in case they loose a temporary job they have taken.
3.2.1 Occupational orientation seminar
The first six weeks are spent in small groups of 10-15 trainees together with a
professional trainer, in most cases psychologists or counselors. The idea is to motivate the
participants to take initiative and define - together with the trainer - an occupational and
educational plan, which will be the basis for a new professional career. This task is
challenging because almost 50% of trainees are above age 30, and have therefore already a
fixed job profile, which is often difficult to change. Moreover, coming from a nationalized
firm with de facto job guarantee might reduce initiatives for re-orientation.
With continuous psychological help - also from external institutions - the seminar starts
with communication and social skills. Self-consciousness and self-esteem is trained, exercises
in introspection and self-knowledge shall help to analyze what the individual wants to do.
Socio-psychological tests for occupational competence, together with an analysis of the past
career and external labor market trends, shall provide the participant with a clearer view about
his possible second career.
Within these six weeks the participant must present a detailed and formal occupational
and educational plan to the group and to officials from the labor office, which can in turn be
corrected and changed by the Foundation's managers, but is binding from then on. The plan
can mean immediate outplacement, re-qualification or the formation of a new business.
3.2.2. Training programs
12 See Irsigler (1990, App 8) for the rules of the Foundation.

11
Qualification can mean higher qualification in the previously practiced occupation or a
complete re-orientation in a new field. The trainees can choose courses offered by the
Foundation itself – mainly shorter language skills, mathematics, software and communication
and presentation techniques. On the other hand, trainees can attend courses at established
training organizations and also formal education at schools (evening school) and universities.
All training courses must be full-time training and require strict attendance and
documentation in form of certificates. (Steininger, 1993, p115f). For some qualification
measures – i.e. apprenticeship training – training-on-the-job is required. In these cases
training places in firms on a voluntary basis are organized. Training – especially technical
training as an apprentice - is also possible in the apprenticeship-training center of the original
steel firm.
Of those who do make a training plan, 65% choose occupational qualifications, whereas
35% take up formal education (Table 1). The vast majority of those in occupational re-
training receive training in technical occupations, followed by commercial ones. Similarly,
most of those in formal education take up secondary technical schooling.
3.2.3. New firm formation
If a trainee designs a project for a new firm, (s)he will benefit from special assistance in
the project planning and project management phase. The concept will get counseling from
internal and external experts, it has to be presented at meetings with the employment office
and the Foundation managers, who can decide on the implementation of the project. The
trainee can obtain special training measures necessary for firm formation, i.e. in the case a
trade license is necessary, etc. The Foundation itself hosts a project center, where basic
infrastructure like telecommunication services and administrative facilities are available.
Until 1998, 108 projects have been started; among them 44 have been successful (Table
2). Most of the projects are in the field of consulting and services, but some concern also
machinery and energy and environmental technology. A proper assessment of the success of
the firm formation program is outside the scope of this report.
3.2.4. Outplacement
The outplacement phase can come after a formal education or training or immediately after
the occupational orientation seminar, if the individual does not want to change his

12
occupational profile. It can last for up to four months; if no job is found, the individual has to
redefine his target or leave the Foundation. In the outplacement phase assistance is given for
regular job-search activities, which reach from software assistance for writing CVs and
application letters to trade directories, access to lists of vacancies and the like. Presentation,
communication and the use of new communication technologies is trained, IQ tests as well as
personality tests are made and analyzed. Moreover, recruitment situations and job interviews
are simulated and analyzed by video recording (Steininger, 1993, p98f). 13
4. Evaluation of the Foundation
The evaluation will concentrate on direct impacts of the Foundation on employment and
wages of participants. Other aims of the Foundation are not assessed. For instance, the
management of the ongoing steel firms is also,, or primarily interested in the Foundation in
order to assure a smooth process of restructuring and downsizing, which is unhindered by
labor disputes and strikes14. This is especially valuable because these firms are formerly
nationalized firms with implicit job-guarantees. As any other social plan, the Foundation
alleviates large downsizing programs, which was the motivation for the management to
discuss the Foundation concept in the first place. These aspects, as well as feedback effects on
the local labor market, are very difficult to assess and are not investigated here.
The central problem of evaluation research is the counterfactual nature of the situation.15
The researcher wants to know what the wage or employment situation of the trainee would
have been, had s(he) not taken place in the training program. As the trainee cannot be
observed in this state, a suitable control group has to be used. In the literature, different
control group concepts have been used: the trainee himself before the training (pre-post-
comparison), a group of other comparable workers (classical control group approach) or
completely matched trainee-control groups in a real social experiment framework.16
13 See Davy et al. (1995) on the effectiveness of formal outplacement strategies.14 See e.g. the statement of a steel manager (Dipplinger, 1991, p.81), see also Seckauer (1997) who conductedinterviews with unionists, members of the chamber of commerce and managers at the local employment office.On the other hand, union officials complain that downsizing will be too easy for firms and no strikes are possibleany more (Seckauer, 1997, p. 53).15 See Heckman, LaLonde and Smith (2000) for a discussion of basic issues, as well as a survey on theeffectiveness of labor market programs in the U.S. See Dar and Gill (1995) for an assessment of transferabilityof retraining programs to countries in transition and Winter-Ebmer and Zweimüller (1996) for an evaluation oftraining programs in Austria.16 In accordance with the literature, feedback effects on local labor markets – especially indirect effects uponmembers of the control group are neglected. This procedure seems to be valid, given the relatively small numberof trainees in each year as compared to the local labor market. See e.g. Heckman, Lochner and Taber (1998) whofind big general equilibrium effects for a universal program in education.

13
Moreover, with the exception of a perfect social experiment, selection into the program is a
prime issue: participants can be expected to join the program exactly because they expect
higher returns from the program than non-participants – which will bias the evaluation results.
Although many evaluations of the Steel Foundation have been done in the last 10 years,
none of these has used a proper control-group setting. Some evaluations have looked only at
the expectations of trainees at entry into the Foundation (Nigsch, 1991, 1995). Most other
publications as well as official bulletins of the Foundation use the immediate exit status of
trainees as a success criterion (Eder, 1997, Voest-Alpine Stahlstiftung, 1998): 72% of trainees
find a new job directly after leaving the Foundation. This measure can be problematic from an
external point of view. It looks only at one point in time. Moreover, the duration of trainees in
the Foundation is variable, and it ends by definition if the trainee finds a new job.
Lechner and Reiter (1991) collected questionnaire information on 120 former trainees,
who were asked about their current situation as compared to their pre-training situation in the
steel firm.17 Only 4% of interviewees were unemployed at the time of the interview. 27% of
trainees experienced a drop in incomes, whereas 29% reported rising wages by more than
10%.18 Losers were predominantly workers above age 35, who had to change their
occupation. Whereas in other situations the pre-training careers of trainees themselves may
serve as a valid control group, in this case, this is highly improbable. Due to high unionization
in the nationalized firms, wage levels in the steel firms were generally relatively high, so that
a displaced worker from one of these firms must expect considerable wage cuts if he starts a
job with a firm in the private sector. Therefore, reliable assessments of the contribution of the
Foundation on wage growth can only be made if an appropriate control group is used.
4.1. Data
In the following analysis I use all available data on trainees in the Steel Foundation from
1987 to 1998. Due to data anonymity procedures, the collection and matching of data turned
out rather complicated. Basic information on members of the Steel Foundation was received
from the Foundation itself, corresponding employment histories were collected from the
Social Security Administration (Hauptverband der Sozialversicherungsträger) and information
17 In a similar project, Gerich (1997)collected 256 interviews with trainees from other foundations in UpperAustria.18 From the report it is not clear, whether nominal or real wages were asked. The proportion of winners issomewhat lower in a later interview in 1994 conducted by the Foundation itself (90 persons). Given the figures Ireport in Section 4.4, it seems evident that many persons reported nominal wage increases.

14
about unemployment spells as well as educational attainment was received from the Austrian
Labor Office (AMS). I could use information for 2098 individuals (trainees), 38 persons of
the original data could not be matched because of inconsistent social security numbers. As
practically all data – except the information on specific training programs for the trainees –
come from administrative data sources, high reliability can be assumed. These employment
and income data serve the purpose of either being the basis for old age retirement pensions or
the basis for the calculation of unemployment benefits in case of unemployment, which will
reduce possible measurement errors. On the other hand, demographic information could only
be gained by the matching of the two administrative data sources.
The control group consists of all workers who worked with one of the Steel Firms, left
them after 1986 and fell unemployed in the same or the next year. A unique firm identifier
serves to collect these workers from the Social Security Administration files. Unfortunately
not all firm identifiers could be received from the different local Social Security
Administrations, because some small firms were not active anymore.19 Therefore I ended up
with workers from 36 firms participating in the Foundation. 15,293 persons build the control
group.
This control group is not the only possible choice. I could have used all workers having
been dismissing by one of the participating firms. I excluded those workers who did not claim
unemployment benefits right after leaving these firms, i.e. those who found immediately a
new job. Those who never fell unemployed are supposedly a positively selected group,
whereas the value of the Steel Foundation – similar to any other labor market program -
should be judged against the experience of those who are unemployed at some point in time.20
Figure 2 serves as a guideline as to which workers were included in the control group and
which were not. As the data contain only the sum of workdays and unemployment days
during a calendar year, but not the exact dates during the years, I chose the following
procedure: Workers who did not claim unemployment benefits (person 4) in the year after
loosing the job with the steel firm were excluded, whereas those who did so at least in the
following year (persons 1 and 2) were included. This procedure mitigates the previously
mentioned effect somewhat: workers who were displaced and never fell unemployed in the
current and the next year were excluded from the control group, whereas those who succeeded
to find a job immediately but lost it over the next year are part of the control group.
19 The problem was somewhat aggravated because all identifiers had to be anonymously transferred between 5different institutions.20 For those who never fell unemployed crucial information about education, family situation and occupation isnot available in any case.

15
How do I judge the success of the program? Most program evaluations look at the time
spent unemployed or being in a program as the prime success indicator. This point of view is
not appropriate for a longer-term oriented training and occupational reorientation program
such as the Steel Foundation. Here, the main intention is not to provide jobs for trainees as
quickly as possible, but to assure long-term job prospects. Therefore, the evaluation must
concentrate on labor market indicators after leaving the Foundation and disregard the
immediate exit from the Foundation as a success indicator. I define the calendar year
following exit from the Foundation as the first year to start the evaluation process (year t+1 in
Figure 2). Accordingly for controls, year t+1 will be the year after the first unemployment
spell after leaving the Steel Firm. In order to properly address these long term aspects, I
construct a five-year observation period for trainees and controls in such a way (see again
Figure2).21 In all evaluations to come I compare outcomes in year t+i (I=1-5) for trainees with
outcomes in year t+i for controls.
A further argument concerns the comparison of the Steel Foundation with other training
programs in Austria - which are in most cases less expensive. In fact, this would be the
appropriate cost-benefit analysis. Unfortunately, it was impossible to find comparable other
training programs, which concerned also steel workers highly concentrated in specific regions
of the country.
Table 3 presents basic statistics of the trainees and controls. Trainees are on average
younger than displaced workers who did not join the Foundation. They have the same tenure
in the steel firm. Trainees on average spend 18 months in the Foundation. The social security
administration records only monthly incomes, up to the social security contribution ceiling.22
If workers are employed for less than a month in a firm, the administration calculates a
hypothetical monthly income. If a worker has worked for several firms in a year, I use only
the highest wage. Wages shown in Table 3 are real wages based on 1986 ATS. For the
presentation of wages I used the same selection as used in Section 4.4. Low wage workers and
those above the social security contribution ceiling were excluded (see below); also workers
below age 17 at the time of redundancy were excluded from the sample.
21 One problem of this kind of analysis is that controls might be unable to find a job in year t+1, my firstevaluation year, whereas trainees – who are taken out of the labor market for one and a half year on average –will have enough time and assistance to locate a job immediately after the end of the Foundation’s guidance. Onecan argue that this guidance is exactly the purpose of the Foundation – and should be checked correspondingly.This argument is less problematic, once I compare job market outcomes in year t+3 and t+4 following thetraining. Moreover, I also performed some sensitivity checks where I systematically postponed year t+1 by oneyear for the control group only with the argument, that year t+1 for controls would be not comparable with yeart+1 for trainees. Regression results – which did not change the results qualitatively are available upon request.22 App. 5% of displaced workers have wages above the social security contribution ceiling.
16
There is some indication of selection processes as can be seen by previous wages.
Trainees have considerably higher wages before redundancy as well as after. For both groups
wages drop in the first year after the redundancy, but regain lost ground later on. The number
of employment days with different firms over a year was summed up to give an employment
indicator. As all workers were employed yearlong in the Steel firms before the redundancy
only employment and unemployment days after redundancy are shown. Again, trainees have
considerably higher employment days in all five years after separation. Likewise their number
of unemployment days is significantly lower.
In the next section I will explore the participation decision, whereas the following
sections will investigate employment and wage effects of the Foundation for its members.
4.2. Participation in the Foundation
As there are high financial incentives to join the Foundation, it is astonishing that only
12% of eligible displaced workers actually did join. One reason may be the requirement for
full-time retraining which may discourage some workers who do not want to reorient their
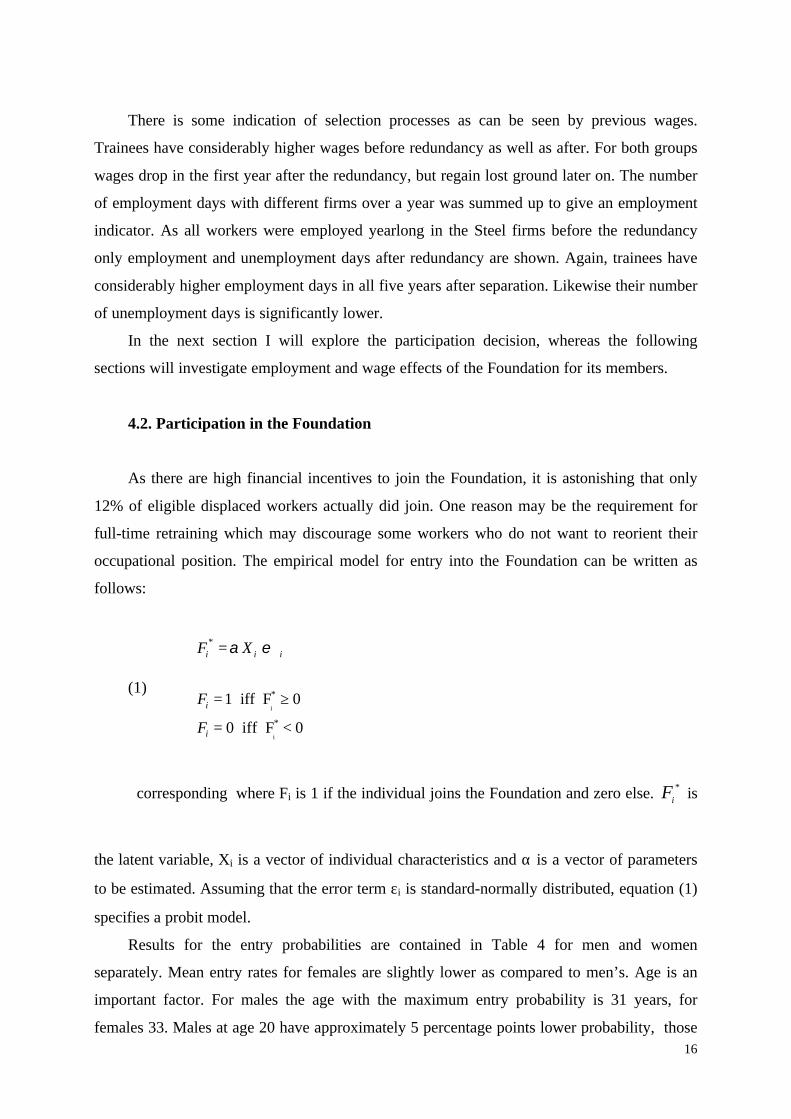
occupational position. The empirical model for entry into the Foundation can be written as
follows:
(1) i
i
*
*
*
1 iff F 0
0 iff F 0
i i i
i
i
F X
F
F
α ε= +
= ≥
= <
corresponding where Fi is 1 if the individual joins the Foundation and zero else. *
iF is
the latent variable, Xi is a vector of individual characteristics and α is a vector of parameters
to be estimated. Assuming that the error term εi is standard-normally distributed, equation (1)
specifies a probit model.
Results for the entry probabilities are contained in Table 4 for men and women
separately. Mean entry rates for females are slightly lower as compared to men’s. Age is an
important factor. For males the age with the maximum entry probability is 31 years, for
females 33. Males at age 20 have approximately 5 percentage points lower probability, those
17
at age 45 have again a 8 percentage points lower probability to join as compared to workers
aged 31 at the time of displacement. More tenured male workers join the Foundation more
frequently, as well as white-collar workers. Workers holding a technical or commercial
middle school, but also those with a general High school as well as apprentices are most likely
to join, whereas those with only elementary school are the least likely among the males.
Foreign citizens are less likely to join whereas workers in metal occupations have the highest
probabilities. Workers with health problems are less like to join the Foundation. These
demographic characteristics of trainees correspond closely to those of trainees in publicly-
financed trainee programs: young men, holding an apprenticeship from metal occupations are
over-represented among trainees as compared to the unemployment pool at large (Blumberger
et al. 1993, p. 96).
Nigsch (1991 and 1995) has investigated expectations and socio-demographic
characteristics of the participants in the Foundation.23 More than 50% of trainees in both
cohorts entered the Foundation because they wanted to start a new education or re-training,
most of them expected primarily to get assistance in occupational re-orientation and
education.
Out of 337 persons asked in 1995, 49% got their first information on the Foundation by
colleagues in the previous firm, 10% by a company newsletter and further 24% by shop
stewards (Nigsch, 1995, p. 66). In rare cases they got information from outside the firm or
from the labor office. Many workers complained that their actual displacement was not
announced before the legally required date and that they got no – or only very late and
hesitant – information about the Steel Foundation (Lechner and Reiter, 1991, p.30).
Moreover, in the early years local shop stewards did not accept the Foundation unequivocally.
Unequal promotion and acceptance of the Foundation can mean that information channels
were different in the various firms who were part of the Steel Foundation and in turn entry
rates among displaced workers were different.
This observation gives us an idea for an Instrumental Variables strategy: As far as the
previous affiliation with a specific firm has no influence on job market prospects in the future
– as can be expected because these firms basically grew out from one big enterprise – the firm
identifiers can serve as a possible instrument to predict membership in the Foundation in
order to cope with the crucial selectivity problem. Therefore, I add 32 firm identifiers as
dummy variables in the entry equation. These firm dummies increase the explanatory power
of the entry regression in Table 4 considerably – for males and for females.

18
Another possible instrument is to rely more directly on information channels.
Prospective Foundation entrants will get their information from former colleagues, who left
the firm one period ago and joined the Foundation. Following this argument, I include the
proportion of redundant workers in each firm and each year who joined the Foundation as an
instrument for individual entry rates. As the firm entry rate in a period is just added up by the
individuals’ entry rates from the same period, I lagged the instrument by one year. Note, that
this instrument varies by firm identifier and year.
4.3. Employment effects
For the actual evaluation I restrict my sample to workers above 16 and below 53 years of
age. Moreover, Foundation members who started a self-employment career were excluded,
because self-employed days are not registered in the data file.
Employment effects of the Foundation will be checked in the five years following exit
from the Foundation. Due to the setup of the data set (see Figure 2) – where employment days
per calendar year are known, but not the exact dates during the year – I took as the first post-
training year the year that followed exit from the Foundation, the first post-displacement year
for controls was defined as the first year following displacement from the steel firm. The
dependent variable is the number of employed days (Yi) per calendar year, which will be
explained by affiliation with the Foundation (Fi) and a vector of other explanatory variables,
which are basically demographic and occupational characteristics measured at the previous
firm (Xi, see footnote to Table 5). Due to lower (0) and upper censoring (365) a Tobit model
is appropriate, where *iY is the underlying latent variable.
(2)
*0
* *i
*i i
*i i
if 0 365
Y 0 if Y 0
Y 365 if Y 365
i i i i
i i
Y F X
Y Y Y
β β η= + +
= ≤ ≤
= <
= >
23 Unfortunately, no corresponding study on non-participants was done.

19
A prime concern in this kind of evaluation is the selection into the Foundation. Only
around 12% of eligible displaced workers choose to participate. In principle they will do so, if
their expected returns from participation exceed their expected costs. In practice, different
arguments are possible why participants are not randomly selected among the displaced
workers, and more importantly, why participants may have different post-training careers as
non-participants would have had. Participants may have higher motivation to be re-trained
and pursue further education. On the other hand, those who think they can easily find a new
job may not take advantage of the Foundation in the first place and search for a job on their
own. This group might as well be a group with better job market prospects.
As discussed in the last section, information about and assessment of the Foundation
were different in the various firms whose displaced workers were eligible to join. Therefore, I
use two Instrumental Variables strategies, i) 32 firm identifiers as dummy variables and ii) the
proportion of redundant workers joining the Foundation in each firm and year – lagged one
period. These instruments influence entry significantly, whereas no impact of affiliation with
a specific firm on subsequent job market careers should be expected.
Heckman, LaLonde and Smith (2000, p.93) argue that an instrumental variables
approach will be invalid, if individuals base their participation on idiosyncratic gains from the
treatment. They frame their critique for the example of using distance-to-college as an
instrument for schooling (Card, 1993). If returns to college are heterogeneous among students,
the instrument distance-to-college will shift participation, but, on the other hand, those who
do go to college from more distant places are those who have relatively large returns to
college, large enough to offset the higher cost of participation. This argument would therefore
invalidate the instrument. For our case of better information in different firms, this argument
should not be important, because those who have less information do not have higher costs of
participating in the Foundation. Insofar as those who have less information about the
Foundation do need a higher motivation or higher expected returns to join anyway, returns by
IV methods will be biased upwards.
In Table 5 employment gains of trainees versus controls are presented using the simple
Tobit as well as the two instrumental variables Tobit24 models. As I can observe up to five
years after completion of the training episode, I merged all observations, which gives an
average impact of the Foundation in the years one to five. Dummy variables for year t+i are
added as well as year dummies for the year of exit from the Steel Firm. Differential impacts in
the first five years after training are investigated in Table 6. For the interpretation of the Tobit

20
coefficients it must be noted that the change in the censored outcome Yi is relevant here,
because workers cannot possible work more than 365 days or less than one day per year. The
change in actual days worked due to participating in the Foundation Fi is given by (Long,
1997, 209)
(3) Pr o
E Y XUncensored X
Fβ
∂=
∂
In the simple Tobit estimate employment of trainees is 45 days higher as compared to
the control group. This must be seen as an average effect over the first five years after exiting
the Foundation. The program impact is even higher if the instrumental variables approach is
used. Irrespective what Instrumental Variables strategy is chosen, trainees work 70-80 days
longer per year than controls. As the sample is mainly comprised of men, the impact for men
only is rather similar. For females program impacts are more imprecisely estimated: Whereas
the simple Tobit impact is significant with 35 days, the two IV estimates range between 5 and
57 days. These inconsistencies can arise because fewer women are in the sample and even
fewer participate in the Foundation. Generally higher impacts for the IV regressions suggest
that the trainees are selected from the a-priori less successful workers.
As the primary sample is rather big, we can look at differential impacts of the
Foundation on different population groups. I present results for age groups and income classes
by quartiles. An interesting age pattern arises: the youngest workers gain the least, whereas
workers above 27 have the highest employment gain from the training in the Foundation. For
workers below age 27 the simple Tobit results are indeed positive and significant, but not the
IV results. This suggests that younger workers have less problems in re-orienting their
occupational career, whereas workers above age 27 need more assistance – most probably
they had also higher tenure with the steel firm in the first place, i.e. a more firm-specific
human capital. Here the difference between Tobit and Tobit-IV results suggests, that among
the young workers, trainees are positively selected, whereas among the older workers, a
negative selection into the Foundation takes place.
In terms of past incomes, the results are more similar. Most training coefficients are
positive and significant (except one negative insignificant coefficient). There is no obvious
pattern by income quantiles, if ever the effect is smaller for the third quantile.
24 I used the STATA module kindly provided by Jonah Gelbach (Univ. of Maryland, College Park).

21
Due to the long duration of the Foundation and the richness of the data, it is possible to
look at medium-term effects of the training measures. Table 6 differentiates training impacts
separately for the first five years after completion of the Foundation. All fifteen regression
coefficients are significantly positive, which means that the trainees profited from the
comprehensive support from the Foundation even five years after leaving. The effect is only
slightly declining over time, when the Tobit or Tobit-IV-1 estimator is used, but not in the
case of Tobit-IV-2.
4.4. Income effects
After inquiring the employment effects of the Foundation I turn now to income effects.
As is typical for administrative data, only monthly incomes are available. The only
information about working hours is a part-time indicator, which is used as a control variable
in the earnings regression. Given the use of monthly earnings, the following results have to be
interpreted with care, because possible impacts of the Foundation on earnings could be caused
by higher productivity as such, which is reflected in higher hourly wages, but also by an
increase in labor supply, i.e. hours per week. The problem seems to be less problematic for
men, who work predominantly a 38.5 hours week. Moreover, part-time work for males in the
steel industry is extremely rare. Nevertheless to reduce biases by having workers with reduced
hours or apprentices, I eliminated workers who had a base monthly income below ATS 8000
(in 1986 real ATS), which is approximately 3% of the sample25. Of course, workers with zero
employment days in a year had to be eliminated, too.
Incomes have to be seen relative to past incomes in the steel firms. Therefore I use wage
growth as a performance indicator. Again, there is a problem of censoring. For those, who
were above the social security contribution ceiling before displacement, wage growth is
impossible to calculate. Therefore I restrain the analysis to workers whose wages were lower
than 2% below the contribution ceiling in the old firm – to allow for some measurement error.
For these workers I can construct earnings growth between period t+k and period t as
(wt+k – wt)/wt:
25 Apprentices could not join the Foundation immediately after completion of their apprentice training, but theycould in principle be part of the control group. This earnings limit should also eliminate apprentices from thecontrol group.

22
(4)
*
0
*
if
else
t k ti i i
t
t k t t k tt k t k
t t
t k t t k t
t t
w wF Z
w
w w w ww C
w w
w w C ww w
γ γ µ+
+ ++ +
+ +
−= + +
− −= ≤
− −
=
Still, the censoring problem in the second period has to be taken into account, which is
the case if earnings in the second period are above Ct+k - the contribution ceiling -, which
varies over time. This results in a Tobit model with varying upper limits. As the censoring is
an un-intentional censoring in this case, i.e. wage growth above the social security ceiling
could well be possible, but cannot be observed in the sample, the right interpretation of the
estimates is to use changes in the latent outcome *
t k t
t
w ww
+ −
as driven by participation in the
Foundation Fi. The coefficient 0γ itself is therefore the appropriate marginal effect.
The impact of the Foundation on earnings growth is on average a gain of 5 percentage
points, when simple Tobit methods are used (Table 7). The impact rises to 6-7 percentage
points whence IV methods are applied. Again, the higher impacts from Instrumental Variables
estimates suggest that participants are negatively selected. The impact of the Foundation is
rather similar for both genders, but less significant for females. It must be noted, though, that
there could be still a problem with working hours for females, if one looks at the high mean
earnings growth of 14%
The pattern for the different age groups is very interesting. Very high effects are
measured for young workers below age 22, still high positive effects for those below age 37,
but no positive impact – even two negative coefficients – can be found for workers above age
36. Again, hours effects could in part influence the very high impact for workers below age
22. This interpretation seems to be consistent with the impacts by income quantiles. Here, the
highest impact is in below the median of the income distribution of the displaced workers,
whereas no notable impact can be found for those above the median. Even if some of these
impacts should be perturbed by hours effects, the positive effect of the Foundation is just
evident in a different way: instead of increasing productivity as such, workers are encouraged
to work long hours. From the point of view of social policy, the effects can be similarly

23
assessed. 26 One problem for this evaluation strategy could be the exclusion of the high-wage
workers due to the censoring problem. Given that no positive impact is found for high-wage
workers, the general impact could be lower, if all high-wage workers would have been
included in the estimation.
Finally, we can look if the impact of the Foundation on monthly earnings is fading over
time. Within the five years after completion of the training, no fading away can be found
(Table 8). This is re-assuring if the impact is to be interpreted as a productivity effect: there is
no reason to believe, that a higher productivity of a worker – brought about by formal
schooling or training – should disappear over time.
An average return of 5-7 percentage points higher wage growth for trainees has to be
compared to returns to formal education in Austria. Fersterer and Winter-Ebmer (2000)
estimate returns to an additional year of education between 1991 and 1997 in the range of 8-
10%, slightly falling over time. How does the return to the training in the Foundation compare
to this? Trainees stay on average 18 months in the Foundation, thereof 6 weeks of
occupational orientation and up to 4 months of outplacement, which leaves roughly more than
a year for real full-time training. The return to this year of training compares well with the
returns to formal education.
4.5. What types of training are the most productive?
In the last Section I try to assess, what types of training are the most successful. There is
some information on the type of training an individual got, with respect to formal or informal
education, but also with respect to the job type the individual wants to be trained. Moreover,
information about the duration in the Foundation is available. Finally, exit from the
Foundation was coded into different categories: if the worker found a new job immediately, if
she was recalled in one of the Steel firms or if she continued education after exiting the
official training in the Foundation. These regressions have to concentrate on trainees alone,
because this information is useful only for them. It has to be noted, that also in this case it has
to be suspected, that selection processes play a role, i.e. how long an individual wants to and
26 These patterns practically reinforce the general earnings pattern for these groups after displacement. Whereasthe whole group of workers in the first quartile (the youngest) experience very high earnings growth, those abovethe median (also those above age 36) experience on average declining wages in this five year period.

24
does stay with the Foundation. Unfortunately, no instrumentation procedure seems possible
for this problem.
Results for employment and wage growth are contained in Table 9. Interestingly,
workers who stayed longer in the Foundation have slightly less employment days, but
considerably less earnings growth. Interpreted with care – because of possible selection
problems – this seems to indicate, that the duration in the Foundation is too long in some
cases.
As expected, workers who opted for outplacement without training, those who continued
with a form of training after leaving the Foundation and those who are expelled from the
Foundation before finishing their training, work less days per year. There are no detrimental
earnings consequences except for those who continue with formal training elsewhere.
Concerning the type of training there seems to be that formal schooling (mainly
technical high school) and training at polytechnics or vocational colleges is most profitable in
terms of higher earnings growth. There is less noticeable impact on days worked. The training
for a construction job as well as for commercial jobs seem the most promising as regards
wages, whereas agricultural jobs and jobs in creative sectors are least promising. Again, there
is not much impact on days worked, except for agricultural jobs.
Separate results by gender and age are presented in the Appendix. Here we see, that long
duration in the Foundation has a significantly negative effect only for the age group above age
27. If trainees opt for outplacement without training or are expelled from the Foundation, both
gender and age groups have significantly less employment days. Differences among the
groups occur concerning the type of training: young workers profit more in terms of
employment if they get formal schooling or attend a polytechnical school. Moreover, the
effect of being trained for a social, agricultural or construction job is more negative for young
workers; women profit more, if they are trained for other service occupations.
Concerning wage growth, again we see that there is no negative duration effect for
younger workers, but for workers above age 27 duration in the Foundation could be too long
already. Young workers profit by a recall into the Steel Firms, they also profit more if they get
a university training, where workers above age 27 profit more from a polytechnical school.
Concerning the type of training we see that young workers profit more from technical, metal
and construction jobs in terms of wages.

25
5. Cost-Benefit analysis
Most labor market programs do not find significant program effects: recently Martin
(2000) for the OECD, Heckman et al (2000) for the U.S. and Fitzenberger and Speckesser
(2000) for Germany found only marginally positive impacts for specific groups in the
population. Due to its comprehensive and long-term oriented structure, sizable positive
employment and wage effects of the Steel Foundation could be found. Therefore, it seems
useful to compare formally costs and benefits of the Foundation in a long-term view. This is
particularly appropriate here, because the benefits of the Foundation are calculated for as long
as five years after quitting the training scheme. Such a formal cost-benefit-analysis is only
rarely done in typical evaluation studies, mainly because in most cases the measured benefits
are small in the first place. It should be noted though, that the costs and especially the benefits
in Table 10 should be seen as approximate figures only, which hinge on a number of
approximations and assumptions. They should give a basic view of the associated dimensions
only.
Costs and benefits are measured in Millions of real Dollars (base 1998). Costs are
basically taken from the books of the Foundation, whereas the benefits are extrapolated life-
time gains from the Foundation based on the regressions in Tables 5 and 7. Some of the costs
are only approximated, because the costs were not directly borne by the Foundation or the
books were not differentiated enough for a proper calculation. For benefits in general lower
bounds of the estimates were used, together with some sensible assumptions for the behavior
of trainees after the five year period, they were observed in the data.
The total costs borne by the Steel firms themselves are 25.1 Million Dollars. This sum
reduces to 20.6 Millions if the contribution to the Foundation due to the matched wage
restraint of the workers is excluded. This sum corresponds to the reduced contributions to
social security funds, the firms can save because of the lower wage bill. The remaining
workforce paid 9 Million Dollars by reducing their wage demands by 0.75 (and later by 0.25)
percent. The contributions of the trainees themselves had to be approximated, because no
actual figures were available. As the trainees had to deposit their redundancy payments, I
calculated a maximal interest loss by using a five percent interest rate and the maximum
deposit of ATS 100,000 and added interest lost on voluntary redundancy pay which was only
required until 1993.27 Moreover, trainees have to incur opportunity costs due to lost income
27 Whereas no details on interest income from contractual redundancy pay was available, the exact amount ofinterest income from voluntary redundancy payments was recorded.

26
during participation. These costs can only be estimated as average wages minus mean
unemployment benefits and stipends. Likewise, public subsidies consisted of direct subsidies
from the local government plus extended unemployment benefit duration for trainees – with
exact figures only for the former. For the latter I assumed 13 months of additional receipt of
unemployment benefits (18 months duration in the Foundation minus five months average
benefit duration for workers in the steel industry) and a mean benefit level of ATS 9000 per
month. These “hidden” costs of the Foundation – together with lost taxes on the opportunity
costs of trainees - increase the public subsidies to 21.8 Million Dollars, which is exactly one
third of total costs of 66.9 Millions.
The calculation of benefits is much more difficult, because possible benefits from
participation can be felt throughout the working life of the trainees. A proper life-time
calculation of benefits seems impossible for most evaluation studies, because in most cases
nothing is known about the time path of the benefits. Here, I can observe participants for at
least five years after the Foundation and can therefore estimate treatment effects for the first
five years after training. Interestingly, the treatment effects both for wage growth and for
employment do not diminish over these five years (see Tables 6 and 8). This is not
particularly astonishing for wage growth, because if the training served to increase
productivity of trainees, wages should be permanently higher thereafter. It is more remarkable
for employment effects, where training could serve as a crises intervention program with
(hopefully) high short-run effects but not so high long-run effects.
As the typical trainee enters the Foundation at age 31, I take 30 years as the time period
for wage gains. A variant of the calculation takes only 10 years as the period where positive
wage gains from training are received. I use the lowest regression result of 5% wage gain,
together with a discount rate of 4% over time.28 Note that this discount rate is rather high,
because it should also take possible wage growth over these 30 years into account. The proper
“nominal” discount rate must therefore be 4% plus the expected long-term wage growth. In
the higher scenario, wage gains are 42 Millions, in the lower scenario 24 Million Dollars. For
employment gains I assume that positive employment gains are reached only in the first 10
years. Again, the lowest Tobit measure of 45 days from Table 5 is used and the employment
gain is transformed into income by using mean incomes from the sample. This results in an
employment gain corresponding to 51 Million Dollars.
The total benefits vary according to my assumptions between 75 and 93 Million Dollar
and are considerably above the total costs. Again, it has to be said that the amount of benefits

27
is highly dependent upon the assumptions I have made. Let us assume that wage and
employment gains would be present only in the first five years – the period where they have
been properly estimated from the available data -, even in that case the benefit amount would
be close to the total costs.
Another cost-benefit analysis can be made for the public. For the public only the costs
borne by the local government and the increased benefit duration are important, which
amounts to 21.8 Million Dollars. The wage and employment gains of the Foundation bring
forth sizable revenues from taxes. For this calculation I took a marginal tax rate of 41% and
included also increased contributions to unemployment and health insurance (but not old-age
pension insurance). Using the higher measure for wage gains (a), we receive a tax increase of
51 Million Dollars which is considerably higher as the public costs of 22 Millions. In a strict
calculation we should also take into account lower public expenditures due to reduced
unemployment of the trainees in the future. Following the calculated employment gains
shown above, these reduced unemployment costs would add up to further 17 Million Dollars
in the first 10 years. So it seems fair to say, that the public cost-benefit analysis should be
positive irrespective of the assumptions used. Moreover it seems highly probable that the total
cost-benefit calculation is also positive, but here the margin is somewhat smaller and,
therefore, the degree of confidence must be somewhat lower.
A final cost-benefit calculation concerns the value of the Foundation to the steel firms
themselves. What is the value of the Foundation to the steel firms? Several answers are
possible. The firms can use the Foundation as a subsidized training and recruitment reservoir.
In fact, ten percent of trainees were later recalled into one of the steel firms. A more realistic
assumption is that the Foundation can serve as a public relations project in order to facilitate
the downsizing necessities. For this supposition speaks the history of the Foundation: the
management of the steel firms tried to strike a deal with the unions to make the downsizing
possible in the first place, the management initiated an increase in the scholarship for trainees
in order to induce more highly-paid workers to join. Moreover, the culture of “no-dismissals”
and the high unionization in the steel firms would have made mass layoffs practically
impossible without an extensive social plan. If the Foundation is, accordingly, seen as a social
plan, how costly is it? Given the number of redundancies, we can calculate costs per laid off
worker. In my sample I have 17,391 workers who were dismissed by the steel firms in the
period 1988 to 1998 and (!) fell unemployed immediately after the dismissal. In general some
people switch to a new job without an intervening unemployment spell, which would increase
28 The calculation takes into account that the workers in my sample work typically only 300 days per year.

28
the (unobserved) number of actual redundancies. If we just consider the 17,391 displaced
persons we can get an upper bound for the costs of downsizing: using the Steel Foundation as
an instrument to facilitate the downsizing had costs of 1443 Dollars per redundant worker at a
maximum, a relatively low amount to buy constantly good labor relations in bad times.29
6. Conclusions
This evaluation has looked at employment and wage gains due to the Steel Foundation
for a period of five years. In this period the Foundation seems to be successful in several
respects: trainees can achieve higher wages, they have also better employment prospects as
compared to the control group. Whereas employment effects are noticeable mainly for the old
workers, wage gains are found only for young and low-wage workers. This points to one
problem of the analysis: As wage gains could not be calculated for high-wage workers
because of data problems, measured wage gains could found to be biased upwards, if the
whole group of displaced workers could be observed.
Moreover, in a cost-benefit analysis, it seems to be that costs are significantly lower than
discounted long-term benefits; this is true for costs at large, but also more narrowly for public
expenditures and public returns. For the steel firms themselves, the Foundation seems to be a
relatively cheap project to get away with a mass dismissal of steel workers. Some questions
remain to be answered: why do so few eligible workers participate in the Foundation, given
that their private return is so high? One answer to this question could be the strict regulations
of the Foundation: members have to commit to a supervised occupational re-orientation work-
shop which might be embarrassing because of the psychological assessment of one’s
qualifications and motives. They also have to commit to a full-time retraining program which
will evidently be more stressfull than, say, being unemployed for a few weeks. Another
reason can lie in time preferences of the individuals. The benefits of the Foundation – which
are found to be substantial – do not accrue before completing the retraining and have to be
accumulated over more than 10 years. On the other side, costs of participating – which are
mainly opportunity costs for lost income – accrue immediately. If people are impatient, the
immediate costs will weigh more heavily.
What is the special feature of this Foundation, that makes it more successful than other
projects? One answer can lie in the comprehensive and long-term direction of the
29 In this calculation other costs like redundancy payments as such were not included. But this analysis considerscorrectly only the marginal costs per dismissal caused by the Foundation.

29
occupational re-orientation and re-training scheme. This long-term orientation will allow a
closer examination of personal qualifications and also more generous and radical career
changes. The immediate and consistent effort in the first weeks to keep the workers mentally
attached to the labor market might overcome another problem which might arise in the case of
hyperbolic discount rates: If workers have hyperbolic discount rates – i.e. they discount the
immediate future higher than the more distant future – more impatient workers have been
found to reduce search effort and stay unemployed longer.30 The first weeks of an
unemployment spell may therefore be very important in order not to lose contact with the
labor market. Another reason can lie in the spirit of the organization; the cooperative
character – starting with the financial structure, the governance of the Foundation and the
program – can possibly improve motivation of the participants and facilitate a self-determined
learning environment. The financial structure – with sizeable contributions by the Steel Firms
and the remaining workers – will foster closer monitoring of the Foundation by both
management and the unions. Both “donors” have something to lose: the management wants to
continue with the wage-cut the unions have agreed, whereas the unions have to justify this
wage-cut towards its members.
Can this program be extended to other regions like developing countries or countries in
transition where restructuring processes in major industries often occur? One important
limitation is for the downsizing firms to remain on the market – otherwise the organization
and financing of the Foundation cannot be done in such a way. Another issue concerns the
local environment: a functioning local infrastructure is needed, which can, on the one hand,
finance long-term oriented labor market policies, on the other hand, it must be able to offer a
diversified set of training slots at different institutions to allow a highly individualized re-
training.
30 More impatient workers are expected to search less, but also to accept lower wage offers. In the case ofhyperbolic discounting the search effect dominates. See DellaVigna and Paserman (2000) for an empirical test.

30
Table 1a: Mean duration in the Foundation in years
Meanduration in
years# of persons
Project and firm formation 1.35 80
Outplacement after occupational.orientation
0.80 259
Type of education:
Apprenticeship training 1.71 334
Training courses 1.17 735
Formal schooling 2.57 446
University 2.87 125
Field of education:
Commercial jobs 1.66 283
Technical jobs 1.90 649
Creative jobs 2.05 33
Social jobs 2.19 184
Other service jobs 1.61 78
Agricultural job 1.91 21
Mining and construction 1.23 37
Metal and electrical occupation 1.53 327
Other manufacturing occ. 1.75 28
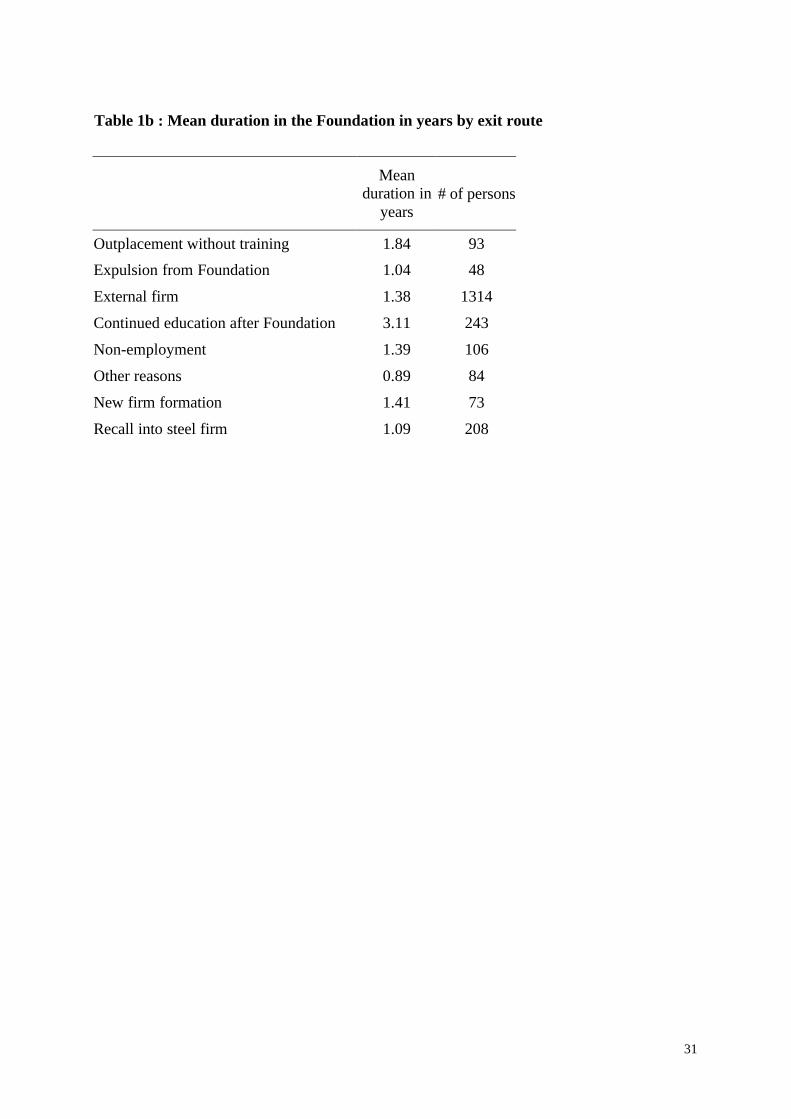
31
Table 1b : Mean duration in the Foundation in years by exit route
Meanduration in
years# of persons
Outplacement without training 1.84 93
Expulsion from Foundation 1.04 48
External firm 1.38 1314
Continued education after Foundation 3.11 243
Non-employment 1.39 106
Other reasons 0.89 84
New firm formation 1.41 73
Recall into steel firm 1.09 208

32
Table 2: New firm formation in the Steel Foundation
Ongoing projects as of March 1998 9
Successful projects 44
Unsuccessful projects 55
Total firm formation projects 108
Types of projects
Consulting and planning 29
Services 23
Machinery and metal works 11
Energy and environmental technology 10
Trade and transport 13
Public relations, film 8
Other projects 14
Source: Steel Foundation, 1987 - 3/1998, 108 projects

33
Table 3: Basic statistics of trainees and controls
Trainees Controls
Mean duration of training 1.48 (1.14) -
Age at redundancy 31.08 (9.94) 35.83 (13.67)
Tenure in steel firm 7.72 (6.51) 7.74 (8.08)
Last wage in steel firms(real ATS per month)
18,979.0 (5039.7) 17,747.7 (5330.3)
Wage t+1* 18,415.6 (4986.8) 16,230.5 (5530.6)
Wage t+2* 18,663.5 (5175.3) 16,979.9 (5706.4)
Wage t+3* 18,943.1 (5362.5) 17,552.5 (5820.9)
Wage t+4* 19,522.6 (5457.3) 18,018.5 (6031.9)
Wage t+5* 19,635.7 (5686.6) 18,057.6 (6326.9)
Employed days t+1 274.6 (131.7) 199.6 (158.1)
-"- t+2 296.7 (121.9) 216.7 (157.7)
-"- t+3 301.6 (120.6) 226.9 (156.1)
-"- t+4 299.9 (123.0) 240.4 (153.5)
-"- t+5 296.7 (126.7) 253.5 (147.3)
Unemployed days t+1 71.9 (115.2) 87.1 (133.4)
-"- t+2 54.7 (108.9) 85.1 (129.7)
-"- t+3 50.6 (107.1) 76.2 (122.0)
-"- t+4 48.5 (107.2) 71.3 (122.3)
-"- t+5 40.2 (98.6) 60.9 (114.1)

34
Table 4: Entry into the Foundation31
Males Females
Age 0.026 (0.002) 0.024 (0.004)Age2/100 -0.042 (0.002) -0.036 (0.006)Tenure in steel firm(years)
0.016 (0.001) 0.007 (0.003)
Tenure in steel firm2/100 -0.059 (0.007) -0.029 (0.014)Married (0/1) -0.024 (0.006) -0.036 (0.010)# of children -0.019 (0.009)Education: base compulsory - apprentice 0.146 (0.064) 0.128 (0.101) - master 0.168 (0.055) 0.166 (0.121) - technical middle school 0.376 (0.110) - - comm. middle school 0.270 (.0107) 0.525 (0.261) - general High school 0.218 (0.108) 0.149 (0.140) - technical high school 0.017 (0.050) - - comm. High school 0.081 (0.064) 0.099 (0.126) - other high school 0.069 (0.072) 0.043 (0.095) - university 0.085 (0.066) -0.015 (0.057) - missing 0.186 (0.090) 0.027 (0.092)Foreign citizen (0/1) -0.031 (0.012) -0.053 (0.013)White-collar worker (0/1) 0.032 (0.008) -0.024 (0.014)Part-time worker (0/1) - -0.046 (0.012)# jobs since 1972 -0.003 (0.001) -0.003 (0.001)Hard-to-place because of health problems (0/1)
-0.026 (0.008) -0.028 (0.013)
Firm size/1000 -0.012 (0.002) 0.001 0.004Occupation: base metal - - - Service -0.058 (0.007) -0.118 (0.013) - Other production worker
-0.034 (0.006) -0.069 (0.009)
- Trade -0.048 (0.007) -0.077 (0.008) - Technician -0.030 (0.008) -0.058 (0.011) - Administration -0.040 (0.007) -0.153 (0.051)
N 14545 2846Mean entry probability 0.123 0.097Pseudo R2 0.189 0.152
31 Marginal effects from a univariate probit regression, LHS is entry into the Foundation. All RHS variables aremeasured at the time of redundancy, standard errors in parenthesis. 11 time dummies not reported.

35
Table 5: Employment gains (days per year) of trainees vs. controls (average effects in
year one to five after training)32
Group NMean
employmentdays per year
Tobit Tobit – IV-1 Tobit – IV-2
All 39318 232.844.78(2.75)
79.96(9.22)
73.8(13.75)
Men 32150 235.443.97(2.91)
67.39(9.46)
55.78(14.34)
Women 7168 220.935.14(7.31)
5.49(27.53)
57.79(37.99)
Age33 < 22 9643 254.332.94(5.87)
-2.94(17.51)
-20.77(29.36)
Age 22 - 26 10256 259.138.26(5.51)
33.34(16.53)
39.93(27.02)
Age 27 – 36 9424 273.514.11(5.09)
81.81(16.32)
98.92(22.22)
Age > 36 9995 146.641.31(4.89)
81.52(15.19)
53.78(23.71)
Previous Wage
1st quartile 9641 245.531.32(5.75)
52.96(17.70)
93.69(24.94)
2nd quartile 9623 247.935.38(5.13)
60.55(13.56)
75.56(19.86)
3rd quartile 9606 224.635.26(5.23)
47.60(17.22)
-5.89(27.20)
4th quartile 10456 214.367.44(5.66)
77.38(24.41)
78.15(38.89)
32 Same control variables as in Table 4 plus 4 dummies for the year t after training, standard errors inparentheses. The coefficients correspond to marginal effects (as well as the re-calculated standard errors) of thecensored LHS variable (see eq. 3 in text).LHS = employment days in calendar year (0-365).33 Age at entry in Foundation or redundancy, respectively.

36
Table 6: Employment gains (days per year) of trainees vs. controls one to five years after
training34
Period NMean
employmentdays per year
Tobit Tobit – IV-1 Tobit – IV-2
Year t + 1 9622 209.7240.13(5.05)
86.32(16.10)
45.92(23.37)
Year t + 2 8718 226.7751.90(4.95)
98.63(16.57)
96.38(24.76)
Year t + 3 7895 236.0955.14(6.07)
107.73(18.84)
97.07(28.64)
Year t + 4 7010 247.9343.22(7.09)
90.88(23.45)
98.41(34.84)
Year t + 5 6073 257.7125.92(8.33)
77.90(34.73)
98.08(50.94)
34 Same control variables as in Table 5, standard errors in parentheses. The coefficients correspond to marginaleffects (as well as the re-calculated standard errors) of the censored LHS variable (see eq. 3 in text).LHS = employment days in calendar year (0-365)
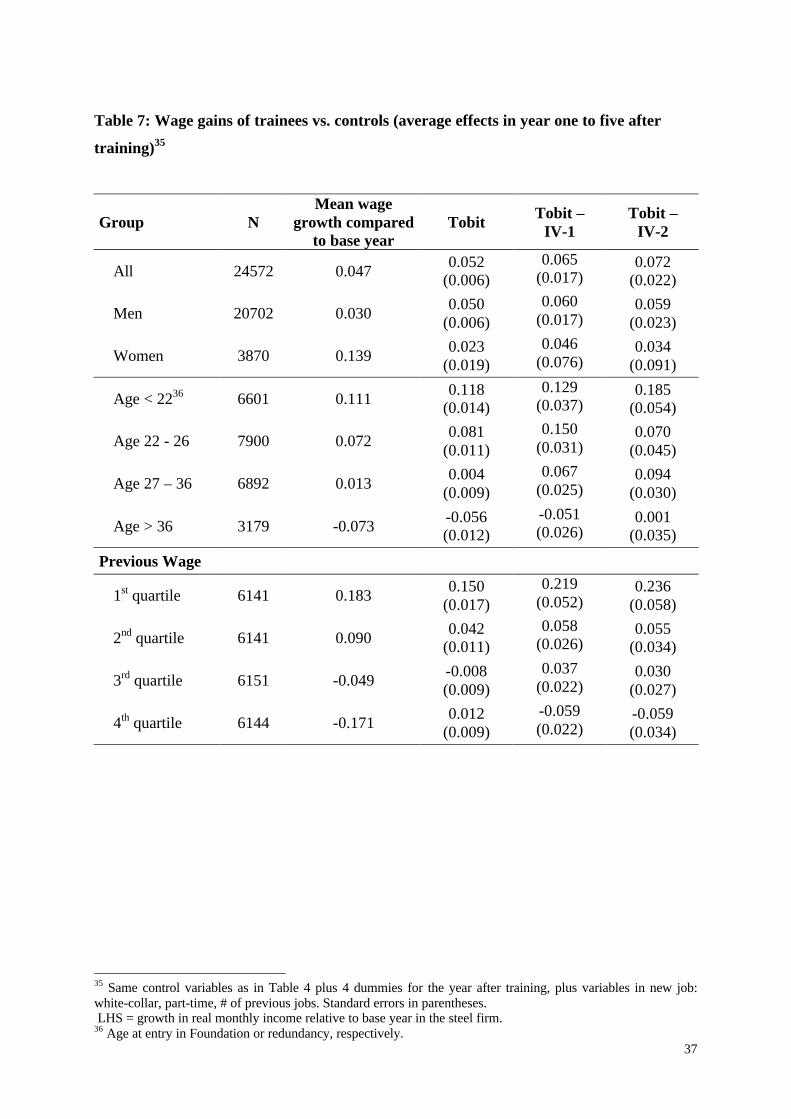
37
Table 7: Wage gains of trainees vs. controls (average effects in year one to five after
training)35
Group NMean wage
growth comparedto base year
TobitTobit –
IV-1Tobit –
IV-2
All 24572 0.0470.052
(0.006)0.065
(0.017)0.072
(0.022)
Men 20702 0.0300.050
(0.006)0.060
(0.017)0.059
(0.023)
Women 3870 0.1390.023
(0.019)0.046
(0.076)0.034
(0.091)
Age < 2236 6601 0.1110.118
(0.014)0.129
(0.037)0.185
(0.054)
Age 22 - 26 7900 0.0720.081
(0.011)0.150
(0.031)0.070
(0.045)
Age 27 – 36 6892 0.0130.004
(0.009)0.067
(0.025)0.094
(0.030)
Age > 36 3179 -0.073-0.056(0.012)
-0.051(0.026)
0.001(0.035)
Previous Wage
1st quartile 6141 0.1830.150
(0.017)0.219
(0.052)0.236
(0.058)
2nd quartile 6141 0.0900.042
(0.011)0.058
(0.026)0.055
(0.034)
3rd quartile 6151 -0.049-0.008(0.009)
0.037(0.022)
0.030(0.027)
4th quartile 6144 -0.1710.012
(0.009)-0.059(0.022)
-0.059(0.034)
35 Same control variables as in Table 4 plus 4 dummies for the year after training, plus variables in new job:white-collar, part-time, # of previous jobs. Standard errors in parentheses. LHS = growth in real monthly income relative to base year in the steel firm.36 Age at entry in Foundation or redundancy, respectively.

38
Table 8: Wage gains of trainees vs. controls one to five years after training37
Period NMean wage growth
compared to base year TobitTobit –
IV-1Tobit –
IV-2
Year t + 1 5820 -0.0270.075
(0.011)0.040
(0.029)0.045
(0.041)
Year t + 2 5335 0.0180.053
(0.012)0.072
(0.032)0.085
(0.045)
Year t + 3 4934 0.0570.050
(0.012)0.057
(0.031)0.096
(0.039)
Year t + 4 4474 0.0950.072
(0.015)0.121
(0.038)0.181
(0.048)
Year t + 5 4009 0.1290.057
(0.017)0.156
(0.064)0.150
(0.084)
37 Same control variables as in Table 2 plus variables in new job: white-collar, part-time, # of previous jobs.Individuals close to social security ceiling (-2%) in the base year excluded, standard errors in parentheses.LHS = growth in real monthly income relative to base year in the steel firm.

39
Table 9: Employment and Wage effects of specific measures in the Foundation38
Variable Employment Wage growth Mean
Duration of training(years)
-3.54(0.99)
-0.065(0.011)
1.35(1.02)
Reason for exit fromFoundation:(Base: new firm)
- Outplacement without training
-25.11(5.40)
0.011(0.052)
0.03(0.16)
- Expulsion from Foundation
-25.49(6.20)
0.027(0.060)
0.02(0.14)
- Continued educ. after Foundation
-26.56(3.18)
-0.098(0.034)
0.09(0.29)
-Other reasons-31.44(5.92)
-0.080(0.053)
0.02(0.15)
- Recall into Steel firm
6.92(3.28)
0.005(0.031)
0.13(0.34)
Type of training(base : apprentice)
- other training0.69
(2.31)-0.001(0.028)
0.38(0.48)
- formal schooling6.59
(3.03)0.101
(0.036)0.19
(0.39)
- polytechnical school7.71
(5.43)0.127
(0.075)0.02
(0.12)
- university-7.85(4.63)
0.011(0.051)
0.04(0.20)
- unknown-1.12(3.18)
0.067(0.037)
0.21(0.41)
Training type (base:commercial job)
- technical job0.99
(2.88)0.035
(0.033)0.31
(0.46)
- creativ job-5.76(7.61)
-0.108(0.069)
0.02(0.13)
- social job0.79
(3.66)-0.054(0.041)
0.08(0.27)
38 Only trainees are in the sample, Tobit results are presented, standard errors in parentheses. Same controlvariables – if possible – are included as in Tables 4-8. The coefficients for employment correspond to marginaleffects (as well as the re-calculated standard errors) of the censored LHS variable (see eq. 3 in text).

40
- other services2.24
(4.53)0.032
(0.051)0.03
(0.18)
- agriculture-22.10(9.33)
-0.299(0.096)
0.01(0.09)
- construction-2.03(6.17)
0.145(0.068)
0.02(0.13)
- metal and electrical6.55
(2.75)0.029
(0.033)0.19
(0.39)
- other production job-3.30(6.13)
-0.106(0.070)
0.02(0.13)

41
Table 10: Cost-Benefit Analysis in 1998 Mio Dollars39
Costs Benefits
a) Steel firms A (including matched wage restraint) 25.1
b) Steel firms B (excluding matched wage restraint)
(20.6)
Remaining Workforce (wage restraint)
9.0
Trainees themselves (interest from severance pay + opportunity costs for lost earnings)
11.0
Public subsidies (direct subsidies + longer benefit duration + lost tax receipts)
21.8
Total costs 66.9
a) Wage gain: 5% over 30 years, discounted by 4%
41.9
b) Wage gain: 5% over 10 years, discounted by 4%
23.9
Employment gain: + 45 days over 10 years discounted by 4%
51.0
Total benefits 74.9 – 92.9
Tax gains induced by wage (scheme a) andemployment gains, marginal tax rate includingcontributions for unemployment and healthinsurance
51.5
Reduced unemployment benefits induced byincreased employment of trainees
16.9
39 See the text for the used assumptions and approximations.

42
Figure 1: Concept and timing in the Foundation
Source: Steel Foundation, 1996
Termination ofemployment contract
by agreement
Internal job-marketin the firm
Entry into Foundation
Occupationalorientation seminar
6 weeks
Training, formaleducation
up to 3-4 years
Job-search assistanceup to 4 months
New Job
Self-employmentNew Job
Starting a newenterprise
up to 3 years
Job search assistance,outplacement
up to 4 months

43
Figure 2: Sampling design
E = employment spell in steel firm, U = unemployment spell, F = trainee in Foundation, +1 =
first year after Foundation or redundancy, respectively. Person 3 is a trainee, persons 1and
2 are part of the control group, person 4 is not.
E
Time
Person
1
19891988 19911990 1992
21
3
1987
41
E
E
E
U
U
U
Ft+ 1 t+ 2
t+ 1 t+ 2
t+1 t+ 2 t+ 3 t+ 4

44
References:
AMS (Arbeitsmarktservice Österreich): Leistungsbezieherdaten 1998, Wien, 1999.
Blumberger, Walter, Nemeth, Dietmar and Hans Reinsprecht: Analyse der
Zugangsproblematik und der Selektionskriterien zu Kursen der Arbeitsmarktverwaltung,
1993, mimeo, Institut für Berufs- und Erwachsenenbildung, Linz.
Carabelli, Umberto, Ceci, Anna, Ciucciovino, Silvia and Leonello Tronti: The Management
of Redundancies in Europe: The Case of Italy, Labour 13/1, 1999, 327-283.
Card, David: Using Geographic Variation in College Proximity to Estimate the Return to
Schooling, NBER working paper #4483, 1993.
Dar, Amit and Indermit S. Gill: Evaluations of Retraining Programs in OECD countries:
Implications for Economies in Transition, The World Bank, Report IDP-156, 1995.
Dary, Jeanette A., Anderson, Joe S. and Nicholas DiMarco: Outcome Comparisons of Formal
Outplacement Services and Informal Support, Human Ressource Development Quarterly
6-3, 1995, 275-288.
Davis, Steven J., Haltiwanger, John C. and Scott Schuh: Job Creation and Destruction, The
MIT-Press (Cambridge, MA), 1996.
Deakin, Simon and Frank Wilkinson: Managing Labour Redundancies: The Case of Great
Britain, Labour 13-1, 1999, 41-90.
Decker, Paul T. and Walter Corson: International Trade and Worker Displacement:
Evaluation of the Trade Adjustment Assistance Program, Industrial and Labor Relations
Review 48, 1995, 758-774.
DellaVigna, Stefano and Daniele M. Paserman: Job Search and Hyperbolic Discounting,
mimeo, Harvard University, November 2000.
Dipplinger, Erich: Die Studie Arbeitsstiftungen: Stellungnahme aus der Sicht der von der
Stahlstifung betreuten Unternehmen, in: Lechner, Ferdinand and Walter Reiter (eds.):
Arbeitsstiftungen, Erfahrungen und Entwicklungsperspektiven, Wissenschaftsverlag
(Wien), 1991, 81-82.
Eder, Johannes: Die Arbeitsstiftung als arbeitsmarktpolitisches Instrument, Masters thesis,
University of Business and Economics, Vienna, 1997.
Emerson, Michael: Regulation or Deregulation of the Labor Market, European Economic
Review 32, 1988, 775-817.

45
Evans-Klock, Christine, Kelly, Peggy, Richards, Peter and Corinne Vargha: Worker
Retrenchment: Preventive and Remedial Measures, International Labour Review 138,
1999, 47-66.
Fersterer, Josef and Rudolf Winter-Ebmer: Are Austrian Returns to Education Falling Over
Time, CEPR Discussion Paper 2313, London, 2000.
Fitzenberger, Bernd and Stefan Speckesser: Zur wissenschaftlichen Evaluation der Aktiven
Arbeitsmarktpolitik in Deutschland: Ein Überblick, ZEW Discussion Paper 00-06,
Mannheim, 2000.
Gerich, Joachim: Arbeitsstiftungen, eine Analyse von Arbeitsstiftungen in Braunau und
Vöcklabruck, Part II, mimeo, Linz, 1997.
Heckman, James, LaLonde, Robert and Jeffrey A. Smith: The Economics and Econometrics
of Active Labor Market Programs, in: Ashenfelter, Orley and David Card (eds.),
Handbook of Labor Economics, Vol. III, North-Holland (Amsterdam), 2000.
Heseler, Heiner and Ulrich Mückenberger: Managing Labour Redundancies: The Case of
Germany, Labour 13-1, 1999, 183-236.
Irsigler, Hans-Peter: Die Arbeitsstiftung, Dissertation, University of Linz, 1990.
Kerz, Sebastian: Bewältigung der Stahlkrisen in den USA, Japan und der EU, Vandenhoeck
& Ruprecht (Göttingen). 1991.
Kodré, Petra and Reiner Buchegger: Regionen im Umbruch: Lokale Arbeitsmarktpolitik im
europäischen Vergleich, mimeo, Linz, 1998.
Lechner, Ferdinand and Walter Reiter (eds.): Arbeitsstiftungen, Erfahrungen und
Entwicklungsperspektiven, Wissenschaftsverlag (Wien), 1991.
Long, Scott: Regression Models for Categorical and Limited Dependent Variables, Sage
Publications (Thousand Oaks), 1997.
Martin, John P.: What works among Active Labour Market Policies: Evidence from OECD
Countries’ Experience, OECD Economic Studies 30, 2000, 79-113.
Mosley, Hugh and Thomas Kruppe: Employment Stabilization through Short-time Work, in:
Schmid, Günther et al. (eds.), International Handbook of Labour Market Policy and
Evaluation, 1996, Cheltenham (Edward Elgar), 594-622.
Neuhofer, Max: Zwischen Krise und Modernisierung. Soziale Dimension des Strukturwandels
im Stahlsektor, Ph.D. Thesis, University of Linz, 1996.
Nigsch, Otto: Effekte der Stahlstiftung, Beabsichtigte und nichtbeabsichtigte, Vöest-Alpine
(Linz), 1995.
Nigsch, Otto: Stiftungseintritte: Brüche und Brücken, mimeo, Linz, 1991.

46
Princic, Thomas: Arbeitsstiftungen in Oberösterreich, Masters thesis, University of Linz,
1993.
Saarstahl Völkingen GMBH (ed.): Die saarländische Lösung 1987. Das soziale Konzept
Stahlindustrie, 1987, Vökingen.
Seckauer, Hansjörg: Arbeitsstiftungen, eine Analyse von Arbeitsstiftungen in Braunau und
Vöcklabruck, mimeo, Linz, part I, 1997.
Steininger, Karl: Die praktische Relevanz der Stahlstiftung beim Personalabbau in der
verstaatlichten Industrie, Masters thesis, University of Linz, 1993.
Toharia, Luis and Antonio Ojeda: The Management of Redundancies in Europe: The Case of
Spain, Labour 13/1, 1999, 237-268.
Voest-Alpine Stahlstiftung,: Leitgedanken von Arbeitsstiftungen, mimeo, Linz, 1998.
Winter-Ebmer, Rudolf and Josef Zweimüller: Manpower Training and Employment Stability,
Economica, 63, 1996, 113-130.
Winter-Ebmer, Rudolf: Firm Size, Earnings, and Displacement Risk, Economic Inquiry, 2001
forthcoming.
Winter-Ebmer, Rudolf: Benefit Duration and Unemployment Entry: Quasi-Experimental
Evidence for Austria, mimeo, CEPR Discussion Paper #1521, December 1996.
Winter-Ebmer, Rudolf: Potential Unemployment Benefit Duration and Spell Length: Lessons
from a Quasi-Experiment in Austria, Oxford Bulletin of Economics and Statistics, 1998,
33-46.

47
Appendix 1: Employment effects of specific measures in the Foundation
Variable EmploymentMales
EmploymentFemales
Employmentage < 27
Employmentage ≥ 27
-11.17 -7.44 -7.76 -13.47Duration (years)(18.59) (5.80) (4.05) (2.05)
Reason for exit fromFoundation: (Base: newfirm)
-53.41 -64.39 -45.82 -65.67- Outplacement withouttraining (7.52) (15.23) (16.24) (7.31)
54.71 -64.00 -50.56 -55.88- Expulsion fromFoundation (9.26) (20.69) (13.12) (10.95)
-61.16 -43.56 -82.41 -53.07- Continued educ. afterFoundation (4.93) (16.59) (9.95) (5.36)
-63.49 -158.50 -58.30 -74.17- Other reasons(7.36) (32.68) (13.58) (8.42)
47.48 -23.89 44.41 35.80- Recall into Steel firm(6.32) (18.59) (13.72) (6.57)
Type of training (base:apprentice)
2.34 19.81 28.23 5.57- other training(4.48) (16.67) (9.66) (4.86)
25.21 38.17 40.45 28.54- formal schooling(5.82) (21.93) (12.16) (6.42)
26.00 30.39 46.51 27.91- polytechnical school(12.37) (32.68) (30.06) (12.37)
-23.39 -0.19 -12.07 -17.10- university(7.79) (26.17) (23.93) (8.03)
3.30 14.86 2.62 5.34- unkown(6.30) (16.96) (11.41) (6.40)
Training type (base:commercial job)
4.53 -15.21 -27.57 1.37- technical job(5.51) (16.81) (11.70) (5.49)
-8.09 -12.75 -27.05 -11.81- creativ job(10.69) (28.58) (19.15) (11.51)
0.93 4.32 -52.04 6.67- social job(6.98) (16.64) (12.56) (6.85)
-5.70 43.28 35.07 5.75- other services(8.95) (15.81) (24.87) (7.91)
-58.44 50.75 -77.87 -49.94- agriculture(14.25) (60.27) (36.15) (14.75)
-14.22 - -58.05 -12.40- construction(10.84) - (24.09) (12.07)

48
18.40 59.53 -8.15 23.37- metal and electrical(5.57) (42.92) (10.57) (5.87)
-9.82 41.81 20.34 -9.35- other production job(11.21) (30.67) (43.87) (10.88)
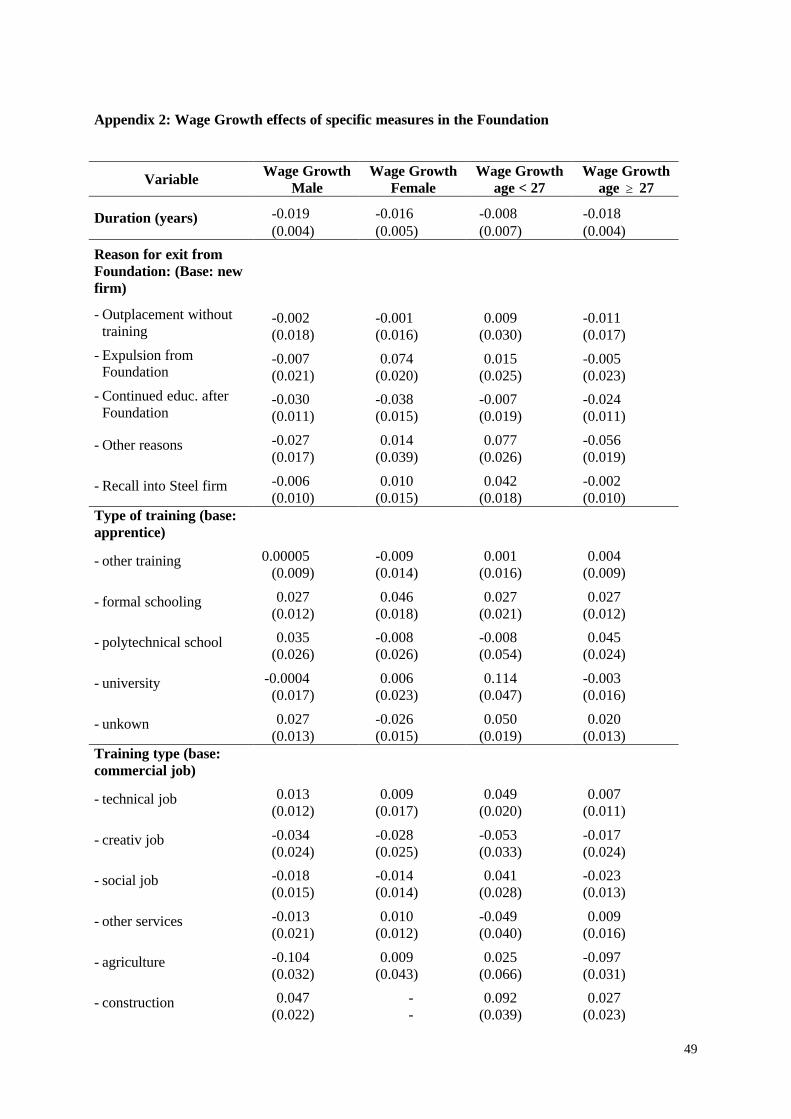
49
Appendix 2: Wage Growth effects of specific measures in the Foundation
Variable Wage GrowthMale
Wage GrowthFemale
Wage Growthage < 27
Wage Growthage ≥ 27
-0.019 -0.016 -0.008 -0.018Duration (years)(0.004) (0.005) (0.007) (0.004)
Reason for exit fromFoundation: (Base: newfirm)
-0.002 -0.001 0.009 -0.011- Outplacement withouttraining (0.018) (0.016) (0.030) (0.017)
-0.007 0.074 0.015 -0.005- Expulsion fromFoundation (0.021) (0.020) (0.025) (0.023)
-0.030 -0.038 -0.007 -0.024- Continued educ. afterFoundation (0.011) (0.015) (0.019) (0.011)
-0.027 0.014 0.077 -0.056- Other reasons(0.017) (0.039) (0.026) (0.019)
-0.006 0.010 0.042 -0.002- Recall into Steel firm(0.010) (0.015) (0.018) (0.010)
Type of training (base:apprentice)
0.00005 -0.009 0.001 0.004- other training(0.009) (0.014) (0.016) (0.009)
0.027 0.046 0.027 0.027- formal schooling(0.012) (0.018) (0.021) (0.012)
0.035 -0.008 -0.008 0.045- polytechnical school(0.026) (0.026) (0.054) (0.024)
-0.0004 0.006 0.114 -0.003- university(0.017) (0.023) (0.047) (0.016)
0.027 -0.026 0.050 0.020- unkown(0.013) (0.015) (0.019) (0.013)
Training type (base:commercial job)
0.013 0.009 0.049 0.007- technical job(0.012) (0.017) (0.020) (0.011)
-0.034 -0.028 -0.053 -0.017- creativ job(0.024) (0.025) (0.033) (0.024)
-0.018 -0.014 0.041 -0.023- social job(0.015) (0.014) (0.028) (0.013)
-0.013 0.010 -0.049 0.009- other services(0.021) (0.012) (0.040) (0.016)
-0.104 0.009 0.025 -0.097- agriculture(0.032) (0.043) (0.066) (0.031)
0.047 - 0.092 0.027- construction(0.022) - (0.039) (0.023)

50
0.007 0.005 0.078 -0.006- metal and electrical(0.012) (0.034) (0.017) (0.011)
-0.021 -0.068 -0.075 -0.032- other production job(0.025) (0.024) (0.077) (0.022)