Embed Size (px)
Citation preview

Long-term development of Collembola communities on a
former rubble deposit
PhD thesis for the attainment of the scientific doctoral degree Dr. rer. nat
Submitted to the Department of Biology (FB2) University of Bremen
Elaheh Daghighi Masouleh August 2017


“It is not the strongest of the species that survive, nor the most intelligent, but the one most responsive to change”.
Charles Darwin
Referees: Prof. Dr. Juliane Filser (General and Theoretical Ecology, University of Bremen, Germany)
Prof. Dr. Marco Rohlfs (Population and Evolutionary Ecology, University of Bremen, Germany and Evolutionary Insect-Microbe Ecology, University of Göttingen, Germany) Date and place of the colloquium: 19th of September, 2017 Center for Environmental Research and Sustainable Technology (UFT), University of Bremen, Germany


Long-term development of Collembola communities on a former rubble deposit Table of contents List of abbreviations ..................................................................................................................... 1
Index of tables .............................................................................................................................. 2
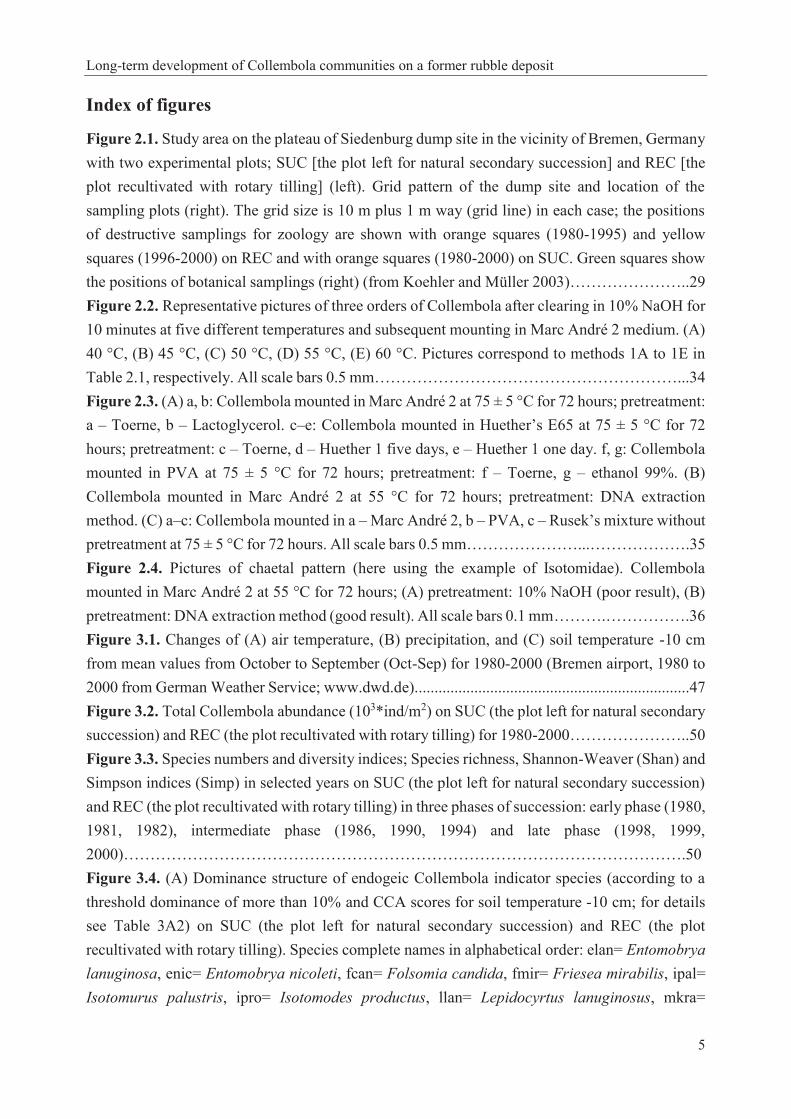
Index of figures ............................................................................................................................. 5
Summary ....................................................................................................................................... 9
Zusammenfassung ...................................................................................................................... 11
1 Introduction ............................................................................................................................. 14
1.1 Collembola ...................................................................................................................... 14
1.1.1 Systematics .................................................................................................................. 15
1.1.2 Ecology ........................................................................................................................ 18
1.2 Succession ....................................................................................................................... 18
1.3 Long-term dynamics in relation to environmental variables .......................................... 19
1.4 Objectives, structure of the thesis and hypotheses .......................................................... 24
1.5 Author contributions ....................................................................................................... 26
2 Materials and methods ............................................................................................................ 28
2.1 Study area ........................................................................................................................ 28
2.2 Techniques for clearing and mounting Collembola from old ethanol collections .......... 30
3 Long-term succession of Collembola communities in relation to climate change and vegetation .................................................................................................................................... 41
4 Collembola and Gamasina in a 20 years secondary succession with different management ................................................................................................................................ 63
5 General discussion ................................................................................................................... 88
5.1 Preconditions in long-term studies: preservation and preparation of specimens for a precise species determination ............................................................................................... 88
5.2 Collembola succession at the Siedenburg dump site ...................................................... 88
5.3 Recognizing key elements of successional development ............................................... 93
5.4 Long-term studies in soil ecology ................................................................................... 95
5.5 Conclusions ..................................................................................................................... 96
5.6 Future perspectives ......................................................................................................... 97
6 References ................................................................................................................................ 99
7 Appendix ................................................................................................................................ 116
Curriculum vitae ...................................................................................................................... 147
List of publications ................................................................................................................... 148
Acknowledgements ................................................................................................................... 149
Declaration ................................................................................................................................ 150

Long-term development of Collembola communities on a former rubble deposit
1
List of abbreviations
SUC (s): the experimental plot left for natural secondary succession REC (r): the experimental plot recultivated with rotary tilling, sowing of grass and mowing PAO: postantennal organ PVA: Polyvinyl lactophenol CCA: Canonical Correspondence Analysis DCA: Detrended Correspondence Analysis CA: Correspondence Analysis RDA: Redundancy Analysis Shan: Shannon-Weaver diversity index Simp: Simpson diversity index Sp. turnover rate: Species turnover rate Ren: Renkonen similarity index Soe: Soerensen similarity index ST: soil temperature R: pH reaction (Ellenberg’s indicator value) F: soil humidity (Ellenberg’s indicator value) SB: Siedenburg Bremen BCM: brown coal mine eastern Germany DF: deposits of a chemical factory G: grassland CF: coniferous forest NGF: Norwegian glacier foreland PL: post-mining landscape of lower Lusatia Germany BF: boreal forest UGC: urban green components (street lawns and park lawns)

Long-term development of Collembola communities on a former rubble deposit
2
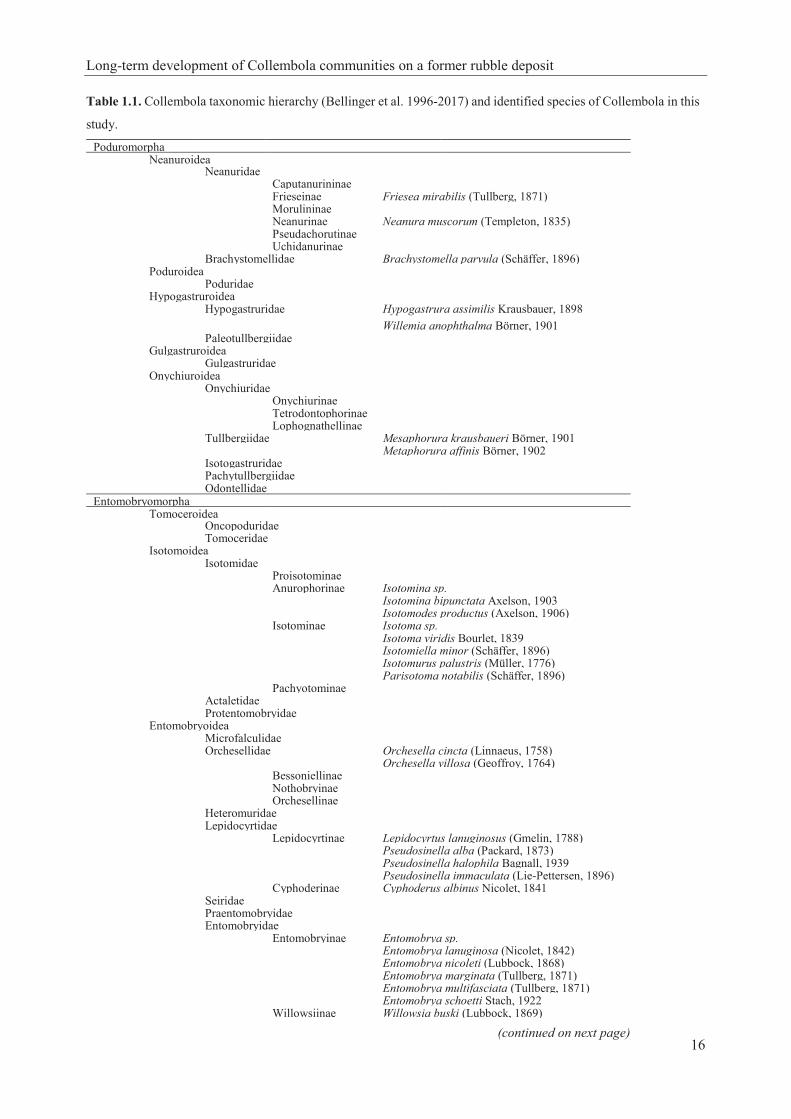
Index of tables
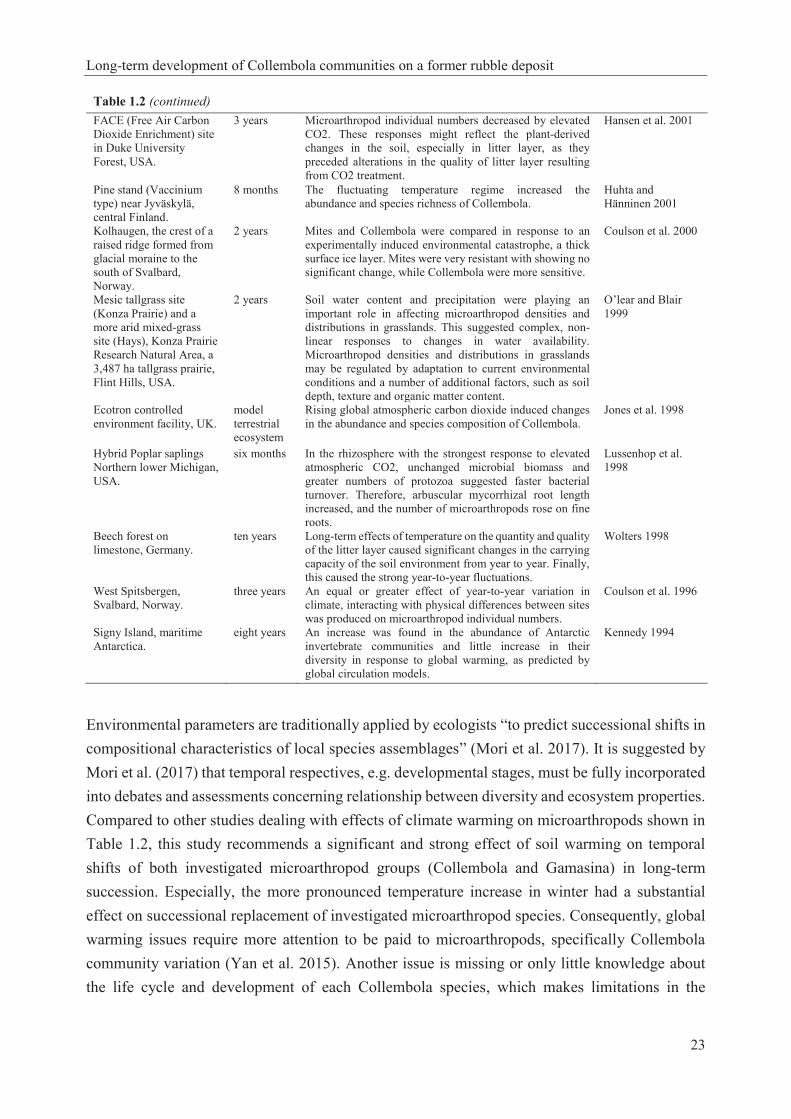
Table 1.1. Collembola taxonomic hierarchy (Bellinger et al. 1996-2017) and identified species of Collembola in this study…………………………………………………………………………16 Table 1.2. Studies about the effect of climate warming on soil microarthopods………………..22 Table 2.1. Pretreatment methods in the optimization experiment………………………………32 Table 2.2. Materials used in the optimization experiment (recipes given in Dunger and Fiedler 1997, Sambrook and Russell 2001)……………………………………………………………...33 Table 2.3. Results of pretreatment (see methods in Table 2.1) before permanent mounting (see details in Table 2.2; microphotographs were taken after 72 hours; see examples in Figs 2.2-2.4)…............................................................................................................................................36 Table 2.4. Condition of Collembola after pretreatment in 10% NaOH at different temperatures and subsequent mounting in Marc André 2 at 65 ± 5 °C for 48 hours. Scores: 1= excellent, 2= very good, 3= good, 4= bad, 5= very bad……………………………………………….………..37 Table 2.5. Details and results of permanent mounting without pretreatment. Clearing time = time between mounting and taking photos…………………………………………………………….37 Table 3.1. Linear model with autoregressive residuals for the first principle coordinate from CA of the Collembola abundances. The model accounts for first principle coordinate (vegetation) from CA of the vegetation data, as well as for experimental conditions (SUC; the plot left for natural secondary succession and REC; the plot recultivated with rotary tilling), period (time) and precipitation……………………………………………………………………………………...51 Table 3.2. Groups (Collembola abundance data) revealed from average linkage clustering in correlation with soil temperature at 10 cm depth (average, minimum and maximum). Throughout daily data for Oct-Sep of the respective years from German Weather Service; www.dwd.de………………………………………………………............………………….…53 Table 3.3. Linear model with autoregressive residuals for the first principle coordinate from CA of the Collembola abundances. The model accounts for first principle coordinate (vegetation) from CA of the vegetation data, as well as for experimental condition (SUC; the plot left for natural secondary succession and REC; the plot recultivated with rotary tilling), soil temperature and precipitation……………………………………………………………………………………...54 Table 3.4. Linear model with autoregressive residuals for the first principle coordinate from CA of the Collembola abundances. The model accounts for first principle coordinate (vegetation) from CA of the vegetation data, as well as for experimental condition (SUC; the plot left for natural secondary succession and REC; the plot recultivated with rotary tilling), air temperature and precipitation……………………………………………………………………………………...55 Table 3A1. List of identified Collembola species and plant species of this study and their occurrence on SUC (the plot left for natural secondary succession) and REC (the plot recultivated with rotary tilling)………………………………………………………………………………..60

Long-term development of Collembola communities on a former rubble deposit
3
Table 3A2. Ordination scores (reciprocal averaging method with linear combination of environmental variables in a multiple regression) of Collembola species abundance on the CCA axes................................................................................................................................................61 Table 3A3. Collembola dominance development in comparison to Vegetation cover percentage development on SUC (the plot left for natural secondary succession) and REC (the plot recultivated with rotary tilling); sorted by ordination scores of sampling years on the first CCA axis (soil temperature)…………………………………………………………………………...62 Table 4.1. Linear model with autoregressive residuals for the first principal component from CA of the (A) Collembola (from Daghighi et al. 2017) and (B) Gamasina abundance. The model accounts for the soil temperature, experimental conditions (SUC/REC), precipitation, F: soil humidity and R: pH reaction [Ellenberg’s indicator value]………………………………………76 Table 4A1. List of identified Collembola species of this study (from Daghighi et al. 2017), their occurrence on SUC (the plot left for natural secondary succession) and REC (the plot recultivated with rotary tilling) with their distinguished successional phase and habitat preference. For references see 4.2.4………………………………………………………………………………80 Table 4A2. List of identified Gamasina species of this study. Further explanations see Table 4A1………………………………………………………………………………………………81 Table 4A3. List of identified plant species of this study (from Daghighi et al. 2017). Further explanations see Table 4A1……………………………………………………………………...82 Table 4A4. Development of Collembola (from Daghighi et al. 2017), Gamasina and vegetation dominance (from Daghighi et al. 2017) on SUC (the plot left for natural secondary succession). Shown are dominance values >4% for microarthropods and % vegetation cover. For complete species names see Tables 4A1, 4A2 and 4A3……………………………………………………83 Table 4A5. Development of Collembola (from Daghighi et al. 2017), Gamasina and vegetation dominance (from Daghighi et al. 2017) on REC (the plot recultivated with rotary tilling); further explanations see Table 4A4……………………………………………………………………...84 Table 5.1. Succession of main Collembola species (>4%) on the Siedenburg dump site, Bremen (SB) in two different plots (SUC, the plot left for natural secondary succession; REC, the plot recultivated with rotary tilling). This study is compared with other successional studies in Europe: BCM, brown coal mine eastern Germany (Dunger 1968; Dunger et al. 2004); DF, deposits from a chemical factory Czeck Republic (Rusek 2004); G, grassland sites in the Lahn-Dill-Bergland Germany (Chauvat et al. 2007); CF, mixed broadleaved coniferous forests Moscow region-Russia (Kuznetsova 2006); NGF, Norwegian glacier foreland (Hågvar 2010); PL, post-mining landscape of lower Lusatia Germany (Krawczynski 2007); BF, boreal forests Sweden (Malmström 2012); UGC, urban green components (old [1980] and new [2012] street and park lawns) Warsaw-Poland (Rzeszowski and Sterzyńska 2016). For complete species names see Appendix Table 7A1…………………………………………………………………………………………...….90 Table 5.2. Collembola Communities of the main species (>4%) on the Siedenburg dump site, Bremen (SB) in two experimental plots; SUC [the plot left for natural secondary succession] and

Long-term development of Collembola communities on a former rubble deposit
4
REC [the plot recultivated with rotary tilling] with their successional phases and related climatic groups (Table 3A2); they are compared with BCM [brown coal mine eastern Germany; Dunger 1968]. For complete species names see Appendix Table 7A1……...…..……...............................92 Table 7A1. List of identified Collembola species in this study…………………………………117 Table 7A2. Species description D. trispinata provided in identification keys after Potapov (2001) and Fjellberg (2007). Contradictions between keys are marked in bold.......................................129 Table 7A3. Mean sequence distance values (uncorrected p) for Desoria species used in the mt COI analysis, based on 618 bp. D. trispinata sampling locations are Germany, United Kingdom, and Russia. Number of samples = n…………………………………………………………….130 Table 7A4. Distribution of D. trispinata……………………………………………………….132 Table 7A5. Habitats of D. trispinata…………………………………………………………...132 Table 7A6. Overview synchronisation 1 and 2 with D. trispinata…………………...…………136 Table 7A7. Ecological data of studied Collembola species from Fjellberg (1998, 2007), Bretfeld (1999), Potapov (2001), Dunger and Schlitt (2011), Jordana (2012), Greenslade et al. (2014), Jantarit et al. (2014), Queiroz and Mendonça (2015). For complete species names see Table 7A1.…………………………………………………………………………………………….145
Long-term development of Collembola communities on a former rubble deposit
5
Index of figures
Figure 2.1. Study area on the plateau of Siedenburg dump site in the vicinity of Bremen, Germany with two experimental plots; SUC [the plot left for natural secondary succession] and REC [the plot recultivated with rotary tilling] (left). Grid pattern of the dump site and location of the sampling plots (right). The grid size is 10 m plus 1 m way (grid line) in each case; the positions of destructive samplings for zoology are shown with orange squares (1980-1995) and yellow squares (1996-2000) on REC and with orange squares (1980-2000) on SUC. Green squares show the positions of botanical samplings (right) (from Koehler and Müller 2003)…………………..29 Figure 2.2. Representative pictures of three orders of Collembola after clearing in 10% NaOH for 10 minutes at five different temperatures and subsequent mounting in Marc André 2 medium. (A) 40 °C, (B) 45 °C, (C) 50 °C, (D) 55 °C, (E) 60 °C. Pictures correspond to methods 1A to 1E in Table 2.1, respectively. All scale bars 0.5 mm…………………………………………………...34 Figure 2.3. (A) a, b: Collembola mounted in Marc André 2 at 75 ± 5 °C for 72 hours; pretreatment: a – Toerne, b – Lactoglycerol. c–e: Collembola mounted in Huether’s E65 at 75 ± 5 °C for 72 hours; pretreatment: c – Toerne, d – Huether 1 five days, e – Huether 1 one day. f, g: Collembola mounted in PVA at 75 ± 5 °C for 72 hours; pretreatment: f – Toerne, g – ethanol 99%. (B) Collembola mounted in Marc André 2 at 55 °C for 72 hours; pretreatment: DNA extraction method. (C) a–c: Collembola mounted in a – Marc André 2, b – PVA, c – Rusek’s mixture without pretreatment at 75 ± 5 °C for 72 hours. All scale bars 0.5 mm…………………...……………….35 Figure 2.4. Pictures of chaetal pattern (here using the example of Isotomidae). Collembola mounted in Marc André 2 at 55 °C for 72 hours; (A) pretreatment: 10% NaOH (poor result), (B) pretreatment: DNA extraction method (good result). All scale bars 0.1 mm……….…………….36 Figure 3.1. Changes of (A) air temperature, (B) precipitation, and (C) soil temperature -10 cm from mean values from October to September (Oct-Sep) for 1980-2000 (Bremen airport, 1980 to 2000 from German Weather Service; www.dwd.de).....................................................................47 Figure 3.2. Total Collembola abundance (103*ind/m2) on SUC (the plot left for natural secondary succession) and REC (the plot recultivated with rotary tilling) for 1980-2000…………………..50 Figure 3.3. Species numbers and diversity indices; Species richness, Shannon-Weaver (Shan) and Simpson indices (Simp) in selected years on SUC (the plot left for natural secondary succession) and REC (the plot recultivated with rotary tilling) in three phases of succession: early phase (1980, 1981, 1982), intermediate phase (1986, 1990, 1994) and late phase (1998, 1999, 2000)…………………………………………………………………………………………….50 Figure 3.4. (A) Dominance structure of endogeic Collembola indicator species (according to a threshold dominance of more than 10% and CCA scores for soil temperature -10 cm; for details see Table 3A2) on SUC (the plot left for natural secondary succession) and REC (the plot recultivated with rotary tilling). Species complete names in alphabetical order: elan= Entomobrya lanuginosa, enic= Entomobrya nicoleti, fcan= Folsomia candida, fmir= Friesea mirabilis, ipal= Isotomurus palustris, ipro= Isotomodes productus, llan= Lepidocyrtus lanuginosus, mkra=

Long-term development of Collembola communities on a former rubble deposit
6
Mesaphorura krausbaueri, mmin= Megalothorax minimus, palb= Pseudosinella alba, pimm= Pseudosinella immaculata, pmin= Proisotoma minuta, pnot= Parisotoma notabilis, spum= Sphaeridia pumilis, wano= Willemia anophthalma. (B) Species turnover rate (Sp. turnover rate) between the selected years on SUC and REC. (C) Soerensen (Soe) and Renkonen (Ren) similarity indices between SUC and REC. All these analyses were performed for three phases of succession: early phase (1980, 1981, 1982), intermediate phase (1986, 1990, 1994) and late phase (1998, 1999, 2000)……………………………………………………………………………….……………51 Figure 3.5. Cluster dendrogram of log-transformed Collembola abundance data consisting of 4 groups based on average linkage clustering. (s=SUC; the plot left for natural secondary succession, r=REC; the plot recultivated with rotary tilling, 80=1980, 81=1981, 82=1982, 86=1986, 90=1990, 94=1994, 98=1998, 99=1999, 100=2000)………………………………….53 Figure 3.6. CCA ordination diagrams (outcome of one CCA analysis, divided in four figures for better legibility): (A)-(B) Vectors characterizing environmental variables (air temperature, soil temperature -10 cm and precipitation) are shown with arrows. (C)- (D) Collembola indicator species are shown by square points, with considering axis X as temperature and axis Y as precipitation. For complete species names see Table 3A1. (SUC; the plot left for natural secondary succession and REC; the plot recultivated with rotary tilling)……………………….…………..54 Figure 3.7. DCA ordination of successional sites for (A) vegetation cover and (B) Collembola abundance. (s=SUC; the plot left for natural secondary succession, r=REC; the plot recultivated with rotary tilling, 80=1980, 81=1981, 82=1982, 86=1986, 90=1990, 94=1994, 98=1998, 99=1999, 100=2000)…………………………………………………………………………….55 Figure 3A1. Climatograms (after Walter and Lieth) of Bremen, Germany; Temperature (thin line) vs. precipitation (thick line). The drought points are shown here with black circles (from Koehler and Müller 2003)………………………………………………………………………………...58 Figure 3A2. Vertical distribution of total Collembola abundance (10³*ind/m2) at 0-4 cm, 4-8 cm and 8-12 cm depths on SUC (the plot left for natural secondary succession) and REC (the plot recultivated with rotary tilling) for 1980 to 2000………………………………………………...59 Figure 4.1. Total abundance of Collembola (from Daghighi et al. 2017) and Gamasina (103*ind/m2) on SUC [the plot left for natural secondary succession] and on REC [the plot recultivated with rotary tilling] for 1980 to 2000. Shown are mean values (1980, 1981, 1982; n=6), (1986, 1990; n=6, 1994; n=10) and (1998, 1999, 2000; n=10)…………………………………...68 Figure 4.2. (A) Species number, (B) Shannon-Weaver (Shan) and (C) Simpson (Simp) indices for Collembola (from Daghighi et al. 2017) and Gamasina on SUC [the plot left for natural secondary succession] and on REC [the plot recultivated with rotary tilling] in selected years of succession: early years (1980, 1981, 1982), intermediate years (1986, 1990, 1994) and late years (1998, 1999, 2000). Shown are mean values (1980, 1981, 1982; n=6), (1986, 1990; n=6, 1994; n=10) and (1998, 1999, 2000; n=10)…………………………………………………………….69 Figure 4.3. Species turnover rate of Collembola (from Daghighi et al. 2017) and Gamasina on SUC [the plot left for natural secondary succession] and REC [the plot recultivated with rotary

Long-term development of Collembola communities on a former rubble deposit
7
tilling] between the selected years of succession: early years (1980, 1981, 1982), intermediate years (1986, 1990, 1994) and late years (1998, 1999, 2000). Shown are mean values (1980, 1981, 1982; n=6), (1986, 1990; n=6, 1994; n=10) and (1998, 1999, 2000; n=10)………………………71 Figure 4.4. Soerensen and Renkonen similarity indices of Collembola (from Daghighi et al. 2017) and Gamasina between SUC [the plot left for natural secondary succession] and REC [the plot recultivated with rotary tilling] in selected years of succession: early years (1980, 1981, 1982), intermediate years (1986, 1990, 1994) and late years (1998, 1999, 2000). Shown are mean values (1980, 1981, 1982; n=6), (1986, 1990; n=6, 1994; n=10) and (1998, 1999, 2000; n=10)…………………………………………………………………………………………….72 Figure 4.5. DCA ordination of successional sites based on the abundance of (A) Collembola (from Daghighi et al. 2017), (B) Gamasina, and (C) cover percentage of each plant species (from Daghighi et al. 2017). (s=SUC; the plot left for natural secondary succession, r=REC; the plot recultivated with rotary tilling, 80=1980, 81=1981, 82=1982, 86=1986, 90=1990, 94=1994, 98=1998, 99=1999, 100=2000)………………………………………………………………….74 Figure 4.6. RDA ordination diagrams (outcome of one RDA analysis, divided in four figures for better legibility): (A)-(C) Vectors characterizing significant environmental variables (ST: soil temperature at 10 cm depth; R: pH reaction and F: soil humidity [Ellenberg’s indicator values]) are shown with thin black arrows. (A)-(B) Collembola (from Daghighi et al. 2017) and (C)-(D) Gamasina dominant species (dominance >10%) are shown by square points, with considering axis X as soil temperature and axis Y as F: soil humidity [Ellenberg’s indicator value] for both groups. The thick black arrows show the time of stopping mowing in r86. The direction of time is shown by grey arrows. (s=SUC the plot left for natural secondary succession, is shown by dash line and triangle time points r=REC the plot recultivated with rotary tilling, is shown by solid line and round time points, 80=1980, 81=1981, 82=1982, 86=1986, 90=1990, 94=1994, 98=1998, 99=1999, 100=2000). For complete species names see Tables 4A1, 4A2 and 4A3………………………………………………………………………………………………75 Figure 4A1. Model of six distinguished successional phases of Collembola and Gamasina dominance [>4%] development (Tables 4A4 and 4A5) with identifying the representative dominant species of each phase on SUC [the plot left for natural secondary succession] and on REC [the plot recultivated with rotary tilling] during twenty years of study……………………..85 Figure 4A2. Dominance structure of five distinguished ecological groups for Collembola and Gamasina: Eurytopic [wide variety of habitats], Forest, open [open natural habitats containing grasslands, meadows, agricultural fields], Hygrophilous [damp sites], others [without distinctive and sufficient ecological data] on SUC [the plot left for natural secondary succession] and on REC [the plot recultivated with rotary tilling]…………………………………………………………86 Figure 7A1. (A) Cover of short common setae of D. trispinata that looks like fur. (B) Colourful iridescence pattern of specimens. Within the pictures the macrosetae are visible as whitish setae that stood out. Scale bars 1 mm………………………………………………………………...127

Long-term development of Collembola communities on a former rubble deposit
8
Figure 7A2. Representative pictures of specimens of D. trispinata after clearing in warm lactic acid (80 °C) at six different times for heating (A) 30 seconds, (B) 45 seconds, (C) one minute, (D) two minutes, (E) three minutes, (F) four minutes and in (G) SNET buffer solution (DNA extraction method). All scale bars 0.5 mm…………………………………………………………………127 Figure 7A3. Pictures of the whole body of specimens of D. trispinata after clearing in SNET buffer solution (A) without killing and (B) with killing in ethanol 98%. Pictures of external features; (C) chaetal pattern on abdominal segments, (D) tibiotarsus, (E) a setae like structure on tibiotarsus I, II, III may be distinguished wrongly as a clavate tenent hair from specimens of D. trispinata mounted in Marc André 2 after clearing in SNET buffer solution with killing in ethanol 98%.............................................................................................................................................128 Figure 7A4. (A) Difference in colour between a freshly moulted (shiny black) D. trispinata and a specimen that will change its exoskeleton soon (greyish black). (B) An adult stripping the white remains of an exoskeleton. (C) A dead adult specimen coloured in black with whitish tips of furca and legs. In the upper right corner a whitish exuvia is visible. Scale bars 1 mm.………….…..135 Figure 7A5. Life history time steps of D. trispinata investigated by two synchronisations………………………………………………………………………………..136 Figure 7A6. Development of D. trispinata and its change in colour by age. (A) Eggs with black pigmented ommata. (B) Hatchling leaving an egg shell. (C) Juvenile (≤ 24 hours) together with a reproductive adult (25 days). (D) Juveniles at day 2. (E) Adults with juveniles of different ages up to 7 days. Specimens at day 7 (F), 14 (G), 21 (H), 25 (I) and 37 (J). Within the fourth to sixth week the first specimens turned into the black of the fully grown adults. (I) and (J) illustrate the difference in colour between the dark midnight bluish-violet and the final “black” of the adults. Scale bars 0.5 mm………………………………………………………………………………138

Long-term development of Collembola communities on a former rubble deposit
9
Summary
Eighteen sampling campaigns were evaluated for investigating the long-term secondary succession of Collembola communities in relation to climate change and vegetation and in comparison with Gamasina communities at two different managed experimental plots. One plot (SUC) was left undisturbed for natural secondary succession, the other plot (REC) was recultivated with rotary-tilling and sowing of grass. This experiment was done on a former rubble deposit over 20 years and samplings took place from 1980 to 2000. Selected sampling campaigns, the first three years (1980, 1981, 1982), the last three years (1998, 1999, 2000) and in-between with an interval of four years (1986, 1990, 1994), were evaluated and studied between 2014 and 2017. In total, 14,742 Collembola individuals were counted and identified by the author. Those consisted of 33 species of which 25 species were identified by the author herself. The most dominant species were: Mesaphorura krausbaueri, Parisotoma notabilis and Isotomodes productus. The analysis of Collembola from this collection posed great challenges in clearing the specimens stored in 70% ethanol for 15-32 years for microscopical inspection. None of the five media with different clearing properties tested for permanent slide mounts cleared the old specimens sufficiently, therefore, pretreatment procedures had to be applied. As such, to achieve good clearing of old ethanol collection material, it is recommended to incubate it in DNA extraction buffer solution such as SNET plus proteinase K and to mount it in Marc André 2 for best optical results. Long-term successional development of Collembola was investigated at the species level with calculation of abundance (ind/m2), dominance, diversity indices, presence-absence and dominance similarity and species turnover rate. Successional stages of Collembola species in both experimental plots were identified. Ecological groups were also distinguished for Collembola species. Long-term succession of Collembola was related to the changes of climatic variables and vegetation in the studied area over 20 years. This relationship was analysed and modeled applying canonical correspondence analysis, linear regression analysis and average linkage clustering for the Collembola abundance data. The model reveals four distinct climatic groups of evaluated data and shows a significant influence of soil temperature on the long-term successional development of Collembola species. No evidence was found for the correlation of Collembola species abundance with vegetation covers. Thus, they are both either independent from each other or at least not related directly. A comparative study was performed to study the synchronicity of the successional development of Collembola, Gamasina and plant species. This was also compared between two experimental plots. To compare the abundance data from Collembola with Gamasina, the same calculations were performed for successional development of Gamasina species, and the model of successional stages and the structure of ecological groups were also provided for Gamasina species. The successional synchrony among the three organism groups was evaluated and modeled with detrended correspondence analysis. Redundancy analysis and

Long-term development of Collembola communities on a former rubble deposit
10
linear regression revealed models for the evaluation of the influence of environmental variables on the successional development of investigated microarthropod groups. Again, soil temperature was proved as a significant factor for both groups, and pH was significantly influential in the long-term development of Gamasina species. Different management in SUC and REC played an important role in successional changes of the three organism groups; the difference between two plots was observable especially in Gamasina. Overall, Collembola community was more similar between both plots and Gamasina community was generally more diverse. Replacement of species during a successional study is mainly related to time i.e. their temporal shifts. Moreover, some environmental variables may influence this process effectively and significantly; in particular soil temperature and pH are determined as such important factors in this study.

Long-term development of Collembola communities on a former rubble deposit
11
Zusammenfassung
Achtzehn Probenahmekampagnen wurden für die Untersuchung der langfristigen sekundären Sukzession von Collembolengemeinschaften im Bezug auf Klimawandel und Vegetation und im Vergleich zu Gamasinengemeinschaften auf zwei unterschiedlich bewirtschafteten, experimentellen Flächen bewertet. Eine Fläche (SUC) wurde für die natürliche Sekundärsukzession ungestört gelassen, die andere Fläche (REC) wurde durch Fräsen und Grasansaat rekultiviert. Dieses Experiment wurde auf einer ehemaligen Bauschuttdeponie über 20 Jahre durchgeführt und die Probenahmen fanden von 1980 bis 2000 statt. Zwischen 2014 und 2017 wurden folgende Probenahmekampagnen ausgewertet: die ersten drei Jahre (1980, 1981, 1982), die letzten drei Jahre (1998, 1999, 2000) und dazwischen mit einem Intervall von vier Jahren (1986, 1990, 1994). Insgesamt wurden 14,742 Collembolen von dem Autor ausgezählt und identifiziert. Diese enthielten 33 Arten, wovon der Autor 25 Arten selbst bestimmte. Die dominantesten unter ihnen waren: Mesaphorura krausbaueri, Parisotoma notabilis und Isotomodes productus. Die Analyse von Collembolen aus dieser Sammlung stellte große Herausforderungen bei der Aufhellung der bereits für 15-32 Jahre in 70% Ethanol konservierten Proben für die mikroskopische Inspektion dar. Fünf verschiedenen Medien für Dauerpräparate mit unterschiedlichen Aufhellungseigenschaften wurden getestet. Keine dieser Medien hat die Individuen ausreichend aufgehellt. Daher mussten Vorbehandlungsverfahren angewendet werden. Um eine gute Aufhellung des alten Ethanol-Sammelmaterials und beste optische Ergebnisse zu erreichen, empfiehlt es sich, es in DNA-Extraktionspufferlösung wie SNET plus Proteinase K zu inkubieren und es in Marc André 2 zu fixieren. Die langfristige sukzessive Entwicklung von Collembolen auf der Artenebene wurde mit der Berechnung der Abundanz (Ind/m2), der Dominanz, der Diversitätindizes, der Anwesenheit-Abwesenheit und der Dominanz Ähnlichkeit und der Artenumsatzrate untersucht. Sukzessive Stadien der Collembolenarten wurden in beiden experimentellen Flächen identifiziert. Auch wurden ökologische Gruppen für Collembolenarten unterschieden. Die langfristige Sukzession von Collembolen hängt mit den Veränderungen der Klimavariablen und der Vegetation über 20 Jahre im untersuchten Gebiet zusammen. Diese Beziehung wurde analysiert und mit der kanonischen Korrespondenzanalyse, der linearen Regressionsanalyse und dem durchschnittlichen Verknüpfungsclustering für die Collembolenabundanzdaten modelliert. Das Modell zeigt vier verschiedene klimatische Gruppen von ausgewerteten Daten und zeigt einen signifikanten Einfluss der Bodentemperatur auf die langfristige sukzessive Entwicklung der Collembolenarten. Es wurde kein Beweis für die Korrelation der Abundanz der Collembolenarten mit der Vegetationsabdeckung gefunden. Demnach sind sie beide unabhängig voneinander oder zumindest nicht direkt verbunden. Es wurde eine vergleichende Studie durchgeführt, um die Synchronizität der sukzessiven Entwicklung von Collembolen, Gamasinen und Pflanzenarten zu untersuchen. Dies wurde auch zwischen den zwei experimentellen Flächen verglichen. Um die

Long-term development of Collembola communities on a former rubble deposit
12
Abundanzdaten von Collembolen mit Gamasinen zu vergleichen, wurden die gleichen Berechnungen für die sukzessive Entwicklung der Gamasinenarten durchgeführt und das Modell der sukzessiven Stadien und die Struktur der ökologischen Gruppen wurde ebenfalls für Gamasinenarten bereitgestellt. Die sukzessive Synchronität zwischen den drei Organismengruppen wurde ausgewertet und mit einer detrendierten Korrespondenzanalyse modelliert. Redundanzanalyse und lineare Regression ergaben Modelle zur Bewertung des Einflusses von Umgebungsvariablen auf die sukzessive Entwicklung der untersuchten Mikroarthropodengruppen. Wiederum erwies sich die Bodentemperatur als ein wesentlicher Faktor für beide Gruppen und der pH-Wert beeinflusste die langfristige Entwicklung der Gamasinenarten. Die verschiedene Managementformen in den Flächen SUC und REC spielten eine wichtige Rolle bei der sukzessiven Veränderung der drei Organismengruppen; der Unterschied zwischen zwei Flächen war vor allem in Gamasinen zu beobachten. Insgesamt war die Collembolengemeinschaft zwischen den beiden Flächen ähnlicher und die Gamasinengemeinschaft war in der Regel vielfältiger. Der Ersatz der Arten während einer Sukzessionsstudie bezieht sich hauptsächlich auf die Zeit, d.h. ihre zeitlichen Verschiebungen. Darüber hinaus können einige Umgebungsvariablen diesen Prozess effektiv und signifikant beeinflussen; insbesondere die Bodentemperatur und der pH-Wert werden als solche Faktoren in dieser Studie bestimmt.

Long-term development of Collembola communities on a former rubble deposit
13
Introduction

Long-term development of Collembola communities on a former rubble deposit
14
1 Introduction
Microarthropods Soil organism communities constitute an essential part of natural and disturbed ecosystems. The necessity to know about the diversity of species is the key to comprehend ecosystems, due to the influential roles of soil communities in function and stability of ecosystems. Microarthropods, such as mites and Collembola, are the most important and abundant soil organisms in vegetation/soil interface (Bardgett 2005), and they are key components of soil decomposer communities in most ecosystems worldwide (Bokhorst et al. 2014). Based on the main focus of this thesis, mostly detailed information given here is about Collembola.
1.1 Collembola Collembola, numerically, are considered to be the dominant hexapoda in most terrestrial ecosystems. Most species of Collembola live in the soil of gardens, arable fields and forests and also in leaf litter and most of the Collembola feed on decaying plant materials, fungi and bacteria. Some terrestrial acarids are the predator of Collembola and in this case Collembola group is a part of their food chain. Just a few species are known as pest in greenhouses, alfalfa farms and center of mushroom nursery (Triplhorn and Johnson 2005). Collembola are present in a wide range of habitats, even in the most extreme environments. Still, new and undiscovered Collembola species exist in a well-known area like Western Europe (Deharveng 2004), and many of the unknown species are expected to occur in tropical regions. A history about research studies of Collembola is given in Appendix. From a morphological aspect, body size of Collembola ranges between 1 and 5 mm with a minimum of 0.12 mm and a maximum of 17 mm. They are entognathous with mouthparts inside the buccal cavity and wingless hexapods. Their antennae are always present. The presence of antennae and absence of cerci differentiate Collembola from other entognathous hexapods, the Protura (with antennae and cerci absent) and the Diplura (with antennae and cerci present). Collembola are characterized by their peculiar abdominal appendages namely ventral tube, furca (jumping organ), retinaculum (furca-holding organ), and the postantennal organs (PAO), sensory organs which are the remnants of the 2nd pair of antennae of its ancestral crustacean (Bellinger et al. 1996-2017). According to these authors, Collembola are currently classified into four orders: Poduromorpha Börner, 1913, Entomobryomorpha Börner, 1913, Symphypleona Börner, 1901 and Neelipleona Massoud, 1971. About the etymology of this group of soil animals, it was proposed for “the division of the Thysanura comprised in the Linnaean genus Podura the term Collembola, as indicating the existence of a projection or mammalia enabling … to attach or glue itself … (from colla (Latin), from kolla (Greek): glue; from embolon (Greek): that what has been thrown into something, …; from emballein (Greek): to throw into, to insert)” (Bellinger et al. 1996-2017). There are ca 8,600 described Collembola species worldwide. Fossils of Collembola belong to the Devonian time, ca 400 million years ago. Thus, they are ancient and considered as one of the oldest known records of terrestrial animals. These organisms are ubiquitous and among the most

Long-term development of Collembola communities on a former rubble deposit
15
successful arthropod lineages in terrestrial ecosystems (Bellinger et al. 1996-2017). Applying the ratio by Mora et al. (2011) between described and unknown species for the whole animal kingdom, we estimate that the global diversity of Collembola could reach about 65,000 species. Taxonomic impediment is the key reason for the present underestimation of Collembola diversity and many other groups of soil invertebrates (Decaëns 2010), and this happens due to difficult taxonomy merged with scarcity of specialists (Porco et al. 2014). From an ecological aspect, there are many oversimplified views concerning the role of Collembola in ecosystems and they are among the most abundant microarthropods in the rhizosphere of plants (Filser 2002; Forey et al. 2015). In the food web in soil with functional groups, Collembola are considered only to be fungivorous, which can affect the reproduction strategy and phenology of plants (Rusek 1998; Filser 2002; Forey et al. 2015). As a key group they regulate, among others, decomposition and nutrient cycling. Strong influences of various Collembola species on plant roots have been highlighted in several studies: indirectly by regulating availability of soil nutrients (Bardgett and Chan 1999; Filser 2002; Ngosong et al. 2014; from Forey et al. 2015) or directly by applying rhizophagous pressure (Endlweber et al. 2009; from Forey et al. 2015). Overall, Collembola are qualified for bioindication of ecosystem processes like succession by their high diversity and complex relationships within soil ecosystems.
1.1.1 Systematics The recent taxonomic hierarchy (Bellinger et al. 1996-2017) is mainly based on Bretfeld (1999), D'Haese (2002), and Deharveng (2004), which is used and followed by the author for classification of identified Collembola species in the current thesis (Table 1.1). This is known as a necessity for the correct illustration of species determination and their taxonomy, which is strongly prerequired in ecological studies. Like in most other arthropod groups, despite the enormous progress in molecular techniques (e.g., bar-coding), morphological features will remain essential for Collembola taxonomy (Deharveng 2004). Phylogenetic relationships among the entognathous primarily wingless insects were revised by Dell’Ampio et al. (2013). The monophyly of Entognatha is supported by Meusemann et al. (2010) and Von Reumont et al. (2012), considering entognathy to have evolved in the last common ancestor of the groups. However, Dell’Ampio et al. (2013) found no evidence for that. Hence, as stated by Prabhoo (1987) and Deharveng (2004), an integrated approach (e.g., using morphological and molecular tools) to the study of taxa helps to reconstruct taxa relationships and appears extremely desirable to elucidate the ecological importance of species. Knowing that species level determines one type of biological indication (Dunger and Voigtländer 2005), investigating the relationship between the taxonomic structure of soil communities and their functioning in ecosystems remains a challenging task in soil ecology (Potapov et al. 2016). For this purpose, an example of a combined study of taxonomy and ecology of a specific Collembola species (Isotomidae: Desoria trispinata) in the lab condition is given in Appendix.
Long-term development of Collembola communities on a former rubble deposit
16
Table 1.1. Collembola taxonomic hierarchy (Bellinger et al. 1996-2017) and identified species of Collembola in this
study.
Poduromorpha Neanuroidea Neanuridae Caputanurininae Frieseinae Friesea mirabilis (Tullberg, 1871) Morulininae Neanurinae Neanura muscorum (Templeton, 1835) Pseudachorutinae Uchidanurinae Brachystomellidae Brachystomella parvula (Schäffer, 1896) Poduroidea Poduridae Hypogastruroidea Hypogastruridae Hypogastrura assimilis Krausbauer, 1898 Willemia anophthalma Börner, 1901 Paleotullbergiidae Gulgastruroidea Gulgastruridae Onychiuroidea Onychiuridae Onychiurinae Tetrodontophorinae Lophognathellinae Tullbergiidae Mesaphorura krausbaueri Börner, 1901 Metaphorura affinis Börner, 1902 Isotogastruridae Pachytullbergiidae Odontellidae Entomobryomorpha Tomoceroidea Oncopoduridae Tomoceridae Isotomoidea Isotomidae Proisotominae Anurophorinae Isotomina sp. Isotomina bipunctata Axelson, 1903 Isotomodes productus (Axelson, 1906) Isotominae Isotoma sp. Isotoma viridis Bourlet, 1839 Isotomiella minor (Schäffer, 1896) Isotomurus palustris (Müller, 1776) Parisotoma notabilis (Schäffer, 1896) Pachyotominae Actaletidae Protentomobryidae Entomobryoidea Microfalculidae Orchesellidae Orchesella cincta (Linnaeus, 1758) Orchesella villosa (Geoffroy, 1764) Bessoniellinae Nothobryinae Orchesellinae Heteromuridae Lepidocyrtidae Lepidocyrtinae Lepidocyrtus lanuginosus (Gmelin, 1788) Pseudosinella alba (Packard, 1873) Pseudosinella halophila Bagnall, 1939 Pseudosinella immaculata (Lie-Pettersen, 1896) Cyphoderinae Cyphoderus albinus Nicolet, 1841 Seiridae Praentomobryidae Entomobryidae Entomobryinae Entomobrya sp. Entomobrya lanuginosa (Nicolet, 1842) Entomobrya nicoleti (Lubbock, 1868) Entomobrya marginata (Tullberg, 1871) Entomobrya multifasciata (Tullberg, 1871) Entomobrya schoetti Stach, 1922 Willowsiinae Willowsia buski (Lubbock, 1869)
(continued on next page)

Long-term development of Collembola communities on a former rubble deposit
17
Table 1.1 (continued) Paronellinae Oncobryidae Coenaletoidea Coenaletidae Neelipleona Neelidae Megalothorax minimus Willem, 1900 Symphypleona Sminthuridoidea Mackenziellidae Sminthurididae Sphaeridia pumilis (Krausbauer, 1898) Katiannoidea Katiannidae Sminthurinus elegans (Fitch, 1863) Spinothecidae Arrhopalitidae Collophoridae Sturmioidea Sturmiidae Sminthuroidea Sminthuridae Sminthurinae Songhaicinae Sphyrothecinae Bourletiellidae Bourletiella hortensis (Fitch, 1863) Dicyrtomoidea Dicyrtomidae Ptenothricinae Dicyrtominae

Long-term development of Collembola communities on a former rubble deposit
18
1.1.2 Ecology Collembola are microarthropods which, together with mites, constitute an important component of soil mesofauna in almost all terrestrial ecosystems and they live in wet as well as in dry ecosystems from arctic and alpine tundra to deserts and tropical rain forests. Collembola are found in high diversity [20-40 species per m2] and abundance [up to a million individuals per m2]. Collembola and Acari feed on leaf litter, fungi and other micro-organisms, which in turn promotes nutrient and carbon cycling in the soil (Filser 2002), and they affect decomposition processes directly through fragmentation of litter and through fecal production (Kardol et al. 2011). The below-ground section fundamentally drives the above-gound system, which also subsequently determines ecosystem fate and properties (Forey et al. 2015). Changes of vegetation due to the large scale drivers have effect on the biodiversity in below-ground and also on the overall ecosystem functions such as decomposition and nutrient cycling. Thus, to predict this, an understanding of the relationships between communities of above- and below-ground is necessary (Mitchell et al. 2016). The decisive issue to the functionality of ecosystems is recognized by the interchange of nutrients and carbon between communities of microarthropods and plants (Bokhorst et al. 2014). It is known that most of the terrestrial ecosystems infrequently undergo “extreme weather events, such as winter warming, prolonged droughts, severe frost periods and extreme rainfall” (Van Dooremalen et al. 2013). The ability of soil organisms e.g. Collembola to overcome with such extreme weather events depends on mitigation through physiological adaptations or migration to avoid the stressful conditions (Berg et al. 2010; Bokhorst et al. 2012a). Further explanations about ecology of each studied Collembola species in this thesis are given in Appendix.
1.2 Succession An essential and vital conception in the early development of ecology was succession, which has been studied with different methods (Prach and Walker 2011): “with field observations based on chronosequences or long-term plots (Johnson and Miyanishi 2008; Walker et al. 2010), experimental manipulations (Prach and Walker 2011) and models (Connell and Slatyer 1977; Tilman 1985; Walker and Chapin 1987)”. Many ecological topics of immediate concern can be investigated in the conceptual framework of succession (Prach and Walker 2011). Successional mechanisms, stages and trajectories are three main components of succession (Prach and Walker 2011). Relating the successional studies to a better comprehension of ecological implications of biodiversity loss, climate change, invasive species, and restoration needs the utilization of modern tools including experiments involved across resource gradients, meta-analyses of data sets in multi-site, mathematical modeling and expert systems (Prach and Walker 2011). Therefore, succession is kept to be considered as a central and indispensable concept in ecology, which can provide critical contributions for understanding implications of challenges in the current environment (Prach and Walker 2011). According to Mori et al. (2017), “succession is the sequential appearance and/or replacement of

Long-term development of Collembola communities on a former rubble deposit
19
species following disturbance, new land formation or deglaciation, which has been a central theme throughout the history of ecology”. According to Schaefer (2012), succession is the replacement of an organism community through another, which is limited by climate, soil or vital activity of organisms. The temporal succession should not be confused by the concept of chronosequence [space-for-time substitution] (Schaefer 2012). Therefore, it can be concluded that soil faunal succession is a slow ecological process of dynamic changes occurring in ecosystems (Faleńczyk-Koziróg et al. 2012), which may be studied and judged by using chronosequences; this compares communities that differ in time since disturbance and it was often found that older or late successional communities consist of more distantly related species (e.g., Pickett 1989; Hågvar 2010; Letcher et al. 2012; Purschke et al. 2013; Li et al. 2015; Rzeszowski and Sterzyńska 2016). Overall, for such studies, dumps are valuable sites (e.g., Dunger 1968; Zerling 1990; Koehler 1998, 2000). There are some long-term studies following succession at individual sites (e.g., Huhta et al. 1979; Hutson 1980; Petersen 1995; from Koehler 1998, 2000), but long-term studies of invertebrates have achieved increased focus during the last decade (e.g., Kaufmann and Raffl 2002; Dunger et al. 2004; Hodkinson et al. 2004; Gobbi et al. 2006; Hågvar et al. 2009; from Hågvar 2010). First, succession is an ecosystem process and therefore, second, animals cannot be discussed without other organisms. Third, abiotic or management changes induce different patterns of succession, which is per se a biotic process. There are two types of succession: (1) primary succession occurs following disturbance which leaves no trace of the pre-existing community (if any); the most common forms follow volcanic eruptions, glacial recession, and movement of sand dunes. Early stages of primary succession are generally harsh environments, and soils and biological communities develop slowly; and (2) secondary succession occurs where disturbance kills or removes vegetation but leaves the soil intact which still contains microoraganisms and resistant stages of animals and seed bank. In the current study both experimental plots (SUC and REC) were established after grading the plateau with heavy machinery. In this kind of soil, vegetation regrowth can begin immediately following disturbance. Thus, secondary succession is the restoration of the former condition after stronger interventions from outside e.g. clearcut logging, natural windthrows and fire, flooding, grazing and farming (Vitousek et al. 1989; Schaefer 2012).
1.3 Long-term dynamics in relation to environmental variables Under natural conditions, a secondary succession would start immediately after a disturbance, e.g. forest destruction by storm, which in Central Europe soon would become a species rich ruderal community and within some centuries a forest (Koehler 1999). In ecological succession, staggered sequences of communities may be observed. The results confirm that ecological succession is a slow ecosystem process and requires time scales which measure in decades (Koehler and Melecis 2010). In early stages of succession, the role of soil organisms in influencing soil structure by burrowing and effects related to their feeding activity may be decisive with a poor species richness (diversity) above- and below-ground and a high risk of nutrient loss (Koehler 1999). Environment

Long-term development of Collembola communities on a former rubble deposit
20
strongly filters and confines the early colonizers of succession. However, biota living above- and below-ground are subsequently and increasingly altering the environment throughout the development processes of ecosystem (Mori et al. 2017). High densities of soil animals have regularly been observed in the first phase of population development (e.g., Meijer 1989; Petersen 1995; Koehler 1998, 2000; Dunger et al. 2004). A few specialized pioneer colonizers with high dispersal and reproductive capacities have their chance to build up large populations. Diversity soon increases and may reach even higher levels than in the final successional stage (Koehler 1999). Following a disturbance, species with a good dispersal ability are able to quickly recolonize an area, which is also essential for the persistence of populations in fragmented patches and enable adaptation of species distributions in response to e.g. climatic changes (Lindberg 2003). Permanent changes in community composition caused by disturbances on a large scale may affect the resilience of soil ecosystems; following the slow recovery of soil fauna after disturbance (Lindberg 2003). Succession can be regarded as a model of soil fauna recovery after disturbances, either caused by natural or anthropogenic effects (Kaufmann 2001). These general observations of successional process apply to different groups of organisms e.g. soil animals, i.e. soil microfauna [Protozoa and Nematodes], soil mesofauna [enchytraeids and microarthropods, e.g., Acari and Collembola] and soil macrofauna [earthworms and arthropods] (Koehler 1999). Therefore, biodiversity of soil mesofauna could be an interesting model of ecological succession: biodiversity is a basic issue and ecosystem relationships are based on biodiversity. Changes in species composition and dominance structure of soil fauna may significantly affect litter decomposition and soil formation, making it more or less vulnerable to degradation and loss of ecosystem services, such as soil fertility, water retention or carbon sequestration (Koehler and Melecis 2010). Collembola can be used as indicators of environmental alterations as they respond to changes in soil conditions and vegetation cover (Chauvat et al. 2003; Ponge et al. 2003; Chauvat et al. 2011). Studying long-term development of Collembola communities (e.g., in comparison to plants and predatory mites as in this study) should reveal the long-term changes of soil ecosystems relevant for the consideration of environmental effects. Therefore, such long-term studies deserve high priority for the understanding of ecosystem functioning in response to environmental changes crucial for human existence, including that of climate (Koehler and Melecis 2010). Nature is not static. Ecosystems change and succession never stops (Connell and Slatyer 1977), and has explicitly to be considered in long-term studies (Koehler and Melecis 2010). A better understanding of these processes is required to predict the response of communities and ecosystems to climate change, which will probably have large consequences for future management of ecosystems (Lindberg 2003). Climate change can influence soil microarthropod community abundance and composition directly by altering soil climate (moisture and temperature) and indirectly by altering resource availability and the composition of the soil food web (Kardol et al. 2011), with implications for ecosystem functioning (Alatalo et al. 2015). The crucial issue in ecosystem functioning with

Long-term development of Collembola communities on a former rubble deposit
21
interactions between various ecosystem components during succession (Frouz et al. 2008) is decomposition of organic matter because of its substantial role in providing ecosystem services for plant growth and primary production (Maharning et al. 2009). Microarthropods contribute to this directly through litter consumption and comminution, or indirectly e.g. through stimulation of microbial activity by grazing (Seastedt 1984; Filser 2002; Fujii and Takeda 2017). Two important factors substantially affecting soil microarthropod life are soil temperature and moisture (Choi et al. 2006), and they directly and indirectly affect soil biodiversity and ecosystem functions (Haimi et al. 2005; Yan et al. 2015). Soil temperature and moisture strongly influence the reproduction and developmental rate of microarthropods; they can directly be altered by warming and changes in precipitation. An indispensable prerequisite for knowing environmental effects on soil organisms, however, would be a much better understanding of the response of selected groups of organisms to long-term fluctuations in environmental conditions (e.g., Van Straalen 1994; Wolters 1998; Lindberg 2003; Uvarov 2003; Kardol et al. 2011). About the effect of climate warming on soil microarthropods; focused on the effect of changes in soil temperature and moisture on Collembola communities, many studies were carried out in different regions, sometimes with contradictory results (Yan et al. 2015; for further details see Table 1.2). In this context, it is emphatically important to study the specific response of Collembola species to global warming and other environmental factors (Yan et al. 2015). However, the results of model experiments (experimentally simulated effects of environmental variables) suffer from restricted spatial and temporal scales (Koehler and Melecis 2010). Key for ecosystem responses to environmental changes due to warming may be changes in soil processes which regulate the availability of plant nutrients (Dormann and Woodin 2002; Hågvar and Klanderud 2009). Effects of soil biota on the successional changes of vegetation may occur due to below-ground herbivory, by effects on nutrient availability and by affecting soil formation and modifying the soil as a habitat for plants (Frouz et al. 2008). Also plants play a major role in the configuration of the physical habitat structure and they form the bottom of the food web (Frouz et al. 2008). Roots of plants preferably grow in existing soil cavities, mostly formed by soil fauna, which have a strong impact on root growth, allocation, length and density (Filser et al. 2016). Knowing that links between succession of Collembola and plants are determined via root system and plant litter, it can be stated that, the acquisition of nutrients and productivity of plants are mainly regulated by root herbivores and rhizosphere grazers, which influence carbon (C) allocation (Filser et al. 2016). Therefore, there is increasing interest in studying (i) C cycling because of potential interactions and feedbacks with climate change (Nielsen et al. 2011), (ii) also nitrogen (N) cycling, as it is a critical element for plant growth. On the other hand, soil fauna (protozoa, nematodes, arthropods, and earthworms) affect N cycling, both directly and indirectly (Filser 2002; Kaneda and Kaneko 2011; Filser et al. 2016). This effect arises from interactions between soil fauna e.g. Collembola and soil microorganisms via their feeding activities and growth under different levels of soil moisture, which changes with their population density (Filser 2002; Kaneda and Kaneko 2011).

Long-term development of Collembola communities on a former rubble deposit
22
Table 1.2. Studies about the effect of climate warming on soil microarthopods. location and habitat duration main results references Fifteen alpine Racomitrium moss-sedge heath sites, UK.
6 weeks The response of soil microarthropod community structure to local-scale variation in habitat quality and food availability was stronger than large-scale variation in climate and nitrogen deposition.
Mitchell et al. 2016
Songnen grassland, China.
3 years None of the treatments through all the sampling times affected Collembola species richness, diversity and evenness, but soil warming significantly increased Collembola abundance.
Yan et al. 2015
Mixed deciduous woodland, Tintern, Wye Valley, UK.
4 months Warming and wetting positively, and drying negatively influenced the Collembola abundance and diversity. Fungal-inoculation treatments with reduced populations compared with uninoculated mesocosms, were less pronounced affected by these climatic changes.
A’Bear et al. 2013
Sub-Arctic heathland community, dominated by dwarf shrubs, Abisko Scientific Research Station (ANS) in northern Sweden.
2 years Prostigmata mites and euedaphic Collembola were the most susceptible groups to winter warming events, which was not apparent from Collembola abundance data at the taxon level. This indicates that in extreme events, life forms and species traits play a major role in community assembly.
Bokhorst et al. 2012a
Oak Ridge National Environmental Research Park in Oak Ridge, Tennessee, USA.
2 years Positive relationship was found between Collembola abundance and richness with soil moisture content, and negative relationship with soil temperature, which was explained by temperature-related shifts in soil moisture content. Alteration in community composition was explained by both precipitation and warming treatments.
Kardol et al. 2011
Shrubland sites, Denmark, Netherlands, Sardina and Catalonia, Hungary.
4 years Significant effects of warming and drought treatments were observed for Collembola density and biomass.
Petersen 2011
Falkland islands, Signy island, Anchorage islands, Maritime Antarctic.
2 years Warming treatment did not affect abundance and diversity of Acari and Collembola. An experimental temperature increase of 1-2 °C consequenced on soil arthropod communities in this region. This was similar for each location but was most likely to be small and initially slow to develop. This experiment was comparable to the magnitude currently seen through recent climate change in the Antarctic Peninsula region.
Bokhorst et al. 2008
Beech forest on an acid Dystric Cambisol soil in northern Germany.
7 years Four Collembola species, which were occurring yearly with delay, reacted on deep spring temperature. A negative correlation was found between species diversity of Collembola and total litter fall, while this correlation was positive for the diversity of oribatid mites.
Irmler 2006
Forest sites near Mazsalaca in North Vidzeme Biosphere Reserve, Latvia.
10 years Community structure of Collembola was not affected by forest age. Therefore, ecological succession could not explain the observed changes in community. Thus, temperature and precipitation were strongly controlling the community responses.
Jucevica and Melecis 2006
Naturally regenerated stand of Scots pine (Pinus sylvestris L.), Mekrijärvi Research Station, University of Joensuu, Finland.
5 years Minor effects of increasing temperature, and no effect of elevated air CO2 concentration had been observed on most of the decomposer fauna at their study site.
Haimi et al. 2005
Mediterranean pine forest on Mt. Holomon in northern Greece.
4 months Drought and infrequent irrigation increased maximum soil temperature. Soil water content and microarthropod species richness decreased by drought, and increased by irrigation treatments.
Tsiafouli et al. 2005
Forst stands in Skogaby and Flakalidan, Sweden.
4 years Abundance and diversity of forest soil fauna specifically Collembola were decreased by climatic changes, which was the result of frequent drought periods in summer.
Lindberg 2003
(continued on next page)
Long-term development of Collembola communities on a former rubble deposit
23
Table 1.2 (continued)
FACE (Free Air Carbon Dioxide Enrichment) site in Duke University Forest, USA.
3 years Microarthropod individual numbers decreased by elevated CO2. These responses might reflect the plant-derived changes in the soil, especially in litter layer, as they preceded alterations in the quality of litter layer resulting from CO2 treatment.
Hansen et al. 2001
Pine stand (Vaccinium type) near Jyväskylä, central Finland.
8 months The fluctuating temperature regime increased the abundance and species richness of Collembola.
Huhta and Hänninen 2001
Kolhaugen, the crest of a raised ridge formed from glacial moraine to the south of Svalbard, Norway.
2 years Mites and Collembola were compared in response to an experimentally induced environmental catastrophe, a thick surface ice layer. Mites were very resistant with showing no significant change, while Collembola were more sensitive.
Coulson et al. 2000
Mesic tallgrass site (Konza Prairie) and a more arid mixed-grass site (Hays), Konza Prairie Research Natural Area, a 3,487 ha tallgrass prairie, Flint Hills, USA.
2 years Soil water content and precipitation were playing an important role in affecting microarthropod densities and distributions in grasslands. This suggested complex, non-linear responses to changes in water availability. Microarthropod densities and distributions in grasslands may be regulated by adaptation to current environmental conditions and a number of additional factors, such as soil depth, texture and organic matter content.
O’lear and Blair 1999
Ecotron controlled environment facility, UK.
model terrestrial ecosystem
Rising global atmospheric carbon dioxide induced changes in the abundance and species composition of Collembola.
Jones et al. 1998
Hybrid Poplar saplings Northern lower Michigan, USA.
six months In the rhizosphere with the strongest response to elevated atmospheric CO2, unchanged microbial biomass and greater numbers of protozoa suggested faster bacterial turnover. Therefore, arbuscular mycorrhizal root length increased, and the number of microarthropods rose on fine roots.
Lussenhop et al. 1998
Beech forest on limestone, Germany.
ten years Long-term effects of temperature on the quantity and quality of the litter layer caused significant changes in the carrying capacity of the soil environment from year to year. Finally, this caused the strong year-to-year fluctuations.
Wolters 1998
West Spitsbergen, Svalbard, Norway.
three years An equal or greater effect of year-to-year variation in climate, interacting with physical differences between sites was produced on microarthropod individual numbers.
Coulson et al. 1996
Signy Island, maritime Antarctica.
eight years An increase was found in the abundance of Antarctic invertebrate communities and little increase in their diversity in response to global warming, as predicted by global circulation models.
Kennedy 1994
Environmental parameters are traditionally applied by ecologists “to predict successional shifts in compositional characteristics of local species assemblages” (Mori et al. 2017). It is suggested by Mori et al. (2017) that temporal respectives, e.g. developmental stages, must be fully incorporated into debates and assessments concerning relationship between diversity and ecosystem properties. Compared to other studies dealing with effects of climate warming on microarthropods shown in Table 1.2, this study recommends a significant and strong effect of soil warming on temporal shifts of both investigated microarthropod groups (Collembola and Gamasina) in long-term succession. Especially, the more pronounced temperature increase in winter had a substantial effect on successional replacement of investigated microarthropod species. Consequently, global warming issues require more attention to be paid to microarthropods, specifically Collembola community variation (Yan et al. 2015). Another issue is missing or only little knowledge about the life cycle and development of each Collembola species, which makes limitations in the

Long-term development of Collembola communities on a former rubble deposit
24
analysis of most of the future researches on Collembola. Thus, in the future, researchers should pay more attention to the life cycle of Collembola (Yan et al. 2015).
1.4 Objectives, structure of the thesis and hypotheses Frequently, in long-term research of soil mesofauna (e.g., Collembola) the following two questions are to be answered (Koehler and Melecis 2010): - What is the effect of temporal variation of certain environmental variables on Collembola? - Are trends or cycles in Collembola population and/or community characteristics detectable in correlation with other organism groups such as plants or Gamasina? To enable those working in the field to use e.g. Collembola as bioindicators and to determine the ecological succession of Collembola in comparison to other soil organisms, specialists must prepare and offer the basic background (Koehler and Melecis 2010). Moreover, for studies dealing with biodiversity and ecology, there is need for a correct species determination as an absolute prerequisite (Koehler 1999; Mallet and Willmott 2003). In the functioning of terrestrial ecosystems, soil biodiversity is a crucial factor (Burkhardt 2005). Soil communities are among the most species-rich components within terrestrial ecosystems (Burkhardt 2005). Thus, this study includes mainly the identification of Collembola species to follow questions on patterns of a) Collembola succession on the plateau of Siedenburg rubble and debris dump, b) their relationship to other taxa, and c) identifying potential indicators for climate change. In this study, Collembola communities were investigated in two experimental plots; SUC (natural secondary succession) and REC (recultivated) on the plateau of Siedenburg rubble and debris dump in Bremen, Germany. The influence of recultivation, which accelerates colonization and leads to increased abundances (Koehler 2000) could be measured. For this purpose and in order to document the synchrony or asynchrony of different biota in successional dynamics, the abundance and community structure of Collembola species were compared between these two experimental plots. Soil compaction, soil water (water logging), macroclimate and microclimate were measured as selecting filters. The effect of soil fauna on plant productivity is mainly indirect. On the other hand, the effect of above-ground vegetation on soil fauna is indirect too, by creating a favorable microclimate for the development of soil fauna, by influencing their food, e.g. microflora and by increasing vertical and horizontal patchiness and habitat diversity (Koehler 1999). Overall, secondary succession provides a good framework for investigating the linkages between above- and below-ground systems (Bardgett et al. 2005; Perez et al. 2013). The available data for predatory mites and vegetation were obtained from the BIOLOG-report (Koehler and Müller 2003) and personal communication with the authors. Based on the information given in the preceding chapters conclusively, the main objective of the present thesis is to determine mainly the secondary succession of soil microarthropods (Collembola and Gamasina) as the central aspect and to understand the effects of some environmental variables [above-ground; macroclimate, vegetation structure, vegetation development and below-ground; e.g., soil climate, C/N ratio and Ellenberg’s weighted mean indicator values (F: soil humidity, R:

Long-term development of Collembola communities on a former rubble deposit
25
pH reaction, N: nitrogen content, PRI: potential rooting impact; Ellenberg et al. 1992)] on the succession of investigated microarthropod groups as a secondary aspect in two experimental plots (SUC and REC) during a twenty-year ecological succession. Central research questions in this thesis were: 1. Optimizing laboratory methods for working with old ethanol Collembola specimens; 2. Long-term succession of Collembola and Gamasina and the effects of environmental variables on both groups; These questions were addressed in three chapters. Their approach is briefly summarized below, followed by the articles or manuscripts themselves and a general discussion. The appendix contains one additional manuscript to which I contributed with the expertise gained in Chapter 2. Chapter 2: Techniques for clearing and mounting Collembola from old ethanol collections To prepare specimens of Collembola for microscopic identification that had been stored for more than 15 years in 70% ethanol, and to find effective methods to clear large numbers of aged specimens during and/or before permanent mounting. Chapter 3: Long-term succession of Collembola communities in relation to climate change and vegetation In a moderate oceanic climate (Bremen regional climate), the influence of macroclimate on the development of Collembola abundance and community structure in a twenty years study was investigated; in particular the effect of soil temperature on endogeic species, and the interaction of successional dynamics (at the ecosystem level) with climate change effects. We hypothesized that the increase in soil temperature is significantly influencing the intrinsic successional dynamics of Collembola communities. Chapter 4: Collembola and Gamasina in a 20 years secondary succession with different management The successional dynamics of Collembola and Gamasina communities were compared and the relationship between them was investigated in a twenty years study. We hypothesized that first, the development of Collembola communities is synchronous to those of Gamasina with some differences due to their ecological traits. Moreover, second, we expected different patterns concerning the differences between management regime (undisturbed succession and recultivation, SUC and REC). Third, microarthropod dynamics should be independent from the development of plants. Further, we assessed that the long-term dynamics of soil microarthropods are correlated and influenced by the changes of some environmental variables during twenty years of study.

Long-term development of Collembola communities on a former rubble deposit
26
1.5 Author contributions Contributions of the single authors to each published or submitted chapter are shown as estimated percentages in the following matrix (each cell amounts to 100%):
Chapter / Who (%) 2 3 4 Appendix Conception of the study ED/30, HK/50,
JF/10, UB/10 ED/20, HK/50, JF/20, RK/10
ED/20, HK/70, JF/5, RK/5
ED/10, JF/20, OR/60, UB/10
Species identification, photography
ED/80, HK/5, UB/15
ED/85, HK/5, UB/10
ED/85, HK/5, UB/10
ED/30, OR/60, UB/10
Molecular analyses --- --- --- UB/100 Statistical analyses --- ED/20, RK/80 ED/20, RK/80 ---- Literature review, other calculations, figures, tables, writing
ED/90, HK/5, UB/5
ED/90, HK/5, RK/5
ED/90, HK/10 ED/20, JF/10 OR/50, UB/20
Revision and correction HK/20, JF/70, UB 10
HK/20, JF/70, RK/10
HK/30, JF/70 JF/90, UB/10
Final revision of manuscript
ED/100 ED/100 ED/100 OR/100
ED = Elaheh Daghighi, HK = Hartmut Koehler, JF = Juliane Filser, OR = Olivia Roithmeier, RK = Raimund Kesel, UB = Ulrich Burkhardt

Long-term development of Collembola communities on a former rubble deposit
27
Materials and methods

Long-term development of Collembola communities on a former rubble deposit
28
2 Materials and methods
2.1 Study area The current long-term investigation was conducted on the plateau of Siedenburg rubble and debris dump in the vicinity of Bremen, Northern Germany [Atlantic climate, average temperature 9.2 °C, average precipitation 671 mm; 30 years annual mean 1971-2000 from German Weather Service; www.dwd.de]. The dump site covers an area of approximately 4 ha, with a slightly inclined plateau to the south of about 1 ha, which is around 20 meters above the surrounding area. The surrounding area is marshland (Koehler and Müller 2003). The dump site was the deposition of mainly construction debris and excavation materials until 1977 and it was covered with surface soil or disturbed soil from excavation works in 1970-1976 (Fig. 2.1). The thickness of the cover is about 50-100 cm and the soil type is a loamy sand (Berendt 1985), with a carbon content (%) ranging from 1.63 to 2.86 on SUC and from 1.81 to 3.96 on REC (Koehler and Müller 2003). After grading the plateau of the dump, two experimental plots were established in 1980, one left undisturbed for natural secondary succession (SUC), which was 0.2 ha. The other one was recultivated with rotary-tilling and sowing of grass (REC), which was 0.1 ha. The lawn was mown regularly for 7 years. Thereafter, in 1988, ruderalization began [see 3.2] (Koehler 1998). Ever since, the succession in the two plots SUC-REC was followed in regular sampling campaigns for pedology, vegetation and soil zoology (Koehler and Müller 2003) (Fig. 2.1). Soil sampling, examination of soil microarthropods (Collembola and Gamasina) and vegetation dynamics are described in detail in 2.2.2, 3.2 and 4.2. The macroclimate condition of the study area is described in 3.2 and 3.3.

Long-term development of Collembola communities on a former rubble deposit
29
Figure 2.1. Study area on the plateau of Siedenburg dump site in the vicinity of Bremen, Germany with two
experimental plots; SUC [the plot left for natural secondary succession] and REC [the plot recultivated with rotary
tilling and sowing of grass] (left). Grid pattern of the dump site and location of the sampling plots (right). The grid
size is 10 m plus 1 m way (grid line) in each case; the positions of destructive samplings for zoology are shown with
orange squares (1980-1995) and yellow squares (1996-2000) on REC and with orange squares (1980-2000) on SUC.
Green squares show the positions of botanical samplings (right) (from Koehler and Müller 2003).

Long-term development of Collembola communities on a former rubble deposit
30
2.2 Techniques for clearing and mounting Collembola from old ethanol collections
Elaheh Daghighi¹*, Ulrich Burkhardt², Juliane Filser¹ and Hartmut Koehler1 1 University of Bremen, UFT Center for Environmental Research and Sustainable Technology, Leobener Str. 6, 28359 Bremen, Germany ² Senckenberg Museum of Natural History Görlitz, Am Museum 1, 02826 Görlitz, Germany * Corresponding author, e-mail: [email protected] Received 19 October 2015, Accepted 18 March 2016 in Soil Organisms, Scientific Journal of Senckenberg Museum of Natural History Görlitz Published online at www.soil-organisms.de 1 April 2016, Printed version 15 April 2016
Abstract Soil mesofauna was collected between 1983 and 2000 from a successional site in Bremen, Germany. The recent analysis of Collembola from this collection posed great challenges in clearing of the specimens stored in 70% ethanol for 15-32 years for microscopical inspection. For this purpose, five media for permanent slide mounts with different clearing properties were tested: Marc André 2, Huether’s E65, Polyvinyl lactophenol (PVA), Rusek’s and Gisin’s mixture. None of these media cleared the old specimens sufficiently, therefore, pretreatment procedures had to be applied. Two out of eight tested pretreatment methods cleared the aged Collembola successfully: treatment in 10% NaOH solution at 60 °C for 10 minutes, which, however, makes the specimens very fragile. Another pretreatment method originally developed for extracting DNA from Collembola cleared the aged specimens very well and kept them sufficiently stable for further handling. For permanent mounts, Marc André 2 was used, as it has good optical properties, is easy to apply and quickly yields ready-to-handle mounts, especially when dealing with high numbers of preparations for ecological research. Keywords: gum-chloral mounting media; high throughput slide mounts; clearing agents; DNA extraction solution
2.2.1 Introduction The determination of soil inhabiting microarthropods to species level by their external morphological features requires examination under a high quality microscope at high magnification. Remains of internal tissue interfere with the detectability of taxonomic characters. Body contents should always be removed or cleared so that the morphological characters used in taxonomy become clearly visible using transmitted light with phase contrast or differential interference contrast (DIC or Nomarski interference contrast). The determination of microarthropods includes mounting for documentation and review. There are lots of considerations in making permanent mounts – ease of use, availability of ingredients, drying time, clearing effect and longevity (e.g., Schauff 1986; Rusek and Greenslade 1992; Gunter and Brown 2004; Glime and Wagner 2013; Rondon and Corp 2015). The most important procedures and materials for fixation, clearing and mounting microarthropods are summarized by Dunger and Fiedler (1997). Here we investigate the applicability of such media on long-time stored Collembola samples. Collembola communities of two different plots (undisturbed succession and

Long-term development of Collembola communities on a former rubble deposit
31
recultivated) were collected between 1980 and 2000 on the plateau of the Siedenburg rubble and debris dump in the vicinity of Bremen (Koehler and Müller 2003). From these collections, only those from 1980 to 1982 had been mounted and studied by Berendt (1985). The material from 1983 to 2000 has been preserved in 70% ethanol for 15-32 years, and meanwhile poses great difficulties and challenges in the clearing process with standard methods. For specimens hard to clear due to long preservation in 70% ethanol, various authors proposed to soak them in cold or warm 7-10% potassium hydroxide or sodium hydroxide solution, or to heat the specimens in lactic acid or lactoglycerol (Gisin 1960; Mari-Mutt 1979; Fjellberg 1980; Brown 1997; Gunter and Brown 2004; Brown and De Boise 2006; Greenslade 2010). However, these methods were not successful in clearing our material. The objective of the experiments reported here is to prepare specimens of Collembola for microscopic identification that have been stored for more than 15 years in 70% ethanol, and to find effective methods to clear large numbers of aged specimens during and/or before permanent mounting.
2.2.2 Materials and methods
2.2.2.1 Sampling and fixation The Collembola specimens had been sampled between 1983 and 2000 from the Siedenburg experimental site (Bremen-Walle, Germany) (Koehler 1998, 2000; Koehler and Müller 2003). Collembola were extracted with a Macfadyen-canister-type apparatus (10 days, temperature increase 5 °C/day, Tmax= 60 °C) either into picric acid (from 1980 to 1990) or into ethylene glycol (from 1991 onwards), and afterwards transferred to 70% ethanol through a 25 μm sieve and washed back into the preserving glass with 70% ethanol. Therefore, the Collembola were preserved in 70% cold ethanol including minor impurities from the fixation fluids (Berendt 1985; Koehler 1998, 2000). Collembola samples were heated in a water bath in 60 °C for 5 minutes and shaken for better immersion and fixation (Fjellberg 1980), and afterwards stored at room temperature (22 °C).
2.2.2.2 Optimization of preparation and mounting of Collembola from old collections
a) Pretreatment before permanent mounting Eight pretreatment methods were applied prior to permanent mounting (Table 2.1). All pretreatment methods were applied systematically to three orders of Collembola available from samples, Poduromorpha, Entomobryomorpha, and Symphypleona. In order to check the clearing properties of the various methods, for method 1 to 7 (Table 2.1) six Collembola from four different families (Entomobryidae, Isotomidae, Onychiuridae, Sminthurididae) were transferred by a pipette to a small glass vial. Vials were filled with the respective liquids and kept at temperatures and with time periods shown in Table 2.1. The technique developed for DNA extraction (method 8, Table 2.1) was applied by placing eight old Collembola specimens from four different families (Brachystomellidae, Entomobryidae, Isotomidae, Sminthurididae) in small glass vials. Most remaining ethanol was removed with a pipette, and 200 μl of SNET buffer solution (Laird et al.
Long-term development of Collembola communities on a former rubble deposit
32
1991) plus 10 μl of proteinase K solution (600 mAU, QiaGen Hilden, Germany) were added. This mixture was kept at 55 °C for 3-5 hours in a lab drying oven (JUERGENS Heraeus-electronic-B5042E). Then 500 μl ethanol (35%) and 1.5 μl formol (3%) were added directly to the mixture, and the samples were then stored at room temperature (22 °C) for at least 3 days to remove remaining buffer salts from the body. After that step the specimens were mounted permanently on microscope slides with Marc André 2 mixture (Tables 2.1-2.3).
Table 2.1. Pretreatment methods in the optimization experiment.
method pretreatment mounting medium
temperature (˚C)
time of pretreatment
heating device
1A ethanol 70%+NaOH 10% (1: 1) Marc André 2 40 10 thermomixer 1) 1B ethanol 70%+NaOH 10% (1: 1) Marc André 2 45 10 thermomixer 1) 1C ethanol 70%+NaOH 10% (1: 1) Marc André 2 50 10 thermomixer 1) 1D ethanol 70%+NaOH 10% (1: 1) Marc André 2 55 10 thermomixer 1) 1E ethanol 70%+NaOH 10% (1: 1) Marc André 2 60 10 thermomixer 1) 2 ethanol 70%+Toerne (1: 1) Marc André 2,
Huether’s E65, PVA
60 25 water bath 2)
3 ethanol 99% PVA 100 4 thermomixer 1) 4 Huether 1 Huether’s E65 22* 24 h (1 day) – 5 Huether 1 Huether’s E65 22* 120 h (5 days) – 6 Lactic acid+glycerol (3: 1)
(Lactoglycerol) Marc André 2 45 4 thermomixer 1)
7 Nesbitt’s fluid Marc André 2 22* 72 h – 8 DNA extraction solution (SNET and
TNES) Marc André 2 55 3-5 h lab drying oven
3)
* Room temperature, 1) Eppendorf thermomixer compact, 2) JUERGENS, 3) JUERGENS Heraeus electronic B5042E. See Table 2.2 for further details.
b) Permanent mounting without pretreatment In order to test whether extensive pretreatment methods could be avoided, the clearing potential of five embedding media was tested without pretreatment: Marc André 2, Huether’s E65, Polyvinyl lactophenol (PVA), Rusek’s and Gisin’s mixtures (Table 2.2). It was done for 6 specimens per treatment from three different families: Entomobryidae, Isotomidae and Onychiuridae. Three drying temperatures of 55 ± 5 °C, 65 ± 5 °C and 75 ± 5 °C were applied in a lab drying oven (JUERGENS Heraeus-electronic-B5042E) for 72 hours before microphotographs were taken. Two to three specimens were mounted between a large coverslip (24 × 40 mm) and a small coverslip (18 × 18 mm) to enable dorsal and ventral inspection with equal optical quality by simply turning the slide. Two microscope slides were prepared per treatment.
c) Assessment of clearing To assess the efficiency of the clearing methods, the Collembola were retrieved under a LEICA MS5 stereomicroscope. The respective results of clearing were documented photographically (Olympus microscope BX60, SONY camera U-SMAD). All pictures of the whole body, mouthparts, thorax, furca and tibiotarsi were taken with 100, 200 and 400 fold magnification.

Long-term development of Collembola communities on a former rubble deposit
33
According to the visibility of organs documented in the microphotographs, clearing quality scores were allocated as follows: 1 = excellent, 2 = very good, 3 = good, 4 = bad, 5 = very bad (Figs 2.2-2.4).
Table 2.2. Materials used in the optimization experiment (recipes given in Dunger and Fiedler 1997, Sambrook and Russell 2001).
Name of material
ingredients
Chl
oral
hyd
rate
(g)
Die
thyl
ethe
r (m
l)
Etha
nol 9
8%-1
00%
(ml)
EDTA
(ml)
Form
ol 4
0% (m
l)
Gla
cial
ace
tic a
cid
(ml)
Gly
cero
l (m
l)
Gly
cero
l, sa
tura
ted
picr
ic a
cid
(ml)
Gum
ara
bic
(g)
H2O
des
t. (m
l)
HC
l (m
l)
Isop
ropa
nol (
ml)
Kar
ion
coar
se p
owde
r for
m (g
)
Kar
ion
liqui
d (m
l)
Lact
ic a
cid
(ml)
NaC
l (g)
Phen
ol (g
)
Poly
viny
lalc
ohol
(g)
SDS
(sod
ium
dod
ecyl
sulfa
te) (
%)
Sodi
um h
ydro
xide
(g)
Tris
bas
e (m
l) (p
H: 7
.5-8
.5)
NaOH 10% (pretreatment)
100 10
Toerne (pretreatment)
3 30 1000
Huether (1) (pretreatment)
25 75 0.3
Lactoglycerol (pretreatment)
10 10 30
Nesbitt,s fluid (pretreatment)
40 12.5 2.5
Marc André 2 200 30 20 50 PVA (Polyvinyl lactophenol)
20 10 50 35 25 10
Huether’s E65 60 24 16 12 12 95 Rusek 50 5 5 15 20 Gisin 2.6 13 10 65 SNET buffer solution
0.01 11.7 0.2 0.1

Long-term development of Collembola communities on a former rubble deposit
34
Figure 2.2. Representative pictures of three orders of Collembola after clearing in 10% NaOH for 10 minutes at five
different temperatures and subsequent mounting in Marc André 2 medium. (A) 40 °C, (B) 45 °C, (C) 50 °C, (D) 55
°C, (E) 60 °C. Pictures correspond to methods 1A to 1E in Table 2.1, respectively. All scale bars 0.5 mm.
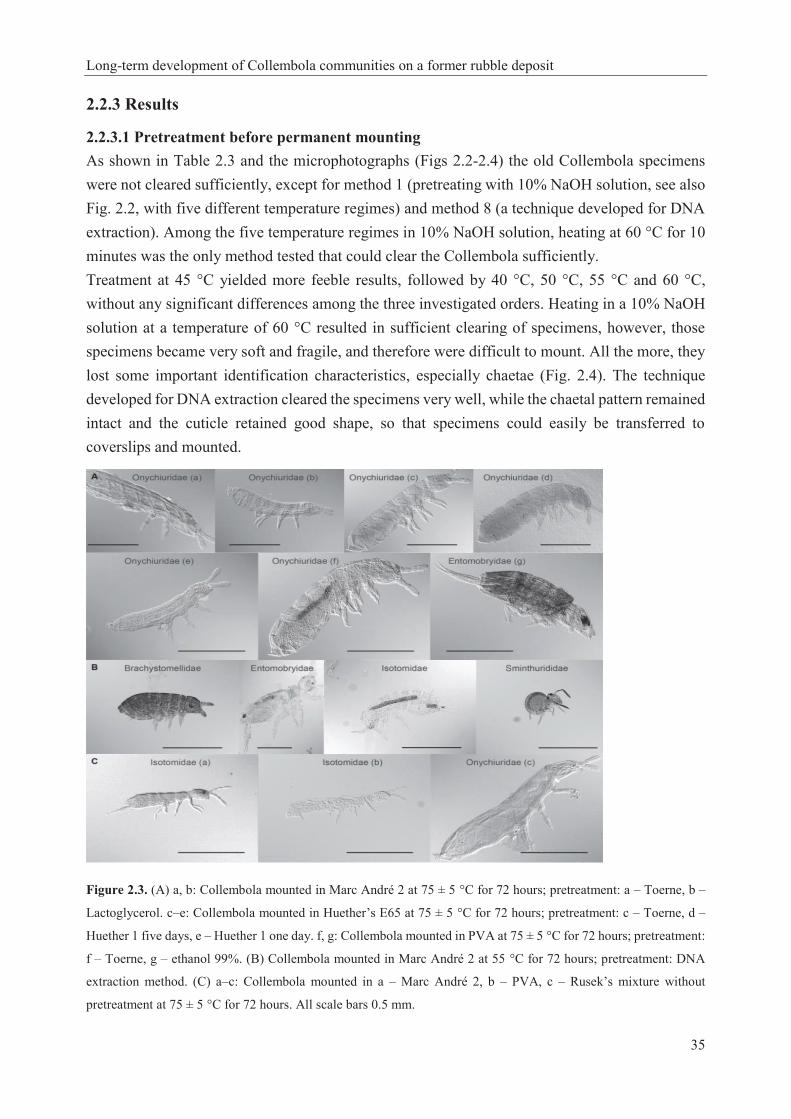
Long-term development of Collembola communities on a former rubble deposit
35
2.2.3 Results
2.2.3.1 Pretreatment before permanent mounting As shown in Table 2.3 and the microphotographs (Figs 2.2-2.4) the old Collembola specimens were not cleared sufficiently, except for method 1 (pretreating with 10% NaOH solution, see also Fig. 2.2, with five different temperature regimes) and method 8 (a technique developed for DNA extraction). Among the five temperature regimes in 10% NaOH solution, heating at 60 °C for 10 minutes was the only method tested that could clear the Collembola sufficiently. Treatment at 45 °C yielded more feeble results, followed by 40 °C, 50 °C, 55 °C and 60 °C, without any significant differences among the three investigated orders. Heating in a 10% NaOH solution at a temperature of 60 °C resulted in sufficient clearing of specimens, however, those specimens became very soft and fragile, and therefore were difficult to mount. All the more, they lost some important identification characteristics, especially chaetae (Fig. 2.4). The technique developed for DNA extraction cleared the specimens very well, while the chaetal pattern remained intact and the cuticle retained good shape, so that specimens could easily be transferred to coverslips and mounted.
Figure 2.3. (A) a, b: Collembola mounted in Marc André 2 at 75 ± 5 °C for 72 hours; pretreatment: a – Toerne, b –
Lactoglycerol. c–e: Collembola mounted in Huether’s E65 at 75 ± 5 °C for 72 hours; pretreatment: c – Toerne, d –
Huether 1 five days, e – Huether 1 one day. f, g: Collembola mounted in PVA at 75 ± 5 °C for 72 hours; pretreatment:
f – Toerne, g – ethanol 99%. (B) Collembola mounted in Marc André 2 at 55 °C for 72 hours; pretreatment: DNA
extraction method. (C) a–c: Collembola mounted in a – Marc André 2, b – PVA, c – Rusek’s mixture without
pretreatment at 75 ± 5 °C for 72 hours. All scale bars 0.5 mm.

Long-term development of Collembola communities on a former rubble deposit
36
Figure 2.4. Pictures of chaetal pattern (here using the example of Isotomidae). Collembola mounted in Marc André 2 at 55 °C for 72 hours; (A) pretreatment: 10% NaOH (poor result), (B) pretreatment: DNA extraction method (good result). All scale bars 0.1 mm.
Table 2.3. Results of pretreatment (see methods in Table 2.1) before permanent mounting (see details in Table 2.2; microphotographs were taken after 72 hours; see examples in Figs 2.2-2.4).
method permanent mounting fluid
temperature (lab drying oven) °C
result
1A Marc André 2 55 ± 5 not cleared, shrinking, remnants of fat and filament 1B Marc André 2 55 ± 5 not cleared, shrinking, remnants of fat and filament 1C Marc André 2 55 ± 5 not cleared, shrinking, remnants of fat and filament 1D Marc André 2 55 ± 5 not sufficiently cleared, remnants of filaments 1E Marc André 2 55 ± 5 cleared and features are visible, but very soft and inappropriate
to handle for mounting 2 Marc André 2 55 ± 5 not cleared, shrinking, remnants of fat and filament 2 Marc André 2 65 ± 5 not cleared, shrinking, remnants of fat and filament 2 Marc André 2 75 ± 5 not cleared, shrinking, remnants of fat and filament 6 Marc André 2 75 ± 5 not cleared, shrinking, remnants of fat and filament 7 Marc André 2 55 ± 5 not cleared, shrinking, remnants of fat and filament 7 Marc André 2 65 ± 5 not cleared, shrinking, remnants of fat and filament 7 Marc André 2 75 ± 5 not cleared, shrinking, remnants of fat and filament 8 Marc André 2 55 sufficiently cleared, features are visible and appropriate to handle
for mounting 2 Huether’s E65 55 ± 5 not cleared, shrinking, remnants of fat and filament 2 Huether’s E65 65 ± 5 not cleared, shrinking, remnants of fat and filament 2 Huether’s E65 75 ± 5 not cleared, shrinking, remnants of fat and filament 4 Huether’s E65 55 ± 5 not cleared, shrinking, remnants of fat and filament 4 Huether’s E65 65 ± 5 not cleared, shrinking, remnants of fat and filament 4 Huether’s E65 75 ± 5 not cleared, shrinking, remnants of fat and filament 5 Huether’s E65 75 ± 5 not cleared, shrinking, remnants of fat and filament 2 PVA 55 ± 5 not cleared, shrinking, remnants of fat and filament 2 PVA 65 ± 5 not cleared, shrinking, remnants of fat and filament 2 PVA 75 ± 5 not cleared, shrinking, remnants of fat and filament 3 PVA 55 ± 5 not cleared, shrinking, remnants of fat and filament 3 PVA 65 ± 5 not cleared, shrinking, remnants of fat and filament 3 PVA 75 ± 5 not cleared, shrinking, remnants of fat and filament

Long-term development of Collembola communities on a former rubble deposit
37
2.2.3.2 Permanent mounting without pretreatment The selected permanent mounting media without applying pretreatment methods did not clear the old specimens sufficiently (Table 2.5). As visible in the microphotographs (Fig. 2.3C), best, but suboptimal results were achieved when applying Marc André 2 at high temperature (75°C ± 5°C).
Table 2.4. Condition of Collembola after pretreatment in 10% NaOH at different temperatures and subsequent mounting in Marc André 2 at 65 ± 5 °C for 48 hours. Scores: 1= excellent, 2= very good, 3= good, 4= bad, 5= very bad.
temperature (°C) Poduromorpha Entomobryomorpha Symphypleona
40 5 5 4
45 5 5 5
50 4 4 5
55 3 5 4
60 2 3 2
Table 2.5. Details and results of permanent mounting without pretreatment. Clearing time = time between mounting and taking photos.
permanent mounting fluid
temperature (lab drying oven) °C
clearing time= time between mounting and taking photos
result
Marc André 2 46 4 weeks not cleared
Marc André 2 60 one day not cleared
Marc André 2 75 ± 5 two days little improvement (proper to interior study)
Polyvinyl-lactophenol 50 two days not sufficiently cleared
Polyvinyl-lactophenol 60 one day not cleared
Polyvinyl-lactophenol 75 ± 5 two days not sufficiently cleared
Huether’s E65 50 two days not sufficiently cleared
Huether’s E65 60 two days not sufficiently cleared
Huether’s E65 75 ± 5 two days not sufficiently cleared
Rusek 55 ± 5 two or three days not cleared, shrinking, remnants of fat and filament
Rusek 65 ± 5 two or three days not cleared, shrinking, remnants of fat and filament
Rusek 75 ± 5 two or three days not cleared, shrinking, remnants of fat and filament
Gisin 55 ± 5 two or three days not cleared, shrinking, remnants of fat and filament
Gisin 65 ± 5 two or three days not cleared, shrinking, remnants of fat and filament
Gisin 75 ± 5 two or three days not cleared, shrinking, remnants of fat and filament

Long-term development of Collembola communities on a former rubble deposit
38
2.2.4 Discussion Standard methods in the lab, such as mounting in Marc André 2 without pretreatment, poorly clear old Collembola specimens and thus hamper a proper microscopic identification. Therefore, an appropriate pretreatment method is needed that can be applied prior to mounting. In the current study, we tested eight different pretreatment methods. Since heating in lactic acid was recommended for deeply pigmented or old specimens (e.g., Bellinger 1954; Greenslade 2010), all pretreatment methods except for Huether 1, were tested by heating the specimens in different clearing mixtures (Table 2.1). However, heating the specimens in ethanol 99% (Berch et al. 2001), Toerne mixture (Dunger and Fiedler 1997), Lactoglycerol (Fjellberg 1980) and warm lactic acid on a cavity slide proved unsuccessful for clearing our old Collembola specimens. The tested pretreatment method with 10% NaOH yielded sufficient clearing but has some disadvantages, as NaOH is a harsh chemical, and heating the specimens in 10% NaOH solution makes them very soft and fragile. Heating the solution to more than 55 °C improves the clearing process but tends to damage important identification characteristics such as chaetae, and does not keep the cuticle in a good shape. Therefore the specimens become inappropriate for handling and difficult to mount on slides. Our modified DNA extraction technique overcomes the disadvantages of other pretreatment methods. As common DNA extraction buffers for eucaryotic genomic DNA include tissue lysis properties (e.g., Laird et al. 1991), they cannot only be used to bring DNA into solution but as well to dissolve the inner body contents while keeping the animal cuticle in good condition for subsequent identification. As the method can be applied to all individuals of one sample in a single vial, it enables preparation also of large numbers of specimens as common in ecological studies, and with the same quality in the clearing process for different orders of Collembola. According to microphotographs, we consider this method the most appropriate pretreatment when preparing old Collembola specimens for mounting and identification (see 2.2.2.2a; Figs 2.3B and 2.4B). Among five different permanent mounting media used in this investigation, Marc André 2 gave best results compared to other mixtures (Table 2.2). It possesses good clearing and optical properties, enables delicate and thin mounts and quickly yields ready-to-handle mounts. It should, however, be noted that chloral hydrate, as in all gum-chloral media tends to crystallize, due to evaporation of the solvent (water). The longevity of these media is hard to predict, while sealing the coverslip may prevent evaporation for a longer time (Gunter and Brown 2004). The other permanent mounting media tested here have some disadvantages: PVA very quickly gives well cleared specimens but the appendages, e.g. legs and palpi, tend to shrink after a few weeks, and the specimens become distorted and fade over time. Besides, it is highly toxic because it contains phenol and the correct formulation of PVA is critical. Rusek’s medium gives thicker mounts, limiting its suitability for preparation of small specimens, and specimens mounted in Gisin’s mixture are often in very poor condition, as this is a liquid medium not appropriate for permanent mounting (Martin 1977; Rusek and Greenslade 1992; Huether 1993; Upton 1993; Halliday 1994; Bernard 2006).

Long-term development of Collembola communities on a former rubble deposit
39
As such, to achieve good clearing of old ethanol collection material, we recommend to incubate it in DNA extraction buffer such as SNET plus proteinase K as described in 2.2.2.2a, method 8, and to mount it in Marc André 2 for best optical results.
Acknowledgements We wish to thank Matty P. Berg (Vrije Universiteit, Institute of Ecological Science, Amsterdam, The Netherlands); Louis Deharveng (Université Paul Sabatier, Toulouse Cedex France); Arne Fjellberg (Tjøme, Norway) and Rafael Jordana (University of Navarra, Pamplona, Spain) for their guidance and examination of some specimens. We thank Moira McKee for linguistic corrections and two anonymous referees for helpful comments.

Long-term development of Collembola communities on a former rubble deposit
40
Results

Long-term development of Collembola communities on a former rubble deposit
41
3 Long-term succession of Collembola communities in relation to climate change and vegetation Elaheh Daghighi*, Hartmut Koehler, Raimund Kesel and Juliane Filser University of Bremen, UFT Center for Environmental Research and Sustainable Technology, Leobener Str. 6, 28359 Bremen, Germany *Corresponding author, email: [email protected] Received 8 November 2016, Accepted 7 June 2017 in Pedobiologia, Journal of Soil Ecology Published online at http://dx.doi.org/10.1016/j.pedobi.2017.06.001 4 July 2017
Abstract The successional dynamics of Collembola communities on a rubble and debris dump in Bremen, Germany were studied between 1980 and 2000 in two experimental plots. One plot (SUC) was left undisturbed for natural secondary succession, the other plot (REC) was recultivated with rotary-tilling and sowing of grass. The mean Collembola abundance varied between 4 and 119 thousand ind. m-2 on SUC and between 6 and 92 thousand ind. m-2 on REC. In the two plots individual numbers peaked in the first decade, thereafter they decreased. Number of species varied from 9 to 17 on SUC with a very slight increase over time and from 8 to 17 on REC with only a temporary depression in 1998. The alpha diversity calculated as Shannon-Weaver and Simpson-indices increased in both plots. The lowest species turnover rate occurred between 1990 and 1994 on SUC and between 1981 and 1982 on REC, indicating the lowest diversity in species composition. During the whole succession, species composition changed more or less irregular in the two plots. With 74%, the dominance similarity (Renkonen index) of the Collembola communities between SUC and REC was greatest two years after the beginning of succession. As a result from CCA analysis, confirmed by linear regression analyses, Collembola total abundance and species composition (dominances) were significantly affected by annual (Oct-Sep) mean air and soil temperature (-10 cm), increasing over the study period of twenty years. Ordination scores of Collembola species abundance on the CCA axes revealed four climatic groups of Collembola: cold-dry, cold-wet, warm-wet and warm-dry. A correlation of Collembola species abundance with vegetation cover was not found. Nevertheless, stronger effects of climatic variables were found on REC, which had a shorter vegetation than SUC, creating a different microclimate. Successional dynamics of Collembola communities in the studied plots are correlated with temporal shifts of species between early and late years of succession, but are also significantly influenced by soil temperature. Keywords: secondary succession; Collembola; soil temperature; climate change
3.1 Introduction Succession refers to dynamic changes with time observed in an ecological community following a disturbance that provide a large space for colonization of species (Connell and Slatyer 1977), in which the environmental conditions are not constant over time (Li et al. 2015). During a long-term succession, soil fauna may respond to various environmental variables, and therefore can

Long-term development of Collembola communities on a former rubble deposit
42
indicate environmental stress through changes in community structure (Hågvar 1994; Van Straalen 1998; Lindberg et al. 2002; Lindberg 2003; Jucevica and Melecis 2006). In addition, soil organisms play a significant role in nutrient cycling and thus may affect productivity and competition within plant assemblages with potential effects on vegetation trajectories (Bradford et al. 2002; Gange and Brown 2002; Laossi et al. 2008; Van der Heijden et al. 2008; Perez et al. 2013). Among the biotic and abiotic environmental factors, which have the role in regulating soil invertebrate activity and population dynamics, temperature and soil moisture are key determinants of soil invertebrate population dynamics (Blankinship et al. 2011; A’Bear et al. 2013) and these factors are difficult to disentangle, requiring more data from multi-factorial ecological studies (A’Bear et al. 2013). Predicting the effects of changing global temperatures on organisms, populations, and ecosystems has become a key focus of ecology (Pachauri et al. 2014; Dillon et al. 2016). There are several studies on the responses of soil arthropod communities to climate change. They have been performed in polar and temperate ecosystems. Most of these studies have focused on temperature responses (e.g., Kennedy 1994; Webb et al. 1998; Hodkinson et al. 1998; Coulson et al. 2000; Lindberg 2003; Bokhorst et al. 2012a,b; A’Bear et al. 2013; Mitchell et al. 2016). Several of them use Collembola as a model group because of their high sensitivity to environmental factors and soil disturbance and the temperature dependency of Collembola developmental rate (e.g., Jucevica and Melecis 2002; Lindberg et al. 2002; Lindberg 2003; Lindberg and Persson 2004; Jucevica and Melecis 2006; Petersen 2011; Alatalo et al. 2015; Yan et al. 2015). Collembola community structure along climatic gradients reflects the long-term adaptation of the communities to climate and other environmental conditions (Petersen 2011). Precipitation and mean temperatures were the main climatic variables considered by studies of climate warming on biological communities (e.g., Frampton et al. 2000; Pflug and Wolters 2001; Lindberg et al. 2002; Lindberg 2003; Jucevica and Melecis 2006; Kardol et al. 2011; Yan et al. 2015). The intrinsic succession of Collembola communities shows predominantly gliding transitions in the occurrence of the Collembola species and overall, the change in their species structure over time. This refers to characterization of communities by dominance of characteristic species (Dunger 1968). Accordingly, distinct phases of succession can be determined by different steps in the colonisation by Collembola (Dunger and Voigtländer 2009). Collembola are assumed to be early successional colonizers, with increasing species diversity with time (Hågvar 2010), and they do not follow a similar trajectory to that of plant species within the ecosystem process of succession (Koehler and Melecis 2010). Successional studies have been determined as a central topic in ecology for about a century (Li et al. 2015). Such studies are emphatically important for our general understanding of the ecosystem dynamics (Petersen 2002), which can aid predictions of how soil ecosystems may function under future climatic conditions (Kardol et al. 2011). Moreover, long-term studies explicitly demonstrate that Collembola are sensitive indicators of climate change (Koehler and Melecis 2010). Climate warming may indirectly alter Collembola communities as a species-rich group of microarthropods (Hågvar and Klanderud 2009) by causing

Long-term development of Collembola communities on a former rubble deposit
43
a shift in the abundance and composition of soil organisms upon which they feed (Sjursen et al. 2005). In addition, this may occur through changes in plant physiology or community structure which can alter resource availability and microhabitat conditions (e.g., Cotrufo and Ineson 1995; Kardol et al. 2010; Kardol et al. 2011). Overall, long-term effects of warming may happen due to permanent changes in quantity and quality of root systems and litter following vegetation changes (Hågvar and Klanderud 2009). Secondary succession with a focus on life forms, for plants and soil biota appears to be a good framework to explore relationships between above and belowground systems (Bardgett et al. 2005; Perez et al. 2013). Euedaphic Collembola species are particularly sensitive to the amount of fine roots and exudates. A growing root system may increase the diversity of food resources (e.g., rhizospheric microorganisms) and also affect abiotic conditions such as water and nutrients for Collembola (Niklaus et al. 2001; Perez et al. 2013). Furthermore, differences in plant diversity affect the diversity and quality of the litter, which is the main habitat for many epedaphic and hemiedaphic Collembola species (Perez et al. 2013). This means, the succession of plants and Collembola communities are linked via root system and plant litter. In the present study the dynamics of Collembola communities were investigated on a rubble and debris dump in the vicinity of Bremen, Germany with two different experimental plots: 1. undisturbed succession (SUC) and 2. recultivated site (REC). The specimens were sampled by Koehler from 1980 to 2000 (Koehler 1998; Koehler and Müller 2003). The aim of this study is to take advantage of a twenty years study during a period of constant global temperature increase in the regional climate of Bremen: moderate oceanic climate; Cfb according to Köppen climate classification (Peel et al. 2007). The focus of this study is the influence of soil temperature on the development of Collembola abundance and community structure. We hypothesize that (i) the climate effect is influencing essentially the intrinsic successional dynamics of the Collembola communities, (ii) soil temperature (microclimate) induces changes especially in endogeic Collembola species composition, (iii) this effect is different on SUC and REC due to the different vegetation structure, and (iv) the development of Collembola communities is asynchronous to the development of plant communities in each experimental plot.
3.2 Materials and methods
3.2.1 Experimental site The study site is an abandoned rubble and debris dump in the vicinity of Bremen, Northern Germany (Atlantic climate, average temperature 9.2 °C, average precipitation 671 mm; 30 years annual mean 1971-2000 from German Weather Service; www.dwd.de). The surrounding area is marshland. The dump was covered with surface soil or disturbed soil from excavation works in 1970-1976. The thickness of the cover is about 50-100 cm and the soil type is a loamy sand (Berendt 1985), with a carbon content (%) ranging from 1.63 to 2.86 on SUC and from 1.81 to 3.96 on REC (Koehler and Müller 2003). After grading the plateau of the dump, two experimental plots were established in 1980, one left undisturbed for natural secondary succession (SUC), with
Long-term development of Collembola communities on a former rubble deposit
44
a size of 0.2 ha. An area of 0.1 ha was recultivated with rotary-tilling and sowing of grass (REC). The lawn on REC was mown for 7 years until 1987. Thereafter, ruderalization began on REC. Because of the change of the mowing regime (intensive 1980-1986, once a year 1987-1996 and cessation 1997-2000), REC was invaded by ruderal plant species, such as Sinapis arvensis, Melilotus alba, M. officinalis and Cirsium arvense. However, the subplots for soil sampling always were dominated by grasses such as Lolium perenne, Agropyron repens, Festuca rubra, Poa spp. and Agrostis spp. (Koehler and Müller 2003). The grass litter and the grasses themselves contributed to an approximately 10 cm sward of vital and dead vegetation. To ensure continuity, the soil samples always were taken after gentle removal of sward. The development of sward does not become visible in the soil carbon data but will affect microclimate.
3.2.2 Soil sampling and Collembola examination Soil microarthropods were sampled with a corer of a surface area of 25 cm² to a depth of 12 cm. The soil column was divided into 0-4, 4-8, 8-12 cm depths, giving samples of 100 cm³ (Koehler 1998). For Collembola community analysis, samples collected in fall (one sampling campaign per year) were selected from the first three years (1980, 1981, 1982), the last three years (1998, 1999, 2000) and in-between, with an interval of four years (1986, 1990, 1994). Number of replicates ranges from 6-12 per plot per year. The inverted soil cores were extracted in a Macfadyen-Canister type apparatus (10 days, temperature increase 5 °C/day, Tmax=60 °C). Cooling from beneath was reduced toward the end of the extraction to make the animals leave even the bottom layers of the soil core (Koehler 1999). Microarthropods were sorted and preserved in ethanol 70% and Collembola were counted to group level and mounted permanently with Marc André 2 under a stereomicroscope. The difficulties to handle old ethanol Collembola were overcome by using SNET buffer solution (Daghighi et al. 2016). Collembola were determined to genus and species level after Fjellberg (1998, 2007), Bretfeld (1999), Potapov (2001), Dunger and Schlitt (2011) and Jordana (2012). The Collembola of the first three years (1980, 1981 and 1982) were identified by Berendt (1985) and rechecked by the authors.
3.2.3 Vegetation and climate Vegetation dynamics on the two experimental plots were studied over the whole period by Müller (Koehler and Müller 2003). The macroclimate weather data (air temperature: 2m, ground temperature: +10 cm, soil temperature: -5 and -10 cm, precipitation) were provided as daily report by German Weather Service (www.dwd.de) from Bremen airport, ca. 8 km south of the experimental plots. Soil temperature was measured from 1980 to 1993 and in 1996 in spring, summer and autumn. This set of measurements, 89 in SUC and 78 in REC, was compared with the soil temperature data of the German Weather Service (www.dwd.de) from Bremen airport for the same days. High correlations of r =0.948, p<0.001*** for SUC and r =0.951, p<0.001*** for REC were found. Thus, data from the airport are closely following data from the experimental site and can be used for modelling.

Long-term development of Collembola communities on a former rubble deposit
45
3.2.4 Life forms To interpret the different reaction of Collembola species to climate change in relation to life forms, a classification was used that included three distinct life forms after Potapov et al. (2016): 1. Epedaphic life form: it corresponds to “upper-litter dwellers” of Stebaeva (1970) or epigeonts in Rusek (2007), inhabiting the upper litter layer or the surface of fallen logs. These Collembola are of medium or large size, with pronounced but frequently uniform coloring, in most cases with 6 + 6 or 8 + 8 ocelli. Limbs usually are less developed than in atmobiotic species. 2. Hemiedaphic life form: it corresponds to the “hemiedaphic” group of Stebaeva (1970) or to hemiedaphobionts in Rusek (2007), inhabiting partly decomposed litter or rotten wood. These Collembola are of medium or small size (ca. 1-2 mm), usually with dispersed pigmentation, reduced number of ocelli and shortened limbs. 3. Euedaphic life form: it corresponds to the “euedaphic” group of Stebaeva (1970) or to euedaphobionts in Rusek (2007), largely inhabiting the upper mineral layers of the soil (humus horizon). These Collembola tend to have elongated soft body of medium or small size without pigmentation; ocelli are absent, furca is reduced or absent.
3.2.5 Collembola community analysis Total Collembola abundance (means of fall sampling in each October from 1980-2000) and species abundance (fall samplings from selected years, see above) were calculated as number of individuals per m2. Dominance (%) of species was calculated as number of individuals of each species (ni) per total number of individuals of all species (100*ni/n). Mean values were calculated for all variables. All analyses were performed for the Collembola communities at 0-12 cm soil depth. The influence of recultivation on soil ecological parameters was assessed by comparison of data from SUC and REC. From this comparative approach, important information is gained at the expense of reduced sample size per plot (Koehler and Melecis 2010). The diversity of Collembola communities on SUC and REC was calculated using species number, Shannon-Weaver-index and Simpson-index (Mühlenberg 1993). Changes in species composition were calculated with species turnover rate between selected years as T=(J+E)/(S1+S2); where J is the number of additional species from year 1 to 2, E is the number of species lost between year 1 and 2, and S1 and S2 are the numbers of species at year 1 and 2, respectively (Dunger et al. 2004). The presence-absence similarity and dominance similarity and between two plots were assessed using Soerensen and Renkonen indices (Mühlenberg 1993). Average-linkage clustering was used to show how the groups of sites clustered into larger clusters on the basis of their similarity coefficients of log-transformed Collembola abundance data, defined as the mean distance of all combinations of sites of the two groups. The decision of four cluster groups was made on the base of a scree plot (Leyer and Wesche 2007). Multivariate analysis was performed using Canonical Correspondence Analysis (CCA) and Detrended Correspondence Analysis (DCA) using R (version 3.3.0) including packages vegan (Oksanen et al. 2017), car (Fox and Weisberg 2011) and Rcmdr (Fox 2005). CCA was applied for ordination of log-transformed Collembola abundance

Long-term development of Collembola communities on a former rubble deposit
46
data as response variables against climatic explanatory variables such as air temperature, precipitation and soil temperature. A Monte Carlo significance test of all canonical axes was run to check for significance of CCA outcome. Only significant CCA outcome is represented in the results. Significance of explanatory variables was tested with F-statistics. The environmental variables were included as means between October of the previous year and September of the year of sampling to get an appropriate result for fall (October) sampling. Only statistically significant correlations (p<0.05) were considered for interpreting the ordination results. Subsequently, the Collembola species table was reordered following the CCA scores for species and sample sites. To confirm the findings from CCA, linear regression analyses with autocorrelated residuals (autocorrelation structure of order 1 with year as a continuous time covariate) were applied to the annual Collembola abundance data. To reduce the high dimensional abundance vector (data from 33 Collembola species) the first principle coordinates from Correspondence Analysis (CA) were used. The vegetation data (vegetation cover data from 19 plant species) were condensed in a similar way. The autoregressive linear model was fitted for the Collembola principle coordinate as dependent and the vegetation principle coordinate as independent variable. The model also accounted for experimental condition (SUC/REC), soil temperature and precipitation (in 1000 mm) as additional independent variables. Potential differences between SUC and REC in the influence of soil temperature were modeled by an interaction term between experimental condition (SUC/REC) and soil temperature. A similar model was applied with air temperature replacing soil temperature as independent variable. In continuation to the findings from the linear regression analyses with autocorrelated residuals applied to the annual Collembola abundance data, a similar autoregressive linear model was fitted for the Collembola principal coordinate to test the variability of species abundance and diversity between the two plots across years. The model also accounts for experimental conditions and precipitation, besides vegetation principal coordinate. There is a very high correlation (0.9506489) between time period and soil temperature. Hence, the two terms are not used in the model together. Similar results hold for air temperature values as a significant correlation (0.7998336) is present between air temperature and time period. The linear regression analyses were done with R (version 3.3.2) applying the packages ca (Nenadic and Greenacre 2007) and nlme (Pinheiro et al. 2017). P-values below 0.05 are considered as statistically significant. DCA analysis was applied to show the ordination of the development of SUC and REC sites based on the vegetation cover data in comparison to the Collembola abundance data.
3.3 Results
3.3.1 Macroclimate of the study area The annual mean air temperature and soil temperature at -10 cm increased by about 2 °C between 1980 and 2000. This increase was more pronounced in soil at 10 cm depth from 9 °C to 11 °C (Fig. 3.1). The coldest year was 1996 with a mean air temperature of 7.8 °C, and 1989 with a mean air temperature of 10.3 °C was the warmest one. The annual amount of precipitation was lowest

Long-term development of Collembola communities on a former rubble deposit
47
in 1996 with 391.8 mm and was highest in 1993 with 883.6 mm. In the soil at 10 cm depth the lowest and the highest annual means were recorded in 1987 and 1995 with a mean of 8.6 °C and 11.6 °C, respectively (data for Oct-Sep of the respective years from German Weather Service; www.dwd.de). A comparison of seasonal monthly mean air temperature in Bremen showed winter (especially January and February) as indicative for climate change with a profound increasing trend 1980-2000. According to the twenty climatograms of Bremen for 1980 to 2000, 10 drought periods were identified, where the precipitation line was below the temperature line. These can be regarded as major potential disturbances for biota. Among these periods, the longest drought was in summer 1983 with the highest number of dry days (Fig. 3A1; Koehler and Müller 2003; the drought periods were inserted into the diagrams by the authors).
Figure 3.1. Changes of (A) air temperature, (B) precipitation, and (C) soil temperature -10 cm from mean values from October to September (Oct-Sep) for 1980-2000 (Bremen airport, 1980 to 2000 from German Weather Service; www.dwd.de).

Long-term development of Collembola communities on a former rubble deposit
48
3.3.2 Abundance Between 1980 and 2000, the mean abundance of Collembola in October at 0-12 cm depth varied between 3,800 [minimum] and 118,667 [maximum] ind/m2 on SUC and between 5,667 [minimum] and 91,942 [maximum] ind/m2 on REC (Fig. 3.2). Generally the total Collembola abundance showed a decreasing trend in both plots. The maximum abundance was higher on SUC than on REC. The pioneer maximum (the early increase maximum of abundance; Dunger and Voigtländer 2009) occurred later on SUC than on REC, precisely five years after start (1985) on SUC, and in the beginning of succession (1980) on REC. The minimum abundance in both plots occurred after 11 years of succession, but there was also an abrupt reduction of total abundance in the 4th year of succession on SUC after two dry summers in 1982 and 1983 (Fig. 3.2 and Fig. 3A1). Vertical distribution of Collembola individuals was variable in the two experimental plots; in total 64% were found in 0-4 cm, 20% in 4-8 cm and 16% in 8-12 cm. In the colder phase of succession (1980-1986), between 45 and 55% and in the warmer phase (1990-2000), between 80 and 90 % of total number of Collembola individuals were found in 0-4 cm of the soil on SUC and REC (Fig. 3A2).
3.3.3 Species numbers and diversity In total, 33 Collembola species were identified from 12 families and 23 genera (Table 3A1). Species numbers in 0-12 cm were similar on SUC and REC (9 to 17 and 8 to 17 per year, respectively). In the course of succession, species richness increased on SUC from 9 in 1980 to 12 in 2000, but decreased on REC from 17 in 1980 to 13 in 2000 (Fig. 3.3). Hemiedaphic Collembola had the highest number of species (17/52%), followed by euedaphic (14/42%) and epigeic Collembola (3/9%). The alpha diversity calculated as Shannon-Weaver and Simpson-indices increased on both experimental plots during the selected years (Fig. 3.3). Within the soil profile, species richness decreased with depth. Summed up over all samples per year, we found on SUC in 0-4 cm 6-15 species, in 4-8 cm 1-9 species, and in 8-12 cm 2-6 species. The respective species numbers on REC per year were: 0-4 cm: 8-16, 4-8 cm: 2-10, 8-12 cm: 2-7. The results in Table 3.1, which show the comparison of Collembola abundance and diversity between SUC and REC across years, confirm the influence of time period, calculated in terms of the duration elapsed since the start of the study, on the species abundance and diversity of Collembola (p-value = 0.01). The rest of the factors were not found to be statistically significant (Table 3.1).
3.3.4 Community structure and species turnover Species composition on SUC and REC was similar over the study period. Out of totally 33 species, 27 common species were identified for the two plots (Table 3A1). Only three species, Mesaphorura krausbaueri, Parisotoma notabilis and Isotomodes productus were present more or less in all selected years, from beginning to the end of succession (Fig. 3.4A). These species were the most dominant species; M. krausbaueri with 32.8%, P. notabilis with 19.6% and I. productus with 18.5%. The dominances of the most abundant endogeic species (more than 10%) were highly

Long-term development of Collembola communities on a former rubble deposit
49
variable through the selected years, but differed slightly between SUC and REC. I. productus and M. krausbaueri were dominating the first decade of succession from 1980 to 1990 on SUC and REC. These species were persistent, but appeared in much lower dominances at mid and late years of succession. I. productus in both plots, Willemia anophthalma on SUC and Proisotoma minuta on REC were dominant and characteristic species of earlier years of succession (pioneer species) and they established themselves in the beginning of succession. P. notabilis appeared during the whole period of succession on SUC and REC, but with higher dominances in the second decade of succession from 1990 to 2000. Recultivation accelerates the initial colonization of all groups in the soil and because of that, some persistent species like P. notabilis also appeared in high dominances in the early phase of succession. On REC, Isotomurus palustris and Sphaeridia pumilis and on SUC Pseudosinella alba and P. immaculata were dominating the mid years of succession. Megalothorax minimus, Lepidocyrtus lanuginosus and especially Entomobrya lanuginosa were considered as characteristic species of the late succession phase and they appeared in the second decade, particularly in late years of succession in both plots (Fig. 3.4A). Species turnover rate in the two plots profoundly decreased between 1990 and 1994 on SUC and between 1981 and 1982 on REC (Fig. 3.4B). This indicated the lowest variability in species composition in respective years. However, species turnover rate followed an irregular trend over the whole period of succession on SUC and REC. These results revealed a more dynamic species composition in the first decade rather than in the second decade on SUC with higher species turnover rate. In turn, these changes appeared more irregular on REC, without following a distinct trend (Fig. 3.4B). The presence-absence similarity (Soerensen index) of Collembola communities between SUC and REC was highest with 88% in the last year of succession (2000) and it was lowest with 48% ten years after the beginning of succession (1990). The dominance similarity (Renkonen index) of Collembola communities between SUC and REC was highest with 74% in the second year of succession (1982) and it was lowest with 31% eighteen years (1998) after the beginning of succession. Overall, species identity converged over the 20 years whereas rather an opposite trend was found for dominance identity (Fig. 3.4C).

Long-term development of Collembola communities on a former rubble deposit
50
Figure 3.2. Total Collembola abundance (103*ind/m2) on SUC (the plot left for natural secondary succession) and REC (the plot recultivated with rotary tilling) for 1980-2000.
Figure 3.3. Species numbers and diversity indices; Species richness, Shannon-Weaver (Shan) and Simpson indices (Simp) in selected years on SUC (the plot left for natural secondary succession) and REC (the plot recultivated with rotary tilling) in three phases of succession: early phase (1980, 1981, 1982), intermediate phase (1986, 1990, 1994) and late phase (1998, 1999, 2000).

Long-term development of Collembola communities on a former rubble deposit
51
Table 3.1. Linear model with autoregressive residuals for the first principle coordinate from CA of the Collembola abundances. The model accounts for first principle coordinate (vegetation) from CA of the vegetation data, as well as for experimental conditions (SUC; the plot left for natural secondary succession and REC; the plot recultivated with rotary tilling), period (time) and precipitation.
Value Std.Error t-value p-value SUC/REC 0.9541291 1.1031889 0.8648828 0.4041 vegetation 0.3634412 0.4398041 0.8263706 0.4247 precipitation -0.0000744 0.0018506 -0.0402203 0.9686 period 0.0856496 0.0306391 2.7954353 0.0162 period: SUC/REC -0.0114419 0.0485271 -0.2357830 0.8176
Figure 3.4. (A) Dominance structure of endogeic Collembola indicator species (according to a threshold dominance of more than 10% and CCA scores for soil temperature -10 cm; for details see Table 3A2) on SUC (the plot left for natural secondary succession) and REC (the plot recultivated with rotary tilling). Species complete names in alphabetical order: elan= Entomobrya lanuginosa, enic= Entomobrya nicoleti, fcan= Folsomia candida, fmir= Friesea mirabilis, ipal= Isotomurus palustris, ipro= Isotomodes productus, llan= Lepidocyrtus lanuginosus, mkra= Mesaphorura krausbaueri, mmin= Megalothorax minimus, palb= Pseudosinella alba, pimm= Pseudosinella immaculata, pmin= Proisotoma minuta, pnot= Parisotoma notabilis, spum= Sphaeridia pumilis, wano= Willemia anophthalma. (B) Species turnover rate (Sp. turnover rate) between the selected years on SUC and REC. (C) Soerensen (Soe) and Renkonen (Ren) similarity indices between SUC and REC. All these analyses were performed for three phases of succession: early phase (1980, 1981, 1982), intermediate phase (1986, 1990, 1994) and late phase (1998, 1999, 2000).

Long-term development of Collembola communities on a former rubble deposit
52
3.3.5 Ordination of Collembola abundance and vegetation cover data in correlation with climatic variables The clustering dendrogram based on average linkage clustering of Collembola abundance data (Fig. 3.5) revealed four groups of sampling years of the sites on SUC and REC. These groups roughly represented stages of succession but did not differentiate between management (SUC and REC): group 1: s80, s81, r80; group 2: s82, s86, r81, r82, r86; group 3: s90, s94; group 4: s98, s99, s100, r90, r94, r98, r99, r100. These four groups were set in relation to the “soil temperature -10 cm of the respective years”. Characteristic temperatures were around 9 °C, 9.3 °C, 10.5 °C and 11 °C for group 1, group 2, group 3 and group 4, respectively (Table 3.2). In CCA analysis of Collembola species (log transformed abundance) in response to climatic variables (Fig. 3.6), the first axis explained 44.3% of the distribution, the second axis explained 12.5%, and remaining 43.2% are explained by further axes. The soil temperature -10 cm was the longest and closest vector to the first axis and it had the highest correlation with the first axis and was significant (p=0.014). Therefore, soil temperature -10 cm represented the gradient on the first axis. Precipitation was correlated with the second axis, but it was not significant (p=0.388) (Fig. 3.6A-B). Collembola species were located along the temperature gradient. The change of community composition over time on SUC and REC followed the ascending soil temperature -10 cm (Table 3A3). According to the correlation of axis 1 and 2 with two main climatic variables (temperature and precipitation), four climate indicator groups of Collembola species could be defined: cold-dry, cold-wet, warm-wet and warm-dry species (Table 3A2). Euedaphic species (I. productus, M. krausbaueri, W. anophthalma and P. minuta), two epigeic species (Isotoma viridis and Orchesella villosa) and one hemiedaphic species (Hypogastrura assimilis) were negatively correlated with axis 1. These species were dominating the colder (young) phase of succession. On the other hand, other hemiedaphic (E. lanuginosa, L. lanuginosus, P. notabilis) and euedaphic species (Isotomiella minor, P. immaculata, M. minimus, P. alba) were dominating the warmer (old) phase of succession. Several euedaphic species (I. productus, M. krausbaueri and W. anophthalma) from the colder phase and euedaphic (M. minimus and P.alba) and hemiedaphic species (P. notabilis) from the warmer phase were negatively correlated with axis 2 (Table 3A2, Fig. 3.6C-D). According to the gradient of species revealed from CCA scores, no specific difference between SUC and REC was found for Collembola in correlation with climatic variables (Table 3A3). The results for the autoregressive linear models are summarized in Tables 3.3 and 3.4. The models confirm the influence of soil and air temperature on the Collembola abundances (p-values are 0.001 and 0.01, respectively). Vegetation was not found to have a statistically significant influence on the Collembola abundances. The models could also not confirm differences between the two experimental conditions (SUC/REC) as well as the influence of precipitation. According to the DCA analysis of vegetation cover data the REC site was getting closer to the SUC site after cessation of mowing (Fig. 3.7A). In contrast, the DCA analysis of the Collembola

Long-term development of Collembola communities on a former rubble deposit
53
abundance data showed that the succession of the Collembola communities was following a similar trajectory in both plots (Fig. 3.7B).
Figure 3.5. Cluster dendrogram of log-transformed Collembola abundance data consisting of 4 groups based on average linkage clustering. (s=SUC; the plot left for natural secondary succession, r=REC; the plot recultivated with rotary tilling, 80=1980, 81=1981, 82=1982, 86=1986, 90=1990, 94=1994, 98=1998, 99=1999, 100=2000).
Table 3.2. Groups (Collembola abundance data) revealed from average linkage clustering in correlation with soil temperature at 10 cm depth (average, minimum and maximum). Throughout daily data for Oct-Sep of the respective years from German Weather Service; www.dwd.de.
year soil temperature -10 cm group
average minimum maximum SUC REC
1980 8.8 -3.0 22.7 1 1
1981 9.4 -0.6 23.7 1 2
1982 9.2 -4.4 24.9 2 2
1986 9.4 -4.7 26.1 2 2
1990 10.7 -0.4 23.6 3 4
1994 10.4 -2.3 28.6 3 4
1998 10.8 -1.9 25.2 4 4
1999 11.1 -1.9 26.4 4 4
2000 11.2 -0.3 28.3 4 4

Long-term development of Collembola communities on a former rubble deposit
54
Figure 3.6. CCA ordination diagrams (outcome of one CCA analysis, divided in four figures for better legibility): (A)-(B) Vectors characterizing environmental variables (air temperature, soil temperature -10 cm and precipitation) are shown with arrows. (C)- (D) Collembola indicator species are shown by square points, with considering axis X as temperature and axis Y as precipitation. For complete species names see Table 3A1. (SUC; the plot left for natural secondary succession and REC; the plot recultivated with rotary tilling).
Table 3.3. Linear model with autoregressive residuals for the first principle coordinate from CA of the Collembola abundances. The model accounts for first principle coordinate (vegetation) from CA of the vegetation data, as well as for experimental condition (SUC; the plot left for natural secondary succession and REC; the plot recultivated with rotary tilling), soil temperature and precipitation.
Coefficient Std.Error t-value p-value
SUC/REC -0.99 3.28 -0.30 0.8
Soil temperature -10 cm 0.83 0.19 4.28 0.001
precipitation 0.45 1.38 0.33 0.8
vegetation 0.12 0.30 0.39 0.7
SUC/REC: soil temperature -10 cm 0.14 0.30 0.48 0.6
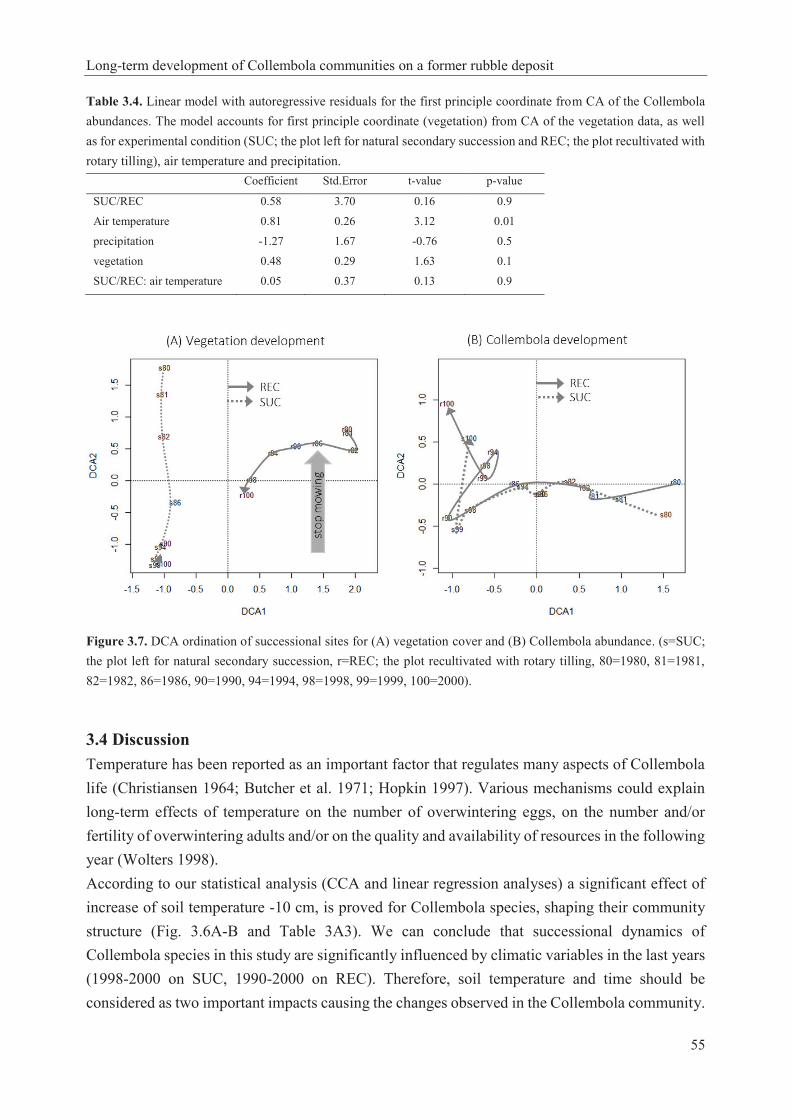
Long-term development of Collembola communities on a former rubble deposit
55
Table 3.4. Linear model with autoregressive residuals for the first principle coordinate from CA of the Collembola abundances. The model accounts for first principle coordinate (vegetation) from CA of the vegetation data, as well as for experimental condition (SUC; the plot left for natural secondary succession and REC; the plot recultivated with rotary tilling), air temperature and precipitation.
Coefficient Std.Error t-value p-value
SUC/REC 0.58 3.70 0.16 0.9
Air temperature 0.81 0.26 3.12 0.01
precipitation -1.27 1.67 -0.76 0.5
vegetation 0.48 0.29 1.63 0.1
SUC/REC: air temperature 0.05 0.37 0.13 0.9
Figure 3.7. DCA ordination of successional sites for (A) vegetation cover and (B) Collembola abundance. (s=SUC; the plot left for natural secondary succession, r=REC; the plot recultivated with rotary tilling, 80=1980, 81=1981, 82=1982, 86=1986, 90=1990, 94=1994, 98=1998, 99=1999, 100=2000).
3.4 Discussion Temperature has been reported as an important factor that regulates many aspects of Collembola life (Christiansen 1964; Butcher et al. 1971; Hopkin 1997). Various mechanisms could explain long-term effects of temperature on the number of overwintering eggs, on the number and/or fertility of overwintering adults and/or on the quality and availability of resources in the following year (Wolters 1998). According to our statistical analysis (CCA and linear regression analyses) a significant effect of increase of soil temperature -10 cm, is proved for Collembola species, shaping their community structure (Fig. 3.6A-B and Table 3A3). We can conclude that successional dynamics of Collembola species in this study are significantly influenced by climatic variables in the last years (1998-2000 on SUC, 1990-2000 on REC). Therefore, soil temperature and time should be considered as two important impacts causing the changes observed in the Collembola community.

Long-term development of Collembola communities on a former rubble deposit
56
Using time and soil temperature -10 cm, four groups of successional sites could be separated by average linkage clustering (Fig. 3.5 and Table 3.2). In this investigation, we stratified our samplings based on two experimental plots with two different managements, but with the same soil type (loamy sand); SUC (the plot left for natural secondary succession) and REC (the plot recultivated with rotary tilling). However, these two plots are ecological pseudo-replicates and are not spatially and temporally independent from each other. Consequently, the study documents a secondary succession of two experimental sites, a recultivated area [REC] and an untouched area for natural succession [SUC] (Koehler 2000). One effect of climate change on Collembola communities is a displacement of vertical distribution towards deeper soil layers, possibly accompanied by a change in composition of life forms (Petersen 2011). The life-form structure is an important parameter of collembolan communities: it reflects the state of soil development during succession and can indicate soil microstructure and humus form (Rusek 1989; Rusek 1998). The different temperatures in the soil profile (between 4 and 12 cm of soil depth) can affect the vertical distribution of soil animals. This issue was pronounced from 1982 on REC stronger than on SUC, furthermore it was a confirmation for the distinct temperature amplitude on REC. Both in summer and in winter the soil conditions on SUC were colder. This situation emerged from the strong effect of the snow and frost on SUC only in the first two winters of the successional study, 1980 and 1981 (Koehler and Müller 2003). Winter snow cover and depth will drive the impacts of winter climate change and add to spatial patterns in vegetation heterogeneity (Bokhorst et al. 2012b). Different life forms of Collembola species may differ the reaction of species to climate change in their vertical distribution. Euedaphic species were mostly affected by temperature increase, while hemiedaphic and epigeic ones appeared to be most sensitive to moisture conditions (Jucevica and Melecis 2006). The soft-bodied Collembola are sensitive to desiccation (Lindberg 2003). Drought may directly influence physiological reactions, resistance to dehydration, development responses, oviposition rate, or fecundity (Xu et al. 2012). To avoid drought, soil animals undertake vertical movements deeper into the soil or redistribute to moist patches (Petersen 2011). Drought has been shown and simulated by many authors to be a limiting factor for Collembola (Jucevica and Melecis 2006). According to the climatogram of Bremen, Germany (Fig. 3A1), two severe dry summers in 1982 and 1983 were determined as real disturbances for Collembola species by affecting soil temperature and precipitation. They caused an abrupt decline in Collembola total abundance in 1984 on SUC and a gradual decline in 1985 on REC (Fig. 3.2). However, the microclimate created by the vegetation structure on SUC rendered a quick recovery of the number of Collembola individuals one year afterward. Besides the climate effects revealed in this study, most Collembola species are following the colonizing groups observed by Dunger et al. (2004) on mine sites, confirming their successional dynamics. However, few hemiedaphic species (E. lanuginosa and L. lanuginosus) do not exactly follow the successional time but rather reflect the climatic variables. They were considered as pioneer species by Dunger and Voigtländer (2009), but appeared in the late phase of succession

Long-term development of Collembola communities on a former rubble deposit
57
(with drier situation followed by increased soil temperature). Lindberg (2003) found that drought-tolerant species of Collembola (often Entomobryidae) had narrower habitat preferences than drought-affected species and they prefer drier sites such as moss cushions and lichens on tree trunks, stones and walls. Lindberg (2003) reported that hemiedaphic species Entomobrya sp. and Lepidocyrtus sp. were less negatively affected by experimental drought. Petersen (2011) found Entomobryidae species significantly increased densities in warming and drought treatments. This is in accordance with our results. Thus, E. lanuginosa and L. lanuginosus can be considered as climate indicator species in this long-term study. The development of soil mesofauna of a successional site is influenced in qualitative and quantitative terms by the vegetation. The effect is caused to a large extent by the structure of the vegetation, which produces a specific microclimate (Koehler 1985). With ruderalization after cessation of mowing in 1987, the vegetation on REC became more similar to that on SUC (Koehler and Born 1989; Koehler and Müller 2003). The input of solar energy was measured on SUC and REC (Schriefer 1985). On SUC, only a small amount of the sun radiation (0.4%) reached the soil, compared with REC (17%). Because of the interception of the canopy on SUC, precipitation with less than 3 l. m-2 did not reach the ground (Schriefer 1985). Thus, the microclimate on REC was warmer and more humid than on SUC. The daily temperature fluctuations on REC were, however, higher than on SUC, and there was a chance of catastrophic loss of vegetation structure in dry periods and subsequent harsh microclimatic conditions. These results have been confirmed in the studies of 1982 and 1985 (Koehler and Born 1989). Therefore, we can conclude that the effect of climate change was stronger on REC with short grasses (especially in the years of mowing, before starting ruderalization) than on SUC with tall growing plants. Mowing was considered as a disturbance, and cessation of mowing in 1987 caused the attenuation of the vegetation on REC in comparison with SUC (Fig. 3.6B). Several studies pointed out the different responses of collembolan life forms to changes in vegetation (Salamon et al. 2004; Chauvat et al. 2011; Salamon et al. 2011; Eisenhauer et al. 2011). According to our study, the development of Collembola is asynchronous to the development of vegetation in the two experimental plots, and plant communities do not have any effects on the development of Collembola communities (Fig. 3.7A-B). Results from the study of Perez et al. (2013) underline the role of plant assemblages as a major driver of collembolan assemblages. This is not in accordance with our results. All these findings in this study are confirmed by a linear model with autoregressive residuals for the first principle coordinate from CA of the Collembola abundances accounts for vegetation, soil temperature and precipitation (Table 3.3), and for vegetation, air temperature and precipitation (Table 3.4). In conclusion, vegetation structure, especially on SUC, buffered the direct effect of above-ground climate change on soil microarthropods like Collembola species. Soil temperature was identified as a significant factor and climate change has to be considered to influence strongly the successional dynamics of Collembola. Still, the two important factors – temperature and time – are strongly correlated and cannot be separated.

Long-term development of Collembola communities on a former rubble deposit
58
Acknowledgements We wish to thank Dr. Ulrich Burkhardt and Dr. Hans-Jürgen Schulz (Senckenberg Museum of Natural History Görlitz, Germany) for their guidance in verification and examination of some Collembola species, Dr. Josef Müller (University of Bremen, Germany) for providing vegetation data, Prof. Dr. Werner Brannath and Garima Priyadarshini (University of Bremen, Germany) for their contribution in applying statistical methods.
Appendix 3A
Figure 3A1. Climatograms (after Walter and Lieth) of Bremen, Germany; Temperature (thin line) vs. precipitation (thick line). The drought points are shown here with black circles (from Koehler and Müller 2003).
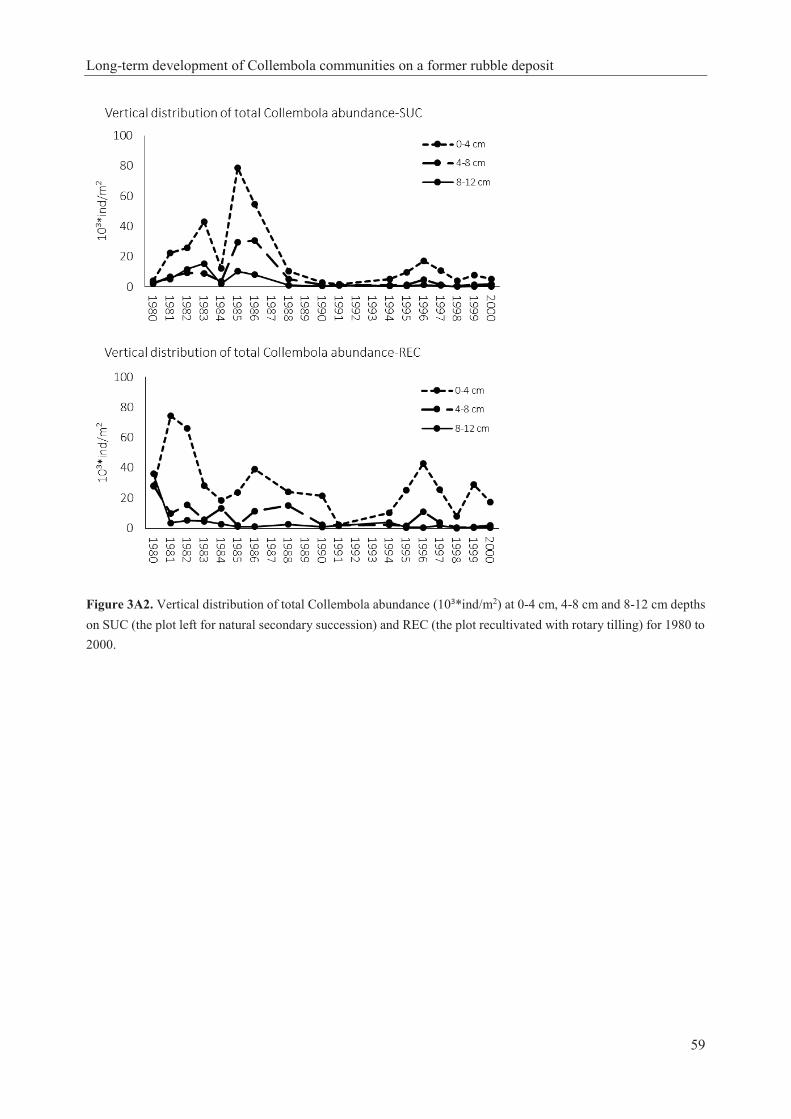
Long-term development of Collembola communities on a former rubble deposit
59
Figure 3A2. Vertical distribution of total Collembola abundance (10³*ind/m2) at 0-4 cm, 4-8 cm and 8-12 cm depths on SUC (the plot left for natural secondary succession) and REC (the plot recultivated with rotary tilling) for 1980 to 2000.

Long-term development of Collembola communities on a former rubble deposit
60
Table 3A1. List of identified Collembola species and plant species of this study and their occurrence on SUC (the plot left for natural secondary succession) and REC (the plot recultivated with rotary tilling).
Collembola species abbreviation occurrence of species on SUC and REC
Poduromorpha Brachystomella parvula (Schäffer, 1896) bpar SUC REC Friesea mirabilis (Tullberg, 1871) fmir SUC REC Hypogastrura assimilis Krausbauer, 1898 hass SUC REC Mesaphorura krausbaueri Börner, 1901 mkra SUC REC Metaphorura affinis Börner, 1902 maff REC Neanura muscorum (Templeton, 1835) nmus SUC REC Willemia anophthalma Börner, 1901 wano SUC REC Entomobryomorpha Cyphoderus albinus Nicolet, 1841 calb REC Entomobrya lanuginosa (Nicolet, 1842) elan SUC REC Entomobrya marginata (Tullberg, 1871) emar SUC REC Entomobrya multifasciata (Tullberg, 1871) emul SUC REC Entomobrya nicoleti (Lubbock, 1868) enic SUC REC Entomobrya schoetti Stach, 1922 esch REC Entomobrya sp. espe SUC REC Folsomia candida Willem, 1902 fcan SUC REC Isotoma sp. ispe SUC Isotoma viridis Bourlet, 1839 ivir SUC REC Isotomiella minor (Schäffer, 1896) imin SUC REC Isotomodes productus (Axelson, 1906) ipro SUC REC Isotomurus palustris (Müller, 1776) ipal REC Lepidocyrtus lanuginosus (Gmelin, 1788) llan SUC REC Orchesella cincta (Linnaeus, 1758) ocin REC Orchesella villosa (Geoffroy, 1764) ovil SUC REC Parisotoma notabilis (Schäffer, 1896) pnot SUC REC Proisotoma minuta (Tullberg, 1871) pmin SUC REC Pseudosinella alba (Packard, 1873) palb SUC REC Pseudosinella halophila Bagnall, 1939 phal SUC REC Pseudosinella immaculata (Lie-Pettersen, 1896) pimm SUC REC Willowsia buski (Lubbock, 1869) wbus SUC Neelipleona Megalothorax minimus Willem, 1900 mmin SUC REC Symphypleona Bourletiella hortensis (Fitch, 1863) bhor SUC REC Sminthurinus elegans (Fitch, 1863) sele SUC REC Sphaeridia pumilis (Krausbauer, 1898) spum SUC REC Plant species abbreviation occurrence of species
on SUC and REC Agropyron repens arep SUC REC Agrostis stolonifera asto SUC REC Archillea mill amil REC Artemisia spp aspe SUC Carex hirta chir REC Circium arvense carv SUC REC Dactvlis alomerata dalo SUC Festuca rubra frub REC Glechoma hederacea ghed REC Lolium perenne lper REC Lotus corniculatus lcor REC Melilotus alba malb SUC Poa spp pspe SUC REC Ranunculus repens rrep SUC Rubus armeniacus rarm SUC REC Ruderal species rspe REC Sinapis arvensis sarv SUC Solidago gigantea sgig SUC Urtica dioica udio SUC REC

Long-term development of Collembola communities on a former rubble deposit
61
Table 3A2. Ordination scores (reciprocal averaging method with linear combination of environmental variables in a multiple regression) of Collembola species abundance on the CCA axes.
climate species axis1 axis2 cold-dry espe -1.119 -0.428 cold-dry fcan -0.990 -0.282 cold-dry ipro -0.279 -0.080 cold-dry ispe -0.960 -0.963 cold-dry ivir -0.002 -0.196 cold-dry mkra -0.206 -0.132 cold-dry wano -0.929 -0.876 cold-wet bhor -1.576 0.691 cold-wet emar -0.445 0.754 cold-wet emul -1.485 0.358 cold-wet esch -1.370 0.068 cold-wet hass -1.714 0.934 cold-wet maff -2.011 1.679 cold-wet nmus -0.099 0.366 cold-wet ocin -2.011 1.679 cold-wet ovil -1.352 0.023 cold-wet pmin -1.432 0.277 cold-wet sele -0.002 0.056 warm-wet elan 0.883 0.078 warm-wet enic 0.325 0.077 warm-wet fmir 0.747 0.178 warm-wet imin 0.918 0.463 warm-wet ipal 0.812 1.200 warm-wet llan 0.777 0.223 warm-wet phal 0.850 0.606 warm-wet pimm 0.813 0.682 warm-wet wbus 0.920 0.592 warm-dry bpar 0.466 -0.108 warm-dry calb 0.997 -0.212 warm-dry mmin 0.443 -0.242 warm-dry palb 0.367 -0.149 warm-dry pnot 0.242 -0.129 warm-dry spum 0.393 -0.122

Long-term development of Collembola communities on a former rubble deposit
62
Table 3A3. Collembola dominance development in comparison to Vegetation cover percentage development on SUC (the plot left for natural secondary succession) and REC (the plot recultivated with rotary tilling); sorted by ordination scores of sampling years on the first CCA axis (soil temperature).
Collembola (SUC) Collembola (REC) -1.90 -1.16 -0.43 0.06 0.24 0.38 0.88 0.89 1.02 -2.07 -0.80 -0.64 0.44 0.67 0.73 0.80 1.08 1.11 ordination
scores soil temperature °C
8.8 9.4 9.2 9.4 10.7 10.4 10.8 11.1 11.2 8.8 9.4 9.2 9.4 10.7 10.4 10.8 11.1 11.2
species\ year 1980 1981 1982 1986 1990 1994 2000 1998 1999 1980 1981 1982 1986 1994 1998 1999 1990 2000 maff 0.11 -1.53 ocin 0.04 -1.53 hass 1.50 0.47 3.13 -1.53 emul 0.12 0.04 -1.49 bhor 7.14 0.08 0.12 -1.26 pmin 2.63 0.12 21.3 0.85 0.12 -1.18 ovil 0.23 0.36 0.20 -1.12 esch 0.04 0.36 -1.08 ispe 0.12 -1.00 espe 3.01 0.12 0.39 0.04 0.61 0.81 -0.86 fcan 1.50 10.6 0.17 0.45 0.54 1.41 0.05 -0.78 wano 0.87 22.1 0.24 4.28 1.62 -0.73 emar 1.13 0.63 1.92 1.19 0.53 0.47 -0.53 ipro 53.7 7.39 17.6 9.30 13.4 1.19 7.60 8.33 1.69 65.6 1.79 17.1 12.9 3.57 0.23 -0.46 mkra 28.9 57.7 41.6 79.9 7.69 19.0 1.75 2.78 1.85 9.35 60.0 47.4 3.27 7.62 1.43 -0.27 nmus 0.12 1.92 0.04 0.47 0.23 -0.20 sele 0.12 1.92 7.14 1.17 5.06 5.90 2.66 4.05 0.70 4.21 0.16 1.08 0.23 -0.09 ivir 0.37 16.1 0.19 0.27 15.7 19.4 0.36 8.15 1.87 5.95 7.93 5.02 -0.01 pnot 4.77 11.8 7.22 50.0 42.8 21.0 36.1 35.3 0.08 54.9 11.8 6.60 50.4 15.4 54.4 23.6 41.0 -0.01 enic 0.12 0.63 1.92 1.19 5.56 0.56 0.10 0.28 0.47 1.79 0.32 palb 0.19 0.36 5.77 15.4 0.58 1.44 1.52 16.0 10.7 14.2 7.00 7.17 6.50 0.35 spum 0.99 3.57 2.92 6.18 2.39 1.08 1.97 5.61 4.76 0.31 10.7 0.46 0.35 mmin 0.77 7.14 42.1 27.7 3.37 0.15 1.25 13.0 2.38 0.16 0.72 3.25 0.51 bpar 0.93 4.96 0.58 8.33 0.56 5.48 0.93 7.14 7.78 6.09 9.74 0.68 pimm 15.3 1.19 2.78 2.81 0.16 1.08 0.83 fmir 0.09 2.92 2.78 0.56 0.28 4.21 5.29 1.79 5.10 0.85 llan 0.09 2.92 2.78 16.2 0.14 3.27 46.4 9.18 10.0 6.50 1.05 elan 15.7 0.93 0.36 25.7 1.05 phal 2.78 1.12 0.36 1.10 wbus 0.56 1.19 imin 0.58 10.1 2.87 0.46 1.28 ipal 25.8 1.28 calb 0.46 1.46 Vegetation (SUC) Vegetation (REC) soil temperature °C
8.8 9.4 9.2 9.4 10.7 10.4 10.8 11.1 11.2 8.8 9.4 9.2 9.4 10.7 10.4 10.8 11.1 11.2
species\ year 1980 1981 1982 1986 1990 1994 2000 1998 1999 1980 1981 1982 1986 1994 1998 1999 1990 2000 rspe 15 5 -0.62 lper 50 60 35 15 1 7 -0.43 sarv 5 1 -0.42 malb 3 30 15 -0.40 rrep 1 10 7 -0.37 aspe 4 17 37 7 -0.36 lcor 1 10 65 -0.35 asto 3 20 35 1 5 7 1 20 5 7 0.5 -0.34 frub 15 5 5 30 45 30 55 40 0.23 sgig 1 3 3 25 15 10 40 40 0.26 dalo 1 15 25 20 20 10 30 25 0 0.28 amil 1 5 7 20 5 10 15 7 0.29 chir 1 15 0.33 pspe 1 3 10 25 15 10 3 5 3 1 5 15 20 25 10 7 3 0.38 rarm 10 1 3 1 3 0.53 ghed 7 1 7 5 0.54 arep 1 5 40 45 80 40 35 30 5 45 30 0.56 carv 1 1 1 20 10 3 10 10 10 1 1 30 15 50 3 0.69 udio 1 1 3 3 10 20 25 1 7 0.73

Long-term development of Collembola communities on a former rubble deposit
63
4 Collembola and Gamasina in a 20 years secondary succession with different management
Elaheh Daghighi*, Hartmut Koehler and Juliane Filser University of Bremen, UFT Center for Environmental Research and Sustainable Technology, Leobener Str. 6, 28359 Bremen, Germany *Corresponding author, email: [email protected] Under resubmission
Abstract Secondary succession of Collembola and Gamasina was investigated over 20 years from 1980 to 2000 on a rubble and debris dump in Bremen, Germany with two plots. One plot (SUC) was left undisturbed for natural secondary succession, the other plot (REC) was recultivated with rotary-tilling and sowing of grass. Successional synchrony between Collembola and Gamasina was hypothesized. We also expected differences due to management and associated vegetation development. Data from 18 sampling campaigns were evaluated. Soil cores of 0-12 cm were taken, divided into three equal layers and analysed for mesofauna. The sample size per campaign was n=6-12 per plot. Maximal abundances of 119,000 and 25,000 individuals per m2 were recorded for Collembola and Gamasina, respectively. The peak abundance of Collembola occurred in the first decade on SUC, and of Gamasina later in the second decade on REC. The management difference between SUC and REC was visible for only individual numbers of Gamasina. The species composition of Collembola community (with much lower species turnover rates than Gamasina in both plots) was more dynamic in the first decade than in the second decade on SUC. For Gamasina community, this was inversely observed on REC. Overall, Collembola community was more similar between both plots and Gamasina community was generally more diverse. Multivariate analyses (DCA and RDA) rendered clear differences in the successional development of Collembola and Gamasina communities, the latter displaying more distinct differences between both plots. Both were independent from the succession of plants. The abundance development of both microarthropod groups was significantly affected by soil temperature (increasing over time). Overall our data show clear differences between both microarthropod groups, especially with respect to biodiversity, management sensitivity and species turnover rates. Keywords: secondary succession; long-term development; microarthropods; soil biodiversity; recultivation
4.1 Introduction Determining the driving factors of successional dynamics in terrestrial ecosystems is one of the most important issues in ecology (Perez et al. 2013). For this purpose, investigation of microarthropods, which constitute a considerable and important part of soil fauna (Wissuwa et al. 2012) and provide multiple ecosystem services (Rumble and Gange 2013), is a valuable approach in a comparative long-term study. Among microarthropods, Collembola and mites are the most important groups in the soil (Wissuwa et al. 2012). Collembola become increasingly abundant in

Long-term development of Collembola communities on a former rubble deposit
64
managed grassland and especially in arable land, closely interact with all elements of the decomposer food web (Christiansen 1964; Lee and Widden 1996) and are active under various environmental conditions, unlike e.g. nematodes, bacteria or earthworms (Filser 2002). Many studies have demonstrated that mites are sensitive to modifications of different physical and chemical environmental factors (e.g., Ruf and Beck 2005; Gulvik 2007; Nielsen et al. 2010; Kardol et al. 2011; Manu et al. 2016). Recent studies suggest that Gamasina are among the most effective predators in soil food webs and effectively control prey populations (Koehler 1999), feeding on e.g. nematodes, Collembola, enchytraeids, insect larvae and mites (Koehler 1999; Wissuwa et al. 2012). Ecosystem change, especially multitrophic interactions, has explicitly to be considered in long-term successional studies (Koehler and Melecis 2010). Long-term development of the soil mesofauna community exhibits extended temporal dynamics, including gliding replacement of species (Koehler and Melecis 2010). Understanding such processes requires a full description of the interactions between below- and above-ground subsystems (Perez et al. 2013). Plant biomass, species composition and diversity affect soil biota via differences in the quantity and quality of trophic resources (Wissuwa et al. 2012). In turn, soil organisms affect plant productivity and composition through their essential role in ecosystem processes such as litter decomposition, interactions with microorganisms and nutrient cycling (Filser 2002; Henneron et al. 2017). We studied the dynamics of Collembola and Gamasina communities on a rubble and debris dump in the vicinity of Bremen, Germany on two experimental plots, undisturbed succession (SUC) and a recultivated site (REC). The specimens had been sampled by Koehler between 1980 and 2000 (Koehler 1998; Koehler and Müller 2003). The available data for Collembola were obtained from Daghighi et al. (2017), for Gamasina and vegetation from Koehler and Müller (2003). Collembola data were analysed in Daghighi et al. (2017) and the conceptions, figures and tables of Collembola data given here from Daghighi et al. (2017) were used and repeated to compare with Gamasina data. Aim of this study is to take advantage of a twenty years study in order to investigate the relationship between the successional dynamics of Collembola and Gamasina. We also compared these findings with plants in the study area and correlated them with a number of biotic and abiotic environmental variables. Long-term observations of soil microarthropods (e.g., Koehler and Müller 2003; Dunger et al. 2004; Jucevica and Melecis 2006; Koehler and Melecis 2010) are rare and their comparative studies (e.g., Irmler 2006; Schneider et al. 2007; Rumble and Gange 2013) even rarer. Gamasina are proposed as suitable indicators of ecological situations (Koehler 2000), and Collembola are considered as one of the most informative groups of microarthropods because they have a high species diversity and their taxonomy is well known (Dunger et al. 2004). Accordingly, we hypothesize that i) The successional development of Gamasina communities is synchronous to the successional development of Collembola communities, despite some differences between these two groups due to their ecological traits;

Long-term development of Collembola communities on a former rubble deposit
65
ii) The successional development of both studied groups is different on SUC and REC due to different management and vegetation structure; iii) Collembola and Gamasina are different from plants in their successional development because of their trophic position within the ecosystem.
4.2 Materials and methods
4.2.1 Experimental site The study site is an abandoned rubble and debris dump in the vicinity of Bremen, Northern Germany [moderate oceanic climate; Cfb according to Köppen climate classification (Peel et al. 2007), average temperature 9.2 °C, average precipitation 671 mm; 30 years annual mean 1971-2000 from German Weather Service; www.dwd.de]. Two experimental plots were established in 1980, one left undisturbed for natural secondary succession (SUC), with a size of 0.2 ha. An area of 0.1 ha was recultivated with rotary-tilling and sowing of grass (REC). The lawn on REC was mown for 7 years until 1987 and left undisturbed thereafter. Vegetation dynamics on the two experimental plots were studied over the whole period by Koehler and Müller (2003). Macroclimate and further details of the study area are described in Daghighi et al. (2017).
4.2.2 Sampling, extraction and identification The grass litter and the grasses themselves contributed to an approximately 10 cm sward of vital and dead vegetation. To ensure continuity, the soil samples always were taken after gentle removal of sward (the development of sward does not become visible in the soil carbon data but will affect microclimate; Daghighi et al. 2017). Soil microarthropods were sampled with a corer of a surface area of 25 cm² to a depth of 12 cm, subdivided in 4 cm layers and extracted with a MacFadyen canister type apparatus. Details on sampling, extraction, preparation and identification are given in Koehler (2000), Koehler and Müller (2003) and Daghighi et al. (2016, 2017). For our analysis, samples collected in fall (one sampling campaign per year) were selected from the first three years (1980, 1981, 1982; n=6), the last three years (1998, 1999, 2000; n=10) and in-between, with an interval of four years (1986, 1990; n=6, 1994; n=10). The analysis of the data set available for Gamasina (Koehler and Müller 2003), covering four sampling campaigns per year (1980-1993) shows some limitations of studying in detail selected October samples only. However, for the comparative approach of Gamasina and Collembola we followed in this paper is not affected by this.
4.2.3 Community analysis All analyses were performed for the Collembola and Gamasina communities for 0-12 cm soil depth. The influence of recultivation was assessed by comparing data from SUC and REC. Total abundance as mean number of individuals per m2 (n=6-10; 1980-1993: n=6, 1994-2000: n=10) was assessed for all October sampling campaigns from 1980-2000. Species abundances were calculated from the findings of the selected campaigns given above. Dominance (%) of species is

Long-term development of Collembola communities on a former rubble deposit
66
given as number of individuals of each species (ni) per total number of individuals of all species (100*ni/n). A dominance classification according to Engelmann (1978) was used: eudominant 40 – 100 % dominant 12.5 – 39.9 % main species subdominant 4.0 – 12.4 % recedent 1.3 – 3.9 % subrecedent < 1.3 % Main species >4% were selected according to this classification and Mühlenberg (1993). Mean values were calculated for all variables. The diversity of Collembola and Gamasina communities on SUC and REC was described using species number, Shannon-Weaver index and Simpson index (Mühlenberg 1993).
4.2.4 Analysis of successional dynamics Five ecological groups were distinguished using information on Collembola species by Fjellberg (1998, 2007), Bretfeld (1999), Potapov (2001), Dunger and Schlitt (2011) and Jordana (2012) and on Gamasina species by Karg et al. (1971), Krantz (1978) and Salmane and Brumelis (2010). Changes in species composition were calculated with species turnover rate between selected years as T=(J+E)/(S1+S2) where J is the number of additional species from year 1 to 2, E is the number of species lost between year 1 and 2, and S1 and S2 are the numbers of species at year 1 and 2, respectively (Dunger et al. 2004). The presence-absence similarity and dominance similarity and between two plots were assessed using Soerensen and Renkonen indices, respectively (Mühlenberg 1993). Six successional phases were determined based on the main species (>4%) of Collembola and Gamasina for the whole period of succession on SUC and REC. Detrended Correspondence Analysis (DCA) and Redundancy Analysis (RDA; corresponds to CCA, but is based on a linear model) were performed using R (3.3.2), applying packages vegan (Oksanen et al. 2017), car (Fox and Weisberg 2011) and Rcmdr (Fox 2005). DCA analysis was chosen to show the ordination of the successional development of SUC and REC plots based on the Collembola and Gamasina abundance and vegetation cover data. RDA was applied for ordination of log-transformed Collembola and Gamasina species abundance as response variables against some Ellenberg’s weighted mean indicator values (Ellenberg et al. 1992; F: soil humidity, R: pH reaction, N: nitrogen content, PRI: potential rooting impact) and some environmental variables in the studied area (ST: soil temperature at 10 cm depth, Prec: precipitation, C/N: measured C/N ratio). Climate data for Oct-Sep of the respective years are from German Weather Service (www.dwd.de). A Monte Carlo significance test of all canonical axes was run to check for significance of RDA outcome. Only significant RDA results are represented in the results. Significance of explanatory variables was tested with F-statistics. Only statistically significant correlations (p<0.05) were considered for interpreting the ordination results. To confirm the findings of RDA, a linear regression analysis with autocorrelated residuals (autocorrelation structure of order 1 with year as a continuous time covariate) was applied to annual data of each
collateral species

Long-term development of Collembola communities on a former rubble deposit
67
of the Collembola and Gamasina abundances. The dimensionalities of the abundance vectors (data from different species of Collembola and Gamasina) were reduced by taking into consideration only the first principal component from the correspondence analysis. An autoregressive linear model was fitted with the principal coordinates of each of the abundances of Collembola and Gamasina species as dependent variables, and independent variables accounting for management type (SUC/REC), soil temperature, precipitation, soil humidity and Ellenberg pH reaction values. Potential differences between the two plots (SUC/REC) in the influence of soil temperature were modelled by an interaction term. The analyses were done with R (version 3.3.3) using packages ca (Nenadic and Greenacre 2007) and nlme (Pinheiro et al. 2017). P-values below 0.05 are considered as statistically significant.
4.3 Results
4.3.1 Abundance Between 1980 and 2000, the mean abundance of Collembola in October at 0-12 cm depth varied between 3,800 [minimum] and 118,667 [maximum] ind/m2 on SUC and between 5,667 [minimum] and 91,942 [maximum] ind/m2 on REC. The corresponding abundances for Gamasina were 800 [minimum] and 9,943 [maximum] ind/m2 on SUC and 2,857 [minimum] and 25,029 [maximum] ind/m2 on REC (Fig. 4.1). In general, total Collembola abundance showed a decreasing trend in both plots, but numbers of Gamasina did not show any trend. The pioneer maximum clearly differed with respect to management, appearing at the very beginning on REC in 1982 (Gamasina) and in 1985 (Collembola) on SUC. On REC it was earlier than on SUC (effect of recultivation measure). The minimum abundance of Collembola in both plots occurred earlier than that of Gamasina after 11 years of succession. For Gamasina it occurred earlier on SUC than on REC, respectively 14 (1994) and 18 years after start of succession (1998) (Fig. 4.1). The maximum abundance of Collembola on SUC was about 1.3 times higher than on REC (Fig. 4.1). In contrast to the Collembola, the abundance development of Gamasina was considerably influenced by the recultivation measure, which stimulated abundances on REC with maxima almost 2.5 times as high as on SUC (Fig. 4.1).
4.3.2 Diversity In total, 33 Collembola and 54 Gamasina species were identified (Tables 4A1 and 4A2). The number of Collembola species recorded for the sampling campaigns was similar on SUC and REC (9 to 17 and 8 to 17, respectively). Gamasina species numbers reflected a positive effect of the recultivation measure with only 4 to 7 species on SUC compared to 4 to 14 on REC (Fig. 4.2A). On SUC, Collembola species richness increased profoundly from 9 in 1980 to 12 in 2000, but decreased on REC from a pioneer community with 17 species in 1980 to 13 in 2000. In turn, Gamasina species richness increased in both plots, from 4 in 1980 to 7 in 2000 on SUC and from 4 in 1980 to 14 in 2000 on REC (Fig. 4.2A). The alpha diversity of Collembola and Gamasina was calculated as Shannon-Weaver and Simpson indices. The Shannon-Weaver index of both groups increased in both experimental plots (Fig.

Long-term development of Collembola communities on a former rubble deposit
68
4.2B). The Simpson index of Collembola showed an increasing trend, whereas for Gamasina it very slightly decreased (Fig. 4.2C).
Figure 4.1. Total abundance of Collembola (from Daghighi et al. 2017) and Gamasina (103*ind/m2) on SUC [the plot left for natural secondary succession] and on REC [the plot recultivated with rotary tilling] for 1980 to 2000. Shown are mean values (1980, 1981, 1982; n=6), (1986, 1990; n=6, 1994; n=10) and (1998, 1999, 2000; n=10).

Long-term development of Collembola communities on a former rubble deposit
69
Figure 4.2. (A) Species number, (B) Shannon-Weaver (Shan)
and (C) Simpson (Simp) indices for Collembola (from
Daghighi et al. 2017) and Gamasina on SUC [the plot left for
natural secondary succession] and on REC [the plot
recultivated with rotary tilling] in selected years of succession:
early years (1980, 1981, 1982), intermediate years (1986,
1990, 1994) and late years (1998, 1999, 2000). Shown are
mean values (1980, 1981, 1982; n=6), (1986, 1990; n=6, 1994;
n=10) and (1998, 1999, 2000; n=10).

Long-term development of Collembola communities on a former rubble deposit
70
4.3.3 Community structure Collembola species composition was similar and Gamasina species composition was variable over the study period (fall samplings from selected years; see materials and methods [4.2]) in both plots. Out of totally 33 Collembola species, 27 (82%) were common to SUC and REC. From the 54 Gamasina species, 22 (40%) were common to both plots (Tables 4A1 and 4A2). Three Collembola species, Mesaphorura krausbaueri, Parisotoma notabilis, Isotomodes productus and only one Gamasina species, Rhodacarellus silesiacus, were present more or less in all selected years, from the beginning to the end of succession. These were the most dominant species: M. krausbaueri with 32.8%, R. silesiacus with 31.6%, P. notabilis with 19.6% and I. productus with 18.5%. The dominances of the most abundant species (more than 4%) of Collembola and Gamasina were highly variable through the selected years, but differed slightly between SUC and REC (Tables 4A4 and 4A5). Collembola species I. productus and M. krausbaueri dominated the first decade of succession from 1980 to 1990 on SUC and REC. These permanent species appeared in lower dominances at mid and especially late years of succession. However, another permanent Collembola species P. notabilis dominated the second decade of succession from 1990 to 2000 in both plots. In contrast, the persistent Gamasina species R. silesiacus appeared with high dominances in all selected years on SUC and in the first decade on REC (details in Tables 4A4 and 4A5).
4.3.4 Species turnover rate Collembola species turnover rate in the two plots profoundly decreased between 1990 and 1994 (intermediate phase) on SUC and between 1981 and 1982 (early phase) on REC (Fig. 4.3). In contrast to Collembola, Gamasina species turnover rate followed a decreasing trend on SUC and an increasing trend on REC with a profound increase between 1986 and 1990 (intermediate phase) indicating the highest variability in their species composition in respective years (Fig. 4.3). These changes were more irregular in Collembola communities than in Gamasina communities, without following a distinct trend over the whole period of study (Fig. 4.3).
4.3.5 Influence of recultivation measure The presence-absence similarity (Soerensen index) of Collembola species between SUC and REC was highest with 88% in the last year of succession (2000) and it was lowest with 48% ten years after the beginning of succession (1990). The dominance similarity (Renkonen index) of Collembola species between SUC and REC was highest with 74% in the second year of succession (1982) and it was lowest with 31% eighteen years (1998) after the beginning of succession (Fig. 4.4). The presence-absence similarity (Soerensen index) of Gamasina species between SUC and REC was highest (18%) and lowest (52%) in 1986 and 1999, respectively. The highest dominance similarity (Renkonen index) of Gamasina species occurred with 84% in 1980 and the lowest with 11% in 1986 (Fig. 4.4). The similarity indices of Collembola species showed a different pattern. The presence-absence similarity of Collembola species between two plots increased, but of

Long-term development of Collembola communities on a former rubble deposit
71
Gamasina species decreased over 20 years. However, the dominance similarity of both Collembola and Gamasina species showed a decreasing trend, which was found more profound in Gamasina than in Collembola. Overall, Collembola and Gamasina species identity converged over the 20 years whereas rather an opposite trend was found for dominance identity (Fig. 4.4).
Figure 4.3. Species turnover rate of Collembola (from Daghighi et al. 2017) and Gamasina on SUC [the plot left for natural secondary succession] and REC [the plot recultivated with rotary tilling] between the selected years of succession: early years (1980, 1981, 1982), intermediate years (1986, 1990, 1994) and late years (1998, 1999, 2000). Shown are mean values (1980, 1981, 1982; n=6), (1986, 1990; n=6, 1994; n=10) and (1998, 1999, 2000; n=10).

Long-term development of Collembola communities on a former rubble deposit
72
Figure 4.4. Soerensen and Renkonen similarity indices of Collembola (from Daghighi et al. 2017) and Gamasina between SUC [the plot left for natural secondary succession] and REC [the plot recultivated with rotary tilling] in selected years of succession: early years (1980, 1981, 1982), intermediate years (1986, 1990, 1994) and late years (1998, 1999, 2000). Shown are mean values (1980, 1981, 1982; n=6), (1986, 1990; n=6, 1994; n=10) and (1998, 1999, 2000; n=10).
4.3.6 Impact of environmental variables The DCA analysis based on the Collembola and Gamasina abundance data showed that the dynamics of Gamasina are asynchronous to that of Collembola and their successional development did not follow a similar trajectory (Fig. 4.5). The comparison between SUC and REC revealed synchronized dynamics of Collembola abundance and an asynchronized dynamics of Gamasina abundance (Fig. 4.5A-B). Also the successional development of plant species based on the vegetation cover followed a totally different trajectory from the successional development of two investigated groups of microarthropods (Fig. 4.5C). The association of the two microarthropod groups [log-transformed abundance data of all species] with some environmental variables is shown by RDA analysis (Fig. 4.6A-D). For Collembola the first axis explained 55.49% of the distribution, the second axis explained 18.32%, and remaining 26.19% are explained by further axes. The soil temperature at 10 cm depth had the highest correlation with the first axis and was significantly contributing (p=0.001). Precipitation was insignificantly correlated with the second axis (p=0.381). Ellenberg’s indicator values; pH
Long-term development of Collembola communities on a former rubble deposit
73
reaction (R) tended to contribute to Collembola abundance (p=0.053), without any distinct correlation with the first two axes. Soil humidity (F) was insignificantly contributing with the third axis (p=0.271) of Collembola abundance RDA analysis (Fig. 4.6A-B). For Gamasina, 40.08% and 23.87% of the distribution are explained by first axis and second axis respectively. Further axes explained the remaining 36.05% of the distribution. According to the RDA analysis of Gamasina abundance, pH reaction was distinguished as the longest and closest vector to the first axis with the highest correlation with the first axis and a significant contribution (p=0.001). The second axis was closely correlated with potential rooting impact, but with an insignificant contribution (p=0.19). In addition to pH reaction, soil temperature at 10 cm depth also showed a highly significant contribution (p=0.001) (Fig. 4.6C-D). However, it was located in the middle of first axis and second axis without any distinct correlation with the first two axes. Therefore, soil temperature at 10 cm depth and pH reaction (R) represented the gradient on the first axis for both Collembola and Gamasina abundance. Only Gamasina were significantly correlated with R (Fig. 4.6A-D). The results for the autoregressive models are summarised in Table 4.1. The models confirm the influence of soil temperature on the succession of both groups and pH reaction on the succession of Gamasina. The rest of the factors did not have any statistically significant influence on the succession of the studied groups.

Long-term development of Collembola communities on a former rubble deposit
74
Figure 4.5. DCA ordination of successional sites based on the abundance of (A) Collembola (from Daghighi et al. 2017), (B) Gamasina, and (C) cover percentage of each plant species (from Daghighi et al. 2017). (s=SUC; the plot left for natural secondary succession, r=REC; the plot recultivated with rotary tilling, 80=1980, 81=1981, 82=1982, 86=1986, 90=1990, 94=1994, 98=1998, 99=1999, 100=2000).

Long-term development of Collembola communities on a former rubble deposit
75
Figure 4.6. RDA ordination diagrams (outcome of one RDA analysis, divided in four figures for better legibility): (A)-(C) Vectors characterizing significant environmental variables (ST: soil temperature at 10 cm depth; R: pH reaction and F: soil humidity [Ellenberg’s indicator values]) are shown with thin black arrows. (A)-(B) Collembola (from Daghighi et al. 2017) and (C)-(D) Gamasina dominant species (dominance >10%) are shown by square points, with considering axis X as soil temperature and axis Y as F: soil humidity [Ellenberg’s indicator value] for both groups. The thick black arrows show the time of stopping mowing in r86. The direction of time is shown by grey arrows. (s=SUC the plot left for natural secondary succession, is shown by dash line and triangle time points r=REC the plot recultivated with rotary tilling, is shown by solid line and round time points, 80=1980, 81=1981, 82=1982, 86=1986, 90=1990, 94=1994, 98=1998, 99=1999, 100=2000). For complete species names see Tables 4A1, 4A2 and 4A3.

Long-term development of Collembola communities on a former rubble deposit
76
Table 4.1. Linear model with autoregressive residuals for the first principal component from CA of the (A) Collembola (from Daghighi et al. 2017) and (B) Gamasina abundance. The model accounts for the soil temperature, experimental conditions (SUC/REC), precipitation, F: soil humidity and R: pH reaction [Ellenberg’s indicator value].
A) Collembola Value Std.Error t-value p-value soil temperature 0.79 0.2 3.97 0.002*** SUC/REC -2.19 2.95 -0.74 0.47 F -0.52 0.53 -0.99 0.34 R -0.62 0.65 -0.95 0.36 precipitation 0.0009 0.001 0.67 0.51 soil temperature: SUC/REC 0.19 0.3 0.64 0.53
B) Gamasina soil temperature 0.4 0.18 2.29 0.04*** SUC/REC -2.29 2.61 -0.88 0.4 F -0.95 0.46 -2.04 0.06 R -1.42 0.58 -2.46 0.03*** precipitation -0.002 0.001 -1.9 0.08 soil temperature: SUC/REC 0.18 0.26 0.66 0.52
4.4 Discussion To document the successional progress, long time spans are required (Koehler 2000). Plants and soil mesofauna meet the demands of a well-founded selection of a sufficient set of groups reflecting complexity and ecological importance in a successional study (Koehler and Melecis 2010). High spatial and temporal dispersal capability is characteristic of many Gamasina species (Koehler 1999; Minor and Cianciolo 2007; Manu et al. 2013). The distribution of Collembola species is conditioned by vertical stratification, soil characteristics (such as humus form, which was correlated with the effects of soil moisture and acidity on species distribution), air temperature, rainfall, and habitat closure (Salmon et al. 2014). According to the Collembola and Gamasina dominance development [>4%] (Tables 4A4 and 4A5), six successional phases could be distinguished with their representative dominant species of each phase (Fig. 4A1): 1. Permanent species [almost dominant in all selected years], 2. Early species [dominant in the first three years; 1980, 1981, 1982], 3. Post-early species [dominant in the first three years, but occurring in less dominances in the first ten years; 1980-1990], 4. Intermediate species [dominant in the mid-years; 1986, 1990, 1994], 5. Post-intermediate species [dominant in the mid-years, but occurring in less dominances in the last three years; 1986-2000], 6. Late species [dominant in the last three years; 1998, 1999, 2000]. The pioneer maximum (the early, first four years, increase maximum of abundance; Dunger and Voigtländer 2009) of Collembola and Gamasina is documented for early stages of zoological successions (e.g., Majer 1989; Koehler 2000; Dunger and Voigtländer 2009). The success of each pioneer species depends on a combination of their good dispersal ability and broad habitat tolerance (Hågvar 2010). Such species, which can tolerate the initially harsh microclimatic conditions find plenty of food (Koehler 1998), in this study were one Gamasina species A.

Long-term development of Collembola communities on a former rubble deposit
77
cetratus, and two Collembola species P. minuta and Bourletiella hortensis. Mesostigmata feed on Collembola and juvenile Oribatida, with some species being specialized on specific groups, P. crassipes and Lasioseius preferring Collembola (Karg 1993) and H. aculeifer preferring Acaridia and Oribatida (Karg and Mack 1986). A. bicornis, A. cetratus and other species from the family Ascidae feed on Collembola, juvenile Oribatida, nematodes and soft membranous mites (Karg 1993). Decline in suitable food may be one reason for the replacement of the species (Koehler 1998). Such feeding habits may explain the relationships between Mesostigmata and their prey Collembola and Oribatida (Wissuwa et al. 2012). Collembola species Willemia anophthalma in both plots and Proisotoma minuta on REC and Gamasina species Arctoseius cetratus in both plots, Pergamasus norvegicus on SUC and P. quisquiliarum, Hypoaspis angusta, Pergamasus crassipes on REC were dominant and characteristic species of early phase of succession (pioneer species). These findings were supported by Dunger et al. (2004), Rusek (2004) and Madej and Kozub (2014). Distinct Collembola species of the intermediate phase were Isotomurus palustris on REC and Pseudosinella immaculata on SUC. Chauvat et al. (2007) also observed I. palustris in middle-aged grassland. Post-intermediate Collembola species were Sphaeridia pumilis on REC and Pseudosinella alba on SUC, and Gamasina species Hypoaspis claviger, Asca bicornis on REC and Leioseius bicolor, Lysigamasus vagabundus on SUC, with a continuous appearance from mid to the end of the succession, but with high dominances in the mid years. These species were reported from more advanced and older sites by Dunger et al. (2004), Rusek (2004), Krawczynski (2007) and Madej and Kozub (2014). Characteristic Collembola species of the late phase were Lepidocyrtus lanuginosus and especially Entomobrya lanuginosa in both plots; for Gamasina these were Rhodacarus reconditus on REC and especially Leptogamasus suecicus on SUC. These species were also observed by Rusek (2004), Krawczynski (2007) and Madej and Kozub (2014) in the most advanced and old communities of succession. According to the DCA analysis in our study (Fig. 4.5A-B), the temporal successional development of Collembola communities is asynchronous to that of Gamasina communities. Even though they are not following the same trajectory during twenty years the single species of both groups maybe correlated with each other in their ecological context. Distinguishing ecological groups with identifying habitat requirements of Collembola and Gamasina species may help to understand their similarities and differences (Fig. 4A2). According to the existing literature about the ecology of Collembola and Gamasina species (see materials and methods), their habitat preferences could be defined in e.g. forests, meadows, grasslands, dunes, seashore, agricultural fields, woods, epiphytic mosses, bogs, fungi, vertebrate and invertebrate (Krawczynski 2007; Salmane and Brumelis 2010). Consequently, in this study five ecological groups could be distinguished for Collembola and Gamasina species (Tables 4A1, 4A2 and Fig. 4A2): 1. Eurytopic species, 2. Forest species, 3. Open habitats species, 4. Hygrophilous species, 5. Other species. A community structure [based on species dominances] considering ecological groups of Collembola and Gamasina is shown for SUC and REC (Fig. 4A2). Do we see any differences between Collembola

Long-term development of Collembola communities on a former rubble deposit
78
and Gamasina regarding their successional phases? The highest numbers of permanent, post-early and late Collembola species are typical for open habitats. Forest typical Collembola species dominate early and intermediate phases, and post-intermediate species are mostly eurytopic. In contrast, Gamasina species typical for open habitats dominate permanent, early and late phases. Intermediate and post-intermediate phases are dominated by Gamasina species typical for forests (Tables 4A1 and 4A2). In this investigation, we sampled two differently managed experimental plots; SUC (the plot left for natural secondary succession) and REC (the plot graded by heavy machinery and recultivated with rotary tilling) to document a secondary succession. However, samples from these two plots are pseudo-replicates and are not spatially and temporally independent from each other. To document the influence of recultivation, the synchronous observation of two experimental plots is needed (Koehler 2000). Recultivation accelerates the buildup of initial population densities and initial colonization of all groups in the soil by approximately one year (Koehler 2000), and because of that, some persistent Gamasina species like R. silesiacus and Collembola species like P. notabilis appeared in high dominances in the early phase of succession. In comparison to REC with its rather homogenous lawn, SUC seems to have a more diverse microhabitat-structure with higher speed of establishing of colonizing species, but poorer resources to support Gamasina colonization by high numbers of species at low densities (Koehler 1998, 2000). Also Bedano and Ruf (2007) showed that the community differences between agroecosystems were due to different management sites. In our study, management differences (SUC/REC) were not significant for abundance of Collembola and Gamasina (Table 4.1). However, according to the RDA analysis (Fig. 4.6A-D), the increasing separation distance between SUC and REC over time is obvious for Gamasina only whereas Collembola communities rather seem to become more similar over time. In this study, higher species numbers were found for Gamasina (54) than Collembola (33). For Gamasina, this finding was supported by e.g. Koehler (1999), Skorupski (2001), Gwiazdowicz (2007), Gulvik (2007), Skorupski et al. (2009), Salmane and Brumelis (2010) and Manu et al. (2013, 2016), and for Collembola by e.g. Dunger et al. (2004), Olejniczak (2004), Rusek (2004), Jucevica and Melecis (2006), Perez et al. (2013) and Rusterholz et al. (2014). The decrease of species turnover rate between 1990 and 1994 on SUC and between 1981 and 1982 on REC (Fig. 4.3) indicated the lowest variability in species composition in respective years. Overall, the turnover rate analysis revealed on SUC a more dynamic Collembola species composition in the first rather than in the second decade, which was inverse for Gamasina on REC. Several studies pointed out the different responses of microarthropod life forms and communities to changes in vegetation (e.g., Hågvar 1982, 1984; Hågvar and Abrahamsen 1984; Scheu and Schulz 1996; Salamon et al. 2004; Salmon et al. 2006; Chauvat et al. 2011; Eisenhauer et al. 2011; Salamon et al. 2011; Perez et al. 2013; Bokhorst et al. 2014). The findings from DCA analysis do not show any effect of plant species on the succession of investigated microarthropod groups (Fig. 4.5A-C), which is also supported by Bernier and Gillet (2012). The main thing is the important

Long-term development of Collembola communities on a former rubble deposit
79
effect of height of vegetation in SUC (undisturbed plot), creating a site-specific microclimate and favourable conditions for soil microarthropods (Daghighi et al. 2017). Roots and litter are a nutritional basis for soil biota, the development of which is favored by the recultivation in quantitative terms (Bardgett et al. 1998; Koehler 1998, 2000). In our study, a significant effect of potential rooting system of plants after Ellenberg et al. (1992) in the studied plots could not be proved statistically [RDA and linear regression analyses] on the abundance development of both investigated groups. Even where soil moisture is sufficient, the decisive limiting factor is soil temperature (Manu et al. 2016). Also in our study soil temperature was a significant factor affecting and explaining the long-term dynamics of both investigated microarthropod groups (Fig. 4.6A-D; Daghighi et al. 2017). None of the other studied environmental variables (F: soil humidity, N: nitrogen content, C/N ratio, precipitation) had any significant impact in our study. We clearly demonstrated that the significant contribution of pH reaction (R) was only found for Gamasina abundance development, which is supported by Bedano and Ruf (2007). Some studies (e.g., Chikoski et al. 2006; Manu 2011; Birkhofer et al. 2012) showed that soil mites prefer a lower pH, which is favorable for the development of fungi, the food source for other soil invertebrates (such as mycetophagous Collembola) which in turn form the prey for mesostigmatid mites (Manu et al. 2016). In our experiment the pH value in the soil also became lower during succession (according to the values available from the REC plot; Koehler and Müller 2003), most likely due to root exudates and humification processes (Koehler and Müller 2003). The effect of acidity on Collembola species assembly was described by Salmon et al. (2014), but our study does not support this finding. In conclusion, the different management in SUC and REC played an important role in successional changes of both vegetation structure and microarthropods. Especially on SUC, it created a special microclimate which may have buffered the direct effect of above-ground abiotic variables on soil microarthropods. The recultivation measure changing soil structure on REC influenced the successional development of both groups. The difference between the two plots is observable especially in Gamasina. Soil temperature and pH were determined as main influential environmental factors. They can significantly impact and drive the direction of species substitution during long-term development of Collembola and Gamasina species abundance. Still, they are strongly correlated with the effect of time and plant community development in the long-term successional study and cannot be separated.
Acknowledgements We wish to thank Dr. Ulrich Burkhardt and Dr. Hans-Jürgen Schulz (Senckenberg Museum of Natural History Görlitz, Germany) for their guidance in verification and examination of some Collembola species, Dr. Josef Müller (University of Bremen, Germany) for providing vegetation data, Raimund Kesel, Prof. Dr. Werner Brannath and Garima priyadarshini (University of Bremen, Germany) for their contribution in applying the statistical methods.

Long-term development of Collembola communities on a former rubble deposit
80
Appendix 4A Table 4A1. List of identified Collembola species of this study (from Daghighi et al. 2017), their occurrence on SUC (the plot left for natural secondary succession) and REC (the plot recultivated with rotary tilling) with their distinguished successional phase and habitat preference. For references see 4.2.4.
Collembola species abbreviation successional phase habitat preference SUC REC Bourletiella hortensis (Fitch, 1863) bhor early early open Brachystomella parvula (Schäffer, 1896) bpar post-intermediate post-intermediate open Cyphoderus albinus Nicolet, 1841 calb late open Entomobrya lanuginosa (Nicolet, 1842) elan late late open Entomobrya marginata (Tullberg, 1871) emar post-early post-early open Entomobrya multifasciata (Tullberg, 1871) emul early early forest Entomobrya nicoleti (Lubbock, 1868) enic post-intermediate intermediate open Entomobrya schoetti Stach, 1922 esch early open Entomobrya sp. espe early early open Folsomia candida Willem, 1902 fcan early early others Friesea mirabilis (Tullberg, 1871) fmir post-intermediate post-intermediate eurytopic Hypogastrura assimilis Krausbauer, 1898 hass early early eurytopic Isotoma sp. ispe early eurytopic Isotoma viridis Bourlet, 1839 ivir permanent permanent open Isotomiella minor (Schäffer, 1896) imin late post-intermediate hygrophilous Isotomodes productus (Axelson, 1906) ipro permanent post-early open Isotomurus palustris (Müller, 1776) ipal intermediate forest Lepidocyrtus lanuginosus (Gmelin, 1788) llan late post-intermediate forest Megalothorax minimus Willem, 1900 mmin post-intermediate post-intermediate forest Mesaphorura krausbaueri Börner, 1901 mkra permanent permanent open Metaphorura affinis Börner, 1902 maff early open Neanura muscorum (Templeton, 1835) nmus post-early post-intermediate eurytopic Orchesella cincta (Linnaeus, 1758) ocin early forest Orchesella villosa (Geoffroy, 1764) ovil early early forest Parisotoma notabilis (Schäffer, 1896) pnot permanent permanent eurytopic Proisotoma minuta (Tullberg, 1871) pmin early early others Pseudosinella alba (Packard, 1873) palb intermediate post-intermediate eurytopic Pseudosinella halophila Bagnall, 1939 phal late intermediate open Pseudosinella immaculata (Lie-Pettersen, 1896) pimm post-intermediate post-intermediate forest Sminthurinus elegans (Fitch, 1863) sele post-intermediate post-early open Sphaeridia pumilis (Krausbauer, 1898) spum late intermediate hygrophilous Willemia anophthalma Börner, 1901 wano early early forest Willowsia buski (Lubbock, 1869) wbus late open

Long-term development of Collembola communities on a former rubble deposit
81
Table 4A2. List of identified Gamasina species of this study. Further explanations see Table 4A1. Gamasina species abbreviation successional phase habitat preference SUC REC Amblyseius alpinus Schweizer, 1922 aalp intermediate forest Asca bicornis (Can. & Fanz., 1887) abic post-intermediate open Arctoseius cetratus (Sellnick, 1940) acet early early open Ameroseius corbiculus (Sowerby, 1806) acor intermediate early open Amblyseius graminis Chant, 1956 agra intermediate open Arctoseius minutus (Halbert, 1915) amin post-early forest Amblygamasus mirabilis Willmann, 1951 amir post-intermediate forest Amblyseius obtusus (C.L. Koch, 1839) aobt intermediate post-intermediate open Alliphis siculus (Oudemans, 1905) asic early early open Cheiroseius borealis (Berlese, 1904) cbor permanent open Cheiroseius necorniger (Oudemans, 1903) cnec early forest (Dendrolaelaps) armatus (Hirschmann, 1960) darm early forest Dendrolaelaps stammeri Hirschmann, 1960 dsta late open (Dendrolaelaps) strenzkei (Hirschmann, 1960) dstr intermediate open Eugamasus berlesei (Willmann, 1935) eber late forest Epicriopsis horridus Kramer, 1876 ehor intermediate forest Geholaspis mandibularis (Berlese, 1904) gema late intermediate forest Hypoaspis aculeifer (Can., 1883) hacu late late open Hypoaspis angusta Karg, 1962 hang post-intermediate post-early open Hypoaspis claviger claviger(Berlese, 1883) hcla late post-intermediate forest Hypoaspis vacua (Michael, 1891) hvac intermediate post-intermediate forest Lasioseius berlesei (Oudemans, 1938) lber intermediate forest Leioseius bicolor (Berlese, 1904) lbic intermediate post-intermediate forest Lysigamasus runcatellus (Berlese, 1903) lcat intermediate forest Lysigamasus celticus Bhattacharrya, 1963 lcel late forest Lysigamasus digitulus Karg, 1963 ldig intermediate open Lysigamasus misellus Berlese, 1904 lmis late intermediate open Leptogamasus suecicus (Trägardh, 1936) lsue late late eurytopic Lysigamasus vagabundus Karg, 1968 lvag post-intermediate forest Macrocheles carinatus (C.L. Koch, 1839) mcar intermediate forest Macrocheles merdarius (Berlese, 1889) mmer late late open Macrocheles recki Bregetova & Koroloeva, 1960 mrec late forest Neojordensia levis (Oudemans & Voigts, 1904) nele intermediate hygrophilous Pergamasus crassipes (Linné, 1758) pcra post-early early eurytopic Paragamasus diversus (Halbert, 1915) pdiv late forest Pseudolaelaps doderoi (Berlese, 1910) pdod post-intermediate post-intermediate others Parasitus beta Oudemans & Voigts, 1904 peta early early others Parasitus kraepelini (Berlese, 1905) pkra late others Parasitus lunulatus (J. Müller, 1859) plun early early others Pergamasus norvegicus (Berlese, 1905) pnor early others Proctolaelaps pygmaeus (Müller, 1860) ppyg intermediate forest Pergamasus quisquiliarum (Can., 1882) pqui post-intermediate early forest Protogamasellus dispar Genis, Loots & Ryke, 1967 prdi intermediate others Protogamasellus primitivus Karg, 1962 prpr late open Protogamasellus singularis (Karg, 1962) psin intermediate others Rhodacarus clavulatus Athias-Henriot, 1962 rcla permanent post-intermediate others Minirhodacarellus minimus (Karg, 1961) rmin intermediate open Rhodacarus reconditus Athias-Henriot, 1961 rrec post-intermediate late others Rhodacarellus silesiacus Willmann, 1935 rsil permanent permanent open Veigaia cerva (Kramer, 1876) vcer intermediate forest Veigaia planicola (Berlese, 1892) vpla post-intermediate late open Zercon colligans Berlese, 1920 zcoll late open Zercoseius spathuliger (Leonardi, 1899) zspa late forest Zercon triangularis C.L.Koch, 1836 ztri post-intermediate forest

Long-term development of Collembola communities on a former rubble deposit
82
Table 4A3. List of identified plant species of this study (from Daghighi et al. 2017). Further explanations see Table 4A1.
Plant species abbreviation plot Agropyron repens arep SUC REC Agrostis stolonifera asto SUC REC Archillea mill amil REC Artemisia spp aspe SUC Carex hirta chir REC Circium arvense carv SUC REC Dactvlis alomerata dalo SUC Festuca rubra frub REC Glechoma hederacea ghed REC Lolium perenne lper REC Lotus corniculatus lcor REC Melilotus alba malb SUC Poa spp pspe SUC REC Ranunculus repens rrep SUC Rubus armeniacus rarm SUC REC Ruderal species rspe REC Sinapis arvensis sarv SUC Solidago gigantea sgig SUC Urtica dioica udio SUC REC
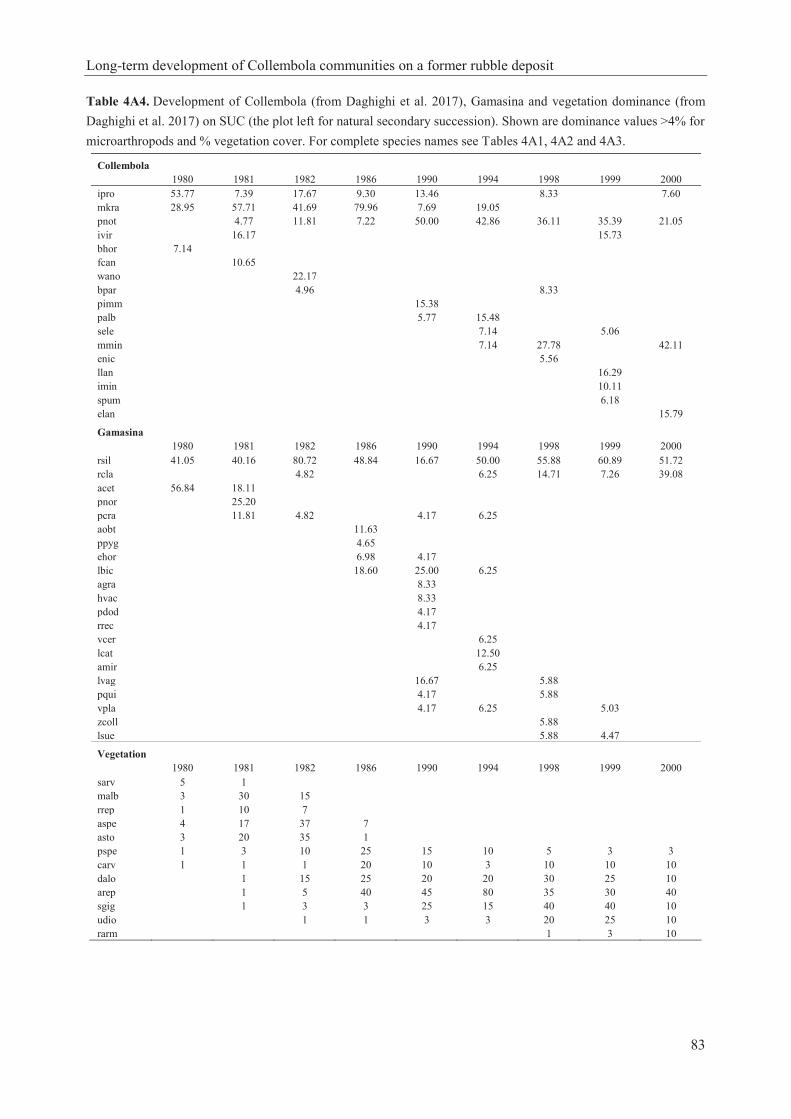
Long-term development of Collembola communities on a former rubble deposit
83
Table 4A4. Development of Collembola (from Daghighi et al. 2017), Gamasina and vegetation dominance (from Daghighi et al. 2017) on SUC (the plot left for natural secondary succession). Shown are dominance values >4% for microarthropods and % vegetation cover. For complete species names see Tables 4A1, 4A2 and 4A3.
Collembola 1980 1981 1982 1986 1990 1994 1998 1999 2000 ipro 53.77 7.39 17.67 9.30 13.46 8.33 7.60 mkra 28.95 57.71 41.69 79.96 7.69 19.05 pnot 4.77 11.81 7.22 50.00 42.86 36.11 35.39 21.05 ivir 16.17 15.73 bhor 7.14 fcan 10.65 wano 22.17 bpar 4.96 8.33 pimm 15.38 palb 5.77 15.48 sele 7.14 5.06 mmin 7.14 27.78 42.11 enic 5.56 llan 16.29 imin 10.11 spum 6.18 elan 15.79
Gamasina 1980 1981 1982 1986 1990 1994 1998 1999 2000 rsil 41.05 40.16 80.72 48.84 16.67 50.00 55.88 60.89 51.72 rcla 4.82 6.25 14.71 7.26 39.08 acet 56.84 18.11 pnor 25.20 pcra 11.81 4.82 4.17 6.25 aobt 11.63 ppyg 4.65 ehor 6.98 4.17 lbic 18.60 25.00 6.25 agra 8.33 hvac 8.33 pdod 4.17 rrec 4.17 vcer 6.25 lcat 12.50 amir 6.25 lvag 16.67 5.88 pqui 4.17 5.88 vpla 4.17 6.25 5.03 zcoll 5.88 lsue 5.88 4.47
Vegetation 1980 1981 1982 1986 1990 1994 1998 1999 2000 sarv 5 1 malb 3 30 15 rrep 1 10 7 aspe 4 17 37 7 asto 3 20 35 1 pspe 1 3 10 25 15 10 5 3 3 carv 1 1 1 20 10 3 10 10 10 dalo 1 15 25 20 20 30 25 10 arep 1 5 40 45 80 35 30 40 sgig 1 3 3 25 15 40 40 10 udio 1 1 3 3 20 25 10 rarm 1 3 10
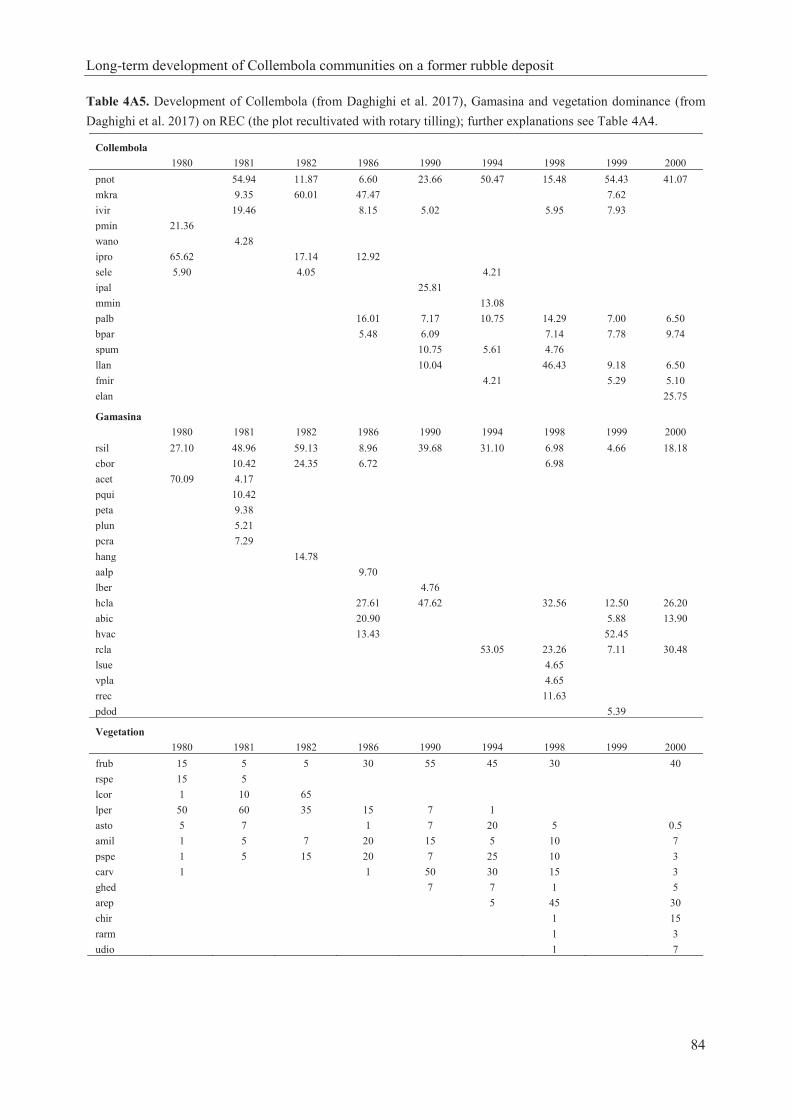
Long-term development of Collembola communities on a former rubble deposit
84
Table 4A5. Development of Collembola (from Daghighi et al. 2017), Gamasina and vegetation dominance (from Daghighi et al. 2017) on REC (the plot recultivated with rotary tilling); further explanations see Table 4A4.
Collembola 1980 1981 1982 1986 1990 1994 1998 1999 2000 pnot 54.94 11.87 6.60 23.66 50.47 15.48 54.43 41.07 mkra 9.35 60.01 47.47 7.62 ivir 19.46 8.15 5.02 5.95 7.93 pmin 21.36 wano 4.28 ipro 65.62 17.14 12.92 sele 5.90 4.05 4.21 ipal 25.81 mmin 13.08 palb 16.01 7.17 10.75 14.29 7.00 6.50 bpar 5.48 6.09 7.14 7.78 9.74 spum 10.75 5.61 4.76 llan 10.04 46.43 9.18 6.50 fmir 4.21 5.29 5.10 elan 25.75
Gamasina 1980 1981 1982 1986 1990 1994 1998 1999 2000 rsil 27.10 48.96 59.13 8.96 39.68 31.10 6.98 4.66 18.18 cbor 10.42 24.35 6.72 6.98 acet 70.09 4.17 pqui 10.42 peta 9.38 plun 5.21 pcra 7.29 hang 14.78 aalp 9.70 lber 4.76 hcla 27.61 47.62 32.56 12.50 26.20 abic 20.90 5.88 13.90 hvac 13.43 52.45 rcla 53.05 23.26 7.11 30.48 lsue 4.65 vpla 4.65 rrec 11.63 pdod 5.39
Vegetation 1980 1981 1982 1986 1990 1994 1998 1999 2000 frub 15 5 5 30 55 45 30 40 rspe 15 5 lcor 1 10 65 lper 50 60 35 15 7 1 asto 5 7 1 7 20 5 0.5 amil 1 5 7 20 15 5 10 7 pspe 1 5 15 20 7 25 10 3 carv 1 1 50 30 15 3 ghed 7 7 1 5 arep 5 45 30 chir 1 15 rarm 1 3 udio 1 7

Long-term development of Collembola communities on a former rubble deposit
85
Figu
re 4
A1.
Mod
el o
f si
x di
stin
guis
hed
succ
essi
onal
pha
ses
of C
olle
mbo
la a
nd G
amas
ina
dom
inan
ce [
>4%
] de
velo
pmen
t (T
able
s 4A
4 an
d 4A
5) w
ith id
entif
ying
the
repr
esen
tativ
e do
min
ant s
peci
es o
f eac
h ph
ase
on S
UC
[the
plo
t lef
t for
nat
ural
se
cond
ary
succ
essi
on] a
nd o
n R
EC [t
he p
lot r
ecul
tivat
ed w
ith ro
tary
tilli
ng] d
urin
g tw
enty
yea
rs o
f stu
dy fr
om 1
980
to 2
000.

Long-term development of Collembola communities on a former rubble deposit
86
Figure 4A2. Dominance structure of five distinguished ecological groups for Collembola and Gamasina: Eurytopic [wide variety of habitats], Forest, open [open natural habitats containing grasslands, meadows, agricultural fields], Hygrophilous [damp sites], others [without distinctive and sufficient ecological data] on SUC [the plot left for natural secondary succession] and on REC [the plot recultivated with rotary tilling].

Long-term development of Collembola communities on a former rubble deposit
87
Discussion

Long-term development of Collembola communities on a former rubble deposit
88
5 General discussion
5.1 Preconditions in long-term studies: preservation and preparation of specimens for a precise species determination To use soil microarthropods as bioindicators in a long-term successional research specialists must prepare and offer the indispensable fundamentals. In this case, correct determination of the species is an absolute prerequisite. It must be emphasized that biology, ecology and consequently indicator properties are strictly related to the species (Koehler and Melecis 2010). During a long-term study involving many sampling dates, which provides mass ecological data, it is usually not possible to evaluate and investigate them immediately after sampling and extraction. Long-term investigations store valuable specimens and data in large numbers, which are representative of changes in communities over time (maybe decades). This important issue reveals some questions, e.g. what materials to store, how and how long to store them. Consequently, in such studies as the first step we need to think and find about an appropriate method in order to make a suitable storage condition of extracted specimens and to keep them in a good condition for years or even decades for further microscopic surveys. In this study, the soil microarthropods had been sampled between 1980 and 2000; samples from 1980-1982 were identified by Berendt (1985) and samples from 1983-2000 were investigated by the author. The large number of extracted soil microarthropods had been preserved in 70% cold ethanol including minor impurities from the fixation fluids; picric acid (from 1980 to 1990) or ethylene glycol (from 1991 onwards) (Daghighi et al. 2016), since the time of sampling until the time of implementing the lab inspection of Collembola specimens by the author in 2014. This long-term (14-31 years) preservation caused great difficulties and challenges in the clearing procedure of Collembola specimens with standard methods in the lab. The first objective of this thesis (main method) reported in chapter 2 was to prepare these old Collembola specimens for an accurate microscopic identification, and to find effective methods to clear large numbers of them during and/or before permanent mounting for ecological investigations. The standard methods in our lab such as mounting in Marc André 2 without applying any pretreatment were not appropriate and could not help to prepare the old ethanol specimens for a proper microscopic inspection and accurate species identification. Thus, we tested different methods to find the best one to prepare the old ethanol Collembola for a precise microscopy inspection and consequently for a good ecological analysis of determined species, which is an essential factor for our ecological understanding. It was clearly demonstrated that the difficulty of clearing long-stored ethanol specimens could be overcome with applying an appropriate pretreatment method (technique developed for DNA extraction, SNET buffer solution), which is necessarily needed before permanent mounting with Marc André 2 (Daghighi et al. 2016).
5.2 Collembola succession at the Siedenburg dump site Passive dispersion of soil microarthropods (Collembola, Oribatei, Gamasida) occurs in different ways, e.g. by people (plants, cars, shoes etc.) or by animals (phoresy: Gamasida), but it has never

Long-term development of Collembola communities on a former rubble deposit
89
been examined for its quantitative effects (Dunger and Voigtländer 2009). Air transport is a strong factor influencing the succession of Collembola species, and this capability makes them successful early colonizers of reclaimed sites (Krawczynski 2007). Immigration of soil animals by air was tested at the Berzdorf mine sites by isolated plots of sterile and humus-free Pleistocene substratum for 497 days and consequently, Collembola with 46 % had the highest percentage of animals (Dunger et al. 2002; Wanner and Dunger 2002; Dunger and Voigtländer 2009). These tests suggest the important impact of immigration by air currents specifically for soil microarthropods (Dunger and Voigtländer 2009). There is still incomplete knowledge about the behaviour of microarthropods in immigration and dispersion (Dunger and Voigtländer 2009). One of the aims of a long-term study is to describe distinct phases of the succession, marked by different steps in the colonisation by Collembola (Dunger and Voigtländer 2009). The possibility of quick and easy sampling and accurate species determination of groups of soil fauna enable them to be appropriate for indicating successional phases (Dunger and Voigtländer 2005). The only feasible method for applying soil microarthropods as ecological indicators is to study them at the species level (Dunger 1997; Dunger et al. 2002; Dunger and Voigtländer 2005). To distinguish colonizing groups of species with the same or likely very similar colonising behaviour, the individual numbers of each species from the communities of Collembola were checked during twenty years of succession. Consequently, six colonizing groups [successional phases] could be defined in the present study (Fig. 4A1; Dunger et al. 2004): 1. Permanent group, 2. Early (pioneer) group, 3. Post-pioneer group, 4. Intermediate group, 5. Post-intermediate group, 6. Late group. All these colonizing groups were defined for Collembola communities on SUC [the plot left undisturbed for natural secondary succession] and on REC [the plot recultivated with rotary tilling and sowing of grass]. A short description of each colonizing group in this study is given below: 1. Permanent species [almost dominant in all selected years], 2. Early species [dominant in the first three years; 1980, 1981, 1982], 3. Post-early species [dominant in the first three years, but occurring in less dominances in the first ten years; 1980-1990], 4. Intermediate species [dominant in the mid-years; 1986, 1990, 1994], 5. Post-intermediate species [dominant in the mid-years, but occurring in less dominances in the last three years; 1986-2000], 6. Late species [dominant in the last three years; 1998, 1999, 2000]. In addition to the explanations above, the succession of each identified species of Collembola in this study is explained and compared with other studies in Table 5.1. Most of them support the findings about Collembola succession in the current thesis. Dunger et al. (2004) found Friesea mirabilis as post-pioneer species (early stages of succession) at brown coal mine sites, the density of which remained high for at least ten years (Dunger and Voigtländer 2009). They distinguished Neanura muscorum in pioneer woodland group, which was present as early as in the initial site stages but showed a rising density in the oldest studied mine sites and the native woodland (Dunger and Voigtländer 2009). They found Parisotoma
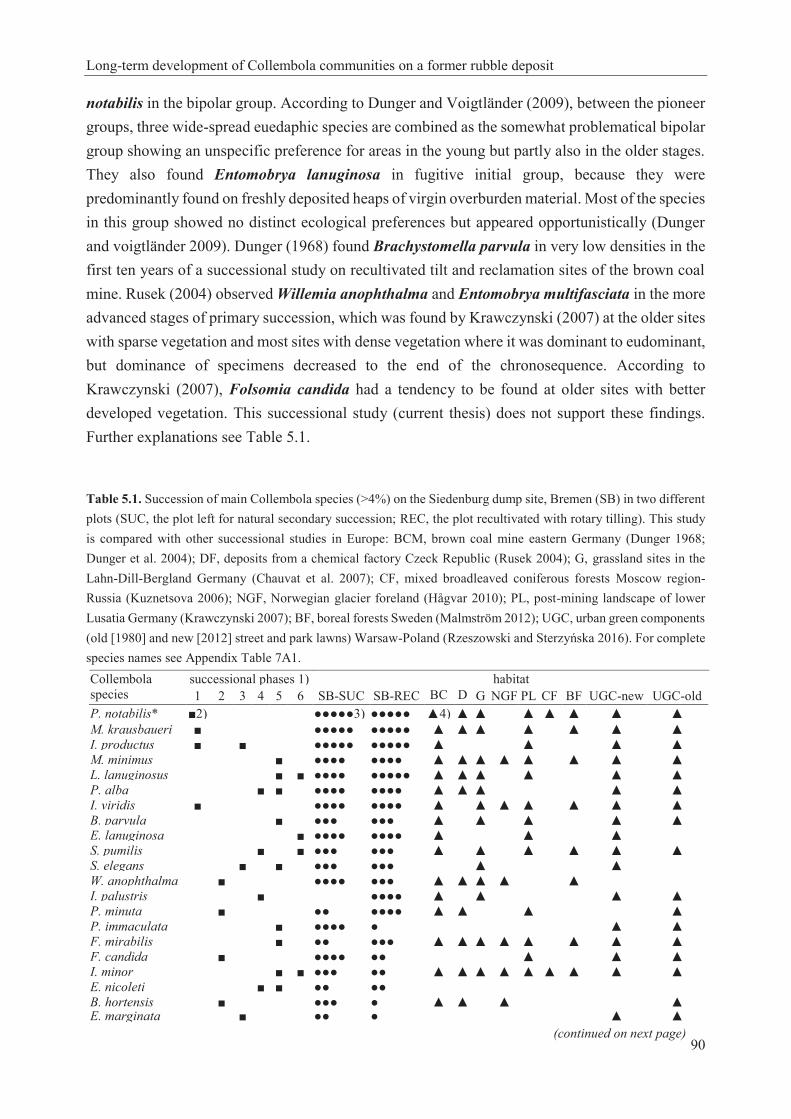
Long-term development of Collembola communities on a former rubble deposit
90
notabilis in the bipolar group. According to Dunger and Voigtländer (2009), between the pioneer groups, three wide-spread euedaphic species are combined as the somewhat problematical bipolar group showing an unspecific preference for areas in the young but partly also in the older stages. They also found Entomobrya lanuginosa in fugitive initial group, because they were predominantly found on freshly deposited heaps of virgin overburden material. Most of the species in this group showed no distinct ecological preferences but appeared opportunistically (Dunger and voigtländer 2009). Dunger (1968) found Brachystomella parvula in very low densities in the first ten years of a successional study on recultivated tilt and reclamation sites of the brown coal mine. Rusek (2004) observed Willemia anophthalma and Entomobrya multifasciata in the more advanced stages of primary succession, which was found by Krawczynski (2007) at the older sites with sparse vegetation and most sites with dense vegetation where it was dominant to eudominant, but dominance of specimens decreased to the end of the chronosequence. According to Krawczynski (2007), Folsomia candida had a tendency to be found at older sites with better developed vegetation. This successional study (current thesis) does not support these findings. Further explanations see Table 5.1.
Table 5.1. Succession of main Collembola species (>4%) on the Siedenburg dump site, Bremen (SB) in two different plots (SUC, the plot left for natural secondary succession; REC, the plot recultivated with rotary tilling). This study is compared with other successional studies in Europe: BCM, brown coal mine eastern Germany (Dunger 1968; Dunger et al. 2004); DF, deposits from a chemical factory Czeck Republic (Rusek 2004); G, grassland sites in the Lahn-Dill-Bergland Germany (Chauvat et al. 2007); CF, mixed broadleaved coniferous forests Moscow region-Russia (Kuznetsova 2006); NGF, Norwegian glacier foreland (Hågvar 2010); PL, post-mining landscape of lower Lusatia Germany (Krawczynski 2007); BF, boreal forests Sweden (Malmström 2012); UGC, urban green components (old [1980] and new [2012] street and park lawns) Warsaw-Poland (Rzeszowski and Sterzyńska 2016). For complete species names see Appendix Table 7A1. Collembola species
successional phases 1) habitat 1 2 3 4 5 6 SB-SUC SB-REC BC D G NGF PL CF BF UGC-new UGC-old
P. notabilis* ■2) ●●●●●3) ●●●●● ▲4) ▲ ▲ ▲ ▲ ▲ ▲ ▲ M. krausbaueri ■ ●●●●● ●●●●● ▲ ▲ ▲ ▲ ▲ ▲ ▲ I. productus ■ ■ ●●●●● ●●●●● ▲ ▲ ▲ ▲ M. minimus ■ ●●●● ●●●● ▲ ▲ ▲ ▲ ▲ ▲ ▲ ▲ L. lanuginosus ■ ■ ●●●● ●●●●● ▲ ▲ ▲ ▲ ▲ ▲ P. alba ■ ■ ●●●● ●●●● ▲ ▲ ▲ ▲ ▲ I. viridis ■ ●●●● ●●●● ▲ ▲ ▲ ▲ ▲ ▲ ▲ B. parvula ■ ●●● ●●● ▲ ▲ ▲ ▲ ▲ E. lanuginosa ■ ●●●● ●●●● ▲ ▲ ▲ S. pumilis ■ ■ ●●● ●●● ▲ ▲ ▲ ▲ ▲ ▲ S. elegans ■ ■ ●●● ●●● ▲ ▲ W. anophthalma ■ ●●●● ●●● ▲ ▲ ▲ ▲ ▲ I. palustris ■ ●●●● ▲ ▲ ▲ ▲ P. minuta ■ ●● ●●●● ▲ ▲ ▲ ▲ P. immaculata ■ ●●●● ● ▲ ▲ F. mirabilis ■ ●● ●●● ▲ ▲ ▲ ▲ ▲ ▲ ▲ ▲ F. candida ■ ●●●● ●● ▲ ▲ ▲ I. minor ■ ■ ●●● ●● ▲ ▲ ▲ ▲ ▲ ▲ ▲ ▲ ▲ E. nicoleti ■ ■ ●● ●● B. hortensis ■ ●●● ● ▲ ▲ ▲ ▲ E. marginata ■ ●● ● ▲ ▲
(continued on next page)
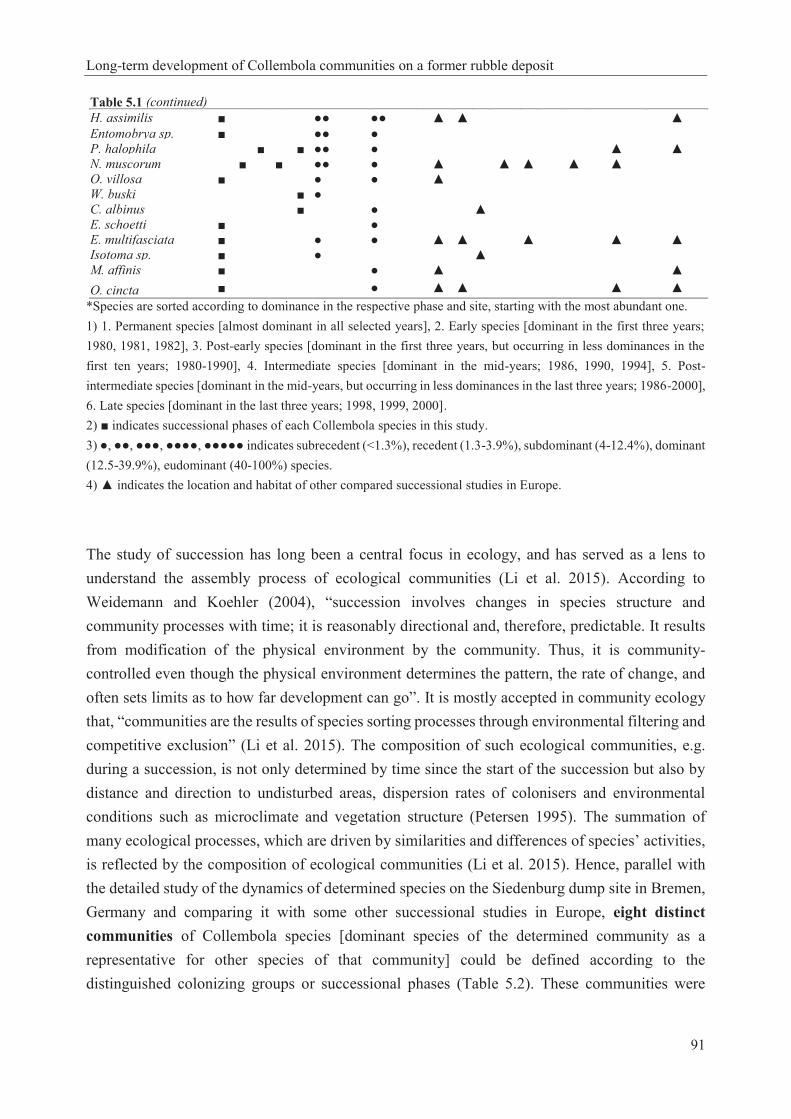
Long-term development of Collembola communities on a former rubble deposit
91
Table 5.1 (continued) H. assimilis ■ ●● ●● ▲ ▲ ▲ Entomobrya sp. ■ ●● ● P. halophila ■ ■ ●● ● ▲ ▲ N. muscorum ■ ■ ●● ● ▲ ▲ ▲ ▲ ▲ O. villosa ■ ● ● ▲ W. buski ■ ● C. albinus ■ ● ▲ E. schoetti ■ ● E. multifasciata ■ ● ● ▲ ▲ ▲ ▲ ▲ Isotoma sp. ■ ● ▲ M. affinis ■ ● ▲ ▲ O. cincta ■ ● ▲ ▲ ▲ ▲
*Species are sorted according to dominance in the respective phase and site, starting with the most abundant one. 1) 1. Permanent species [almost dominant in all selected years], 2. Early species [dominant in the first three years; 1980, 1981, 1982], 3. Post-early species [dominant in the first three years, but occurring in less dominances in the first ten years; 1980-1990], 4. Intermediate species [dominant in the mid-years; 1986, 1990, 1994], 5. Post-intermediate species [dominant in the mid-years, but occurring in less dominances in the last three years; 1986-2000], 6. Late species [dominant in the last three years; 1998, 1999, 2000]. 2) ■ indicates successional phases of each Collembola species in this study. 3) ●, ●●, ●●●, ●●●●, ●●●●● indicates subrecedent (<1.3%), recedent (1.3-3.9%), subdominant (4-12.4%), dominant (12.5-39.9%), eudominant (40-100%) species. 4) ▲ indicates the location and habitat of other compared successional studies in Europe.
The study of succession has long been a central focus in ecology, and has served as a lens to understand the assembly process of ecological communities (Li et al. 2015). According to Weidemann and Koehler (2004), “succession involves changes in species structure and community processes with time; it is reasonably directional and, therefore, predictable. It results from modification of the physical environment by the community. Thus, it is community-controlled even though the physical environment determines the pattern, the rate of change, and often sets limits as to how far development can go”. It is mostly accepted in community ecology that, “communities are the results of species sorting processes through environmental filtering and competitive exclusion” (Li et al. 2015). The composition of such ecological communities, e.g. during a succession, is not only determined by time since the start of the succession but also by distance and direction to undisturbed areas, dispersion rates of colonisers and environmental conditions such as microclimate and vegetation structure (Petersen 1995). The summation of many ecological processes, which are driven by similarities and differences of species’ activities, is reflected by the composition of ecological communities (Li et al. 2015). Hence, parallel with the detailed study of the dynamics of determined species on the Siedenburg dump site in Bremen, Germany and comparing it with some other successional studies in Europe, eight distinct communities of Collembola species [dominant species of the determined community as a representative for other species of that community] could be defined according to the distinguished colonizing groups or successional phases (Table 5.2). These communities were
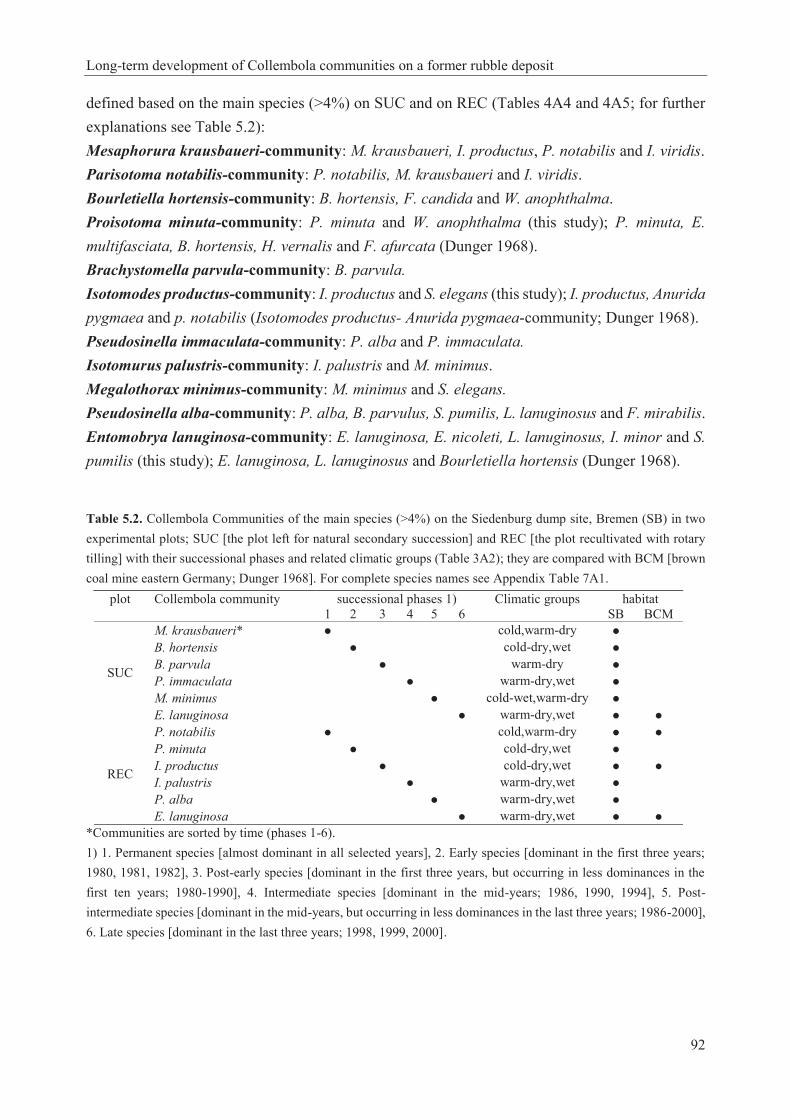
Long-term development of Collembola communities on a former rubble deposit
92
defined based on the main species (>4%) on SUC and on REC (Tables 4A4 and 4A5; for further explanations see Table 5.2): Mesaphorura krausbaueri-community: M. krausbaueri, I. productus, P. notabilis and I. viridis. Parisotoma notabilis-community: P. notabilis, M. krausbaueri and I. viridis. Bourletiella hortensis-community: B. hortensis, F. candida and W. anophthalma. Proisotoma minuta-community: P. minuta and W. anophthalma (this study); P. minuta, E. multifasciata, B. hortensis, H. vernalis and F. afurcata (Dunger 1968). Brachystomella parvula-community: B. parvula. Isotomodes productus-community: I. productus and S. elegans (this study); I. productus, Anurida pygmaea and p. notabilis (Isotomodes productus- Anurida pygmaea-community; Dunger 1968). Pseudosinella immaculata-community: P. alba and P. immaculata. Isotomurus palustris-community: I. palustris and M. minimus. Megalothorax minimus-community: M. minimus and S. elegans. Pseudosinella alba-community: P. alba, B. parvulus, S. pumilis, L. lanuginosus and F. mirabilis. Entomobrya lanuginosa-community: E. lanuginosa, E. nicoleti, L. lanuginosus, I. minor and S. pumilis (this study); E. lanuginosa, L. lanuginosus and Bourletiella hortensis (Dunger 1968).
Table 5.2. Collembola Communities of the main species (>4%) on the Siedenburg dump site, Bremen (SB) in two experimental plots; SUC [the plot left for natural secondary succession] and REC [the plot recultivated with rotary tilling] with their successional phases and related climatic groups (Table 3A2); they are compared with BCM [brown coal mine eastern Germany; Dunger 1968]. For complete species names see Appendix Table 7A1.
plot Collembola community successional phases 1) Climatic groups habitat 1 2 3 4 5 6 SB BCM
SUC
M. krausbaueri* ● cold,warm-dry ● B. hortensis ● cold-dry,wet ● B. parvula ● warm-dry ● P. immaculata ● warm-dry,wet ● M. minimus ● cold-wet,warm-dry ● E. lanuginosa ● warm-dry,wet ● ●
REC
P. notabilis ● cold,warm-dry ● ● P. minuta ● cold-dry,wet ● I. productus ● cold-dry,wet ● ● I. palustris ● warm-dry,wet ● P. alba ● warm-dry,wet ● E. lanuginosa ● warm-dry,wet ● ●
*Communities are sorted by time (phases 1-6). 1) 1. Permanent species [almost dominant in all selected years], 2. Early species [dominant in the first three years; 1980, 1981, 1982], 3. Post-early species [dominant in the first three years, but occurring in less dominances in the first ten years; 1980-1990], 4. Intermediate species [dominant in the mid-years; 1986, 1990, 1994], 5. Post-intermediate species [dominant in the mid-years, but occurring in less dominances in the last three years; 1986-2000], 6. Late species [dominant in the last three years; 1998, 1999, 2000].

Long-term development of Collembola communities on a former rubble deposit
93
5.3 Recognizing key elements of successional development Succession may be considered as community assembly in progress (Bhaskar et al. 2014). Alonso et al. (2006) define a community as “a group of species whose competitive interaction strengths are determined by their niche overlaps, and new species originate through adaptation to new niches”. The same authors noted about Hubbell’s neutral theory that “it lies in the combination of the fact that it (i) assumes equivalence among interacting species; (ii) is an individual-based stochastic theory; and (iii) can be formulated as a dispersal limited sampling theory”. The neutrality assumption of Hubbell’s theory without full recognition of other relevant species to the theory was mostly critisized, but it has not been rejected. However, there is more attention to the theory than neutrality alone (Alonso et al. 2006). Nowadays advances in statistics and theory provide a possible way to apply functional traits to conclude the mechanisms of community assembly. In addition, the trait-based approach gives valuable insights into mode of assmblages of standing ecological communities. This can be examined by testing for particular trait dispersion patterns among co-occuring species (Bhaskar et al. 2014). Despite these arguments about community assembly, overall the progress in soil zoological studies offers the possibility to examine the self-sustaining condition of the newly developing ecosystems (Dunger et al. 2004), which in turn can be a long-term successional study. Succession, especially in the first phases, depends on colonization of involved biotic factors and many other stochastic processes and conditions (Mudrák et al. 2016). The colonization on the plateau of the Siedenburg dump site occured in part actively from the adjacent environment [e.g., macrofauna, vegetation; hill slopes, adjacent biotopes], in majority passively by transport e.g. wind and animals [phoresy] (Koehler and Müller 2003). Alonso et al. (2006) suggest that dispersal plays a central role in the structuring of ecological communities e.g. during an ecological succession. The mechanisms of succession have usually been restricted to the interactions between plants and the physical environment, also other organisms and plant consumers that have always been included as one of the factors influencing succession. Plants are primary producers and usually constitute the greatest amount of biomass and community structure in terrestrial ecosystems (Connell and Slatyer 1977). However, in this case consumers such as decomposer microorganisms and fungi, which are relevant for mineral nutrients cycling, received more attention than herbivores (Connell and Slatyer 1977). This process is related to the root system and plant litter decomposition, which influence the soil properties (Henneron et al. 2017). This is determined as the link between succession of soil fauna and plants. Such interactions between plants and soil are recognized to play a major role in terrestrial ecosystems structure and functioning, and may subsequently determine the important elements mainly driving the succession of microarthropod groups in the soil (Henneron et al. 2017). The biologically dominated part of the succession starts with the first real settlement i.e. initial colonizers. They have a competitive advantage over colonizing species, might dominate over a long-time period and then change the environment. This all happens due to priority effects of colonizers in the initial phase. Knowing which species are established in the early phase of

Long-term development of Collembola communities on a former rubble deposit
94
succession might substantially increase the ability to predict the course of succession (Mudrák et al. 2016). This process is determined on the one hand by immigration [natural immigration by air or introduction by man], on the other hand by the ability to overcome the immigration barrier [e.g., soil texture, water content, porosity, temperature, acidity, toxins and nutrients] during the initial phase (Dunger et al. 2004). As opposed to the quick airborne colonisation of microarthropods (e.g., Collembola as early colonizers), earthworms must first overcome several immigration barriers. Therefore, they colonise later in time (Dunger and Voigtländer 2005). However, endogeic life forms of earthworms [mineral soil inhabitants ingest soil particles including any organic matter and microorganisms; Dunger and Voigtländer (2009)] have detrimental effect on Collembola due to competition for food and soil disturbance (Henneron et al. 2017). Collembola and Acari communities change also in relation to soil pH (Salmane and Brumelis 2008). We clearly demonstrated that soil pH is a significant factor influencing the long-term successional development of Gamasina, but not Collembola communities. The species composition in the initial phase of succession may greatly influence the changes in later phases of succession (Mudrák et al. 2016). With the successful settlement of organisms at the initial habitat, the starting point is given for an intensive enlargement of the environmental capacity by biocoenotic regulation (Dunger et al. 2004). During succession, physical stresses to plants and then competition for resources between plants are determined as one of the main mechanisms determining the course of succession (Connell and Slatyer 1977). Moreover, plant species composition and diversity have important effects on soil biota via their differences in the quantity and quality of trophic resources i.e. litter and root exudates, which they supply to the soil (Henneron et al. 2017). The mechanism of this link happens due to the consequences of root-derived trophic ressources i.e. root litter and exudates on soil fungal community structure especially mycorrhiza, which in turn is the food of many euedaphic Collembola species (Henneron et al. 2017). Vice versa, Soil fauna may affect plants and herbivores performance in their direct and indirect interaction with plant roots (i.e., root herbivores, pathogens and mycorrhizal fungi) and by changes in resource uptake, likely by inducing different plant responses (Wurst et al. 2006). Milcu et al. (2013) mentioned that there is a convincing evidence for the response of soil biota to the quality and quantity of organic matter inputs as well as to the variation in micro-environmental conditions related to changes in plant diversity. For the development of the vegetation itself, seed bank is of major importance. Also for soil fauna development, survivors of grading and tilling (recultivation experiment) play an important role [e.g., cocoons of enchytraeids and small microarthropods] (Koehler and Müller 2003). Furthermore, there are several environmental variables, which change during a long-term succession and can be investigated both for plants and soil microarthropods. This may help to distinguish the influential environmental factors which can be recognized to impact the long-term replacement and dynamics of microarthropod and plant species.

Long-term development of Collembola communities on a former rubble deposit
95
5.4 Long-term studies in soil ecology For an understanding of temporal changes in ecosystems the investigation of soil mesofauna is mandatory, both from an indicator and biodiversity point of view and from a functional perspective, and it has to be performed over a long-term period (Koehler and Melecis 2010). Succession, the central focus of ecology during 110 years of ecological history is the sequential shift of species following a disturbance. Actually, succession is a wide and comprehensive context to refer to most temporal dynamics of communities and ecosystems (Prach and Walker 2011). Modifications associated with temporal variation of any community dynamics may be studied on the basis of long-term investigations, as repeated observations over many years or decades, or by a chronosequence approach (space-for-time substitution), which easily can lead to misinterpretations (Walker et al. 2010; Rzeszowski and Sterzyńska 2016). Chronosequence studies can only be traced by long-term research in natural environments (Koehler and Melecis 2010). Understanding ecosystem functioning in response to changes in environmental conditions provides the necessities to perform ecological research in a long-term framework. However, most long-term studies neglect soil organisms (Koehler and Melecis 2010). Soil mesofauna should be considered in the assessment of risk associated with climate change and intensive use of the soil resource, because of their role as promoters of ecosystem services such as soil fertility, carbon sequestration and water infiltration (Koehler and Melecis 2010). The response of soil fauna to changes over different time scales and in various systems, such as, during spontaneous succession at post mining sites (Frouz et al. 2013; Mudrák et al. 2016), in restored grasslands of different age after cessation of fertilization (Berg and Hemerik 2004), or during forest rotation (Chauvat et al. 2003; Hågvar 2010) mostly have been examined by the chronosequence method (Rzeszowski and Sterzyńska 2016). According to Koehler and Melecis (2010), such space-for-time approaches as an alternative for long-term investigations do not reflect natural transitions and the role of year-specific conditions, e.g. in areas of glacial retreat or along precipitation gradients (as models for succession or climate change; Clements 1916; Likens 1988; Kaufmann 2002; Araujo and Rahbek 2006; Fleischer and Sternberg 2006). In this static perspective of succession, sites of different age are examined within one time point and it is assumed that the succession of younger sites direct the older sites, and this is different from the dynamic view of succession based on repeated year-specific samplings in a long-time period (Mudrák et al. 2016). The response of Collembola communities to long-term environmental changes has been examined in many other ecosystems to understand successional processes (Wolters 1998; Kuznetsova 2007) including the global warming effect (Jucevica and Melecis 2002, 2006; Koehler and Melecis 2010) or changes due to air pollution in temperate ecosystems (Rzeszowski and Sterzyńska 2016). This was also investigated in the study of Rzeszowski and Sterzyńska (2016) by long-term exposure to urbanization (anthropogenic disturbances), and erosion in species diversity over time. Ecosystem succession is dependent on site age. Therefore, it is useful to compare the results from long-term studies of quantitative development of earthworms as well as microarthropod

Long-term development of Collembola communities on a former rubble deposit
96
communities to single short-term investigations (Dunger and Voigtländer 2005). Succession aids to predict and interpret the disturbance responses in a world increasingly modified by humans with real ecosystems and shifting of ecological associations (Prach and Walker 2011). Through these processes, assessment of biological soil quality would only be possible with distinguishing the stages of soil faunal development by certainty. This can be done based on the species composition, the biomass and the metabolic activity of the investigated groups of soil animals. In this case, the type of food competition among saprophagous groups should be considered as well (Dunger and Voigtländer 2005). Important long-term soil faunal studies have been performed in the last decades such as Dunger (1968), Dunger (1975), Dunger et al. (2001, 2004), Takeda (1987), Hogervorst et al. (1993), Petersen (1995), Wolters (1998), Koehler (2000), Koehler and Müller (2003), Irmler (2006), Hågvar (2010), Koehler and Melecis (2010). Knowing that many processes in the soil system are slow, the development of the mesofauna community exhibits extended and continuous temporal dynamics as an almost trivial consequence. Thus, such studies have to be performed over longer periods of time (Koehler and Melecis 2010). In addition, long-term studies play an important role in inspiring the scientific community and funding agencies to sustain and intensify long-term research projects in this important branch of soil ecology (Koehler and Melecis 2010).
5.5 Conclusions In the present study, some environmental variables were clearly shown to be effective in addition to the intrinsic character of succession including self-colonization of different species during time. It was demonstrated that soil temperature was a key element among all the environmental variables below- and above-ground and was significantly affecting and driving the long-term development of the investigated microarthropod communities (Collembola and Gamasina). The different management in SUC and REC was distinguished as another driver, which played an important role in successional changes of both vegetation structure and microarthropods. This can be explained by the special vegetation structure on SUC, which created a favourable microclimate and the changes in soil structure by the recultivation measure on REC; both influenced the successional development of investigated microarthropod communities. However, these important effects are mainly observable when considering the major impact of time during succession. This means, the influential key elements of succession drive the direction of the successional trajectory simultaneously with the effect of time, which must be considered first of all the investigated abiotic and biotic variables in any long-term successional studies. Thus, succession is a time-dependent integration of all ecological processes at a site (Weidemann and Koehler 2004). Conclusively, in the current study soil warming was substantially and strongly affecting the temporal shifts of investigated Collembola and Gamasina species. Furthermore, considering different two managements (SUC and REC) in this study, stronger effects of significant warming have been demonstrated on REC with recultivation measurement and shorter vegetation.
Long-term development of Collembola communities on a former rubble deposit
97
5.6 Future perspectives Ecosystem development with its successional dynamics occurs during time and it needs to be studied not only by a short-term investigation though better in a long-term research covering several years, even more than a decade. This research necessarily needs the attempt of taxonomists in accurate determination of species to distinguish community structure and subsequently the knowledge about life cycle of each species occurring during successional development. The current thesis, which is covering an investigation of microarthropods (Collembola and Gamasina) successional development over 20 years, is a good example of temporal long-term studies. Only these kinds of studies can help us to better understand the ecosystem processes and especially the changes that may occur in relation to climate change. Knowing that successional development always has its own temporal dynamics in the ecosystem, certainly there are existing numbers of environmental variables, biotic or abiotic, which are strongly affecting the intrinsic dynamics of ecosystem components. However, many studies emphasize on the effects of the climate warming on microarthropods, which can be positive or even negative, but they are mostly lacking data from a long-term developmental process, which is extremely important. This study covers twenty years of study in an Atlantic oceanic climate in temperate ecological zone. It releases new insights in understanding the influence of important ecological factors including climatic variables, especially in the case of climate warming, vegetation and also different management (SUC and REC) on the intrinsic long-term development of soil microarthopod species. Consequently, successional development is an emphatic time dependent ecological process and the relationship between ecosystem components with their surrounding environment can be well understood during time under temporal long-term studies. Therefore, for future aspects we really need to encourage researchers and funding organizations to design long-term successional projects over several years to make the best model for the purpose of accurately evaluating the ecological changes and doing environmental assessments in an ecosystem.

Long-term development of Collembola communities on a former rubble deposit
98
References

Long-term development of Collembola communities on a former rubble deposit
99
6 References
A’Bear, A.D., Boddy, L., Jones, T.H., 2013. Bottom-up determination of soil Collembola diversity and population dynamics in response to interactive climatic factors. Oecologia. 173, 1083-1087.
Alatalo, M.A., Jägerbrand, A.K., Čuchta, P., 2015. Collembola at three alpine subarctic sites resistant to twenty years of experimental warming. Scientific Reports. 5, 1-8.
Alonso, D., Etienne, R.S., McKane, A.J., 2006. The merits of neutral theory. Trends in Ecology and Evolution. 21, 451-457.
Araujo, M.B., Rahbek, C., 2006. How does climate change affect biodiversity? Science. 313, 1396-1397.
Bardgett, R.D., 2005. The biology of soils. A community and ecosystem approach. Oxford University Press, Oxford.
Bardgett, R.D., Chan, K.F., 1999. Experimental evidence that soil fauna enhance nutrient mineralization and plant nutrient uptake in montane grassland ecosystems. Soil Biology and Biochemistry. 31, 1007-1014.
Bardgett, R.D., Wardle, D.A., Yeates, G.W., 1998. Linking above-ground and below-ground interactions: how plant responses to foliar herbivory influence soil organisms. Soil Biology and Biochemistry. 30, 1867-1878.
Bardgett, R.D., Bowman, W.D., Kaufmann, R., Schmidt, S.K., 2005. A temporal approach to linking aboveground and belowground ecology. Trends in Ecology and Evolution. 20, 634-641.
Bedano, J.C., Ruf, A., 2007. Soil predatory mite communities (Acari: Gamasina) in agroecosystems of Central Argentina. Applied Soil Ecology. 36, 22-31.
Bellinger, P.F., 1954. Studies of soil fauna with special reference to the Collembola. Bulletin of the Connecticut Agricultural Experiment Station New Haven. 583, 1-66.
Bellinger, P.F., Christiansen, K.A., Janssens, F., 1996-2017. Checklist of the Collembola of the World. http://www.collembola.org.
Berch, S.M., Baumbrough, B., Battigelli, J., Kroeger, P., Strub, N., De Montigny, L., 2001. Preliminary assessment of selected communities of soil organisms under different conifer species. British Columbia, Forest Science Program, Research Report. 20, 27pp.
Berendt, R., 1985. Die sekundäre Sukzession der Collembolenfauna eines Ruderalökosystems und ihre Beeinflussung durch Rekultivierung. Diploma thesis, University of Bremen, 101pp.
Berg, M.P., Hemerik, L., 2004. Secondary succession of terrestrial isopod, centipede, and millipede communities in grasslands under restoration. Biology and Fertility of Soils. 40, 163-170.
Berg, M.P., Kiers, E.T., Driessen, G., 2010. Adapt or disperse: understanding species persistence in a changing world. Global Change Biology. 16, 587-598.

Long-term development of Collembola communities on a former rubble deposit
100
Bernard, E.C., 2006. Redescription of Cosberella conatoa Wray (Collembola: Hypogastruridae) and description of C. lamaralexanderi n. sp. Proceedings of the Biological Society of Washington. 119, 269-278.
Bernier, N., Gillet, F., 2012. Structural relationships among vegetation, soil fauna and humus form in a subalpine forest ecosystem: a Hierarchical Multiple Factor Analysis (HMFA). Pedobiologia. 55, 321-334.
Bhaskar, R., Dawson, T.E., Balvanera, P., 2014. Community assembly and functional diversity along succession post management. Functional Ecology. 28, 1256-1265.
Birkhofer, K., Schoning, I., Alt, F., Herold, N., Klarner, B., Maraun, M., Marhan, S., Oelmann, Y., Wubet, T., Yurkov, A., Begerow, D., Berner, D., Buscot, F., Daniel, R., Diekötter, T., Ehnes, RB., Erdmann, G., Fischer, C., Foesel, B., Groh, J., Gutknecht, J., Kandeler, E., Lang, C., Lohaus, G., Meyer, A., Nacke, H., Näther, A., Overmann, J., Polle, A., Pollierer, M.M., Scheu, S., Schloter, M., Schulze, E.D., Schulze, W., Weinert, J., Weisser, W.W., Wolters, V., Schrumpf, M., 2012. General relationships between abiotic soil properties and soil biota across spatial scales and different land-use types. PLOS ONE. 7, 1-8.
Blankinship, J.C., Niklaus, P.A., Hungate, B.A., 2011. A meta-analysis of responses of soil biota to global change. Oecologia. 165, 553-565.
Bokhorst, S., Wardle, D.A., Nilsson, M.C., Gundale, M.J., 2014. Impact of understory mosses and dwarf shrubs on soil micro-arthropods in a boreal forest chronosequence. Plant and Soil. 379, 121-133.
Bokhorst, S., Huiskes, A., Convey, P., Van Bodegom, P.M., Aerts, R., 2008. Climate change effects on soil arthropod communities from the Falkland Islands and the Maritime Antarctic. Soil Biology and Biochemistry. 40, 1547-1556.
Bokhorst, S., Phoenix, G.K., Bjerke, J.W., Callaghan, T.V., Huyer-Brugman, F., Berg, M.P., 2012a. Extreme winter warming events more negatively impact small rather than large soil fauna: shift in community composition explained by traits not taxa. Global Change Biology. 18, 1152-1162.
Bokhorst, S., Bjerke, J.W., Tømmervik, H., Preece, C., Phoenix, G.K., 2012b. Ecosystem Response to Climatic Change: The Importance of the Cold Season. AMBIO: A Journal of the Human Environment. 41, 246-255.
Bradford, M.A., Jones, T.H., Bardgett, R.D., Black, H.I., Boag, B., Bonkowski, M., Cook, R., Eggers, T., Gange, A.C., Grayston, S.J., Kandeler, E., 2002. Impacts of soil faunal community composition on model grassland ecosystems. Science. 298, 615-618.
Bretfeld, G., 1999. Synopses on Palaearctic Collembola, Volume 2. Symphypleona. Abhandlungen und Berichte des Naturkundemuseums Görlitz, Band 71, Heft 1, 1999, 1-318.
Brown, P.A., 1997. A review of techniques used in the preparation, curation and conservation of microscope slides at the Natural History Museum, London. The Biology Curator. 10, 1-33.

Long-term development of Collembola communities on a former rubble deposit
101
Brown, P.A., De Boise, E., 2006. Procedures for the Preparation of Whole Insects as Permanent Microscope Slides and For the Remounting of Deteriorating Aphid Slides. NatSCA News. 8, 15-19.
Burkhardt, U., 2005. Species identification of Collembola by means of PCR-based marker systems. Shaker. Ph.D thesis, University of Bremen, Germany.
Butcher, J.W., Snider, R., Snider, R.J., 1971. Bioecology of edaphic Collembola and Acarina. Annual Review of Entomology. 16, 249-288.
Chauvat, M., Wolters, V., Dauber, J., 2007. Response of collembolan communities to land use change and grassland succession. Ecography. 30, 183-192.
Chauvat, M., Zaitsev, A.S., Wolters, V., 2003. Successional changes of collembola and soil microbiota during forest rotation. Oecologia. 137, 269-276.
Chauvat, M., Titsch, D., Zaytsev, A.S., Wolters, V., 2011. Changes in soil faunal assemblages during conversion from pure to mixed forest stands. Forest Ecology and Management. 262, 317-324.
Chikoski, J.M., Ferguson, S.H., Meyer, L., 2006. Effects of water addition on soil arthropods and soil characteristics in a precipitation- limited environment. Acta Oecologica. 30, 203-211.
Choi, W.I., Moorhead, D.L., Neher, D.A., Ryoo, M.I., 2006. A modeling study of soil temperature and moisture effects on population dynamics of Paronychiurus kimi (Collembola: Onychiuridae). Biology and Fertility of Soils. 43, 69-75.
Christian, A., 1993. Untersuchungen zur Entwicklung der Raubmilbenfauna (Gamasina) der Halden des Braunkohlentagebaus Berzdorf/OL. Abhandlungen und Berichte des Naturkundemuseums Görlitz. 67, 2-64.
Christiansen, K., 1964. Bionomics of Collembola. Annual Review of Entomology. 9, 147-178. Clements, F.E., 1916. Plant succession: An analysis of the development of vegetation. Carnegie
Institution of Washington publication. 242, 1-51. Connell, J.H., Slatyer, R.O., 1977. Mechanisms of succession in natural communities and their
role in community stability and organization. American Naturalist. 111, 1119-1144. Cotrufo, M.E., Ineson, P., 1995. Effects of enhanced atmospheric CO2 and nutrient supply on the
quality and subsequent decomposition of fine roots of Betula pendula Roth and Picea sitchensis (Bong). Carr. Plant Soil. 170, 267-277.
Coulson, S.J., Hodkinson, I.D., Webb, N.R., Block, W., Bale, J.S., Strathdee, A.T., Worland, M.R., Wooley, C., 1996. Effects of experimental temperature elevation on high-arctic soil microarthropod populations. Polar Biology. 16, 147-153.
Coulson, S.J., Leinaas, H.P., Ims, R.A., Søvik, G., 2000. Experimental manipulation of the winter surface ice layer: the effects on a High Arctic soil microarthropod community. Ecography. 23, 299-306.
Daghighi, E., Burkhardt, U., Filser, J., Koehler, H., 2016. Techniques for clearing and mounting Collembola from old ethanol collections. Soil Organisms. 88, 89-97.

Long-term development of Collembola communities on a former rubble deposit
102
Daghighi, E., Koehler, H., Kesel, R., Filser, J., 2017. Long-term succession of Collembola communities in relation to climate change and vegetation. Pedobiologia. http://dx.doi.org/10.1016/j.pedobi.2017.06.001.
Decaëns, T., 2010. Macroecological patterns in soil communities. Global Ecology and Biogeography. 19, 287-302.
Deharveng, L., 2004. Recent advances in Collembola systematics. 6th International Seminar on Apterygota, Siena, Italy, 2002. Pedobiologia. 48, 415-433.
Dell’Ampio, E., Meusemann, K., Szucsich, N.U., Peters, R.S., Meyer, B., Borner, J., Petersen, M., Aberer, A.J., Stamatakis, A., Walzl, M.G., Minh, B.Q., 2013. Decisive data sets in phylogenomics: lessons from studies on the phylogenetic relationships of primarily wingless insects. Molecular Biology and Evolution. 31, 239-249.
D'Haese, C.A., 2002. Were the first springtails semi-aquatic? A phylogenetic approach by means of 28S rDNA and optimization alignment. Proceedings of the Royal Society of London B. 269, 1143-1151.
Dillon, M.E., Woods, H.A., Wang, G., Fey, S.B., Vasseur, D.A., Telemeco, R.S., Marshall, K., Pincebourde, S., 2016. Life in the Frequency Domain: the Biological Impacts of Changes in Climate Variability at Multiple Time Scales. Integrative and Comparative Biology, pp. 1-17. From the symposium ‘‘Beyond the Mean: Biological Impacts of Changing Patterns of Temperature Variation’’ presented at the annual meeting of the Society for Integrative and Comparative Biology, January 3–7, 2015 at Portland, Oregon.
Dormann, C.F., Woodin, S.J., 2002. Climate change in the Arctic: using plant functional types in a meta-analysis of field experiments. Functional Ecology. 16, 4-17.
Dunger, W., 1968. Die Entwicklung der Bodenfauna auf rekultivierten Kippen und Halden des Braunkohlentage-baues. Ein Beitrag zur pedozoologischen Standortsdiagnose. Abhandlungen und Berichte des Naturkunde-museums Görlitz. 43, 1-256.
Dunger, W., 1975. On the delimination of soil microarthropod cenosis in time and space. In J. Vanek (Ed.), Progress in soil zoology (pp. 43-49). The Hague: Junk.
Dunger, W., 1997. Zur Lage der Speziellen Zoologie, besonders der Systematik und Autfkologie von Bodentieren. Abhandlungen und Berichte des Naturkunde-museums Görlitz. 69, 5-18.
Dunger, W., Fiedler, H.J., 1997. Methoden der Bodenbiologie. Jena, Gustav Fischer, 539pp. Dunger, W., Schlitt, B., 2011. Synopses on Palaearctic Collembola, Volume 6/1. Tullbergiidae.
Soil Organisms. 83, 1-168. Dunger, W., Voigtländer, K., 2005. Assessment of biological soil quality in wooded reclaimed
mine sites. Geoderma. 129, 32-44. Dunger, W., Voigtländer, K., 2009. Soil fauna (Lumbricidae, Collembola, Diplopoda and
Chilopoda) as indicators of soil eco-subsystem development in post-mining sites of eastern Germany - a review. Soil Organisms. 81, 1-51.
Dunger, W., Schulz, H.J., Zimdars, B., 2002. Colonization behaviour of Collembola under different conditions of dispersal: Proceedings of the Xth international Colloquium on

Long-term development of Collembola communities on a former rubble deposit
103
Apterygota, České Budějovice 2000: Apterygota at the Beginning of the Third Millennium. Pedobiologia. 46, 316-327.
Dunger, W., Schulz, H.J., Zimdars, B., Hohberg, K., 2004. Changes in Collembolan species composition in Eastern German mine-sites over fifty years of primary succession. Pedobiologia. 48, 503-517.
Dunger, W., Wanner, M., Hauser, H., Hohberg, K., Schulz, H.J., Schwalbe, T., Seifert, B., Vogel, J., Voigtländer, K., Zimdars, B., Zulka, K.P., 2001. Development of soil fauna at mine sites during 46 years after afforestation. Pedobiologia. 45, 243-271.
Eisenhauer, N., Sabais, A.C.W., Scheu, S., 2011. Collembola species composition and diversity effects on ecosystem functioning vary with plant functional group identity. Soil Biology and Biochemistry. 43, 1697-1704.
Ellenberg, H., Weber, H.E., Düll, R., Wirth, V., Werner, W., Paulißen, D., 1992. Zeigerwerte von Pflanzen in Mitteleuropa. Scripta Geobotanica. 18, 1-248.
Endlweber, K., Ruess, L., Scheu, S., 2009. Collembola switch diet in presence of plant roots thereby functioning as herbivores. Soil Biology and Biochemistry. 41, 1151-1154.
Engelmann, H.D., 1978. Zur Dominanzklassifizierung von Bodenarthropoden. Pedobiologia. 18, 378-380.
Faleńczyk-Koziróg, K., Kaczmarek, S., Marquardt, T., Marcysiak, K., 2012. Contribution to succession of mite (Acari) communities in the soil of Tilio-Carpinetum TRACZ. 1962 in northern Poland. Acta Zoologica Cracoviensia. 55, 47-57.
Filser, J., 2002. The role of Collembola in carbon and nitrogen cycling in soil. Pedobiologia. 46, 234-245.
Filser, J., Faber, J.H., Tiunov, A.V., Brussaard, L., Frouz, J., De Deyn, G., Uvarov, A.V., Berg, M.P., Lavelle, P., Loreau, M., Wall, D.H., 2016. Soil fauna: key to new carbon models. Soil. 2, p.565.
Fjellberg, A., 1980. Identification keys to Norwegian Collembola. Norsk Entomologisk Forening, Ås, 152pp.
Fjellberg, A., 1998. The Collembola of Fennoscandia and Denmark. Part I: Poduromorpha. Fauna Entomologica Scandinavica. 35. Koninklijke Brill NV, Leiden.
Fjellberg, A., 2007. The Collembola of Fennoscandia and Denmark. Part 2: Entomobryomorpha and Symphypleona. Koninklijke Brill NV, Leiden, the Netherlands. 264pp.
Fleischer, A., Sternberg, M., 2006. The economic impact of global climate change on Mediterranean rangeland ecosystems: A Space-for-Time approach. Ecological Economics. 59, 287-295.
Forey, E., Coulibaly, S.F., Chauvat, M., 2015. Flowering phenology of a herbaceous species (Poa annua) is regulated by soil Collembola. Soil Biology and Biochemistry. 90, 30-33.
Fox, J., 2005. The R Commander: A Basic Statistics Graphical User Interface to R. Journal of Statistical Software. 14, 1-42.

Long-term development of Collembola communities on a former rubble deposit
104
Fox, J., Weisberg, S., 2011. An {R} Companion to Applied Regression, Second Edition. Thousand Oaks CA: Sage. URL: http://socserv.socsci.mcmaster.ca/jfox/Books/Companion.
Frampton, G.K., Van den Brink, P.J., Gould, P.J.L., 2000. Effects of spring drought and irrigation on farmland arthropods in southern Britain. Journal of Applied Ecology. 37, 865-883.
Frouz, J., Prach, K., Pizl, V., Hanel, L., Stary, J., Tajovsky, K., Materna, J., Balik, V., Kalcik, J., Rehounkova, K., 2008. Interactions between soil development, vegetation and soil fauna during spontaneous succession in post mining sites. European Journal of Soil Biology. 44, 109-121.
Frouz, J., Thébault, E., Pižl, V., Adl, S., Cajthaml, T., Baldrian, P., Hán, l.L., Tajovský, K., Materna, J., Nováková, A., de Ruiter, P.C., 2013. Soil food web changes during spontaneous succession at post mining sites: a possible ecosystem engineering effect on food web organization. PLOS ONE. 8, e79694.
Fujii, S., Takeda, H., 2017. Succession of soil microarthropod communities during the aboveground and belowground litter decomposition processes. Soil Biology and Biochemistry. 110, 95-102.
Gange, A.C., Brown, V.K., 2002. Soil food web components affect plant community structure during early succession. Ecological Research. 17, 217-227.
Gisin, H., 1960. Collembolenfauna Europas. Museum D’ Histoire Naturelle, Geneva, 312pp. Glime, J.M., Wagner, D.M., 2013. Laboratory Techniques: Preservation and Permanent Mounts.
Chapters 2-4. In: Glime, J. M. (ed.): Bryophyte Ecology. Volume 3. Methods. Ebook sponsored by Michigan Technological University and the International Association of Bryologists [www.bryoecol.mtu. edu, last updated 5 September 2013].
Gobbi, M., De Bernardi, F., Pelfini, M., Rossaro, B., Brandmayr, P., 2006. Epigean arthropod succession along a 154-year glacier foreland chronosequence in the Forni Valley (Central Italian Alps). Arctic, Antarctic, and Alpine Research. 38, 357-362.
Greenslade, P., 2010. The aquatic Springtails (Insecta: Collembola) of South Africa. Australian National University. [http://www.ru.ac.za/media/rhodesuniversity/ resources/martin/acollembola.html].
Gulvik, M.E., 2007. Mites (Acari) as indicators of soil biodiversity and land use monitoring: A review. Polish Journal of Ecology. 55, 415-450.
Gunter, M., Brown, A.P., 2004. Notes on Conservation Tests of Failing Collembola (Insecta) Micro-Slide Mounts. NatSCA news. 4, 35-36.
Gwiazdowicz, D.J., 2007. Ascid mites (Acari, Gamasina) from selected forest ecosystems and microhabitats in Poland. University Augusta Cieszkowskiego Press, Poznan.
Hågvar, S., 1982. Collembola in Norwegian coniferous forest soils 1. Relations to plant communities and soil fertility. Pedobiologia. 24, 255-296.
Hågvar, S., 1984. Six common mite species (Acari) in Norwegian coniferous forest soils: relations to vegetaion types and soil characteristics. Pedobiologia. 27, 355-364.

Long-term development of Collembola communities on a former rubble deposit
105
Hågvar, S., 1994. Log-normal distribution of dominance as an indicator of stressed soil microarthropod communities? Acta Zoologica Fennica. 195, 71-80.
Hågvar, S., 2010. Primary Succession of Springtails (Collembola) in a Norwegian Glacier Foreland. Arctic, Antarctic, and Alpine Research. 42, 422-429.
Hågvar, S., Abrahamsen, G., 1984. Collembola in Norwegian coniferous forest soils III. Relations to soil chemistry. Pedobiologia. 27, 331-339.
Hågvar, S., Klanderud, K., 2009. Effect of simulated environmental change on alpine soil arthropods. Global Change Biology. 15, 2972-2980.
Hågvar, S., Solhøy, T., Mong, C., 2009. Primary succession of soil mites (Acari) in a Norwegian glacier foreland, with emphasis on oribatid species. Arctic, Antarctic, and Alpine Research. 41, 219-227.
Haimi, J., Laamanen, J., Penttinen, R., Räty, M., Koponen, S., Kellomäki, S., Niemelä, P., 2005. Impacts of elevated CO2 and temperature on the soil fauna of boreal forests. Applied Soil Ecology. 30, 104-112.
Halliday, R.B., 1994. Microscope slide mounting media – results of informal survey. Acarology List, revised edition 15 June 1994 [http://www.nhm.ac.uk/hosted-sites/acarology/archive/ summary.html].
Hansen, R.A., Williams, R.S., Degenhardt, D.C., Lincoln, D.E., 2001. Non-litter effects of elevated CO2 on forest floor microarthropod abundances. Plant Soil. 236, 139-144.
Henneron, L., Aubert, M., Archaux, F., Bureau, F., Dumas, Y., Ningre, F., Richter, C., Balandier, P., Chauvat, M., 2017. Forest plant community as a driver of soil biodiversity: experimental evidence from collembolan assemblages through large scale and long term removal of oak canopy trees Quercus petraea. Oikos. 126, 420-434.
Hodkinson, I.D., Coulson, S.J., Webb, N.R., 2004. Invertebrate community assembly along proglacial chronosequences in the High Arctic. Journal of Animal Ecology. 73, 556-568.
Hodkinson, I.D., Webb, N.R., Bale, J.S., Block, W., Coulson, S.J., Strathdee, A.T., 1998. Global change and arctic ecosystems: conclusions and predictions from experiments with terrestrial invertebrates on Spitsbergen. Arctic and Alpine Research. 30, 306-313.
Hogervorst, R.F., Verhoef, H.A., Van Straalen, N.M., 1993. Five-year trends in soil arthropod densities in pine forests with various levels of vitality. Biology and Fertility of Soils. 15, 189-195.
Hopkin, S.P., 1997. Biology of the Springtails (Insecta, Collembola). Oxford University Press, Oxford.
Huether, W., 1993. Sammel- und Präparationsmethoden für Bodenarthropoden. Abhandlungen und Berichte des Naturkunde-museums Görlitz 66. 6, 1-11.
Huhta, V., Hänninen, S., 2001. Effects of temperature and moisture fluctuations on an experimental soil microarthropod community. Pedobiologia. 45, 279-286.
Huhta, V., Ikonen, E., Vilkamaa, P., 1979. Succession of invertebrate populations in artificial soil made of sewage sludge and crushed bark. Annales Zoologici Fennici. 16, 223-270.

Long-term development of Collembola communities on a former rubble deposit
106
Hutson, B.R., 1980. Colonization of reclamation sites by Acari, Collembola and other invertebrates. Journal of Applied Ecology. 17, 255-275.
Irmler, U., 2006. Climatic and litter fall effects on collembolan and oribatid mite species and communities in a beech wood based on a 7 years investigation. European Journal of Soil Biology. 42, 51-62.
Johnson, E.A., Miyanishi, K., 2008. Testing the assumptions of chronosequences in succession. Ecology Letters. 11, 419-431.
Jones, T.H., Thompson, L.J., Lawton, J.H., Bezemer, T.M., Bardgett, R.D., Blackburn, T.M., Bruce, K.D., Cannon, P.F., Hall, G.S., Hartley, S.E., Howson, G., Jones, C.G., Kampichler, C., Kandeler, E., Ritchie, D.A., 1998. Impacts of rising atmospheric carbon dioxide on model terrestrial ecosystems. Science. 280, 441-443.
Jordana, R., 2012. Synopses on Palaearctic Collembola, Volume 7/1. Capbryinae et Entomobryini. Soil Organisms. 84, 1-390.
Jucevica, E., Melecis, V., 2002. Long-term dynamics of Collembola in a pine forest ecosystem. Pedobiologia. 46, 365-372.
Jucevica, E., Melecis, V., 2006. Global warming affect Collembola community: A long-term study. Pedobiologia. 50, 177-184.
Kaneda, S., Kaneko, N., 2011. Influence of Collembola on nitrogen mineralization varies with soil moisture content. Soil Science and Plant Nutrition. 57, 40-49.
Kardol, P., Cregger, M.A., Campany, C.E., Classen, A.T., 2010. Soil ecosystem functioning under climate change: plant species and community effects. Ecology. 91, 767-781.
Kardol, P., Reynolds, W.N., Norby, R.J., Classen, A.T., 2011. Climate change effects on soil microarthropod abundance and community structure. Applied Soil Ecology. 47, 37-44.
Karg, W., 1993. Raubmilben. Fischer, Jena, 523pp. Karg, W., Mack, S., 1986. Bedeutung und Nutzung oligophager Raubmilben der Cohors
Gamasina leach. Archives of Phytopathology and Plant Protection. 22, 107-118. Karg, W., Bischoff, H., Dahl, F., Dahl, M., 1971. Acari (Acarina), Milben, Unterordnung
Anactinochaeta (Parasitiformes), die freilebenden Gamasina (Gamasides), Raubmilben. Gustav Fischer.
Kaufmann, R., 2001. Invertebrate succession on an alpine glacier foreland. Ecology. 82, 2261-2278.
Kaufmann, R., 2002. Glacier foreland colonisation: Distinguishing between short-term and long-term effects of climate change. Oecologia. 130, 470-475.
Kaufmann, R., Raffl, C., 2002. Diversity in primary succession: The chronosequence of a glacier foreland. In Körner, C., and Spehn, E. (eds.), Global Mountain Biodiversity: a Global Assessment. London: Parthenon, 177-190.
Kennedy, A.D., 1994. Simulated climate change: A field manipulation study of polar microarthropod community response to global warming. Ecography. 17, 131-140.

Long-term development of Collembola communities on a former rubble deposit
107
Koehler, H., 1985. Rekultivierung als ökologisches Problem: 5. Die Entwicklung der Gamasinen- Synusie (Acari, Parasitiformes) der Deckschicht einer Bauschuttdeponie und ihre Beeinflussung durch Rekultivierungsmaßnahmen. Verh. Ges. Oekol. (Bremen 1983). 13, 781-785.
Koehler, H., 1998. Secondary succession of soil mesofauna: a thirteen year study. Applied Soil Ecology. 9, 81-86.
Koehler, H., 1999. Predatory mites (Gamasina, Mesostigmata). Agriculture, Ecosystems and Environment. 74, 395-410.
Koehler, H., 2000. Natural regeneration and succession: results from a 13 years study with reference to mesofauna and vegetation, and implications for management. Landscape and Urban Planning. 8pp.
Koehler, H., Born, H., 1989. The influence of vegetation structure on the development of soil mesofauna. Agric. Ecosystems and Environment. 27, 253-269.
Koehler, H., Melecis, V., 2010. Long-Term Ecological Research: Chapter ID 15: Long-term Observations of Soil Mesofauna. Springer Science+Business Media B. V. 20pp.
Koehler, H., Müller, J., 2003. Entwicklung der Biodiversität während einer 20 jährigen Sukzession als Grundlage für Managementmaßnahmen (BMBF report, s.c. 01 LC 0005), 241pp.
Krantz, G.W., 1978. A Manual of Acarology, 2nd ed. Oregon State University Book Stores, Corvallis, USA. 335pp.
Krawczynski, R., 2007. Succession of Collembola in the postmining landscape of Lower Lusatia. Ph.D. Thesis, Cottbus Technical University, Germany.
Kuznetsova, N.A., 2006. Long-term dynamics of Collembola in two contrasting ecosystems. Pedobiologia. 50, 157-164.
Kuznetsova, N.A., 2007. Long-term dynamics of collembolan populations in forest and meadow ecosystems. Entomological Review. 87, 11-24.
Laird, P.W., Zijderveld, A., Linders, K., Rudnicki, M.A., Jaenisch, R., Berns, A., 1991. Simplified Mammalian DNA isolation procedure. Nucleic Acids Research. 19, p.4293.
Laossi, K.R., Barot, S., Carvalho, D., Desjardins, T., Lavelle, P., Martins, M., Mitja, D., Rendeiro, A.C., Rousseau, G., Sarrazin, M., Velasquez, E., 2008. Effects of plant diversity on plant biomass production and soil macrofauna in Amazonian pastures. Pedobiologia. 51, 397-407.
Lee, Q., Widden, P., 1996. Folsomia candida, a “fungivorous” collembolan, feeds preferentially on nematodes rather than soil fungi. Soil Biology and Biochemistry. 28, 689-690.
Letcher, S.G., Chazdon, R.L., Andrade, A., Bongers, F., van Breugel, M., Finegan, B., Laurance, S.G., Mesquita, R.C., Martínez-Ramos, M., Williamson, G.B., 2012. Phylogenetic community structure during succession: evidence from three Neotropical forest sites. Perspectives in Plant Ecology, Evolution and Systematics. 14, 79-87.
Leyer, I., Wesche, K., 2007. Multivariate Statistik in der Ökologie. Springer Berlin Heidelberg.

Long-term development of Collembola communities on a former rubble deposit
108
Li, S.P., Cadotte, M.W., Meiners, S.J., Hua, Z.S., Jiang, L., Shu, W.S., 2015. Species colonisation, not competitive exclusion, drives community overdispersion over long-term succession. Ecology Letters. 18, 964-973.
Likens, G.E. (Ed.)., 1988. Long-term studies in ecology. New York: Springer. Lindberg, N., 2003. Soil Fauna and Global Change – Responses to Experimental Drought,
Irrigation, Fertilisation and Soil Warming. Ph.D. Thesis, Silvestria 270, Swedish University of Agricultural Sciences, Uppsala.
Lindberg, N., Persson, T., 2004. Effects of long-term nutrient fertilisation and irrigation on the microarthropod community in a boreal Norway spruce stand. Forest Ecology and Management. 188, 125-135.
Lindberg, N., Bengtsson, J., Persson, T., 2002. Effects of experimental irrigation and drought on the composition and diversity of soil fauna in a coniferous stand. Journal of Applied Ecology. 39, 924-936.
Lussenhop, J., Treonis, A., Curtis, P.S., Teeri, J.A., Vogel, C.S., 1998. Response of soil biota to elevated atmospheric CO2 in poplar model systems. Oecologia. 113, 247-251.
Madej, G., Kozub, M., 2014. Possibilities of using soil microarthropods, with emphasis on mites (Arachnida, Acari, Mesostigmata), in assessment of successional stages in a reclaimed coal mine dump (Pszów, S Poland). Biological Letters. 51, 19-36.
Majer, J., 1989. Animals in primary succession. The role of fauna in reclaimed lands. Cambridge University Press: 547pp.
Maharning, A.R., Mills, A.A., Adl, S.M., 2009. Soil community changes during secondary succession to naturalized grasslands. Applied Soil Ecology. 41, 137-147.
Mallet, J., Willmott, K., 2003. Taxonomy: renaissance or Tower of Babel? Trends in Ecology and Evolution. 18, 57-59.
Malmström, A., 2012. Life-history traits predict recovery patterns in Collembola species after fire: a 10 year study. Applied Soil Ecology. 56, 35-42.
Manu, M., 2011. The influence of some environmental factors on the species diversity of the predator mites (Acari: Gamasina) from natural forest ecosystems in Bucegi massif. Travaux du Museum D’Histoire Naturelle”Grigore Antipa”. 54, 9-20.
Manu, M., Băncilă, R.I., Onete, M., 2013. Soil mite communities (Acari: Gamasina) from different ecosystem types from Romania. Belgian Journal of Zoology. 143, 30-41.
Manu, M., Iordache, V., Băncilă, R.I., Bodescu, F., Onete, M., 2016. The influence of environmental variables on soil mite communities (Acari: Mesostigmata) from overgrazed grassland ecosystems–Romania. Italian Journal of Zoology. 83, 89-97.
Mari-Mutt, J., 1979. A revision of the genus Dicranocentrus Schött (Insecta: Collembola: Entomobryidae). Bulletin of the University of Puerto Rico, Agricultural Experiment Station. 259, 41-79.
Martin, J.E.H., 1977. Collecting, Preparing and Preserving Insects, Mites, and Spiders. The Insects and Arachnids of Canada, Vol. 1. – Agriculture Canada, 182pp.

Long-term development of Collembola communities on a former rubble deposit
109
Meijer, J., 1989. Sixteen years of fauna invasion and succession in the Lauwerszeepolder. In: Majer, J.D. (Ed.), Animals in Primary Succession. Cambridge University Press, Cambridge, pp339-369.
Meusemann, K., Von Reumont, B.M., Simon, S., Roeding, F., Strauss, S., Kück, P., Ebersberger, I., Walzl, M., Pass, G., Breuers, S., Achter, V., 2010. A phylogenomic approach to resolve the arthropod tree of life. Molecular Biology and Evolution. 27, 2451-2464.
Milcu, A., Allan, E., Roscher, C., Jenkins, T., Meyer, S.T., Flynn, D., Bessler, H., Buscot, F., Engels, C., Gubsch, M., König, S., 2013. Functionally and phylogenetically diverse plant communities key to soil biota. Ecology. 94, 1878-1885.
Minor, M.A., Cianciolo, J.M., 2007. Diversity of soil mites (Acari: Oribatida, Mesostigmata) along a gradient of use types in New York. Applied Soil Ecology. 35, 140-153.
Mitchell, R.J., Urpeth, H.M., Britton, A.J., Black, H., Taylor, A.R., 2016. Relative importance of local-and large-scale drivers of alpine soil microarthropod communities. Oecologia. 182, 913-924.
Mora, C., Tittensor, D.P., Adl, S., Simpson, A.G.B., Worm, B., 2011. How Many Species Are There on Earth and in the Ocean? PLOS Biology. 9, p.e1001127.
Mori, A.S., Osono, T., Cornelissen, J.H.C., Craine, J., Uchida, M., 2017. Biodiversity ecosystem function relationships change through primary succession. Oikos. http://dx.doi.org/10.1111/oik.04345.
Mudrák, O., Doležal, J., Frouz, J., 2016. Initial species composition predicts the progress in the spontaneous succession on post-mining sites. Ecological Engineering. 95, 665-670.
Mühlenberg, M., 1993. Freilandökologie. 3. Aufl. Quelle and Meyer, Heidelberg. Nenadic, O., Greenacre, M., 2007. Correspondence Analysis in R, with two- and three-
dimensional graphics: The ca package. Journal of Statistical Software. 20, 1-13. Ngosong, C., Gabriel, E., Ruess, L., 2014. Collembola grazing on arbuscular mycorrhiza fungi
modulates nutrient allocation in plants. Pedobiologia. 57, 171-179. Nielsen, U.N., Ayres, E., Wall, D.H., Bardgett, R.D., 2011. Soil biodiversity and carbon cycling:
a review and synthesis of studies examining diversity–function relationships. European Journal of Soil Science. 62, 105-116.
Nielsen, U.N., Osler, G.H.R., Campbell, C.D., Burslem, F.R.P., Van der Wal, R., 2010. The influence of vegetation type, soil properties and precipitation on the composition of soil mite and microbial communities at the landscape scale. Journal of Biogeography. 37, 1317-1328.
Niklaus, P.A., Kandeler, E., Leadley, P.W., Schmid, B., Tscherko, D., Körner, C., 2001. A link between plant diversity, elevated CO2 and soil nitrate. Oecologia. 127, 540-548.
O’Lear, H.A., Blair, J.M., 1999. Responses of soil microarthropods to changes in soil water availability in tallgrass prairie. Biology and Fertility of Soils. 29, 207-217.
Oksanen, J., Blanchet, F.G., Friendly, M., Kindt, R., Legendre, P., McGlinn, D., Minchin, P.R., O’hara, R.B., Simpson, G.L., Solymos, P., Stevens, M.H.H., Szoecs, E., Wagner, H., 2017.

Long-term development of Collembola communities on a former rubble deposit
110
Vegan: Community Ecology Package. R package version 2.4-3. https://CRAN.R-project.org/package=vegan.
Olejniczak, I., 2004. Communities of soil microarthropods with special reference to Collembola in midfield shelterbelts. Polish Journal of Ecology. 52, 123-133.
Pachauri, R.K., Allen, M.R., Barros, V.R., Broome, J., Cramer, W., Christ, R., Church, J.A., Clarke, L., Dahe, Q., Dasgupta, P., Dubash, N.K., 2014. Climate change 2014: synthesis report. Contribution of Working Groups I, II and III to the fifth assessment report of the Intergovernmental Panel on Climate Change (p. 151). IPCC.
Peel, M.C., Finlayson, B.L., McMahon, T.A., 2007. Updated world map of the Köppen-Geiger climate classification. Hydrology and earth system sciences discussions. 4, 439-473.
Perez, G., Decaëns, T., Dujardin, G., Akpa-Vinceslas, M., Langlois, E., Chauvat, M., 2013. Response of Collembolan assemblages to plant species successional gradient. Pedobiologia. 56, 169-177.
Petersen, H., 1995. Temporal and spatial dynamics of soil Collembola during secondary succession in Danish heathland. Acta Zoologica Fennica. 196, 190-194.
Petersen, H., 2002. General aspects of collembolan ecology at the turn of the millenium. Pedobiologia. 46, 246-260.
Petersen, H., 2011. Collembolan communities in shrublands along climatic gradients in Europe and the effect of experimental warming and drought on population density, biomass and diversity. Soil Organisms. 83, 463-488.
Pflug, A., Wolters, V., 2001. Influence of drought and litter age on Collembola communities. European Journal of Soil Biology. 37, 305-308.
Pickett, S.T.A., 1989. Space-for-time substitution as an alternative to long-term studies. In: Likens, G.E. (Ed.), Long-term studies in ecology. Springer, New York, 110-135.
Pinheiro, J., Bates, D., DebRoy, S., Sarkar, D., R Core Team., 2017. _nlme: Linear and Nonlinear Mixed Effects Models_. R package version 3. 1-131, <URL: https://CRAN.R-project.org/package=nlme>.
Ponge, J.F., Gillet, S., Dubs, F., Fedoroff, E., Haese, L., Sousa, J.P., Lavelle, P., 2003. Collembolan communities as bioindicators of land use intensification. Soil Biology and Biochemistry. 35, 813-826.
Porco, D., Skarżyński, D., Decaëns, T., Hebert, P.D., Deharveng, L., 2014. Barcoding the Collembola of Churchill: a molecular taxonomic reassessment of species diversity in a subArctic area. Molecular Ecology Resources. 14, 249-261.
Potapov, M., 2001. Isotomidae. In: Dunger, W. (Ed.), Synopses on Palearctic Collembola, vol. 3. Abhandlungen und Berichte des Naturkunde-museums Görlitz 73/2.
Potapov, A.A., Semenina, E.E., Korotkevich, A.Y., Kuznetsova, N.A., Tiunov, A.V., 2016. Connecting taxonomy and ecology: Trophic niches of collembolans as related to taxonomic identity and life forms. Soil Biology and Biochemistry. 101, 20-31.

Long-term development of Collembola communities on a former rubble deposit
111
Prabhoo, N.R., 1987. Recent trends in the biosystematics entognathous apterygota with special reference to Collembola. Proceedings of the Indian Academy of Sciences, Animal Sciences. 96, 619-928.
Prach, K., Walker, L.R., 2011. Four opportunities for studies of ecological succession. Trends in Ecology and Evolution. 26, 119-123.
Purschke, O., Schmid, B.C., Sykes, M.T., Poschlod, P., Michalski, S.G., Durka, W., Kühn, I., Winter, M., Prentice, H.C., 2013. Contrasting changes in taxonomic, phylogenetic and functional diversity during a long-term succession: insights into assembly processes. Journal of Ecology. 101, 857-866.
Rondon, S., Corp, M., 2015. Preserving insects and related arthropods. Oregon State University. [http://extension.oregonstate.edu/umatilla/sites/default/files/PRESERVING__INSECTS.pdf].
Ruf, A., Beck, L., 2005. The use of predatory soil mites in ecological soil classification and assessment concepts with perspectives for oribatid mites. Ecotoxicology and Environmental Safety. 62, 290-299.
Rumble, H., Gange, A.C., 2013. Soil microarthropod community dynamics in extensive green roofs. Ecological Engineering. 57, 197-204.
Rusek, J., 1989. Ecology of Collembola. In 3rd International Seminar on Apterygorta (R. Dallai ed.) pp. 271-281, Siena: Univ. Siena Press.
Rusek, J., 1998. Biodiversity of Collembola and their functional role in the ecosystem. Biodiversity and Conservation. 7, 1207-1219.
Rusek, J., 2004. Collembola succession on deposits from a chemical factory. Pedobiologia. 48, 519-525.
Rusek, J., 2007. A new classification of Collembola and Protura life forms. In: contributions to soil zoology in central Europe II. ISB BC ASCR. Ceske Budejovice 109-115.
Rusek, J., Greenslade, P., 1992. Report of round table discussion on methods of mounting Collembola. Finnish museum of natural history, University of Helsinki, 6pp.
Rusterholz, H.P., Salamon, J.A., Ruckli, R., Baur, B., 2014. Effects of the annual invasive plant Impatiens glandulifera on the Collembola and Acari communities in a deciduous forest. Pedobiologia. 57, 285-291.
Rzeszowski, K., Sterzyńska, M., 2016. Changes through time in soil Collembola communities exposed to urbanization. Urban Ecosystems. 19, 143-158.
Salamon, J.A., Wissuwa, J., Moder, K., Frank, T., 2011. Effects of Medicago sativa, Taraxacum officinale and Bromus sterilis on the density and diversity of collembola in grassy arable fallows of different ages. Pedobiologia. 54, 63-70.
Salamon, J.A., Schaefer, M., Alphei, J., Schmid, B., Scheu, S., 2004. Effects of plant diversity on collembola in an experimental grassland ecosystem. Oikos. 106, 51-60.
Salmane, I., Brumelis, G., 2008. The importance of the moss layer in sustaining biological diversity of Gamasina mites in coniferous forest soil. Pedobiologia. 52, 69-76.

Long-term development of Collembola communities on a former rubble deposit
112
Salmane, I., Brumelis, G., 2010. Species list and habitat preference of Mesostigmata mites (Acari, Parasitiformes) in Latvia. Acarologia. 50, 373-394.
Salmon, S., Mantel, J., Frizzera, L., Zanella, A., 2006. Changes in humus forms and soil animal communities in two developmental phases of Norway spruce on an acidic substrate. Forest Ecology and Management. 237, 47-56.
Salmon, S., Ponge, J.F., Gachet, S., Deharveng, L., Lefebvre, N., Delabrosse, F., 2014. Linking species, traits and habitat characteristics of Collembola at European scale. Soil Biology and Biochemistry. 75, 73-85.
Sambrook, J., Russell, D.W., 2001. Molecular Cloning: A laboratory manual, 3rd edition. Cold Spring Harbor Laboratory Press, 622pp.
Schaefer, M., 2012. Wörterbuch der Ökologie. Spektrum Akademischer Verlag. Schauff, M.E., 1986. Collecting and preserving Insects and Mites: techniques and tools.
Agricultural research service, USDA, 69pp. Scheu, S., Schulz, E., 1996. Secondary succession, soil formation and development of a diverse
community of oribatids and saprophagous soil macro-invertebrates. Biodiversity and Conservation. 5, 235-250.
Schneider, K., Scheu, S., Maraun, M., 2007. Microarthropod density and diversity respond little to spatial isolation. Basic and Applied Ecology. 8, 26-35.
Schriefer, T., 1985. Restauration: an ecological problem. 1. Development of the microclimate on a rubble dump cover. Z. Kulturtech. Flurbereinig. 26, 305-313.
Seastedt, T.R., 1984. The role of microarthropods in decomposition and mineralization processes. Annual Review of Entomology. 29, 25-46.
Sjursen, H., Michelsen, A., Jonasson, S., 2005. Effects of long-term soil warming and fertilisation on microarthropod abundances in three sub-arctic ecosystems. Applied Soil Ecology. 30, 148-161.
Skorupski, M., 2001. Mites (Acari) from the order Gamasida in theWielkopolski National Park. Fragmenta Faunistica. 44, 129-167.
Skorupski, M., Butkiewicz, G., Wierzbicka, A., 2009. The first reaction of soil mite fauna (Acari, Mesostigmata) caused by conversion of Norway spruce stand in the Szklarska Poręba Forest District. Journal of Forest Science. 55, 234-243.
Stebaeva, S.K., 1970. Life forms of springtails (Collembola). Zoologicheskii zhurnal. Takeda, H., 1987. Dynamics and maintenance of collembolan communities structure in a forest
soil system. Researches on Population Ecology. 29, 291-346. Tilman, D., 1985. The resource-ratio hypothesis of plant succession. American Naturalist. 125,
827-852. Triplhorn, C. A., Johnson, N. F., 2005. Borror and Delong’s introduction to the study of insects
(7th edition). Thomson Brooks/Cole, USA, 864pp.

Long-term development of Collembola communities on a former rubble deposit
113
Tsiafouli, M.A., Kallimanis, A.S., Katana, E., Stamou, G.P., Sgardelis, S.P., 2005. Responses of soil microarthropods to experimental short-term manipulations of soil moisture. Applied Soil Ecology. 29, 17-26.
Upton, S.M., 1993. Aqueous gum-chloral slide mounting media: an historical review. Bulletin of Entomological Research. 83, 267-274.
Uvarov, A.V., 2003. Effects of diurnal temperature fluctuations on population responses of forest floor mites. Pedobiologia. 47, 331-339.
Van der Heijden, M.G.A., Bardgett, R.D., Van Straalen, N.M., 2008. The unseen majority: soil microbes as drivers of plant diversity and productivity in terrestrialecosystems. Ecology Letters. 11, 296-310.
Van Dooremalen, C., Berg, M.P., Ellers, J., 2013. Acclimation responses to temperature vary with vertical stratification: implications for vulnerability of soil dwelling species to extreme temperature events. Global Change Biology. 19, 975-984.
Van Straalen, N.M., 1994. Adaptive significance of temperature responses in Collembola. Acta Zoologica Fennica. 195, 135-142.
Van Straalen, N.M., 1998. Evaluation of bioindicator systems derifec from soil arthropod communities. Applied Soil Ecology. 6, 429-437.
Vitousek, P.M., Matson, P.A., Van Cleve, K., 1989. Nitrogen availability and nitrification during succession: primary, secondary, and old-field seres. Plant and Soil. 115, 229-239.
Von Reumont, B.M., Jenner, R.A., Wills, M.A., Dell’Ampio, E., Pass, G., Ebersberger, I., Meyer, B., Koenemann, S., Iliffe, T.M., Stamatakis, A., Niehuis, O., 2012. Pancrustacean phylogeny in the light of new phylogenomic data: support for Remipedia as the possible sister group of Hexapoda. Molecular Biology and Evolution. 29, 1031-1045.
Walker, L.R., Chapin III, F.S., 1987. Interactions among processes controlling successional change. Oikos. 50, 131-135.
Walker, L.R., Wardle, D.A., Bardgett, R.D., Clarkson, B.D., 2010. The use of chronosequences in studies of ecological succession and soil development. Journal of Ecology. 98, 725-736.
Wanner, M., Dunger, W., 2002. Primary immigration and succession of soil organisms on reclaimed opencast coal mining areas in eastern Germany. European Journal of Soil Biology. 38, 137-143.
Webb, N.R., Coulson, S.J., Hodkinson, I.D., Block, W., Bale, J.S., Strathdee, A.T., 1998. The effects of experimental temperature elevation on populations of cryptostigmatid mites in high Arctic soils. Pedobiologia. 42, 298-308.
Weidemann, G., Koehler, H., 2004: Sukzession. In: Fränzle, O.; Müller, F.; Schröder, W. (Hrsg.): Handbuch der Umweltwissenschaften. Grundlagen und Anwendungen der Ökosystemforschung. - Landsberg am Lech, München, Zürich.
Wissuwa, J., Salamon, J.A., Frank, T., 2012. Effects of habitat age and plant species on predatory mites (Acari, Mesostigmata) in grassy arable fallows in Eastern Austria. Soil Biology and Biochemistry. 50, 96-107.

Long-term development of Collembola communities on a former rubble deposit
114
Wolters, V., 1998. Long-term dynamics of collembolan community. Applied Soil Ecology. 9, 221-227.
Wurst, S., Langel, R., Rodger, S., Scheu, S., 2006. Effects of belowground biota on primary and secondary metabolites in Brassica oleracea. Chemoecology. 16, 69-73.
Xu, G-L., Kuster, T.M., Günthardt-Goerg, M.S., Dobbertin, M., Li, M-H., 2012. Seasonal Exposure to Drought and Air Warming Affects Soil Collembola and Mites. PLOS ONE. 7, e43102.
Yan, X., Ni, Z., Chang, L., Wang, K., Wu, D., 2015. Soil Warming Elevates the Abundance of Collembola in the Songnen Plain of China. Sustainability. 7, 1161-1171.
Zerling, L., 1990. Zur Sukzession von Kleinarthropoden, insbesondere Collembolen, im Bodenbildungsprozeb auf einer landwirtschaftlich genutzten Braunkohlenkippe bei Leipzig. Pedobiologia. 34, 315-335.

Long-term development of Collembola communities on a former rubble deposit
115
Appendix
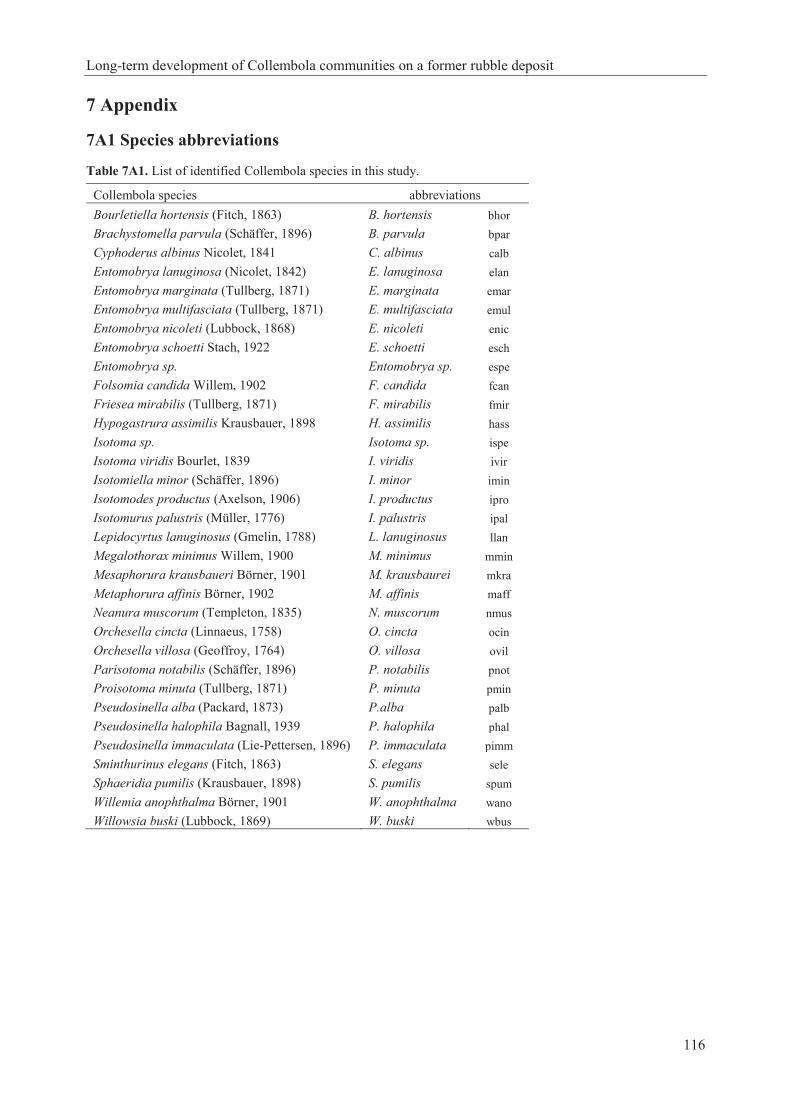
Long-term development of Collembola communities on a former rubble deposit
116
7 Appendix
7A1 Species abbreviations
Table 7A1. List of identified Collembola species in this study.
Collembola species abbreviations Bourletiella hortensis (Fitch, 1863) B. hortensis bhor Brachystomella parvula (Schäffer, 1896) B. parvula bpar Cyphoderus albinus Nicolet, 1841 C. albinus calb Entomobrya lanuginosa (Nicolet, 1842) E. lanuginosa elan Entomobrya marginata (Tullberg, 1871) E. marginata emar Entomobrya multifasciata (Tullberg, 1871) E. multifasciata emul Entomobrya nicoleti (Lubbock, 1868) E. nicoleti enic Entomobrya schoetti Stach, 1922 E. schoetti esch Entomobrya sp. Entomobrya sp. espe Folsomia candida Willem, 1902 F. candida fcan Friesea mirabilis (Tullberg, 1871) F. mirabilis fmir Hypogastrura assimilis Krausbauer, 1898 H. assimilis hass Isotoma sp. Isotoma sp. ispe Isotoma viridis Bourlet, 1839 I. viridis ivir Isotomiella minor (Schäffer, 1896) I. minor imin Isotomodes productus (Axelson, 1906) I. productus ipro Isotomurus palustris (Müller, 1776) I. palustris ipal Lepidocyrtus lanuginosus (Gmelin, 1788) L. lanuginosus llan Megalothorax minimus Willem, 1900 M. minimus mmin Mesaphorura krausbaueri Börner, 1901 M. krausbaurei mkra Metaphorura affinis Börner, 1902 M. affinis maff Neanura muscorum (Templeton, 1835) N. muscorum nmus Orchesella cincta (Linnaeus, 1758) O. cincta ocin Orchesella villosa (Geoffroy, 1764) O. villosa ovil Parisotoma notabilis (Schäffer, 1896) P. notabilis pnot Proisotoma minuta (Tullberg, 1871) P. minuta pmin Pseudosinella alba (Packard, 1873) P.alba palb Pseudosinella halophila Bagnall, 1939 P. halophila phal Pseudosinella immaculata (Lie-Pettersen, 1896) P. immaculata pimm Sminthurinus elegans (Fitch, 1863) S. elegans sele Sphaeridia pumilis (Krausbauer, 1898) S. pumilis spum Willemia anophthalma Börner, 1901 W. anophthalma wano Willowsia buski (Lubbock, 1869) W. buski wbus

Long-term development of Collembola communities on a former rubble deposit
117
7A2 History of research in the case of Collembola Extensive Collembola faunistic studies were done around the world in the past 20 years. Some examples of these faunistic studies are as follow: A. Ohio state, USA 60 species (Phillips et al. 1998) B. Brazil 199 species (Culik and Zeppelini Filho 2003) C. Myanmar 187 species (Christiansen and Nascimbene 2006) D. Finland and Denmark 239 species (Fjellberg 2007) E. Arkhangelsk province, Russia 126 species (Babenko 2008) F. A study about Collembola in fresh water 525 species (Deharveng et al. 2008) G. Penza province, Russia 92 species (Shveenkova 2010) H. Wrangel islands, Russia 89 species (Babenko 2010) I. Eastern Europe 30 species (Chernov et al. 2010) J. Iran 112 species (Gardenehire 1959; Cox 1982; Daghighi et al. 2013 a,b; Shayanmehr et al. 2013) K. Poland 89 species (Rzeszowski and Sterzyńska 2016).
References Babenko, A.B., 2008. Springtails (Hexapoda, Collembola) in Karst Landscapes of the Pinega State
Reserve. Entomological Review. 88, 150-163. Babenko, A.B., 2010. The Springtail (Hexapoda, Collembola) Fauna Wrangel Island.
Entomological Review. 90, 571-584. Chernov, A.V., Kuznetsova, N.A., Potapov, M.B., 2010. Springtail Communities (Collembola) of
Eastern European Broad-Leaf Forests. Entomological Review. 90, 556-570. Christiansen, K., Nascimbene, P., 2006. Collembola (Arthropoda: Hexapoda) from the mid
cretaceous of Myanmar (Burma). Cretaceous Research. 27, 318-363. Cox, P. 1982. The Collembola fauna of north and north western Iran. Entomologist’s monthly
magazine. 118, 39-43. Culik, P.M., Zeppelini Filho, D., 2003. Diversity and distribution of Collembola (Arthropoda:
Hexapoda) of Brazil. Biodiversity and Conservation. 12, 1119-1143. Daghighi, E., Hajizadeh, J., Hosseini, R., Moravvej, A. 2013a. A checklist of Iranian Collembola
with six new records from family Isotomidae (Collembola: Isotomidae). Entomofauna, Band 34, Heft 11: 149-156.
Daghighi, E., Hajizadeh, J., Hosseini, R., Moravvej, A. 2013b. Introduction of eighteen species of Springtails (Arthropoda: Collembola) from Guilan province with three new records for Iran. Entomofauna, Band 34, Heft 13: 177-184.
Deharveng, L., Cyrille, A.D., Bedos, A., 2008. Global diversity of springtails (Collembola: Hexapoda) in freshwater. Hydrobiologia. 595, 329-338.
Fjellberg, A., 2007. The Collembola of Fennoscandia and Denmark. Part 2: Entomobryomorpha and Symphypleona. Koninklijke Brill NV, Leiden, the Netherlands. 264pp.

Long-term development of Collembola communities on a former rubble deposit
118
Gardenehire, R. Q., 1959. Summary of insect conditions in Iran, 1958. Entomologie et Phytopathologie Appliquée. 18, 51-61.
Phillips, Y., Weicht, T., Neher, D., 1998. Collembola of Ohio and Hocking County. University of Toledo. Available in web site: www.uvm.edu/~dneher/posters/OBS_collembola2.pdf.
Rzeszowski, K., Sterzyńska, M., 2016. Changes through time in soil Collembola communities exposed to urbanization. Urban Ecosystems. 19, 143-158.
Shayanmehr, M., Yahyapour, E., Kahrarian, M., Yoosefi Lafooraki, E., 2013. An introduction to Iranian Collembola (Hexapoda): an update to the species list. ZooKeys. 335, 69-83.
Shveenkova, Y.B., 2010. Fauna and Population Structure of Springtails (Hexapoda, Collembola) in Zonal Forest-Steppe Biotopes of the Middle Volga River Basin. Entomological Review. 90, 441-458.

Long-term development of Collembola communities on a former rubble deposit
119
7A3 Desoria trispinata (McGillivray 1896), a promising model species for studying species invasions, stress resistance and adaptive evolution
Olivia Roithmeiera, Elaheh Daghighia, Ulrich Burkhardtb, Juliane Filsera Corresponding author: Olivia Roithmeier, [email protected] aUniversity of Bremen, UFT Center for Environmental Research and Sustainable Technology, Leobener Str. 6, 28359 Bremen, Germany bSenckenberg Museum of Natural History, Am Museum 1, 02826 Görlitz, Germany Submitted 13 July 2017 to Pedobiologia Journal of Soil Ecology
Abstract Given their huge biodiversity, the available set of animal species for model studies is very small, also in widespread and highly abundant groups such as Collembola. The species Desoria trispinata (MacGillivray 1896) is globally distributed but probably not native to Europe. Reports on its occurrence have increased substantially over the last years, proving that it is extremely successful, often dominating not only Collembola but the entire macroscopic soil fauna under favourable conditions. Still, D. trispinata has seldom been studied, and its systematic position is poorly understood. We compiled available literature on the ecology of this species, rendering some very interesting information with respect to its success. In addition, during the past years we established a controlled laboratory culture, recorded relevant life history information and verified its systematic position using taxonomic expertise and molecular genetic analyses. Keywords: Collembola; life History; ecology; culturing; identification; DNA barcoding
Introduction Model species and communities are needed for a better understanding of ecological and evolutionary processes, including stress resistance in view of global environmental change. While a large variety of plants can be bred easily, only a limited set of animals is available, which is in contrast to their huge biodiversity. Collembola are a diverse group of microarthropods (Maaß et al. 2015) that live in most soils and
ecosystems (Rusek 1998). They can occur in high abundances (Bardgett and Cook 1998) and are an essential part of soil ecosystems, e.g. as consumers of fungi and litter (Fountain and Hopkin
2005). Therefore, and since they being sensitive to soil characteristics and contaminants they are exposed to, Collembola are used in ecotoxicological tests and soil quality assessment (Fountain and Hopkin 2005; Janus et al. 2015; OECD 2015). The role of Collembola in community ecology has frequently been studied, too. To better understand the specific impact of individual species on ecosystem processes, manifold experiments with single species (e.g., Buse et al. 2013; Lartey et
al. 1994) or manipulated community composition have been performed (e.g., A´Bear et al. 2012;
Cragg and Bardgett 2001; D’Annibale et al. 2015; Eisenhauer et al. 2011). However, all those studies were restricted to a limited set of clearly defined species as their cultivation in the laboratory is difficult.

Long-term development of Collembola communities on a former rubble deposit
120
The same holds true for ecotoxicological tests. Their vast majority is confined to the standard organism Folsomia candida Willem 1902 on which the OECD guideline is based (Fountain and
Hopkin 2005). However, other species are permitted if, e.g. these species are unequivocally identified and their reproductive biology is included within the test time which means their life-history and optimal cultural conditions for growth and reproduction should be known (OECD
2015). Further, in recent years, community tests have received increasing attention, to take into account sensitivity differences between species (e.g., Filser et al. 2014; Renaud et al. 2017; Scott-Fordsmand et al. 2008). Sometimes specimens for such tests come from field collections (Buch et
al. 2016; Chelinho et al. 2014; Van den Brink et al. 2005), complicating standardisation. The majority of species in culture are euedaphic or hemiedaphic whereas to our knowledge only very few epigeic species are available. These are mostly Orchesella cincta (Linnaeus 1758; Costa et
al. 2012) and Hypogastrura assimilis (Krausbauer 1898; D’Annibale et al. 2015; Scott-Fordsmand
et al. 2008). D. trispinata is a cosmoplitan species that can occur in high abundances and several habitats (see section Ecology). Back in 1970, Tanaka extensively studied D. trispinata, including its culture under laboratory conditions (Tanaka 1970). However, he cultured the specimens in grassland soil, which is hard to control and impossible to standardize. The only controlled
laboratory culture we are aware of had been mentioned in Toft and Wise (1999), which both have retired by now. D. trispinata is a highly interesting species as it occurs worldwide and at very high abundances (see section Ecology). However, information on this species is to a large extent confined to peer-reviewed journals: a basic search in Web of Science© on July 4, 2017 rendered exactly one hit (Sharin 2004), in contrast to >90 in Google Scholar©. To make the situation even more complicated, its identification is difficult (e.g., it can be mixed up with a grey Isotoma viridis
Bourlet 1839) (Shaw and Benefer 2015) and its systematic position thus far remains largely unexplored. Therefore we attempted to shed more light on the biology of this species. Specifically, we (i) compiled available literature, (ii) scrutinized discrepancies in existing identification keys, (iii) established a laboratory culture under controlled conditions including life history information and (iv) verified the taxonomic position of the established culture using taxonomic expertise and molecular genetic analyses. Our main hypotheses are: - Desoria trispinata from different locations form a genetically homogeneous cluster that can be clearly separated from other species of the genus. - The species can be cultivated for a long period of time on a plaster of Paris/charcoal mixture and exhibit similar generation times as in cultures with natural soil.

Long-term development of Collembola communities on a former rubble deposit
121
Materials and methods
Literature review In April 2017 we ran a literature research within Web of Science©, ScienceDirect® and GoogleScholar© with Desoria trispinata and its synonyms as keywords.
Species origin The specimens were sampled from a population located in Bremen, Germany. In early April 2016 soil cores (depths: 0-4, 4-8 cm, 100 cm³) were taken within an extensive grassland (53.1301°N 008.8928°E). The dominating ground vegetation is Holcus mollis, H. lanatus and Poa pratensis interspersed with mainly Plantago lanceolata, Rumex acetosa or R. acetosella. In the vicinity of the sampling location several Betula pubescens, Malus ssp. and a Carpinus betulus grow and a few coniferous trees. It is a loamy sand soil with a pH of 3.8 (CaCl2) and a humus content of 4.6% (LOI). Soil mesofauna was extracted using a Berlese-Tullgren funnel apparatus (10 days, 25-60 °C, + 5 °C / 24 h) into transparent, plastic containers (height: 4 cm, diameter: 7 cm) on a 0.5 cm layer of rewetted plaster of Paris with activated charcoal. The aforementioned container height was mandatory since D. trispinata tends to jump out of too shallow culture vessels. Collembola were collected daily by hand using a micro-aspirator. Approximately 40 black-coloured Collembola, leftovers from the extraction after the start of an experiment, were the initial stock of our culture.
Preparation and identification Two different clearing techniques were applied prior to permanent mounting for optimizing preparation (method 1: warm lactic acid [80 °C], method 2: a technique developed for DNA extraction). For method 1, specimens were transferred by a pipette from an Eppendorf tube containing ethanol (98%) to microscope slides with one or two drops of lactic acid before heating (Greenslade 2010) to 80 °C in different time treatments (30, 45 seconds and 1, 2, 3 and 4 minutes); three specimens were used for each treatment. Method 2, DNA extraction using SNET buffer
solution (Laird et al. 1991; Daghighi et al. 2016) was applied by placing six specimens in small glass vials filled with the respective liquids and kept at a temperature of 55 °C for 3 hours. After that step the specimens were mounted permanently on microscope slides with Marc André 2 mixture. For assessing the efficiency of the clearing methods, the specimens were sorted under a LEICA MS5 stereomicroscope. Species were determined using an Olympus microscope BX60
and keys of Potapov (2001) and Fjellberg (2007). The results of clearing were documented photographically (SONY camera U-SMAD) at 100, 200 and 400 fold magnification. For a preliminary identification of living specimens via stereomicroscope, we distinguished characteristics of living adults based on the experiences with “our” D. trispinata. These characteristics were identified at by the use of a LEICA MS5 (magnification 6.3, 16, 25, 40 or an OLYMPUS SZH10, magnification 7, 20, 40).

Long-term development of Collembola communities on a former rubble deposit
122
Genetic community analysis Adult specimens were taken from rearing and synchronisation containers, killed and stored in 98% Ethanol until analysis. DNA was extracted using the DNeasy Tissue Kit (Qiagen, Hilden, Germany) with a non-destructive method: Following incubation in 110 μl Q-ATL buffer and 3 mAU proteinase K at 56 °C for 36 hours, the cuticle was removed, incubated in 30% ethanol to remove remaining buffer salts, and mounted on a slide in Rusek’s reagent (Rusek 1975). The subsequent extraction of DNA followed the manufacturer’s standard protocol for animal tissue except for the amounts of extraction reagents, which were reduced according to the reduced amount of tissue lysis buffer initially applied. DNA was dissolved in a total of 40 μl of Q-AE buffer (QiaGen). The mt Cox1 5’ barcoding region was amplified with the primer pair LCO1490/ HCO2198
(Folmer et al. 1994). PCR reactions were performed in 10 μl reaction volumes containing 10 - 15 ng of DNA, 0.1 μM of each primer (10 μM), 1x Peq PCR buffer (VWR Darmstadt, Germany), MgCl2 to a total of 1.5 mM, 0.15 mM of each dNTP and 0,25 U of Peq Taq polymerase. DNA amplification was performed under the following cycling conditions: 60 sec. of denaturation at 94 °C; followed by 5 cycles with 94 °C /40 sec., 45 °C / 40 sec., 72 °C / 60 sec.; 35 cycles as before with annealing temperature increased to 51 °C, and a final extension at 72 °C for 5 min. PCR products were inspected on a 1% agarose gel, single band amplifications were purified with ExoSap-IT (Affymetrix, Santa Clara CA, USA) and sequenced at the BiK-F Bio-diversity and Climate Research Centre, Frankfurt am Main, Germany. Sequences were manually assembled and checked for ambiguities, deletions and indels as well as adherence to an open reading frame. BLAST searches were performed for all sequences via GenBank online nucleotide database using the megaBLAST algorithm (www.ncbi.nlm.nih.gov,
acc. 20.05.2017). Sequences were aligned using Muscle (Edgar 2004) as implemented in MEGA7
(Kumar et al. 2016). To assess intraspecific variation among sites and samples of available Desoria specimens, we estimated uncorrected p distances using MEGA7. Intraspecific p distance was only calculated if more than one specimen per site was available. Newly sequenced DNA sequences
were submitted to the BOLD identification system (Ratnasingham and Hebert 2013), assigned to operational taxonomic units and checked for close match to Collembola sequences present in the BOLD database. For sequence comparison, we included nine mt COI sequences of Desoria species available from Genbank (1 D. trispinata each from UK and Russia, 2 D. tigrina (Nicolet 1842), 2 D. olivacea (Tullberg 1871), and 2 D. germanica (Hüther and Winter 1961) with accession numbers KT808356, JN981079, and DQ365787- DQ365792, respectively. All new sequences obtained for this study have been deposited at GenBank® under accession numbers (...pending). Voucher specimens are stored in the GBOL slide collections of Senckenberg Museum of Natural History, DE, Görlitz, specimen and locality data are available online via Edaphobase data warehouse (www.edaphobase.org).

Long-term development of Collembola communities on a former rubble deposit
123
Culturing Culture conditions predominantly follow the guidelines of the Collembola reproduction test
(OECD 2015) but were adapted: We used transparent, plastic containers (height: 4 cm, diameter: 7 cm). These were closed by their lid but not airtight to prevent anoxia. Their bottom was filled with an approx. 5 mm layer of gypsum with activated carbon (200 g gypsum, 25 g activated carbon, 190 ml demineralised, filtrated tap water). Still, D. trispinata can escape from these containers and invade other containers. This occurred more often if they ran out of food, the population density was too high (≥ 400 - 600 specimens / container) or the containers were too dirty. We prevented escaping and infestation by storing the single culture vessels within a semitransparent and airtight closed plastic box (length: 26 cm, width: 16 cm, height: 11 cm). The culture vessel were exposed to the natural day-night-rhythm in the laboratory and stored at room temperature (20 ± 2 °C). We watered the containers with demineralised, filtrated tap water 1 - 2 times a week providing a high relative air humidity but preventing condensation of water droplets. The main food source was granulated dried baker’s yeast (Dr. Oetker). Additionally, we offered small (0.5 - 1 cm²) twigs or pieces of bark collected from mixed deciduous wood covered by algae and lichens. These were picked up from soil below trees (e.g., Betula spec., Fagus sylvatica) and not broken from the trees themselves. Together with some (approx. 5) clay granulate (SERAMIS®), twigs and bark pieces provided structure and food within the artificial habitat; the specimens could hide, climb, graze and lay eggs on them. D. trispinata also seemed to thrive better with these structures and additional food source (derived from previous pilot experiments). To exchange air and keep the balance between providing enough food, e.g. after hatching, but preventing fungal growth, we checked the containers for food, humidity and fungi twice a week. Clay granulates, twigs and bark pieces covered by fungi were replaced and fungi and dead specimens removed. Additionally, clay granulates applied were autoclaved (Varioklav® Steam Sterilizer, type no. 2259) and twigs and bark pieces were stored at -20 °C before use. Under these conditions the culture of originally 40 specimens increased to several thousand between April and December 2016. To increase the stock culture, start a synchronisation or to exchange specimens from old culture vessels into new ones, we inserted 80 - 85 specimens (age: approx. ≥ 3 weeks) into a new vessel. Within the first two months, the population usually increased up to 400 - 600 individuals but started declining within the third month. Oviposition often stopped, too, whereas the number of dead specimens increased. The population could collapse in the fourth month, even below the number of originally inserted adults. To reduce such collapses and stress of crowding, we transferred specimens via micro-aspirator into new containers, usually by end of the third month.
Synchronisation Adults were inserted into culture vessels as described before but without provision of clay granulate and pieces of twigs or barks. 20 - 25 grains of baker’s yeast were offered as food. After

Long-term development of Collembola communities on a former rubble deposit
124
two days, adults and yeast were removed. As soon as we detected the first hatchlings, we added baker’s yeast (10 - 15 grains). We started two separate synchronisations in January 2017: Synchronisation 1 (start: 11.01.2017) based on adults of one single container. Its parent specimens had been transferred into a new container in October 2016. Synchronisation 2 (start: 25.01.2017) based on a mixture of parent adults from four containers that were transferred last into a new vessel in December 2016. Each synchronisation was run with four replicates and started with 82 adults (similar to stock culture vessels), except for one container (70 specimens in synchronisation 1, not enough specimens left for the last replicate). No clay granulate, twigs or barks were offered to avoid hiding places for eggs and specimens. The four containers of each synchronisation were kept in separate boxes to avoid escaping and entering of specimens between synchronisations. These boxes stood next to each other to ensure comparable storage conditions. Containers were checked daily with a stereomicroscope, except weekends, to document key events in life history. To allow investigation of colour change by age, we took pictures with a cell phone camera (SAMSUNG GALAXY S III S3 mini, magnification 1) through the stereomicroscope (20 and 40 fold magnification) and at identical light settings.
Biology and ecology The information on ecology and biology was compiled using the literature presented in this publication and our experiences with the D. trispinata sampled in the field and cultured successfully on plaster of Paris-charcoal for more than 15 months in the laboratory.
Results and discussion
Morphological identification “Desoria trispinata is a little-known...springtail that could easily be mistaken for a grey Isotoma viridis...” (Shaw and Benefer 2015) or other Collembola. The synonyms of Desoria trispinata (MacGillivray 1896) are: Isotoma trispinata, Isotoma maritima meridionalis, Halisotoma
meridionalis, Isotoma setinornata (Potapov 2001). However, the synonym Isotoma trispinata can
be mixed up with synonyms of other Desoria species (Bellinger et al. 1996-2017): Isotoma trispinata, Tuxen, 1944 which is partly synonymized to Desoria olivacea (Tullberg 1871), partly to Desoria violacea (Tullberg 1877). This should be taken into account during literature research. A preliminary identification of our culture specimens via stereomicroscope showed the following characteristics (Fig. 7A1): • Slender body shape with a dense cover of short setae that looks like fur • Body shape Isotoma-like with abdomen widening towards tip and abdomen V and VI separate • Adults look completely black with whitish basal parts of legs and furca but under light the black colour turns into a bluish-purplish black with a vivid, iridescent shimmering (like a drop of oil) • D. trispinata is a fast moving Collembola that can jump easily 1 - 2 cm in distance and >1 cm in height

Long-term development of Collembola communities on a former rubble deposit
125
The weight of sampled field specimens is on average (dry body mass) 9 ± 1 μg per individual (Van Dooremalen et al. 2013). Newly-hatched individuals are 0.4 mm in length and adults have a
mean body length of 0.75 mm whereas a maximum length up to 1.2 - 1.3 mm (Tanaka 1970) or
even up to 1.5 mm (Bhattacharjee 1990) is possible.
Figure 7A1. (A) Cover of short common setae of D. trispinata that looks like fur. (B) Colourful iridescence pattern of specimens. Within the pictures the macrosetae are visible as whitish setae that stood out. Scale bars 1 mm.
As shown in Fig. 7A2 the specimens were not cleared sufficiently except for two variations of the tested methods (warm lactic acid, technique developed for DNA extraction). Among the six different time regimes in warm lactic acid (80 °C), heating for 1 minute at 80 °C was the only method tested that could sufficiently clear the specimens. Heating for 30 and 45 seconds yielded insufficient results in clearing of specimens. Heating for more than 1 minute made specimens soft and fragile and could easily destroy tissues of the body of specimens, resulting in loss of some important characteristics mentioned in identification keys (Fig. 7A2). The technique developed for DNA extraction cleared the specimens very well, while the chaetal pattern remained intact and when specimens were killed in ethanol 98% the cuticle retained good shape, so that specimens could easily be transferred to microscope slides and mounted in Marc André 2 (Fig. 7A3).
Figure 7A2. Representative pictures of specimens of D. trispinata after clearing in warm lactic acid (80 °C) at six different times for heating (A) 30 seconds, (B) 45 seconds, (C) one minute, (D) two minutes, (E) three minutes, (F) four minutes and in (G) SNET buffer solution (DNA extraction method). All scale bars 0.5 mm.

Long-term development of Collembola communities on a former rubble deposit
126
Figure 7A3. Pictures of the whole body of specimens of D. trispinata after clearing in SNET buffer solution (A) without killing and (B) with killing in ethanol 98%. Pictures of external features; (C) chaetal pattern on abdominal segments, (D) tibiotarsus, (E) a setae like structure on tibiotarsus I, II, III may be distinguished wrongly as a clavate tenent hair from specimens of D. trispinata mounted in Marc André 2 after clearing in SNET buffer solution with killing in ethanol 98%.
After applying an appropriate clearing technique, the species could be unequivocally identified
after Potapov (2001) and Fjellberg (2007). The characteristics are: Mucro tridentate, apical ring of tibiotarsus with 7-9 setae, tibiotarsi without clavate tenent hairs, but with pointed apical setae, macrosetae short and smooth, especially on abdomen V shorter than tergite length and ventral tube with 3+3 laterodistal setae (Fig. 7A3). In addition, a comparison of characteristics mentioned in identification keys after Potapov (2001) and Fjellberg (2007) is shown in Table 7A2.

Long-term development of Collembola communities on a former rubble deposit
127
Table 7A2. Species description D. trispinata provided in identification keys after Potapov (2001) and Fjellberg (2007). Contradictions between keys are marked in bold.
Trait Potapov 2001 Fjellberg 2007 Body size Total length up to 1.3 mm. Body size up to 1.3 mm. Color Color blue or purplish blue with darker
posterior edges of the tergites. Color bluish grey, posterior edges of tergites often darkened.
Eyes 8+8 Omma with G and H insignificantly smaller.
Ocelli 8+8, large, subequal.
PAO PAO broad, 1.0 – 1.5 times as long as an omma.
PAO roundish, only slightly larger than nearest ocellus.
Mouthparts Labrum with four apical folds in the form of curved spines. Maxillary head with one strongly developed and distally broadened lamella, as in species of Parisotoma. Maxillary palp bifurcate. Labium with 4 proximal and 5 basomedian setae, papilla E has lost the e7 guard. Guards b3 and b4 detached from papilla B. Usually with 5+5 postlabial setae
Labral chaetotaxy 4/554. Two apical rows of labral setae set on distinct sockets, proximal setae without sockets. Apical edge with 4 small, upright spines followed by a transverse bulge. Ventroapical ciliation absent. Labial palp trifurcate, 4 sublobal hairs. Labial papilla E without guard e7. Guards b3 and b4 detached from the trunk of papilla B, pointed upwards, into the mouth. Proximal field of labium with 4 setae. Basomedian field with 4 setae. Head with 4–5 postlabial setae. Maxillary palp trifurcate, 4 sublobal hairs. Mandibles normal. Maxilla strongly modified, lam.1 much longer than the 3-toothed capitulum, apically expanded, with two rows on long filaments. Lam.2 with ciliation along the edges only, lam.3–5 almost smooth or with fine denticles (3). Lam.6 broad, with many regular rows of small denticles.
Antennae Antennae 1 with about five hair-like ventrolateral sensory organs.
Antennae 1 with a ventral group of 5–6 sensilla, of which three apical ones are short. Antennae 3 with a normal sensory organ. Antennae 4 without differentiated (thick) sensilla, with many hair-like sensilla. Subapical organite indistinct, pin-seta simple. Antennae 2 and 3 with many slender, hair-like sensilla dispersed over the surface.
Tibiotarsi Apical ring of tibiotarsi with 8 setae. Basal part of first leg with three outer setae. Tibiotarsi with 8 apical setae.
Claws Claw with very tiny lateral and without inner teeth.
Claws with a pair of small basal teeth. Unguiculus pointed.
Ventral tube Ventral tube with 4-5+4-5 anterior, 3+3 laterodistal and 5-6 posterior setae (with 2 in a distal transverse row).
Ventral tube with 4–5 frontal setae on each side, 3 + 3 lateral and 5–6 caudal setae.
Retinaculum Retinaculum with 5-6 setae. Retinaculum with 4 + 4 teeth and 5–7 setae. Manubrium Manubrium with 2+2 short apical setae,
manubrial thickening simple. Manubrium with sharp apical teeth and usually 2 + 2 ventroapical short setae.
Dens Dens with many crenulations and 14-16 posterior setae, apical seta on dens long.
Dens strongly crenulated, with 15–20 dorsal setae in basal half.
Mucro Mucro tridentate, without seta. Mucro with 3 teeth, an inner lamella stops with a small tooth about 1/3 from apex, no mucronal seta.
Abdomen Abd V and VI separate. Setae Macrosetae short and smooth, those on Abd V
a little shorter than the median length of tergite, sensillar chaetotaxy abundant, abdomen I-III with 8-9 accp-sensillum/ae in the p-row of setae. Microsensillae on abdomen III located within p-row.
No ventral setae on thorax.

Long-term development of Collembola communities on a former rubble deposit
128
Morphological identification is difficult and slightly divergent in these keys. Some characteristics of D. trispinata can be difficult to distinguish such as the tridentate mucro or the absence of clavate tenent hairs in tibiotarsus II and III. The latter is a key character separating the genus Desoria from Vertagopus. According to Potapov (2001) and Fjellberg (2007) no clavate tenent hairs but pointed apical setae should be visible on apical tibiotarsi for precise species determination. Those important and crucial characteristics in identifying D. trispinata can be easily mixed up with other variations of the characteristics or artefacts that might occur by an unfavourable preparation or clearing technique. To tackle these challenges, first of all, a favourable and suitable clearing technique is essential. Heating in lactic acid is applicable for a quick and short-term survey of specimens. It keeps the specimen in a good condition for few days; especially mouthparts were clearly visible. By this method specimens lose some important identification characteristics, especially chaetae, which may lead to misidentification. The technique developed for DNA extraction, which optimized the method 1 (warm lactic acid) and was also successfully applied for clearing old specimens (Daghighi et al. 2016), is applicable for a long-term storage of the prepared specimens for further microscopic inspection. It also enables a precise species determination under the microscope.
Genetic community analysis A 617 bp fragment (205 codons) of mt 5’-COI was used for analyses, corresponding to positions 1519 to 2135 of the Drosophila yakuba mt sequence (KF824900). No deletions, insertions or stop codons were detected. Among the 22 sequences, there were 415 constant sites and 202 variable sites. Among the 14 newly sequenced Desoria specimens, 30 sites showed a nucleotide ambiguity bias (16 with c/t bias, 8 with a/g, 2 each with a/t, or a/c, and 1 each with t/g, or c/g). Genetic distance between Desoria species ranged from 15.5 to 24.1 %, while within genetic distance was low, ranging from 0.4 to 0.9 % in D. trispinata populations (Table 7A3).
Table 7A3. Mean sequence distance values (uncorrected p) for Desoria species used in the mt COI analysis, based on 618 bp. D. trispinata sampling locations are Germany, United Kingdom, and Russia. Number of samples = n.
1 2 3 4 5 n D. trispinata GER 0.004 14 D. trispinata UK 0.006 1 D. trispinata RUS 0.008 0.009 1 D. germanica 0.168 0.185 0.183 2 D. olivacea 0.192 0.204 0.207 0.155 2 D. tigrina 0.207 0.219 0.223 0.235 0.241 2
Using the specimen identification request tool implemented in BOLD (http://www.barcodinglife.org/index.php/IDS_OpenIdEngine, acc. 16.06.2017), all newly sequenced specimens of D. trispinata could be validated via close match to D. trispinata as most similar species available in BOLD except one sequence shorter than the minimum required 500 bp - with sequence similarities ranging between 98.1 and 99.8 %.

Long-term development of Collembola communities on a former rubble deposit
129
Thus, genetic distance indicated a clear molecular separation between the four Desoria species investigated, and the low genetic distance between 16 D. trispinata specimens from Russia, UK and Germany, compared to intraspecific divergence up to 1.4% (avg. 0.52) reported for other Collembola species (Porco et al. 2012), indicates D. trispinata to represent a genetically quite homogeneous species regarding its DNA barcoding sequence. Albeit the number of populations of this species sampled so far for both morphological and genetic identification is admittedly low, their geographical distance and genetic similarity suggest the COI barcoding sequence suitable for molecular based identification and verification of morphological based identification, which, for Palaearctic Desoria species, is still a challenging task due the subtlety of morphological characters to be studied, as mentioned above. Our genetic analyses indicate D. trispinata to yield a homogeneous molecular pattern for specimens that fit the identification definition as presented
by Potapov (2001), i.e. a high correspondence between morphological and molecular species limits. The aforementioned nucleotide ambiguity found on 30 nucleotide sites within D. trispinata was so far only detected among the specimens of our newly studied German population. As this aspect occurred constantly in all three separate sets of amplification runs sent to sequencing, including repeat runs, it cannot be explained by lab handling procedures alone or sloppy sequencing, but may be regarded a possible characteristic of this population’s genetic configuration. There are recommendations to remove such ambiguous nucleotide positions as a step of signal cleaning prior
to barcoding (Buhay 2009; Yu et al. 2012). On the other hand, such distinct ambiguous sequence areas may indicate underlying processes of adaptation of species to habitat conditions, including population speciation, and thus should be held to enable subsequent studies on genetic distinction of soil organisms along the border between species and populations.
Ecology and biology Ecology Origin and distribution. D. trispinata is probably an invader to Europe (Fjellberg 2007; Kindl-
Stamatopolos 2001; Potapov 2001) originating from the USA (Zettel 2010). But today it is a cosmopolitan mainly distributed in North America and East Asia and with a few records from Europe (Fjellberg 2007; Kindl-Stamatopolos 2001; Potapov 2001). The introduction was likely unintended and occurred e.g. “within soil of ornamental plants, with vegetables, dirty equipment
and vehicles” (Zettel 2010). Publications considering D. trispinata increased within the last ten years revealing that it is predominantly inhabiting the Holarctics but also parts of the Neotropics and Palaeotropics, e.g. India, Hawaii or Brazil (Table 7A4). Habitats. Habitats can be summarized in four main groups. D. trispinata occurs in terrestrial (e.g. in forests, grasslands, cultivated lands), water-associated (e.g., wetlands, river banks, caves), anthropogenic areas (e.g. towns, house walls, flower pots) or in other locations (e.g., associated to volcanic regions) (Table 7A5).

Long-term development of Collembola communities on a former rubble deposit
130
Table 7A4. Distribution of D. trispinata.
Biogeographic region
Continent Countries
Holarctics Europe Austria (Kindl-Stamatopolos 2001), Azores (Potapov 2001), Czech Republic (Potapov 2001), Denmark and Norway (Fjellberg 2007), Finland (Huhta 2007), Germany (Fjellberg 2007; Potapov 2001; Scholz-Starke et al. 2011; Sticht et al. 2008) and present study, Moldava (Buşmachiu 2010), Netherlands (van Dooremalen et al. 2013), Poland (Rzeszowski and Sterzyńska 2016), Portugal, Italy and Turkey (Özata et al. 2016), United Kingdom (Shaw and Benefer 2015; Shaw and Ozanne 2011)
Asia Japan (Nakamori and Suzuki 2007; Potapov 2001; Tanaka 1970), Russia (Potapov 2001; Sharin 2004), Korea (Lim and Park 2011; Potapov 2001), USA/Kanada (Chagnon et al. 2000; Giordano et al. 2014)
Palaeotropics Asia India (Bhattacharjee 1990; Pahari et al. 2014; Dorlong 1984; Hattar et al. 1992; Reddy 1984; Santeshwari and Singh 2015), Nepal (Potapov 2001)
North America
Hawaii (Christiansen and Bellinger 1992), Mexico (Palacios-Vargas 2014), USA (Dold 2010)
Neotropics South America
Brazil (Andrade et al. 2014b; Culik et al. 2002),
Table 7A5. Habitats of D. trispinata.
Terrestrial
Forest Deciduous: sugar maple (Chagnon et al. 2000), oak, redwood (Özata et al. 2016), oak pine (Toft and Wise 1999) Coniferous: protected forest (forest site: dominated by Pinus kesiya; Jhum site: original pine stand now dominated by shrubs and herbaceous vegetation) (Dorlong 1984), Pine (Hattar et al. 1992), Pinus plantation (Reddy 1984), spruce forest (Huhta 2007)
Grassland Christiansen and Bellinger (1992), Scholz-Starke et al. (2011), Sticht et al. (2008), Tanaka (1970), van Dooremalen et al. (2013), present study
Cultivated land/ agriculture
Dold (2010), Hattar et al. (1992), Tamura (1967)
Water-associated
Wetlands Constructed wetlands (Giordano et al. 2014)
Rivers Mangrove (Andrade et al. 2014a), within wet sediment of an inner-city riverbank (Kindl-Stamatopolos 2001)
Caves Occasionally in caves (Kindl-Stamatopolos 2001), caves (almost exclusively from leaf litter) (Soto-Adames and Taylor 2010)
Anthropogenic
Urban Indoor flower pots, outdoor house walls, in compost and other organic debris (Fjellberg 2007), aboveground biotops (Kindl-Stamatopolos 2001), urban green (Rzeszowski and Sterzyńska 2016), oak leaf mulch from compost heap (Shaw and Ozanne 2011)
Others
Volcano and high altitudes
Different altitudes within the Darjeeling Himalaya (Pahari et al. 2014), wetland at the top of a volcano (Lim and Park 2011), Mofette fields (in plots with 100% soil CO2 concentration) (Russell et al. 2011)

Long-term development of Collembola communities on a former rubble deposit
131
Abundance and population density. D. trispinata often occurs as the dominant or amongst the dominating Collembola species: in North America, D. trispinata “is one of the most common
species of springtails in surface leaf litter” (Soto-Adames and Taylor 2010), it was a dominating
species in a Pinus plantation (Reddy 1984) and the most dominant species in a pine forest and
cultivated land (Hattar et al. 1992). It can even show “the highest density of all species and even
among all groups...” (Dorlong 1984) and be the most abundant Collembola in constructed
wetlands (Giordano et al. 2014). Dorlong (1984) recorded densities of D. trispinata in India in Pinus dominated forest soil and in jhum soil (an original pine stand now dominated by shrubs and herbaceous vegetation) during the first and second annual cycle. In forest soil, he found densities of 641.000 / m² and 686.200 / m² respectively, contributing to approx. 83% of Isotomidae, 63% of Collembola and 29% of the forest soil fauna respectively. Densities in jhum soils were lower: 78.300/m² and 91.500²/m² within the first and second annual cycle. Still, they also contributed to >80% of Isotomidae, >68% of Collembola and approx. 18% of the soil fauna. Vertical distribution. D. trispinata is a epigeic, litter to surface soil dweller: In forest soil approx. 40% were located within litter and approx. 30% at 0-2 cm soil depth whereas in jhum soil >75% were located within the first 10 cm (Dorlong 1984). Tamura (1967) recorded them mainly within
the litter and the 0-2 cm soil layer and Tanaka (1970) within the first 5 cm of a grassland soil. In caves specimens were sampled predominantly (>99%) from leaf litter (Soto-Adames and Taylor
2010). This supports that D. trispinata is a near surface living species (Van Dooremalen et al.
2013). However, it can occur down to 30 cm soil depth in cultivated land and down to 20 cm depth
in pine forests (Hattar et al. 1992). Temperature and humidity. Population densities of D. trispinata are mainly affected by soil
temperature (Pahari et al. 2014). Tanaka (1970) observed that time duration for hatching, growth until full body length and maturation period became shorter with rising temperature (5 °C - 30 °C, steps of 5 °C); frequencies of moulting rose with increasing temperature whereas longevity decreased at temperatures higher than 10 °C. In contrast, at 5 °C specimens did not reach maturity. Soto-Adames and Taylor (2010) collected D. trispinata in a cave at an air temperature of 15.6 °C, soil temperature 15.5 °C and a relative humidity of 87.3%.
Seasonal fluctuations. Tanaka (1970) also studied seasonal effects of precipitation, soil water content, soil and air temperature on D. trispinata in Kyushu, Japan (temperature range: 4 °C - 30 °C, yearly mean temperature: 16.4 °C). The vertical distribution was rather unaffected (>94% of specimens in summer and winter in 0-5 cm soil depth). But size class distribution varied with seasons since the majority of the population in winter (December, February) and in late summer to early autumn (August, September) consisted of adults. Three peaks of population density (February to March, May - June, July) and two minima (April, September) were detected. This pattern partly coincidences to the results of Dorlong (1984) (site in Meghalaya, India; temperature range: 2 - 26 °C, average annual rainfall: 2500 - 300 mm): He described maxima in litter and 0-

Long-term development of Collembola communities on a former rubble deposit
132
10 cm soil depth for June and July and a minimum in autumn (September, October, November) but also a minimum, not a maximum, in winter months (December, February). Disturbance. On the one hand, D. trispinata “hardly reacted to clear cutting or shifting agriculture” (Dorlong 1984). On the other hand, Hattar et al. (1992) compared cultivated versus forest land: in 0-10 cm soil depth densities were twice as high in a cultivated lawn as in pine a forest “and reverse in the case of 10-20 cm soil layer.” This indicates effects of habitat type and land use on the vertical distribution of D. trispinata. Furthermore, D. trispinata has a high
resistance to gamma radiation, which is higher than for other Collembola (Loring 1985).
Biology Sex. Males and females have been observed by Bhattacharjee (1990) who investigated amongst
others the germcell cytology. Fjellberg (2007) did not observe males within D. trispinata from
Fennoscandia and Denmark. According to Tanaka (1970) it is impossible to distinguish between sexes of living individuals. In old containers (third month after insertion of specimens) we observed differences in size and shape between fully grown adults. Some were slightly bigger and the abdomen was more roundish, like those of e.g. Protaphorura. Other specimens were smaller with an overall cane like shape and without a roundish abdomen. We suspect the bigger roundish ones to be females, maybe before oviposition. However, this differentiation needs more experience with the species changes by
ageing to be seen correctly and it is prone to error. Consequently, we concur with Tanaka (1970): it is impossible to reliably distinguish sexes in living individuals. Feeding behaviour. D. trispinata is a detritivorous species (Zettel 2010) that may be attracted by
fungal volatiles (Giordano et al. 2014); e.g. dead specimens were found on fruit bodies of
basidiomycetes (Russula bella) (Nakamori and Suzuki 2007). To the first 40 specimens of our culture we offered different food sources: oat flakes, granulated, dried, baker’s yeast as well as twigs and bark pieces of deciduous wood collected from the study site. First, D. trispinata, probably starved after the living extraction, ate everything. After two days they favoured baker’s yeast and grazed on algae growing on twigs and bark pieces. However, they never completely grazed all algae but did so with the granulated baker’s yeast. Thus, we choose these two as food sources for cultures. Cannibalism. At two occasions we observed potential cannibalism: D. trispinata fed on dead specimens or eggs. One time an adult fed on a juvenile that had died recently during hatching. For about two minutes the adult gnawed on an area between egg shell and juvenile and at the juvenile. On another occasion, an approximately one week old juvenile fed on the neck of a dead younger juvenile (approx. 2 - 3 days old). The body of the dead specimen shrunk during that activity. At each of these occasions food was consumed completely, and the population density was very high. Within the container 400 - 600 individuals lived, corresponding to 10 - 16 individuals / cm2. According to (Fountain and Hopkin 2005) densities of more than one F. candida / cm2 reduces

Long-term development of Collembola communities on a former rubble deposit
133
egg deposition and can increase cannibalism of eggs. In addition, it is known that lack of food may cause F. candida to cannibalize its own eggs (OECD 2015). Thus, to avoid cannibalism of D. trispinata, too high densities and lack of food should be avoided. This is another reason why we fed our culture twice a week and transferred specimens to new containers at the latest by the end of the third month. Predators. For some predators D. trispinata is a toxic prey: Wolf spiderlings (Schizocosa) that fed exclusively on D. trispinata did not grow, died without moulting and hatchlings feeding on
them survived less than those of the starved controls (Toft and Wise 1999). Movement. Under the stereomicroscope conditions (intense light, open lid supporting air exchange) D. trispinata moved fast on the plaster of Paris-charcoal layer of our culture containers. They can jump >1 cm in height and 1-2 cm in distance and climb up easily the walls and at the lid of vessels; a behaviour also mentioned by Tanaka (1970) for specimens reared in culture tubes with soil. Moulting and longevity. D. trispinata is moulting during its entire life. At no occasion we saw them eating the moulted skin, and within three months the culture vessels were covered with a layer of white exuviae. Thus, is can be reasonably assumed that D. trispinata is not eating it. This is an important way to get rid of waste products or pollutants potentially stored within or attached to the moulted skin, which, in Collembola also contains the midgut epithelium (Filser and
Hölscher 1997; Vijver et al. 2004). After transferring specimens into new vessels they changed skin within the first three days, often before laying the first eggs. Pigments were likely recovered before ecdysis: a few days before moulting adults turn greyish black and the exuviae stripped are white whereas dead specimens are black (Fig. 7A4). Instead, adults after ecdysis were shiny black for a while. Our specimens reached > 90% of their final body length within four weeks and were fully grown within six weeks which is in accordance to the specimens cultured at 25 °C by Tanaka (1970). The mean longevity decreases with increasing temperature above 10 °C and should be between one and two month in
our rearing considering results of Tanaka (1970) (54 days at 20 °C, 33 days at 25 °C).
Figure 7A4. (A) Difference in colour between a freshly moulted (shiny black) D. trispinata and a specimen that will change its exoskeleton soon (greyish black). (B) An adult stripping the white remains of an exoskeleton. (C) A dead adult specimen coloured in black with whitish tips of furca and legs. In the upper right corner a whitish exuvia is visible. Scale bars 1 mm.

Long-term development of Collembola communities on a former rubble deposit
134
Life history of gypsum-charcoal cultured populations Tanaka (1970) reared cultures on a 0.5 cm layer of field soil (sieved, mesh size 0.25mm) in petri dishes (9 cm diameter) providing dry yeast once a week and keeping them at room temperature. To study life history, he kept them in glass tubes (13 x 55 mm) at 20% soil water content and at different temperatures, offered food constantly and checked them every two to three days (5 - 20 °C) or daily (25 °C, 30 °C). In contrast, we cultured D. trispinata in containers (7 cm diameter, 4 cm height) on plaster of
Paris-charcoal as recommended for ecotoxicological test cultures (e.g., OECD 2015). Culture containers were checked twice a week and synchronisation containers daily, except weekends, to offer moist conditions and yeast constantly. All vessels were stored at 21 ± 2 °C room temperature. Main results (time steps and key characteristics of life history) of the synchronisations are summarized in Fig. 7A5 and Table 7A6.
Figure 7A5. Life history time steps of D. trispinata investigated by two synchronisations.
Table 7A6. Overview synchronisation 1 and 2 with D. trispinata.
Synchronisation 1 Synchronisation 1 Culture from 10/2016 12/2016 Start Synchronisation 11.01.2017 25.01.2017 Adults inserted 82 82 82 70 82 82 82 82 Ratios of F1 that laid eggs to adults inserted within replicates
0.96 1.93 2.10 0.67 0.48 1.96 1.20 0.62
Dead F1 specimens till first F1 egg laying (four replicates)
0 2 0 1 1 0 3 2
Some features of the life history of D. trispinata (Fig. 7A5) closely resemble those of F. candida which eases handling for researchers already familiar with F. candida. At 20 °C D. trispinata laid eggs within 24 hours, the F1 generation hatched within 7 or 8 days and laid eggs themselves at day 17 - 18. F. candida F1 hatched within 7 - 10 days and laid eggs after 3 weeks (Fountain and

Long-term development of Collembola communities on a former rubble deposit
135
Hopkin 2005). The handling for rearing and synchronisation (see method section) is also similar to those of F. candida which makes it a promising candidate for ecological and ecotoxicological studies. Further, the ratio of juveniles hatched and laying eggs to adults inserted was highly variable within and between synchronisations (Table 7A6). A few F1-generation specimens died before laying eggs (≤ 3, Table 7A6) which influences the ratio of reproductive F1 specimens to inserted adults. However, the mortality was < 5%. This high variation might be rather due to different male/female ratios inserted into the single replicates because of the aforementioned impossibility to distinguish them, or due to age differences of specimens inserted. This is relevant since fecundity rate is age-specific in D. trispinata (recently matured females laid eggs less often than the average) and follows oscillating patterns (Tanaka 1970). Additional observations in life history are described in the following. The whitish to amber-coloured eggs were often laid in clutches but also singly as known from other Collembola (Butcher
et al. 1971) and D. trispinata (Tanaka 1970). D. trispinata oviposited nearly everywhere but preferred the offered clay granulates, the vicinity of twigs and bark pieces, holes within the charcoal gypsum layer or the edge of the containers. Shortly before hatching the pigmented ommata became visible within the semitranspararent eggs (Fig. 7A6a) as described e.g. for Orchesella cincta (Schaller 1970). Juveniles usually hatch head first (Fig. 7A6b) but occasionally we observed abdomen first. The egg development time was in the range of earlier work: we
observed 7 to 8 days until eggs laid hatched (at 21 ± 1 °C); Tanaka (1970) noted 9.5 days at 20 °C and 4.8 days at 25 °C. Another characteristic is colour change of juveniles up to the sixth week (Fig. 7A6). New hatchlings (≤ 24 hours) looked nearly transparent, like whitish glass without any pigmentation except from the black ommata. Juveniles turned into a partly dirty-greyish or bluish anthracite mixed with light pink (day 2 - 3) stepwise darkening into a purple with slightly bluish shades (day 7). By end of week three up to the middle of week four, the colour had changed slowly into a dark midnight bluish violet. At daylight conditions, this colour looked already like the black of the adults, but it is not when assessing specimens with a stereomicroscope at higher magnifications (20-fold) and under full light conditions. However, within the fourth week, the first specimens turned into the final black of the adults, even under the mentioned stereomicroscope settings. By end of the sixth week, all specimens had turned into the black of the adults and reached their final size. The early steps in colour change by age of our D. trispinata specimens partly resemble those described for Hypogastrura purpurescens (Lubbock 1867) by Strebel (1932). In contrast, Tanaka
(1970) described his Japanese juveniles as gradually changing from clear white to light blue. However, specimens of D. trispinata exhibit a broad variety of black, blue, green or purple

Long-term development of Collembola communities on a former rubble deposit
136
(Bellinger et al. 1996-2017). This change in colour by age of our specimens enabled us to distinguish four age stages by stereomicroscopial inspection (magnification 20-fold, full light conditions): • Fresh hatchlings (≤ 24 hours): nearly transparent, like whitish glass without any pigmentation except from the black ommata • Juveniles (2 - 3 days): semitransparent, a mix of dirty-greyish or bluish anthracite mixed with light pink • Juveniles (~ 7 days): completely coloured, purple with slightly bluish shades • Adults of 4 - 6 weeks: completely pitch black, even under the stereomicroscope conditions mentioned above.
Figure 7A6. Development of D. trispinata and its change in colour by age. (A) Eggs with black pigmented ommata. (B) Hatchling leaving an egg shell. (C) Juvenile (≤ 24 hours) together with a reproductive adult (25 days). (D) Juveniles at day 2. (E) Adults with juveniles of different ages up to 7 days. Specimens at day 7 (F), 14 (G), 21 (H), 25 (I) and 37 (J). Within the fourth to sixth week the first specimens turned into the black of the fully grown adults. (I) and (J) illustrate the difference in colour between the dark midnight bluish-violet and the final “black” of the adults. Scale bars 0.5 mm.
Conclusions We successfully established a controlled laboratory culture of D. trispinata for more than 15 months by now, verified its taxonomic position and recorded life history data. The species reproduces very fast (from ~85 to 400 - 600 individuals within 3 month). Analysing the available

Long-term development of Collembola communities on a former rubble deposit
137
literature showed that it is a very successful species, as may be explained by a short life cycle, resistance against even gamma radiation, and toxicity to lycosid spiders – abundant predators controlling other Collembola populations. A genetic community analysis assembled specimens of our culture and D. trispinata from the UK and Russia in the same cluster, which was clearly separated from other species of the genus. To complete the knowledge on D. trispinata and its systematic position we need more verified records and genetic community analyses. The use of different identification keys and rechecking the characters listed in the genus and species description of the keys is mandatory. Inviting experienced experts in scrutinizing for a final determination of the species is another option. Finally, a genetic community analysis consisting of DNA barcoding can assist species identification and reveal further information. This cosmopolitan species should be considered more often for ecological and ecotoxicological studies. It can easily sampled in the field, extracted alive and cultured in the laboratory; moreover we offer to share specimens of our well-characterized culture.
This would prevent that not enough specimens exist for a test as in (Van Dooremalen et al. 2013) and increase ecological understanding of an introduced widespread, dominant and probably invasive Collembola species.
Acknowledgements We are indebted to Jürgen Schulz and Arne Fjellberg who confirmed the determination of Desoria trispinata (MacGillivray 1896). This research did not receive any specific grant from funding agencies in the public, commercial, or not-for-profit sectors.
References A´Bear, A.D., Boddy, L., Hefin Jones, T., 2012. Impacts of elevated temperature on the growth
and functioning of decomposer fungi are influenced by grazing Collembola. Global Change Biology. 18, 1823-1832.
Andrade, J.T.M., Palhano, N.B., Tagliaro, C.H., Beasley, C.R., 2014a. Spatial and temporal variation in the abundance and taxonomic composition of estuarine and terrestrial macrofauna associated with mangrove logs. Journal of the Marine Biological Association of the United Kingdom. United Kingdom 94, 35-42.
Andrade, N.A., Centofanti, T., McConnell, L.L., Hapeman, C.J., Torrents, A., Nguyen, A., Beyer, W.N., Chaney, R.L., Novak, J.M., Anderson, M.O., Cantrell, K.B., 2014b. Utilizing thin-film solid-phase extraction to assess the effect of organic carbon amendments on the bioavailability of {DDT} and dieldrin to earthworms. Environmental Pollution. 185, 307-313.
Bardgett, R.D., Cook, R., 1998. Functional aspects of soil animal diversity in agricultural grasslands. Applied Soil Ecology. 10, 263-276.
Bellinger, P.F., Christiansen, K.A., Janssens, F., 1996-2017. Checklist of the Collembola of the World. [WWW Document]. URL http://www.collembola.org.

Long-term development of Collembola communities on a former rubble deposit
138
Bhattacharjee, R.K., 1990. Taxonomic studies on selected species of Collembola from North-East India. Thesis, North-Eastern Hill University, Shillong, India, pp. 1-242.
Buch, A.C., Niemeyer, J.C., Fernandes Correia, M.E., Silva-Filho, E.V., 2016. Ecotoxicity of mercury to Folsomia candida and Proisotoma minuta (Collembola: Isotomidae) in tropical soils: Baseline for ecological risk assessment. Ecotoxicology and Environmental Safety. 127, 22-29.
Buhay, J.E., 2009. “COI-like” sequences are becoming problematic in molecular systematic and DNA barcoding studies. Journal of Crustacean Biology. 29, 96-110.
Buse, T., Ruess, L., Filser, J., 2013. New trophic biomarkers for Collembola reared on algal diets. Pedobiologia (Jena). 56, 153-159.
Buşmachiu, G., 2010. Checklist of springtails (Collembola) from the Republic of Moldova. Travaux du Muséum National d'Histoire Naturelle" Grigore Antipa". 53, 149-160.
Butcher, J.W., Snider, R., Snider, R.J., 1971. Bioecology of edaphic Collembola and Acarina. Annual Review of Entomology. 16, 249-288.
Chagnon, M., Hébert, C., Paré, D., 2000. Community structures of Collembola in sugar maple forests: relations to humus type and seasonal trends. Pedobiologia (Jena). 44, 148-174.
Chelinho, S., Domene, X., Andrés, P., Natal-da-Luz, T., Norte, C., Rufino, C., Lopes, I., Cachada, A., Espíndola, E., Ribeiro, R., Duarte, A.C., Sousa, J.P., 2014. Soil microarthropod community testing: A new approach to increase the ecological relevance of effect data for pesticide risk assessment. Applied Soil Ecology. 83, 200-209.
Christiansen, K., Bellinger, P., 1992. Insects of Hawaii, Vol. 15, Collembola, Museum. University of Hawaii Press, Honolulu.
Costa, D., Mariën, J., Janssens, T.K.S., Van Gestel, C.A.M., Driessen, G., Sousa, J.P., Van Straalen, N.M., Roelofs, D., 2012. Influence of adaptive evolution of cadmium tolerance on neutral and functional genetic variation in Orchesella cincta. Ecotoxicology. 21, 2078-2087.
Cragg, R.G., Bardgett, R.D., 2001. How changes in soil faunal diversity and composition within a trophic group influence decomposition processes. Soil Biology and Biochemistry. 33, 2073-2081.
Culik, M.P., de Souza, J.L., Ventura, J.A., 2002. Biodiversity of Collembola in tropical agricultural environments of Espı́rito Santo, Brazil. Applied Soil Ecology. 21, 49-58.
D’Annibale, A., Larsen, T., Sechi, V., Cortet, J., Strandberg, B., Vincze, É., Filser, J., Audisio, P.A., Krogh, P.H., 2015. Influence of elevated CO2 and GM barley on a soil mesofauna community in a mesocosm test system. Soil Biology and Biochemistry. 84, 127-136.
Daghighi, E., Burkhardt, U., Filser, J., Koehler, H., 2016. Techniques for clearing and mounting Collembola from old ethanol collections. Soil Organisms. 88, 89-97.
Dold, S., 2010. Impact of mustards (Brassicaseae) grown as cover crops on non-target arthropod communities. Thesis, University of Illinois at Urbana-Champaign.
Dorlong, V.T., 1984. Ecological studies of soil arthropods in forest and jhum systems of Laitkor, Meghalaya. Thesis, North-Eastern Hill University.
Long-term development of Collembola communities on a former rubble deposit
139
Edgar, R.C., 2004. MUSCLE: Multiple sequence alignment with high accuracy and high throughput. Nucleic Acids Research. 32, 1792-1797.
Eisenhauer, N., Sabais, A.C.W., Scheu, S., 2011. Collembola species composition and diversity effects on ecosystem functioning vary with plant functional group identity. Soil Biology and Biochemistry. 43, 1697-1704.
Filser, J., Hölscher, G., 1997. Experimental studies on the reactions of Collembola to copper contamination. Pedobiologia (Jena). 41, 173-178.
Filser, J., Wiegmann, S., Schröder, B., 2014. Collembola in ecotoxicology-Any news or just boring routine? Applied Soil Ecology. 83, 193-199.
Fjellberg, A., 2007. The Collembola of Fennoscandia and Denmark, Part II: Entomobryomorpha and Symphypleona, Fauna Entomologica Scandinavica. Koninklijke Brill NV, Leiden, The Netherlands.
Folmer, O., Black, M., Hoeh, W., Lutz, R., Vrijenhoek, R., 1994. DNA primers for amplification of mitochondrial cytochrome c oxidase subunit I from diverse metazoan invertebrates. Molecular Marine Biology and Biotechnology. 3, 294-299.
Fountain, M.T., Hopkin, S.P., 2005. Folsomia candida (Collembola): a “standard” soil arthropod. Annual Review of Entomology. 50, 201-222.
Giordano, R., Weber, E., Darby, B.J., Soto-Adames, F.N., Murray, R.E., Drizo, A., 2014. Invertebrates associated with a horizontal-flow, subsurface constructed wetland in a northern climate. Environmental Entomology. 43, 283-290.
Greenslade, P., 2010. The aquatic Springtails (Insecta: Collembola) of South Africa. [WWW Document]. Aquatic Springtails (Insecta Collembola) South Africa. URL http://www.ru.ac.za/media/rhodesuniversity/resources/martin/acollembola.html.
Hattar, S.J.S., Alfred, J.R.B., Darlong, V.T., 1992. Soil Acarina and Collembola in forest and cultivated land of Khasi hill, Meghalaya. Zoological Survey of India. 92, 89-97.
Huhta, V., 2007. The role of soil fauna in ecosystems: A historical review. Pedobiologia (Jena). 50, 489-495.
Janus, A., Pelfrêne, A., Heymans, S., Deboffe, C., Douay, F., Waterlot, C., 2015. Elaboration, characteristics and advantages of biochars for the management of contaminated soils with a specific overview on Miscanthus biochars. Journal of Environmental Management. 162, 275-289.
Kindl-Stamatopolos, L., 2001. Arthropoden des Wienflußufers im dicht bebauten Stadtgebiet Wiens. Verhandlungen der Zool. Gesellschaft Österreich, 138, 1-15.
Kumar, S., Stecher, G., Tamura, K., 2016. MEGA7: Molecular Evolutionary Genetics Analysis Version 7.0 for Bigger Datasets. Molecular Biology and Evolution. 33, 1870-1874.
Laird, P.W., Zijderveld, A., Linders, K., Rudnicki, M.A., Jaenisch, R., Berns, A., 1991. Simplified mammalian DNA isolation procedure. Nucleic Acids Research. 19, p.4293.

Long-term development of Collembola communities on a former rubble deposit
140
Lartey, R.T., Curl, E.A., Peterson, C.M., 1994. Interactions of mycophagous Collembola and biological control fungi in the suppression of Rhizoctonia solani. Soil Biology and Biochemistry. 26, 81-88.
Lim, M.H., Park, K.H., 2011. New species of Desoria (Collembola: Isotomidae) from Korea. Entomological Research. 41, 95-97.
Loring, S.J., 1985. Gamma-radiation effects on Collembola. Environmental Entomology. 14, 805-809.
Maaß, S., Caruso, T., Rillig, M.C., 2015. Functional role of microarthropods in soil aggregation. Pedobiologia (Jena). 58, 59-63.
Nakamori, T., Suzuki, A., 2007. Defensive role of cystidia against Collembola in the basidiomycetes Russula bella and Strobilurus ohshimae. Mycological Research. 111, 1345-1351.
OECD., 2015. Draft Updated Test Guideline 232: Collembolan Reproduction Test in Soil. doi:http://www.oecd.org/env/ehs/testing/Draft-Updated-Test-Guildeline-232-Collembolan-Reproduction-Test-in-soil.pdf
Özata, M.A., Sevgili, H., Kaprus, I.J., 2016. New records of springtail fauna (Hexapoda: Collembola: Entomobryomorpha) from Ordu Province in Turkey. Turkish Journal of Zoology. 40, 1-9.
Pahari, D., Mandal, G., Kumar, H.A., 2014. Records of the Zoological Survey of India Occasional Papers. Study of Diversity of Collembola (Insecta) fauna of Darjeeling Himalayas, West Bengal, India. Publication Division by the Director, Zoological Survey of India, Kolkata.
Palacios-Vargas, J.G., 2014. Biodiversidad de Collembola (Hexapoda: Entognatha) en México. Revista Mexicana de Biodiversidad. 85, 220-231.
Porco, D., Bedos, A., Greenslade, P., Janion, C., Skarzyński, D., Stevens, M.I., Jansen Van Vuuren, B., Deharveng, L., 2012. Challenging species delimitation in Collembola: Cryptic diversity among common springtails unveiled by DNA barcoding. Invertebrate Systematics. 26, 470-477.
Potapov, M.B., 2001. Synopses on Palaearctic Collembola, Volume 3: Isotomidae. Abhandlungen und Berichte des Naturkunde-museums Görlitz 73, 603.
Ratnasingham, S., Hebert, P.D.N., 2013. A DNA-Based Registry for All Animal Species: The Barcode Index Number (BIN) System. PLOS ONE. 8, e66213.
Reddy, M. V, 1984. Seasonal fluctuations of different edaphic microarthropod population densities in relation to soil moisture and temperature in a pine, Pinus kesiya Royle planta. International Journal of Biometeorology. 28, 55-60.
Renaud, M., Chelinho, S., Alvarenga, P., Mourinha, C., Palma, P., Sousa, J.P., Natal-da-Luz, T., 2017. Organic wastes as soil amendments – Effects assessment towards soil invertebrates. Journal of Hazardous Materials. 330, 149-156.
Rusek, J., 1998. Biodiversity of Collembola and their functional role in the ecosystem. Biodiversity and Conservation. 7, 1207-1219.
Long-term development of Collembola communities on a former rubble deposit
141
Rusek, J., 1975. Eine Präparationstechnik für Springschwänze und ähnliche Gliederfüßer. Mikrokosmos. 65, 378-381.
Russell, D.J., Hohberg, K., Pfanz, H., 2011. Occurrence of Collembolan fauna in mofette fields (natural carbon- dioxide springs) of the Czech Republic. Soil Organisms. 83, 489-505.
Rzeszowski, K., Sterzyńska, M., 2016. Changes through time in soil Collembola communities exposed to urbanization. Urban Ecosystems. 19, 143-158.
Santeshwari, M.R., Singh, J., 2015. Collembola (Insecta: Collembola) community from Varanasi and nearby regions of Uttar of Pradesh, India. Journal of Experimental Zoology. 18, 571-577.
Schaller, F., 1970. Collembola (Springschwänze). Handbuch der Zoologie. 4, 1-72. Scholz-Starke, B., Nikolakis, A., Leicher, T., Lechelt-Kunze, C., Heimbach, F., Theißen, B.,
Toschki, A., Ratte, H.T., Schäffer, A., Roß-Nickoll, M., 2011. Outdoor Terrestrial Model Ecosystems are suitable to detect pesticide effects on soil fauna: Design and method development. Ecotoxicology. 20, 1932-1948.
Scott-Fordsmand, J.J., Maraldoi, K., van den Brink, P.J., 2008. The toxicity of copper contaminated soil using a gnotobiotic Soil Multi-species Test System (SMS). Environment International. 34, 524-530.
Sharin, G. V., 2004. Collembolan community (Collembola) of a disposal tip in Moscow region. Zoologiceskij žurnal. 83, 1419-1426.
Shaw, P., Benefer, C.M., 2015. Development of a barcoding database for the UK Collembola: early results. Soil Organisms. 87, 197-202.
Shaw, P., Ozanne, C., 2011. A calibration of the efficiency of Winkler eclectors for extracting Collembola at different humidities. Soil Organisms. 83, 515-520.
Soto-Adames, F.N., Taylor, S.J., 2010. Status assessment survey for springtails (Collembola) in Illinois caves: the Salem Plateau, INHS Technical Report. Champaign, Illinois.
Sticht, C., Schrader, S., Giesemann, A., Weigel, H.J., 2008. Atmospheric CO2 enrichment induces life strategy- and species-specific responses of Collembolans in the rhizosphere of sugar beet and winter wheat. Soil Biology and Biochemistry. 40, 1432-1445.
Strebel, O., 1932. Beiträge zur Biologie, Ökologie und Physiologie einheimischer Collembolen. Zeitschrift für Morphologie und Ökologie der Tiere. 25, 31-153.
Tamura, H., 1967. Some Ecological Observations on Collembola in Sapporo, Northern Japan). Journal of the Faculty of Science, Hokkaido University, Series VI. Zoology. 16, 238-252.
Tanaka, M., 1970. The Bio-Economics on the Populations of Isotoma (Desoria) trispinata MacGillivray and Onychiurus (Protaphorura) sp. (Collembola; Onychiuridae) in a Grassfield. Publications from the Amakusa Marine Biological Laboratory, Kyushu University. 2, 51-120.
Toft, S., Wise, D.H., 1999. Growth, development, and survival of a generalist predator fed single- and mixed-species diets of different qualities. Oecologia 119, 191-197.
Van den Brink, P.J., Tarazona, J.V., Solomon, K.R., Knacker, T., Van den Brink, N.W., Brock, T., Hoogland, J.P., 2005. The use of terrestrial and aquatic microcosms and mesocosms for the

Long-term development of Collembola communities on a former rubble deposit
142
ecological risk assessment of veterinary medicinal products. Environmental Toxicology and Chemistry. 24, 820-829.
Van Dooremalen, C., Berg, M.P., Ellers, J., 2013. Acclimation responses to temperature vary with vertical stratification: Implications for vulnerability of soil-dwelling species to extreme temperature events. Global Change Biology. 19, 975-984.
Vijver, M.G., Gestel, C.A.M. Van, Lanno, R.P., Straalen, N.M. Van, Peijnenburg, W.J.G.M., 2004. Internal Metal Sequestration and Its Ecotoxicological Relevance: A Review. Environmental Science and Technology. 38, 4705-4712.
Yu, D.W., Ji, Y., Emerson, B.C., Wang, X., Ye, C., Yang, C., Ding, Z., 2012. Biodiversity soup: Metabarcoding of arthropods for rapid biodiversity assessment and biomonitoring. Methods in Ecology and Evolution. 3, 613-623.
Zettel, J., 2010. Springtails and Silverfishes (Apterygota). Chapter 13.5. BioRisk. 4, 851-854.

Long-term development of Collembola communities on a former rubble deposit
143
7A4 Ecology of determined Collembola species in this study Soil-faunal groups should show clear reactions to the ecosystem development, and their specific ecological potency must be known from literature (Dunger and Voigtländer 2005). Ecology of Collembola is poorly known. There is little information in the literature describing the species ecological traits. Knowing that food objects of Collembola are strongly related to their habitat (Potapov et al. 2016), and according to the existing knowledge of ecology about different species of Collembola from Fjellberg (1998, 2007), Bretfeld (1999), Potapov (2001), Dunger and Schlitt (2011), Jordana (2012), Greenslade et al. (2014), Jantarit et al. (2014), Queiroz and Mendonça (2015) (Table 7A7 and Fig. 4A2) and of Gamasina from Karg et al. (1971), Krantz (1978) and Salmane and Brumelis (2010) (Fig. 4A2), their habitat preferences could be defined in e.g. forests, meadows, dunes, seashore, agricultural fields, woods, epiphytic mosses, bogs, fungi, vertebrate and invertebrate (Salmane and Brumelis 2010). Consequently in this study, five ecological groups of Collembola species (based on the species dominances) could be distinguished (Fig. 4A2; Krawszynski 2007): 1. Eurytopic species, 2. Forest species, 3. Open habitats species, 4. Hygrophilous species, 5. Other species.
Table 7A7. Ecological data of studied Collembola species from Fjellberg (1998, 2007), Bretfeld (1999), Potapov (2001), Dunger and Schlitt (2011), Jordana (2012), Greenslade et al. (2014), Jantarit et al. (2014), Queiroz and Mendonça (2015). For complete species names see Table 7A1.
Collembola species life form reproductive mode ecological information F. mirabilis hemiedaphic sexual Cosmopolitan species, abundant in many types of habitats, in
forests, meadows, the seashore, and alpine healths, avoiding only the driest sites. The species is supposed to be predacious, hunting nematodes, rotifers, etc.
N. muscorum hemiedaphic parthenogenetic Cosmopolitan species, in a wide variety of habitats both in forests, open coastal areas and alpine heaths.
B. parvula hemiedaphic sexual Cosmopolitan species, most abundant in wet salt meadows along the coast, but also from drier habitats.
H. assimilis hemiedaphic sexual Eurytopic and cosmopolitan species (records, e.g., from compost heaps, caves, recultivated areas, woodland, littoral zones, arable lands, sandy habitats). River banks and sea shore meadows. Often abundant in cultivated fields and grassland.
W. anophthalma euedaphic parthenogenetic Edaphic genus, sometimes living in burrows, or a psammobiont, common in meadows and forest litter. A common and widely distributed species in various soil types.
M. krausbaueri euedaphic parthenogenetic Cosmopolitan species, it prefers humid (not wet) soils under grass or broadleaved (more seldom conifer) trees from the shore up to (sub) alpine level, acidointolerant, hygromesophilic.
M. affinis euedaphic sexual Characteristic for drained meadow soils, but also found in woods and even in marshy soils. Fairly common, esp. in dry meadows at seashore.
I. productus euedaphic sexual Cosmopolitan species, common species in soils of different open, dry sites with low abundances, a characteristic species for different meadows, it does not occur in forests, it was found only in open-dry land. The species is found in dry, sandy beach meadows and xerophilic plant communities on exposed rocks in vestfold.
Isotoma sp. euedaphic sexual Eurytopic group (able to adapt to a wide range of environmental conditions; widely distributed), more frequent in open and damp sites.
(continued on next page)

Long-term development of Collembola communities on a former rubble deposit
144
Table 7A7 (continued) I. viridis epedaphic sexual Eurytopic, ubiquist species with a high preference for open sites.
At low temperatures, the warmer areas attract the animal. It is common in various habitats, widely distributed.
I. minor euedaphic sexual, parthenogenetic
Eurytopic litter-dwelling species with high abundances and a moderate preference for wet and forest sites. This species is present but in low densities in xerothermic meadows, recultivated and urban areas. They are seldom or absent in agricultural fields, pioneer stages of compost successions (but can be numerous in the last stages), under single trees in towns. A common species in various litter and soil types.
I. palustris euedaphic sexual Hydrophilous species, common and numerous in different damp sites (floodlands, bogs, wet mesdows and forests, ponds, river banks etc). In associated sites in the mountains, Arctic and tidal marine zone, it is replaced with other isotomids. In central europe, it often occurs in agricultural fields. It actively reacts to moisture. Probably widely distributed. Common at border of lakes, brooks, in bogs and other wet habitats.
P. notabilis hemiedaphic sexual, parthenogenetic
Cosmopolitan species, eurytopic and mesophilic litter dwelling species with high abundances, ubiquist species, it reaches high densities in various natural and disturbed sites, forests and open grasslands. In the optimum zone, P. notabilis predominates in most Collembolan communities, its low abundance in theoretically preferable sites, however, were sometimes indicated. It mostly reacts positively to increased PH. An euryoecous species, probably the species is parthenogenetic.
Folsomia sp. euedaphic parthenogenetic Common and abundant in litter of most biotopes, more frequently in alpine, tundra and different forest sites, disturbed as well. Rarely in dry, exposed (tree trunks, stones) and sandy sites.
F. candida euedaphic parthenogenetic Cosmopolitan species, thermophilous, ruderal and troglophilous species, with low abundances in unprotected soils. It was founded in flower pots in a house, frequent in compost etc. in other places in Europe.
P. minuta hemiedaphic sexual Cosmopolitan species, due to its ecological preferences, it is probably an artificially introduced species in certain areas. Thermophilous, compost and ruderal species. It is the most common isotomid species in various compost heaps, manure, dump grounds and similar sites. It is very tolerant to unfavourable conditions (pioneer). It normally does not reach high densities. It is a characteristic species of pioneer stages. Mainly in substrate rich in decomposing organic matter (compost, etc.). Also in flower pots indoors.
O. cincta epedaphic sexual Common in southern districts in dry forest habitats. Usually found in litter around foot of trees, in moss on tree trunks and rocks, sometimes in meadows. Common in forests, on tree trunks, etc.
O. villosa epedaphic sexual In meadows and lush forests. At one site (Halmstad) abundant in older forest near seashore.
L. lanuginosus hemiedaphic sexual Apparently the species is less common with a southern distribution. Most records from rich organic soils in lush hardwood forests, but also from dry sites in open land.
P. alba euedaphic sexual Cosmopolitan species, it was found in many different habitats, both in moth and forest litter, meadows and seashores. It is under stones in forests, in ant hills, in debris at sea shore.
P. halophila euedaphic sexual A marine littoral species, also found in salt marshes at some distance from the sea. Under stones and in debris. Palaearctic species.
(continued on next page)

Long-term development of Collembola communities on a former rubble deposit
145
Table 7A7 (continued) P. immaculata euedaphic sexual Palaearctic species, in rich broad-leaved forest soil. Some records
from east and west Norway in deep soil (under stones and tree roots).
C. albinus euedaphic sexual Probably widespread with ants. A common species in colonies of various species of ants. Usually found under stones with lasius and black Formica species. Linaniemi (1912) also recorded specimens among Camponotus, Myrmica and Tetramorium. Palaearctic species.
Entomobrya sp. hemiedaphic sexual They mainly live on trees or bushes, feeding on fungi or algae that grow on the bark. Some species are found in grass and low vegetation.
E. lanuginosa hemiedaphic sexual It is a species that lives in grass and litter in open areas. It has been recorded from many kinds of habitats, but these habitats are linked with areas in which the species is not present. Meadows and grassy places; in beach meadows, dry seaweed and other wrack, a halophilous form is present. It differs from the main form by paler colour (light green, yellowish brown, greyish violet).
E. nicoleti hemiedaphic sexual It is frequent in low vegetation and shrub vegetation, and is the most frequent Entomobrya species in Spain. A halophilous species living in beach meadows, under wrack, etc.
E. marginata hemiedaphic sexual Many authors consider this species as corticolous, but it occurs as well in litter, moss and under stones. In moss on tree trunks, under bark on dead trees, etc.
E. multifasciata hemiedaphic sexual It has been recorded from many kinds of habitats, such as forests, high mountains in lowland, grass, meadows or on the sea shore. Some records from forest litter and tree trunks.
E. schoetti hemiedaphic sexual It lives in Spain in fields of clover, lucerne and grass in open areas, associated to Sminthurus viridis. However, it can be found in caves and in mountains.
W. buski hemiedaphic sexual A characteristic animal in hot, dry places like exposed tree trunks. Sometimes also on house walls and inside buildings. Cosmopolitan species.
M. minimus euedaphic parthenogenetic It lives during the whole year in litter, moss, and upper soil layers, down to 45 cm depth during frost period. It is troglophile and has been found up to 2500 m altitude.
S. pumilis hemiedaphic sexual It occurs on the surface and in upper layers of different moist soils and in their low vegetation, but not in winter and in dry summer months.
S. elegans hemiedaphic sexual It lives in more open and dryer habitats than S. aureus. In vineyards it was more abundant than S. Aureus and has been found down to 50 cm depth. In the Pyrenees it occurs in wet meadows up to 1200 m altitute.
B. hortensis epedaphic sexual It is common and one of the most drought resistent and sun-loving Symphypleonan species: it can be found on hot, sunny garden slabs and concrete walls, post-fire sites, raw man-made tip soils, small urban greens, and flat roofs. It also lives in low, grassy or herbaceous vegetation or on agricultural soils, where it may occasionally damage plants.
References Bretfeld, G., 1999. Synopses on Palaearctic Collembola, Volume 2. Symphypleona.
Abhandlungen und Berichte des Naturkunde-museums Görlitz. Band 71, Heft 1, p.1-318. Dunger, W., Voigtländer, K., 2005. Assessment of biological soil quality in wooded reclaimed
mine sites. Geoderma. 129, 32-44.

Long-term development of Collembola communities on a former rubble deposit
146
Dunger, W., Schlitt, B., 2011. Synopses on Palaearctic Collembola, Volume 6/1. Tullbergiidae. Soil Organisms. 83, 1-168.
Fjellberg, A., 1998. The Collembola of Fennoscandia and Denmark. Part I: Poduromorpha. Fauna Entomologica Scandinavica. 35. Koninklijke Brill NV, Leiden.
Fjellberg, A., 2007. The Collembola of Fennoscandia and Denmark. Part 2: Entomobryomorpha and Symphypleona. Koninklijke Brill NV, Leiden, the Netherlands. 264pp.
Greenslade, P., Ireson, J., Skarżyński, D., 2014. Biology and key to the Australian species of Hypogastrura and Ceratophysella (Collembola: Hypogastruridae). Austral Entomology. 53, 53-74.
Jantarit, S., Satasook, C., Deharveng, L., 2014. Cyphoderus (Cyphoderidae) as a major component of collembolan cave fauna in Thailand, with description of two new species. ZooKeys. 368, p.1.
Jordana, R., 2012. Synopses on Palaearctic Collembola, Volume 7/1. Capbryinae et Entomobryini. Soil Organisms. 84, 1-390.
Karg, W., Bischoff, H., Dahl, F., Dahl, M., 1971. Acari (Acarina), Milben, Unterordnung Anactinochaeta (Parasitiformes), die freilebenden Gamasina (Gamasides), Raubmilben. Gustav Fischer.
Krantz, G.W., 1978. A Manual of Acarology, 2nd ed. Oregon State University Book Stores, Corvallis, USA. 335pp.
Krawczynski, R., 2007. Succession of Collembola in the postmining landscape of Lower Lusatia. Ph.D. Thesis, Cottbus Technical University, Germany.
Potapov, M., 2001. Isotomidae. In: Dunger, W. (Ed.), Synopses on Palearctic Collembola, vol. 3. Abhandlung und Berichte des Naturkunde-museums, Görlitz. 73/2.
Potapov, A.A., Semenina, E.E., Korotkevich, A.Y., Kuznetsova, N.A., Tiunov, A.V., 2016. Connecting taxonomy and ecology: Trophic niches of collembolans as related to taxonomic identity and life forms. Soil Biology and Biochemistry. 101, 20-31.
Queiroz, G.C., Mendonça, M.C., 2015. Two new Brazilian species of Friesea Dalla Torre, 1895 (Collembola: Neanuridae). Austral Entomology. 54, 110-116.
Salmane, I., Brumelis, G., 2010. Species list and habitat preference of mesostigmata mites (Acari, Parasitiformes) in Latvia. Acarologia. 50, 373- 394.

Long-term development of Collembola communities on a former rubble deposit
147
Curriculum vitae Elaheh Daghighi Masouleh Azadegan Street, Khomeiran Zahedan Street, Apartment Mohammad, unit 6, Rasht-Iran Postal code: 41848-44953 0098 13 33345603 Email: [email protected]; [email protected] Day and place of birth 12th of April 1987 in Tehran, Iran Education 10/2013- 09/2017: PhD of soil ecology “Long-term development of Collembola communities on a former rubble deposit” General and theoretical ecology, Professor Juliane filser and Professor Hartmut Koehler, department of Biology, University of Bremen 07/2015: Research stay Senckenberg Museum of Natural History Görlitz-Germany 09/ 2009-02/2012: Master of agricultural entomology Collembola faunal study University of Guilan, Rasht-Iran 09/2005-07/2009 Bachelor of agriculture engineering Plant diseases and pests University of Guilan, Rasht-Iran 07/2005 Diploma of science Ardeshiri and Mostashari highschool, Rasht-Iran

Long-term development of Collembola communities on a former rubble deposit
148
List of publications (master and PhD)
A) Peer reviewed papers in international journals 1. Daghighi, E., Hajizadeh, J., Hosseini, R., Moravvej, A., 2013. A checklist of Iranian Collembola
with six new records from family Isotomidae (Collembola: Isotomidae). Entomofauna, Band 34, Heft 11: 149-156.
2. Daghighi, E., Hajizadeh, J., Hosseini, R., Moravvej, A., 2013. Introduction of eighteen species of Springtails (Arthropoda: Collembola) from Guilan province with three new records for Iran. Entomofauna, Band 34, Heft 13: 177-184.
3. Daghighi, E., Burkhardt, U., Filser, J., Koehler, H., 2016. Techniques for clearing and mounting Collembola from old ethanol collections. Soil Organisms. 88, 89-97.
4. Daghighi, E., Koehler, H., Kesel, R., Filser, J., 2017. Long-term succession of Collembola communities in relation to climate change and vegetation. Pedobiologia. http://dx.doi.org/10.1016/j.pedobi.2017.06.001.
5. Daghighi, E., Koehler, H., Filser, J., 2017. Collembola and Gamasina in a 20 years secondary succession with different management. Under resubmission.
6. Roithmeier, O., Daghighi, E., Burkhardt, U., Filser, J., 2017. Desoria trispinata (McGillivray 1896), a promising model species for studying species invasions, stress resistance and adaptive evolution. Pedobiologia. Under review.
B) Contributions to scientific meetings and conferences 1. Daghighi, E., Hajizadeh, J., Hosseini, R., Moravvej, A. Introduction of three species and two genus
of family Entomobryidae (Collembola: Entomobryidae) from Rasht and suburbs. First Congress of modern agricultural sciences and technologies at University of Zanjan-Iran (2011), poster presentation.
2. Daghighi, E., Hajizadeh, J., Hosseini, R., Moravvej, A. Introduction of one tribe, two genera and one species from springtails (Collembola: Symphypleona) in Rasht and suburbs. The annual research week meeting at University of Guilan-Iran (2011), poster presentation.
3. Daghighi, E., Hajizadeh, J., Hosseini, R., Moravvej, A. Introduction of four Genus and one species from springtails (Collembola: Symphypleona) in Rasht and suburbs. The twenties Iranian Plant Protection Congress at the University of Shiraz-Iran (2012), poster presentation.
4. Daghighi, E., Hajizadeh, J., Hosseini, R., Moravvej, A. Introduction of two genera and six species from springtails (Collembola: Entomobryidae) in Rasht and suburbs. The twenties Iranian Plant Protection Congress at the University of Shiraz-Iran (2012), poster presentation.
5. Daghighi, E., Burkhardt, U., Filser, J., Koehler, H. Techniques for clearing and mounting Collembola from old ethanol collections. 28th mesofauna meeting at Senckenberg museum in Görlitz-Germany (2015), oral presentation.
6. Daghighi, E., Koehler, H., Kesel, R., Filser, J. Long-term succession of Collembola communities in relation to climate change and vegetation. The 46th Annual Meeting of the Ecological Society of Germany, Austria and Switzerland in Marburg-Germany (2016), poster presentation; 29th mesofauna meeting at the University of Bremen-Germany (2016), oral presentation.

Long-term development of Collembola communities on a former rubble deposit
149
Acknowledgements
I like to dedicate my thesis to my life coaches, my dear parents “Davood Daghighi and Malihe Taskindoust” and my lovely sister “Elika Daghighi”. Because I owe all my life to them. Many thanks for all their advices, supports and their presence in my success. I would like to express my sincere gratitude to my supervisors Prof. Juliane Filser and prof. Hartmut Koehler for the continuous support of my PhD study, for their patience, kindly behaviour, motivation, and immense knowledge. Their guidance and support encouraged me to overcome many problems during the whole time of my PhD work. Therefore, I could pursue my scientific research and achieve my goals. Besides my supervisors, I wish to thank the rest of my thesis defence committee members: Prof. Marco Rohlfs and Prof. Martin Diekmann for their contribution in my defence session, insightful comments and encouragements. My sincere thanks also go to the technicians of the working group of Prof. Juliane Filser; Iris Burfeindt, Ute Uebers, Annemarie Kissling and Andrea Böschen for providing a situation for good laboratory works with safety instructions. I also want to express my special thanks to German Academic Exchange Service (DAAD) for providing the foundation for my PhD thesis and living in Germany for four and a half years. Before that, I wish to thank my English and German language teacher in Iran, Fardin Komaei who introduced me and encouraged me to do a PhD under the programs of DAAD in Germany. I really wish to express my endless thanks by my heart to my best friends and colleagues; Hind Khalili and Olivia Roithmeier, who supported me very kindly during the whole time of my PhD study at the University of Bremen and they did their best that I could improve my German language and I did not feel far from home. I always like them as a family member of mine.

Long-term development of Collembola communities on a former rubble deposit
150
Ort, Datum: ____________________________
Versicherung an Eides Statt
Ich, _______________________________ (Vorname, Name, Anschrift, Matr.-Nr.) versichere an Eides Statt durch meine Unterschrift, dass ich die vorstehende Arbeit selbständig und ohne fremde Hilfe angefertigt und alle Stellen, die ich wörtlich dem Sinne nach aus Veröffentlichungen entnommen habe, als solche kenntlich gemacht habe, mich auch keiner anderen als der angegebenen Literatur oder sonstiger Hilfsmittel bedient habe. Ich versichere an Eides Statt, dass ich die vorgenannten Angaben nach bestem Wissen und Gewissen gemacht habe und dass die Angaben der Wahrheit entsprechen und ich nichts verschwiegen habe. Die Strafbarkeit einer falschen eidesstattlichen Versicherung ist mir bekannt, namentlich die Strafandrohung gemäß § 156 StGB bis zu drei Jahren Freiheitsstrafe oder Geldstrafe bei vorsätzlicher Begehung der Tat bzw. gemäß § 161 Abs. 1 StGB bis zu einem Jahr Freiheitsstrafe oder Geldstrafe bei fahrlässiger Begehung. _________________________ Ort, Datum Unterschrift