Embed Size (px)
Citation preview
RESEARCH ARTICLE Open Access
Long-term experimental evolution revealspurifying selection on piRNA-mediatedcontrol of transposable element expressionUlfar Bergthorsson1†, Caroline J. Sheeba2,3†, Anke Konrad1,4, Tony Belicard2,3, Toni Beltran2,3,5, Vaishali Katju1*
and Peter Sarkies2,3*
Abstract
Background: Transposable elements (TEs) are an almost universal constituent of eukaryotic genomes. In animals,Piwi-interacting small RNAs (piRNAs) and repressive chromatin often play crucial roles in preventing TE transcriptionand thus restricting TE activity. Nevertheless, TE content varies widely across eukaryotes and the dynamics of TEactivity and TE silencing across evolutionary time is poorly understood.
Results: Here, we used experimentally evolved populations of C. elegans to study the dynamics of TE expressionover 409 generations. The experimental populations were evolved at population sizes of 1, 10 and 100 individualsto manipulate the efficiency of natural selection versus genetic drift. We demonstrate increased TE expressionrelative to the ancestral population, with the largest increases occurring in the smallest populations. We show thatthe transcriptional activation of TEs within active regions of the genome is associated with failure of piRNA-mediated silencing, whilst desilenced TEs in repressed chromatin domains retain small RNAs. Additionally, we findthat the sequence context of the surrounding region influences the propensity of TEs to lose silencing throughfailure of small RNA-mediated silencing.
Conclusions: Our results show that natural selection in C. elegans is responsible for maintaining low levels of TEexpression, and provide new insights into the epigenomic features responsible.
Keywords: C. elegans, Experimental evolution, Transposable elements, Epigenetics, Small RNAs, piRNAs, Chromatin
BackgroundTransposable elements (TEs) are almost ubiquitousacross eukaryotic genomes [1]. Their ability to replicateindependently of the host genome, coupled with the ex-istence of multiple copies liable to ectopic recombin-ation means they present a potential threat to genomestability. Moreover, TEs pose a threat to genome
function as new integrations can disrupt genes or generegulatory elements. As a result, organisms have evolvedsophisticated control strategies, which protect the gen-ome from TE proliferation. Across eukaryotes, short(20- to 33-nucleotide) RNAs play an important role inthe suppression of TE activity. Within animals, Piwi-interacting small RNAs (piRNAs) are paramount in theTE defence armoury [2]. piRNAs are produced from de-fined genomic loci named piRNA clusters and, after pro-cessing, associate with the Piwi subfamily of Argonauteproteins [3]. They recognize TEs through sense-antisense base pairing and target TEs for transcriptionaland post-transcriptional silencing [2]. In many model
© The Author(s). 2020 Open Access This article is licensed under a Creative Commons Attribution 4.0 International License,which permits use, sharing, adaptation, distribution and reproduction in any medium or format, as long as you giveappropriate credit to the original author(s) and the source, provide a link to the Creative Commons licence, and indicate ifchanges were made. The images or other third party material in this article are included in the article's Creative Commonslicence, unless indicated otherwise in a credit line to the material. If material is not included in the article's Creative Commonslicence and your intended use is not permitted by statutory regulation or exceeds the permitted use, you will need to obtainpermission directly from the copyright holder. To view a copy of this licence, visit http://creativecommons.org/licenses/by/4.0/.The Creative Commons Public Domain Dedication waiver (http://creativecommons.org/publicdomain/zero/1.0/) applies to thedata made available in this article, unless otherwise stated in a credit line to the data.
* Correspondence: [email protected]; [email protected]†Ulfar Bergthorsson and Caroline J. Sheeba are co-first authors.1Department of Veterinary Integrative Biosciences, Texas A&M University,College Station, TX 77845, USA2MRC London Institute of Medical Sciences, Du Cane Road, London W120NN, UKFull list of author information is available at the end of the article
Bergthorsson et al. BMC Biology (2020) 18:162 https://doi.org/10.1186/s12915-020-00897-y
organisms, piRNAs are essential for fertility throughtheir role in controlling TE proliferation in the germline[4].The nematode Caenorhabditis elegans is a well-
established model for small-RNA mediated silencing.piRNAs in C. elegans are unusual in that the two piRNAclusters on Chromosome IV are composed of individualRNA polymerase II (RNA pol II) transcription lociwhere each piRNA has its own upstream motif [5–8].piRNA clusters are located within H3K27me3-rich chro-matin, which, together with cis-acting RNA pol II paus-ing sequences downstream of the piRNA, enforceproduction of ~ 28 nucleotide piRNA precursors [9].piRNA precursors are further trimmed to result in ma-ture 21-nucleotide piRNAs with a uracil as the first nu-cleotide (21 U-RNAs), which associate with the C.elegans Piwi protein PRG-1 [5–7]. Downstream of PRG-1, piRNA silencing relies on a nematode-specific class ofsecondary small RNAs known as 22G-RNAs [6]. 22G-RNA synthesis is carried out by RNA-dependent RNApolymerases using the target RNA as a template, follow-ing initiation by piRNA target recognition [10]. 22G-RNAs bind to Argonaute proteins and lead to transcrip-tional and post-transcriptional silencing of target RNAs[11]. Additionally, 22G-RNAs can be transmitted trans-generationally [12] and as a result, piRNA-initiated silen-cing can persist for many generations even after piRNAsthemselves are removed by mutating PRG-1 [13–15].Consequently, whilst removal of piRNAs alone has mildeffects on TE expression, combining mutations of PRG-1 with mutations disrupting the 22G-RNA biogenesismachinery leads to reactivation of several TEs [16, 17].Despite the universality of TEs across eukaryotes, there is
striking variability both in TE content and TE expressionacross species. Several interacting factors have been pro-posed to account for this. First, silencing mechanisms differbetween organisms. For example, the entire piRNA path-way has been lost independently multiple times in nema-todes [18] and was lost in parasitic flatworms [19, 20] andin dust mites [21]. Second, it is possible that some TEs mayhave beneficial consequences through their ability to act asreservoirs for evolutionary novelty. For example, up to 60%of human-specific enhancers may be TE-derived [22] andTE insertions have been proposed to substantially rewirethe human immune cell transcriptome [23]. TEs themselvesmay also be co-opted into developmental programs. For ex-ample, transcription of L1 RNA is observed at the 2-cellstage in mouse embryogenesis where it may have a directrole in coordinating gene expression programs [24]. Fur-thermore, TEs may serve as a genome-wide source of regu-latory elements [1]. Despite these examples, TEs are overallconsidered to be detrimental to fitness, and beneficial TEinsertions appear overrepresented due to the effects of nat-ural selection in weeding out deleterious insertions [25].
The diversity of TEs across evolution may thus reflectpopulation genetics factors such as population structureand effective population size. For example, even moderatelydeleterious TE insertions might become fixed in very smallpopulations as the intensity of selection decreases with re-duced population size. In agreement with this model, a re-cent large-scale study across nematodes concluded thatgenetic drift was likely responsible for differences in TEcontent across nematodes [26].In the context of these potential models to explain the
diversity in TE content, it is important to understandthe extent to which the balance between TE expressionand TE regulation is under selection. One way to studythis is to use a mutation accumulation (MA) frameworkin which replicate lines descended from a single com-mon ancestor are propagated under a regime of drasticpopulation bottlenecks for several hundred generations[27, 28]. The maintenance of these lines at a minimalpopulation size attenuates the efficacy of selection,thereby enabling the accumulation of a large, unbiasedsample of spontaneous mutations under conditions ofgenetic drift which can subsequently be identified andtheir fitness effects investigated.Previously, MA lines have been used to investigate the
rate and spectrum of TE copy-number changes in Sac-charomyces cerevisiae, C. elegans and Drosophila mela-nogaster, thus providing estimates of the rate of TEtransposition [29–32]. However, TE expression is notnecessarily directly linked to TE copy-number and mayhave independent fitness consequences. The opportunityto interrogate genome-wide RNA expression has beenexploited to investigate the effect of mutations onprotein-coding gene expression divergence [33–35].Here, we use C. elegans to extend this approach in orderto investigate the effect of spontaneous mutations on TEexpression divergence.The genome of C. elegans is approximately 12% repeti-
tive [36]. DNA transposons, which spread via a cut andpaste mechanism, are the most abundant [37], with Tc1,the founding member of the Tc1/Mariner family ofDNA transposons, particularly well-studied as it is activein laboratory and wild strains [38, 39]. There are also anumber of retrotransposons, which spread via a copy-paste mechanism involving an RNA intermediate, ofwhich very few are predicted to be active [40, 41]. Otherelements, including Helitrons, are also suggested to havebeen recently active [42]. Transposable elements aremore abundant in repressed regions of the genome thatare typically enriched with specific histone modificationssuch as H3K9me3 [43].We created spontaneous MA lines of C. elegans that
were descended from a single worm ancestor and propa-gated for 409 generations under three population sizetreatments of N = 1, 10 and 100 individuals per
Bergthorsson et al. BMC Biology (2020) 18:162 Page 2 of 17
generation [44]. The varying population size treatmentin the experiment permitted a manipulation of thestrength of selection, with the N = 1 lines evolving underclose to neutral conditions (minimal selection) and anincremental increase in the strength of selection with in-creasing population size. We employed this frameworkto investigate how TE expression evolves under condi-tions of near neutrality and under the influence of in-creasing selection intensity. We show that overall TEexpression increases in MA lines with the smallest popu-lation size. We further show that expression increase re-sults in part from failure of piRNA-mediated silencing.Intriguingly, differences in the responses of different TEsto reduced piRNA-mediated silencing depend on thechromatin environment of the TE loci, such that TEs inrepressed chromatin domains largely remain silent dueto epigenetic memory imparted by 22G-RNAs, whilst inactive chromatin domains, increased TE expression ismuch more likely to occur. Together, our results dem-onstrate for the first time that robust control of TE ex-pression is under selection in animals. Importantlyfurther, our results provide new insight into how thechromatin environment interacts with piRNA-mediatedsilencing to control TE expression.
ResultsRelaxed selection leads to increased TE expressionIn order to assess the effect of selection on TE expres-sion, we generated spontaneous MA lines of C. elegansand propagated them by randomly selecting N individ-uals at each generation, where N was either 1, 10 or 100[44]. Henceforth, we refer to the three population sizetreatments as N.1, N.10 or N.100 (Fig. 1a). We propa-gated the lines for 409 generations; we isolated RNA andperformed RNA sequencing to investigate TE expres-sion. The fundamental difference between these treat-ments is the size of the bottleneck that the population issubjected to in each generation. However, it is inevitablethat the population density will also vary between thethree population size treatments, resulting in environ-mental differences that could introduce variation in geneexpression amongst the experimental lines maintained atthese three population sizes. To counteract this, all lineswere maintained in similar conditions including nopopulation bottleneck differences for three generationsprior to RNA extraction. Therefore, the most likely ex-planation for any differences in TE expression that weobserve is the different strength of purifying selectionbetween the three population size treatments duringMA. It should be noted that although epigenetic effectsaffecting endogenous genes lasting longer than threegenerations are very rare [45], we cannot formally ex-clude them as a possibility.
MA lines from all three population size treatmentsshowed an increase in total TE expression relative to thepre-MA ancestral control; moreover, N.1 had highertotal TE expression than N.10 or N.100. Across increas-ing population sizes, we observed a monotonic decreasein total TE expression (using the non-parametric Jonc-kheere test for ordered medians with groupings of N.1,N.10 and N.100 in that order, henceforth Jh, p = 0.02;Fig. 1b). Similarly, linear regression analysis showed asignificant negative relationship between increasingpopulation size and TE expression (linear regression;henceforth LR, p = 0.02; Fig. 1b). The mean expressionacross all changes in TEs normalized to the pre-MA an-cestral control showed a significant tendency to decreaseas the population size increased (Jh, p = 0.003; LR, p =0.02; Additional File 1: Fig. S1A).Protein-coding gene expression diverges during MA
in a variety of model organisms including C. elegans[33, 34, 46]. In addition to an overall increase, TE ex-pression also appears to show broader distributions inthe N.1 lines compared to the N.10 and N.100 lines(Additional File 1: Fig. S1B). To test this directly, weestimated the variation in the expression of each indi-vidual TE and each individual gene. To control forpotential changes in the mean expression, which canaffect noise, we calculated the Fano factor [var(x)/mean(x)] within N.1, N.10 and N.100 lines separately.Fano factors for TEs and genes were higher in N.1lines relative to N.10 or N.100 lines (TEs: Wilcoxonpaired test, p = 0.015 and 0.004 for N.10 and N.100;genes: Wilcoxon paired test, p < 1 × 10⁻¹⁶ for bothN.10 and N.100; Additional File 1 Fig. S1C, S1D). Tocontrol for the possibility that the larger number ofN.1 lines might lead to higher variance, we calculatedTE Fano factors from 1000 subsets of five N.1 linesand all 252 subsets of five N.10 lines and comparedthese to the five N.100 lines. This showed the sametrend as the full dataset (Additional File 1: Fig. S1E).To further investigate the variation in expression, wecalculated the total variance in the change in expres-sion of all TEs or all genes between each line and thepre-MA ancestral control. Variance in the differencesin both TE and gene expression increased withsmaller population sizes (Jh, p = 0.008 and 0.009, re-spectively) (Additional File 1: Figs. S1F, S1G). How-ever, importantly, there was no correlation in overallvariance between TEs and genes in the same line(Additional File 1: Fig. S1H), showing that TE expres-sion and gene expression diverge independently.In order to understand loss of repression of TE expres-
sion in more detail, we investigated the expressionchanges of different families of TEs. We detected 87 TEsfor which we obtained robust RNA-Seq coverage in atleast one line. We used RepeatMasker to classify these
Bergthorsson et al. BMC Biology (2020) 18:162 Page 3 of 17
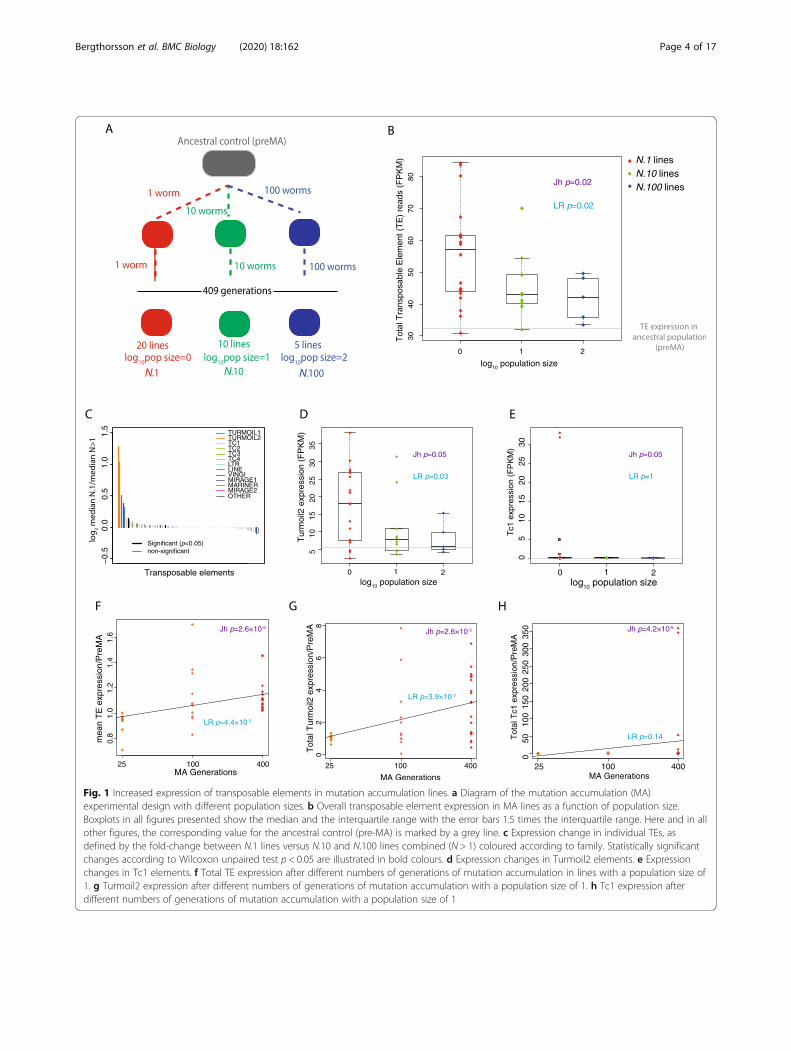
Fig. 1 Increased expression of transposable elements in mutation accumulation lines. a Diagram of the mutation accumulation (MA)experimental design with different population sizes. b Overall transposable element expression in MA lines as a function of population size.Boxplots in all figures presented show the median and the interquartile range with the error bars 1.5 times the interquartile range. Here and in allother figures, the corresponding value for the ancestral control (pre-MA) is marked by a grey line. c Expression change in individual TEs, asdefined by the fold-change between N.1 lines versus N.10 and N.100 lines combined (N > 1) coloured according to family. Statistically significantchanges according to Wilcoxon unpaired test p < 0.05 are illustrated in bold colours. d Expression changes in Turmoil2 elements. e Expressionchanges in Tc1 elements. f Total TE expression after different numbers of generations of mutation accumulation in lines with a population size of1. g Turmoil2 expression after different numbers of generations of mutation accumulation with a population size of 1. h Tc1 expression afterdifferent numbers of generations of mutation accumulation with a population size of 1
Bergthorsson et al. BMC Biology (2020) 18:162 Page 4 of 17
TEs into different families (Additional File 1: Fig. S2A,S2B). We detected expression from several major fam-ilies of TEs (Additional File 1: Fig. S2A, SB), spreadacross all chromosomes (Additional File 1:Fig. S2C). Ourset included TEs in several different chromatin environ-ments and those targeted by small RNAs (Additional File1: Fig. S2D, S2E). We investigated the change in TE ex-pression between N.1 and N > 1 lines (combined N.10and N.100 lines) and tested for monotonic median in-crease with decreasing population size. As expected, themajority of TEs that showed a significant difference be-tween N.1 and N > 1 lines had increased expression inN.1 compared to the other lines (Fig. 1c). However, indi-vidual TEs displayed different patterns of expressionchange. Some TEs, notably the DNA transposon Tur-moil2, showed more consistent increases across the N.1lines compared to the N.10 and N.100 lines (Fig. 1d). In-deed, the majority of the total effect on TE expressionseen in Fig. 1b could be attributed to one TE family, theTurmoil2 TEs, which showed a large expression increaseacross the majority of the N.1 lines (Fig. 1c, d). Contrast-ingly, some TEs, notably the Mariner family DNA trans-poson Tc1, showed a burst-like pattern of expressionwhere a large increase in expression was observed in afew N.1 lines whilst retaining low expression in theremaining N.1 lines as well as the N > 1 lines (Fig. 1e).We next investigated the time course of TE desilen-
cing during propagation of the MA lines. We performedgene expression analysis by RNA-Seq on 11 N.1 lines at25 and 100 MA generations. Median relative TE expres-sion showed a significant increase with increasing num-bers of MA generations (Jh, p = 2.6 × 10⁻⁵; Fig. 1f).Linear regression analysis confirmed a positive relation-ship between increased numbers of MA generations andincreased TE expression (LR, p = 4.4 × 10⁻³; Fig. 1f). Dif-ferent TEs showed different kinetics of desilencing. Tur-moil2 showed a positive relationship between thenumber of MA generations and expression (LR, p =3.9 × 10⁻³) and a monotonic increase in median expres-sion (Jh, p = 2.6 × 10⁻³; Fig. 1g). Contrastingly, Tc1 desi-lencing did not show a positive linear relationshipbetween the number of MA generations and expression(LR, p = 0.14; Fig. 1h) though there was a significant in-crease in median expression (Jh, p = 4.2 × 10⁻⁶).We further investigated whether the expression of TEs
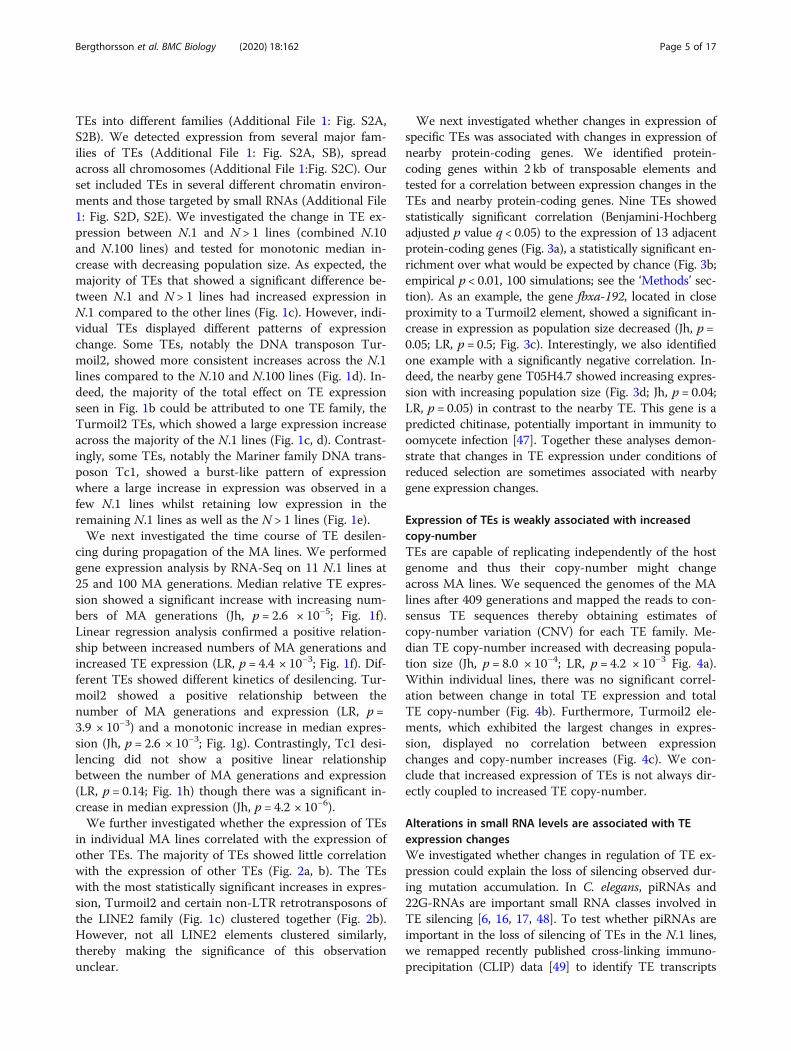
in individual MA lines correlated with the expression ofother TEs. The majority of TEs showed little correlationwith the expression of other TEs (Fig. 2a, b). The TEswith the most statistically significant increases in expres-sion, Turmoil2 and certain non-LTR retrotransposons ofthe LINE2 family (Fig. 1c) clustered together (Fig. 2b).However, not all LINE2 elements clustered similarly,thereby making the significance of this observationunclear.
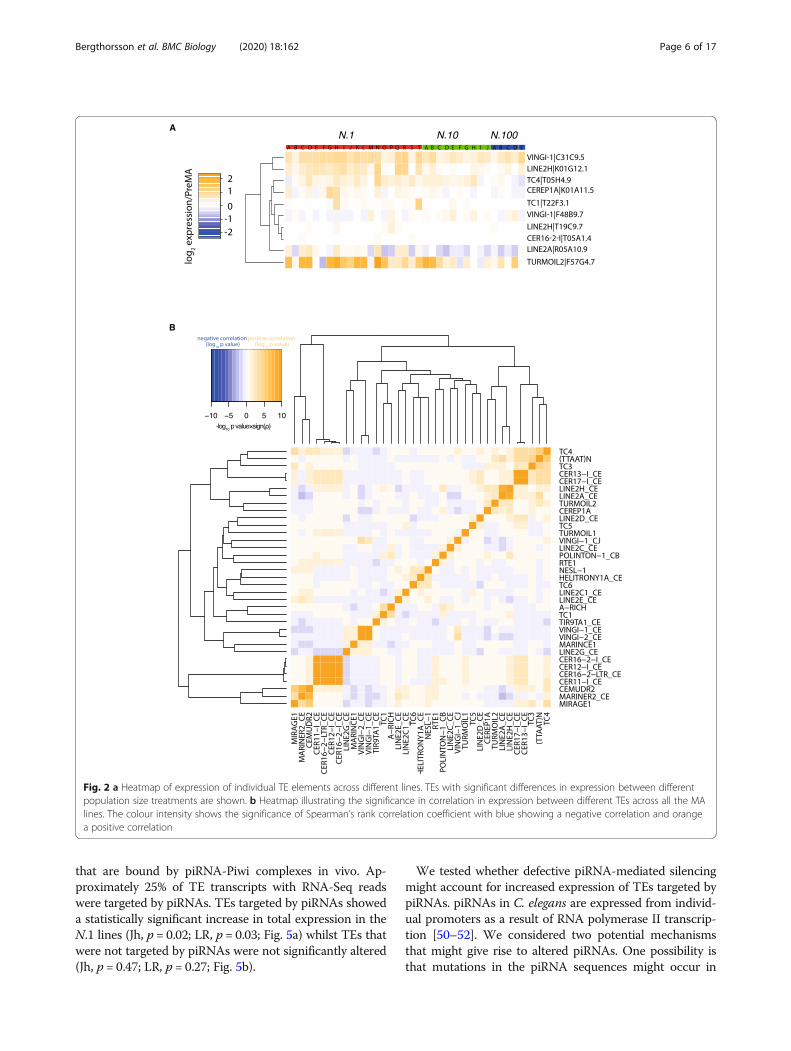
We next investigated whether changes in expression ofspecific TEs was associated with changes in expression ofnearby protein-coding genes. We identified protein-coding genes within 2 kb of transposable elements andtested for a correlation between expression changes in theTEs and nearby protein-coding genes. Nine TEs showedstatistically significant correlation (Benjamini-Hochbergadjusted p value q < 0.05) to the expression of 13 adjacentprotein-coding genes (Fig. 3a), a statistically significant en-richment over what would be expected by chance (Fig. 3b;empirical p < 0.01, 100 simulations; see the ‘Methods’ sec-tion). As an example, the gene fbxa-192, located in closeproximity to a Turmoil2 element, showed a significant in-crease in expression as population size decreased (Jh, p =0.05; LR, p = 0.5; Fig. 3c). Interestingly, we also identifiedone example with a significantly negative correlation. In-deed, the nearby gene T05H4.7 showed increasing expres-sion with increasing population size (Fig. 3d; Jh, p = 0.04;LR, p = 0.05) in contrast to the nearby TE. This gene is apredicted chitinase, potentially important in immunity tooomycete infection [47]. Together these analyses demon-strate that changes in TE expression under conditions ofreduced selection are sometimes associated with nearbygene expression changes.
Expression of TEs is weakly associated with increasedcopy-numberTEs are capable of replicating independently of the hostgenome and thus their copy-number might changeacross MA lines. We sequenced the genomes of the MAlines after 409 generations and mapped the reads to con-sensus TE sequences thereby obtaining estimates ofcopy-number variation (CNV) for each TE family. Me-dian TE copy-number increased with decreasing popula-tion size (Jh, p = 8.0 × 10⁻⁴; LR, p = 4.2 × 10⁻³ Fig. 4a).Within individual lines, there was no significant correl-ation between change in total TE expression and totalTE copy-number (Fig. 4b). Furthermore, Turmoil2 ele-ments, which exhibited the largest changes in expres-sion, displayed no correlation between expressionchanges and copy-number increases (Fig. 4c). We con-clude that increased expression of TEs is not always dir-ectly coupled to increased TE copy-number.
Alterations in small RNA levels are associated with TEexpression changesWe investigated whether changes in regulation of TE ex-pression could explain the loss of silencing observed dur-ing mutation accumulation. In C. elegans, piRNAs and22G-RNAs are important small RNA classes involved inTE silencing [6, 16, 17, 48]. To test whether piRNAs areimportant in the loss of silencing of TEs in the N.1 lines,we remapped recently published cross-linking immuno-precipitation (CLIP) data [49] to identify TE transcripts
Bergthorsson et al. BMC Biology (2020) 18:162 Page 5 of 17
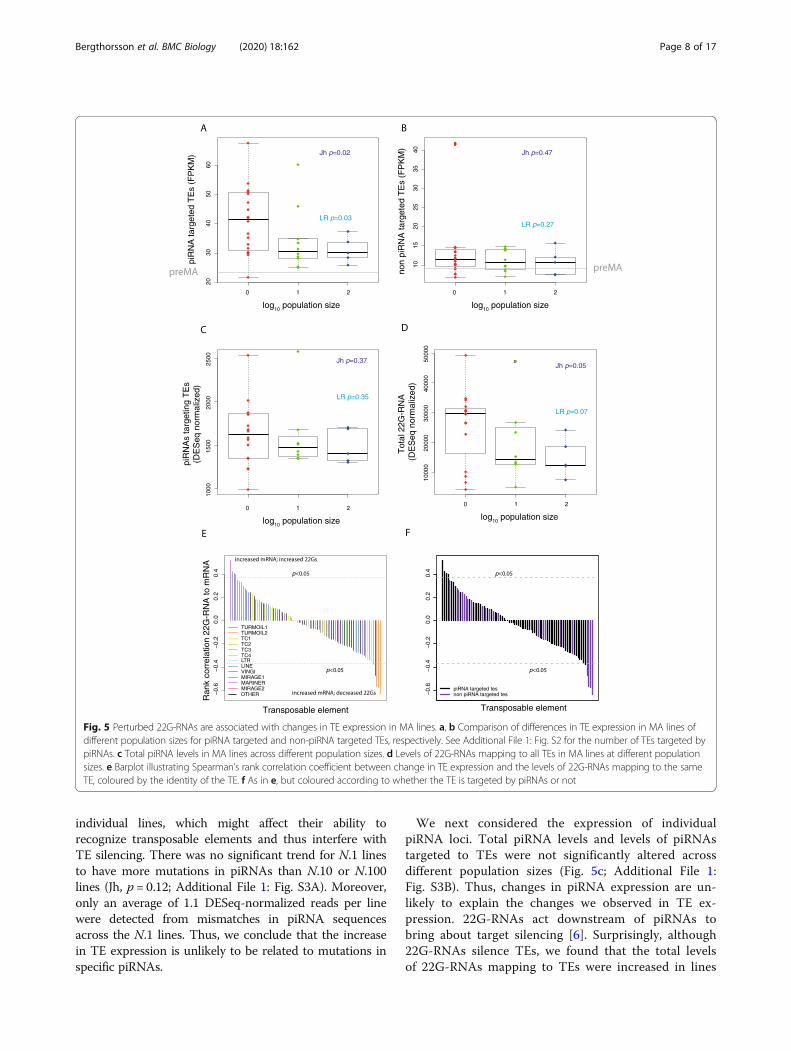
that are bound by piRNA-Piwi complexes in vivo. Ap-proximately 25% of TE transcripts with RNA-Seq readswere targeted by piRNAs. TEs targeted by piRNAs showeda statistically significant increase in total expression in theN.1 lines (Jh, p = 0.02; LR, p = 0.03; Fig. 5a) whilst TEs thatwere not targeted by piRNAs were not significantly altered(Jh, p = 0.47; LR, p = 0.27; Fig. 5b).
We tested whether defective piRNA-mediated silencingmight account for increased expression of TEs targeted bypiRNAs. piRNAs in C. elegans are expressed from individ-ual promoters as a result of RNA polymerase II transcrip-tion [50–52]. We considered two potential mechanismsthat might give rise to altered piRNAs. One possibility isthat mutations in the piRNA sequences might occur in
Fig. 2 a Heatmap of expression of individual TE elements across different lines. TEs with significant differences in expression between differentpopulation size treatments are shown. b Heatmap illustrating the significance in correlation in expression between different TEs across all the MAlines. The colour intensity shows the significance of Spearman’s rank correlation coefficient with blue showing a negative correlation and orangea positive correlation
Bergthorsson et al. BMC Biology (2020) 18:162 Page 6 of 17
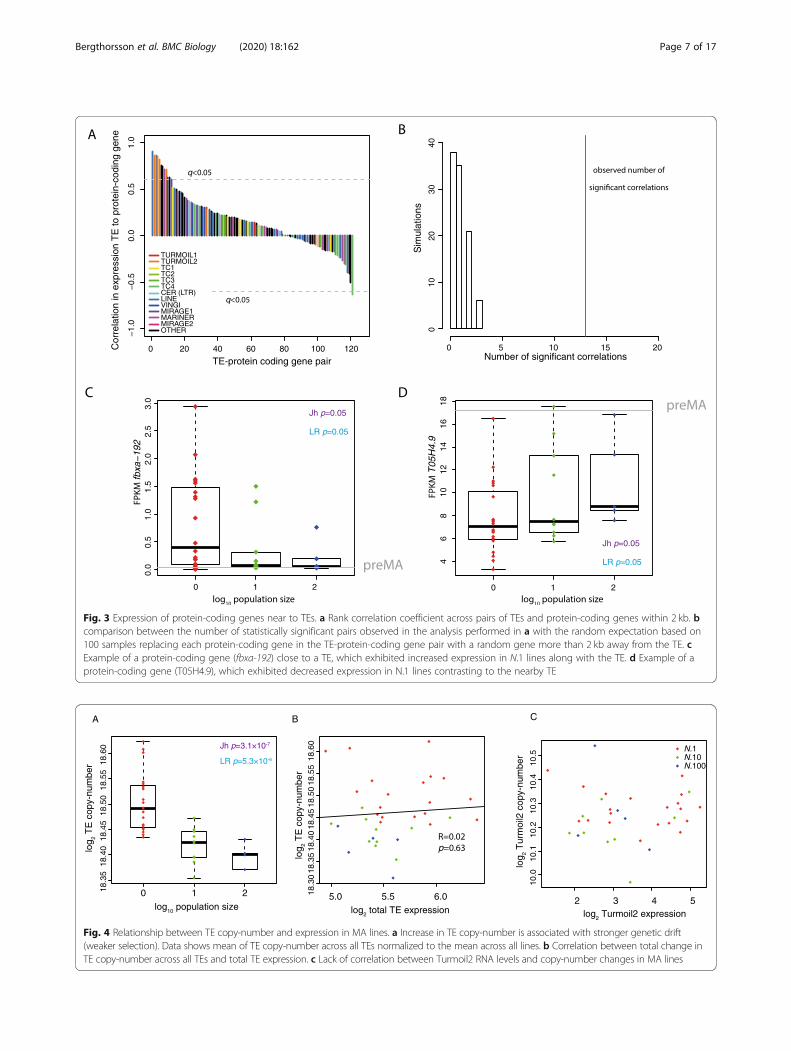
Fig. 3 Expression of protein-coding genes near to TEs. a Rank correlation coefficient across pairs of TEs and protein-coding genes within 2 kb. bcomparison between the number of statistically significant pairs observed in the analysis performed in a with the random expectation based on100 samples replacing each protein-coding gene in the TE-protein-coding gene pair with a random gene more than 2 kb away from the TE. cExample of a protein-coding gene (fbxa-192) close to a TE, which exhibited increased expression in N.1 lines along with the TE. d Example of aprotein-coding gene (T05H4.9), which exhibited decreased expression in N.1 lines contrasting to the nearby TE
Fig. 4 Relationship between TE copy-number and expression in MA lines. a Increase in TE copy-number is associated with stronger genetic drift(weaker selection). Data shows mean of TE copy-number across all TEs normalized to the mean across all lines. b Correlation between total change inTE copy-number across all TEs and total TE expression. c Lack of correlation between Turmoil2 RNA levels and copy-number changes in MA lines
Bergthorsson et al. BMC Biology (2020) 18:162 Page 7 of 17
individual lines, which might affect their ability torecognize transposable elements and thus interfere withTE silencing. There was no significant trend for N.1 linesto have more mutations in piRNAs than N.10 or N.100lines (Jh, p = 0.12; Additional File 1: Fig. S3A). Moreover,only an average of 1.1 DESeq-normalized reads per linewere detected from mismatches in piRNA sequencesacross the N.1 lines. Thus, we conclude that the increasein TE expression is unlikely to be related to mutations inspecific piRNAs.
We next considered the expression of individualpiRNA loci. Total piRNA levels and levels of piRNAstargeted to TEs were not significantly altered acrossdifferent population sizes (Fig. 5c; Additional File 1:Fig. S3B). Thus, changes in piRNA expression are un-likely to explain the changes we observed in TE ex-pression. 22G-RNAs act downstream of piRNAs tobring about target silencing [6]. Surprisingly, although22G-RNAs silence TEs, we found that the total levelsof 22G-RNAs mapping to TEs were increased in lines
Fig. 5 Perturbed 22G-RNAs are associated with changes in TE expression in MA lines. a, b Comparison of differences in TE expression in MA lines ofdifferent population sizes for piRNA targeted and non-piRNA targeted TEs, respectively. See Additional File 1: Fig. S2 for the number of TEs targeted bypiRNAs. c Total piRNA levels in MA lines across different population sizes. d Levels of 22G-RNAs mapping to all TEs in MA lines at different populationsizes. e Barplot illustrating Spearman’s rank correlation coefficient between change in TE expression and the levels of 22G-RNAs mapping to the sameTE, coloured by the identity of the TE. f As in e, but coloured according to whether the TE is targeted by piRNAs or not
Bergthorsson et al. BMC Biology (2020) 18:162 Page 8 of 17
maintained at smaller population sizes, although thisincrease was only marginally significant (Jh, p = 0.05;LR, p = 0.07; Fig. 5d). 22G-RNA levels mapping toTEs targeted by piRNAs behaved similarly (AdditionalFile 1: Fig. S3C). To examine this in more detail, weanalysed 22G-RNAs at individual TEs. We investi-gated the correlation between TE expression and22G-RNA levels across all the different lines, usingSpearman’s rank correlation coefficient to avoid mak-ing the assumption of linearity (Fig. 5d). An approxi-mately equal number of TEs demonstrated positivecorrelations (22G-RNA levels increased and expres-sion also increased) and negative correlation coeffi-cients (22G-RNA levels decreased with expressionincreased; Fig. 5e). This suggests that at some TEloci, 22G-RNA levels increase in response to in-creased TE expression, whilst in others, reduced 22G-RNA levels are associated with increased TE expres-sion. Turmoil2 elements were particularly prominentamongst TEs displaying increased expression and re-duced 22G-RNA levels (Fig. 5e). Consistently, totalTurmoil2 22G-RNAs showed a negative correlationwith changes in 22G-RNA levels relative to the parentline (LR, p = 2.0 × 10⁻⁵; Additional File 1: Fig. S3D).Notably, four out of the five TEs with clear negativecorrelation between expression and 22G-RNA levelswere piRNA targets (Fig. 5f), a statistically significantenrichment relative to all TEs (Fisher’s exact test, p =0.035). This suggests that loss of piRNA targetingmight be responsible for increased expression of someTEs due to reduced levels of 22G-RNAs. 22G-RNAsinduced downstream of piRNAs bind to HRDE-1 andWAGO-1 and consistently, HRDE-1 and WAGO-1targets identified on the basis of immunoprecipitationexperiments [14, 53] included TEs with increased ex-pression and reduced 22G-RNA levels (Additional File1: Fig. S3E, S3F). Furthermore, both WAGO-1 andHRDE-1-targeted TEs showed increased expression aspopulation size decreased (Additional File 1: Fig. S3G,SH).
Chromatin environment is associated with therelationship between 22G-RNA levels and TE expression22G-RNAs interact with chromatin-modifying factors tocontrol expression of TEs [43]. piRNA-mediated silencinghas been directly linked to the generation of H3K9me2/3-marked nucleosomes (“classical heterochromatin”), andthis has been proposed to be important for transcriptionalsilencing induced by piRNAs [13, 14, 43, 54]. Additionally,it is becoming clear that a large proportion of the auto-somal DNA in C. elegans can be divided into two categor-ies. “Active” domains, containing H3K36me3, containgenes that are expressed in the germline and broadlyexpressed across somatic tissue. “Regulated” domains hold
H3K27me3-marked nucleosomes and contain genes thatare silent in the germline with restricted expression in spe-cific tissues or developmental stages [55–57]. These do-mains are largely stable through development, includingin the adult germline [55, 58]. These chromatin domainsare not found on the X chromosome, which has insteadan alternative configuration of chromatin enriched inH4K20 mono-methylation and H3K27 methylation due tothe activity of the dosage compensation complex [59]. Weexamined the influence of these types of chromatin on theresponse of TEs to mutation accumulation.TEs on the X chromosome showed no difference in
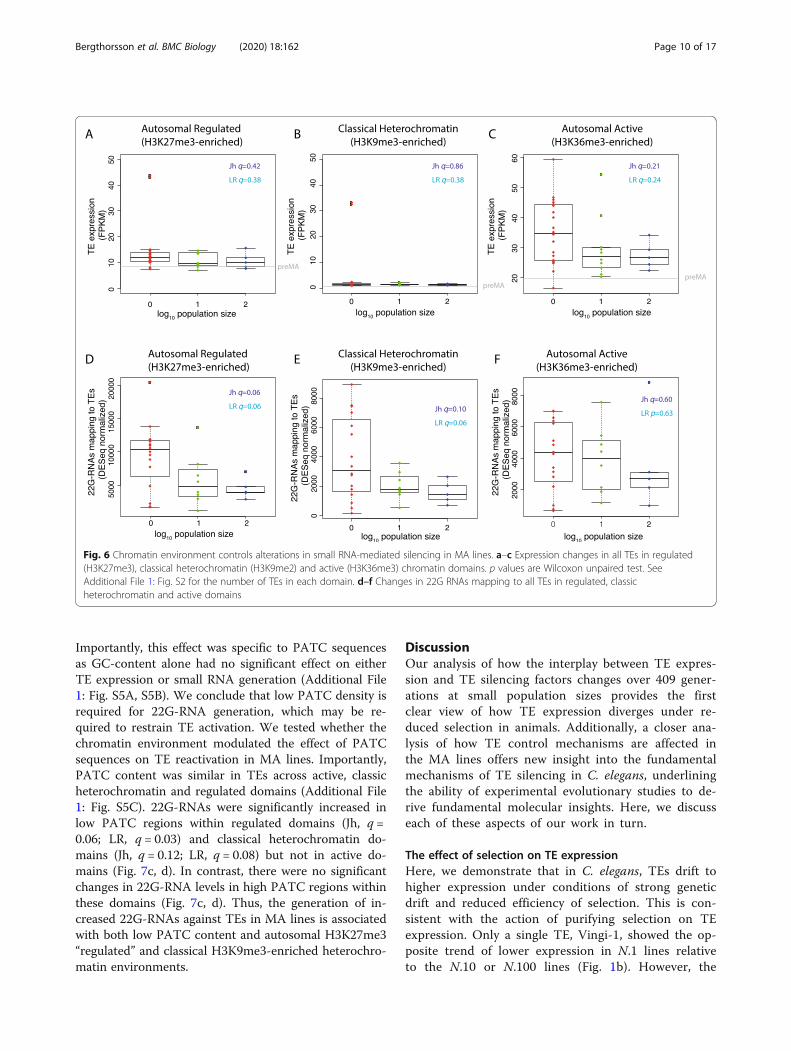
expression between N.1 lines and N.100 lines (AdditionalFile 1: Fig. S4A, S4B). There was also no significant dif-ference in TE expression across population size in auto-somal regulated domains, classical heterochromatin oractive domains (Benjamini-Hochberg corrected p valueq > 0.1; Fig. 6a–c). The rare examples of N.1 lines show-ing significantly higher expression of TEs in classicalheterochromatin corresponded to lines in which Tc1 re-activation occurred, consistent with enrichment of Tc1elements within these regions [43]. However, TEs in ac-tive domains had significantly higher expression in theN.1 than all N > 1 lines together (Wilcoxon unpairedtest, p = 0.02).We next examined 22G-RNAs mapping to TEs across
different chromatin domains. TEs in H3K27me3-enriched autosomal regulated domains showed signifi-cantly (Benjamini-Hochberg corrected p value q < 0.1)increased levels of 22G-RNAs as population size de-creased (Jh Benjamini-Hochberg adjusted p value q =0.06; LR, q = 0.06). TEs in classical heterochromatin alsoshowed significantly increased levels (Jh, q = 0.06; LR,q = 0.10). However, in active domains, there was no sig-nificant change in 22G-RNA levels (Fig. 6d–f). Thus, in-creased 22G-RNAs occur predominantly in TEs withinsilent autosomal chromatin, marked by eitherH3K27me3 or H3K9me3.
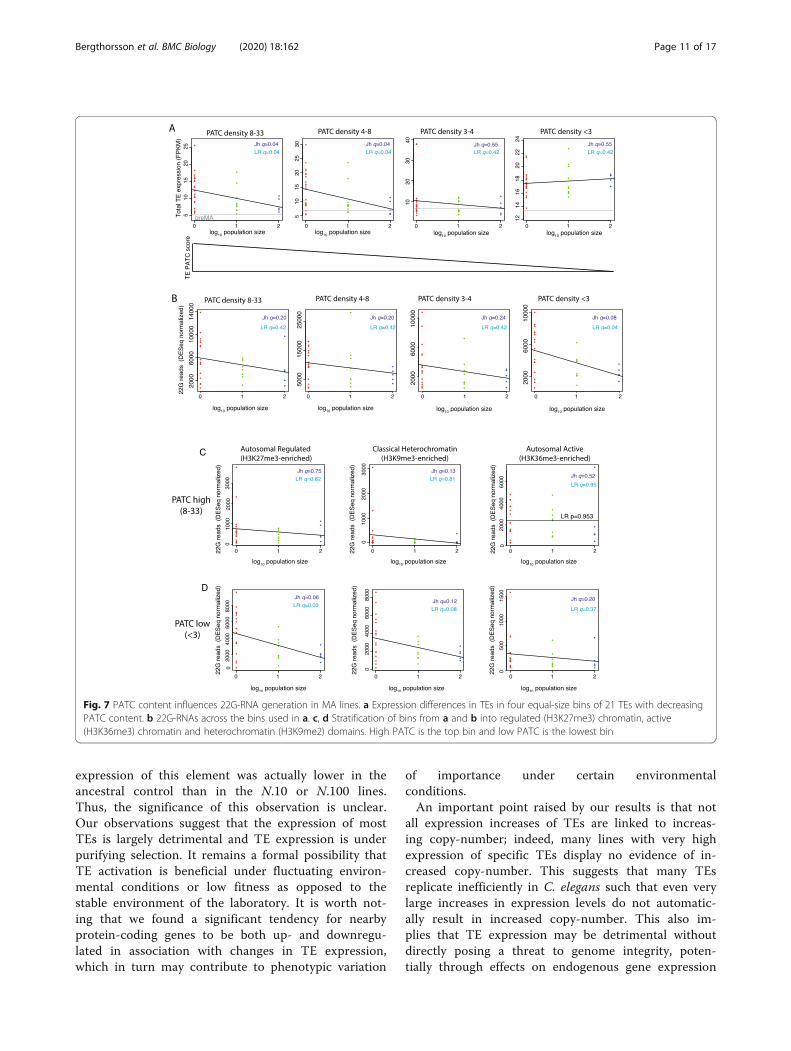
AT-rich sequences in TEs reduce the generation of 22G-RNAsA recent study has demonstrated that silencing of bothtransgenes and endogenous genes by 22G-RNAs isinhibited by a high content of periodic repeats of AT-rich sequences, known as PATCs [60]. We tested howPATC density within TEs was associated with changesin their expression under reduced selection. High PATCdensity corresponded to significant (Benjamini-Hoch-berg adjusted p value q < 0.1) reactivation of TEs (Jh, q =0.04; LR, q = 0.04) whereas TEs with low PATC densitydid not show an increase in expression (Fig. 7a). Con-trastingly, only TEs with low PATC density showed sig-nificantly increased 22G-RNAs in N.1 lines relative toN.10 and N.100 (Jh, q = 0.08; LR, q = 0.04; Fig. 7b).
Bergthorsson et al. BMC Biology (2020) 18:162 Page 9 of 17
Importantly, this effect was specific to PATC sequencesas GC-content alone had no significant effect on eitherTE expression or small RNA generation (Additional File1: Fig. S5A, S5B). We conclude that low PATC density isrequired for 22G-RNA generation, which may be re-quired to restrain TE activation. We tested whether thechromatin environment modulated the effect of PATCsequences on TE reactivation in MA lines. Importantly,PATC content was similar in TEs across active, classicheterochromatin and regulated domains (Additional File1: Fig. S5C). 22G-RNAs were significantly increased inlow PATC regions within regulated domains (Jh, q =0.06; LR, q = 0.03) and classical heterochromatin do-mains (Jh, q = 0.12; LR, q = 0.08) but not in active do-mains (Fig. 7c, d). In contrast, there were no significantchanges in 22G-RNA levels in high PATC regions withinthese domains (Fig. 7c, d). Thus, the generation of in-creased 22G-RNAs against TEs in MA lines is associatedwith both low PATC content and autosomal H3K27me3“regulated” and classical H3K9me3-enriched heterochro-matin environments.
DiscussionOur analysis of how the interplay between TE expres-sion and TE silencing factors changes over 409 gener-ations at small population sizes provides the firstclear view of how TE expression diverges under re-duced selection in animals. Additionally, a closer ana-lysis of how TE control mechanisms are affected inthe MA lines offers new insight into the fundamentalmechanisms of TE silencing in C. elegans, underliningthe ability of experimental evolutionary studies to de-rive fundamental molecular insights. Here, we discusseach of these aspects of our work in turn.
The effect of selection on TE expressionHere, we demonstrate that in C. elegans, TEs drift tohigher expression under conditions of strong geneticdrift and reduced efficiency of selection. This is con-sistent with the action of purifying selection on TEexpression. Only a single TE, Vingi-1, showed the op-posite trend of lower expression in N.1 lines relativeto the N.10 or N.100 lines (Fig. 1b). However, the
Fig. 6 Chromatin environment controls alterations in small RNA-mediated silencing in MA lines. a–c Expression changes in all TEs in regulated(H3K27me3), classical heterochromatin (H3K9me2) and active (H3K36me3) chromatin domains. p values are Wilcoxon unpaired test. SeeAdditional File 1: Fig. S2 for the number of TEs in each domain. d–f Changes in 22G RNAs mapping to all TEs in regulated, classicheterochromatin and active domains
Bergthorsson et al. BMC Biology (2020) 18:162 Page 10 of 17
expression of this element was actually lower in theancestral control than in the N.10 or N.100 lines.Thus, the significance of this observation is unclear.Our observations suggest that the expression of mostTEs is largely detrimental and TE expression is underpurifying selection. It remains a formal possibility thatTE activation is beneficial under fluctuating environ-mental conditions or low fitness as opposed to thestable environment of the laboratory. It is worth not-ing that we found a significant tendency for nearbyprotein-coding genes to be both up- and downregu-lated in association with changes in TE expression,which in turn may contribute to phenotypic variation
of importance under certain environmentalconditions.An important point raised by our results is that not
all expression increases of TEs are linked to increas-ing copy-number; indeed, many lines with very highexpression of specific TEs display no evidence of in-creased copy-number. This suggests that many TEsreplicate inefficiently in C. elegans such that even verylarge increases in expression levels do not automatic-ally result in increased copy-number. This also im-plies that TE expression may be detrimental withoutdirectly posing a threat to genome integrity, poten-tially through effects on endogenous gene expression
Fig. 7 PATC content influences 22G-RNA generation in MA lines. a Expression differences in TEs in four equal-size bins of 21 TEs with decreasingPATC content. b 22G-RNAs across the bins used in a. c, d Stratification of bins from a and b into regulated (H3K27me3) chromatin, active(H3K36me3) chromatin and heterochromatin (H3K9me2) domains. High PATC is the top bin and low PATC is the lowest bin
Bergthorsson et al. BMC Biology (2020) 18:162 Page 11 of 17
networks or through toxicity of repetitive RNA withinthe cell [61].Phenotypic analyses of previous C. elegans MA experi-
ments suggest that the decline in fitness in N = 1 linesresults primarily from a few mutations with large effects[44, 62–65]. Similar results have been obtained in ex-perimental evolution studies in D. melanogaster [66] andbacteria [67, 68]. In our study, purifying selection at lar-ger population sizes (N.10 and N.100) would eliminatesuch large-effect mutations and indeed, our N.10 andN.100 lines exhibited no evidence of fitness reductionover the course of successive bottlenecking for 409 gen-erations [44, 62]. Analysis of gene expression data fromMA experiments from C. elegans, D. melanogaster andS. cerevisiae concluded that large effect mutations arealso responsible for changes in protein-coding gene ex-pression [46]. However, our results for TE expression donot seem to fit with this model because overall TE ex-pression, which is largely driven by Turmoil2 and non-LTR elements (see Fig. 1), increases gradually with timeacross the N.1 lines and is also increased, although lessso, in the N.10 and N.100 lines. The expression of Tc1 isan exception to the overall trend as it is not affected inN.10 or N.100 lines but a small number of N.1 linesshow markedly increased Tc1 expression. Thus, Tc1 re-activation may be dominated by a few mutations withlarge effect. This difference might be related to the dif-ferent mechanism of silencing of Tc1 compared to Tur-moil2 elements as discussed further below.
Weakened piRNA silencing is responsible for increasedexpression of TEs under relaxed selectionOur investigations of the molecular mechanisms behindreduced silencing of TEs in MA lines strongly suggestthat defective piRNA silencing is a major culprit. OnlypiRNA-targeted TEs show significantly increased expres-sion in MA lines, and, whilst piRNAs themselves do notseem to change significantly in MA lines, the levels of22G-RNAs that act as effectors of piRNA silencing areperturbed at the Turmoil2 TEs that show increased ex-pression. Why is piRNA silencing so vulnerable to muta-tion accumulation? TE silencing and activation inorganisms are likely in a precarious equilibrium due to aconstant evolutionary arms race between TEs and theirhost genome. As a result, many mutations could con-verge on the piRNA pathway to throw TE silencing outof balance.
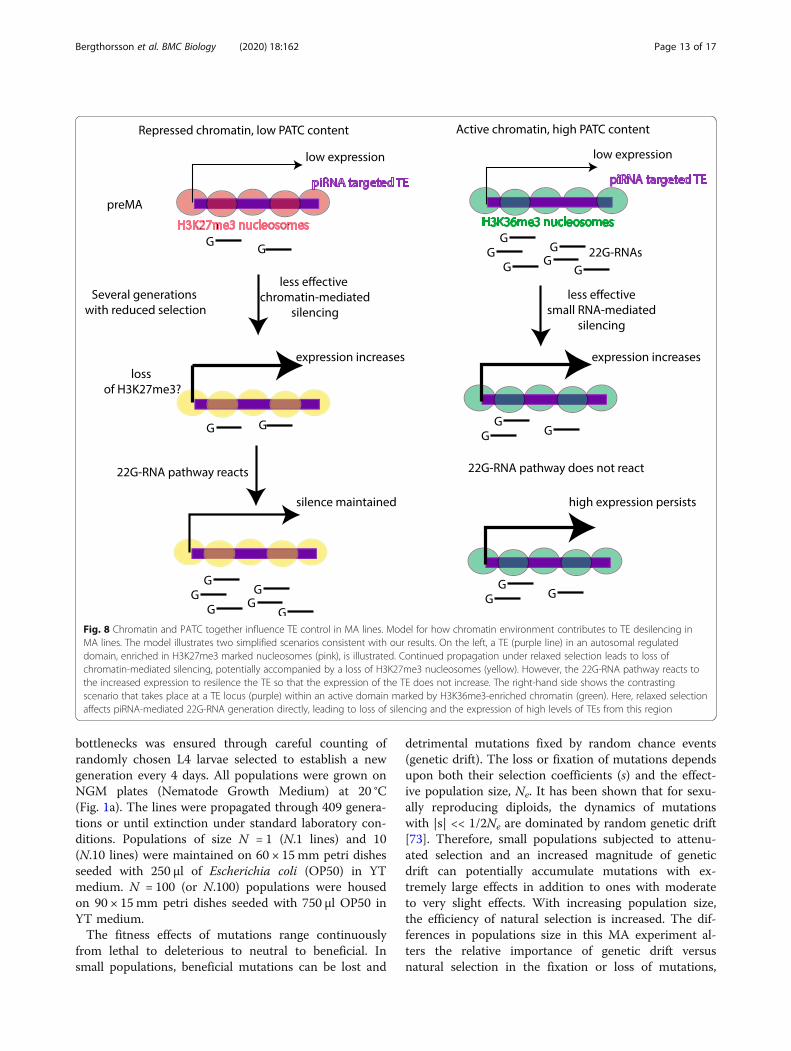
New insights into the role of chromatin in the piRNApathwayOur analysis of how mutation accumulation affects TEsilencing provides novel insights into how the chromatinenvironment of TEs might affect piRNA-mediated silen-cing in C. elegans (Fig. 8). TEs in autosomal regulated
domains, enriched in H3K27me3-marked nucleosomes,and in classical heterochromatin marked by H3K9me3,are less prone to reactivation than those in active chro-matin regions. Mechanistically, we propose that this isbecause 22G-RNA levels in repressive chromatin regionsare stable or even increased, whilst 22G-RNA levelsmapping to TEs in active regions are reduced in MAlines with increased expression. This result may also ex-plain why reactivation of Tc1 elements occurs less fre-quently than Turmoil2 elements, because Tc1 elementsare predominantly located in repressed domains and aretherefore silenced more robustly.What is the mechanism whereby silencing memory is
supported in repressed chromatin regions? The simplestpossibility is that generation of 22G-RNAs is directly pro-moted by repressive chromatin modifications. In line withthis possibility, a mutually reinforcing loop between H3K9methylation and small RNAs is well documented in fissionyeast [69], and H3K9 methylation factors contribute to si-lencing of transgenes in C. elegans [13, 14, 43, 54] al-though the situation is more complicated for endogenousgenes [70]. Our observations hold equally well for auto-somal H3K27me3-repressed chromatin. These observa-tions are consistent with a previous study reporting thatpiRNA targeting was correlated with increasedH3K27me3 levels mediated by the nuclear silencing factorNRDE2 [71]. We propose that the nuclear small RNApathway responds differently depending on whether sur-rounding genes are active or repressed to detect and quellaberrant gene activation. This model will be of interest forfurther mechanistic investigation of small-RNA mediatedsilencing in C. elegans.
ConclusionsThe control of the expression of specific TEs is vulner-able to the effects of mutation, resulting in increased ex-pression over 409 generations of growth under minimalpopulation size. The vulnerability of TEs to reactivationdepends their genomic location and silencing mechan-ism, as well as the sequence properties of the TE. Ourresearch acts as a key starting point to understand thebalance between selection, genetic drift in shaping TEdiversity within and across species.
MethodsSpontaneous mutation accumulation (MA) experiment atvarying population sizes and its theoreticalunderpinningsThe descendants of a single wild-type Bristol (N2) herm-aphrodite were used to establish 35 MA lines. TwentyMA lines were propagated through single individual des-cent, whilst ten lines were bottlenecked to ten individ-uals, and five lines were bottlenecked to 100 individualsevery generation [44, 62, 72]. The size of these
Bergthorsson et al. BMC Biology (2020) 18:162 Page 12 of 17
bottlenecks was ensured through careful counting ofrandomly chosen L4 larvae selected to establish a newgeneration every 4 days. All populations were grown onNGM plates (Nematode Growth Medium) at 20 °C(Fig. 1a). The lines were propagated through 409 genera-tions or until extinction under standard laboratory con-ditions. Populations of size N = 1 (N.1 lines) and 10(N.10 lines) were maintained on 60 × 15 mm petri dishesseeded with 250 μl of Escherichia coli (OP50) in YTmedium. N = 100 (or N.100) populations were housedon 90 × 15mm petri dishes seeded with 750 μl OP50 inYT medium.The fitness effects of mutations range continuously
from lethal to deleterious to neutral to beneficial. Insmall populations, beneficial mutations can be lost and
detrimental mutations fixed by random chance events(genetic drift). The loss or fixation of mutations dependsupon both their selection coefficients (s) and the effect-ive population size, Ne. It has been shown that for sexu-ally reproducing diploids, the dynamics of mutationswith |s| << 1/2Ne are dominated by random genetic drift[73]. Therefore, small populations subjected to attenu-ated selection and an increased magnitude of geneticdrift can potentially accumulate mutations with ex-tremely large effects in addition to ones with moderateto very slight effects. With increasing population size,the efficiency of natural selection is increased. The dif-ferences in populations size in this MA experiment al-ters the relative importance of genetic drift versusnatural selection in the fixation or loss of mutations,
Fig. 8 Chromatin and PATC together influence TE control in MA lines. Model for how chromatin environment contributes to TE desilencing inMA lines. The model illustrates two simplified scenarios consistent with our results. On the left, a TE (purple line) in an autosomal regulateddomain, enriched in H3K27me3 marked nucleosomes (pink), is illustrated. Continued propagation under relaxed selection leads to loss ofchromatin-mediated silencing, potentially accompanied by a loss of H3K27me3 nucleosomes (yellow). However, the 22G-RNA pathway reacts tothe increased expression to resilence the TE so that the expression of the TE does not increase. The right-hand side shows the contrastingscenario that takes place at a TE locus (purple) within an active domain marked by H3K36me3-enriched chromatin (green). Here, relaxed selectionaffects piRNA-mediated 22G-RNA generation directly, leading to loss of silencing and the expression of high levels of TEs from this region
Bergthorsson et al. BMC Biology (2020) 18:162 Page 13 of 17
with genetic drift having the greatest influence in N = 1lines and natural selection having greater influence inpopulations that were bottlenecked at 10 and 100 indi-viduals each generation.
RNA library preparation, sequencing and analysis oftranscript abundanceThe library preparation and RNA-sequencing proce-dures have previously been described in detail [72]. Toprepare RNA from lines following 409 generations ofmutation accumulation (all lines) or 25 or 100 genera-tions (N.1 lines only), we isolated one, two and three in-dividuals each of the N.1, N.10 and N.100 lines,respectively. These 55 worms, as well as one individualfrom the ancestral control population (preMA), wereeach sequestered to NGM plates seeded with OP50,where they were allowed to self-fertilize and reproduceat 20 °C. Three offspring worms at the L4 larval stagewere isolated from each of the F1 populations to serveas biological replicates. These 168 individual worm sam-ples were allowed to reproduce for three generations toyield enough tissue for RNA extraction. A standardbleaching protocol was used to collect eggs from gravidadults in order to generate synchronized populations ofL1 larvae. Total RNA was isolated from L1 larvae via theQiagen RNeasy Mini Kit. The Nanodrop 2000, Qubit 3.0Fluorometer and an Agilent RNA Analyzer were used toevaluate the quality of the RNA samples, and an Illu-mina TruSeq RNA Library Prep Kit v2 was used withstandard procedures to prepare the RNA sequencing li-braries for each sample at the Texas A&M UniversityGenomics and Bioinformatics Services Center. The RNAwas fragmented and Illumina adapters were annealed foramplification. Size-selected cDNA fragments were iso-lated via a Qiagen Gel Extraction Kit. Finally, sequencingwas performed on the Illumina HiSeq 4000 platformwith default quality filters.Demultiplexing and prefiltering of the sequencing
reads was performed based on default Illumina QC pro-tocols. Reads containing abnormally short insert lengthswere removed, and adapters were discarded from thereads. The raw RNA-sequencing reads in fastq formatwere aligned to the protein-coding transcriptome of C.elegans (Wormbase reference N2 genome versionWS247) using TopHat [74] via the “very sensitive” bow-tie2 algorithm with a maximum of one mismatch in theanchor region for each spliced alignment and a mini-mum and maximum intron length of 20 and 3000 bp, re-spectively. Cufflinks [75] with default settings and geneannotations from the N2 genome version WS247 wasused to estimate the relative transcript abundance foreach protein-coding gene. All following analyses were fo-cused on FPKM values calculated on the per gene level.The relative transcript abundances (FPKM) from the
three biological replicates for each original sample wereaveraged to get mean relative transcript abundance foreach gene in that sample.
Small RNA sequencingMA lines were synchronized using hypochlorite treat-ment and embryos were isolated after 12 h. RNA was ex-tracted using TRIzol and small RNA libraries wereprepared using the Illumina Small RNA sequencing kitas described previously [18]. Small RNAs were alignedto a genome built using bowtie from a fasta file contain-ing all piRNAs, miRNAs, ncRNAs and genes includingTEs, extracted from Wormbase (WS264; ce11), requiringperfect mapping. Reads mapping to the sense strand ofncRNAs and miRNAs were extracted using bedtoolsintersect –c –S. We used DEseq using ncRNAs andmiRNAs to extract size factors. 22G-RNAs mapping toTEs and genes were extracted using a custom Perl scriptand the number of 22G-RNAs mapping antisense toeach gene and TE was then counted using bedtoolsintersect –c –s. The 22G-RNAs were then normalized tothe size factors from ncRNAs and miRNAs combined.
TE copy-number analysisDNA sequence reads were aligned to a genome builtusing bowtie2-build from TE consensus sequences ex-tracted from repbase combined with all coding se-quences. Bowtie2 was used to map PE reads to thisgenome and the read count mapping to each CDS or TEwas obtained using bedtools intersect –c.
Computational analysis of TE expression and small RNAanalysisTEs from WS264 were annotated using Repeatmasker[76]. All data analysis was conducted using the R envir-onment for statistical analysis (www.Rproject.com). De-tails of the individual analyses are available on theGithub page associated with this project (https://github.com/PeterSarkies-LMS/TEMALs_repo). Previously pub-lished datasets containing chromatin domain annota-tions from Early Embryo ChiP-Seq were taken fromEvans et al. (2016) updated to WS264 using liftover(https://genome.ucsc.edu/). The average PATC score foreach TE was calculated by taking the average PATCscore across the element from per-base sliding windowgenome-wide PATC scores from [60]. To identifyprotein-coding genes near to TEs, we used the functionwindowbed from the Bedtools suite using a 2-kbwindow.
Statistical analysesTo test if TE expression was significantly different acrossincreasing population size, we used the Jonckheere test,a non-parametric test that takes account of a known
Bergthorsson et al. BMC Biology (2020) 18:162 Page 14 of 17
ordering across the samples [77]. We implemented theJonckheere test using the package clinfun in R. Add-itionally, to investigate whether the trend could be de-scribed linearly, we computed a standard linear modelusing the function lm in R. To compare if N.1 lines weredifferent from all N > 1 lines, we used the Wilcoxon-unpaired test to avoid the assumption of normality. Wecalculated the correlation between 22G-RNA levels andexpression of individual TEs using Spearman’s rank cor-relation coefficient, which does not assume linearity.Similarly, the correlation between TE expression changesand expression changes of nearby genes were obtainedusing Spearman’s rank correlation coefficient. Signifi-cance was defined at 0.05 after multiple test correctionusing the Benjamini-Hochberg procedure. To estimatethe number of significant correlations between TE andnearby genes that might be expected by chance, we re-placed each protein-coding gene with a random protein-coding gene greater than 2 kb distant. We then calcu-lated the correlation coefficients for this random set andtabulated the number of significant correlations. We re-peated this process 100 times to obtain a simulated dis-tribution and compared this to the observed number ofsignificant correlations.
Supplementary informationThe online version contains supplementary material available at https://doi.org/10.1186/s12915-020-00897-y.
Additional file 1: Figure S1. Quantitative analysis of TE variabilityacross different population sizes. A Mean change in expression relative tothe ancestral control across all TEs for each line. B Violin plots showingdistribution of changes in TE expression across all TEs for each line. Linesare ordered by increasing mean TE expression change (L to R). C Fanofactor of individual TE transcript levels across all lines of the indicatedpopulation size. D Fano factor in individual protein-coding gene tran-script levels across all lines of the indicated population size. E Fano factorof TE transcript levels in 1000 samples of five N.1 lines, 253 samples offive N.10 lines [the maximum] and all five N.100 lines. F Total variance intranscript level differences between each TE and its corresponding valuein the starting population across lines of different population size. G Totalvariance of transcript level differences between each protein-coding geneand the starting population in lines of the indicated population size. Box-plots for A-D are as in Fig. 1D. H Variance in TE transcript changes relativeto starting population compared to the variance in protein-coding genetranscript changes in the same line. Figure S2. Characteristics of C. ele-gans TEs analysed in this study. A Base pairs covered by TE families forwhich robust RNA-Seq coverage was obtained in at least one line (ana-lysed in this study), grouped by family and coloured according to type ofTE. B Number of elements of each TE family found, coloured accordingto type of TE. C Distribution of TEs analysed in this study across chromo-somes. D Number of TEs analysed in this study targeted by different smallRNA pathways. E Number of TEs analysed in this study in different chro-matin domains. Figure S3. Further analysis of small RNA mediated TEcontrol in MA lines. A Number of piRNA loci containing a mismatch tothe genome of the parental line across different population sizes of MAlines, as assessed by small RNA sequencing. B Total piRNA expressionacross lines of different population sizes. C 22G-RNAs targeted to TEs tar-geted by piRNAs across different population sizes. D Scatterplot compar-ing 22G-RNA levels and mRNA levels for Turmoil2 elements across alllines. E Spearman’s rank correlation coefficient between expressionchanges and 22G-RNA levels for different TEs across all lines, coloured by
HRDE-1 targets. F Spearman’s rank correlation coefficient between expres-sion changes and 22G-RNA levels for different TEs across all lines,coloured by WAGO-1 targets. G Total expression changes of TEs targetedby HRDE-1 across different population sizes. H Total expression changesof TEs targeted by WAGO-1 across different population sizes. Figure S4.TEs on the X chromosome are not upregulated in MA lines. A Expressionof TEs located on autosomes across different population sizes. B Expres-sion of TEs located on the X chromosome across different populationsizes. See Additional File 1: Fig. S2 for the numbers of TEs on eachchromosome. Figure S5. Further analysis of the effect of sequence fea-tures on TE desilencing in MA lines. A GC-content does not affect reacti-vation of TEs in the N.1 lines. Bins with high to low GC-content, left toright. There are no significant (q < 0.1) trends in any category. Regressionlines were therefore omitted for clarity. B GC-content does not affect thechange in 22G-RNA levels. Bins with high to low-GC content, left to right.There are no significant trends in any category so regression lines wereomitted as in A. C No clear difference in the proportion of TEs from dif-ferent chromatin domains within bins of different PATC content. D Ex-pression of TEs from regulated, heterochromatic and active chromatinregions in the top PATC bin. E Expression of TEs from regulated, hetero-chromatic and active chromatin regions in the lowest PATC bin. (PDF2643 kb)
Additional file 2. Table showing change in median expression ofindividual transposable elements in MA lines. (CSV 8 kb)
AcknowledgementsWe thank members of the Sarkies and Katju laboratories for helpfuldiscussions. We thank Dr. Tobias Warnecke and Dr. Michaelis Barkoulas forhelpful discussions and suggestions for analyses. We thank the LMSsequencing facility for sequencing small RNA libraries.
Authors’ contributionsConceptualization: UB,VK,PS. Acquisition of data: TB,TB,AK, CJS, PS. Formalanalysis: UB, AK, PS. Writing and editing: UB, VK, PS. All authors read andapproved the final manuscript.
FundingThis work was supported by the UK Medical Research Council (PS: MC-A652-5PY80 ‘Epigenetics and Evolution’) and the National Science Foundationgrant (VK: MCB-1565844). UB and VK were additionally supported by start-upfunds from the Department of Veterinary Integrative Biosciences, College ofVeterinary Medicine and Biomedical Sciences at Texas A&M University.
Availability of data and materialsRNA sequencing for N.1, N.10 and N.100 lines after 409 generations isavailable from GEO GSE112821 [72]; RNA sequencing for N.1 lines after 25and 100 generations is available from the SRA PRJNA553063 [78]; DNAsequencing for N.1, N.10 and N.100 lines after 409 generations is availablefrom SRA PRJNA448413 [72]; small RNA sequencing of N.1, N.10 and N.100lines generated in this study is available from the SRA PRJNA656266; and C.elegans lines are available from V. Katju upon request. Lines will also beavailable in the CGC public repository once deposition becomes possible.R code used to generate the figures in this manuscript along with processedfiles used to generate the figures have been uploaded to a GitHubrepository https://github.com/PeterSarkies-LMS/TEMALs_repo
Ethics approval and consent to participateNot applicable
Consent for publicationNot applicable
Competing interestsThe authors declare no competing interests.
Author details1Department of Veterinary Integrative Biosciences, Texas A&M University,College Station, TX 77845, USA. 2MRC London Institute of Medical Sciences,Du Cane Road, London W12 0NN, UK. 3Institute of Clinical Sciences, ImperialCollege London, Du Cane Road, London W12 0NN, UK. 4Present Address:
Bergthorsson et al. BMC Biology (2020) 18:162 Page 15 of 17
Intituto Gulbenkian de Ciencia, Rua da Quinta Grande, 6, 2780-156 Oeiras,Portugal. 5Present Address: Centre for Genomic Regulation, PRBB Building,08003 Barcelona, Spain.
Received: 7 April 2020 Accepted: 13 October 2020
References1. Chuong EB, Elde NC, Feschotte C. Regulatory activities of transposable
elements: from conflicts to benefits. Nature Reviews Genetics. 2017:71–86.https://doi.org/10.1038/nrg.2016.139.
2. Siomi MC, Sato K, Pezic D, Aravin AA. PIWI-interacting small RNAs: thevanguard of genome defence. Nat Rev Mol Cell Biol. 2011;12:246 Available:https://doi.org/10.1038/nrm3089.
3. Brennecke J, Aravin AA, Stark A, Dus M, Kellis M, Sachidanandam R, et al.Discrete small RNA-generating loci as master regulators of transposonactivity in Drosophila. Cell. 2007;128:1089–103. https://doi.org/10.1016/j.cell.2007.01.043.
4. Weick E, Miska E A. piRNAs : from biogenesis to function. Genes Dev. 2014;1–41. doi:https://doi.org/10.1242/dev.094037.
5. Wang G, Reinke V. A C. elegans Piwi, PRG-1, regulates 21U-RNAs duringspermatogenesis. Curr Biol 2008;18: 861–867.
6. Das PP, Bagijn MP, Goldstein LD, Woolford JR, Lehrbach NJ, Sapetschnig A,et al. Piwi and piRNAs act upstream of an endogenous siRNA pathway tosuppress Tc3 transposon mobility in the Caenorhabditis elegans germline.Mol Cell. 2008;31:79–90. https://doi.org/10.1016/j.molcel.2008.06.003.
7. Batista PJ, Ruby JG, Claycomb JM, Chiang R, Fahlgren N, Kasschau KD, et al.PRG-1 and 21U-RNAs interact to form the piRNA complex required forfertility in C. elegans. Mol Cell. 2008;31:67–78.
8. Ruby JG, Jan C, Player C, Axtell MJ, Lee W, Nusbaum C, et al. Large-scalesequencing reveals 21U-RNAs and additional MicroRNAs and endogenoussiRNAs in C. elegans. Cell. 2006;127:1193–207. https://doi.org/10.1016/j.cell.2006.10.040.
9. Beltran T, Barroso C, Birkle TY, Stevens L, Schwartz HT, Sternberg PW, et al.Comparative epigenomics reveals that RNA polymerase II pausing andchromatin domain organization control nematode piRNA biogenesis. DevCell. 2019;48:793–810.e6. https://doi.org/10.1016/j.devcel.2018.12.026.
10. Pak J, Fire A. Distinct populations of primary and secondary effectors duringRNAi in C. elegans. Science (80- ). 2007;315:241–4.
11. Yigit E, Batista PJ, Bei Y, Pang KM, Chen C-CG, Tolia NH, et al. Analysis of theC. elegans Argonaute family reveals that distinct Argonautes actsequentially during RNAi. Cell. 2006;127:747–57. https://doi.org/10.1016/j.cell.2006.09.033.
12. Buckley BA, Burkhart KB, Gu SG, Spracklin G, Kershner A, Fritz H, et al. Anuclear Argonaute promotes multigenerational epigenetic inheritance andgermline immortality. Nature. 2012;489:447–51 Available: http://www.pubmedcentral.nih.gov/articlerender.fcgi?artid=3509936&tool=pmcentrez&rendertype=abstract.
13. Ashe A, Sapetschnig A, Weick EM, Mitchell J, Bagijn MP, Cording AC, et al.PiRNAs can trigger a multigenerational epigenetic memory in the germlineof C. elegans. Cell. 2012;150:88–99. https://doi.org/10.1016/j.cell.2012.06.018.
14. Shirayama M, Seth M, Lee H-C, Gu W, Ishidate T, Conte D, et al. piRNAsinitiate an epigenetic memory of nonself RNA in the C. elegans germline.Cell. 2012;150:65–77. https://doi.org/10.1016/j.cell.2012.06.015.
15. Luteijn MJ, van Bergeijk P, Kaaij LJT, Almeida MV, Roovers EF, Berezikov E,et al. Extremely stable Piwi-induced gene silencing in Caenorhabditiselegans. EMBO J. 2012;31:3422–30.
16. de Albuquerque BFM, Placentino M, Ketting RF. Maternal piRNAs areessential for germline development following de novo establishment ofendo-siRNAs in Caenorhabditis elegans. Dev Cell. 2015;34:448–56.
17. Phillips CM, Brown KC, Montgomery BE, Ruvkun G, Montgomery TA. PiRNAsand piRNA-dependent siRNAs protect conserved and essential C. elegansgenes from misrouting into the RNAi pathway. Dev Cell. 2015;34:457–65.
18. Sarkies P, Selkirk ME, Jones JT, Blok V, Boothby T, Goldstein B, et al. Ancientand novel small RNA pathways compensate for the loss of piRNAs inmultiple independent nematode lineages. PLoS Biol. 2015;13. https://doi.org/10.1371/journal.pbio.1002061.
19. Skinner DE, Rinaldi G, Koziol U, Brehm K, Brindley PJ. How might flukes andtapeworms maintain genome integrity without a canonical piRNA pathway?Trends Parasitol. 2014. https://doi.org/10.1016/j.pt.2014.01.001.
20. Fontenla S, Rinaldi G, Smircich P, Tort JF. Conservation and diversification ofsmall RNA pathways within flatworms. BMC Evol Biol. 2017. https://doi.org/10.1186/s12862-017-1061-5.
21. Mondal M, Klimov P, Flynt AS. Rewired RNAi-mediated genome surveillancein house dust mites. PLoS Genet. 2018;14. https://doi.org/10.1371/journal.pgen.1007183.
22. Rebollo R, Romanish MT, Mager DL. Transposable elements: an abundant andnatural source of regulatory sequences for host genes. Annu Rev Genet. 2011;46:120913153128008. https://doi.org/10.1146/annurev-genet-110711-155621.
23. Imbeault M, Helleboid P-Y, Trono D. KRAB zinc-finger proteins contribute tothe evolution of gene regulatory networks. Nature. 2017;543:550–4. https://doi.org/10.1038/nature21683.
24. Percharde M, Lin C-J, Yin Y, Guan J, Peixoto GA, Bulut-Karslioglu A, et al. ALINE1-nucleolin partnership regulates early development and ESC identity.Cell. 2018;174:391–405.e19. https://doi.org/10.1016/J.CELL.2018.05.043.
25. Simonti CN, Pavličev M, Capra JA. Transposable element exaptation intoregulatory regions is rare, influenced by evolutionary age, and subject topleiotropic constraints. Mol Biol Evol. 2017;34:2856–69. https://doi.org/10.1093/molbev/msx219.
26. Szitenberg A, Cha S, Opperman CH, Bird DM, Blaxter ML, Lunt DH. Geneticdrift, not life history or RNAi, determine long-term evolution of transposableelements. Genome Biol Evol. 2016;8:2964–78. https://doi.org/10.1093/gbe/evw208.
27. Halligan DL, Keightley PD. Spontaneous mutation accumulation studies inevolutionary genetics. Annu Rev Ecol Evol Syst. 2009;40:151–72. https://doi.org/10.1146/annurev.ecolsys.39.110707.173437.
28. Katju V, Bergthorsson U. Old trade, new tricks: insights into the spontaneousmutation process from the partnering of classical mutation accumulationexperiments with high-throughput genomic approaches. Makova K, editor.Genome Biol Evol 2019;11: 136–165. doi:https://doi.org/10.1093/gbe/evy252.
29. Bégin M, Schoen DJ. Low impact of germline transposition on the rate ofmildly deleterious mutation in Caenorhabditis elegans. Genetics. 2006;174:2129–36. https://doi.org/10.1534/genetics.106.065508.
30. Bégin M, Schoen DJ. Transposable elements, mutational correlations, andpopulation divergence in Caenorhabditis elegans. Evolution (N Y). 2007;61:1062–70. https://doi.org/10.1111/j.1558-5646.2007.00097.x.
31. Adrion JR, Song MJ, Schrider DR, Hahn MW, Schaack S. Genome-wideestimates of transposable element insertion and deletion rates inDrosophila melanogaster. Genome Biol Evol. 2017;9:1329–40. https://doi.org/10.1093/gbe/evx050.
32. Bast J, Jaron KS, Schuseil D, Roze D, Schwander T. Asexual reproductionreduces transposable element load in experimental yeast populations. Elife.2019;8. https://doi.org/10.7554/eLife.48548.
33. Denver DR, Morris K, Streelman JT, Kim SK, Lynch M, Thomas WK. Thetranscriptional consequences of mutation and natural selection inCaenorhabditis elegans. Nat Genet. 2005;37:544–8. https://doi.org/10.1038/ng1554.
34. Landry CR, Lemos B, Rifkin SA, Dickinson WJ, Hartl DL. Genetic propertiesinfluencing the evolvability of gene expression. Science (80- ). 2007;317:118–21. https://doi.org/10.1126/science.1140247.
35. Rifkin SA, Houle D, Kim J, White KP. A mutation accumulation assay revealsa broad capacity for rapid evolution of gene expression. Nature. 2005;438:220–3. https://doi.org/10.1038/nature04114.
36. Consortium C elegans S. Genome sequence of the nematode C. elegans: aplatform for investigating biology. Science (80- ). 1998;282:2012–8. https://doi.org/10.1126/science.282.5396.2012.
37. Sijen T, Plasterk RHA. Transposon silencing in the Caenorhabditis elegansgerm line by natural RNAi. Nature. 2003;426:310–4. https://doi.org/10.1038/nature02107.
38. Plasterk RHA, Izsvák Z, Ivics Z. Resident aliens the Tc1/mariner superfamily oftransposable elements. Trends in Genetics. 1999. pp. 326–332. doi:https://doi.org/10.1016/S0168-9525(99)01777-1.
39. Laricchia KM, Zdraljevic S, Cook DE, Andersen EC. Natural variation in thedistribution and abundance of transposable elements across theCaenorhabditis elegans species. Mol Biol Evol. 2017;34:2187–202. https://doi.org/10.1093/molbev/msx155.
40. Bessereau J-L. Transposons in C. elegans. WormBook. 2006:1–13. https://doi.org/10.1895/wormbook.1.70.1.
41. Ganko EW, Fielman KT, McDonald JF. Evolutionary history of Cer elementsand their impact on the C. elegans genome. Genome Res. 2001;11:2066–74.https://doi.org/10.1101/gr.196201.
Bergthorsson et al. BMC Biology (2020) 18:162 Page 16 of 17
42. Garrigues JM, Tsu B V., Daugherty MD, Pasquinelli AE. Diversification of theCaenorhabditis heat shock response by helitron transposable elements.Elife. 2019;8. doi:https://doi.org/10.7554/eLife.51139.
43. McMurchy AN, Stempor P, Gaarenstroom T, Wysolmerski B, Dong Y,Aussianikava D, et al. A team of heterochromatin factors collaborates withsmall RNA pathways to combat repetitive elements and germline stress.Elife. 2017;6. https://doi.org/10.7554/eLife.21666.
44. Katju V, Packard LB, Bu L, Keightley PD, Bergthorsson U. Fitness decline inspontaneous mutation accumulation lines of Caenorhabditis elegans withvarying effective population sizes. Evolution (N Y). 2015;69:104–16. https://doi.org/10.1111/evo.12554.
45. Beltran T, Shahrezaei V, Katju V, Sarkies P. Epimutations driven by small RNAsarise frequently but have limited duration in a metazoan organism. bioRxiv.2019; 2019.12.29.890194. doi:https://doi.org/10.1101/2019.12.29.890194.
46. Hodgins-Davis A, Rice DP, Townsend JP. Gene expression evolves under ahouse-of-cards model of stabilizing selection. Mol Biol Evol. 2015;32:2130–40. https://doi.org/10.1093/molbev/msv094.
47. Osman GA, Fasseas MK, Koneru SL, Essmann CL, Kyrou K, Srinivasan MA,et al. Natural infection of C. elegans by an oomycete reveals a newpathogen-specific immune response. Curr Biol. 2018;28. https://doi.org/10.1016/j.cub.2018.01.029.
48. Bagijn MP, Goldstein LD, Sapetschnig A, Weick EM, Bouasker S,Lehrbach NJ, et al. Function, targets, and evolution of Caenorhabditiselegans piRNAs. Science (80- ). 2012;337:574–8. https://doi.org/10.1126/science.1220952.
49. Shen E-Z, Chen H, Ozturk AR, Tu S, Shirayama M, Tang W, et al.Identification of piRNA binding sites reveals the Argonaute regulatorylandscape of the C. elegans germline. Cell. 2018;172:937–51.e18. https://doi.org/10.1016/j.cell.2018.02.002.
50. Billi AC, Freeberg MA, Day AM, Chun SY, Khivansara V, Kim JK. A conservedupstream motif orchestrates autonomous, germline-enriched expression ofCaenorhabditis elegans piRNAs. PLoS Genet. 2013;9:e1003392.
51. Cecere G, Zheng GXY, Mansisidor AR, Klymko KE, Grishok A. Promotersrecognized by Forkhead proteins exist for individual 21U-RNAs. Mol Cell.2012;47:734–45. https://doi.org/10.1016/j.molcel.2012.06.021.
52. Gu W, Lee H-C, Chaves D, Youngman EM, Pazour GJ, Conte D, et al. CapSeqand CIP-TAP identify Pol II start sites and reveal capped small RNAs as Celegans piRNA precursors. Cell. 2012;151:1488–500. https://doi.org/10.1016/j.cell.2012.11.023.
53. Gu W, Shirayama M, Conte D Jr, Vasale J, Batista PJ, Claycomb JM, et al.Distinct Argonaute-mediated 22G-RNA pathways direct genomesurveillance in the C. elegans germline. Mol Cell. 2009;36:231–44. https://doi.org/10.1016/j.molcel.2009.09.020.
54. Woodhouse RM, Buchmann G, Hoe M, Harney DJ, Low JKK, Larance M, et al.Chromatin modifiers SET-25 and SET-32 are required for establishment butnot long-term maintenance of transgenerational epigenetic inheritance. CellRep. 2018;25:2259–72.e5. https://doi.org/10.1016/j.celrep.2018.10.085.
55. Evans KJ, Huang N, Stempor P, Chesney MA, Down TA, Ahringer J. StableCaenorhabditis elegans chromatin domains separate broadly expressed anddevelopmentally regulated genes. Proc Natl Acad Sci. 2016;113:E7020–9.https://doi.org/10.1073/pnas.1608162113.
56. Gaydos LJ, Rechtsteiner A, Egelhofer TA, Carroll CR, Strome S. Antagonismbetween MES-4 and polycomb repressive complex 2 promotes appropriategene expression in C. elegans germ cells. Cell Rep. 2012;2:1169–77. https://doi.org/10.1016/j.celrep.2012.09.019.
57. Carelli FN, Sharma G, Ahringer J. Broad chromatin domains: an importantfacet of genome regulation. BioEssays. 2017;39:1700124. https://doi.org/10.1002/bies.201700124.
58. Rechtsteiner A, Ercan S, Takasaki T, Phippen TM, Egelhofer TA, Wang W,et al. The histone H3K36 methyltransferase MES-4 acts epigenetically totransmit the memory of germline gene expression to progeny. Plos Genet,Available. 2010;6:e1001091 https://doi.org/10.1371/journal.pgen.1001091.
59. Liu T, Rechtsteiner A, Egelhofer TA, Vielle A, Latorre I, Cheung M-S, et al.Broad chromosomal domains of histone modification patterns in C. elegans.Genome Res. 2011;21:227–36. https://doi.org/10.1101/gr.115519.110.
60. Frøkjær-Jensen C, Jain N, Hansen L, Davis MW, Li Y, Zhao D, et al. Anabundant class of non-coding DNA can prevent stochastic gene silencing inthe C. elegans germline. Cell. 2016;166:343–57. https://doi.org/10.1016/j.cell.2016.05.072.
61. Simon M, Sarkies P, Ikegami K, Doebley AL, Goldstein LD, Mitchell J, et al.Reduced insulin/IGF-1 signaling restores germ cell immortality to
Caenorhabditis elegans Piwi mutants. Cell Rep. 2014;7:762–73. https://doi.org/10.1016/j.celrep.2014.03.056.
62. Katju V, Packard LB, Keightley PD. Fitness decline under osmotic stress inCaenorhabditis elegans populations subjected to spontaneous mutationaccumulation at varying population sizes. Evolution (N Y). 2018;72:1000–8.https://doi.org/10.1111/evo.13463.
63. Estes S, Phillips PC, Denver DR, Thomas WK, Lynch M. Mutationaccumulation in populations of varying size: the distribution of mutationaleffects for fitness correlates in Caenorhabditis elegans. Genetics. 2004;166:1269–79. https://doi.org/10.1534/genetics.166.3.1269.
64. Keightley PD, Cabellero A. Genomic mutation rates for lifetime reproductiveoutput and lifespan in Caenorhabditis elegans. Proc Natl Acad Sci U S A.1997;94:3823–7 Available: http://www.wormbase.org/db/misc/paper?name=WBPaper00002775.
65. Halligan D, Peters A, Keightley P. Estimating numbers of EMS-inducedmutations affecting life history traits in Caenorhabditis elegans in crossesbetween inbred sublines. Genet Res. 2003;82:191–205 Available: http://www.wormbase.org/db/misc/paper?name=WBPaper00006482.
66. Ávila V, García-Dorado A. The effects of spontaneous mutation oncompetitive fitness in Drosophila melanogaster. J Evol Biol. 2002;15:561–6.https://doi.org/10.1046/j.1420-9101.2002.00421.x.
67. Heilbron K, Toll-Riera M, Kojadinovic M, MacLean RC. Fitness is stronglyinfluenced by rare mutations of large effect in a microbial mutationaccumulation experiment. Genetics. 2014;197:981–90. https://doi.org/10.1534/genetics.114.163147.
68. Dillon MM, Cooper VS. The fitness effects of spontaneous mutations nearlyunseen by selection in a bacterium with multiple chromosomes. Genetics.2016;204:1225–38. https://doi.org/10.1534/genetics.116.193060.
69. Bühler M. RNA turnover and chromatin-dependent gene silencing.Chromosoma. 2009;118:141–51. https://doi.org/10.1007/s00412-008-0195-z.
70. Ni JZ, Chen E, Gu SG. Complex coding of endogenous siRNA, transcriptionalsilencing and H3K9 methylation on native targets of germline nuclear RNAiin C. elegans. BMC Genomics. 2014;15:1157 Available: http://www.pubmedcentral.nih.gov/articlerender.fcgi?artid=4367959&tool=pmcentrez&rendertype=abstract.
71. Mao H, Zhu C, Zong D, Weng C, Yang X, Huang H, et al. The Nrde pathwaymediates small-RNA-directed histone H3 lysine 27 trimethylation inCaenorhabditis elegans. Curr Biol. 2015;25:2398–403.
72. Konrad A, Flibotte S, Taylor J, Waterston RH, Moerman DG, Bergthorsson U,et al. Mutational and transcriptional landscape of spontaneous geneduplications and deletions in Caenorhabditis elegans. Proc Natl Acad Sci.2018;115:7386–91. https://doi.org/10.1073/pnas.1801930115.
73. Kimura M. On the probability of fixation of mutant genes in a population.Genetics. 1962;47:713–9.
74. Trapnell C, Pachter L, Salzberg SL. TopHat: discovering splice junctions withRNA-Seq. Bioinformatics. 2009;25:1105–11 Available: https://doi.org/10.1093/bioinformatics/btp120.
75. Trapnell C, Williams BA, Pertea G, Mortazavi A, Kwan G, van Baren MJ, et al.How Cufflinks works. Nat Biotechnol. 2010;28:511–5. https://doi.org/10.1038/nbt.1621.
76. Smit A, Hubley R, Green P. RepeatMasker Open-4.0.6 2013–2015 . http://www.repeatmasker.org. 2017. Available: http://repeatmasker.org.
77. Jonckheere AR. A distribution-free k-sample test against orderedalternatives. Biometrika. 1954;41:133. https://doi.org/10.2307/2333011.
78. Beltran T, Shahrezaei V, Katju V, Sarkies P. Epimutations driven by small RNAsarise frequently but most have limited duration in Caenorhabditis elegans.Nat Ecol Evol. 2020. https://doi.org/10.1038/s41559-020-01293-z.
Publisher’s NoteSpringer Nature remains neutral with regard to jurisdictional claims inpublished maps and institutional affiliations.
Bergthorsson et al. BMC Biology (2020) 18:162 Page 17 of 17