Embed Size (px)
Citation preview
Long-term financial analysis Why and how?
2
Content
1. Introduction ................................................................. 3
2. Why take a long-term approach? ................................... 4
3. What does it look like in the municipalities today? ...... 11
4. Our model ................................................................... 18
5. Conclusions ................................................................. 21
3
1. Introduction
At PwC, we have worked with a number of municipalities with the aim of preparing long-term analysis of their economy and finances. We have also developed a model for these kinds of calculations.
Here, we are now summarising our experiences from some of the municipalities that obtained our help in estimating their possibilities of financing future welfare. We also describe our model, which estimates revenues and expenses 10-20 years in the future based on the population forecast.
The model takes into account the impact of the investments needed to handle population change or more ambitious objectives. The results of the calculation indicate the need to improve efficiency or raise taxes or reprioritisation requirements necessary to obtain sustainable finances over the long term.
We also conducted a survey of financial managers in all municipalities to find out how they view the need to plan further out than three years as required by law. In addition, we ascertained whether they actually perform long-term estimates and analyses and how they are structured. Furthermore, we obtained explanations as to why such estimates/analyses are not done.
We hope that this text will serve as a source of inspiration in the ambition to develop long-term analysis and create better conditions for sustainable finances.
This text was prepared by Anders Haglund, Joanna Hägg, Henrik Berggren and Hans Nyström.
Stockholm, June 2016,
Susanna Collijn Manager, Municipal Sector in PwC
4
2. Why take a long-term approach
Sweden is currently experiencing strong population growth. This population growth is taking place in combination with a pronounced demographic change with growing percentages of children and elderly. This trend is driven to a large degree by extensive refugee immigration.
The population change is one of the major challenges the municipalities are facing. The current demographic trend will continue for the next several years. This trend was already dramatic for both the municipalities with a growing population and those with a decreasing population. The population of many municipalities has grown by more than 10 per cent in the past 10 years, while others have had a decrease in population of the same magnitude.
Municipalities with positive and negative growth – different challenges According to some estimates, there will be 100 municipalities with fewer than 10,000 residents by 2020. Small municipalities in the inland areas of Norrland are estimated to lose 40 per cent of their population by 2030. Elsewhere, growth is explosive! For the “growers”, it is important to match a greater need for service and investments to the financial restraints. For the “decliners”, reprioritisations and closures of operations and facilities are involved. In both cases, there is a great need for a long-term approach and advanced planning.
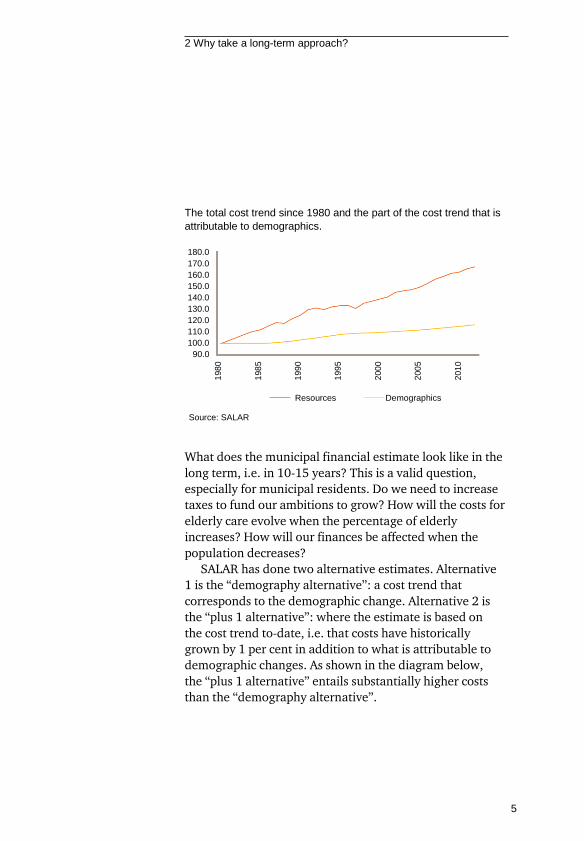
The cost trend is not only being driven by the demographic change, but also greater demand for service and new treatment methods in healthcare. In terms of experience, costs have grown since 1980 by around 1 per cent per year beyond what is attributable to demographic changes, according to the Swedish Association of Local Authorities and Regions (SALAR). A gradually increasing level of ambition is part of the explanation of this.
2 Why take a long-term approach?
5
The total cost trend since 1980 and the part of the cost trend that is attributable to demographics.
180.0 170.0 160.0 150.0 140.0 130.0 120.0 110.0 100.0
90.0
Resources Demographics
Source: SALAR
What does the municipal financial estimate look like in the long term, i.e. in 10-15 years? This is a valid question, especially for municipal residents. Do we need to increase taxes to fund our ambitions to grow? How will the costs for elderly care evolve when the percentage of elderly increases? How will our finances be affected when the population decreases?
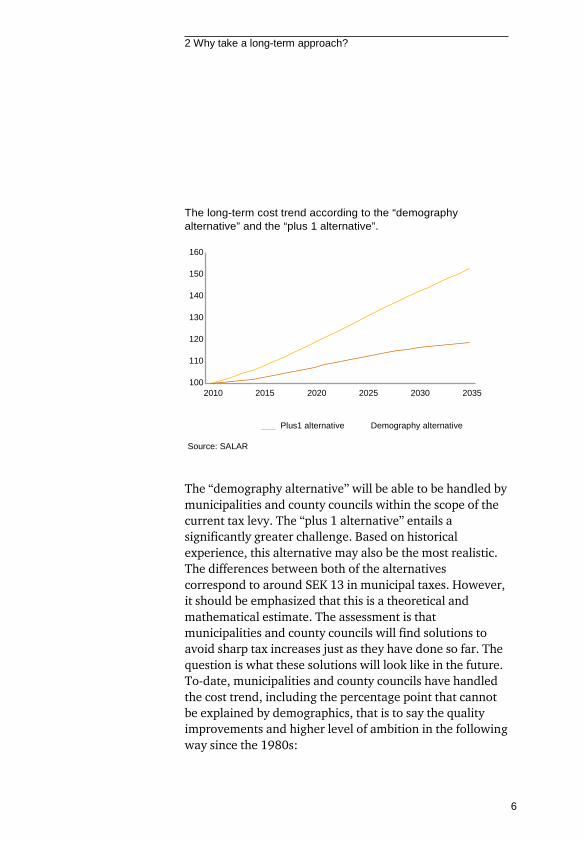
SALAR has done two alternative estimates. Alternative 1 is the “demography alternative”: a cost trend that corresponds to the demographic change. Alternative 2 is the “plus 1 alternative”: where the estimate is based on the cost trend to-date, i.e. that costs have historically grown by 1 per cent in addition to what is attributable to demographic changes. As shown in the diagram below, the “plus 1 alternative” entails substantially higher costs than the “demography alternative”.
1980
1985
1990
1995
2000
2005
2010
2 Why take a long-term approach?
6
The long-term cost trend according to the “demography alternative” and the “plus 1 alternative”.
160
150
140
130
120
110
100 2010 2015 2020 2025 2030 2035
Plus1 alternative Demography alternative
Source: SALAR
The “demography alternative” will be able to be handled by municipalities and county councils within the scope of the current tax levy. The “plus 1 alternative” entails a significantly greater challenge. Based on historical experience, this alternative may also be the most realistic. The differences between both of the alternatives correspond to around SEK 13 in municipal taxes. However, it should be emphasized that this is a theoretical and mathematical estimate. The assessment is that municipalities and county councils will find solutions to avoid sharp tax increases just as they have done so far. The question is what these solutions will look like in the future. To-date, municipalities and county councils have handled the cost trend, including the percentage point that cannot be explained by demographics, that is to say the quality improvements and higher level of ambition in the following way since the 1980s:
2 Why take a long-term approach?
7
• Moderate tax increases • Streamlining operations • Sales of assets • Reduction of financial reserves
In our opinion, long-term financial estimates, scenarios, long-term planning and impact and risk analyses should top the agendas of the boards and committees. Unfortunately, this is not the case. In general, these phenomena make up a very large area for development in the municipalities. Most often only the requirement of a three-year financial plan as set out by the Local Government Act is dutifully met. This is illustrated by the survey we conducted that is presented in the next section.
Rough long-term estimates have long been done at an aggregate level by SALAR, among others. It is now high time to go further at the municipal level. Only when estimates for various scenarios are done at that level do the challenges become concrete and prerequisites are created for an earnest discussion.
Choosing the right strategy Long-term estimates are necessary as a basis for discussion regarding priorities, ambitions in terms of population growth and consequences of a population decrease. This is also true of strategies for financing the investments, in other words how much can/should be financed externally, with loans, and how much should be self-financed. The chosen strategy naturally influences the financial targets, not least the demand for results. The estimates and the chosen strategies also clarify how much resources can be devoted to the core operations and how much pressure there is to streamline in order to ensure sustainable financial development. Of course, this is not a matter of detailed development plans on the long term. Rather, it involves estimates for various alternative scenarios and actionable alternatives on a perspective of 10-20 years.
2 Why take a long-term approach?
8
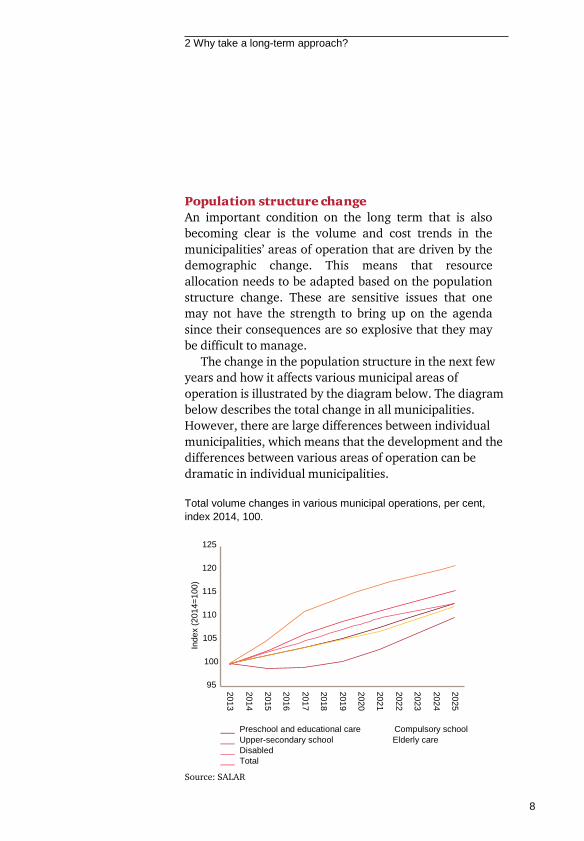
Population structure change An important condition on the long term that is also becoming clear is the volume and cost trends in the municipalities’ areas of operation that are driven by the demographic change. This means that resource allocation needs to be adapted based on the population structure change. These are sensitive issues that one may not have the strength to bring up on the agenda since their consequences are so explosive that they may be difficult to manage.
The change in the population structure in the next few years and how it affects various municipal areas of operation is illustrated by the diagram below. The diagram below describes the total change in all municipalities. However, there are large differences between individual municipalities, which means that the development and the differences between various areas of operation can be dramatic in individual municipalities.
Total volume changes in various municipal operations, per cent, index 2014, 100.
125
120
115
110
105
100
95
Preschool and educational care Compulsory school Upper-secondary school Elderly care Disabled Total
Source: SALAR
2025
2024
2023
2022
2021
2020
2019
2018
2017
2016
2015
2014
2013
Inde
x (2
014=
100)
2 Why take a long-term approach?
9
Outcome and 2015-10
2014 2015-05. Outcome and forecast, October 2015
Forecast 2014
A common objection to working with long-term estimates and analyses is that the uncertainty is too large for them to be able to serve any purpose. The arguments that there will be a different population development and that the government will change its subsidies are concrete examples of objections.
In our view, it is not a matter of planning, but rather involves creating knowledge of the consequences of various scenarios. What happens if the population grows by 3 per cent annually instead of 1 per cent? What will the consequences be of our investment programme, which besides the expansion of elderly housing also includes investments in several sports facilities?
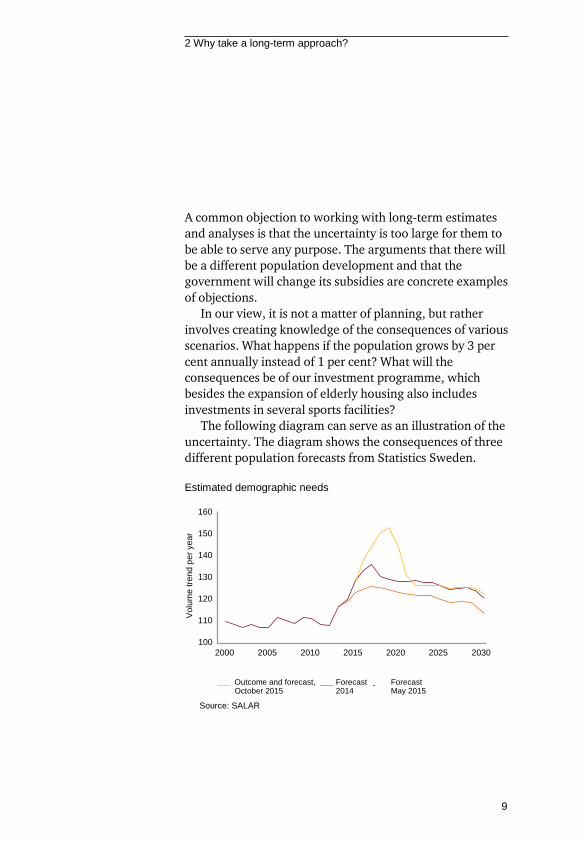
The following diagram can serve as an illustration of the uncertainty. The diagram shows the consequences of three different population forecasts from Statistics Sweden.
Estimated demographic needs
160
150
140
130
120
110
100 2000 2005 2010 2015 2020
2025
2030
Source: SALAR
Forecast May 2015
Vol
ume
trend
per
yea
r
2 Why take a long-term approach?
10
The population forecasts are recalculated to the municipalities’ volume trend and thereby the cost trend. The diagram shows that the population trend, in other words, both the size and the population structure entailed a stable volume increase of around 0.5 per cent between 2000 and 2012. Then a dramatic change occurred. In 2014, it was assumed that the volume increase in 2015 and a few years in the future would be between 1 and 1.5 per cent. One year later, the assumptions increased by around 0.5 percentage points. The population forecast from October 2015 now indicates a rate of increase of between 2 and 2.5 per cent for a number of years.
In our opinion, several alternatives should be involved in light of the prevailing uncertainty. This is true of the population growth, the investment programme and the financing. The latter involves the possibility of self-financing the investments by working with different result requirements.
11
3. What does it look like in the municipalities today?
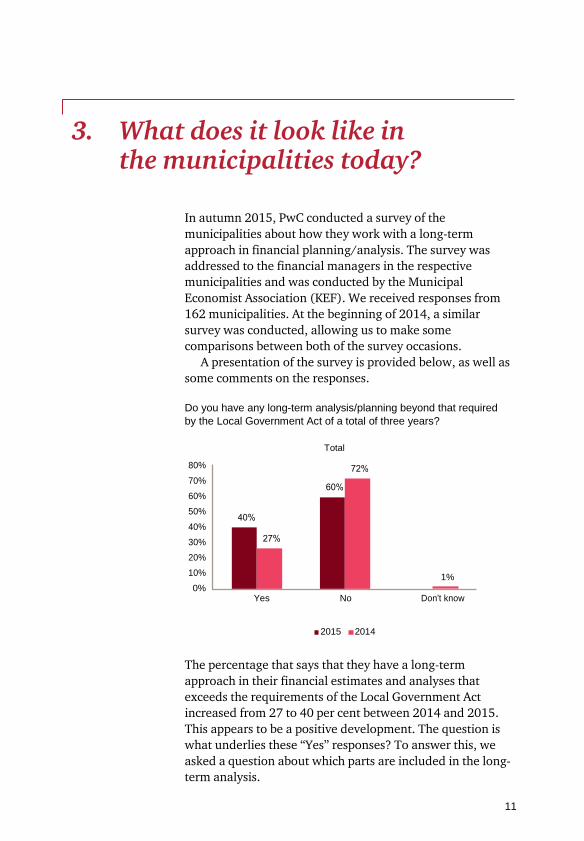
In autumn 2015, PwC conducted a survey of the municipalities about how they work with a long-term approach in financial planning/analysis. The survey was addressed to the financial managers in the respective municipalities and was conducted by the Municipal Economist Association (KEF). We received responses from 162 municipalities. At the beginning of 2014, a similar survey was conducted, allowing us to make some comparisons between both of the survey occasions.
A presentation of the survey is provided below, as well as some comments on the responses.
Do you have any long-term analysis/planning beyond that required by the Local Government Act of a total of three years?
80%
70% 60% 50%
40% 30% 20% 10% 0%
Total
Yes No Don’t know
2015 2014
The percentage that says that they have a long-term approach in their financial estimates and analyses that exceeds the requirements of the Local Government Act increased from 27 to 40 per cent between 2014 and 2015. This appears to be a positive development. The question is what underlies these “Yes” responses? To answer this, we asked a question about which parts are included in the long-term analysis.
1%
3 What does it look like in the municipalities today?
12
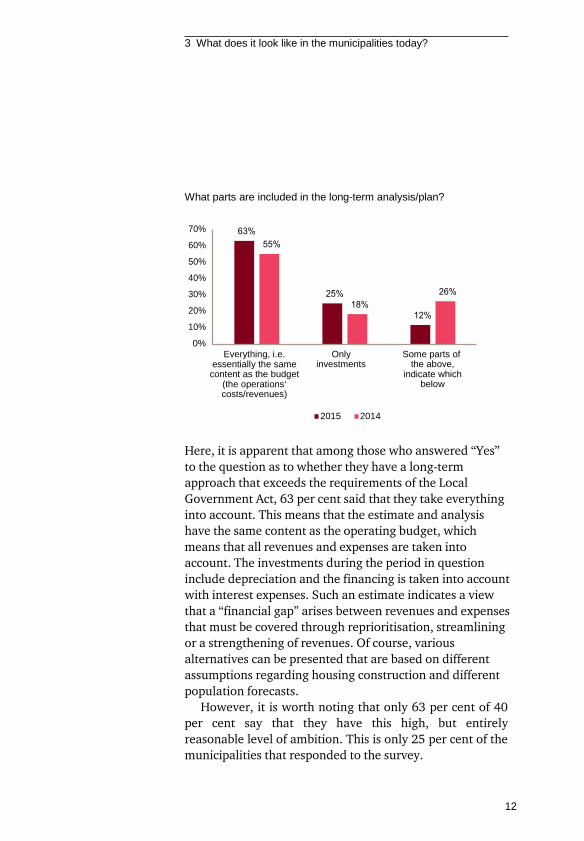
What parts are included in the long-term analysis/plan?
70%
60%
50%
40%
30%
20%
10%
0%
Everything, i.e. essentially the same content as the budget
(the operations’ costs/revenues)
Only investments
Some parts of the above,
indicate which below
2015 2014
Here, it is apparent that among those who answered “Yes” to the question as to whether they have a long-term approach that exceeds the requirements of the Local Government Act, 63 per cent said that they take everything into account. This means that the estimate and analysis have the same content as the operating budget, which means that all revenues and expenses are taken into account. The investments during the period in question include depreciation and the financing is taken into account with interest expenses. Such an estimate indicates a view that a “financial gap” arises between revenues and expenses that must be covered through reprioritisation, streamlining or a strengthening of revenues. Of course, various alternatives can be presented that are based on different assumptions regarding housing construction and different population forecasts.
However, it is worth noting that only 63 per cent of 40 per cent say that they have this high, but entirely reasonable level of ambition. This is only 25 per cent of the municipalities that responded to the survey.
3 What does it look like in the municipalities today?
13
50% 46% 45% 40% 35% 35% 35% 30% 28% 28% 25%
20% 19%
15% 10% 10% 5% 0%
5-7 years 8-10 years More than 10 years Other
2015 2014
Suburban
municipalities near
major cities
Suburban
municipalities near
large cities
Municipalities in densely populated regions
Large cities
Major cities
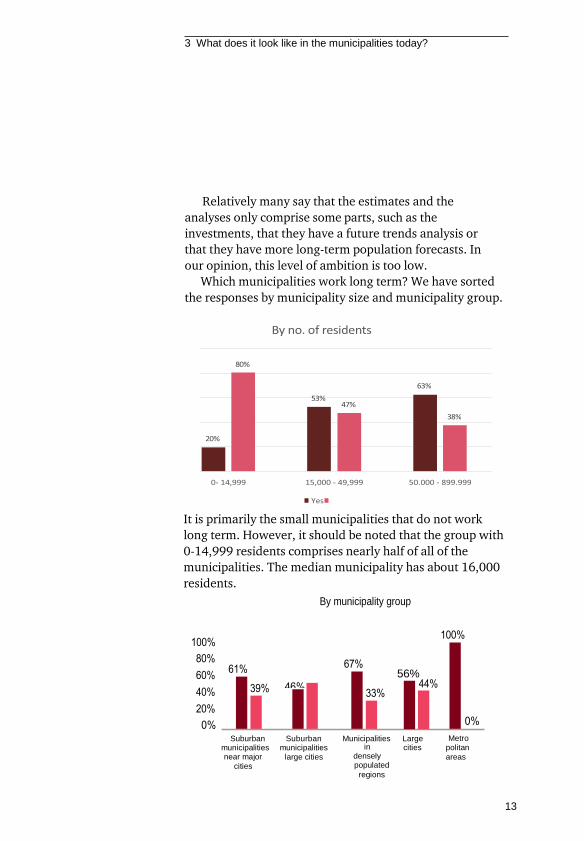
Relatively many say that the estimates and the analyses only comprise some parts, such as the investments, that they have a future trends analysis or that they have more long-term population forecasts. In our opinion, this level of ambition is too low.
Which municipalities work long term? We have sorted the responses by municipality size and municipality group.
It is primarily the small municipalities that do not work long term. However, it should be noted that the group with 0-14,999 residents comprises nearly half of all of the municipalities. The median municipality has about 16,000 residents.
By municipality group
80% 60% 40% 20% 0%
56%
Suburban municipalities near major
cities
Suburban municipalities
large cities
Municipalities in
densely populated
regions
Large cities
Metro
politan areas
3 What does it look like in the municipalities today?
14
100% 80% 60% 40% 20%
0%
Municipalities in sparsely
populated regions
Sparsely populated
municipalities
Tourism municipalities
Manufacturing municipalities
Commuter municipalities
Yes No
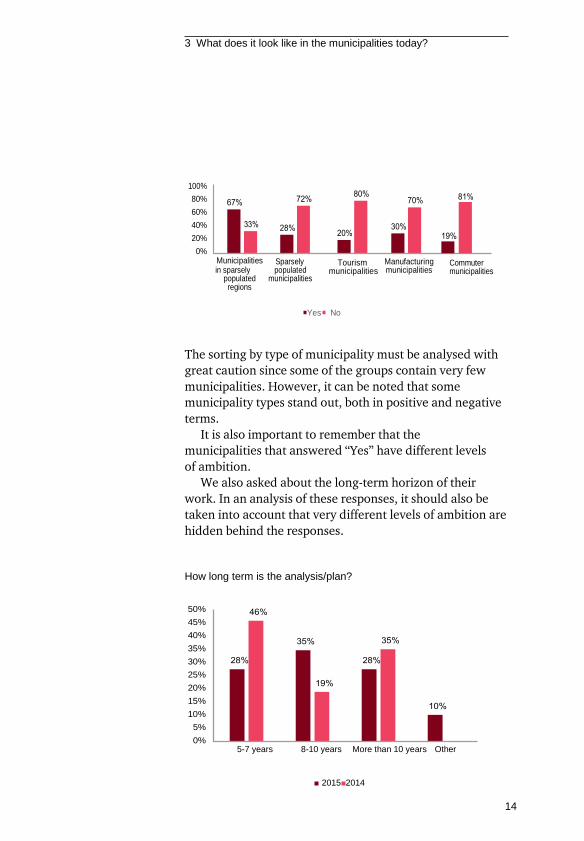
The sorting by type of municipality must be analysed with great caution since some of the groups contain very few municipalities. However, it can be noted that some municipality types stand out, both in positive and negative terms.
It is also important to remember that the municipalities that answered “Yes” have different levels of ambition.
We also asked about the long-term horizon of their work. In an analysis of these responses, it should also be taken into account that very different levels of ambition are hidden behind the responses.
How long term is the analysis/plan?
50% 45% 40% 35% 30% 25% 20% 15% 10%
5% 0%
5-7 years 8-10 years More than 10 years Other
2015 2014
3 What does it look like in the municipalities today?
15
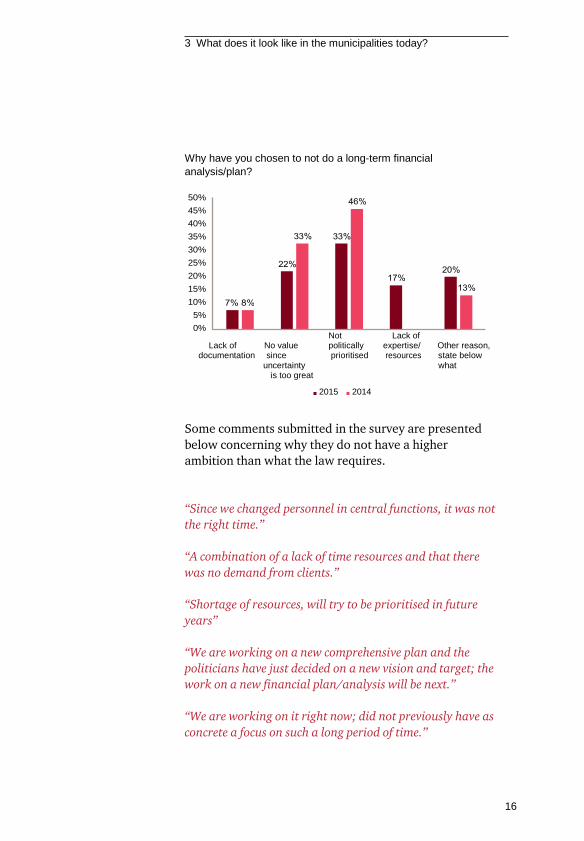
Of course, we also asked those who have no higher level of ambition than what is required by the Local Government Act why this is the case. A lack of expertise and resources are two reasons that many point out. This may not be so strange considering that it is generally small municipalities that do not have a higher level of ambition than what the Local Government Act requires. These municipalities often lack specialists and development resources.
Many say that the reason is that the uncertainty is too large for it to be meaningful to work long term. The percentage that gives this reason has decreased since 2014, which is positive. Uncertainty may be one of the better arguments for preparing long-term estimates, preferably several alternatives based on different conditions.
Relatively many unfortunately say that the area is not politically prioritised. This is remarkable in our view. One highly justified question from a resident and taxpayer in a municipality with ambitious expansion plans is what their financial consequences will be in a few years. Will extensive reprioritisations need to be made or will municipal taxes need to be increased? Is the estimate with all investments in balance? Corresponding questions can also be asked in a municipality with a declining population. Not having an answer hardly inspires confidence.
3 What does it look like in the municipalities today?
16
Why have you chosen to not do a long-term financial analysis/plan?
50% 45% 40% 35% 30% 25% 20% 15% 10%
5% 0%
Lack of
No value
Not politically
Lack of expertise/
Other reason,
documentation since uncertainty
prioritised resources state below what
is too great 2015 2014
Some comments submitted in the survey are presented below concerning why they do not have a higher ambition than what the law requires.
“Since we changed personnel in central functions, it was not the right time.”
“A combination of a lack of time resources and that there was no demand from clients.”
“Shortage of resources, will try to be prioritised in future years”
“We are working on a new comprehensive plan and the politicians have just decided on a new vision and target; the work on a new financial plan/analysis will be next.”
“We are working on it right now; did not previously have as concrete a focus on such a long period of time.”
3 What does it look like in the municipalities today?
17
“We have requested a tender from PwC and will in all likelihood conduct an analysis in spring 2016.”
“Cannot say. Began as the financial manager in August 2015 and the political leadership is new since the 2014 election.”
“Given the large uncertainty, it is not politically prioritised.”
“A long-term plan was prepared several times a few years ago. In recent years, the task has not been prioritised in part because a lack of time and different areas of focus and in part because of little interest from the client.”
“Status reports and thereby reinvestment and maintenance requirements on our properties and facilities are being prepared.”
“A start-up meeting will be held shortly with politicians and employees to prepare a long-term plan”
“We have a rough assessment, but mainly the refugee situation is turning virtually everything upside down. “
18
Housing construction Relocation
Investments Operating costs
Government
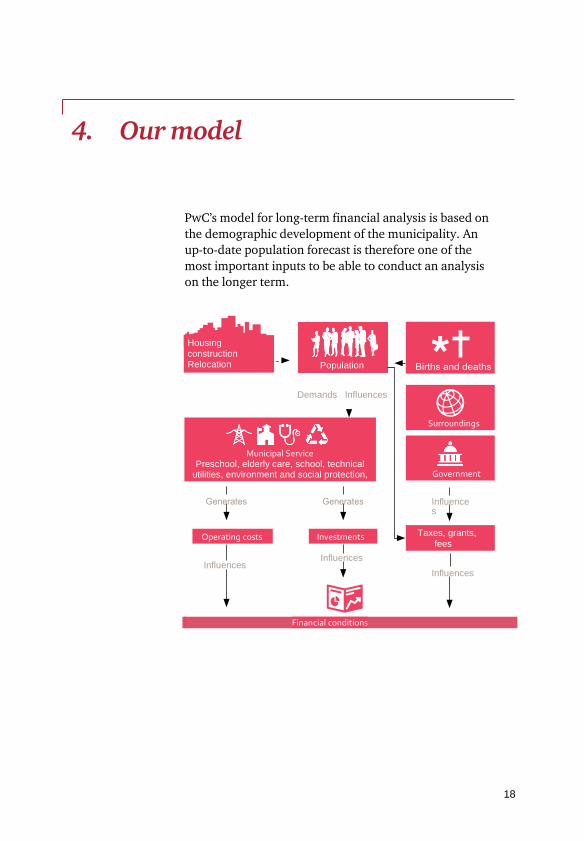
4. Our model
PwC’s model for long-term financial analysis is based on the demographic development of the municipality. An up-to-date population forecast is therefore one of the most important inputs to be able to conduct an analysis on the longer term.
Influences Influences
Influences
Financial conditions
Population
Demands Influences
Influences
Municipal Service Preschool, elderly care, school, technical
utilities, environment and social protection, etc.
Taxes, grants, fees
Surroundings
4 Our model
19
Based on the population forecast, an estimate is made of what is known as the demographic pressure, both on the operating finances and investment finances. For municipal services, the development in various selected age and population groups is of interest. Demand for the municipality’s services does not necessarily need to increase or decrease at the same rate that the number of residents changes since not all residents demand the full municipal service offering. Demand for municipal service is accordingly not primarily determined by how the total number of residents changes, but mainly by the development for the specific age groups that the municipality’s various services target and by government reforms or social changes that affect the target groups’ demand.
Given the development of the target groups pursuant to the municipality’s population forecast, the effects on the municipal services are estimated. The change pressure in total affects the municipality’s costs through higher salaries and rent (in-house management) and through higher expenses for contracts (external providers). The relationship between services under in-house management and on contract is interesting in terms of the need for investments
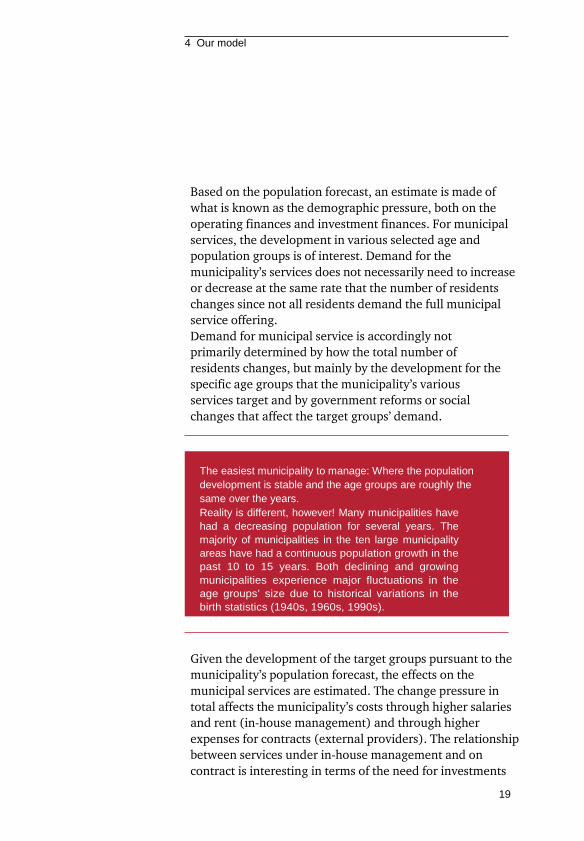
The easiest municipality to manage: Where the population development is stable and the age groups are roughly the same over the years. Reality is different, however! Many municipalities have had a decreasing population for several years. The majority of municipalities in the ten large municipality areas have had a continuous population growth in the past 10 to 15 years. Both declining and growing municipalities experience major fluctuations in the age groups’ size due to historical variations in the birth statistics (1940s, 1960s, 1990s).
4 Our model
20
in public buildings. An increase in the number of users of services under in-house management can create needs for new investments. An increase in the number of users of services on contract does not create corresponding needs as the external provider can be assumed to resolve the premises issue.
Investment needs and demographic development In PwC’s model, the investment need is included in tax-financed operations that are brought about by the demographic changes, such as in schools and elderly housing. The investment need is usually worked out together with representatives from the municipality, thereby capturing any space in the existing stock, how large the municipality usually builds and what it costs.
The analysis is supplemented with information on pensions, depreciation of existing fixed assets and financial expenses and revenues until the chosen final year and the municipality’s future costs are recalculated in continuous prices. An estimate of the municipality’s future revenues from taxes, government subsidies, local government equalisation system and property charges is set against the costs. Based on this, an assessment of the municipality’s financial conditions for the period is obtained.
Different alternatives and assumptions A special analysis is done of the municipality’s future cash flow to determine how the investments will be financed. Through the analysis, the need for external financing and development of the loan liability is shown. The model provides the possibility to simulate different alternatives and assumptions, such as those regarding results targets and interest rate levels. This way, the municipality can be provided the conditions to continue a discussion on strategic decisions in the future.
21
5. Conclusions
One factor common to Malmö, Sollentuna, Lund, Mjölby and Flen (examples of cities where we have worked with long-term financial analysis) is that long-term analyses have contributed to greater awareness. Decision input has improved and in some cases, the dialogue between different actors, such as the municipal executive board, committees and parties, has also improved.
Easier to look ahead The analysis has also led to the financial targets being revised and investment programmes being reviewed. It has also become clear what efficiency improvements are required to keep finances in balance. The discussions have become more initiated and rooted in reality, which facilitates a focus on the future and strategic thinking rather than looking back, questioning the current position.
Long-term approach at the top of the agenda The municipalities presented here have a long-term approach high on their agenda. We also have other good examples from other municipalities. However, according to our survey, many municipalities do not have the long-term perspective particularly high on their agenda. We hope that this text can serve as a source of inspiration for these municipalities to also get started with such an effort. This is absolutely necessary in our opinion.

© 2016 PricewaterhouseCoopers i Sverige AB. Duplication of the content in part or in whole is prohibited under the Act regarding Copyright in Literary and Artistic Works (1960:729). This prohibition applies to every kind of duplication through printing, copying, etc.