Embed Size (px)
Citation preview

OECD Journal: Financial Market Trends www.oecd.org/daf/fmt
Volume 2013 – Issue 1
Pre-print version
© OECD 2013
Long-term investment, the cost of capital
and the dividend and buyback puzzle
by
Adrian Blundell-Wignall and Caroline Roulet *
The paper argues that interest rates are at extremely low levels to support banks, and the search for yield has pushed the liquidity driven speculative bubble from real estate, derivatives and structured products markets into the corporate debt market. Equities have rallied strongly too. This asset cycle is certainly helping banks reduce hidden losses on illiquid securities and could also help reduce the cost of equity. But for this to occur at current bond yields would require an unrealistic bubble in equities. Markets are assuming that this transition from low to higher rates (more in line with nominal GDP) can be handled smoothly by policy makers, when in fact this may not be so. Extreme volatility would risk new financial fragility problems. The paper presents a panel model using more than 4,000 global companies and shows that the Capex decision in general depend on the cost of equity, the accelerator and uncertainty, whereas buybacks are driven mainly by the gap between the cost of equity and debt. Right now the incentive structure implied by very low interest rates, which may be sustained for a long time, together with tax incentives, works directly against long-term investment. Debt finance is cheap, while the cost of equity capital needed for risky long-term investment is still high. This combination provides a direct incentive for borrowing to carry out buybacks (de-equitisation). Noting that weak investment reduces potential GDP, the paper makes some policy suggestions.
JEL Classification: G15, G32, G28, E52.
Keywords: long-term investment, interest rates, de-equitisation, cost of capital, dividend and buybacks, monetary policy.
* Adrian Blundell-Wignall is the Special Advisor to the OECD Secretary-General for Financial Markets, and
the Deputy Director of the Directorate of Financial and Enterprise Affairs (http://www.oecd.org/daf/abw).
Caroline Roulet is an OECD economist and analyst. The views in this paper are those of the authors, and
do not necessarily reflect those of any member government of the OECD.
LONG-TERM INVESTMENT, THE COST OF CAPITAL AND THE DIVIDEND AND BUYBACK PUZZLE
2 OECD JOURNAL: FINANCIAL MARKET TRENDS 2013/1 © OECD 2013
I. Introduction
The US Federal Reserve, the ECB, and the Bank of England have conducted a policy of low rates
and/or unconventional policies of buying out along the yield curve to reduce the term premium. Most
recently, announcements from the Bank of Japan suggest that they too will follow suit, and this has seen a
sharp fall in the yen. A weakening yen, and a rising risk appetite for yield in Asia, also risks seeing
quantitative easing spread beyond OECD economies to Asia. These policies are expressly designed to help
banks recover and deal with bad loans and to help the economy by encouraging risk taking: to increase the
relative attractiveness of corporate debt and equities, both of which may be used to finance long-term
investment. Portfolio investors have indeed taken more risk, forced out of low-yield low-risk assets in the
search for higher yields in equities and corporate bond markets. This has led to an extraordinary rally in
higher yielding corporate bonds, and the equity market too has rallied strongly. But so far this increased
portfolio risk taking has not translated into a surge of capital spending at the company level. The US
economy is picking up only moderately, and unemployment remains stuck at high levels. The traditional
job-producing cycle that is created by new net investment has not materialised as in past cycles. In Europe,
the recession seems to have gathered pace in early 2013, banks continue to cut lending and there is
certainly no sign of any pick-up in business investment.
At the same time corporate borrowing has been strong, equity issuance weak, and companies have
frequently decided to return cash flow to shareholders in the form of dividends and buybacks. The aim of
this study is to explore this puzzle in more detail. It does so by using microeconomic data on cash flow,
capital expenditure, dividends, and buyback decisions of thousands of observations from non-financial
companies included in the MSCI global stock index. Section II looks at some of the macroeconomic
indicators of the distortionary responses to the financial crisis that may be distorting investment decisions.
Section III then looks at some of the microeconomic characteristics of the data and the capital expenditure,
dividend and buyback outcomes. It hypothesises that the high level of uncertainty, the low cost of
corporate debt and the high cost of equity funding is favouring dividends and buybacks at the expense of
investment. Panel regression techniques are then used to explore whether this hypothesis is supported by
the data in section IV. Finally, some concluding remarks are made in section V on the likely causes of the
failure of policy to translate into better economic performance, and what areas policy makers might look to
improve this situation.
II. Macroeconomic Influences on the Investment Incentives
The effect of unconventional monetary policy, including the compression of term premium and risk
premiums by buying out along the curve is shown for the United States in Figure 1. The search for yield on
the part of investors has led to a rally in non-Government paper, as the risk free sovereign yield has
declined to record low levels (the USA 10-year bond rate is below 2% in early April 2013). While the
financial crisis began with excess leverage on the part of banks and households, currently being unwound
in a massive deleveraging, that bubble is being transferred to the securities markets and the corporate
sector, which is now issuing debt to lock-in low rates. In Asia as well, corporate issuance is in a bubble
phase, with many low quality and even unrated issues being many time over-subscribed.1
LONG-TERM INVESTMENT, THE COST OF CAPITAL AND THE DIVIDEND AND BUYBACK PUZZLE
OECD JOURNAL: FINANCIAL MARKET TRENDS 2013/1 © OECD 2013 3
Extreme low interest rates do not provide an incentive to invest2
With respect to bond financing, the interest rate on corporate debt ( i ) must be consistent with the
bond investor’s required return ( r ) given the personal tax rate ( t ):
(1)
The cost of equity ( k ) to the company is the dividend yield ( d ) plus the ex-dividend nominal return
for a dollar invested ( g ):
(2)
For the equity investor the cost of the company retaining that dollar for investment is reduced by the
dividend tax ( td ) not paid on the dollar (not distributed) but evaluated at the capital gains tax ( tg ) that
will be paid (for simplicity assumed to be paid on an accrual basis), so the cost of a dollar invested for the
shareholder is3:
(3)
The dividend and growth (ex-dividend nominal return) must be consistent with the equity investor’s
required return on the retained dollar invested ρ: i.e. the after tax dividend paid divided by cost of that
retained dollar c. plus the growth arising from the investment taxed at the capital gains tax rate:
(4)
And substituting for c:
(5)
Finally, capital market arbitrage requires that the investor’s return on both debt (the investor can
invest in the risk free asset) and equity, adjusted for the equity risk premium σ, must be equal,
(6)
So that substituting for ρ and r:
(7)
Notice that dividend taxes drop out, implying they are neutral for a dollar of earnings retained for
investment. Taxes on dividends are taxes on profits generated and distributed; only taxes on the dollar
invested is relevant in the case of a dollar retained for investment. The cost of equity capital for a retained
earnings investment is:
(8)
Figure 1 shows an empirical calculation of the cost of equity k.4 Since 2000, the US cost of equity has
drifted upwards from 8-3/4%, spiking at 11-1/4% at the end of 2008, and currently around 10%. This
occurred at the same time that the cost of corporate debt trended downwards for the past two decades in
one of the greatest bull markets in fixed income of all time, so the cost of debt-financed investment is now
very low. The Moody’s AAA US corporate bond average is sitting at 3.9% currently, from 7.75 at the start

LONG-TERM INVESTMENT, THE COST OF CAPITAL AND THE DIVIDEND AND BUYBACK PUZZLE
4 OECD JOURNAL: FINANCIAL MARKET TRENDS 2013/1 © OECD 2013
of 2000. The BAA corporate bond rate fell from 8.3% in 2000 to 4.9% at present, and the Merrill Lynch-
BoA below-investment grade high yield average index fell from 11% to 6.4%. For the first time in history,
the high-yield bond in the USA is less than the earnings yield on equities in the S&P500. The wedge
between the cost of debt and the cost of equity has widened sharply since 2000, i.e. the risk premium σ has
risen sharply. This has greatly increasing the incentive to issue debt and retire equity.
Figure 1: The US Bond Bubble and the Incentive for De-equitisation
Source: Datastream, OECD.
The cost of a dollar of debt to the firm is simply (1 + cr)(1 – tc), where cr is the credit risk premium.
The equity risk premium is:
(9)
Table 1 shows a hypothetical example of some of the sheer extent of the incentive to do buybacks. In
the first column of Table 1 the risk premium for something like the current situation is 6.5%: assuming a
normal earning growth of around 6%, a dividend yield of 3%, an extremely low risk free rate of 2%, a 15%
capital gains tax and a 40% personal rate. In the second column, if the bond market returned to a more
normal level in line with nominal GDP of 4.5%, the risk premium could fall to 5%, without any impact on
the cost of capital at 9%. In the third column, with bonds at 2%, there is an enormous incentive to carry out
share buybacks to boost share prices and returns to investors and, ultimately, to reduce the cost of retained
earnings for investment. In this example, the share price rally needed to return the risk premium to the
normal level of 5% would be 240%, an extreme bubble on any criteria. This would have the advantage of
reducing the cost of capital, but at the cost of financial fragility concerns arising out of the bubble (excess
leverage) and of a sharp reversal in equity prices when interest rates did rise. Such exuberance could be
avoided by raising taxes (loose monetary policy plus tight fiscal), as shown in the fourth column, to keep
the risk premium low alongside low interest rates. But this seems hardly sensible, as it raises the cost of
equity and works against capital spending.
The current policy of extreme low interest rates does not provide an incentive to borrow to invest. The
company can retain earnings, invest them at the risk free rate, and drive up the share price to the point
where the risk premium is normalized. At this point—provided the low rate of interest is sustainable—the
firm would invest again to grow earnings and share prices in line with trend growth. From the investors’
2.5
4.5
6.5
8.5
10.5
12.5
14.5
16.5
18.5
20.5
Jan
-85
May
-86
Sep
-87
Jan
-89
May
-90
Sep
-91
Jan
-93
May
-94
Sep
-95
Jan
-97
May
-98
Sep
-99
Jan
-01
May
-02
Sep
-03
Jan
-05
May
-06
Sep
-07
Jan
-09
May
-10
Sep
-11
Jan
-13
May
-14
BAA Corp
S&P Eq.Earn.Yld
Hi Yld Corp
AAA Corp
Cost of Equity
%

LONG-TERM INVESTMENT, THE COST OF CAPITAL AND THE DIVIDEND AND BUYBACK PUZZLE
OECD JOURNAL: FINANCIAL MARKET TRENDS 2013/1 © OECD 2013 5
point of view, the buyback strategy has the added advantage of capital gains tax deferral for the investor.
The above equations and example are based on the assumption of the taxation of accruals, but taxes are
typically collected when capital gains are realized. The boosting of share prices does not incur taxation
until the shares are actually sold.
If the extremely low bond rate is not sustainable, this strategy to reflate the economy is flawed and
carries with it new financial risks: the improvement in the values of structured products, margin finance
products, ETFs, bonds and equities will only help banks, investors and the economy for a temporary period
of time. The reversal of bond yields will affect all of these assets in a negative way.
Table1: Hypothetical Examples of the Risk Premium, Cost of Equity and Taxes
Source: OECD
Company buybacks and borrowing trends in the global economy
The MSCI companies and the USA
Figure 2 shows cash flow on the right hand vertical axis, and on the left hand side capital expenditure,
long-term borrowing and the sum of dividends and buybacks, all expressed as share of net sales, for the
4981 non-financial companies in the global MSCI stock index. The median firm values are shown. These
key outcomes of the board room decision show the following median characteristics:
Capital expenditure in the MSCI companies fell from 6% of sales in 1997 to around 4.5% 2 years
into the crisis, before recovering slightly to 5% by 2012.
From 2005 dividends and buybacks rose from around 1% of sales to 2-3/4% in 2012. In contrast
to investment, borrowing rose from 1-3/4% of sales in 2005, accelerating to 5-3/4% of sales in
the latest year 2012.
Figure 3 shows the same variables for those US companies in the MSCI global index.
Current With equil With buy Raise cap.
Variables bond back rally gains tax
Tax rate
Personal (t) 0.400 0.400 0.400 0.400
Capital gains (tg) 0.150 0.150 0.150 0.310
Corporate (tc) 0.300 0.300 0.300 0.300
Perpetual earnings growth 0.060 0.060 0.060 0.060
Risk free interest rate (i) 0.020 0.045 0.020 0.020
Credit risk premium (crp) 0.022 0.022 0.022 0.022
Corporate rate after company tax 0.029 0.047 0.029 0.029
Share price par value 1.0 1.000 1.000 2.429 1.000
Dividend cents per 1 dollar 0.030 0.030 0.030 0.030
Dividend yield (d) 0.030 0.030 0.012 0.030
Cost of capital (k) 0.090 0.090 0.072 0.090
Equity Risk premium 0.065 0.050 0.050 0.050

LONG-TERM INVESTMENT, THE COST OF CAPITAL AND THE DIVIDEND AND BUYBACK PUZZLE
6 OECD JOURNAL: FINANCIAL MARKET TRENDS 2013/1 © OECD 2013
Figure 2: MSCI Companies, Cash, Borrowing, Capital Expenditure and Buybacks
Source: Bloomberg, OECD
Figure 3: US Companies, Cash, Borrowing, Capital Expenditure and Buybacks
Source: Bloomberg, OECD
Consistent with the price bubble in corporate debt markets, shown in Figure 1, US corporate
borrowing has accelerated strongly since 2004. From 0.5% of sales in 2004, it rose to 4% of sales in 2007,
dropped back to 2-3/4% in the 2 years following the crisis and, responding to the search for yield, rose to
6% of sales in 2012. In contrast to this, US companies have seen investment in a trend decline as a
percentage of sales since 1997, with only a modest pick up along with corporate cash flow in 2011 and
2012.
0
5
10
15
20
25
0
1
2
3
4
5
6
7
1997 1998 1999 2000 2001 2002 2003 2004 2005 2006 2007 2008 2009 2010 2011 2012
%%
Total Cash Flow / Net Sales (RHS)
Long Term Borrowings / Net Sales
Cash Dividend Paid & Buybacks / Net Sales
Capital Expenditures / Net Sales
0
5
10
15
20
25
0
1
2
3
4
5
6
7
1997 1998 1999 2000 2001 2002 2003 2004 2005 2006 2007 2008 2009 2010 2011 2012
%%
Total Cash Flow / Net Sales (RHS)Long Term Borrowings / Net SalesCash Dividend Paid & Buybacks / Net SalesCapital Expenditures / Net Sales

LONG-TERM INVESTMENT, THE COST OF CAPITAL AND THE DIVIDEND AND BUYBACK PUZZLE
OECD JOURNAL: FINANCIAL MARKET TRENDS 2013/1 © OECD 2013 7
The case of Japan
The case of Japan in Figure 4 shows a very weak picture of investment—which has essentially halved
as a share of sales since 1997. Cash flow is very low compared to international peers, only 9% of sales in
2012 compared to 20% for the USA. While the effects of the business cycle are evident, the unusual
pattern of corporate behavior in Japan highlights a number of structural factors that other countries should
take note of:
Decades of low interest rates will not stimulate private investment following a period of chronic
over investment, excessive borrowing and banking crises in the 1980s and 1990’s.
The keiretsu structure which includes cash flow sharing, while reducing idiosyncratic risk at the
firm level, increases the correlation of firms in respect to market and global risks.5
External forms of finance are weak in bank dependent industrial groups. When banking crises
arise, investment is directly constrained. The failure to deal with the bad loan problems in banks,
keeping zombie companies alive instead of cutting them off has contributed to the poor
investment situation. The hope that banks would recover via operating profits and gradual write-
offs—implying regulatory forbearance—has not been a successful strategy.
Figure 4: Japanese Companies, Cash, Borrowing, Capital Expenditure and Buybacks
Source: Bloomberg, OECD
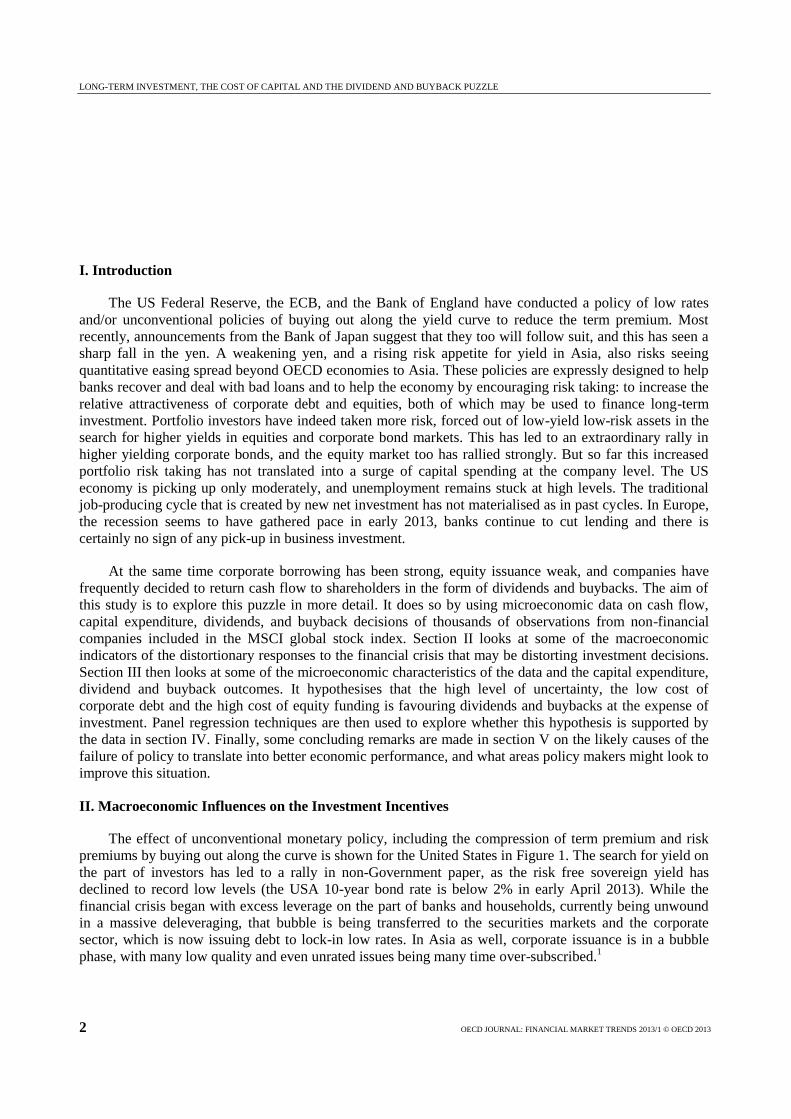
Europe
Europe, while more dependent on banks than the USA, does have a developed corporate bond market.
Cash flow is a little stronger overall than for Japan, but less than for the Unites States. There is a strong
correlation between cash flow and capital expenditure, and the fall in both following the tech bust in the
early 2000’s is notable. Subsequently, both cash flow and long-term borrowing picked up from 2004 until
the eve of the financial crisis. Dividends and buybacks rose during this period. Subsequently, borrowing
fell sharply between 2008 and 2010, as did buybacks, cash flow and investment. Investment of companies
has fallen as a share of net sales from 5-3/4% in the late 1990’s to 3-3/4% of sales by 2012.
0
2
4
6
8
10
12
14
0
1
2
3
4
5
6
7
1997 1998 1999 2000 2001 2002 2003 2004 2005 2006 2007 2008 2009 2010 2011 2012
%%
Total Cash Flow / Net Sales (RHS)Long Term Borrowings / Net SalesCash Dividend Paid & Buybacks / Net SalesCapital Expenditures / Net Sales
LONG-TERM INVESTMENT, THE COST OF CAPITAL AND THE DIVIDEND AND BUYBACK PUZZLE
8 OECD JOURNAL: FINANCIAL MARKET TRENDS 2013/1 © OECD 2013
Figure 5: European Companies: Cash, Borrowing, Capital Expenditure and Buybacks
Source: Bloomberg, OECD. This includes the UK and Switzerland.
Developed Asia
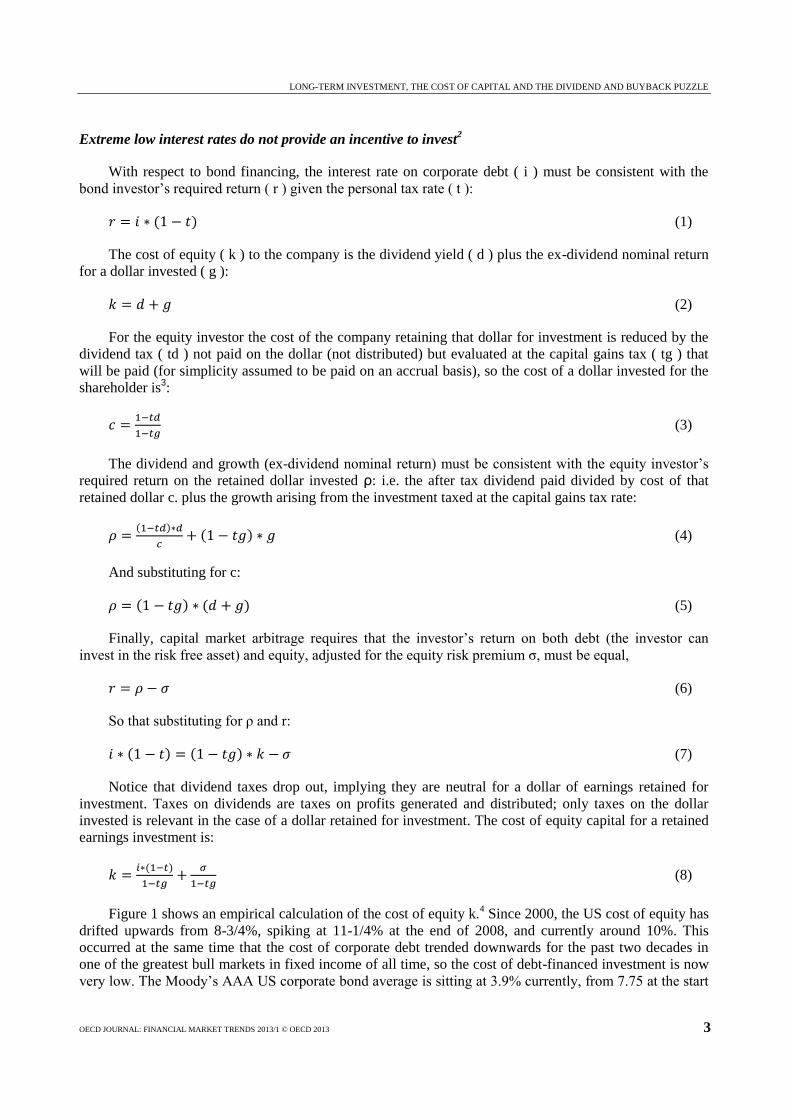
Figure 6: Developed Asia: Cash, Borrowing, Capital Expenditure and Buybacks
Source: Bloomberg, OECD. This includes: Australia, New Zealand, Hong Kong and Singapore.
This group, which includes Hong Kong, Singapore, Australia and New Zealand, is shown in Figure 6.
It is notable that investment is overall higher, within the range of 6-8% of sales (versus 3-1/2% to 6%
range in the advanced countries) and it has shown no sign of any trend decline. Long-term borrowing
picked up markedly since 2002, rising from 4% of sales in 2000 to over 10% in 2008, and there is a clear
correlation with both capital expenditure and buybacks since the mid 2000’s. Cash flow is more robust
than in the other developed countries and regions, at a stable 20% of sales (versus 15% to 20% in the USA,
12%-16% in Europe and 10%-15% in Japan).
0
5
10
15
20
0
1
2
3
4
5
6
1997 1998 1999 2000 2001 2002 2003 2004 2005 2006 2007 2008 2009 2010 2011 2012
%%
Total Cash Flow / Net Sales (RHS)Long Term Borrowings / Net SalesCash Dividend Paid & Buybacks / Net SalesCapital Expenditures / Net Sales
0
5
10
15
20
25
0
2
4
6
8
10
12
1997 1998 1999 2000 2001 2002 2003 2004 2005 2006 2007 2008 2009 2010 2011 2012
%%
Total Cash Flow / Net Sales (RHS)Long Term Borrowings / Net SalesCash Dividend Paid & Buybacks / Net SalesCapital Expenditures / Net Sales

LONG-TERM INVESTMENT, THE COST OF CAPITAL AND THE DIVIDEND AND BUYBACK PUZZLE
OECD JOURNAL: FINANCIAL MARKET TRENDS 2013/1 © OECD 2013 9
The Emerging Market Countries
The emerging countries exhibit a very close correlation between cash flow and investment. This group
consists mainly of the BRICS, Korea, Taiwan, and some smaller countries. Long-term borrowing in debt
markets is relatively small, collapsing after the Asia crisis from 7% of sales in 1997 to 3-1/2% in 2000.
Subsequently, there has been a slow recovery back to around 6% of sales in 2012. Buybacks have picked
up somewhat, but to a modest level of 2-1/2% in 2007 and 2012.
Figure 7: Emerging: Cash, Borrowing, Capital Expenditure and Buybacks
Source: Bloomberg, OECD. This includes the BRICS, Taiwan, Korea, Mexico.
Summary
In sum, the buybacks and borrowing trend is a phenomenon mainly in North America and Europe.
Japan shows very low cash flow and investment is in a trend decline. Developed Asia has the strongest
investment with long-term borrowing playing a role in investment, with only moderate buybacks. Cash
flow and moderate borrowing drives the investment in emerging countries.
IV. Determinants of Long Term Investment
The board room decisions concerning capital expenditure, dividends and buybacks are complex,
involving the cost of borrowing, the cost of equity, tax and risk premium issues. To investigate the
determinants of firms’ (excluding financials) long-term investment and cash returned to shareholders, two
fairly simple independent equations are estimated, incorporating microeconomic and macroeconomic
variables6. In the investment equation, the dependent variable is the share of capital expenditures in firms’
total sales (CAPEX_Sales). In the dividends-buybacks equation, the dependent variable is the share of cash
dividends paid plus cash spent on buybacks in the firm’s total sales (DivBB_Sales).
The explanatory variables
For the CAPEX_Sales equation, the explanatory variables are those referred to in section III:
In the above discussion, the difference between the cost of equity based on retained earnings and the
cost of debt was argued to be a major determinant of in the incentive to engage in both long-term
borrowing and share buyback strategies—currently at quite an extreme point in the USA and Europe.
0
5
10
15
20
25
30
35
0
2
4
6
8
10
12
1997 1998 1999 2000 2001 2002 2003 2004 2005 2006 2007 2008 2009 2010 2011 2012
%%
Total Cash Flow / Net Sales (RHS)Long Term Borrowings / Net SalesCash Dividend Paid & Buybacks / Net SalesCapital Expenditures / Net Sales

LONG-TERM INVESTMENT, THE COST OF CAPITAL AND THE DIVIDEND AND BUYBACK PUZZLE
10 OECD JOURNAL: FINANCIAL MARKET TRENDS 2013/1 © OECD 2013
The cost of equity (k) which is measured as the dividend yield for the national benchmark plus
the trend rate of growth of earnings.7 A higher cost of equity discourages firms to retain earnings
for the purpose of capital expenditures. CAPEX_Sales is expected to have a negative relationship
with this variable.
The cost of debt (i_AAA) is the yield of AAA-rating corporate bond index of the country
location of the company. A higher bond yield discourages firms from borrowing to increase their
capital expenditures. CAPEX_Sales is expected to have a negative relationship with this variable.
In the above discussion, buybacks and borrowing trends are quite different in the USA, Europe and
Japan compared to emerging countries. Computing the cost of equity and measuring the bond
yield at the country level controls for possible heterogeneity across countries in the regressions.
The accelerator effect on private long-term investment caused by economic growth is also a key
determinant of long-term investment.
Economic growth is measured by GDP growth in the home country (GDP). It is the annual per
cent change in gross domestic product of the country location of the firms. The CAPEX_Sales is
expected to have a positive relationship with this variable. Table 2 divides all of the companies
into quartiles, with the lowest investment/sales group in the top panel, and the highest in the
bottom. There is a clear positive relationship between GDP growth and the propensity to invest.
Finally, uncertainty is measured by the firm’s own stock price volatility.
Uncertainty (σ) is the annual standard deviation of the firm’s daily stock price. This is a firm-
specific variable that proxies uncertainty about the longer-term outlook for the firm
CAPEX_Sales is expected to have a negative relationship with this variable.
For the dividends and buybacks equation, the explanatory variables are:
The relative cost of equity versus debt: (k – i_AAA), which is the cost of equity as defined above
minus the corporate bond rate defined above. DivBB_Sales is expected to have a positive
relationship with this variable. If the cost of retaining a dollar to invest is high and a firm can
borrow very cheaply, it can reduce its costs by borrowing to pay dividends and to buy back
shares.
The average earning yield by sector: (EARN_YLD), which is the ratio of last twelve months
earning per share to current market price for the sector. Companies in low-growth sectors with a
high earnings yield (low PE), such as utilities, telecommunications, oil and basic materials
sectors (See Figure 8) pay higher dividends that high growth high PE companies. This variable
controls for possible heterogeneity across sectors in the regressions. DivBB_Sales is expected to
have a simple positive relationship with this variable.

LONG-TERM INVESTMENT, THE COST OF CAPITAL AND THE DIVIDEND AND BUYBACK PUZZLE
OECD JOURNAL: FINANCIAL MARKET TRENDS 2013/1 © OECD 2013 11
Figure 8: Average PER and Capital Expenditures (To Sales) by Sector Over the Period 1997-2011
Source: Datastream, OECD.
The data and the model
The econometric analysis is run on a global sample of 4143 publicly traded companies from 31
countries8 and 10 sectors
9 over the period Q1_1997- Q4_2011. Quarterly market and macroeconomic data
were extracted from Datastream. Company data were also extracted from Bloomberg. Table 2 provides
some descriptive statistics of the sample.
Table 2: Some Characteristics of the Data
Source: Datastream. This table reports the average value from Q1 1997 to Q4 2011 of the ratio shown.
In the investment equation, the dependent variable (CAPEX_Sales) at time t is regressed on a set of
microeconomic and macroeconomic variables described below that correspond to time t-1, to identify the
Global
Basic Mat
Cons. Goods
Cons. ServicesHealthcare
Industrials
Oil & Gas
Technology
Telecoms
Utilities
15
17
19
21
23
25
27
29
0 5 10 15 20 25
PE (%)
Capex / Sales (%)
Capital
expenditures
/ total sales
(%)
Cost of
equity (%)
Earning
Yield,
Average by
sector
Stock price
annual
volatility (%)
Annual GDP
growth rate
(%)
Min - 25%
Mean 1.3 9.51 4.92 28.71 1.55
Median 1.40 9.17 5.27 27.04 1.88
Std. Dev. 0.7 1.34 1.71 9.78 3.00
25% - 50%
Mean 3.4 9.50 5.01 29.04 1.86
Median 3.41 9.12 5.30 27.44 2.14
Std. Dev. 0.6 1.33 1.59 9.80 2.86
50% - 75%
Mean 6.3 9.48 5.00 28.86 1.93
Median 6.06 9.12 5.26 27.49 2.11
Std. Dev. 1.2 1.39 1.62 9.54 2.94
75% - Max
Mean 21.1 9.80 5.14 29.75 2.47
Median 15.35 9.57 5.40 28.26 2.48
Std. Dev. 15.3 1.46 1.81 10.23 3.21

LONG-TERM INVESTMENT, THE COST OF CAPITAL AND THE DIVIDEND AND BUYBACK PUZZLE
12 OECD JOURNAL: FINANCIAL MARKET TRENDS 2013/1 © OECD 2013
main factors that drive the board room decisions concerning capital expenditure, dividends and buybacks.10
In the dividend equation, the dependent variable (DivBB_Sales) is regressed on the one-year lagged
value11
of microeconomic and macroeconomic variables identified in the previous literature.
The empirical model is specified by the following equations:
{
(10) and (11)
Both of these equations are estimated with least squares on the panel. After testing for cross-section
and time-fixed versus random effects, both found to be significant, both sets of effects were included in the
regressions.
The results
Regressions are run on the panel of MSCI companies for the years 1997 to 2011, involving some
212,632 observations. The results are shown in Table 3.
Table 3: Long-Term Investment and Buybacks (excluding financials)
Note: This table shows the results of estimating an equation system for an unbalanced panel of 4143 publicly traded companies from 31 countries and 10 sectors over the period Q1 1997- Q4 2011. See section IV for the definition of the explanatory variables. Cross-section and time fixed effects are used in the regressions as is the White cross-section covariance method. *, ** and *** indicate statistical significance at the 10%, 5% and 1% levels, respectively.
For the investment equation:
The cost of equity variable is significant at the 1% level: so when cost of equity rises, there is
strong evidence that firms are likely to be reducing their long capital expenditure programs. The
rate of interest on AAA corporate debt variable is not supported by the data. This may suggest
that the AAA corporate bond rate is not is not a representative borrowing rate for the corporations
Capital Expenditures Equation
Cost of equity (%)-0.18 ***
(-4.65)
AAA corporate bond yield (%)0.01
(1.13)
Stock price annual volatility (%)-0.01 **
(-1.94)
Annual GDP growth rate (%)0.07 ***
(6.62)
Dividend and Buybacks Equation
Cost of equity - AAA corporate bond yield
(%)
0.03 ***
(4.89)
Earning Yield, Average by sector0.002 ***
(12.52)
Total Obs. 212,632

LONG-TERM INVESTMENT, THE COST OF CAPITAL AND THE DIVIDEND AND BUYBACK PUZZLE
OECD JOURNAL: FINANCIAL MARKET TRENDS 2013/1 © OECD 2013 13
in each country when considering their investment decisions. However, all corporate bond rates
are correlated, and it would be surprising to obtain this result if long-term corporate borrowing
was systematically negatively related to investment. An alternative hypothesis is that the use of
long term-debt is related to tax and interest rate incentives. For example, in current low rate
environment it makes sense for firms to lock in low rates, carry out buybacks to boost share
prices up to the point where the risk premium and the cost of capital are reduced back to normal,
and investment via retained earnings becomes more attractive. M&A activities, privatisation and
de-equitisation accompany very low rates, rather than incentivising Investment projects.
Uncertainty, as captured by the volatility of the firm’s stock price, is of the correct negative sign
and strongly supported by the data.
Finally, the accelerator effect in the growth rate of the economy is also supported by the data at
the 1% level. An increase in annual GDP growth boosts companies’ long term investment
relative to sales.
For the dividend and buybacks equation:
The cost of equity versus the AAA corporate bond rate is of the correct sign and is strongly
supported by the data, with significance at the 1% level. This provides strong support for the
above views: that a high cost of equity and a low borrowing rate (see Figure1 for example)
encourages firms to carry out buybacks and to pay higher dividends to shareholders instead of
investing.
In addition, the average earning yield by sector is significant at the 1% level.
V. Concluding Remarks
Interest rates are at extremely low levels to support banks, and the search for yield has pushed the
liquidity driven speculative bubble from real estate, derivatives and structured products markets
into the corporate debt market. Equities have rallied strongly too, as investors are forced out of
low-yielding cash and bonds. This asset cycle is certainly helping banks reduce losses on illiquid
securities market products hidden on their balance sheet. In principle, the equity rally could also
reduce the cost of equity making retained earning investment projects more attractive.
However, as shown in Table 1, equities would have to rally to unrealistic levels to restore even
normal equity risk premia at current bond yields. This should not be allowed to happen. Bonds
will have to move back in line with nominal GDP trend growth before it is safe to invest for long-
term growth. But this will not happen smoothly. Markets are assuming that this transition from
low to higher rates can be handled smoothly by policy makers, when in fact this assumption may
not be validated. In that case, bond volatility would likely be large, and banks that dominate
derivatives businesses have not been separated to reduce the riskiness of a sharp rise in bond
yields and renewed falls in asset prices. New fragility problems may arise in banks at this point in
time.
The paper presents a panel model using more than 4,000 global companies and shows that the
Capex decision in general depend on the cost of equity, the accelerator and uncertainty, whereas
buybacks are driven mainly by the gap between the cost of equity and debt. Right now the
incentive structure implied by very low interest rates, which may be sustained for a long time,
together with tax incentives, works directly against long-term investment. Debt finance is cheap,

LONG-TERM INVESTMENT, THE COST OF CAPITAL AND THE DIVIDEND AND BUYBACK PUZZLE
14 OECD JOURNAL: FINANCIAL MARKET TRENDS 2013/1 © OECD 2013
while the cost of equity capital needed for risky long-term investment is still high (unaffected by
low rates). This combination provides a direct incentive for borrowing to carry out buybacks (de-
equitisation), shown to be at record levels in section III.
In an environment of weak sales growth and high uncertainty, companies (particularly in Anglo-
Saxon countries) are keeping their capital expenditure contained, and they are taking advantage
of cheap corporate borrowing rates to issue debt and build up cash flow. This cash flow is used
for paying dividends and carrying out buybacks of shares. Many companies that embark on
investment now are punished by the selling down of their shares. This makes it difficult for
policy to feed into normal recovery patterns—for investment to pick up, create jobs, and
eventually cause the consumer to follow.
Weak investment reduces future potential growth, and this in turn creates inflation and growth
bottlenecks.
The best way to improve long-term investment, are policies that return interest rates to normal
levels, and reduce the distorted incentives for buybacks and low investment.
Notes
1. For example, China Rail 10 year BBB+ was 16 time over-subscribed, and the unrated Agile Property from
China was 10 times oversubscribed.
2. See Cohen, Hasset and Hubbard, (1999). This paper ignores inflation, given the sample period explored
later on.
3. This may be double taxed if there is no company tax credit at the company tax rate tc and the personal rate
t, so that (1-td) is (1-t-tc-tc.t). Notice that if the capital gains tax and the dividend tax were aligned, the cost
would just be the $1 retained.
4. The 10-Year US government bond yield plus the equity risk premium equals the dividend yield plus
expected trend earnings growth of the S&P 500.
5. Hoshi et al. (1991) and Shin and Park (1999) who find that non Keiretsu / Chaebol group firms in Japan
and Korea exhibit positive sensitivity of investments to cash flows. Hoshi et.al. found that firms that tried
to leave bank structures in the 1980’s were financially constrained. This of course worked against these
firms in the long-running bank crisis.
6. Further work could look at systems estimation of more complex models. This work is provided to give a
general indication of the tendencies in more than 4,000 global companies.
7. In other words, the 10-Year government bond yield plus the equity risk premium equals the dividend yield
plus expected trend earnings growth of the national equity benchmark.
8. These firms can be located in North America (United States, Canada), Europe (Austria, Belgium,
Denmark, Finland, France, Germany, Greece, Ireland, Italy, Netherlands, Norway, Portugal, Spain,
Sweden, Switzerland, United Kingdom), Asia-Pacific (Australia, Japan, New-Zealand, Hong-Kong,
Singapore), Emerging countries (Brazil, China, India, Mexico, Russia, South-Africa, South-Korea,
Taiwan).

LONG-TERM INVESTMENT, THE COST OF CAPITAL AND THE DIVIDEND AND BUYBACK PUZZLE
OECD JOURNAL: FINANCIAL MARKET TRENDS 2013/1 © OECD 2013 15
9. These sectors are: oil and gas, basic materials, industrials, consumer goods, healthcare, consumer services,
telecommunication, utilities, financials and technology.
10. From this perspective, a simple Granger causality idea helps to mitigate potential endogeneity issues.
11. The aim is to identify the main factors that have contributed to impact the long term investment strategy or
dividend payment policy of firms.
References
Cohen, D., Hassett, K.A. and Hubbard, R.G., (1999), “Inflation and the User Cost of Capital”, in The
Costs and Benefits of Price Stability, Martin Feldstein (ed), NBER.
Hoshi, T., Kashyap, A. and Scharfstein, D., (1991), Corporate Structure Liquidity and Investment:
Evidence from Japanese Industrial Groups, Quarterly Journal of Economics, 106, 33-59.
Shin, H. and Park, Y.S., 1999, “Financing Constraints and Internal Capital Markets: Evidence from
Korean ‘Chaebols”’, Journal of Corporate Finance, 33, 169-191.