Embed Size (px)
Citation preview

Long-Term Management Objectives Phase III (2016 to 2020)
Three-Year Management Plan 2016 to 2018
January 27, 2016 Canon Marketing Japan Inc. Masahiro Sakata, President

Long-Term Management Objectives Phase III (2016 to 2020)
2

Group Mission
Help resolve social issues with advanced imaging & IT solutions.
3 * imaging refers to all of Canon’s technologies related to input and output images.
Group Vision
The Canon Marketing Japan Group understands and grows with its
customers.
2020 Group Mission and Vision

Image of Achieving our Mission and Vision
Strengths of manufacturer’s sales companies
Customer base Technical skills
Create imaging & IT solutions
Vision: understands and grows with its customers
Mission: Help resolve social issues
Create results with its customers
Customers Canon Group IT
4

Shifting to a Customer-Oriented Framework Current Future
5
Key Products ×
Channels
Markets/Customers ×
Solutions Business Solutions
Document Sol
Office devices
MFP Direct selling (large, medium, small)
Business partner PPS
IT Solutions
IT Products
SI Services
IT Infrastructure Service
Embedded Systems
Imaging Systems
Printers & Cameras Mass retailers Camera stores
Industrial / Medical Personal Life
Small business operators
Offices by industries / IT areas (Large to middle-sized companies)
Specific focal areas Commercial &
Industrial Printing Medical
& Healthcare Imaging Creation
Cross-industry areas
Security Outsourcing IT Infrastructure
Cloud

Group Management Goals ¥ billion
6 6
659.4 646 660 686 725
800
25.1 26.6 27 29.1
35 40
0
100
200
300
400
500
0
1,000
2,000
3,000
4,000
5,000
6,000
7,000
8,000
9,000
2014年 2015年 2016年 2017年 2018年 2020年 売上高 営業利益
2014 2015 2016 2017 2018 2020
Net Sales Operating Income
900
800
700
600
500
400
300
200
100

Growth Scenario Categories & Strategy Overview Strategy Overview Key Products and Services
Canon’s Profitability
Growth Areas
Achieve and maintain No.1 market share of key products
Increase productivity by reforming sales and services
MFP and LBP Cameras, Inkjet Printers, Digital X-ray camera (CXDI)
Canon’s Growth Areas
Expand the network camera business • Cooperate with Axis and Milestone • Enhance solutions
Expand the production printing business area • Upstream and downstream processes of commercial printing • Package printing, industrial printing area
Network Cameras, Projectors, Production Printing, Business Inkjet Printers, Commercial Imaging Equipment, DreamLabo, Machine Vision
Independent Growth Areas
Strengthen and expand IT solutions in all businesses
Change from entrusted development business to solution proposing Sier
Expand cross-industry solutions (security, outsourcing, etc.)
Turn Industrial Business Unit into a commercial firms
Strengthen solutions in the medical business
IT Solutions Industrial Equipment (semiconductors and non-semiconductors) Medical Solutions, Infection Control, and Dispensing Equipment
7 7

0
1,000
2,000
3,000
4,000
5,000
6,000
7,000
8,000
2015年 2016年 2017年 2018年 2020年 キヤノン収益向上領域 キヤノン成長領域 独自成長領域
Key Management Indicator 1: Shifting Weight to Growth Areas
¥billion
646.0 725.0
800.0
-0.3%
+14.2%
Annual avg. growth rate:+4.4%
+8.2%
63%
37%
50%
Beyond CANON
40%
Beyond JAPAN
8%
8
2015 2016 2017 2018 2020 Canon’s Profitability Growth Areas
Canon’s Growth Areas Independent Growth Areas
800
700
600
500
400
300
200
100

Key Management Indicator 2: Creation of New Service Businesses
143.7 200.0
0
1,000
2,000
3,000
4,000
5,000
6,000
7,000
8,000
2015年 2016年 2017年 2018年 2020年
独自サービスビジネス キヤノン関連ストックビジネス ハードウェアビジネス
2015 2016 2017 2018 2018 2020
646.0
22%
25% +8.4%
725.0 800.0
*2: Maintenance of Canon products and cartridges, etc. *1: IT Solutions & Maintenance of non-Canon products 9
Independent Service Business Canon-related Stock Business Hardware Business
Annual avg. growth rate:+4.4%
*2 *1
800
700
600
500
400
300
200
100
¥billion

10
Six Basic Policies and Priority Strategies (1) Basic Policies Priority Strategies
1 Become the “true
partner”of our customers
Expand both large company solutions by industry and SME solutions Strengthen customer relations through
digital marketing
2
Maintain the high profitability base of Canon’s Profitability
Growth Areas
Achieve and maintain No.1 market share of key products Reform the sales approach (improve
CRM, promote EC)
3
Turn Canon Growth Areas into core
businesses (improve solution skills
and promote cooperation)
Expand the network camera business through cooperation with Axis and Milestone. Expand the business area into the upstream
and downstream processes of commercial printing, and enter the package printing and industrial printing markets.
10
11
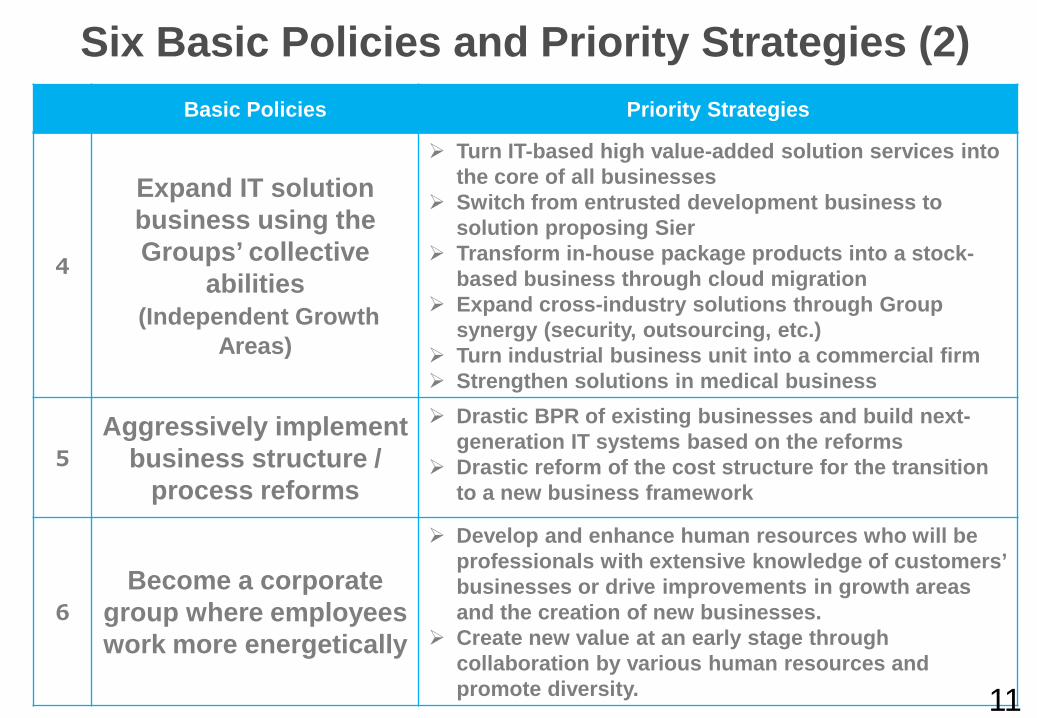
Six Basic Policies and Priority Strategies (2) Basic Policies Priority Strategies
4
Expand IT solution business using the Groups’ collective
abilities (Independent Growth
Areas)
Turn IT-based high value-added solution services into the core of all businesses
Switch from entrusted development business to solution proposing Sier
Transform in-house package products into a stock-based business through cloud migration
Expand cross-industry solutions through Group synergy (security, outsourcing, etc.)
Turn industrial business unit into a commercial firm Strengthen solutions in medical business
5 Aggressively implement
business structure / process reforms
Drastic BPR of existing businesses and build next-generation IT systems based on the reforms
Drastic reform of the cost structure for the transition to a new business framework
6 Become a corporate
group where employees work more energetically
Develop and enhance human resources who will be professionals with extensive knowledge of customers’ businesses or drive improvements in growth areas and the creation of new businesses.
Create new value at an early stage through collaboration by various human resources and promote diversity. 11

Key Management Indicators ¥ billion
2015 Results
2018 Targets
2020 Targets
Net sales 646.0 725.0 800.0 Gross profit margin 36.1% 35.0% 35% SG&A expenses to
net sales 32.0% 30.2% 30% Operating margin 4.1% 4.8% 5.0%
Ratio of sales from Growth Areas 37% 43% 50%
Ratio of sales from Beyond CANON 33% 34% 40%
Ratio of sales from Independent
Service Business 22% 24% 25%
12

Three-Year Management Plan (2016 to 2018)
13

14
Group Consolidated Financial Targets Results Three-year Plan Targets
2014 2015 2016 2017 2018
Net sales 659.4 646.0 660.0 686.0 725.0 YoY growth rate - -2.0% +2.2% +3.9% +5.7%
Operating income 25.1 26.6 27.0 29.1 35.0
(margin) 3.8% 4.1% 4.1% 4.2% 4.8%
Ordinary income 26.6 28.0 28.2 30.2 36.0 (margin) 4.0% 4.3% 4.3% 4.4% 5.0%
Net profit 16.0 15.7 17.7 19.1 23.0 (margin) 2.4% 2.4% 2.7% 2.8% 3.2%
EPS ¥124 ¥121 ¥137 ¥147 ¥177 ROE 6.1% 5.7% 6.3% 6.5% 7.5%
Free Cash Flow (3 year total)
11.2 (total for 2013 to 2015)
28.7 (total for 2016 to 2018)
¥ billion
14

* The percentages in the lower part of each segment indicate the YoY growth rate for sales and the operating margin for operating income.
Net Sales and Operating income Target by Segment
15
Results Medium-term Plan CAGR 2015
→2018 2014 2015 2016 2017 2018 Net
Sales operating income
Net Sales
operating income
Net Sales
operating income
Net Sales
operating income
Net Sales
operating income
Net Sales
Business Solutions
330.2 8.2 326.9 9 334.1 9 348 11 368.1 13.5 +4.0%
- 2.5% -1.0% 2.8% +2.2% 2.8% 4.2% 3.2% 5.8% 3.7% -
IT Solutions
148.8 3.2 141.2 4.1 145.8 4.4 154.2 4.6 168.7 6.7 +6.1%
- 2.1% -5.1% 2.9% +3.3% 3.0% 5.8% 3.0% 9.4% 4.0% -
Imaging Systems
185.4 14.3 178.7 13.8 180.3 13.3 180.5 13 183.1 13.5 +0.8%
- 7.7% -3.6% 7.7% +0.9% 7.4% +0.1% 7.2% +1.4% 7.4% -
Industrial / Medical
28 -1 27.2 -0.7 26.7 -0.3 30.7 0.1 33.6 0.9 +7.3%
- - -3.1% - -1.7% - +15.0% 0.3% +9.4% 2.7% -
Corporate / Elimination -33 0.4 -27.9 0.4 -26.9 0.4 -27.4 0.4 -28.5 0.4 -
Group consolidated
659.4 25.1 646 26.6 660.0 27.0 686 29 725 35 +4.0%
- 3.8% -2.0% 4.1% +2.2% 4.1% +3.9% 4.2% +5.8% 4.8%
¥ billion
15

Medium- to Long-term Growth Strategy by Growth Scenario
16 16

Canon’s Profitability Growth Areas
Canon’s Profitability
Growth Areas
MFP, LBP Cameras, Inkjet Printers, Digital X-ray camera (CXDI)
17

Canon’s Profitability Growth Areas: Document Business
18
1 Increase competitiveness in middle-sized market, increase MFP market share
2 Expand the sales of related solution products (IT outsourcing, document / security solutions)
3 Shift the focus of LBP business to the key industries -distribution/retail, hospitals/dispensing, and government offices
18
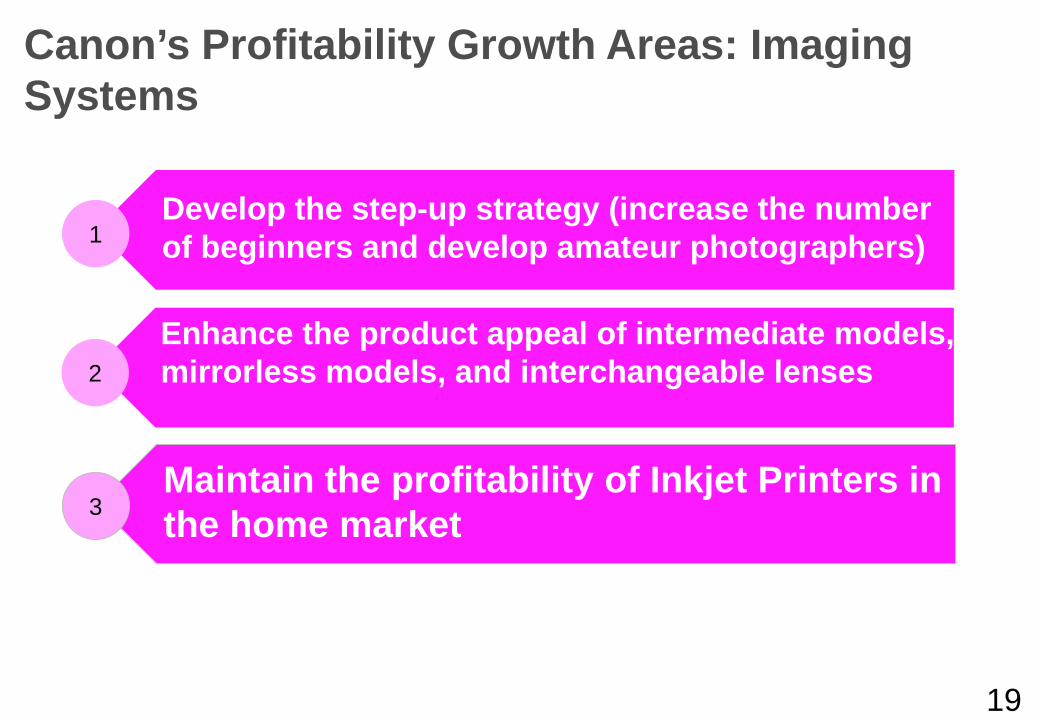
Canon’s Profitability Growth Areas: Imaging Systems
19
1 Develop the step-up strategy (increase the number of beginners and develop amateur photographers)
2 Enhance the product appeal of intermediate models, mirrorless models, and interchangeable lenses
19
3 Maintain the profitability of Inkjet Printers in the home market
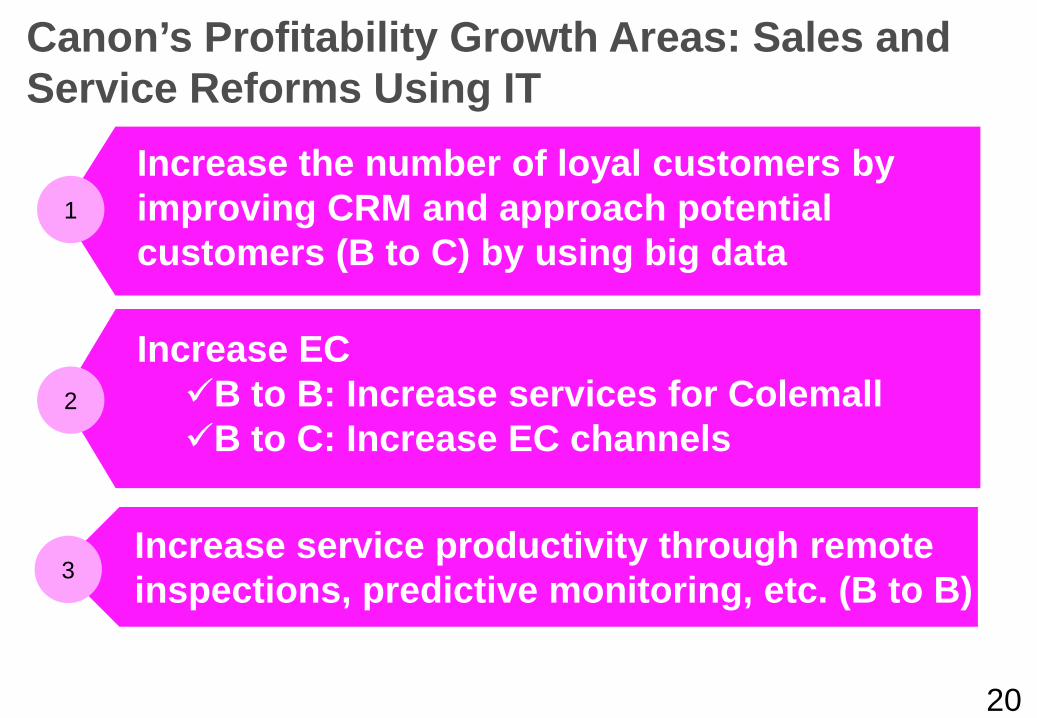
3 Increase service productivity through remote inspections, predictive monitoring, etc. (B to B)
Canon’s Profitability Growth Areas: Sales and Service Reforms Using IT
1
Increase the number of loyal customers by improving CRM and approach potential customers (B to C) by using big data
2
Increase EC B to B: Increase services for Colemall B to C: Increase EC channels
20
Canon Growth Areas Canon
Growth Areas
Network Cameras, Projectors, Production Printing Business Inkjet Printers Commercial Imaging Equipment, DreamLabo Machine Vision
21

Canon Growth Areas: Network Cameras
22
Avg. growth rate until 2018: 37 %
Provide various solutions through alliances
Increase number of product and solution
lines
Expand channels Develop contacts with new
customers
Cooperation with Axis and Milestone
Further improvement of sales system Cloud services
Canon +
Partners
Electronic material stores, etc.
22

Canon Growth Area: Production Printing
23
Existing Areas
Books Newspaper
For Business Invoices
Design
New Areas
Soft packing
Paper containers
Packaging / Industrial Printing
Wallpaper
Textile
Glass
Full-fledged entry into commercial printing sector
23
Avg. growth rate until 2018: 11 %
Focal Areas
In addition to increasing the number of business areas, convert from focus on merchandise sales to integrated solution models ranging
from upstream systems to downstream processes.
Catalogs, leaflets Direct Mail
Photo books
Signs
Ledgers and forms
CAD Drawings

Canon Growth Areas: Commercial Imaging Equipment
24 24
Also consider entering image production and technical service (content-related) businesses
Become a one-stop total imaging service company with excellent 4K/8K technologies
Avg. growth rate until 2018: +21%
SI
Soft ware Equipment
Photography Editing Distribution, broadcasting
Management (archives)
Equipment sales
Solutions
Current business area
• Cinema EOS • Cinema lens for
broadcasting • Robot cameras
• Recorders • Editing devices • Displays
• Distribution/ transmission facilities
• Media cards
Expand the customer base by including broadcasting, filming, and distribution companies.

Independent Growth Areas
Independent Growth Areas
IT Solutions Industrial Equipment (semiconductors and non-semiconductors) Medical Solutions, Infection Control, and Dispensing Equipment
25

IT Solution Business
Direction of the IT Solution Segment Functionality
26
Solutions driven
by ITS business unit
Solutions by cooperation with other
business units
Improve functions by linking
Establish IT solution business unique to Canon MJ Group

Image for Expanding Range of IT Solution Business in All Businesses
Products
SI services (development)
Medical imaging
Network Cameras
Cloud Embedded systems
IT Infrastructure service
IT solutions
Imaging systems
Business solutions
Industrial sector
Security
Engineering design solutions
Medical sector
Medical information
Digital marketing
IoT IoT
IoT
Customers Using know-how to strengthen solution skills
27

Sales Targets for Group IT Solutions
28 ※ 2020年:18年以降2年間の平均伸び率・伸び額
2015 Results* 2018 2020
ITS Segment 141.2 168.7 200.0 Other segments 58.3 76.0 80.0 Inter-segment sales -27.4 -27.7 -30.0 Group IT Solutions – total 172.1 217.0 250.0
28
¥ billion
28
Group consolidated 646.0 725.0 800.0 Ratio of sales from Group IT Solutions 27% 30% 31%
* 2015 Results are not equal to the figures on page 16, “[Reference] Overall sales of IT Solutions,” of “FY 2015 Results Presentation” which is disclosed separately, due to recalculation based upon our aggregation method of the Long-Term Management Objectives.

IT Solution Business Strategy (1)
Entrusted Development
(development from scratch) Solution SI
•Internal IT system and solution development •Conversion of knowledge for system development for industry users into solutions
Conversion to business based on SI service solutions Expand market presence Growth through new business
areas Increase profitability and
productivity
29
Customers
Direction of SI service reform
Deep understanding Appropriate proposals

IT Solution Business Strategy (2)
Partner cloud (AWS, etc.)
SOLTAGE
Customers
Cloud integration
Increase value-added services
Application development System operation service Maintenance service
Increase cloud-related services
Expand the system integration business Establish a stable business base
Strengthening Cloud Business
30
Cloud version of in-house package

Independent Growth Areas: Security
Canon Security Cloud Physical Security
Group of security sensors that employ network cameras
Information Security Integrated security service for companies
Build a new service business model by using Canon Group’s advanced devices (Network Cameras) and by increasing IT security services through cloud migration and the use of data analysis systems.
Big data Recognition and analysis applications
Security infrastructure platform 31

Independent Growth Areas: Outsourcing
Customers
Core operations
Non-core operations
Non-core operations
Non-core operations
Canon MJ Group Outsourcing Business Model
Canon ITS
Canon BA
Edifist
Device management Internal printing
General affairs
Sales support
Personnel
Examples
Support desk and call center operation Clerical work for sales, office support
Salary payment, Social insurance, etc. Educational training / welfare management,
stock ownership 32
Canon PPS

Independent Growth Areas: Medical Solutions
33
Medical imaging
business
Electronic medical record
business Healthcare business
Hospitals/clinics Medical checkup facilities
Dispensing pharmacies
Digital Health Base
Equipment systems Documents Life logs ・・・・
Develop into solution businesses (into IT &
cloud migration)
In the future, these will be directed to life / nonlife Insurance and personal businesses
Medical imaging
cloud
Medical checkup
cloud
Healthcare cloud
Image data

Independent Growth Areas: 3D Solutions
Canon MJ 3D Solutions
Printers for
medical market
Printers for
Education market
Printers for design
and manufactu
ring
3D printing service
3D CAD software for manufacturi
ng and construction 3D-
related software
Printers for
housing construct
ion
MR for manufacturing and construct
ion
Establish Canon’s presence in the 3D solution industry by offering various printers and Canon’s original solutions, such as mixed reality (MR) and CAD, in growing markets.
34

Investing in Growth
Breakdown of Investment Cumulative Investment
2016 to 2018
General Investment
Main Investment
Items
Data center improvement ¥8.5 billion
Rental business ¥25.0 billion
Investment in IT ¥8.5 billion
Total General Investment ¥54 billion
Strategic Investments M&A-related funds, etc. ¥40 billion
35

Shareholder Dividend Policy Pay dividends with comprehensive consideration of the
medium-term profit plan, investment plan, and cash flows, based on a consolidated payout ratio of at least 30%
36
20 24 24 40 45 45
2011 2012 2013 2014 2015 2016 (Forecast)
(Yen)

The performance and future projections made in this document are based on information available at the present time, and include potential risks and inaccuracies. Owing to various factors, actual results may differ substantially from these projections. All estimated/actual performance figures are for consolidated performance.
*Fractions of less than 100 million yen are rounded off in this document.
Canon Marketing Japan Group