Embed Size (px)
Citation preview

Long-term programming of CD8 T cell immunity by perinatal exposure to glucocorticoids
Jun Young Hong1, Jaechul Lim1, Fernando Carvalho1, Jen Young Cho1, Bharat Vaidyanathan1,2, Shuang Yu1, Charles Annicelli1, W. K. Eddie, Ip1,3, Ruslan Medzhitov1,4,5
1Department of Immunobiology, Yale University School of Medicine, New Haven, CT 06510, USA
2Current address: EMD Serono Research and Development Institute, Billerica, MA 01821, USA.
3Current address: Department of Immunology, Mayo Clinic, Rochester, MN 55905, USA.
4Howard Hughes Medical Institute, Chevy Chase, MD 20815, USA.
5Lead Contact
Summary
Early life environmental exposure, particularly during perinatal period, can have a life-long impact
on organismal development and physiology. The biological rationale for this phenomenon is to
promote physiological adaptations to the anticipated environment based on early life experience.
However, perinatal exposure to adverse environments can also be associated with adult-onset
disorders. Multiple environmental stressors induce glucocorticoids, which prompted us to
investigate their role in developmental programming. Here, we report that perinatal glucocorticoid
exposure had long-term consequences and resulted in diminished CD8 T cell response in
adulthood and impaired control of tumor growth and bacterial infection. We found that perinatal
glucocorticoid exposure resulted in persistent alteration of the hypothalamic-pituitary-adrenal
(HPA) axis. Consequently, the level of the hormone in adults was significantly reduced, resulting
in decreased CD8 T cell function. Our study thus demonstrates that perinatal stress can have long-
term consequences on CD8 T cell immunity by altering HPA axis activity.
Introduction
Early-life exposure to specific environments can influence the development and function of
multiple tissues and organ systems, including the central nervous system, gastrointestinal
and immune systems (Gollwitzer and Marsland, 2015; Mueller et al., 2015; Ralevski and
Horvath, 2015). Moreover, early-life experience has been recognized as an important factor
for adult-onset diseases. Epidemiological studies showed the association between early-life
adversity and later-life development of heart disease, diabetes, hypertension, infectious
Corresponding author: [email protected] ContributionsJ.H. and R.M. designed the study, analyzed the data, and wrote the manuscript with input from the other co-authors. J.H. performed experiments with the assistance from J.L., F.C., J.C, B.V., S.Y., C.A and W.K.E.I. J.L. performed all analyses of RNA-seq and ATAC-seq. F.C. performed all analyses of the brain histology.
Declaration of InterestsAll authors declare no competing interests. B.V. is currently an employee of EMD Serono.
HHS Public AccessAuthor manuscriptCell. Author manuscript; available in PMC 2020 August 04.
Published in final edited form as:Cell. 2020 March 05; 180(5): 847–861.e15. doi:10.1016/j.cell.2020.02.018.
Author M
anuscriptA
uthor Manuscript
Author M
anuscriptA
uthor Manuscript

disease, asthma and cancer in humans (Barker, 2002; Gluckman and Hanson, 2004; Kelly-
Irving et al., 2013; Moore et al., 2006). It is thought that early-life experiences can affect
life-long developmental programing to better adapt to anticipated environments and that
disease may develop when the actual environment is mismatched with the anticipated one
(Bateson et al., 2004). This type of long-term adaptive developmental programming, known
as phenotypic plasticity, is documented in many invertebrate species and plants (Bateson et
al., 2004). However, mechanisms of developmental programming are largely unknown,
particularly in mammals, where few examples of phenotypic plasticity are known.
Development of the immune system throughout perinatal period can be affected by several
environmental factors, including microbial exposure and diet. A well-known example of this
is the increased susceptibility to atopic diseases associated with reduced microbial exposure
in early life, as originally suggested in the framework of the ‘hygiene hypothesis’ (Bach,
2002). Studies have revealed that perinatal psychological or nutritional stress, as well as
perturbation of microbiota, have strong association with immunological disorders later in
life (Gollwitzer and Marsland, 2015). Particularly, exposure to early-life stress has been
linked with susceptibility to infectious diseases both in humans and rodents (Beijers et al.,
2010; Henriksen and Thuen, 2015; Kay et al., 1998; Nielsen et al., 2011), decreased anti-
tumor immune response (Witek Janusek et al., 2013), and reduced adaptive immune
response in humans (O’Connor et al., 2013). Nonetheless, how early-life stress is connected
to long-term alteration of immune functions remains unknown.
Hypothalamic-pituitary-adrenal (HPA) axis is the major stress response pathways that
controls the production of the stress hormones, glucocorticoids (GC), in response to various
environmental stressors. GC, acting through the glucocorticoid receptor (GR), elicits
metabolic and immune-suppressive effects (Cain and Cidlowski, 2017). Due to its central
role in stress response, GC has been speculated to link early-life adversity and disease
development in adulthood (Barbazanges et al., 1996; Braun et al., 2013). Indeed, perinatal
GC exposure has been associated with neuropsychiatric diseases and metabolic alterations
(Braun et al., 2013; Kapoor et al., 2008). More importantly, HPA axis activity can be
affected by perinatal GC treatment, although the duration of this change in HPA in humans
is still debatable (Alexander et al., 2012; Tegethoff et al., 2009). Studies with rodents have
revealed that early-life adversity as well as GC exposure can lead to HPA axis programming,
altering the systemic level of GC during stress, as a strategy to adapt to a potential future
environment (van Bodegom et al., 2017). However, long-term consequences of HPA axis
programming, if any, are still poorly understood. It is conceivable that early-life stress
exposure may lead to altered immune responses if HPA axis is affected, considering the
strong immune-modulating role of GC.
Here, we report that perinatal GC exposure results in diminished CD8 T cell response in
adult animals leading to deficient anti-tumor and anti-bacterial CD8 T cell responses. We
found significantly reduced systemic levels of corticosterone (CORT) with the modification
of HPA axis after perinatal GC exposure, leading to decreased GR signaling in CD8 T cells,
which was sufficient to cause reduced CD8 T cell response in adults. Our study shows that
perinatal stress may have long-term consequences on CD8 T cell immunity by altering HPA
axis threshold, thereby increasing predisposition to cancer and infections.
Hong et al. Page 2
Cell. Author manuscript; available in PMC 2020 August 04.
Author M
anuscriptA
uthor Manuscript
Author M
anuscriptA
uthor Manuscript

Results
Perinatal GC exposure decreased long-term CD8 T cell immune function in adulthood
To test the long-term effect of perinatal GC exposure on later-life immune function, we
adopted an experimental model of dexamethasone (DEX) treatment in drinking water (Di
Meco et al., 2016). We treated the mice from mid-pregnancy to early-postnatal period
(embryonic day (E) 7.5 to postnatal day (PND) 1), the period when important hematological
and lymphoid organogenesis is taking place. After this perinatal treatment, mice were
allowed to mature to adulthood (8–20 week of age), when all the analyses of immune
function were conducted (Figure 1A). Perinatal DEX exposure increased total lymphocyte
counts, CD4 T and CD8 T cells, and CD11b+ myeloid cells (Figure S1A, S1B, and S1C).
We first tested the response of bone marrow-derived macrophages to lipopolysaccharide or
IL-4, and found no significant effect of perinatal DEX exposure (Figure S1D and S1E).
Next, we asked whether the T cell function in adult mice was altered with perinatal DEX
treatment. No significant change in thymic selection was first observed (Figure S1F). Using
the footpad immunization model (Figure 1B), we found antigen-specific IFN-γ response
was reduced following perinatal DEX exposure in C57BL/6 (B6) mice (Figure 1C and 1D).
With flow cytometric analysis (Figure S2A), we observed that CD8 T cells were the main
producers of IFN-γ (Figure 1E) and that the effector CD8 T cell responses were
significantly suppressed while no significant changes were identified in CD4 T cells (Figure
1E and 1F). Reduced CD8 T cell responses with perinatal DEX exposure were recapitulated
in Balb/c mice (Figure S2B and S2C). There was no difference in myeloid cell population in
the draining lymph nodes (LN) (Figure S2D). The reduced CD8 T cell response was further
confirmed using the T cell receptor (TCR) transgenic OT-I model (Hogquist et al., 1994).
We found reduced OT-I T cell response to ovalbumin (OVA) in mice with perinatal DEX
treatment (Figure 1G).
To determine whether these effects were dependent on antigen presenting cells, and to
further investigate CD8 T cell function, we utilized ex vivo co-culture system. Naïve OT-I
CD8 T cells from mice with or without perinatal DEX exposure were sorted and co-cultured
with bone marrow derived dendritic cells (BMDC) from control mice (Figure 1H). OT-I
CD8 T cells were activated with SIINFEKL OVA peptide (OVAp) with or without IL-12,
and analyzed by flow cytometry (Figure S2E). OT-I CD8 T cells from mice with perinatal
DEX exposure showed decreased effector function, characterized by CD25 and IFN-γ expression (Figure 1I), as well as CD69, CD44, granzyme B, and T-bet expression (Figure
S2F). Moreover, OT-I CD8 T cells taken from mice with perinatal DEX treatment showed
reduced proliferation upon activation as well as decreased Ki67 expression (Figure 1J and
S2F). We also found that the differential responses were maintained up to 5 days after
activation (Figure S2G). To determine whether the ex vivo changes with perinatal DEX
exposure were specific to CD8 T cells, we repeated the experiment utilizing OT-II mice.
Unlike in vivo immunization results, OT-II CD4 T cells from perinatally DEX-exposed mice
showed similar decrease in IFN-γ production upon ex vivo activation in Th1 promoting
condition (Figure S2H).
Hong et al. Page 3
Cell. Author manuscript; available in PMC 2020 August 04.
Author M
anuscriptA
uthor Manuscript
Author M
anuscriptA
uthor Manuscript

Perinatal GC exposure resulted in reduced anti-tumor CD8 T cell response
A link between early-life stress and later-life risk of cancer and infectious disease has been
previously reported (Beijers et al., 2010; Henriksen and Thuen, 2015; Kelly-Irving et al.,
2013; Nielsen et al., 2011; Spracklen et al., 2014). Since CD8 T cells play a critical role in
controlling various tumors and pathogens, we asked whether altered CD8 T cell function due
to perinatal GC exposure would lead to compromised anti-tumor immunity. We first utilized
the immunogenic B16-F10 mouse melanoma model. Both C57BL/6 and Balb/c mice with
perinatal DEX treatment showed accelerated tumor growth, which was more pronounced in
allogenic condition (Figure 2A and 2B). Consistent with footpad immunization results,
CD45+ cells and CD8 T cell population were significantly reduced inside the tumors as well
as in tumor draining lymph nodes in perinatal DEX treated mice, while no major difference
in NK cell population was found (Figure S3A–D). At the early stage of tumor development
when total tumor cell number was similar, we found that CD8 T cells were specifically
affected among NK, CD4 and CD8 T cells and showed reduced IL-2 and Granzyme B
expression (Figure 2C). To further corroborate this finding, we adopted an immunogenic
‘Yale University mouse melanoma exposed to radiation 1.7’ (YUMMER1.7) tumor model
that was developed to carry three driver mutations (BrafV600E, Pten−/− and Cdkn2a−/−) as
well as neoantigens due to UV irradiation (Wang et al., 2017). Compared to control mice,
perinatally-DEX exposed mice showed higher YUMMER1.7 tumor burden (Figure 2D). To
directly test the role of CD8 T cells in anti-tumor responses, we utilized OT-I mice and
E.G7-OVA lymphoma that expresses OVA antigen. We first confirmed that there was no
E.G7-OVA tumor growth in control OT-I mice, compared to B6 mice (Figure 2E). In
contrast, OT-I mice with perinatal DEX exposure failed to control E.G7-OVA tumor growth
(Figure 2E and 2F). Next, we sorted the OT-I CD8 T cells from mice with or without
perinatal DEX exposure, and adoptively transferred them to wild-type mice implanted with
E.G7-OVA. While mice that received OT-I cells from control animals effectively suppressed
E.G7-OVA tumor growth, mice that received OT-I cells from perinatally DEX-exposed mice
failed to control tumor growth (Figure 2G). These results showed that perinatal GC exposure
made mice susceptible to tumor development due to cell-intrinsic defect in CD8 T cell
function.
Perinatal GC exposure resulted in decreased anti-bacterial CD8 T cell function
We next assessed the effect of perinatal GC exposure on CD8 T cells in a mouse infection
model. We utilized Listeria monocytogenes expressing defined OVA antigen (LM-OVA) to
analyze antigen-specific CD8 T cell response. We found that antigen-specific CD8 T cell
response was significantly reduced and Listeria burden increased in mice with perinatal
DEX exposure (Figure 3A and 3B). We tested the antigen-specific killing activity of CD8 T
cells in vivo and found that antigen-loaded cells were killed less efficiently in perinatally
DEX-exposed mice in the context of LM-OVA infection (Figure S4A and 3C). We have also
further analyzed the memory precursor effector cells (MPEC) and short-live effector cells
(SLEC) among the antigen-specific effector CD8 T cells and found that perinatal DEX
treatment did not change those population (Figure S4B). Next, we tested the anti-bacterial
function of CD8 T cells utilizing adoptive transfer model (Figure S4C). Mice that received
OT-I CD8 T cells from perinatally DEX-exposed mice showed lower OT-I cell numbers and
higher bacterial burden (Figure 3D and 3E). Adoptively transferred OT-I cells showed
Hong et al. Page 4
Cell. Author manuscript; available in PMC 2020 August 04.
Author M
anuscriptA
uthor Manuscript
Author M
anuscriptA
uthor Manuscript

diminished IFN-γ and granzyme B expression in these mice (Figure 3F). These results
demonstrate that mice with perinatal GC exposure have compromised CD8 T cell function in vivo in the context of bacterial infection.
Perinatal GC exposure decreased systemic CORT level in adults
Early-life stress models in rodents have been reported to result in either enhanced or
decreased CORT level, depending on the type, timing, duration of stressors (van Bodegom et
al., 2017). We therefore measured CORT in serum and found that perinatal DEX exposure
resulted in decreased CORT level at steady state in adult B6 and Balb/c mice (Figure 4A,
S5A and S5B). Moreover, adult mice with the perinatal DEX treatment had a reduced CORT
induction under various stress conditions, including tumor implantation, infection, and
immobilization (Figure 4B), known to induce CORT (Kim et al., 2001; Valles et al., 2013).
Inhibition of GR signaling suppressed CD8 T cell function
Although glucocorticoids are primarily known for their immunosuppressive effects, previous
studies suggested a more complex picture with both positive and negative effects on the
immune system (Wilckens and De Rijk, 1997). Recent studies also found that the absence of
GR signaling can decrease CD4 and CD8 T cell function (Mittelstadt et al., 2012; Shimba et
al., 2018). Based on these findings, we asked whether the reduction in basal CORT level was
responsible for the reduced CD8 T cell function in the mice with perinatal DEX treatment.
To test this, we first utilized RU486, a GR antagonist. In BMDC and OT-I co-culture system,
the addition of RU486 significantly suppressed OT-I activation ex vivo (Figure 4C). Next,
we used Metyrapone (2-methyl-1,2-di-3-pyridyl-1-propanone; MTY), a drug that blocks the
synthesis of CORT. Treatment with MTY during footpad immunization in vivo inhibited the
antigen-specific CD8 T cell response (Figure 4D). The level of reduction with MTY was
comparable to that with perinatal DEX exposure (Figure 4D). Similarly, OT-I mice that
received MTY also showed suppressed CD8 T cell response with footpad immunization
(Figure 4E). To confirm these findings, we immunized adrenalectomized (ADX) mice, and
assessed the antigen specific CD8 T cell response. Consistent with the results with MTY,
ADX mice showed reduced CD8 T cell response (Figure S5C). Finally, we used a genetic
model (CD4-Cre; Nr3c1-flox mice) to eliminate GR signaling specifically in T cells (Figure
S5D). Deletion of GR in T cells significantly reduced antigen-specific CD8 T cell activation
after immunization (Figure 4F). The decrease in CD8 T cell response due to GR deletion
was comparable to the effect of perinatal DEX exposure, suggesting that the effect of
perinatal DEX on CD8 T cell function is largely mediated by T cell intrinsic GR function.
Next, we asked whether the change in non-hematopoietic compartment also contributed to
the changes in CD8 T cell responses. To test this, we conducted bone marrow transplantation
experiments by transferring bone marrow cells from CD45.2+ OT-I mice to CD45.1+ B6
mice after irradiation. When OT-I bone marrow was transplanted to an irradiated wild-type
hosts with perinatal DEX treatment (Figure 4G), activation of OT-I CD8 T cells was
significantly decreased in vivo (Figure 4H) and ex vivo (BMDC and OT-I co-culture, Figure
S5E and S5F). Furthermore, when OT-I bone marrow from mice with perinatal DEX
exposure was transplanted to irradiated wild-type control hosts, a significant reduction of
OT-I CD8 T cell response was also observed, suggesting that hematopoietic stem cell
Hong et al. Page 5
Cell. Author manuscript; available in PMC 2020 August 04.
Author M
anuscriptA
uthor Manuscript
Author M
anuscriptA
uthor Manuscript
compartment also contributes to the reduced CD8 T cell function with perinatal GC
exposure (Figure S5G).
GR signaling in CD8 T cells controls activation, survival and effector programs
T cells devoid of GR signaling are defective in homing to lymphoid tissues and have
impaired survival and activation (Shimba et al., 2018). Consistent with this report, GR
deficient CD8 T cells had reduced activation and survival following immunization in vivo with reduced expression of Bcl2 and CD69 (Figure 4F, 5A, and 5B). When GR deficient
naïve CD8 T cells were co-cultured with BMDC, activation was diminished upon CD3
stimulation (Figure 5C). Expression of CD25, IL-2, T-bet, Bcl2, and Ki67, as well as
phosphorylated-STAT5, were all down-regulated in GR deficient CD8 T cells (Figure 5D).
Moreover, mice with T cell-specific GR deficiency showed reduced anti-tumor response in
YUMMER melanoma model (Figure S6A). CD8 T cells from ADX mice also showed
reduced activation and expression of CD25, Bcl2 and IL-2 in this setting (Figure S6B and
S6C). All of these GR dependent changes were also recapitulated in OT-I CD8 T cells taken
from the mice with perinatal DEX exposure, characterized by the reduction of CD25, Bcl2,
and IL-2 when activated with OVAp on BMDC (Figure 1I, S2F and S6D).
To expand on these findings, we sorted CD8 T cells after immunization from control and
DEX treated mice and performed RNA-seq. We found that expression of genes involved in
the CD28-mTOR-P70S6K pathways were decreased significantly while the oxidative
phosphorylation (OXPHOS) pathway was increased with perinatal DEX exposure (Figure
5E, S6E, and S6F). Consistently, the expression of key genes in those pathways (Figure 5F)
and known GR target genes were significantly decreased (Figure 5G). We confirmed that
OT-I CD8 T cells with perinatal DEX exposure showed increased OXPHOS function during
activation (Figure S6G and S6H). To validate these changes, we conducted phospho-flow
staining of OT-I CD8 T cells in the context of BMDC co-culture and OVAp activation. We
found phosphorylation of ZAP70 (Y319), mTOR (S2448), Akt (S473), and S6 (S236), were
all significantly down-regulated with perinatal DEX treatment (Figure 5H). Overall changes
in these signaling pathways likely account for the decrease in activation and survival of CD8
T cells with GR deficiency or ADX.
Perinatal GC exposure caused persistent changes of the chromatin state of naïve CD8 T cells
Next, we asked how perinatal DEX exposure resulted in a long-term programming in naïve
CD8 T cells. We performed RNA-Seq analysis of naïve OT-I CD8 T cells with or without
perinatal DEX exposure. Among the genes that were differentially regulated, the expression
of Tbx21, Eomes, and Cxcr3 were significantly decreased in naïve OT-I CD8 cells with
perinatal DEX treatment (Figure 6A). We then performed an Assay for Transposase-
Accessible Chromatin with high-throughput sequencing (ATAC-seq) to evaluate the
genome-wide chromatin state of those OT-I CD8 T cells. With motif enrichment analysis
from ATAC-seq peaks, we found T-bet binding sites were significantly depleted in the
perinatal DEX-exposed group (Figure 6B). Consistent with this finding, chromatin
accessibility of Ifng locus with T-bet binding site, which is known to be important for IFN-γ gene expression (Karmaus et al., 2019), was reduced in naïve OT-I T cells with perinatal
Hong et al. Page 6
Cell. Author manuscript; available in PMC 2020 August 04.
Author M
anuscriptA
uthor Manuscript
Author M
anuscriptA
uthor Manuscript
DEX treatment (Figure 6C). Moreover, chromatin accessibility of Tbx21 locus itself was
also decreased (Figure 6D). We identified consensus GR binding sites in the affected sites of
Tbx21 locus (Figure 6D), suggesting that reduced GR signaling following perinatal DEX
exposure led to low chromatin accessibility of Tbx21 locus. These findings suggest that
perinatal DEX exposure results in long term epigenetic reprogramming of naïve CD8 T
cells, leading to reduced effector function.
Perinatal GC and stress altered the HPA axis activity
Our findings so far indicate that perinatal DEX exposure resulted in persistently decreased
CD8 T cell function via reducing systemic level of CORT. Given that early-life stress and
GC exposure can lead to HPA axis programming (van Bodegom et al., 2017), we next asked
how perinatal DEX exposure altered systemic CORT level in the adults in our model. We
first analyzed the gene expression of corticosterone synthesis enzymes in adrenal glands of
mice with or without perinatal DEX treatment, but found no obvious differences (Figure
S7A). Next, we assessed the brain regions that are important for HPA axis regulation. CORT
binds to two receptors in the brain: the type I corticosteroid receptor, MR, and the type II
corticosteroid receptor, GR. Expression of these receptors in hippocampus and
paraventricular nucleus of hypothalamus (PVH) is particularly important for HPA axis
regulation (De Kloet et al., 1998). MR has higher affinity to CORT than GR, and has been
implicated as an important regulator of HPA axis in the lower range of circadian CORT
regulation for proactive negative feedback (De Kloet et al., 1998). Particularly, GR and MR-
expressing neurons in dentate gyrus, cornu ammonis (CA) 3, and CA1 innervate neurons in
subiculum, which sends negative signal for the CRH production in the neurons of PVH (Han
et al., 2005; Schoenfeld and Gould, 2012; Yoshiya et al., 2013). We found significantly more
MR expression in dentate gyrus and CA1, CA3 region of hippocampus as well as in PVH of
GR-expressing neurons in perinatal DEX treated mice (Figure 7A–7C). We observed that
animals exposed to DEX presented increased non-nuclear MR as well (Figure S7B), which
is known to influence glutamatergic signaling (Karst et al., 2005). Because hippocampal MR
provides a negative feedback to the HPA axis (De Kloet et al., 1998), increased MR
expression should result in reduced HPA steady-state activity and CORT level. Consistently,
we found serum adrenocorticotrophic hormone (ACTH) level was decreased at steady-state
(Figure S7C). Together, these data indicate that perinatal DEX exposure changed the set
point of the HPA axis by raising the threshold for negative feedback signal.
Since various early-life stressors can affect the HPA axis, we asked whether different
perinatal stressors can cause alteration in systemic CORT level. We found prenatal cold
exposure (E14.5-PND0) led to the enhancement of basal CORT, while the longer duration of
the same cold stress spanning perinatal periods (E13.5-PND7) can elicit the suppression of
CORT level (Figure 7D). Moreover, a single injection of poly (I:C) on PND3 strongly
inhibited CORT level in later life (Figure 7D). This result supports the idea that HPA axis
can be programmed to be hyperactive or hypoactive depending on the type, duration, timing,
and frequency of stressors (van Bodegom et al., 2017). Next, we tested the CORT level with
different regimes of DEX treatment. We found DEX treatment during mid-pregnancy (E7.5-
E14.5) did not change adult CORT level, while DEX treatment during late-pregnancy
(E14.5-PND1) and maternal DEX treatment during postnatal 2 weeks (PND0-PND14)
Hong et al. Page 7
Cell. Author manuscript; available in PMC 2020 August 04.
Author M
anuscriptA
uthor Manuscript
Author M
anuscriptA
uthor Manuscript

decreased basal level of CORT (Figure 7E). Nevertheless, the mice with postnatal DEX
exposure showed enhanced CORT level with restraint stress, suggesting the responsiveness
to stress is differentially programmed with perinatal and postnatal DEX exposure (Figure 4B
and S7D). Based on this, we speculated that the sensitive developmental window for CORT
programming would be around the time of birth. To test this idea, we directly injected DEX
to pups on PND2, and found PND2 DEX injection was sufficient to reduce basal CORT
level in the adults (Figure 7F). We also found that the single injection of DEX on PND2 was
sufficient to decrease CD8 T cell function in vivo and ex vivo (Figure 7G). To test a possible
influence of microbiota, we repeated the experiments in littermates that were born and
housed together, and found the consistent reduction of CD8 T cell function with PND2 DEX
treatment (Figure S7E), suggesting the phenotype in this setting is microbiota-independent.
Moreover, we found the increased expression of hippocampal MR with PND2 DEX
exposure (Figure S7F). Of note, unlike perinatal DEX treatment, dentate gyrus nuclear MR
was not affected by PND2 DEX, suggesting differential mechanism of programming by
distinctive hippocampal neuronal population. Finally, we further explored the developmental
window with other DEX treatment regimens and confirmed the importance of periods
around birth for the functional reduction of CD8 T cell (Figure 7H). The only exception to
this trend was in mice exposed to DEX during the first two weeks of pregnancy (E1.5-
E14.5), which also showed reduced CD8 T cell function (Figure 7H). Overall, these results
suggest that various perinatal stressors can program HPA axis, and that GC has a direct role
in this programming.
Discussion
Our study shows that perinatal stress hormone exposure has long-term consequences for
CD8 T cell immunity due to alteration of the HPA axis activity. Specifically, we found that
perinatal GC treatment resulted in impaired antigen-specific CD8 T cell response to bacterial
infection and implanted tumors in adult mice. Perinatal GC exposure resulted in increased
hippocampal MR expression thereby lowering the threshold for GC negative feedback and
changing the HPA set point resulting in lower CORT level in circulation. We also found that
suppression of GR signaling or depletion of CORT production by adrenalectomy were
sufficient to decrease CD8 T cell activation and survival. Overall these results indicate
developmental programming of immunity can occur due to early-life stress via the
modification of HPA axis (Figure 7I).
Our study adds to the evidence that early life stress experience can program HPA axis
activity to either higher or lower level, depending on the type, duration, and timing of
stressors (van Bodegom et al., 2017). It is presumed that mild to moderate stress may lead to
hyperactive HPA axis, while extreme stress may produce hypoactive HPA axis (van
Bodegom et al., 2017). The precise rules and mechanism behind these phenomena are yet to
be fully understood. However, the alterations of HPA axis activity do not appear to be
random, but rather may be designed to adapt to different environments after birth, as
suggested before (Braun et al., 2013; Schmidt, 2011). Furthermore, alteration of GC with
early-life stress has been reported not only in mammals but also in birds and fish (Henriksen
et al., 2011; Reyes-Contreras et al., 2019), suggesting HPA axis programming may be an
evolutionarily conserved adaptation strategy.
Hong et al. Page 8
Cell. Author manuscript; available in PMC 2020 August 04.
Author M
anuscriptA
uthor Manuscript
Author M
anuscriptA
uthor Manuscript

In our study, we found that long-term immunity is affected by perinatal stress. The
association between early-life stress and decreased immune function in later-life has been
recognized previously (Beijers et al., 2010; Henriksen and Thuen, 2015; Kay et al., 1998;
Nielsen et al., 2011). Our study indicates that HPA axis programming could be one of the
mechanisms that mediates the long-term immune alteration with early-life stress.
Considering the role of hypothalamus as the central integrator of various environmental
signals for optimal distribution of resources for survival and reproduction success (Wang et
al., 2019), having compromised immunity could be the consequence of allocating resources
to the appropriate maintenance program for successful adaptation, as suggested by the life
history theory (Okin and Medzhitov, 2012; Stearns, 1992).
We also found GC plays an immune-enhancing role on CD8 T cells. This finding is
consistent with recent report that showed that circadian rise of GC increases T cell survival,
migration and activation (Shimba et al., 2018). Consistent with the findings by Shimba et al,
we found that survival of CD8 T cell and expression of Bcl2 were decreased, and the
expression of CD25 and IL-2, as well as phosphorylation of Stat5 were all down-regulated in
CD8 T cell without GR signaling. IL-2 signaling regulates multiple phosphorylation events
for T cell activation and survival (Ross et al., 2016); therefore, the decline in survival and
activation in GR-deficient or perinatally DEX-exposed CD8 T cells should have been
affected by the reduction of CD25 and IL-2 signaling. We found that expression of genes
involved in OXPHOS was increased in CD8 T cells with perinatal DEX exposure.
Considering the effect of IL-2 on glycolytic metabolism (Macintyre et al., 2011), it could be
the consequence of decreased IL-2 signaling. Alternatively, increased OXPHOS in CD8 T
cells could be upstream of decreased IL-2 production, given the report that utilizing of
OXPHOS over glycolysis leads to decrease in IFN-γ and IL-2 production during T cell
activation (Chang et al., 2013). Surprisingly, the effect we observed in vivo was mostly
restricted to CD8 T cells. However, CD4 T cells from the mice with perinatal GC exposure
also had decreased effector function in Th1 promoting condition with ex vivo activation. The
reason for the difference between in vivo and ex vivo conditions for Th1 response is unclear.
In our study, naïve CD8 T cells showed reduced priming with lower expression of T-bet and
reduced chromatin accessibility of Ifng locus. While the suppression of GR signaling during
activation with GR antagonist, RU486, was sufficient to reduce CD8 T cell activation,
ATAC-seq results suggest there is another layer of GC regulation of T cells. Because thymic
selection is altered by GR signaling (Mittelstadt et al., 2012; Mittelstadt et al., 2018; Taves et
al., 2019), T cell repertoire and naïve T cell maintenance can potentially be affected by
perinatal GC exposure. However, we did not find significant changes in thymocyte
population, and we observed the GC effect in a TCR ‘fixed’ OT-I system. Moreover, we
even found that stem cell compartment contributed the compromised CD8 T cell response.
These results suggest that the phenotypic changes in naïve CD8 T cells are potentially set up
even before thymic selection. We found that the changes in CD8 T cells are maintained after
the adoptive transfer of cells to new environments such as in new hosts or in cell culture
media, indicating a stable ‘imprinting’ of the gene expression programs in CD8 T cells by
early life GC exposure. Given the loss of accessibility of GR binding sites of Tbx21 locus
following perinatal GC exposure, it is conceivable that systemic reduction of GC accounts
for those changes.
Hong et al. Page 9
Cell. Author manuscript; available in PMC 2020 August 04.
Author M
anuscriptA
uthor Manuscript
Author M
anuscriptA
uthor Manuscript

We also observed that MR expression is increased in the hippocampus following perinatal
DEX exposure. MR has higher affinity to CORT than GR, and has been recognized as a
main regulator of HPA axis under lower circadian range of CORT oscillation (De Kloet et
al., 1998). As CORT level increases with stress, GR occupancy also increases, and both GR
and MR work in concert for the negative feedback to bring HPA axis activity to homeostatic
level (Bradbury et al., 1994; De Kloet et al., 1998). Thus, increased expression of MR in
hippocampus should lead to reduced CORT induction. Mechanism of long-term
maintenance of higher MR expression is of particular interest for future studies. Given the
epigenetic modification of GR in hippocampus of pups due to maternal behavior (Weaver et
al., 2004), one can envision that MR expression is maintained in a similar manner by
epigenetic mechanisms. Consistent with this possibility, changes in DNA methylation of GR
and MR gene loci were found in children with the maternal prenatal depressive symptoms
(Stonawski et al., 2019). Further assessment is required to address the precise mechanism
for the induction of MR with perinatal GC exposure.
In this study, we found an important role of perinatal GC in the programming of HPA axis.
GC induced by physiological stress during pregnancy may potentially be transferred to the
pups during prenatal and perinatal period. During prenatal period, fetus is influenced by
maternal GC: despite of high expression of placental 11β-hydroxysteroid dehydrogenase
type-2 (HSD11B2) that degrades active CORT, maternal GC can access fetal circulation at
the peak of circadian rise and under stress (Barbazanges et al., 1996; Venihaki et al., 2000).
The expression HSD11B2 is also decreased under chronic stress, allowing maternal CORT
to affect fetal system (Mairesse et al., 2007). After birth, mice and rats have a stress hypo-
responsive period and during this period, the pups become insensitive to various
environmental stressors for GC induction (Levine, 1994; Sapolsky and Meaney, 1986).
However, maternal care during this period has a strong influence on HPA axis development
and long-term behavioral changes (Weaver et al., 2004). It is uncertain whether maternal GC
via breast milk has direct effect on HPA axis programming. While the treatment of CORT to
nursing dams in drinking water has long-term effect on offspring’s behavior and HPA axis
activity (Catalani et al., 2011; Catalani et al., 1993), it can also affect maternal behavior. Our
study adds evidence for the direct programming by GC, independent of maternal behavior,
because we did not observe obvious changes of maternal behavior with perinatal GC
treatment and, more importantly, direct injection of DEX to pups was sufficient to program
HPA axis.
STAR Methods
Lead Contact and Materials Availability
Further information and requests for reagents may be directed to, and will be fulfilled by, the
lead contact Ruslan Medzhitov ([email protected]).
Experimental model and subject details
Mice—Male and female C57BL/6J (stock #000664), B6-CD45.1 (stock #002014), Balb/cJ
(stock #000651), OT-I (stock #003831), Nr3c1fl/fl (stock #021021), and CD4-Cre (stock
#017336) were purchased from Jackson Laboratory. For the adrenalectomized (ADX) study,
Hong et al. Page 10
Cell. Author manuscript; available in PMC 2020 August 04.
Author M
anuscriptA
uthor Manuscript
Author M
anuscriptA
uthor Manuscript

we ordered ADX mice and sham operated C57BL/6J (stock #000664 with operation) mice
from Jackson Laboratory. Mice were maintained in a specific pathogen-free facility and all
animal experiments were performed in accordance with institutional regulations after
protocol review and approval by Yale University’s Institutional Animal Care and Use
Committee.
For DEX treatment, 8–16 week old female mice were treated with DEX (1.3 μg/ml; diluted
in 0.002% DMSO and balanced with 0.02% 2-hydroxypropyl-β-cyclodextrin as vehicle
(Sigma)) in drinking water after conception with different timing of fetal and neonatal
development. Considering water volume uptake (3–5 ml/day) and body weight change
during pregnancy (20–30g), mice received approximately 0.2 mg/kg of DEX per day. The
dosage and timing of treatment were adopted and modified based on the study that treated
pregnant mice with DEX (Di Meco et al., 2016). We chose to treat DEX in drinking water to
minimize unnecessary stress that may be caused by handling and injection. For direct
injection of DEX to pups, DEX (0.5 mg/kg) was delivered intraperitoneally on different day
after birth. All the mice with perinatal DEX exposure remained undisturbed until they
become mature (8–16 week old) when the phenotype was assessed.
For footpad immunization assay, mice were immunized both feet subcutaneously in rear
footpads with 50μl of PBS contains 50μg OVA, with or without 5 μg LPS (Sigma) and 50%
incomplete freuds’s adjuvant (IFA). Cells in popliteal and inguinal lymph nodes were
collected after 5 days post immunization, counted and seeded (0.5–1 million cells per well)
in 96 well plate in RPMI1640 media supplemented 10% FBS (GIBCO or BenchMark) with
2 mM L-glutamine (GIBCO) with 50 μM β-mercaptoethanol (Sigma). For the experiments
with ADX mice, only one foot was immunized to prevent morbidity and mortality related to
hyper-inflammation, and charcoal-stripped FBS was utilized for ex vivo culture (GIBCO).
Cells were re-stimulated with 9 – 90 μg of OVA for 16 hours to 72 hours. Supernatant was
collected for cytokine measurement, and cells were analyzed with flow cytometry after 4
hours of Phorbol 12-myristate 13-acetat (PMA, 50 ng/ml, Sigma-Aldrich), ionomycin (1
μM, Cell signaling techology), Golgi plug (1x, BD Biosciences) stimulation. Some mice
were treated with Metyrapone (Cayman), corticosterone synthesis inhibitor, at 0.8 mg/ml in
drinking water from 7 days before footpad immunization until the day of LN collection
(Chen et al., 2010).
For tumor study, tumor cell lines were cultured, counted and implanted (B16-F10: 105
cells/100 μl; YUMMER: 105 cells/100 μl; E.G7-OVA: 0.5 × 10⁵ − 1 × 10⁶ cells/100 μl)
subcutaneously in the flank of mice, and tumor growth was measured with digital caliper.
Mice with moribund or carrying tumor exceeding 1000 mm3 in volume were euthanized as
the end point of the experiment. For the assessment of tumor positive mice were made when
the tumor size exceeded 15 mm2. For immune cell analysis, tumor and tumor draining
lymph nodes were harvested, and digested with 100 U/ml collagenase IV (Worthington
Biochemical Co.) at 37 °C for 30 minutes, stimulated with PMA, ionomycin and Golgi Plug
for 4 hours, and stained with fluorochrome-conjugated antibodies and analyzed with flow
cytometry. For the study for E.G7-OVA killing with adoptively transferred OT-I, mice were
first implanted with 1 million E.G7-OVA subcutaneously. On day 5, OT-I CD8 T cells taken
from OT-I mice with or without perinatal DEX treatment were MACS sorted and 0.1 million
Hong et al. Page 11
Cell. Author manuscript; available in PMC 2020 August 04.
Author M
anuscriptA
uthor Manuscript
Author M
anuscriptA
uthor Manuscript
cells were adoptively transferred intra-orbitally. On day 6, OT-I cells were activated with 100
μg poly (I:C) + 100 μg OVA injected intra-orbitally, and tumor size was assessed.
For infection of mice, OVA-expressing Listeria monocytogenes strain (LM-OVA) was
obtained from the laboratory of Dr. Leo Lefrancois (Pope et al., 2001). LM-OVA was grown
to log phase in brain heart infusion (BHI) broth (BD), washed once with PBS, and
resuspended in fresh BHI. Mice were injected retro-orbitally with 1 × 10⁵ colony forming
units (CFU) of LM-OVA diluted in PBS. For adoptive transfer, CD8 T cells isolated from
OT-I mice with or without perinatal DEX exposure were sorted with MACS, labelled with
Cell Trace Violet (Invitrogen), injected to host mice. For immune cell analysis, cells were
isolated from blood or spleen, processed for single cell suspension, stained with
fluorochrome-conjugated antibodies and analyzed with flow cytometry. Bacterial burden
was quantified at the day 3 or day 7 post infection in the livers.
For the measurement of serum hormones, mice were bleed retro-orbitally at the designated
time of day (ZT=0 (7 am), ZT=12 (7 pm)).
Primary cell cultures—To prepare bone marrow derived dendritic cells (BMDC),
C57BL/6J mice were euthanized by CO2 asphyxiation and femurs and tibias were isolated.
The bones were cleansed with ethanol then washed with RPMI 1640 (Corning 10–040-CV),
and pulverized in a mortar. Resulting contents were filtered through a 70 μm nylon cell
strainer. After ACK lysing buffer (Lonza) for 5 min, contents were centrifuged and the pellet
was resuspended in BMDC growth medium (DMEM supplemented with 10% FBS (GIBCO
or BenchMark), 1% penicillin-streptomycin (GIBCO), 2 mM L-glutamine (GIBCO), 1 mM
sodium pyruvate (GIBCO), 0.01 M HEPES (AmericanBio), 50 μM β-mercaptoethanol
(Sigma), and 2% granulocyte-macrophage colony-stimulating factor (GM-CSF)-conditioned
media from GM-CSF producing cell lines (J558L) (Gao et al., 2013). Then, cells were
seeded at 1 × 10⁶ cells/ml concentration, and cultured for 6 days in 24 well cell culture
plates. Half of media was replaced on 2 and 4 days. On day 5, cells were loaded with OVA
or SIINFEKL peptide (OVAp, Anaspec). On day 6, BMDCs were sorted and co-cultured
with naïve CD8 T cells isolated and sorted from OT-I mice or C57BL/6 mice in RPMI 1640
media supplemented 7.5% FBS with 2 mM L-glutamine with 50 μM β-mercaptoethanol.
Naïve CD8 T cells were either sorted with MACS (EasySep Mouse Naive CD8+ T Isolation
Kit, Stemcell technologies), following the manufacturer’s protocol, or sorted with FACS
(FACS Aria II) after presorting with MACS (Pan T cell Isolation Kit II, Miltenyi Biotech).
For the experiments with CD8 T cells taken from ADX mice, charcoal-stripped FBS was
utilized (GIBCO). Naïve CD8 T cells from OT-I mice were co-cultured with BMDC loaded
with OVA or OVAp in the presence or absence of IL-12. Naïve CD8 T cells from B6 mice
were co-cultured with BMDC and activated with anti-CD3ε in the presence or absence of
IL-12. In some circumstance, RU486 (Sigma), GR antagonist, at 1 μg/ml was treated during
BMDC and OT-I co-culture. For the cell proliferation assay, OT-I CD8 T cells were labelled
with Cell Trace Violet, and then co-cultured with BMDC with or without SIINFEKL
loading. Proliferation of OT-I cells were assessed by the dilution of Violet signal.
Hong et al. Page 12
Cell. Author manuscript; available in PMC 2020 August 04.
Author M
anuscriptA
uthor Manuscript
Author M
anuscriptA
uthor Manuscript

Method details
Flow cytometry—Antibodies used for flow cytometry are cataloged in the antibodies
section of the Key Resources Table. Cells were stained in round-bottom 96 well plates
following manufacturer’s suggested protocol (BD Bioscience). Cell viability was determined
using Zombie Yellow viability kit (Biolegend), and samples were Fc-blocked with mouse
anti-CD16/32 (93) antibody (Thermofisher scientific). For all the intracellular cytokine
staining in this study, cells were stimulated with PMA, Ionomycin and Golgi plug (PIG) for
4 hours, otherwise stated differently. For intracellular and phospho-flow staining, cells were
fixed and permeabilized with Foxp3 staining kit (Thermofisher scientific). All samples were
acquired on an LSR II Flow cytometer (BD Bioscience) and analyzed using FlowJo software
(Tree Star technology). All the T cells analyzed here were within the population of single
cells, viable, and CD45-expressing. In some cases, 123 count beads (Thermofisher
scientific) was added to count the total cell number. For the staining for GR, permeabilized
cells were either incubated with mouse monoclonal anti-GR antibody conjugated with FITC
(G-5, Santa Cruz) or with Rabbit anti-GR antibody (D6H2L, Cell signaling) and anti-rabbit
IgG (H+L), F(ab’)2 Fragment conjugated with Alexa Fluor® 488 (#4412, Cell signaling).
Fluorescence-activated cell sorting (FACS) and magnetic-activated cell sorting (MACS)
Naïve CD8 T cells from B6 mice or OT-I mice were sorted from spleens and/or LNs with
FACS or MACS. BMDCs from 6 day culture were sorted with FACS or MACS. For FACS,
single cell suspension was prepared by mincing the tissues on 70 μm filtered and lysed with
ACK lysis buffer. Cells were then stained with fluorochrome-conjugated antibodies. Naïve
CD8 T cells (CD45+, CD8α+, CD62L+, CD44-) or BMDCs (CD45+ CD11chigh) were
sorted with BD FACS Aria (BD Bioscience). In some cases, T cells were enriched before
FACS by utilizing Pan T cell MACS kit (Miltenyi Biotec). For direct sorting of naïve CD8 T
cells with MACS, EasySep Naïve CD8 T cell kit (Stemcell) was utilized, and for BMDC
sorting with MACS, CD11c nanobead (Biolgend) was used following the manufacturer’s
protocol.
ELISA—For the detection of IFN-γ with ELISA, 96 well plate was first coated with anti-
mouse IFN-γ antibody (XMG1.2) in coating buffer (Thermofisher Scientific). Then,
standard recombinant IFN-γ and samples (R&D systems) were added to plates after
blocking with 1% BSA blocking buffer. Plate was washed with 0.05% Tween-20-containing
PBS, and biotinylated anti-mouse IFN-γ secondary antibody (R4–6A2-bi) was added.
Streptavidin-HRP was then added after plate wash, and developed with TMB substrate.
After the development, reaction was quenched with 2N H2SO4 and quantified with 450 nm
absorbance by the SpectraMax M5 plate reader (Molecular Devices). For the detection of
total CORT in serum with ELISA, Corticosterone EIA kit (Arbor assay) was utilized
following the manufacturer’s protocol. For the detetection of ACTH in serum, RayBio
ACTH hormone Enzyme Immunoassay Kit (RayBiotech) was utilized following
manufacturer’s protocol.
Blood analysis—Whole blood was harvested from mice by retro-orbital bleeding. For
serum separation, blood was clotted for 15–30 minutes at room temperature or for overnight
at 4°C, and serum was separated with the centrifugation with 5000 rpm for 15 minutes at
Hong et al. Page 13
Cell. Author manuscript; available in PMC 2020 August 04.
Author M
anuscriptA
uthor Manuscript
Author M
anuscriptA
uthor Manuscript

4°C. Serum was analyzed immediately or stored in −80°C until the assessment. For the
hematological assessment of blood, EDTA was added to blood, and immediately analyzed
with a Hemavet 950FS (Drew Scientific) according to the manufacturer’s protocol.
Tumor cell line culture—B16-F10 melanoma cells were cultured in DMEM and E.G7-
OVA cells were cultured in RPMI1640, both were supplemented with 10% FBS (GIBCO),
1% penicillin-streptomycin (GIBCO), 2 mM L-glutamine (GIBCO), 1 mM sodium pyruvate
(GIBCO), and 0.01 M HEPES (AmericanBio). YUMMER1.7 cells were provided by Dr.
Marcus W. Bosenberg. YUMMER1.7 cells were cultured in DMEM/F-12 Media with 10%
FBS (GIBCO), 1% penicillin-streptomycin (GIBCO), 2 mM L-glutamine (GIBCO), 1 mM
sodium pyruvate (GIBCO), and 0.01 M HEPES (AmericanBio). For the in vivo injection,
cells were diluted in OPTI-MEM with the proper concentration of injection.
In vivo killing assay—In vivo killing assay was performed as described previously with
modification (Kim et al., 2014). 18 week old CD45.2+ B6 mice were infected with LM-
OVA. On day 7 after infection, splenocytes from 8 week old CD45.1+ B6 mice were loaded
and labeled with Cell Trace Violet (Violet) (PBS (5 μM Violet) or SIINFEKL peptide (0.5
μM Violet) and injected to the LM-OVA-infected mice retro-orbitally. Spleens of LM-OVA-
infected mice were harvested after 4 hours of CD45.1+ splenocytes, and analyzed by flow
cytometry. Killing activity was determined by the ratio between SIINFEKL peptide-loaded
vs unloaded cell proportion.
Bone marrow transplantation—OT-I (stock #003831) mice with or without perinatal
DEX exposure were utilized as BM donors, and wild-type B6-CD45.1 (stock #002014) mice
with or without perinatal DEX treatment were used as recipients. 6-week-old Recipient mice
were irradiated with 10 Gy and 10 million donor BM cells were transplanted by intravenous
injection. Mice were recovered for 6–10 weeks after transplantation and then utilized for
further experiments.
Quantification of bacterial loads—LM-OVA CFU titers were determined by plating
titrated amounts of liver homogenate on BHI plates. Briefly, liver was harvested at indicated
times post-infection and weighed. Tissue homogenates were generated by mincing the
tissues on a 70 μm cell strainer using the plunger of a 5 ml syringe. Titrated dilutions of
tissue homogenate were generated in 1% Triton X-100 (Sigma-Aldrich), plated on BHI
plates, and grown overnight at 37°C.
Seahorse metabolic analysis—Analysis of the extracellular acidification rate (ECAR)
and oxygen consumption rate (OCR) was performed with a Seahorse XF96 Extracellular
Flux Analyzer instrument in the context BMDC and OT-I co-culture as a measure of lactate
production (a surrogate for the glycolytic rate) and OXPHOS respectively. In brief, BMDC
(0.2 × 10⁵ cells per well) and naïve OT-I CD8 T cells (1 × 10⁵ cells per well) were co-
cultured in the presence or absence of SIINFEKL peptide overnight on a pretreated poly-
Dlysine-coated 96-well polystyrene Seahorse plate in RPMI 1640 media supplemented 7.5%
FBS with 2 mM L-glutamine with 50 μM β-mercaptoethanol. Prior to starting the assay,
cells were washed and incubated in Seahorse Assay Medium supplemented with 10 mM
glucose, 2mM L-glutamine and 1 mM sodium pyruvate in 37°C incubator without CO2 for
Hong et al. Page 14
Cell. Author manuscript; available in PMC 2020 August 04.
Author M
anuscriptA
uthor Manuscript
Author M
anuscriptA
uthor Manuscript

45 min. Oligomycin (ATPase inhibitor, 1 μM), FCCP (0.2 μM) and rotenone (0.5 μM) were
injected where indicated and the ECAR (mpH/min) OCR (pMoles O2/min) was measured in
real time.
Perinatal stress and poly (I:C) injection—For the induction of perinatal restraint
stress, pregnant mice were placed into ventilated 50 ml conical tube for 3 hours/day during
E12.5-E17.5. For perinatal cold exposure, pregnant mice or nursing mice with pups were
placed 5 °C in cold chamber (HPP750Life, Memmert) 6–12 hours/day with 12 hours light/
dark condition. Control mice for cold exposure were placed in room temperature with 12
hours light/dark condition. For poly (I:C) injection, we injected either saline or poly (I:C)
(20 μg in 10 μl; High Molecular weight, Invivogen) intraperitoneally on PND3 directly to
pups.
RNA-sequencing and analysis—Naïve OT-I T cells or activated CD8 T cells were
sorted from spleen and/or LNs as indicated in the specific experiments. RNA was purified
from T cells using QIAGEN RNeasy columns (74106) with on-column DNase digestion
according to the manufacturer’s instructions. RNA-seq libraries were constructed following
Illumina Tru-seq stranded mRNA protocol (20020594). Paired-end sequencing was
performed with Nextseq 500 with 38 bp reads from each end. Reads were mapped to the
mouse transcriptome (GRCm38 ensembl release 89; cDNA and ncRNA) and quantified by
Kallisto (v0.45.0) with a k-mer index 25 and 60 bootstrapping (Bray et al., 2016). The
expression of each transcript is calculated in TPM (transcript per million). When multiple
transcripts match to the same gene, the expression of the gene is calculated by summing the
TPM of all matched transcripts. We also aligned the reads to the mm10 genome by STAR
using Partek® Genomics Suite® software, version 7.0 (2018) and analyzed the result with
Ingenuity Pathway Analysis (Qiagen).
ATAC-seq—Naïve CD8 T cells from spleens and LNs were sorted with FACS. ATAC-seq
libraries were constructed with 50K cells from each condition following Omni-ATAC
protocol (Illumina FC-121–1031(Corces et al., 2017)). The libraries were sequenced on
Illumina Nextseq 500 (paired-end run, 38 bp). Sequenced reads were trimmed with adaptor
sequences (cutadapt v1.9.1, (Martin, 2011)) and mapped to the mouse genome (GRCm38,
emsembl release 93) by Bowtie2 (v2.3.4.1, (Langmead and Salzberg, 2012)). Mitochondrial
and duplicated reads were removed by SAMtools (v1.9, (Li et al., 2009)) and Picard (v2.9.0,
https://broadinstitute.github.io/picard/), respectively. Peaks were found by MACS2 (v.2.1.1,
(Zhang et al., 2008)) and visualized by deepTools (v3.1.1, Ramirez et al., 2014, NAR).
Data availability—Sequenced reads are being deposited in the NCBI Gene Expression
Omnibus (GEO) database (accession number GSE136980).
Brain Histology—For GR and MR analysis, mice were perfused (transcardially with 4%
PFA in PBS, pH 7.4). Brains were kept in fixation solution overnight at 4 °C, then
transferred to 30% sucrose solution for 24 h, sectioned (50 μm thickness) on a cryostat and
stained while free-floating. Antibodies were as follows: 1:100 NR3C2 monoclonal antibody
(ThermoFisher Scientific, MA1–620), 1:200 rabbit anti-GR (ThermoFisher Scientific, PA1–
511A). Secondary antibodies were Alexa Fluor 488 (ThermoFisher Scientific, A-21202),
Hong et al. Page 15
Cell. Author manuscript; available in PMC 2020 August 04.
Author M
anuscriptA
uthor Manuscript
Author M
anuscriptA
uthor Manuscript
647 (ThermoFisher Scientific, A-31573). dorsal DG, dorsal CA3, and dorsal CA1 were
analyzed at −1.43 to −1.79 mm from bregma. PVH was analyzed at −0.59 to −0.95 mm from
bregma. 3–5 sections per mouse were acquired and analyzed and the data per mouse was the
average of the sections. All the samples were acquired using the same settings (laser power,
20% for MR, 10% for GR, optical slice, 1 μm) on an Leica SP8 on HC PL APO 40×/1.30
oil-immersion. Images were quantified using spot detection software (Imaris 9.2, Bitplane
AG, expected radius 1 μm).
RNA Extraction and Quantification—For tissue RNA extraction, tissues were
harvested into RNA Bee RNA isolation reagent (Tel Test) and disrupted by bead
homogenization in Lysing Matrix D tubes using a FastPrep-24 5G homogenizer (MP
Biomedicals). RNA was extracted using the RNeasy Kit according to manufacturer’s
protocol (QIAGEN). For RNA extraction from cultured cells, RNA was harvested using
phenol-chloroform extraction according to manufacturer’s protocol (Tel Test). cDNA
synthesis was performed using MMLV reverse transcriptase (Clontech) with oligo(dT)
primers. qRT-PCR reactions were performed on either a CFX96 Real-Time System or
CFX384 Real-Time System (Bio-Rad) using PerfeCTa SYBR Green SuperMix (Quanta
Biosciences) and transcript levels were normalized to Rpl13a. Primers used for qRT-PCR are
cataloged in Table S1.
Quantification and Statistical Analysis—Statistical information including n, mean,
and statistical significance values are indicated in the text or the figure legends. Results were
statistically analyzed using Student’s t-test, Mann Whitney U-test, or an analysis of variance
(ANOVA) test with multiple comparisons where appropriate using Prism 8.0 (GraphPad
Software, Inc). Kaplan Meier survival curves were compared using log-rank Mantel-Cox
test. A p value of < 0.05 was considered to be statistically significant
Supplementary Material
Refer to Web version on PubMed Central for supplementary material.
Acknowledgments
Work in the R.M. lab was supported by Howard Hughes Medical Institute (HHMI), the Blavatnik Family Foundation, the Else Kroner-Fresenius Foundation and a grant from the NIH (1R01 AI144152-01). J. Hong is supported by the Cancer Research Institute/Bristol-Myers Squibb postdoctoral fellowship. J. Lim is supported by Jane Coffin Childs Fellowship and the Human Frontier Science Program Long-Term Fellowship (LT000037/2018-L). We thank to Dr. Marcus Bosenberg for providing YUMMER1.7 cell line. We want to thank all current and former members of the Medzhitov lab for discussions.
References
Alexander N, Rosenlocher F, Stalder T, Linke J, Distler W, Morgner J, and Kirschbaum C (2012). Impact of antenatal synthetic glucocorticoid exposure on endocrine stress reactivity in term-born children. J Clin Endocrinol Metab 97, 3538–3544. [PubMed: 22869608]
Bach JF (2002). The effect of infections on susceptibility to autoimmune and allergic diseases. N Engl J Med 347, 911–920. [PubMed: 12239261]
Barbazanges A, Piazza PV, Le Moal M, and Maccari S (1996). Maternal glucocorticoid secretion mediates long-term effects of prenatal stress. J Neurosci 16, 3943–3949. [PubMed: 8656288]
Hong et al. Page 16
Cell. Author manuscript; available in PMC 2020 August 04.
Author M
anuscriptA
uthor Manuscript
Author M
anuscriptA
uthor Manuscript

Barker DJ (2002). Fetal programming of coronary heart disease. Trends Endocrinol Metab 13, 364–368. [PubMed: 12367816]
Bateson P, Barker D, Clutton-Brock T, Deb D, D’Udine B, Foley RA, Gluckman P, Godfrey K, Kirkwood T, Lahr MM, et al. (2004). Developmental plasticity and human health. Nature 430, 419–421. [PubMed: 15269759]
Beijers R, Jansen J, Riksen-Walraven M, and de Weerth C (2010). Maternal prenatal anxiety and stress predict infant illnesses and health complaints. Pediatrics 126, e401–409. [PubMed: 20643724]
Bradbury MJ, Akana SF, and Dallman MF (1994). Roles of type I and II corticosteroid receptors in regulation of basal activity in the hypothalamo-pituitary-adrenal axis during the diurnal trough and the peak: evidence for a nonadditive effect of combined receptor occupation. Endocrinology 134, 1286–1296. [PubMed: 8119168]
Braun T, Challis JR, Newnham JP, and Sloboda DM (2013). Early-life glucocorticoid exposure: the hypothalamic-pituitary-adrenal axis, placental function, and long-term disease risk. Endocr Rev 34, 885–916. [PubMed: 23970762]
Bray NL, Pimentel H, Melsted P, and Pachter L (2016). Near-optimal probabilistic RNA-seq quantification. Nat Biotechnol 34, 525–527. [PubMed: 27043002]
Cain DW, and Cidlowski JA (2017). Immune regulation by glucocorticoids. Nat Rev Immunol 17, 233–247. [PubMed: 28192415]
Catalani A, Alema GS, Cinque C, Zuena AR, and Casolini P (2011). Maternal corticosterone effects on hypothalamus-pituitary-adrenal axis regulation and behavior of the offspring in rodents. Neurosci Biobehav Rev 35, 1502–1517. [PubMed: 21056056]
Catalani A, Marinelli M, Scaccianoce S, Nicolai R, Muscolo LA, Porcu A, Koranyi L, Piazza PV, and Angelucci L (1993). Progeny of mothers drinking corticosterone during lactation has lower stress-induced corticosterone secretion and better cognitive performance. Brain Res 624, 209–215. [PubMed: 8252393]
Chang CH, Curtis JD, Maggi LB Jr., Faubert B, Villarino AV, O’Sullivan D, Huang SC, van der Windt GJ, Blagih J, Qiu J, et al. (2013). Posttranscriptional control of T cell effector function by aerobic glycolysis. Cell 153, 1239–1251. [PubMed: 23746840]
Chen Y, Qiao S, Tuckermann J, Okret S, and Jondal M (2010). Thymus-derived glucocorticoids mediate androgen effects on thymocyte homeostasis. FASEB J 24, 5043–5051. [PubMed: 20798244]
Corces MR, Trevino AE, Hamilton EG, Greenside PG, Sinnott-Armstrong NA, Vesuna S, Satpathy AT, Rubin AJ, Montine KS, Wu B, et al. (2017). An improved ATAC-seq protocol reduces background and enables interrogation of frozen tissues. Nature methods 14, 959–962. [PubMed: 28846090]
De Kloet ER, Vreugdenhil E, Oitzl MS, and Joels M (1998). Brain corticosteroid receptor balance in health and disease. Endocr Rev 19, 269–301. [PubMed: 9626555]
Di Meco A, Joshi YB, Lauretti E, and Pratico D (2016). Maternal dexamethasone exposure ameliorates cognition and tau pathology in the offspring of triple transgenic AD mice. Mol Psychiatry 21, 403–410. [PubMed: 26077691]
Gao Y, Nish SA, Jiang R, Hou L, Licona-Limón P, Weinstein JS, Zhao H, and Medzhitov R (2013). Control of T helper 2 responses by transcription factor IRF4-dependent dendritic cells. Immunity 39, 722–732. [PubMed: 24076050]
Gluckman PD, and Hanson MA (2004). Living with the past: evolution, development, and patterns of disease. Science 305, 1733–1736. [PubMed: 15375258]
Gollwitzer ES, and Marsland BJ (2015). Impact of Early-Life Exposures on Immune Maturation and Susceptibility to Disease. Trends Immunol 36, 684–696. [PubMed: 26497259]
Han F, Ozawa H, Matsuda K, Nishi M, and Kawata M (2005). Colocalization of mineralocorticoid receptor and glucocorticoid receptor in the hippocampus and hypothalamus. Neurosci Res 51, 371–381. [PubMed: 15740800]
Henriksen R, Rettenbacher S, and Groothuis TG (2011). Prenatal stress in birds: pathways, effects, function and perspectives. Neurosci Biobehav Rev 35, 1484–1501. [PubMed: 21536067]
Henriksen RE, and Thuen F (2015). Marital Quality and Stress in Pregnancy Predict the Risk of Infectious Disease in the Offspring: The Norwegian Mother and Child Cohort Study. PLoS One 10, e0137304. [PubMed: 26422017]
Hong et al. Page 17
Cell. Author manuscript; available in PMC 2020 August 04.
Author M
anuscriptA
uthor Manuscript
Author M
anuscriptA
uthor Manuscript

Hogquist KA, Jameson SC, Heath WR, Howard JL, Bevan MJ, and Carbone FR (1994). T cell receptor antagonist peptides induce positive selection. Cell 76, 17–27. [PubMed: 8287475]
Kapoor A, Petropoulos S, and Matthews SG (2008). Fetal programming of hypothalamic-pituitary-adrenal (HPA) axis function and behavior by synthetic glucocorticoids. Brain research reviews 57, 586–595. [PubMed: 17716742]
Karmaus PWF, Chen X, Lim SA, Herrada AA, Nguyen TM, Xu B, Dhungana Y, Rankin S, Chen W, Rosencrance C, et al. (2019). Metabolic heterogeneity underlies reciprocal fates of TH17 cell stemness and plasticity. Nature 565, 101–105. [PubMed: 30568299]
Karst H, Berger S, Turiault M, Tronche F, Schütz G, and Joëls M (2005). Mineralocorticoid receptors are indispensable for nongenomic modulation of hippocampal glutamate transmission by corticosterone. Proc Natl Acad Sci U S A 102, 19204–19207. [PubMed: 16361444]
Kay G, Tarcic N, Poltyrev T, and Weinstock M (1998). Prenatal stress depresses immune function in rats. Physiol Behav 63, 397–402. [PubMed: 9469733]
Kelly-Irving M, Lepage B, Dedieu D, Lacey R, Cable N, Bartley M, Blane D, Grosclaude P, Lang T, and Delpierre C (2013). Childhood adversity as a risk for cancer: findings from the 1958 British birth cohort study. BMC Public Health 13, 767. [PubMed: 23957659]
Kim D, Reilly A, and Lawrence DA (2001). Relationships between IFNγ, IL-6, Corticosterone, and Listeria monocytogenes Pathogenesis in BALB/c Mice. Cell Immunol 207, 13–18. [PubMed: 11161448]
Kim MV, Ouyang W, Liao W, Zhang MQ, and Li MO (2014). Murine in vivo CD8(+) T Cell Killing Assay. Bio-protocol 4.
Langmead B, and Salzberg SL (2012). Fast gapped-read alignment with Bowtie 2. Nature methods 9, 357–359. [PubMed: 22388286]
Levine S (1994). The ontogeny of the hypothalamic-pituitary-adrenal axis. The influence of maternal factors. Ann N Y Acad Sci 746, 275–288; discussion 289–293. [PubMed: 7825883]
Li H, Handsaker B, Wysoker A, Fennell T, Ruan J, Homer N, Marth G, Abecasis G, and Durbin R (2009). The Sequence Alignment/Map format and SAMtools. Bioinformatics 25, 2078–2079. [PubMed: 19505943]
Macintyre AN, Finlay D, Preston G, Sinclair LV, Waugh CM, Tamas P, Feijoo C, Okkenhaug K, and Cantrell DA (2011). Protein kinase B controls transcriptional programs that direct cytotoxic T cell fate but is dispensable for T cell metabolism. Immunity 34, 224–236. [PubMed: 21295499]
Mairesse J, Lesage J, Breton C, Breant B, Hahn T, Darnaudery M, Dickson SL, Seckl J, Blondeau B, Vieau D, et al. (2007). Maternal stress alters endocrine function of the feto-placental unit in rats. Am J Physiol Endocrinol Metab 292, E1526–1533. [PubMed: 17264224]
Martin M (2011). Cutadapt removes adapter sequences from high-throughput sequencing reads. 2011 17, 3 %J EMBnet.journal.
Mittelstadt PR, Monteiro JP, and Ashwell JD (2012). Thymocyte responsiveness to endogenous glucocorticoids is required for immunological fitness. J Clin Invest 122, 2384–2394. [PubMed: 22653054]
Mittelstadt PR, Taves MD, and Ashwell JD (2018). Cutting Edge: De Novo Glucocorticoid Synthesis by Thymic Epithelial Cells Regulates Antigen-Specific Thymocyte Selection. J Immunol 200, 1988–1994. [PubMed: 29440508]
Moore SE, Collinson AC, Tamba N’Gom P, Aspinall R, and Prentice AM (2006). Early immunological development and mortality from infectious disease in later life. Proc Nutr Soc 65, 311–318. [PubMed: 16923314]
Mueller NT, Bakacs E, Combellick J, Grigoryan Z, and Dominguez-Bello MG (2015). The infant microbiome development: mom matters. Trends Mol Med 21, 109–117. [PubMed: 25578246]
Nielsen NM, Hansen AV, Simonsen J, and Hviid A (2011). Prenatal stress and risk of infectious diseases in offspring. Am J Epidemiol 173, 990–997. [PubMed: 21389042]
O’Connor TG, Winter MA, Hunn J, Carnahan J, Pressman EK, Glover V, Robertson-Blackmore E, Moynihan JA, Lee FE, and Caserta MT (2013). Prenatal maternal anxiety predicts reduced adaptive immunity in infants. Brain Behav Immun 32, 21–28. [PubMed: 23439080]
Okin D, and Medzhitov R (2012). Evolution of inflammatory diseases. Curr Biol 22, R733–740. [PubMed: 22975004]
Hong et al. Page 18
Cell. Author manuscript; available in PMC 2020 August 04.
Author M
anuscriptA
uthor Manuscript
Author M
anuscriptA
uthor Manuscript

Pope C, Kim SK, Marzo A, Masopust D, Williams K, Jiang J, Shen H, and Lefrancois L (2001). Organ-specific regulation of the CD8 T cell response to Listeria monocytogenes infection. J Immunol 166, 3402–3409. [PubMed: 11207297]
Ralevski A, and Horvath TL (2015). Developmental programming of hypothalamic neuroendocrine systems. Front Neuroendocrinol 39, 52–58. [PubMed: 26391503]
Reyes-Contreras M, Glauser G, Rennison DJ, and Taborsky B (2019). Early-life manipulation of cortisol and its receptor alters stress axis programming and social competence. Philos Trans R Soc Lond B Biol Sci 374, 20180119. [PubMed: 30966879]
Ross SH, Rollings C, Anderson KE, Hawkins PT, Stephens LR, and Cantrell DA (2016). Phosphoproteomic Analyses of Interleukin 2 Signaling Reveal Integrated JAK Kinase-Dependent and -Independent Networks in CD8(+) T Cells. Immunity 45, 685–700. [PubMed: 27566939]
Sapolsky RM, and Meaney MJ (1986). Maturation of the adrenocortical stress response: neuroendocrine control mechanisms and the stress hyporesponsive period. Brain Res 396, 64–76. [PubMed: 3011218]
Schmidt MV (2011). Animal models for depression and the mismatch hypothesis of disease. Psychoneuroendocrinology 36, 330–338. [PubMed: 20674180]
Schoenfeld TJ, and Gould E (2012). Stress, stress hormones, and adult neurogenesis. Exp Neurol 233, 12–21. [PubMed: 21281629]
Shimba A, Cui G, Tani-Ichi S, Ogawa M, Abe S, Okazaki F, Kitano S, Miyachi H, Yamada H, Hara T, et al. (2018). Glucocorticoids Drive Diurnal Oscillations in T Cell Distribution and Responses by Inducing Interleukin-7 Receptor and CXCR4. Immunity 48, 286–298.e286. [PubMed: 29396162]
Spracklen CN, Wallace RB, Sealy-Jefferson S, Robinson JG, Freudenheim JL, Wellons MF, Saftlas AF, Snetselaar LG, Manson JE, Hou L, et al. (2014). Birth weight and subsequent risk of cancer. Cancer Epidemiol 38, 538–543. [PubMed: 25096278]
Stearns SC (1992). The evolution of life histories (Oxford; New York: Oxford University Press).
Stonawski V, Frey S, Golub Y, Rohleder N, Kriebel J, Goecke TW, Fasching PA, Beckmann MW, Kornhuber J, Kratz O, et al. (2019). Associations of prenatal depressive symptoms with DNA methylation of HPA axis-related genes and diurnal cortisol profiles in primary school-aged children. Dev Psychopathol 31, 419–431. [PubMed: 29606180]
Taves MD, Mittelstadt PR, Presman DM, Hager GL, and Ashwell JD (2019). Single-Cell Resolution and Quantitation of Targeted Glucocorticoid Delivery in the Thymus. Cell reports 26, 3629–3642.e3624. [PubMed: 30917317]
Tegethoff M, Pryce C, and Meinlschmidt G (2009). Effects of intrauterine exposure to synthetic glucocorticoids on fetal, newborn, and infant hypothalamic-pituitary-adrenal axis function in humans: a systematic review. Endocr Rev 30, 753–789. [PubMed: 19837868]
Valles SL, Benlloch M, Rodriguez ML, Mena S, Pellicer JA, Asensi M, Obrador E, and Estrela JM (2013). Stress hormones promote growth of B16-F10 melanoma metastases: an interleukin 6- and glutathione-dependent mechanism. J Transl Med 11, 72. [PubMed: 23517603]
van Bodegom M, Homberg JR, and Henckens M (2017). Modulation of the Hypothalamic-Pituitary-Adrenal Axis by Early Life Stress Exposure. Front Cell Neurosci 11, 87. [PubMed: 28469557]
Venihaki M, Carrigan A, Dikkes P, and Majzoub JA (2000). Circadian rise in maternal glucocorticoid prevents pulmonary dysplasia in fetal mice with adrenal insufficiency. Proc Natl Acad Sci U S A 97, 7336–7341. [PubMed: 10861000]
Wang A, Luan HH, and Medzhitov R (2019). An evolutionary perspective on immunometabolism. Science 363.
Wang J, Perry CJ, Meeth K, Thakral D, Damsky W, Micevic G, Kaech S, Blenman K, and Bosenberg M (2017). UV-induced somatic mutations elicit a functional T cell response in the YUMMER1.7 mouse melanoma model. Pigment cell & melanoma research 30, 428–435. [PubMed: 28379630]
Weaver IC, Cervoni N, Champagne FA, D’Alessio AC, Sharma S, Seckl JR, Dymov S, Szyf M, and Meaney MJ (2004). Epigenetic programming by maternal behavior. Nat Neurosci 7, 847–854. [PubMed: 15220929]
Wilckens T, and De Rijk R (1997). Glucocorticoids and immune function: unknown dimensions and new frontiers. Immunol Today 18, 418–424. [PubMed: 9293156]
Hong et al. Page 19
Cell. Author manuscript; available in PMC 2020 August 04.
Author M
anuscriptA
uthor Manuscript
Author M
anuscriptA
uthor Manuscript

Witek Janusek L, Tell D, Albuquerque K, and Mathews HL (2013). Childhood adversity increases vulnerability for behavioral symptoms and immune dysregulation in women with breast cancer. Brain Behav Immun 30 Suppl, S149–162. [PubMed: 22659062]
Yoshiya M, Komatsuzaki Y, Hojo Y, Ikeda M, Mukai H, Hatanaka Y, Murakami G, Kawata M, Kimoto T, and Kawato S (2013). Corticosterone rapidly increases thorns of CA3 neurons via synaptic/extranuclear glucocorticoid receptor in rat hippocampus. Frontiers in neural circuits 7, 191. [PubMed: 24348341]
Zhang Y, Liu T, Meyer CA, Eeckhoute J, Johnson DS, Bernstein BE, Nusbaum C, Myers RM, Brown M, Li W, et al. (2008). Model-based analysis of ChIP-Seq (MACS). Genome Biol 9, R137. [PubMed: 18798982]
Hong et al. Page 20
Cell. Author manuscript; available in PMC 2020 August 04.
Author M
anuscriptA
uthor Manuscript
Author M
anuscriptA
uthor Manuscript

Highlights
• Early-life stress has long-term effect on the immune system.
• Perinatal glucocorticoids exposure changes the set-point of the HPA-axis.
• Reduced GR signaling decreases CD8 T cell function by altering chromatin at
key loci.
• Perinatal glucocorticoids result in susceptibility to tumors and bacterial
infection.
Hong et al. Page 21
Cell. Author manuscript; available in PMC 2020 August 04.
Author M
anuscriptA
uthor Manuscript
Author M
anuscriptA
uthor Manuscript
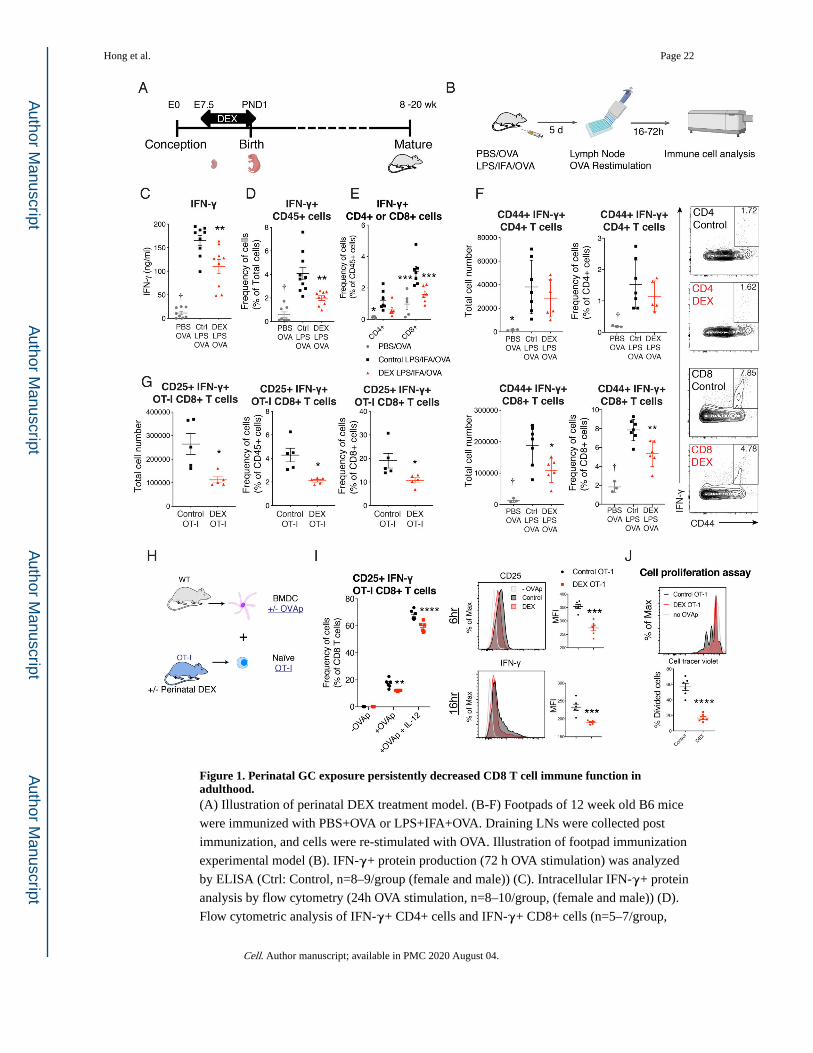
Figure 1. Perinatal GC exposure persistently decreased CD8 T cell immune function in adulthood.(A) Illustration of perinatal DEX treatment model. (B-F) Footpads of 12 week old B6 mice
were immunized with PBS+OVA or LPS+IFA+OVA. Draining LNs were collected post
immunization, and cells were re-stimulated with OVA. Illustration of footpad immunization
experimental model (B). IFN-γ+ protein production (72 h OVA stimulation) was analyzed
by ELISA (Ctrl: Control, n=8–9/group (female and male)) (C). Intracellular IFN-γ+ protein
analysis by flow cytometry (24h OVA stimulation, n=8–10/group, (female and male)) (D).
Flow cytometric analysis of IFN-γ+ CD4+ cells and IFN-γ+ CD8+ cells (n=5–7/group,
Hong et al. Page 22
Cell. Author manuscript; available in PMC 2020 August 04.
Author M
anuscriptA
uthor Manuscript
Author M
anuscriptA
uthor Manuscript

male and female) (E). Flow cytometric analysis of CD44+ IFN-γ+ CD4 and CD8 T cells in
draining LN (n=3–7/group, (male), representative of 3 independent experiments (repeated in
females)) (F). (G) Footpads of 12 week old OT-I mice were immunized with OVA as
described in Figure 1B. Flow cytometric analysis of CD25+ IFN-γ+ OT-I CD8 T cell in
draining LN (n=5/group (female), representative of 2 independent experiments). (H-J) Naïve
CD8 T cells from 10–12 week old female or male OT-I mice were sorted and co-cultured
with BMDC in the presence or absence of SIINFEKL (OVAp) and IL-12. Illustration of
BMDC and CD8 T cell co-culture experimental model (H). Flow cytometric analysis of
CD25+ IFN-γ+ OT-I CD8 T cells after 16 hours of co-culture (left) Flow cytometric
analysis of mean florescent intensity (MFI) of CD25 and IFN-γ of CD8+ cells after co-
culture (right, n=3–6/group (female), representative of four independent experiments
(repeated in males)) (I). Sorted naïve OT-I CD8 T cells (single cells/live/CD45+/CD3ε+
CD8α+) were labeled with Cell Trace Violet (Violet). Cell proliferation was measured with
Violet dilution after 48 hours of OVAp activation (n=6/group, female). Data are represented
as mean ± SEM. 1-way ANOVA (C, D, and F), 2-way ANOVA (E and I) Student’s t-test
(rest), *p<0.05, **p<0.01, ***p<0.001 vs Control group, †p<0.05 vs both Control and DEX
group.
Hong et al. Page 23
Cell. Author manuscript; available in PMC 2020 August 04.
Author M
anuscriptA
uthor Manuscript
Author M
anuscriptA
uthor Manuscript
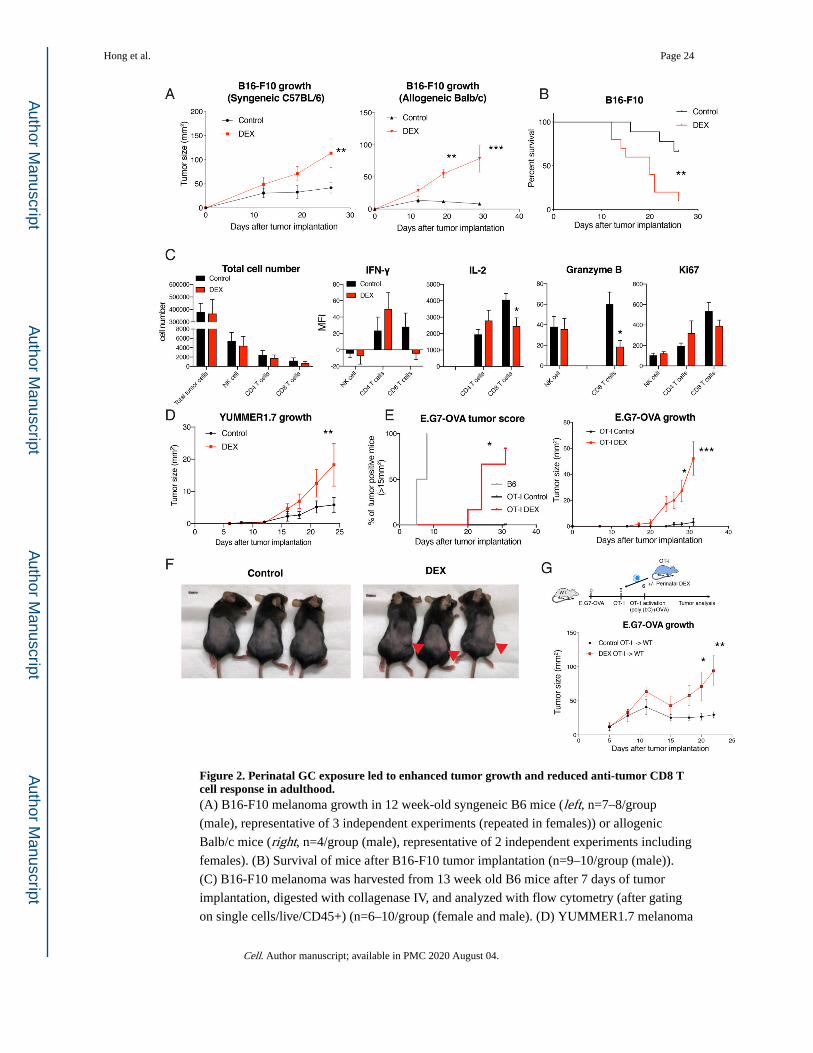
Figure 2. Perinatal GC exposure led to enhanced tumor growth and reduced anti-tumor CD8 T cell response in adulthood.(A) B16-F10 melanoma growth in 12 week-old syngeneic B6 mice (left, n=7–8/group
(male), representative of 3 independent experiments (repeated in females)) or allogenic
Balb/c mice (right, n=4/group (male), representative of 2 independent experiments including
females). (B) Survival of mice after B16-F10 tumor implantation (n=9–10/group (male)).
(C) B16-F10 melanoma was harvested from 13 week old B6 mice after 7 days of tumor
implantation, digested with collagenase IV, and analyzed with flow cytometry (after gating
on single cells/live/CD45+) (n=6–10/group (female and male). (D) YUMMER1.7 melanoma
Hong et al. Page 24
Cell. Author manuscript; available in PMC 2020 August 04.
Author M
anuscriptA
uthor Manuscript
Author M
anuscriptA
uthor Manuscript

growth in 11–12 week old B6 mice (n=8/group (male), representative of 2 independent
experiments including females). (E and F) 10 week old B6 mice or OT-I mice were
implanted with EG.7-OVA lymphoma, and the tumor growth was monitored. Tumor score in
B6 mice (n=7 (female)) and OT-I mice (n=4–6/group (female)) (left) and tumor growth
(right) (E). Representative picture of OT-I mice after 4 weeks of tumor implantation (F). (G)
E.G7-OVA tumor was implanted to 8 week old wild-type mice, and OT-I CD8 T cell were
sorted from 8 week old OT-I mice and adoptively transferred to the tumor-bearing mice.
Experimental scheme with OT-I transfer and activation (top) and E.G7-OVA growth
(bottom). Data are represented as mean ± SEM. 2-way ANOVA (A, C, D, E (right), G), Log-
rank Mantel-Cox test (B and E (left)), *p<0.05, **p<0.01, ***p<0.001 vs Control group.
Hong et al. Page 25
Cell. Author manuscript; available in PMC 2020 August 04.
Author M
anuscriptA
uthor Manuscript
Author M
anuscriptA
uthor Manuscript

Figure 3. Perinatal GC exposure elicited decreased anti-bacterial CD8 T cell function and increased bacterial burden.(A and B) 16 week old B6 mice were infected with 1 × 10⁵ colony-forming unit (CFU) of
LM-OVA. OVA-specific CD8 T cells in spleen of mice after 7 days post infection (n=6–7/
group (female)) (A). Listeria burden in liver 7 days after LM-OVA infection (n=13/group
(female)) (B). (C) 18 week old CD45.2+ B6 mice were infected with LM-OVA. On day 7
after infection, killing of antigen-loaded splenocytes was analyzed by flow cytometry (see
also Figure S4A, n=5/group (female). (D-F) OT-I CD8 T cells were sorted from 12 week old
OT-I mice and labeled with Violet, adoptively transferred to wild-type mice and then
infected with LM-OVA. Flow cytometric analysis of OT-I cell proliferation in blood (after
gating on single cell/live/CD45+) (n=5/group (male) in each time points) (D). Listeria
burden in liver 3 days after LM-OVA infection (n=5–6/group (female)) (E). Flow cytometric
analysis (after gating on single cells/live/CD45+/CD3ε+ CD8α+) of IFN-γ+ cells among
Violet+ OT-I CD8 T cells (left, F), and Granzyme B expression in Violet+ OT-I CD8 T cells
after 3 days post infection (n=6/group (female)) (right, F). Data are represented as median ±
95% confidence interval (B and E) or mean ± SEM (others). Mann Whitney U-test (B and
E), Student’s t-test (A, C, and F), 2-way ANOVA (D), *p<0.05, **p<0.01, ***p<0.001 vs
Control group.
Hong et al. Page 26
Cell. Author manuscript; available in PMC 2020 August 04.
Author M
anuscriptA
uthor Manuscript
Author M
anuscriptA
uthor Manuscript

Figure 4. Perinatal GC exposure decreased systemic CORT level, and inhibition of GR signaling reduced CD8 T cell function.(A) Corticosterone level in 16 week old B6 mice (n=14–19/group (female and male), ZT=3
(10 am)). (B) Corticosterone level in B6 mice after 5 days of B16-F10 melanoma
implantation (n=5–7/group (male), left, ZT=4), after 7 days of LM-OVA (n=4/group
(female), middle, ZT=4), and after 30 minutes of restraint stress (n=7/group (male and
female), ZT=6). (C) Flow cytometric analysis of CD44+ IFN-γ+ OT-I CD8 T cells with or
without RU486 (1 μg/ml) in BMDC and OT-I co-culture system described in Figure 1H
(n=3/group (female), representative of 3 independent experiments including males). (D and
E) MTY (800 μg/ml) was treated in drinking water during footpad immunization with LPS
+IFA+OVA (−7 to +5 days of immunization) in mice, as described in Figure 1B. Flow
cytometric analysis of IFN-γ+ CD8 T cells in the LN (16 week old Balb/c mice, n=4–7/
group (male)) (D), and CD44+ IFN-γ+ OT-I CD8 T cells in the LN (16 week old OT-I mice,
n=4–6/group (male)) (E). (F) 12 week-old Wild-type (WT;Nr3c1fl/fl) mice or KO (CD4-Cre
Nr3c1fl/fl) mice were immunized with LPS+IFA+OVA. CD44+ IFN-γ+ CD8 T cells in LN
Hong et al. Page 27
Cell. Author manuscript; available in PMC 2020 August 04.
Author M
anuscriptA
uthor Manuscript
Author M
anuscriptA
uthor Manuscript

were analyzed with flow cytometry (n=5–15/group (female and male)). (G and H) Bone
marrow cells from 10 week old OT-I mice were transferred to 10 week old CD45.1+ wild-
type mice. Footpads of recipient mice were immunized. Illustration of bone marrow
transplantation experiment (G). Flow cytometric analysis of CD44+ IFN-γ+ CD8 T cells in
LN (n=3–5/group (female)) (H). Data are represented as mean ± SEM. 1-way ANOVA (D
and F) 2-way ANOVA (C), Student’s t-test (rest), *p<0.05, **p<0.01, ***p<0.001 vs
Control (Vehicle, DMSO, WT Control) group.
Hong et al. Page 28
Cell. Author manuscript; available in PMC 2020 August 04.
Author M
anuscriptA
uthor Manuscript
Author M
anuscriptA
uthor Manuscript

Figure 5. Reduction of GR signaling led to insufficient CD8 T cell response via reduction in survival and activation signaling.(A and B) Footpads of 13 week old WT (Nr3c1fl/fl) mice and KO (CD4-Cre Nr3c1fl/fl) mice
were immunized and analyzed (described in Figure 1B). Flow cytometric analysis of dead
CD8 T cells in LNs (n=6–8/group (female and male)) (A), and the expression of Bcl2 and
CD69 in CD8 T cell (n=6–8/group (female and male)) (B). (C and D) Wild-type BMDC and
naïve CD8 T cells from 14 week old WT and KO mice were co-cultured in the presence or
absence of anti-CD3ε antibody and IL-12. Flow cytometric analysis of CD25+ IFN-γ+ CD8
T cells (n=3/group (female), representative of 3 independent experiments including males)
Hong et al. Page 29
Cell. Author manuscript; available in PMC 2020 August 04.
Author M
anuscriptA
uthor Manuscript
Author M
anuscriptA
uthor Manuscript

(C). Flow cytometric analysis of expression of proteins in CD8 T cells after activation with
anti-CD3ε antibody (n=6/group (female), representative of 2 independent experiments) (D).
(E-G) CD8 T cells were sorted (single cells/live/CD45+/CD3ε+/CD8α+) from LNs of 12
week old male B6 mice after 5 days of footpad immunization. mRNA from CD8 T cells was
isolated and analyzed with RNA-seq. Differentially-regulated top canonical pathways with
IPA analysis (E). Representative transcripts per millions (TPM) (n=3/group) (F and G). (H)
Wild-type BMDC and naïve OT-I cells sorted from 16 week old OT-I mice were co-cultured
as described in Figure 1G. Flow cytometric analysis after 3–6 hours of SIINFEKL (OVAp)
treatment with or without IL-12 (n=3/group (male), representative of 2 independent
experiments including females). Data are represented as mean ± SEM. 2-Way ANOVA (C
and H), Student’s t-test (rest), *p<0.05, **p<0.01, ***p<0.001 vs Control or wild-type (WT)
group.
Hong et al. Page 30
Cell. Author manuscript; available in PMC 2020 August 04.
Author M
anuscriptA
uthor Manuscript
Author M
anuscriptA
uthor Manuscript

Figure 6. Perinatal GC exposure persistently changed epigenomic state of naïve CD8 T cells via alteration of T-bet.(A) Naïve CD8+ T cells were sorted (with gating on single cell/live/CD45+/CD3ε/CD8α/
CD62L+ CD44-) from spleens and inguinal LNs of 12 week old OT-I mice with or without
perinatal DEX exposure. mRNA from naïve CD8 T cells was isolated and analyzed with
RNA-seq (n=3/group (female)). Differentially regulated representative genes are illustrated
with volcano plot. (B-D) Naïve CD8+ T cells were sorted from spleens and inguinal LNs of
12 week old OT-I mice, and epigenomic state was analyzed with ATAC-seq (n=3/group
(female)). Illustration of motif enrichment analysis of ATAC-seq peak (B). Accessibility of
Ifng locus in different animals, aligned with T-bet-binding sites (C). Accessibility of Tbx21 locus in different animals, aligned with GR-binding sites (D).
Hong et al. Page 31
Cell. Author manuscript; available in PMC 2020 August 04.
Author M
anuscriptA
uthor Manuscript
Author M
anuscriptA
uthor Manuscript

Figure 7. Perinatal GC and stress altered the HPA axis activity.(A-C) Brain of 14 week old B6 mice was collected, sectioned and stained for GR and MR.
Number of MR puncta of GR+ nucleus in dentate gyrus, CA3, CA1 region of hippocampus
(A) and paraventricular nucleus of hypothalamus (B) (n=3/group (female), representative of
2 independent experiments). Representative image of dentate gyrus MR and GR expression
(Scale bar: 30 μm, C). (D) CORT was measured in the morning of age-matched 9–20 week
old B6 mice with various perinatal stressors such as prenatal restraint (3 hours/day during
E12.5-E17.5, n=3 (female)), or perinatal cold exposure (12 hours/day during E13.5 to
Hong et al. Page 32
Cell. Author manuscript; available in PMC 2020 August 04.
Author M
anuscriptA
uthor Manuscript
Author M
anuscriptA
uthor Manuscript
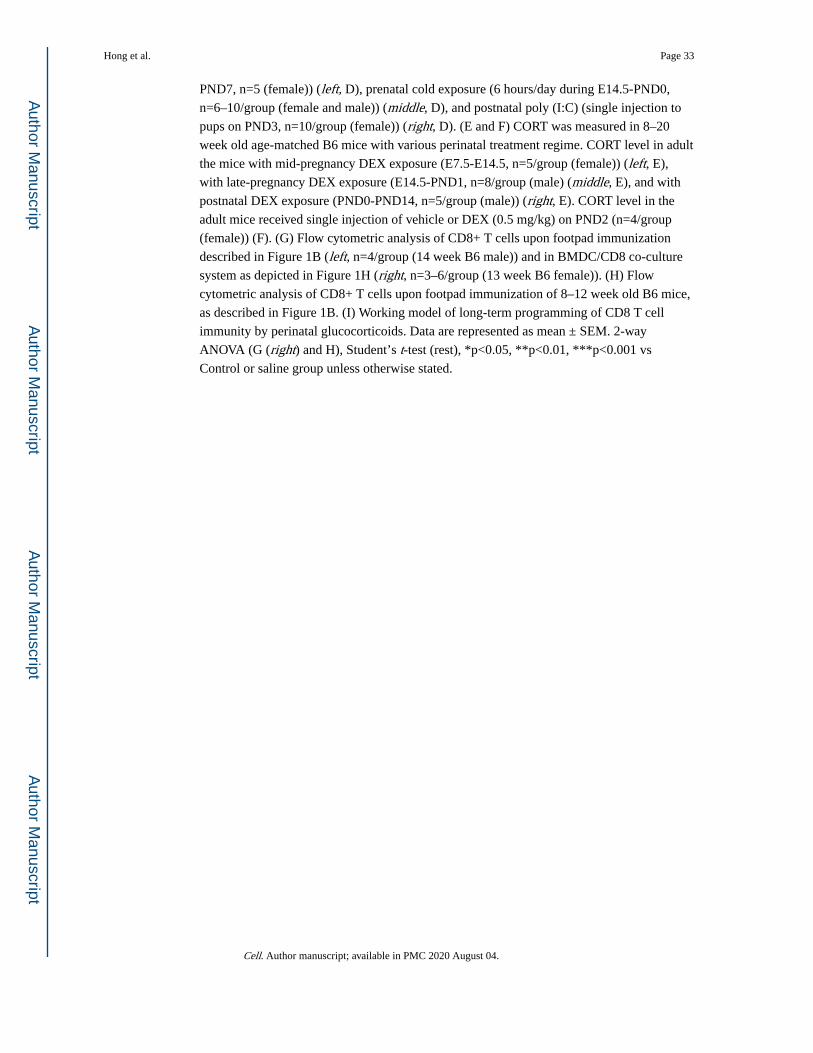
PND7, n=5 (female)) (left, D), prenatal cold exposure (6 hours/day during E14.5-PND0,
n=6–10/group (female and male)) (middle, D), and postnatal poly (I:C) (single injection to
pups on PND3, n=10/group (female)) (right, D). (E and F) CORT was measured in 8–20
week old age-matched B6 mice with various perinatal treatment regime. CORT level in adult
the mice with mid-pregnancy DEX exposure (E7.5-E14.5, n=5/group (female)) (left, E),
with late-pregnancy DEX exposure (E14.5-PND1, n=8/group (male) (middle, E), and with
postnatal DEX exposure (PND0-PND14, n=5/group (male)) (right, E). CORT level in the
adult mice received single injection of vehicle or DEX (0.5 mg/kg) on PND2 (n=4/group
(female)) (F). (G) Flow cytometric analysis of CD8+ T cells upon footpad immunization
described in Figure 1B (left, n=4/group (14 week B6 male)) and in BMDC/CD8 co-culture
system as depicted in Figure 1H (right, n=3–6/group (13 week B6 female)). (H) Flow
cytometric analysis of CD8+ T cells upon footpad immunization of 8–12 week old B6 mice,
as described in Figure 1B. (I) Working model of long-term programming of CD8 T cell
immunity by perinatal glucocorticoids. Data are represented as mean ± SEM. 2-way
ANOVA (G (right) and H), Student’s t-test (rest), *p<0.05, **p<0.01, ***p<0.001 vs
Control or saline group unless otherwise stated.
Hong et al. Page 33
Cell. Author manuscript; available in PMC 2020 August 04.
Author M
anuscriptA
uthor Manuscript
Author M
anuscriptA
uthor Manuscript

Author M
anuscriptA
uthor Manuscript
Author M
anuscriptA
uthor Manuscript
Hong et al. Page 34
KEY RESOURCES TABLE
REAGENT or RESOURCE SOURCE IDENTIFIER
Antibodies
Anti-mouse CD45 BUV395 (Clone 30-F11) BD Bioscience Cat#564279;RRID:AB_2651134
Ant-mouse CD8α PerCP-Cy5.5 (Clone 53-6.7) Biolegend Cat#100734;RRID:AB_2075238
Anti-mouse CD3ε BUV737 (Clone 17A2) BD Bioscience Cat#564380; RRID:AB_2738781
Anti-mouse CD69 Alexa Fluor 700 (Clone H1.2F3) Biolegend Cat#104539; RRID:AB_2566304
Anti-mouse CD25 eFluor 780 (Clone PC61.5) ThermoFisher Scientific Cat#47-0251; RRID:AB_1272179
Anti-mouse CD44 BV711 (Clone IM7) Biolegend Cat#103057; RRID:AB_2564214
Anti-mouse IL-2 PacBlue (Clone JES6-5H4) ThermoFisher Scientific Cat#48-7021; RRID:AB_1944464
Anti-mouse Nr3c1 (GR) FITC (Clone G-5) Santa Cruz Cat#sc-393232; RRID:AB_2687823
Anti-mouse T-bet PE-Cy7 (Clone 4B10) ThermoFisher Scientific Cat#25-5825; RRID:AB_11042699
Anti-mouse Bcl2 APC (Clone REA356) Miltenyi Biotec Cat#130-105-431;RRID: AB_2651267
Anti-mouse Ki67 PE-Dazzle 594 (Clone 16A8) Biolegend Cat#652427;RRID: AB_2632695
Anti-mouse IFN-γ PE (Clone XMG1.2) BD Biosciences Cat#554412;RRID: AB_395376
Purified anti-mouse CD3ε (Clone 145-2C11) BD Biosciences Cat#553057; RRID: AB_394590
Purified anti-mouse IL-4 (Clone 11B11) BD Biosciences Cat#554432; RRID: AB_395388
Anti-mouse phosphorylated-ZAP70 (Y319) PE (Clone n3kobu5)
ThermoFisher Scientific Cat#12-9006; RRID: AB_2572665
Anti-mouse phosphorylated-mTOR (S2448) eFluor450 (Clone MRRBY)
ThermoFisher Scientific Cat#48-9718; RRID: AB_2574127)
Anti-mouse phosphorylated-S6 (S235/S236) PE-Cy7 (Clone cupk43k)
ThermoFisher Scientific Cat#25-9007; RRID: AB_2637099
Anti-mouse phosphorylated-Akt (S473) FITC (Clone SDRNR)
ThermoFisher Scientific Cat#11-9715; RRID: AB_2637097
Anti-mouse phosphorylated-Stat5 (Y694) PE (Clone SRBCZX)
ThermoFisher Scientific Cat#12-9010; RRID: AB_2572671
Anti-mouse IFN-γ (Clone XMG1.2) ThermoFisher Scientific Cat#14-7311; RRID: AB_468468
Anti-mouse IFN-γ Biotin (Clone R4-6A2) ThermoFisher Scientific Cat#13-7312; RRID: AB_466938
NR3C2 (MR) Monoclonal antibody (Clone H10E4C9F)
ThermoFisher Scientific Cat#MA1-620; RRID: AB_2298880
Anti-GR Polyclonal antibody ThermoFisher Scientific Cat#PA1-511A; RRID: AB_2236340
Glucocorticoid Receptor (D6H2L) XP® Rabbit mAb Cell Signaling Technology Cat#12041; RRID: AB_2631286
Anti-rabbit IgG (H+L), F(ab’)2 Fragment (Alexa Fluor® 488 Conjugate)
Cell Signaling Technology Cat#4412, RRID:AB_1904025
Bacterial and Virus Strains
Listeria monocytogenes strain expressing OVA Pope et al., 2001 N/A
Chemicals, Peptides, and Recombinant Proteins
Dexamethasone Sigma-Aldrich Cat#D1756
(2-Hydroxypropyl)-β-cyclodextrin Sigma-Aldrich Cat#H107
Mifepristone (RU486) Sigma-Aldrich Cat#M8046
Metyrapone Cayman Chemical Cat# 54-36-4
Poly(I:C) Invivogen Cat#trl-pic-5
Cell. Author manuscript; available in PMC 2020 August 04.
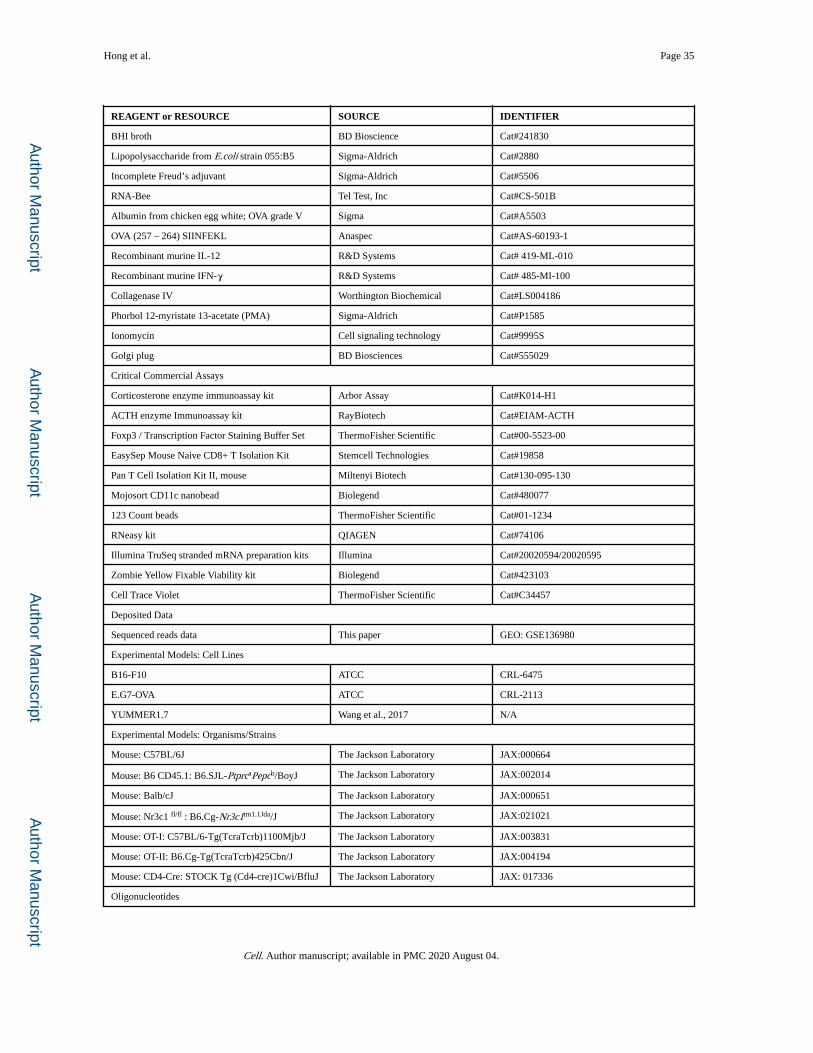
Author M
anuscriptA
uthor Manuscript
Author M
anuscriptA
uthor Manuscript
Hong et al. Page 35
REAGENT or RESOURCE SOURCE IDENTIFIER
BHI broth BD Bioscience Cat#241830
Lipopolysaccharide from E.coli strain 055:B5 Sigma-Aldrich Cat#2880
Incomplete Freud’s adjuvant Sigma-Aldrich Cat#5506
RNA-Bee Tel Test, Inc Cat#CS-501B
Albumin from chicken egg white; OVA grade V Sigma Cat#A5503
OVA (257 – 264) SIINFEKL Anaspec Cat#AS-60193-1
Recombinant murine IL-12 R&D Systems Cat# 419-ML-010
Recombinant murine IFN-γ R&D Systems Cat# 485-MI-100
Collagenase IV Worthington Biochemical Cat#LS004186
Phorbol 12-myristate 13-acetate (PMA) Sigma-Aldrich Cat#P1585
Ionomycin Cell signaling technology Cat#9995S
Golgi plug BD Biosciences Cat#555029
Critical Commercial Assays
Corticosterone enzyme immunoassay kit Arbor Assay Cat#K014-H1
ACTH enzyme Immunoassay kit RayBiotech Cat#EIAM-ACTH
Foxp3 / Transcription Factor Staining Buffer Set ThermoFisher Scientific Cat#00-5523-00
EasySep Mouse Naive CD8+ T Isolation Kit Stemcell Technologies Cat#19858
Pan T Cell Isolation Kit II, mouse Miltenyi Biotech Cat#130-095-130
Mojosort CD11c nanobead Biolegend Cat#480077
123 Count beads ThermoFisher Scientific Cat#01-1234
RNeasy kit QIAGEN Cat#74106
Illumina TruSeq stranded mRNA preparation kits Illumina Cat#20020594/20020595
Zombie Yellow Fixable Viability kit Biolegend Cat#423103
Cell Trace Violet ThermoFisher Scientific Cat#C34457
Deposited Data
Sequenced reads data This paper GEO: GSE136980
Experimental Models: Cell Lines
B16-F10 ATCC CRL-6475
E.G7-OVA ATCC CRL-2113
YUMMER1.7 Wang et al., 2017 N/A
Experimental Models: Organisms/Strains
Mouse: C57BL/6J The Jackson Laboratory JAX:000664
Mouse: B6 CD45.1: B6.SJL-PtprcaPepcb/BoyJ The Jackson Laboratory JAX:002014
Mouse: Balb/cJ The Jackson Laboratory JAX:000651
Mouse: Nr3c1 fl/fl : B6.Cg-Nr3c1tm1.1Jda/J The Jackson Laboratory JAX:021021
Mouse: OT-I: C57BL/6-Tg(TcraTcrb)1100Mjb/J The Jackson Laboratory JAX:003831
Mouse: OT-II: B6.Cg-Tg(TcraTcrb)425Cbn/J The Jackson Laboratory JAX:004194
Mouse: CD4-Cre: STOCK Tg (Cd4-cre)1Cwi/BfluJ The Jackson Laboratory JAX: 017336
Oligonucleotides
Cell. Author manuscript; available in PMC 2020 August 04.
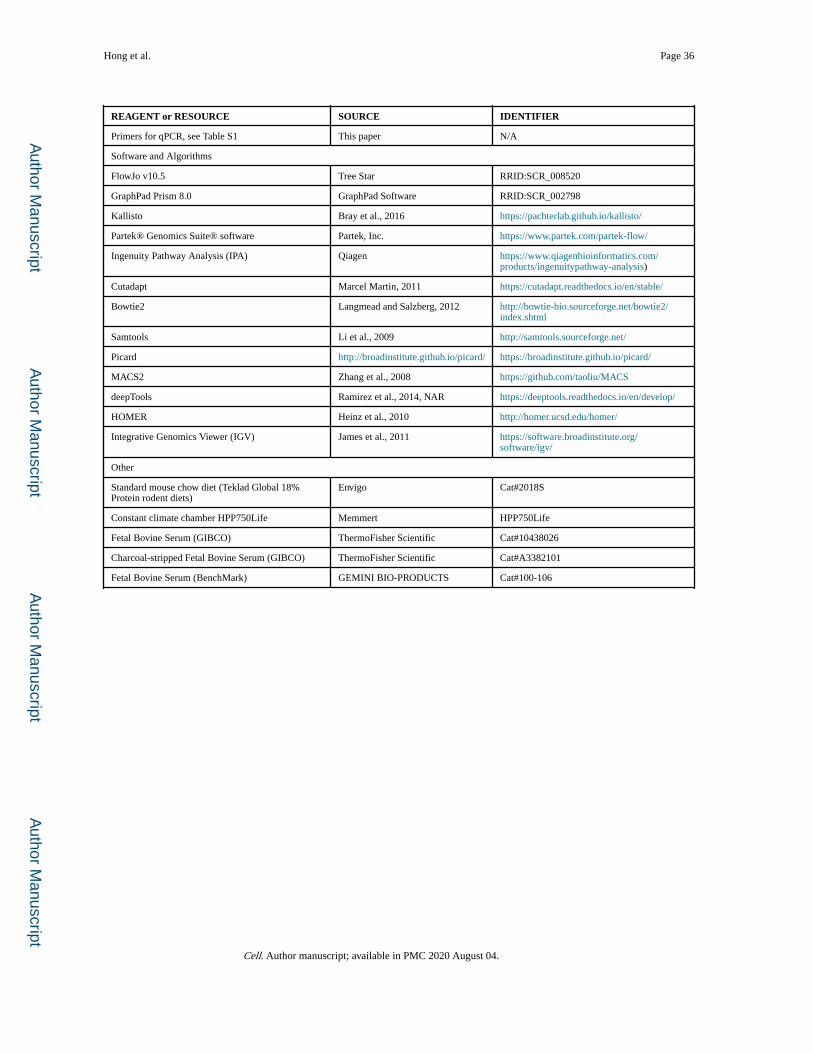
Author M
anuscriptA
uthor Manuscript
Author M
anuscriptA
uthor Manuscript
Hong et al. Page 36
REAGENT or RESOURCE SOURCE IDENTIFIER
Primers for qPCR, see Table S1 This paper N/A
Software and Algorithms
FlowJo v10.5 Tree Star RRID:SCR_008520
GraphPad Prism 8.0 GraphPad Software RRID:SCR_002798
Kallisto Bray et al., 2016 https://pachterlab.github.io/kallisto/
Partek® Genomics Suite® software Partek, Inc. https://www.partek.com/partek-flow/
Ingenuity Pathway Analysis (IPA) Qiagen https://www.qiagenbioinformatics.com/products/ingenuitypathway-analysis)
Cutadapt Marcel Martin, 2011 https://cutadapt.readthedocs.io/en/stable/
Bowtie2 Langmead and Salzberg, 2012 http://bowtie-bio.sourceforge.net/bowtie2/index.shtml
Samtools Li et al., 2009 http://samtools.sourceforge.net/
Picard http://broadinstitute.github.io/picard/ https://broadinstitute.github.io/picard/
MACS2 Zhang et al., 2008 https://github.com/taoliu/MACS
deepTools Ramirez et al., 2014, NAR https://deeptools.readthedocs.io/en/develop/
HOMER Heinz et al., 2010 http://homer.ucsd.edu/homer/
Integrative Genomics Viewer (IGV) James et al., 2011 https://software.broadinstitute.org/software/igv/
Other
Standard mouse chow diet (Teklad Global 18% Protein rodent diets)
Envigo Cat#2018S
Constant climate chamber HPP750Life Memmert HPP750Life
Fetal Bovine Serum (GIBCO) ThermoFisher Scientific Cat#10438026
Charcoal-stripped Fetal Bovine Serum (GIBCO) ThermoFisher Scientific Cat#A3382101
Fetal Bovine Serum (BenchMark) GEMINI BIO-PRODUCTS Cat#100-106
Cell. Author manuscript; available in PMC 2020 August 04.
![Lymphatic dysfunction attenuates tumor immunity through ......system, such as natural killer (NK) cells [2], and cells of adaptive immunity, such as dendritic cells (DCs) [3] and CD8+](https://img.pdfslide.net/doc/110x75/5ffe986eee420b437546dbf3/lymphatic-dysfunction-attenuates-tumor-immunity-through-system-such-as.jpg)


![Current Strategies to Enhance Anti-Tumour Immunity · immunity that was observed was reliant upon the CD4 T-cells, but independent of CD8 T-cells [35]. We have demonstrated the targeting](https://img.pdfslide.net/doc/110x75/5f0eb6d57e708231d4409407/current-strategies-to-enhance-anti-tumour-immunity-immunity-that-was-observed-was.jpg)


![In silico CD4+, CD8+ & humoral immunity associated ...In silico epitope prediction and HLA distribution analysis of HTLV-I 1515 JBUON 2018; 23(5): 1515 Sjogren’s syndrome [6]. ATL](https://img.pdfslide.net/doc/110x75/5ffb953e60586734ba04b701/in-silico-cd4-cd8-humoral-immunity-associated-in-silico-epitope-prediction.jpg)