Embed Size (px)
Citation preview
Long Term Response Action
Audit Report No. 16
October 16, 2007 through April 22, 2008
Ace Services Site
Colby, Kansas
Prepared forUSEPA Region VII
June 3, 2008
Prepared by.Black and Veatch Special Projects Corp.
EPA Contract Number EP-S7-05-06EPA Task Order No. 0075
BVSPC Project Number 44720
30018001
11111Superfund
Table of Contents
1.0 Introduction ....:. ;...... 1-1
2.0 Observations on General System Operation 2-1
2.1 Well Field '..2-1
2.2 Treatment Plant 2-3
2.3 Resin Quality Issues 2-6
3.0 Sampling and Record Keeping 3-1
4.0 Evaluation of System Performance 4-1
5.0 Action Summary : 5-1
Tables
Table 4-1 Selected Flow and Chromium Concentration Data
Table 4-2 Performance Data Summary
Ace Services Site TC-1 044720.01.49LTRA Audit Report No. 16
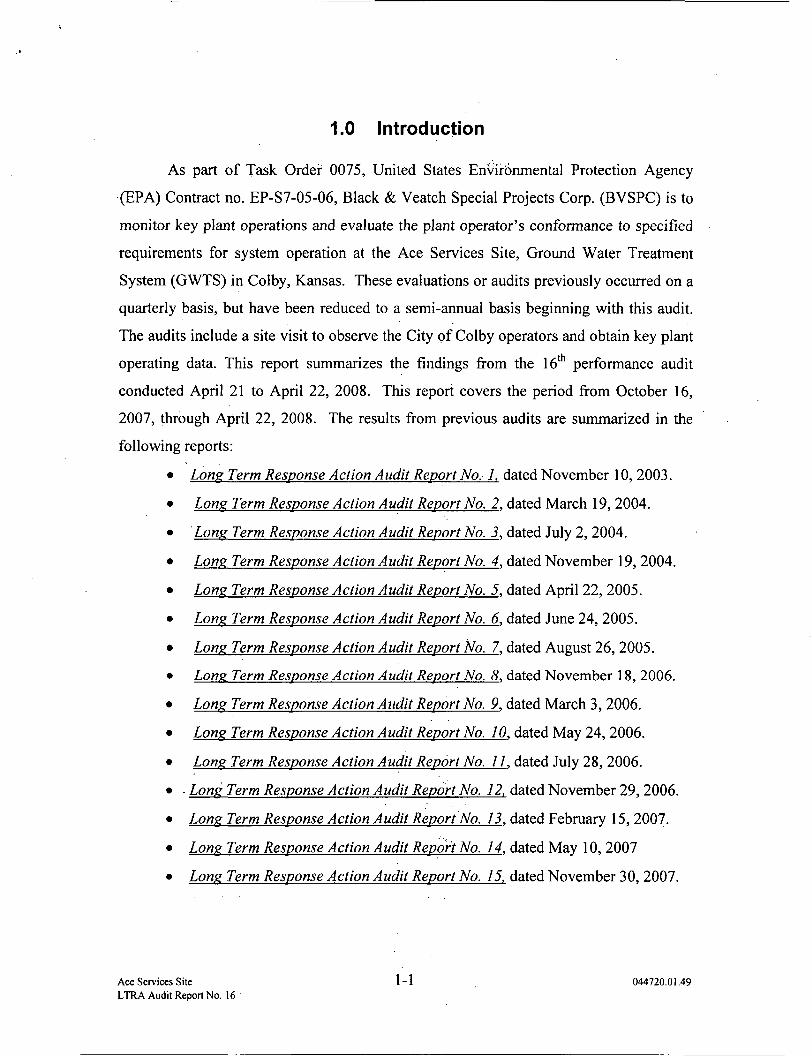
1.0 Introduction
As part of Task Order 0075, United States Environmental Protection Agency
(EPA) Contract no. EP-S7-05-06, Black & Veatch Special Projects Corp. (BVSPC) is to
monitor key plant operations and evaluate the plant operator's conformance to specified
requirements for system operation at the Ace Services Site, Ground Water Treatment
System (GWTS) in Colby, Kansas. These evaluations or audits previously occurred on a
quarterly basis, but have been reduced to a semi-annual basis beginning with this audit.
The audits include a site visit to observe the City of Colby operators and obtain key plant
operating data. This report summarizes the findings from the 16th performance audit
conducted April 21 to April 22, 2008. This report covers the period from October 16,
2007, through April 22, 2008. The results from previous audits are summarized in the
following reports:
• Lons Term Response Action Audit Report No. 1, dated November 10, 2003.
• Long Term Response Action Audit Report No. 2, dated March 19, 2004.
• Lons Term Response Action Audit Report No. 3, dated July 2, 2004.
• Long Term Response Action Audit Report No. 4, dated November 19, 2004.
• Low Term Response Action Audit Report No. 5, dated April 22, 2005.
• Lons Term Response Action Audit Report No. 6, dated June 24, 2005.
• Lons Term Response Action Audit Report No. 7, dated August 26, 2005.
• Long Term Response Action Audit Report No. 8, dated November 18, 2006.
• Long Term Response Action Audit Report No. 9, dated March 3, 2006.
• Lons Term Response Action Audit Report No. 10, dated May 24, 2006.
• Long Term Response Action Audit Report No. 11, dated July 28, 2006.
• Long Term Response Action Audit Report No. 12, dated November 29, 2006.
• Lons Term Response Action Audit Report No. 13, dated February 15, 2007.
• Long Term Response Action Audit Report No. 14, dated May 10, 2007
• Lons Term Response Action Audit Report No. 15, dated November 30, 2007.
Ace Services Site 1-1 044720.01.49LIRA Audit Report No. 16
2.0 Observations on General System Operation
The Ace Services GWTS performance audit was performed onsite April 21
through April 22, 2008. BVSPC representative Curt McCoy performed the audit
including review of operation records, GWTS functions, and observation of the City
operators throughout the regular staff hours.
The City staffing of the plant was unchanged from the last several audits. Mr. Jim
Helus with the City of Colby Public Works Department is assigned as the full time
operator for the treatment system. Mr. Helus generally arrives at the treatment plant at
8:00 A.M. and spends the majority of the day tending to the plant and well field systems.
Mr. Helus is occasionally supplemented by other city staff on an as needed basis. A
second operator is at the plant on Wednesdays to assist with the extra work associated
with collecting, preparing, and shipping the weekly sample splits for off-site laboratory
analysis. Mr. Helus is responsible for system operation Monday through Friday.
Weekend staffing is provided by various other members of the Colby Public Works
Department; however, Mr. Helus remains on-call for plant alarms 7 days a week. Mr.
Helus responds to all off-hours alarms in a timely manner.
The assignment of a single primary operator continues to result in good follow-
through on maintenance, supplies inventory, record keeping, and problem resolution.
The plant, office, storage, and lab areas were clean and very well organized. The
operating staff continues to express positive attitudes regarding the facility and their jobs.
Mr. Helus remains particularly well engaged in his job as plant operator and his skill
levels regarding the more complex plant subsystems continues to improve. Mr. Helus, as
well as other plant staff, routinely call BVSPC for advice and assistance as needed.
2.1 Well Field
A reduced scheme sampling round including the extraction wells, monitoring
wells, and residential wells was conducted from April 21 through April 23, 2008. A
complete analysis of the groundwater extraction system performance and chromium
plume status will be conducted on an annual basis only. An abbreviated evaluation of the
April 2008 sampling round results is presented in a technical memorandum. The
Ace Services Site 2 - 1 " 044720.01.49LIRA Audit Report No. 16
complete analysis will be presented in the Long Term Response Action, Cleanup Status
Report Number JO which will be prepared after the semi-annual sampling round
conducted in October 2008.
A granular activated carbon (GAC) treatment system installed by Kansas
Department of Health and Environment (KDHE) to remove the 1,2-dichloroethane (1,2-
DCA) and other volatile organic compounds (VOCs) from the well water prior to
entering the GWTS was started on August 24, 2004.
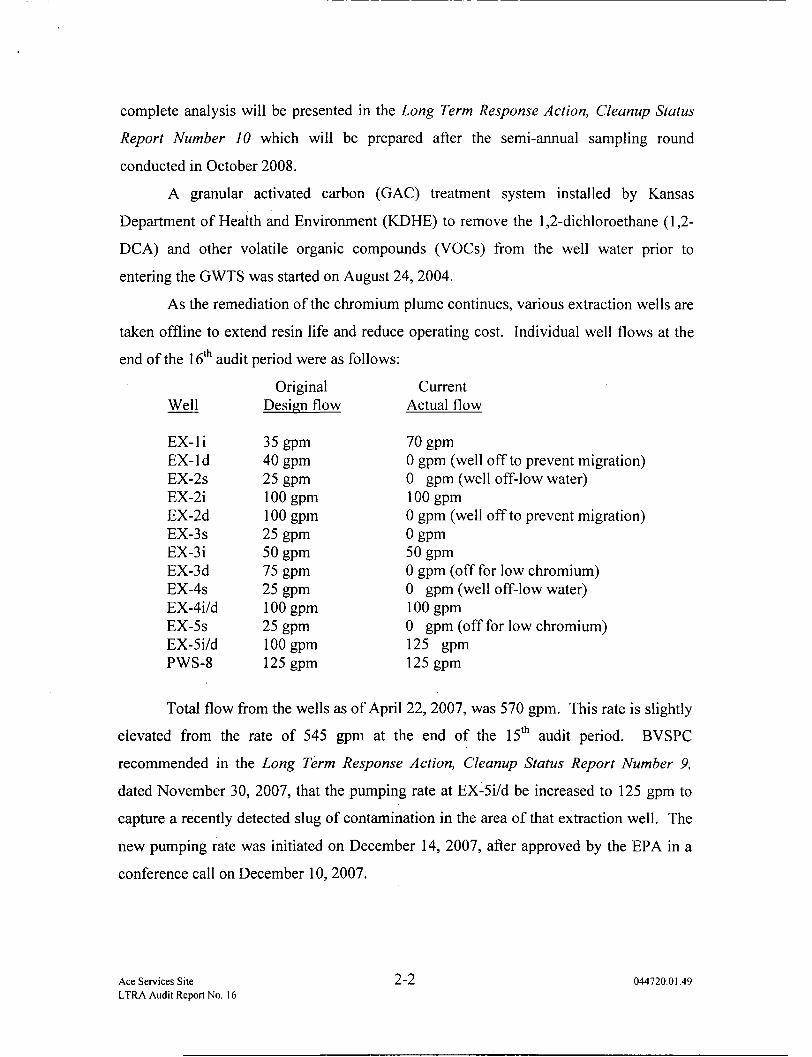
As the remediation of the chromium plume continues, various extraction wells are
taken offline to extend resin life and reduce operating cost. Individual well flows at the
end of the 16th audit period were as follows:
Original CurrentWell Design flow Actual flow
EX-li 35 gpm 70 gpmEX-ld 40 gpm 0 gpm (well off to prevent migration)EX-2s 25 gpm 0 gpm (well off-low water)EX-2i 100 gpm 100 gpmEX-2d 100 gpm 0 gpm (well off to prevent migration)EX-3s 25 gpm 0 gpmEX-3i 50 gpm 50 gpmEX-3d 75 gpm 0 gpm (off for low chromium)EX-4s 25 gpm 0 gpm (well off-low water)EX-4i/d 100 gpm 100 gpmEX-5s 25 gpm 0 gpm (off for low chromium)EX-5i/d 100 gpm 125 gpmPWS-8 125 gpm 125 gpm
Total flow from the wells as of April 22, 2007, was 570 gpm. This rate is slightly
elevated from the rate of 545 gpm at the end of the 15th audit period. BVSPC
recommended in the Long Term Response Action, Cleanup Status Report Number 9,
dated November 30, 2007, that the pumping rate at EX-5i/d be increased to 125 gpm to
capture a recently detected slug of contamination in the area of that extraction well. The
new pumping rate was initiated on December 14, 2007, after approved by the EPA in a
conference call on December 10, 2007.
Ace Services Site 2-2 044720.01.49LIRA Audit Report No. 16
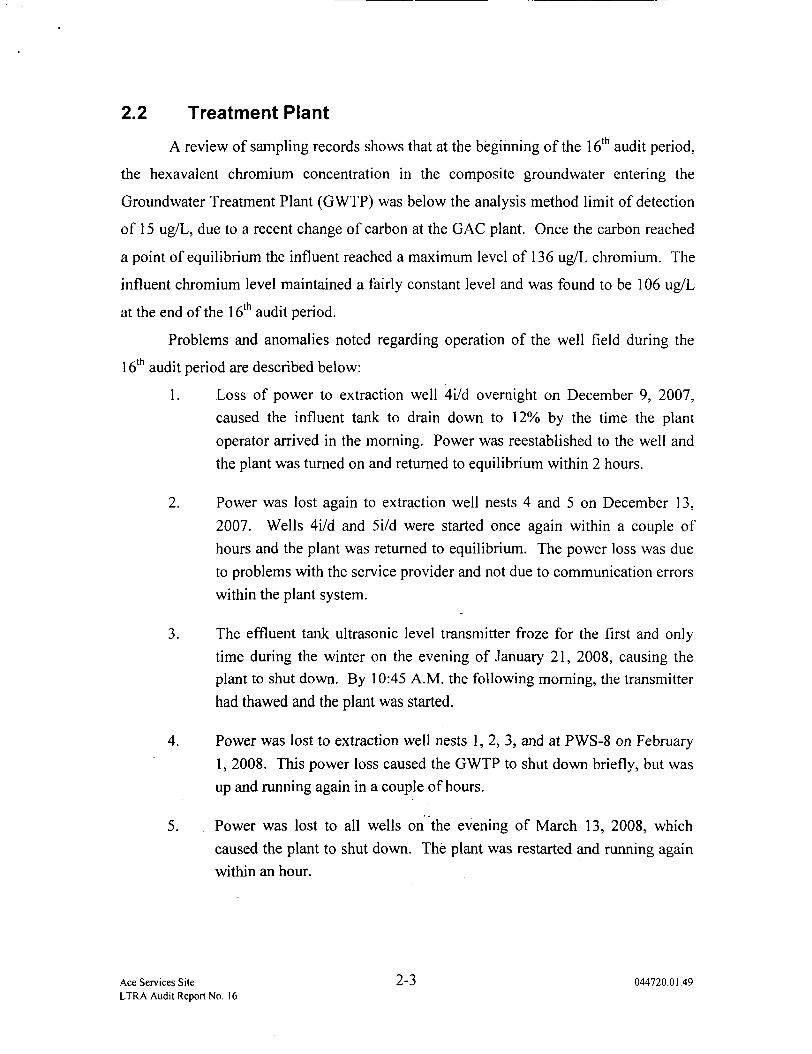
2.2 Treatment Plant
A review of sampling records shows that at the beginning of the 16th audit period,
the hexavalent chromium concentration in the composite groundwater entering the
Groundwater Treatment Plant (GWTP) was below the analysis method limit of detection
of 15 ug/L, due to a recent change of carbon at the GAC plant. Once the carbon reached
a point of equilibrium the influent reached a maximum level of 136 ug/L chromium. The
influent chromium level maintained a fairly constant level and was found to be 106 ug/L
at the end of the 16th audit period.
Problems and anomalies noted regarding operation of the well field during the
16th audit period are described below:
1. Loss of power to extraction well 4i/d overnight on December 9, 2007,
caused the influent tank to drain down to 12% by the time the plant
operator arrived in the morning. Power was reestablished to the well and
the plant was turned on and returned to equilibrium within 2 hours.
2. Power was lost again to extraction well nests 4 and 5 on December 13,
2007. Wells 4i/d and 5i/d were started once again within a couple of
hours and the plant was returned to equilibrium. The power loss was due
to problems with the service provider and not due to communication errors
within the plant system.
3. The effluent tank ultrasonic level transmitter froze for the first and only
time during the winter on the evening of January 21, 2008, causing theplant to shut down. By 10:45 A.M. the following morning, the transmitter
had thawed and the plant was started.
4. Power was lost to extraction well nests 1, 2, 3, and at PWS-8 on February
1, 2008. This power loss caused the GWTP to shut down briefly, but was
up and running again in a couple of hours.
5. Power was lost to all wells on the evening of March 13, 2008, which
caused the plant to shut down. The plant was restarted and running again
within an hour.
Ace Services Site 2-3 044720.01.49LTRA Audit Report No. 16
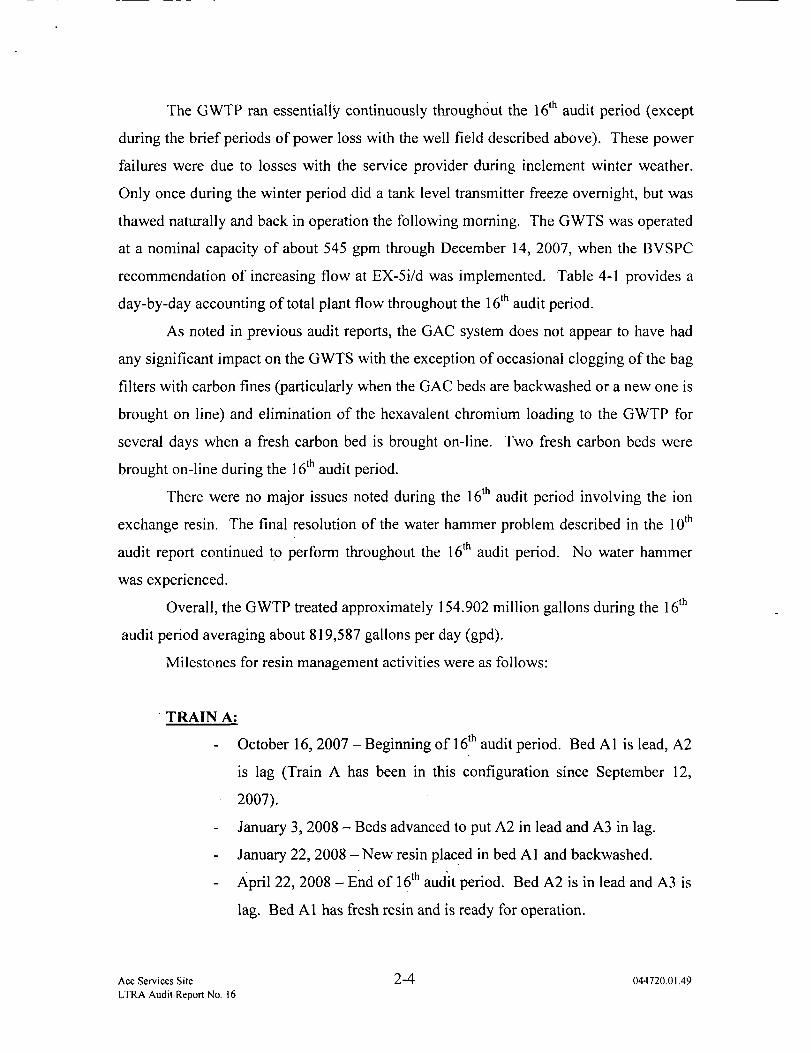
The GWTP ran essentially continuously throughout the 16th audit period (except
during the brief periods of power loss with the well field described above). These power
failures were due to losses with the service provider during inclement winter weather.
Only once during the winter period did a tank level transmitter freeze overnight, but was
thawed naturally and back in operation the following morning. The GWTS was operated
at a nominal capacity of about 545 gpm through December 14, 2007, when the BVSPC
recommendation of increasing flow at EX-5i/d was implemented. Table 4-1 provides a
day-by-day accounting of total plant flow throughout the 16th audit period.
As noted in previous audit reports, the GAC system does not appear to have had
any significant impact on the GWTS with the exception of occasional clogging of the bag
filters with carbon fines (particularly when the GAC beds are backwashed or a new one is
brought on line) and elimination of the hexavalent chromium loading to the GWTP for
several days when a fresh carbon bed is brought on-line. Two fresh carbon beds were
brought on-line during the 16th audit period.
There were no major issues noted during the 16th audit period involving the ion
exchange resin. The final resolution of the water hammer problem described in the 10th
audit report continued to perform throughout the 16th audit period. No water hammer
was experienced.
Overall, the GWTP treated approximately 154.902 million gallons during the 16th
audit period averaging about 819,587 gallons per day (gpd).
Milestones for resin management activities were as follows:
TRAIN A:
October 16, 2007 - Beginning of 16th audit period. Bed Al is lead, A2
is lag (Train A has been in this configuration since September 12,
2007).
January 3, 2008 - Beds advanced to put A2 in lead and A3 in lag.
January 22, 2008 -New resin placed in bed Al and backwashed.
April 22, 2008 - End of 16th audit period. Bed A2 is in lead and A3 is
lag. Bed Al has fresh resin and is ready for operation.
Ace Services Site 2-4 044720.01.49LIRA Audit Report No. 16
TRAIN B;
- October 16, 2008 - Beginning of 16th audit period. Bed Bl is lead, B2
is lag (Train B has been in this configuration since September 12,
2007).
- January 3, 2008 - Beds advanced to put B2 in lead and B3 in lag.
- January 23, 2008 - New resin placed in bed Bl and backwashed.
- April 3, 2008 - Resin strainers cleaned in Beds B2 & B3.
- April 22, 2008 - End of 16th audit period. Bed B2 is in lead and B3 is
lag. Bed Bl has fresh resin and is ready for operation.
The status of the GWTS at the end of the 16th audit period included operation of
treatment trains with Beds A2 and B2 in lead service and Beds A3 and B3 in lag service.
Stand-by Beds Al and Bl had fresh resin. As can be seen in Table 4-1, the trains were
being operated at the same rates near the beginning of the 16th audit period. Train A was
being operated at about 400 gpm with Train B running about 400 gpm. Problems and
anomalies regarding plant operation that were noted or corrected during the 16th audit
period are described below:
1. Plant communication failures and solutions with the well field were
discussed in the previous well field section of the audit report.
2. October 29, 2007, the observation was made that EX-li was showing "0"
feet of water within the well, yet the well was continuing to pump. This
indicated that the level probe had failed in the well, therefore a new level
probe was ordered. The new probe was installed by Woofter Pump &
Well on November 26, 2007. The water level is now reading correctly at
the plant operating computer.
Overall no significant issues arose and were needed to be resolved during the 16th
audit period. Operator follow-through to address, diagnose, and solve plant issues was
excellent during the 16th audit period and should be commended.
Ace Services Site 2-5 044720.01.49LIRA Audit Report No. 16
2.3 Resin Quality Issues
Section 2.3 of the 7th through 10th audit reports summarized significant water
quality incidents related to poor resin quality as well as the ultimate resolution for these
problems. Resin performance observed in subsequent audit periods have verified that all
of the significant problems have been resolved and resin performance from the current
supplier has considerably improved.
Ace Services Site 2-6 044720.01.49LIRA Audit Report No. 16
3.0 Sampling and Record Keeping
As part of the audit, the in-plant records kept by the City operators were reviewed
for completeness and conformity to requirements. The sample collection and analysis
methods are also observed. During the review, emphasis was placed on water flow and
chromium concentration data that are critical to evaluation of treatment system
performance. The daily records were well organized in notebooks kept at the plant. The
daily records were organized by month and date and were complete and easy to access.
The City operators have continued to enter the flow meter totalizer readings and sample
analysis results into Excel® spreadsheets to facilitate trend tracking and quick data
retrieval. The sample record sheets include free chlorine results when the discharge to
the city water system is active as well as total chromium results of the morning influent
sample.
The operators have continued to fill out a GAC system log sheet each day. This
log sheet records critical flow and pressure data for the KDHE GAC system.
The City operating staff has done an excellent job with the sampling and record
keeping requirements during the 16th audit period. Any significant irregularities that
were noted in the audit and subsequent review of records are described below:
1. Incomplete records regarding system problems: No issues were noted
with the plant operator's recordkeeping. BVSPC will continue to take
the initiative to gather all data regarding major incidents and generate
simple technical memorandums for the record to assist in future
problem solutions.
2. Incomplete records at GWTP: A review during the 16th audit indicated
that all required records are now on-file at the GWTP.
There have been no significant changes regarding plant sampling and record
keeping during the 16th audit period. In an effort to reduce the quantity of plant records
being copied for BVSPC records in hardcopy format, the plant operator was asked to
cease hard copy preparation of the daily records and laboratory analysis. The plant logs
will continue to be maintained in their current format. In the future, documents are to be
Ace Services Site 3-1 044720.01.49LIRA Audit Report No. 16
scanned using the plant copier and placed into a daily electronic file. Lab records are
also to be scanned when received and placed into the daily electronic files. The daily
electronic files are to be forwarded to BVSPC on a monthly basis in an electronic format
for inclusion into the BVSPC filing system.
Ace Services Site 3-2 044720.01.49LIRA Audit Report No. 16
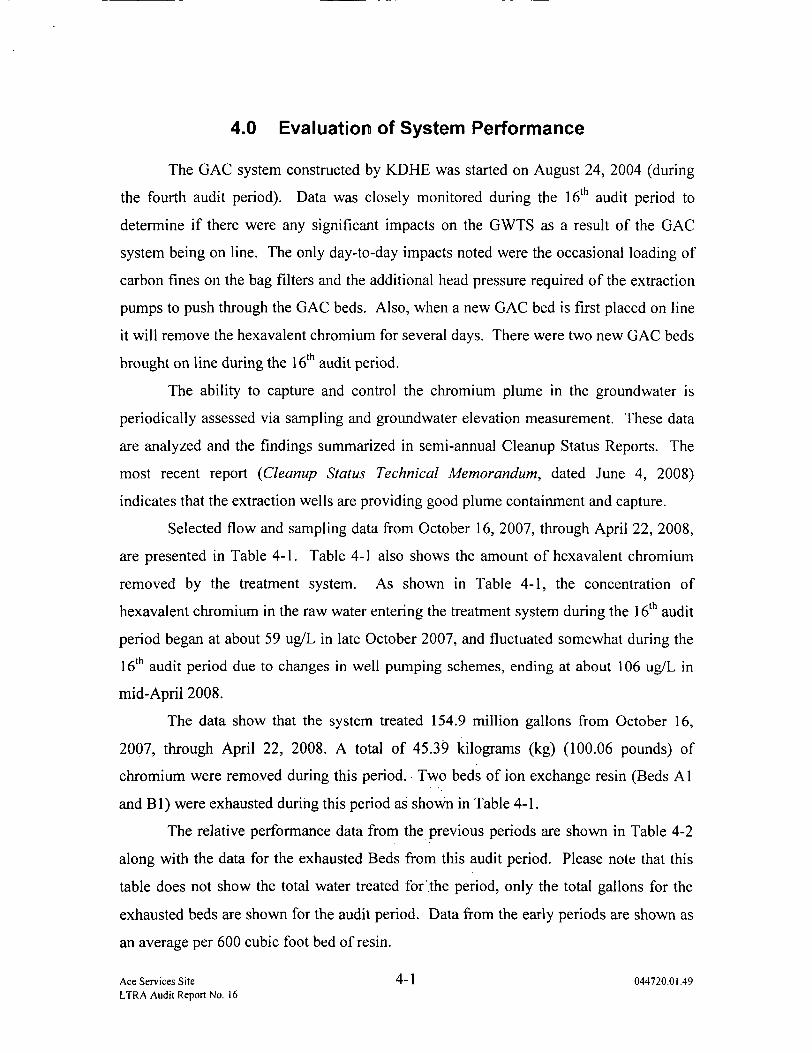
4.0 Evaluation of System Performance
The GAC system constructed by KDHE was started on August 24, 2004 (during
the fourth audit period). Data was closely monitored during the 16th audit period to
determine if there were any significant impacts on the GWTS as a result of the GAC
system being on line. The only day-to-day impacts noted were the occasional loading of
carbon fines on the bag filters and the additional head pressure required of the extraction
pumps to push through the GAC beds. Also, when a new GAC bed is first placed on line
it will remove the hexavalent chromium for several days. There were two new GAC beds
brought on line during the 16' audit period.
The ability to capture and control the chromium plume in the groundwater is
periodically assessed via sampling and groundwater elevation measurement. These data
are analyzed and the findings summarized in semi-annual Cleanup Status Reports. The
most recent report (Cleanup Status Technical Memorandum, dated June 4, 2008)
indicates that the extraction wells are providing good plume containment and capture.
Selected flow and sampling data from October 16, 2007, through April 22, 2008,
are presented in Table 4-1. Table 4-1 also shows the amount of hexavalent chromium
removed by the treatment system. As shown in Table 4-1, the concentration of
hexavalent chromium in the raw water entering the treatment system during the 16th audit
period began at about 59 ug/L in late October 2007, and fluctuated somewhat during the
16th audit period due to changes in well pumping schemes, ending at about 106 ug/L in
mid-April 2008.
The data show that the system treated 154.9 million gallons from October 16,
2007, through April 22, 2008. A total of 45.39 kilograms (kg) (100.06 pounds) of
chromium were removed during this period. Two beds of ion exchange resin (Beds Al
and Bl) were exhausted during this period as shown in Table 4-1.
The relative performance data from the previous periods are shown in Table 4-2
along with the data for the exhausted Beds from this audit period. Please note that this
table does not show the total water treated for the period, only the total gallons for the
exhausted beds are shown for the audit period. Data from the early periods are shown as
an average per 600 cubic foot bed of resin.
Ace Services Site 4-1 044720.01.49LIRA Audit Report No. 16
The chromium holding capacity of the resin is expected to diminish with
diminishing influent hexavalent chromium concentrations due to the lower equilibrium.
More gallons of water are treated with the same 600 cubic feet of resin but at diminishing
resin holding capacity. As the hexavalent chromium concentration drops, a point is
eventually reached where the gallons treated by a given amount of resin will no longer
increase. This is due to the presence of other anions in the influent water that take up
resin exchange capacity. Previous performance audits analyzed the relationship between
the gallons of water treated by a vessel of resin and the influent chromium concentration.
Current observations indicate that once the average chromium concentration drops below
100 u.g/L, each 600 cubic foot treatment vessel may have reached its maximum
chromium holding capacity.
Increases (10%) over the 16th audit period have occurred in the resin prices due
to transportation costs. The total resin cost including transportation and disposal for the
16th audit period was 0.163 cents per gallon, which is up from the 15th period total of
0.144 cents per gallon. This is also up from 0.156 cents per gallon from the 13th and 14th
audit period, and comparable to 0.164 cents per gallon from the 11th and 12lh audit
periods. This increase in resin price no longer enables one to see reduced costs as the
resin approaches peak ion exchange capacity. Should resin prices stabilize at the current
costs, the assumption can be made that future treatment costs for resin will be
approximately 0.165 cents per gallon of water treated. BVSPC does not have access to
sufficient data to determine the total cost per gallon to treat the extracted groundwater
including labor and plant utilities.
Ace Services Site 4-2 044720.01.49LIRA Audit Report No. 16
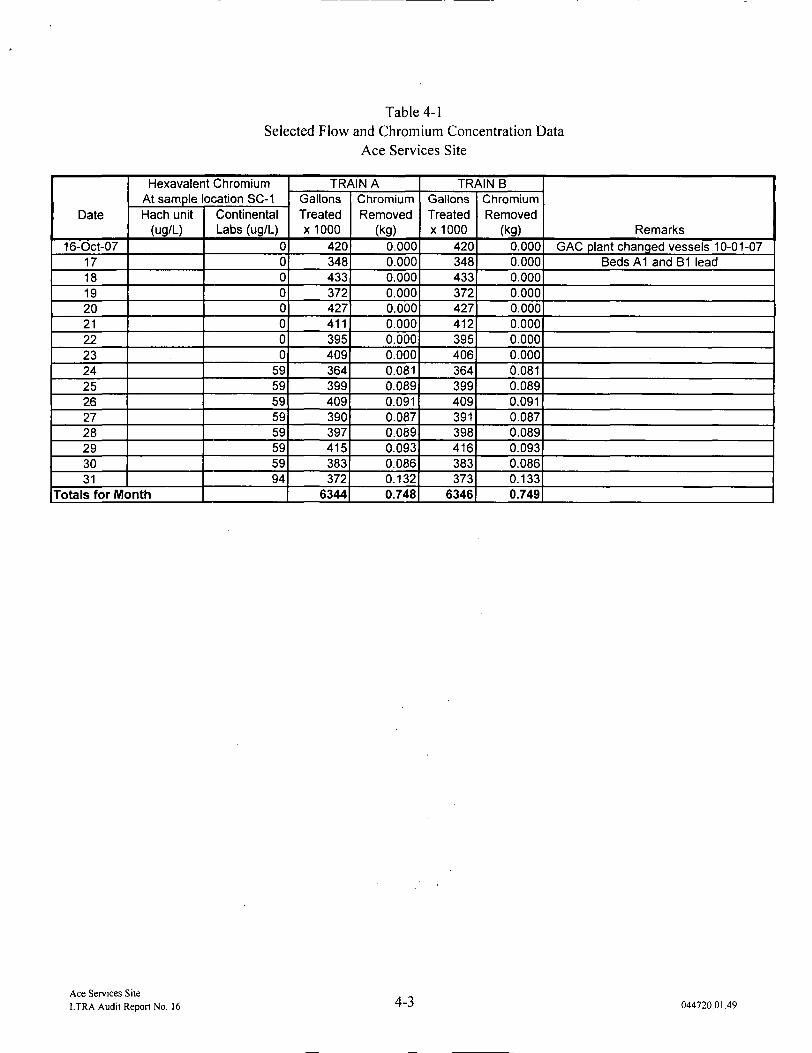
Table 4-1Selected Flow and Chromium Concentration Data
Ace Services Site
Date
16-Oct-07171819202122232425262728293031
Hexavalent ChromiumAt sample location SC-1Hach unit
(ug/L)
Totals for Month
ContinentalLabs (ug/L)
00000000
5959595959595994
TRAIN AGallonsTreatedX1000
420348433372427411395409364399409390397415383372
6344
ChromiumRemoved
(kg)0.0000.0000.0000.0000.0000.0000.0000.0000.0810.0890.0910.0870.0890.0930.0860.1320.748
TRAIN BGallonsTreatedx 1000
420348433372427412395406364399409391398416383373
6346
ChromiumRemoved
(kg)0.0000.0000.0000.0000.0000.0000.0000.0000.0810.0890.0910.0870.0890.0930.0860.1330.749
RemarksGAC plant changed vessels 10-01-07
Beds A1 and B1 lead
Ace Services SiteLIRA Audit Report No. 16 4-3 044720.01.49
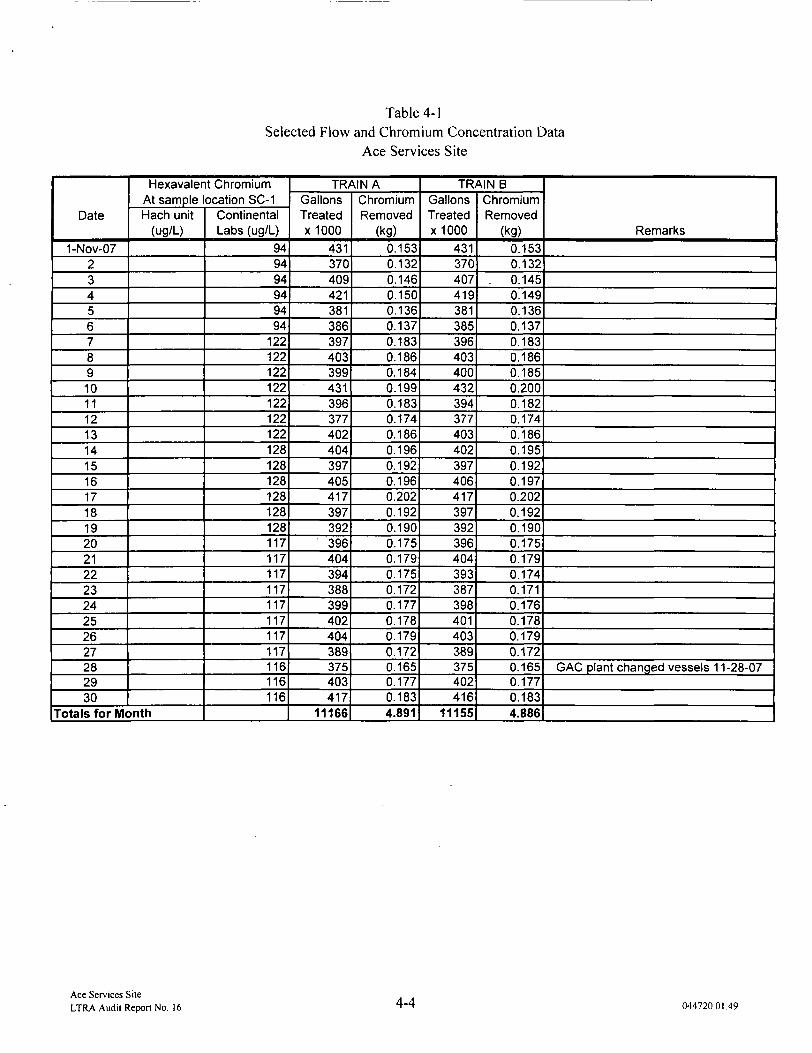
Table 4-1Selected Flow and Chromium Concentration Data
Ace Services Site
Date
1-Nov-0723456789101112131415161718192021222324252627282930
Hexavalent ChromiumAt sample location SC-1Hach unit
(ug/L)
Totals for Month
ContinentalLabs (ug/L)
949494949494
122122122122122122122128128128128128128117117117117117117117117116116116
TRAIN AGallonsTreatedX1000
431370409421381386397403399431396377402404397405417397392396404394388399402404389375403417
11166
ChromiumRemoved
(kg)0.1530.1320.1460.1500.1360.1370.1830.1860.1840.1990.1830.1740.1860.1960.1920.1960.2020.1920.1900.1750.1790.1750.1720.1770.1780.1790.1720.1650.1770.1834.891
TRAIN BGallonsTreatedx lOOO
431370407419381385396403400432394377403402397406417397392396404393387398401403389375402416
11155
ChromiumRemoved
(kg)0.1530.132
. 0.1450.1490.1360.1370.1830.1860.1850.2000.1820.1740.1860.1950.1920.1970.2020.1920.1900.1750.1790.1740.1710.1760.1780.1790.1720.1650.1770.1834.886
Remarks
GAC plant changed vessels 1 1-28-07
Ace Services SiteLIRA Audit Report No. 16 4-4 044720.01.49
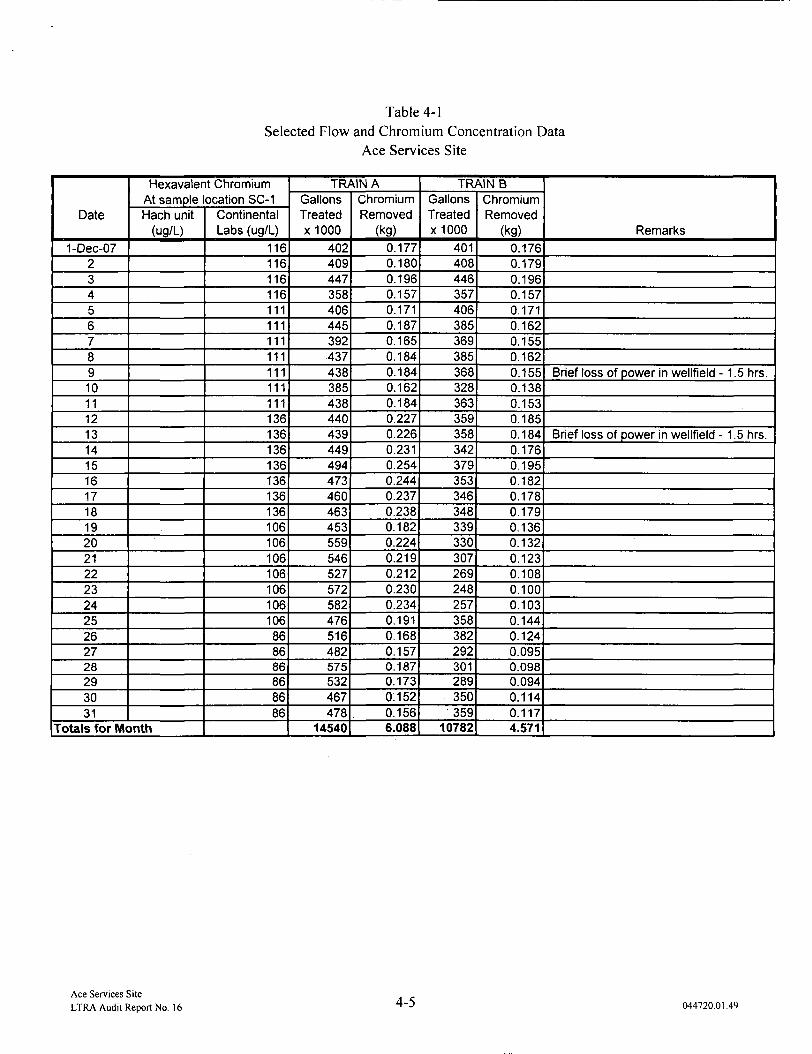
Table 4-1Selected Flow and Chromium Concentration Data
Ace Services Site
Date
1-Dec-072345678910111213141516171819202122232425262728293031
Hexavalent ChromiumAt sample location SC-1Hach unit
(ug/L)
Totals for Month
ContinentalLabs (ug/L)
116116116116111111111111111111111136136136136136136136106106106106106106106868686868686
TRAIN AGallonsTreatedx lOOO
402409447358406445392437438385438440439449494473460463453559546527572582476516482575532467478
14540
ChromiumRemoved
(kg)0.1770.1800.1960.1570.1710.1870.1650.1840.1840.1620.1840.2270.2260.2310.2540.2440.2370.2380.1820.2240.2190.2120.2300.2340.1910.1680.1570.1870.1730.1520.1566.088
TRAIN BGallonsTreatedx lOOO
401408446357406385369385368328363359358342379353346348339330307269248257358382292301289350359
10782
ChromiumRemoved
(kg)0.1760.1790.1960.1570.1710.1620.1550.1620.1550.1380.1530.1850.1840.1760.1950.1820.1780.1790.1360.1320.1230.1080.1000.1030.1440.1240.0950.0980.0940.1140.1174.571
Remarks
Brief loss of power in wellfield - 1.5 hrs.
Brief loss of power in wellfield - 1 .5 hrs.
Ace Services SiteLIRA Audit Report No. 16 4-5 044720.01.49
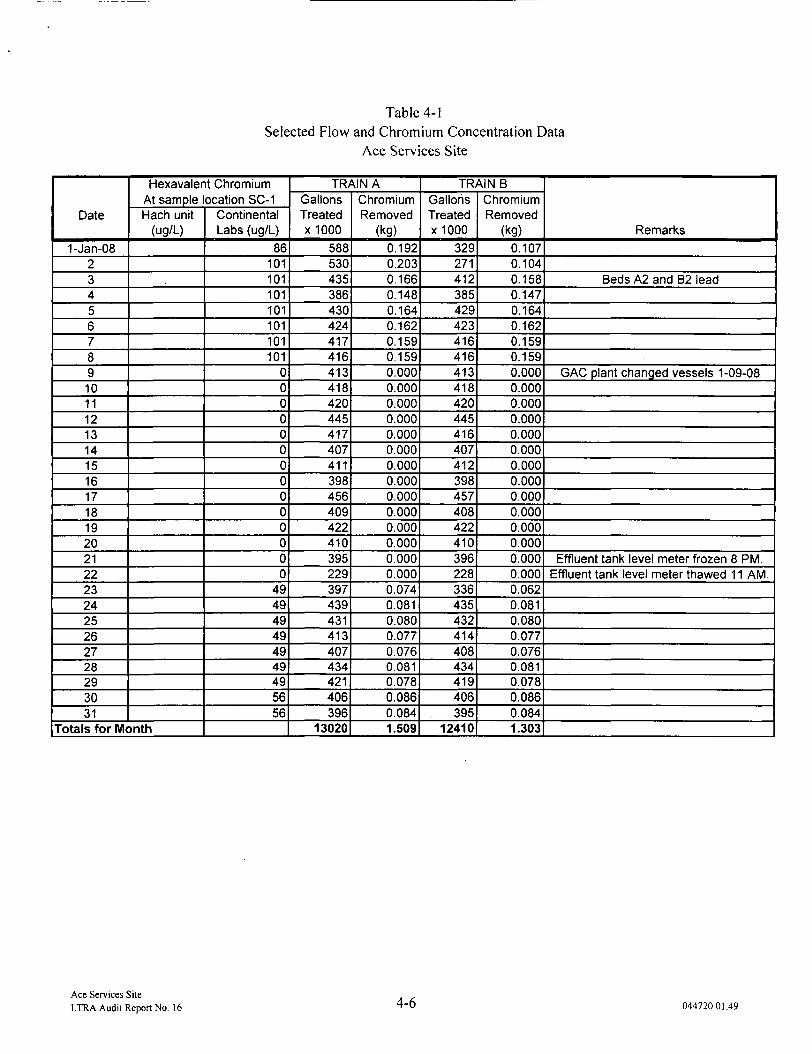
Table 4-1Selected Flow and Chromium Concentration Data
Ace Services Site
Date
1-Jan-082345678910111213141516171819202122232425262728293031
Hexavalent ChromiumAt sample location SC-1Hach unit
(ug/L)
Totals for Month
ContinentalLabs (ug/L)
86101101101101101101101
00000000000000
494949494949495656
TRAIN AGallonsTreatedx lOOO
588530435386430424417416413418420445417407411398456409422410395229397439431413407434421406396
13020
ChromiumRemoved
(kg)0.1920.2030.1660.1480.1640.1620.1590.1590.0000.0000.0000.0000.0000.0000.0000.0000.0000.0000.0000.0000.0000.0000.0740.0810.0800.0770.0760.0810.0780.0860.0841.509
TRAIN BGallonsTreatedx lOOO
329271412385429423416416413418420445416407412398457408422410396228336435432414408434419406395
12410
ChromiumRemoved
(kg)0.1070.1040.1580.1470.1640.1620.1590.1590.0000.0000.0000.0000.0000.0000.0000.0000.0000.0000.0000.0000.0000.0000.0620.0810.0800.0770.0760.0810.0780.0860.0841.303
Remarks
Beds A2 and B2 lead
GAC plant changed vessels 1-09-08
Effluent tank level meter frozen 8 PM.Effluent tank level meter thawed 1 1 AM.
Ace Services SiteLTRA Audit Report No. 16 4-6 044720.01.49
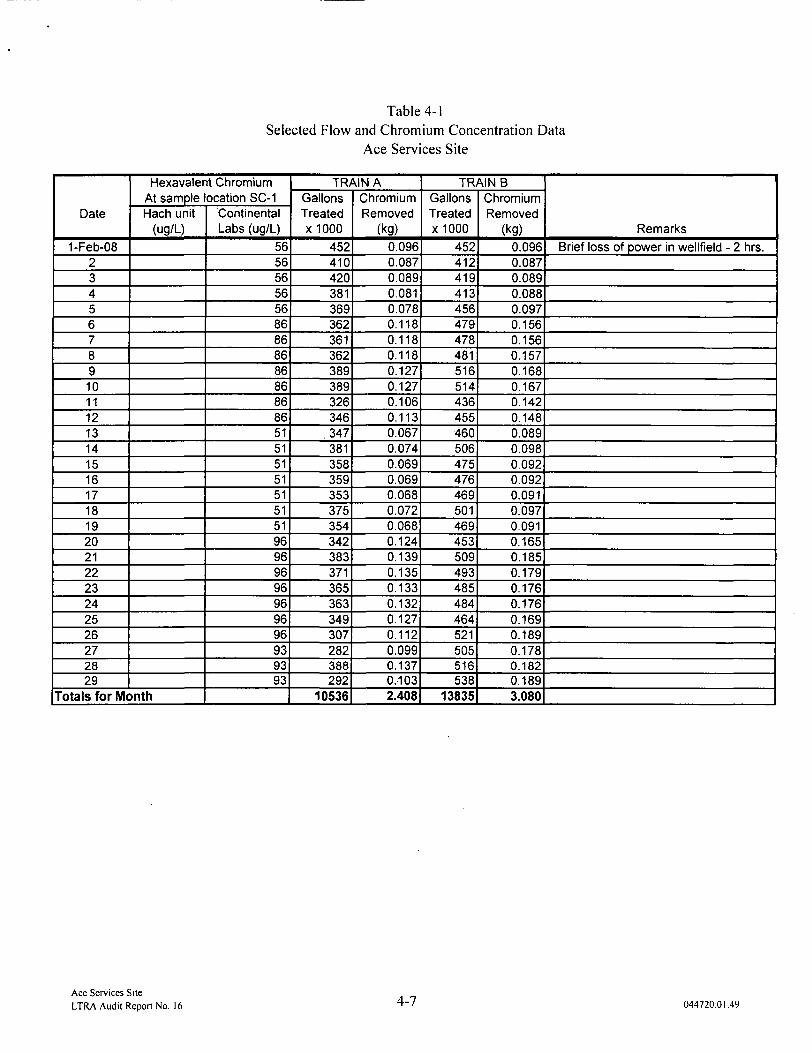
Table 4-1Selected Flow and Chromium Concentration Data
Ace Services Site
Date
1-Feb-08234567891011121314151617181920212223242526272829
Hexavalent ChromiumAt sample location SC-1Hach unit
(ug/L)
Totals for Month
ContinentalLabs (ug/L)
5656565656868686868686865151515151515196969696969696939393
TRAIN AGallonsTreatedX1000
452410420381369362361362389389326346
.347381358359353375354342383371365363349307282388292
10536
ChromiumRemoved
(kg)0.0960.0870.0890.0810.0780.1180.1180.1180.1270.1270.1060.1130.0670.0740.0690.0690.0680.0720.0680.1240.1390.1350.1330.1320.1270.1120.0990.1370.-1032.408
TRAIN BGallonsTreatedX1000
452412419413456479478481516514436455460506475476469501469453509493485484464521505516538
13835
ChromiumRemoved
(kg)0.0960.0870.0890.0880.0970.1560.1560.1570.1680.1670.1420.1480.0890.0980.0920.0920.0910.0970.0910.1650.1850.1790.1760.1760.1690.1890.1780.1820.1893.080
RemarksBrief loss of power in wellfield - 2 hrs.
Ace Services SiteLIRA Audit Report No. 16 4-7 044720.01.49
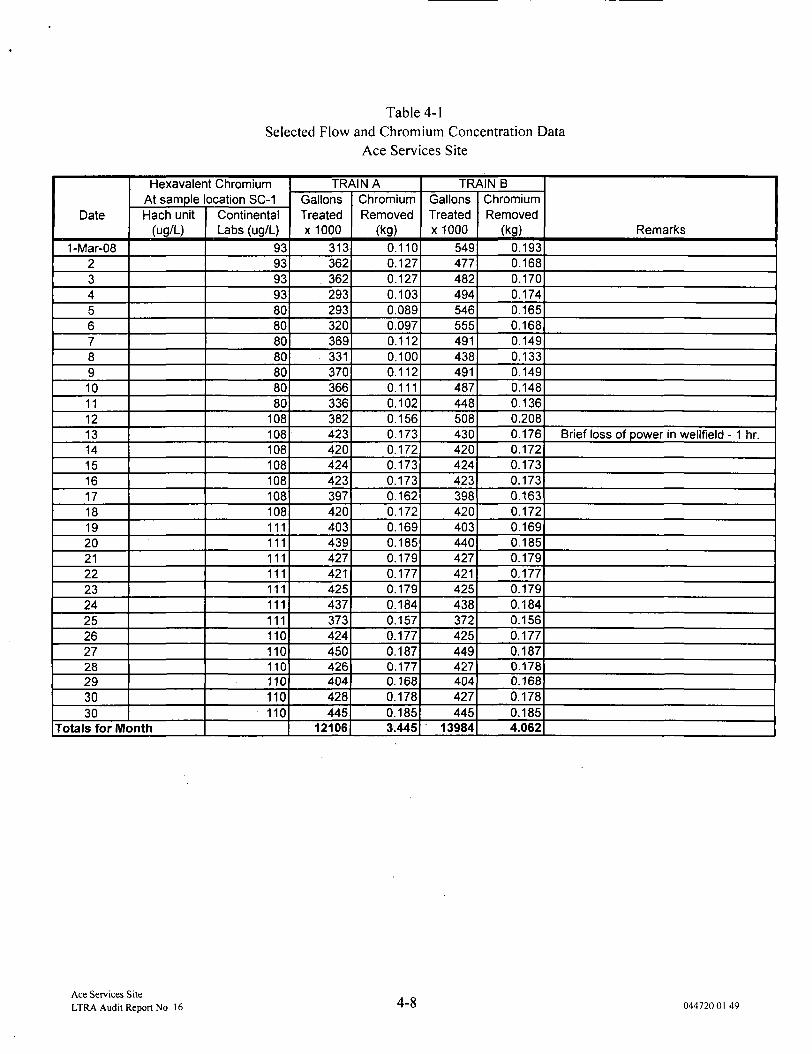
Table 4-1Selected Flow and Chromium Concentration Data
Ace Services Site
Date
1-Mar-082345678910111213141516171819202122232425262728293030
Hexavalent ChromiumAt sample location SC-1Hach unit
(ug/L)
Totals for Month
ContinentalLabs (ug/L)
9393939380808080808080
108108108108108108108111111111111111111111110110110110110110
TRAIN AGallonsTreatedxlOOO
313362
. 362293293320369331370366336382423420424423397420403439427421425437373424450426404428445
12106
ChromiumRemoved
(kg)0.1100.1270.1270.1030.0890.0970.1120.1000.1120.1110.1020.1560.1730.1720.1730.1730.1620.1720.1690.1850.1790.1770.1790.1840.1570.1770.1870.1770.1680.1780.1853.445
TRAIN BGallonsTreatedxlOOO
549477482494546555491438491487448508430420424423398420403440427421425438372425449427404427445
13984
ChromiumRemoved
(kg)0.1930.1680.1700.1740.1650.1680.1490.1330.1490.1480.1360.2080.1760.1720.1730.1730.1630.1720.1690.1850.1790.1770.1790.1840.1560.1770.1870.1780.1680.1780.1854.062
Remarks
Brief loss of power in wellfield - 1 hr.
Ace Services SiteLTRA Audit Report No 16 4-8 044720.01.49
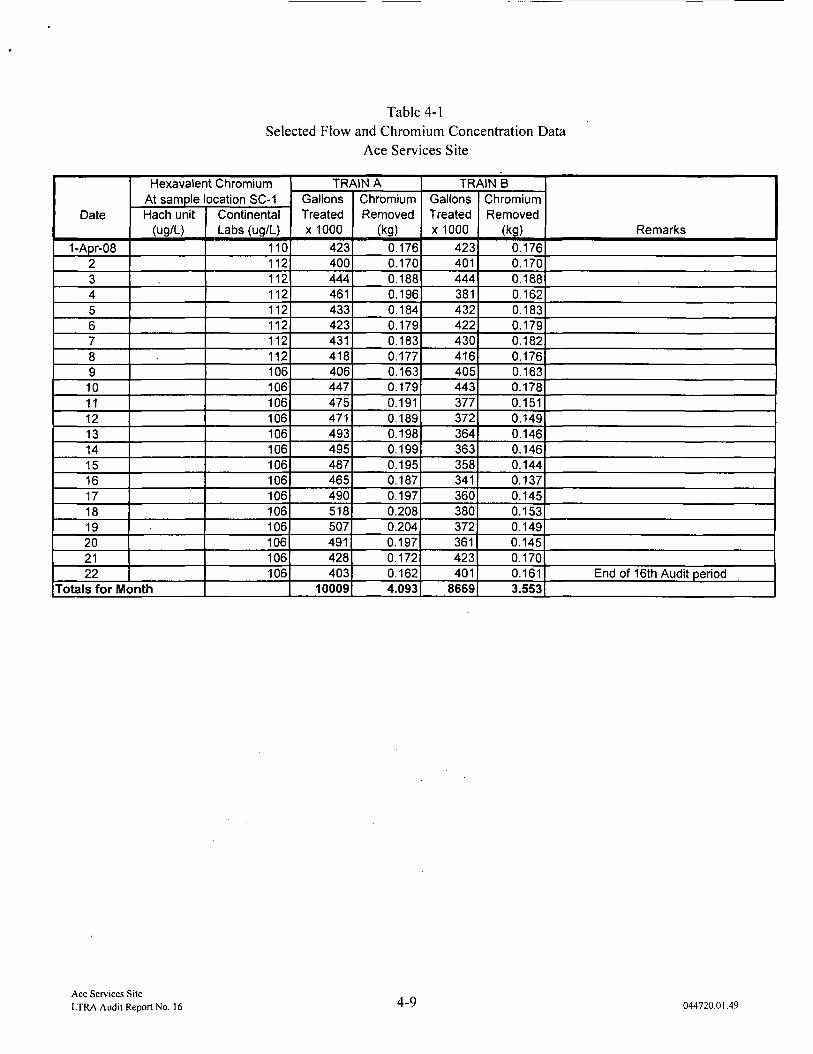
Table 4-1Selected Flow and Chromium Concentration Data
Ace Services Site
Date
1-Apr-082345678910111213141516171819202122
Hexavalent ChromiumAt sample location SC-1Hach unit
(ug/L)
Totals for Month
ContinentalLabs (ug/L)
110112112112112112112112106106106106106106106106106106106106106106
TRAIN AGallonsTreatedxlOOO
423400444461433423431418406447475471493495487465490518507491428403
10009
ChromiumRemoved
(kg)0.1760.1700.1880.1960.1840.1790.1830.1770.1630.1790.1910.1890.1980.1990.1950.1870.1970.2080.2040.1970.1720.1624.093
TRAIN BGallonsTreatedxlOOO
423401444381432422430416405443377372364363358341360380372361423401
8669
ChromiumRemoved
(kg)
0.1760.1700.1880.1620.1830.1790.1820.1760.1630.1780.1510.1490.1460.1460.1440.1370.1450.1530.1490.1450.1700.1613.553
Remarks
End of 16th Audit period
Ace Services SiteLIRA Audit Report No. 16 4-9 044720.01.49
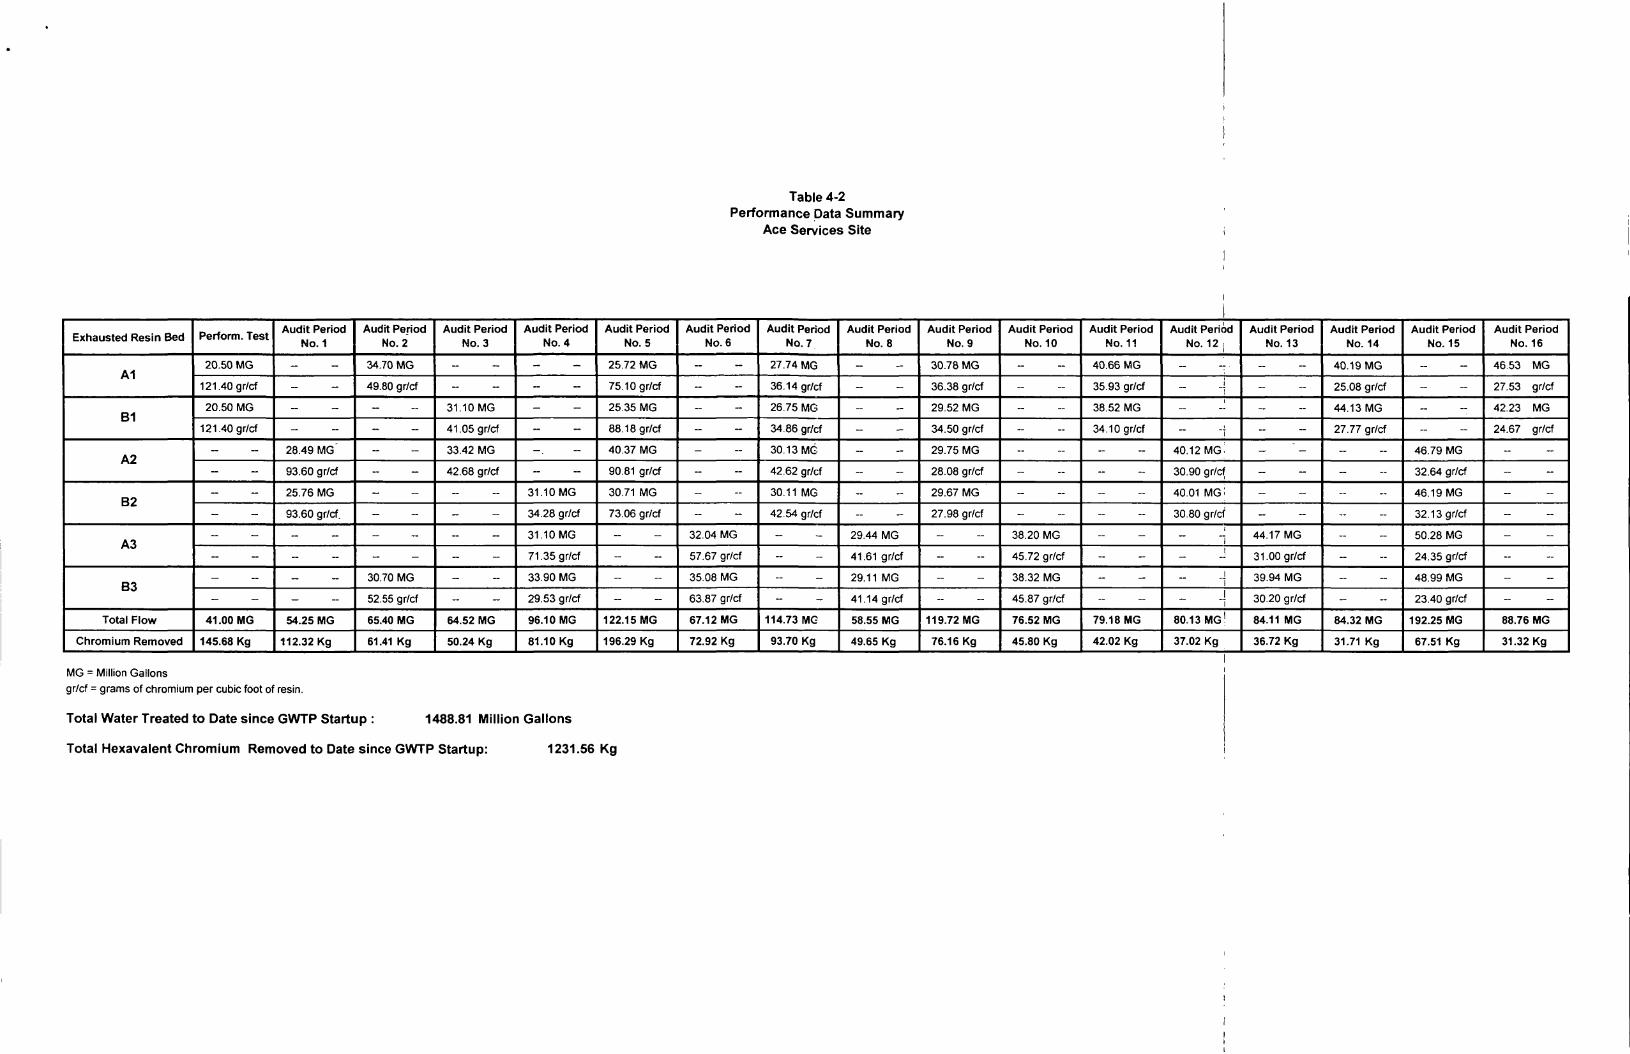
Table 4-2Performance Data Summary
Ace Services Site
Exhausted Resin Bed
A1
B1
A2
B2
A3
B3
Total Flow
Chromium Removed
Perform. Test
20.50 MG
121.40gr/cf
20.50 MG
121.40gr/cf
-
-
-
-
-
-
-
-
41.00MG
145.68 Kg
Audit PeriodNo. 1
-
-
-
-
28.49 MG"
93.60 gr/cf
25.76 MG
93.60 gr/cf.
-
-
-
-
54.25 MG
112.32 Kg
Audit PeriodNo. 2
34.70 MG
49.80 gr/cf
-
-
-
-
-
-
-
-
30.70 MG
52.55 gr/cf
65.40 MG
61.41 Kg
Audit PeriodNo. 3
-
-
31.10MG
41. 05 gr/cf
33.42 MG
42.68 gr/cf
-
-
-
-
-
-
64.52 MG
50.24 Kg
Audit PeriodNo. 4
-
-
-
-
-.
-
31.10MG
34.28 gr/cf
31.10MG
71. 35 gr/cf
33.90 MG
29.53 gr/cf
96.10 MG
81. 10 Kg
Audit PeriodNo. 5
25.72 MG
75. 10 gr/cf
25.35 MG
88. 18 gr/cf
40.37 MG
90.81 gr/cf
30.71 MG
73.06 gr/cf
-
-
-
-
122.15 MG
196.29 Kg
Audit PeriodNo. 6
-
-
_
-
-
-
-
-
32.04 MG
57.67 gr/cf
35.08 MG
63.87 gr/cf
67.12 MG
72.92 Kg
Audit PeriodNo. 7
27.74 MG
36.14 gr/cf
26.75 MG
34.86 gr/cf
30.13MG
42.62 gr/cf
30.11 MG
42.54 gr/cf
-
-
-
-
1 14.73 MG
93.70 Kg
Audit PeriodNo. 8
-
-
-
-
_
-
-
-
29.44 MG
41.61 gr/cf
29.11 MG
41. 14 gr/cf
58.55 MG
49.65 Kg
Audit PeriodNo. 9
30.78 MG
36.38 gr/cf
29.52 MG
34.50 gr/cf
29.75 MG
28.08 gr/cf
29.67 MG
27.98 gr/cf
-
-
-
-
11 9.72 MG
76.16 Kg
Audit PeriodNo. 10
-
-
-
-
-
-
-
-
38.20 MG
45.72 gr/cf
38.32 MG
45.87 gr/cf
76.52 MG
45.80 Kg
Audit PeriodNo. 11
40.66 MG
35.93 gr/cf
38.52 MG
34. 10 gr/cf
-
-
-
-
-
-
-
-
79.18 MG
42.02 Kg
Audit PeriodNo. 12
-i
-
-
40.12 MG:30.90 gr/cf
40.01 MG
30.80 gr/cfi
~ ~iJ
i~i
1i
80.13 MG
37.02 Kg
Audit PeriodNo. 13
_
-
_
-
-
-
-
-
44.17MG
3 1.00 gr/cf
39.94 MG
30.20 gr/cf
84.11 MG
36.72 Kg
Audit PeriodNo. 14
40.19 MG
25.08 gr/cf
44.13 MG
27.77 gr/cf
-
_
-
--
-
-
-
_
84.32 MG
31.71 Kg
Audit PeriodNo. 15
-
-
-
-
46.79 MG
32.64 gr/cf
46.19MG
32. 13 gr/cf
50.28 MG
24.35 gr/cf
48.99 MG
23.40 gr/cf
192.25 MG
67.51 Kg
Audit PeriodNo. 16
46.53 MG
27.53 gr/cf
42.23 MG
24.67 gr/cf
-
-
-
-
-
--
-
-
88.76 MG
31 .32 Kg
MG = Million Gallons
gr/cf = grams of chromium per cubic foot of resin.
Total Water Treated to Date since GWTP Startup : 1488.81 Million Gallons
Total Hexavalent Chromium Removed to Date since GWTP Startup: 1231.56 Kg
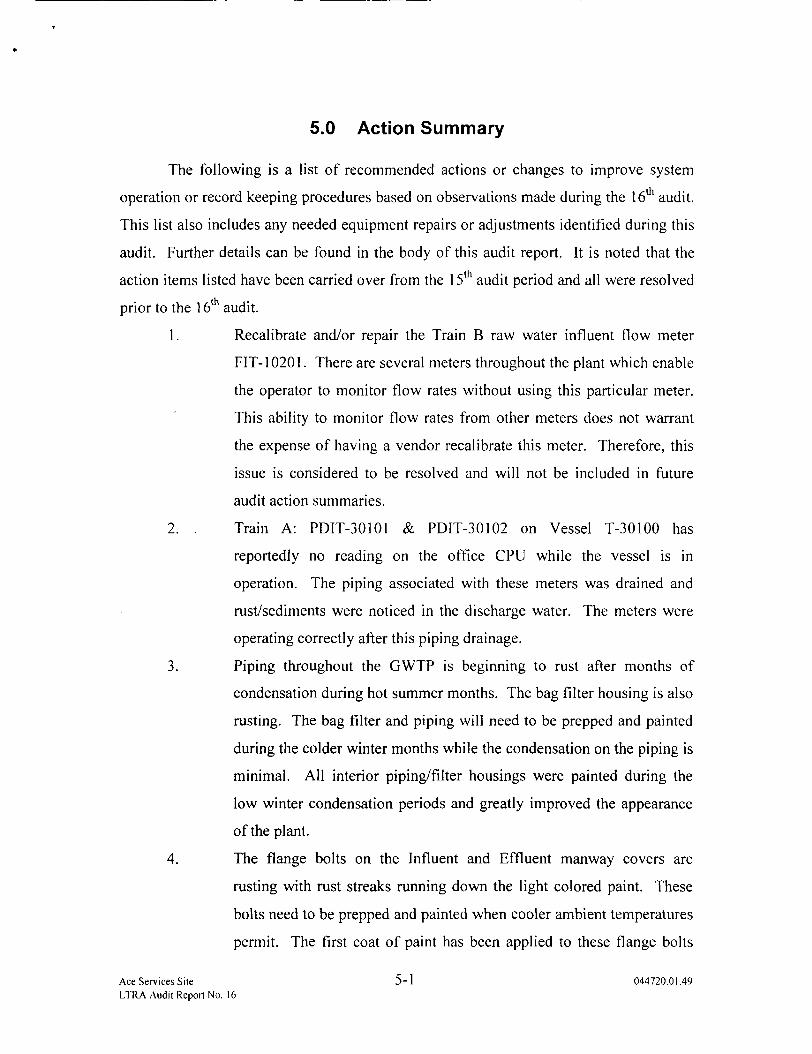
5.0 Action Summary
The following is a list of recommended actions or changes to improve system
operation or record keeping procedures based on observations made during the 16th audit.
This list also includes any needed equipment repairs or adjustments identified during this
audit. Further details can be found in the body of this audit report. It is noted that the
action items listed have been carried over from the 15th audit period and all were resolved
prior to the 16th audit.
1. Recalibrate and/or repair the Train B raw water influent flow meter
FIT-10201. There are several meters throughout the plant which enable
the operator to monitor flow rates without using this particular meter.
This ability to monitor flow rates from other meters does not warrant
the expense of having a vendor recalibrate this meter. Therefore, this
issue is considered to be resolved and will not be included in future
audit action summaries.
2. Train A: PDIT-30101 & PDIT-30102 on Vessel T-30100 has
reportedly no reading on the office CPU while the vessel is in
operation. The piping associated with these meters was drained and
rust/sediments were noticed in the discharge water. The meters were
operating correctly after this piping drainage.
3. Piping throughout the GWTP is beginning to rust after months of
condensation during hot summer months. The bag filter housing is also
rusting. The bag filter and piping will need to be prepped and painted
during the colder winter months while the condensation on the piping is
minimal. All interior piping/filter housings were painted during the
low winter condensation periods and greatly improved the appearance
of the plant.
4. The flange bolts on the Influent and Effluent manway covers are
rusting with rust streaks running down the light colored paint. These
bolts need to be prepped and painted when cooler ambient temperatures
permit. The first coat of paint has been applied to these flange bolts
Ace Services Site 5-1 044720.01.49LIRA Audit Report No. 16
and will require an additional coat as ambient weather conditions
permit.
Ace Services Site 5-2 044720.01.49LTRA Audit Report No. 16