Embed Size (px)
Citation preview
Long-Term Trash Load Reduction Plan and Assessment Strategy
Submitted by:
City of Belmont,
Department of Public Works
One Twin Pines Lane STE 385
Belmont, CA 94002
In compliance with Provisions C.10.c of Order R2-2009-0074
January 28, 2014
ii
Page Intentionally Left Blank
City of Belmont
iv
TABLE OF CONTENTS CERTIFICATION STATEMENT .............................................................................................................................................. III TABLE OF CONTENTS ............................................................................................................................................................. IIV LIST OF TABLES .......................................................................................................................................................................... V LIST FIGURES ............................................................................................................................................................................... V ABBREVIATIONS ........................................................................................................................................................................ VI PREFACE ........................................................................................................................................................................................ 2 1.0 INTRODUCTION .......................................................................................................................................................... 2
1.1 PURPOSE OF LONG-TERM TRASH REDUCTION PLAN ................................................................................................................... 2 1.2 BACKGROUND ...................................................................................................................................................................................... 3
1.2.1 Long-Term Trash Load Reduction Plan Framework ............................................................................................ 3 1.2.2 BASMAA Generation Rates Project .............................................................................................................................. 4 1.2.3 Short-Term Trash Load Reduction Plan .................................................................................................................... 5
1.3 ORGANIZATION OF LONG-TERM PLAN ............................................................................................................................................ 6 2.0 SCOPE OF THE TRASH PROBLEM ......................................................................................................................... 7
2.1 PERMITTEE CHARACTERISTICS ......................................................................................................................................................... 7 2.2 TRASH SOURCES AND PATHWAYS .................................................................................................................................................... 8 2.3 TRASH GENERATING AREAS .............................................................................................................................................................. 9
2.3.1 Generation Categories and Designation of Areas .................................................................................................. 9 2.3.2 Summary of Trash Generating Areas and Sources .............................................................................................. 11
3.0 TRASH MANAGEMENT AREAS AND CONTROL MEASURES ...................................................................... 14 3.1 MANAGEMENT AREA DELINEATION AND PRIORITIZATION ....................................................................................................... 14 3.2 CURRENT AND PLANNED TRASH CONTROL MEASURES ............................................................................................................. 17
3.2.1 Trash Management Area #1 ........................................................................................................................................ 17 3.2.2 Trash Management Area #2 ........................................................................................................................................ 21 3.2.3 Trash Management Area #3 ........................................................................................................................................ 21 3.2.4 Trash Management Area #4 ........................................................................................................................................ 22 3.2.5 Trash Management Area #5 ........................................................................................................................................ 23 3.2.6 Jurisdiction-wide Control Measures .......................................................................................................................... 24 3.2.7 Creek and Shoreline Hot Spot Cleanups ................................................................................................................... 27 3.2.8 Summary of Trash Control Measures........................................................................................................................ 28
3.3 CONTROL MEASURE IMPLEMENTATION SCHEDULE.................................................................................................................... 29 4.0 PROGRESS ASSESSMENT STRATEGY ................................................................................................................ 32
4.1 SMCWPPP PILOT ASSESSMENT STRATEGY................................................................................................................................ 32 4.1.1 Management Questions .................................................................................................................................................. 32 4.1.2 Indicators of Progress and Success ............................................................................................................................ 32 4.1.3 Pilot Assessment Methods .............................................................................................................................................. 33
4.2 BASMAA “TRACKING CALIFORNIA’S TRASH” PROJECT ............................................................................................................ 36 4.2.1 Testing of Trash Monitoring Methods ...................................................................................................................... 37 4.2.2 Full Capture Equivalent Studies .................................................................................................................................. 37
4.3 LONG-TERM ASSESSMENT STRATEGY ........................................................................................................................................... 37 4.4 IMPLEMENTATION SCHEDULE......................................................................................................................................................... 37
5.0 REFERENCES ............................................................................................................................................................. 39
Long-Term Trash Load Reduction Plan
v
LIST OF TABLES TABLE 1. SAN FRANCISCO BAY AREA TRASH GENERATION RATES BY LAND USE (GALLONS/ACRE/YEAR). TABLE 2. PERCENTAGES OF THE CITY OF BELMONT'S JURISDICTIONAL AREA WITHIN LAND USE CLASSES IDENTIFIED BY
ABAG (2005) TABLE 3. TRASH GENERATION CATEGORIES AND ASSOCIATED GENERATION RATES (GALLONS/ACRE/YEAR). TABLE 4. DEFINITIONS OF ON-LAND TRASH ASSESSMENT CONDITION CATEGORIES. TABLE 5. PERCENTAGE OF JURISDICTIONAL AREA WITHIN THE CITY/COUNTY OF CITY OF BELMONT ASSIGNED TO EACH
TRASH GENERATION CATEGORY. TABLE 6. JURISDICTIONAL AREA AND PERCENTAGE OF EACH TRASH MANAGEMENT AREA (TMA) COMPRISED OF TRASH
GENERATION CATEGORIES TABLE 7. CITY OF BELMONT TRASH CONTROL MEASURE IMPLEMENTATION SCHEDULE. TABLE 8. TRASH CONDITION CATEGORIES USED IN THE DRAFT ON-LAND VISUAL ASSESSMENT PROTOCOL. TABLE 9. CITY OF BELMONT TRASH PROGRESS ASSESSMENT IMPLEMENTATION SCHEDULE.
LIST FIGURES FIGURE 1. EIGHT-STEP FRAMEWORK FOR DEVELOPING, IMPLEMENTING AND REFINING LONG-TERM TRASH REDUCTION PLANS. FIGURE 2. CONCEPTUAL MODEL OF TRASH GENERATION, INTERCEPTION AND LOAD. FIGURE 3. TRASH SOURCES CATEGORIES AND TRANSPORT PATHWAYS TO URBAN CREEKS. FIGURE 4. TRASH SOURCES CATEGORIES AND TRANSPORT PATHWAYS TO URBAN CREEKS. FIGURE 5. FINAL TRASH GENERATION MAP FOR THE CITY OF BELMONT. FIGURE 6. TRASH MANAGEMENT AREA MAP FOR THE CITY OF BELMONT. FIGURE 7. TRASH FULL CAPTURE DEVICE MAP FOR THE CITY OF BELMONT.
City of Belmont
vi
ABBREVIATIONS ABAG Association of Bay Area Governments BASMAA Bay Area Stormwater Management Agencies Association BID Business Improvement District CalRecycle California Department of Resources Recycling and Recovery Caltrans California Department of Transportation CASQA California Stormwater Quality Association CDS Continuous Deflection Separator CEQA California Environmental Quality Act CY Cubic Yards EIR Environmental Impact Report EPA Environmental Protection Agency GIS Geographic Information System MRP Municipal Regional Stormwater NPDES Permit MS4 Municipal Separate Storm Sewer System NGO Non-Governmental Organization NPDES National Pollutant Discharge Elimination System O&M Operation and Maintenance OWOW Our Water Our World PIP Public Information and Participation PSA Public Service Announcement Q Flow SFRWQCB San Francisco Regional Water Quality Control Board SMCWPPP San Mateo County Water Pollution Prevention Program SWRCB State Water Resource Control Board TMA Trash Management Areas TMDL Total Maximum Daily Load USEPA United States Environmental Protection Agency Water Board San Francisco Regional Water Quality Control Board WDR Waste Discharge Requirements
City of Belmont
2
PREFACE This Long-Term Trash Load Reduction Plan and Assessment Strategy (Long-Term Plan) is submitted in compliance with provision C.10.c of the Municipal Regional Stormwater NPDES Permit (MRP) for Phase I communities in the San Francisco Bay (Order R2-2009-0074). The Long-Term Plan was developed using a regionally consistent outline and guidance developed by the Bay Area Stormwater Management Agencies Association (BASMAA) and reviewed by San Francisco Bay Regional Water Quality Control Board staff. The Long-Term Plan is consistent with the Long-Term Trash Load Reduction Framework developed in collaboration with Water Board staff. Its content is based on the City of Belmont’s current understanding of trash problems within its jurisdiction and the effectiveness of control measures designed to reduce trash impacts associated with Municipal Separate Storm Sewer (MS4) discharges. This Long-Term Plan is intended to be iterative and may be modified in the future based on information gained through the implementation of trash control measures. The City of Belmont therefore reserves the right to revise or amend this Long-Term Plan at its discretion. If significant revisions or amendments are made by the City, a revised Long-Term Plan will be submitted to the Water Board through the City’s annual reporting process.
City of Belmont
2
1.0 INTRODUCTION
1.1 Purpose of Long-Term Trash Reduction Plan
The Municipal Regional Stormwater National Pollutant Discharge Elimination System (NPDES) Permit for Phase I communities in the San Francisco Bay (Order R2-2009-0074), also known as the Municipal Regional Permit (MRP), became effective on December 1, 2009. The MRP applies to 76 large, medium and small municipalities (cities, towns and counties) and flood control agencies in the San Francisco Bay Region, collectively referred to as Permittees. Provision C.10.c of the MRP requires Permittees to submit a Long-Term Trash Load Reduction Plan (Long-Term Plan) by February 1, 2014. Long-Term Plans must describe control measures that are currently being implemented, including the level of implementation, and additional control measures that will be implemented and/or increased level of implementation designed to attain a 70% trash load reduction by July 1, 2017, and 100% (i.e., “No Visual Impact”) by July 1, 2022.
This Long-Term Plan is submitted by the City of Belmont in compliance with MRP provision C.10.c. Consistent with provision C.10 requirements, the goal of the Long-Term Plan is to solve trash problems in receiving waters by reducing the impacts associated with trash in discharges from the City of Belmont’s municipal separate storm sewer system (MS4) that are regulated by NPDES Permit requirements. The Long-Term Plan includes:
1. Descriptions the current level of implementation of trash control measures, and the type and extent to which new or enhanced control measures will be implemented to achieve a target of 100% (i.e. full) trash reduction from MS4s by July 1, 2022, with an interim milestone of 70% reduction by July 1, 2017;
2. A description of the Trash Assessment Strategy that will be used assess progress towards trash reduction targets achieved as a result of control measure implementation; and,
3. Time schedules for implementing control measures and the assessment strategy. The Long-Term Plan was developed using a regionally consistent outline and guidance developed by the Bay Area Stormwater Management Agencies Association (BASMAA) and reviewed by the San Francisco Bay Regional Water Quality Control Board (Water Board) staff. The Long-Term Plan is consistent with the Long-Term Trash Load Reduction Framework (see section 1.2.1) developed in collaboration with Water Board staff. Its content is based on the City of Belmont’s current understanding of trash problems within its jurisdiction and the effectiveness of control measures designed to reduce trash impacts associated with Municipal Separate Storm Sewer (MS4) discharges. The Long-Term Plan builds upon trash control measures implemented by the City prior to the adoption of the MRP and during the implementation of the Short-Term Trash Load Reduction Plan submitted to the Water Board on February 1, 2012.

Long-Term Trash Load Reduction Plan
3
1.2 Background
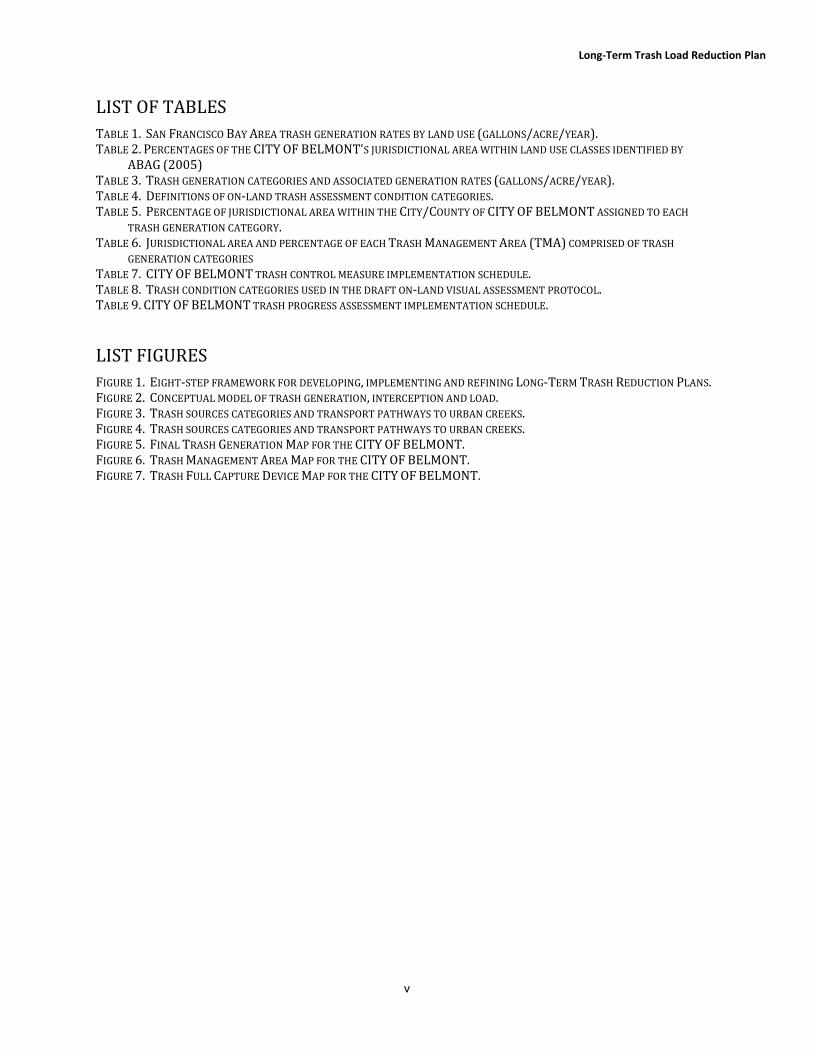
1.2.1 Long-Term Trash Load Reduction Plan Framework A workgroup of MRP Permittee, Bay Area countywide stormwater program staff and Water Board staff met between October 2012 and March 2013 to better define the process for developing and implementing Long-Term Plans, methods for assessing progress toward reduction goals, and tracking and reporting requirements associated with provision C.10. Through these discussions, an eight-step framework for developing and implementing Long-Term Plans was created by the workgroup (Figure 1).
Figure 1. Eight-step framework for developing, implementing and refining Long-Term Trash Reduction Plans.
The workgroup agreed that as the first step in the framework, Permittees would identify very high, high, moderate, and low trash generating areas in their jurisdictional areas. Trash generation rates developed through the BASMAA Baseline Trash Generation Rates Project (as discussed below) were used as a starting point for differentiating and delineating land areas with varying levels of trash generation. Permittees would then use local knowledge and field and/or desktop assessments to confirm or refine the level of trash generation for specific areas within their jurisdiction. Each Permittee would then develop a map depicting trash generation categories within their jurisdiction.
As a next step, Permittees would then delineate and prioritize Trash Management Areas (TMAs) where specific control measures exist or are planned for implementation. TMAs delineated by Permittees are intended to serve as reporting units in the future. Reporting at the management area level provides the level of detail necessary to demonstrate implementation and progress towards trash reduction targets.
Once control measures are selected and implemented, Permittees will evaluate progress toward trash reduction targets using outcome-based assessment methods. As the results of the progress
5. Define method(s) to assess progress
4. Identify/select control measures
3. Delineate and prioritize management areas
2. Identify trash sources (as needed)
8. Modify area designations & reprioritize areas / problems
7. Assess progress via defined methods
6. Implement control measures
1. Identify and map trash generating areas
City of Belmont
4
assessments are available, Permittees may choose to reprioritize trash management areas and associated control measures designed to improve trash reduction within their jurisdictions.
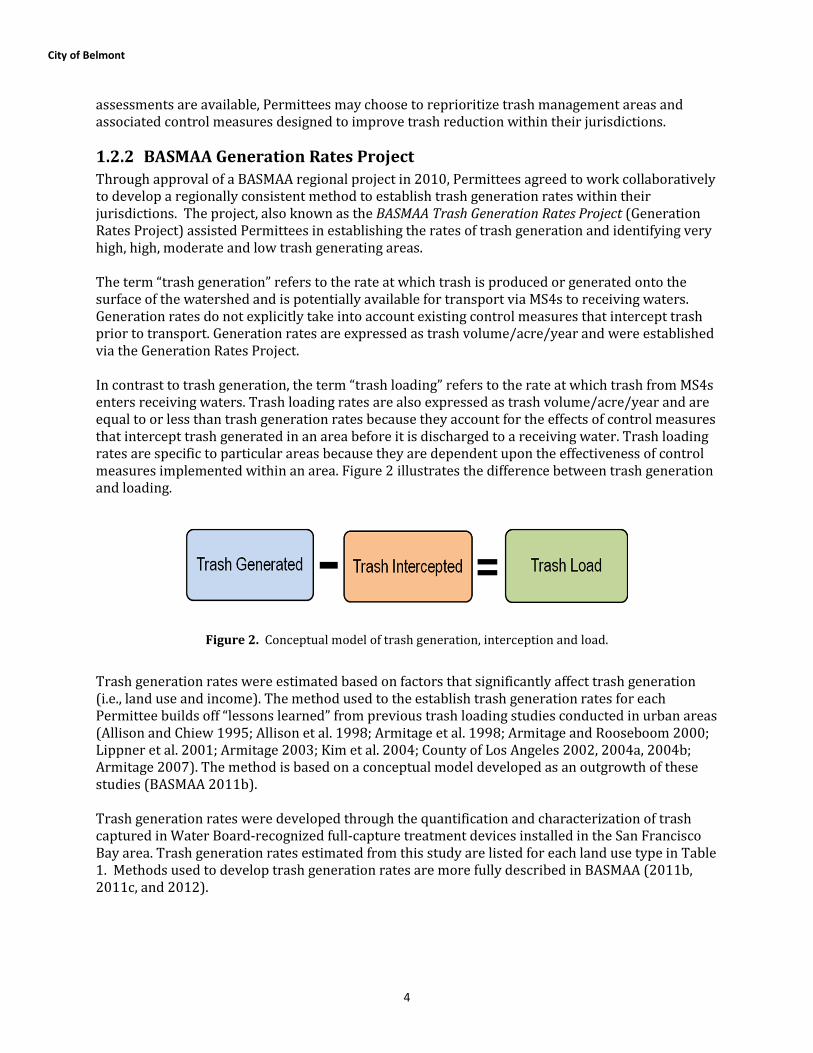
1.2.2 BASMAA Generation Rates Project Through approval of a BASMAA regional project in 2010, Permittees agreed to work collaboratively to develop a regionally consistent method to establish trash generation rates within their jurisdictions. The project, also known as the BASMAA Trash Generation Rates Project (Generation Rates Project) assisted Permittees in establishing the rates of trash generation and identifying very high, high, moderate and low trash generating areas. The term “trash generation” refers to the rate at which trash is produced or generated onto the surface of the watershed and is potentially available for transport via MS4s to receiving waters. Generation rates do not explicitly take into account existing control measures that intercept trash prior to transport. Generation rates are expressed as trash volume/acre/year and were established via the Generation Rates Project. In contrast to trash generation, the term “trash loading” refers to the rate at which trash from MS4s enters receiving waters. Trash loading rates are also expressed as trash volume/acre/year and are equal to or less than trash generation rates because they account for the effects of control measures that intercept trash generated in an area before it is discharged to a receiving water. Trash loading rates are specific to particular areas because they are dependent upon the effectiveness of control measures implemented within an area. Figure 2 illustrates the difference between trash generation and loading.
Figure 2. Conceptual model of trash generation, interception and load.
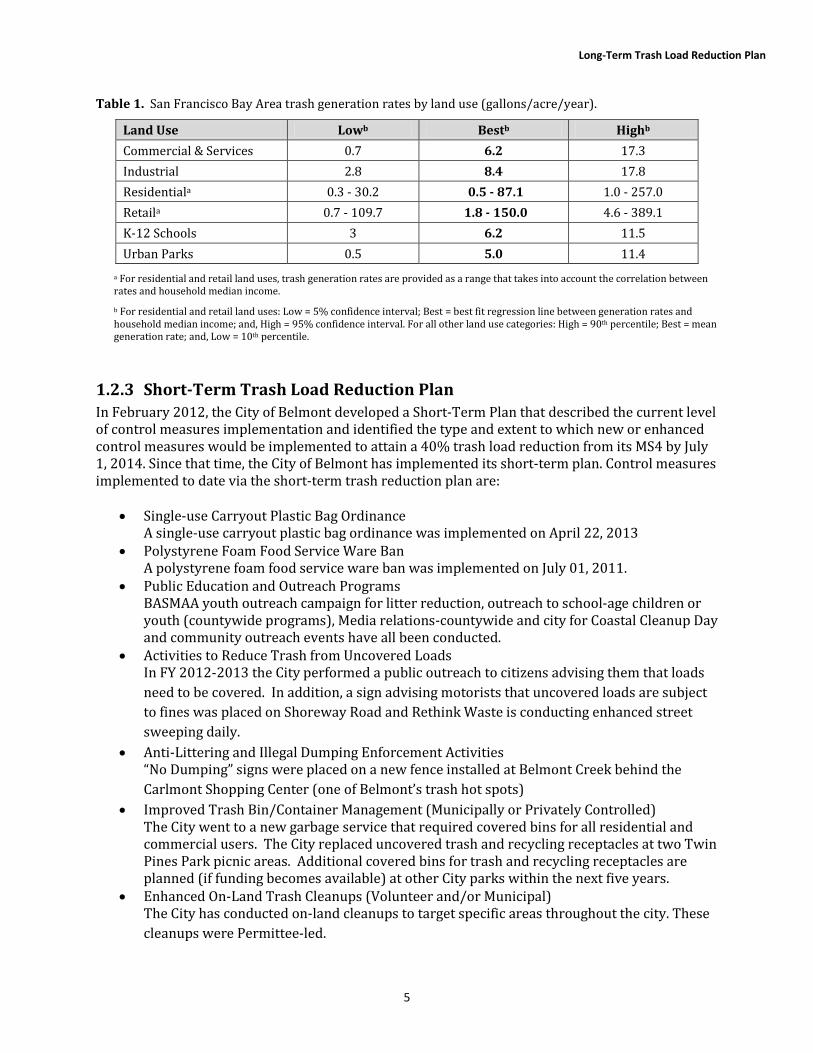
Trash generation rates were estimated based on factors that significantly affect trash generation (i.e., land use and income). The method used to the establish trash generation rates for each Permittee builds off “lessons learned” from previous trash loading studies conducted in urban areas (Allison and Chiew 1995; Allison et al. 1998; Armitage et al. 1998; Armitage and Rooseboom 2000; Lippner et al. 2001; Armitage 2003; Kim et al. 2004; County of Los Angeles 2002, 2004a, 2004b; Armitage 2007). The method is based on a conceptual model developed as an outgrowth of these studies (BASMAA 2011b). Trash generation rates were developed through the quantification and characterization of trash captured in Water Board-recognized full-capture treatment devices installed in the San Francisco Bay area. Trash generation rates estimated from this study are listed for each land use type in Table 1. Methods used to develop trash generation rates are more fully described in BASMAA (2011b, 2011c, and 2012).
Long-Term Trash Load Reduction Plan
5
Table 1. San Francisco Bay Area trash generation rates by land use (gallons/acre/year).
Land Use Lowb Bestb Highb Commercial & Services 0.7 6.2 17.3 Industrial 2.8 8.4 17.8 Residentiala 0.3 - 30.2 0.5 - 87.1 1.0 - 257.0 Retaila 0.7 - 109.7 1.8 - 150.0 4.6 - 389.1 K-12 Schools 3 6.2 11.5 Urban Parks 0.5 5.0 11.4
a For residential and retail land uses, trash generation rates are provided as a range that takes into account the correlation between rates and household median income. b For residential and retail land uses: Low = 5% confidence interval; Best = best fit regression line between generation rates and household median income; and, High = 95% confidence interval. For all other land use categories: High = 90th percentile; Best = mean generation rate; and, Low = 10th percentile.
1.2.3 Short-Term Trash Load Reduction Plan In February 2012, the City of Belmont developed a Short-Term Plan that described the current level of control measures implementation and identified the type and extent to which new or enhanced control measures would be implemented to attain a 40% trash load reduction from its MS4 by July 1, 2014. Since that time, the City of Belmont has implemented its short-term plan. Control measures implemented to date via the short-term trash reduction plan are:
• Single-use Carryout Plastic Bag Ordinance A single-use carryout plastic bag ordinance was implemented on April 22, 2013
• Polystyrene Foam Food Service Ware Ban A polystyrene foam food service ware ban was implemented on July 01, 2011.
• Public Education and Outreach Programs BASMAA youth outreach campaign for litter reduction, outreach to school-age children or youth (countywide programs), Media relations-countywide and city for Coastal Cleanup Day and community outreach events have all been conducted.
• Activities to Reduce Trash from Uncovered Loads In FY 2012-2013 the City performed a public outreach to citizens advising them that loads need to be covered. In addition, a sign advising motorists that uncovered loads are subject to fines was placed on Shoreway Road and Rethink Waste is conducting enhanced street sweeping daily.
• Anti-Littering and Illegal Dumping Enforcement Activities “No Dumping” signs were placed on a new fence installed at Belmont Creek behind the Carlmont Shopping Center (one of Belmont’s trash hot spots)
• Improved Trash Bin/Container Management (Municipally or Privately Controlled) The City went to a new garbage service that required covered bins for all residential and commercial users. The City replaced uncovered trash and recycling receptacles at two Twin Pines Park picnic areas. Additional covered bins for trash and recycling receptacles are planned (if funding becomes available) at other City parks within the next five years.
• Enhanced On-Land Trash Cleanups (Volunteer and/or Municipal) The City has conducted on-land cleanups to target specific areas throughout the city. These cleanups were Permittee-led.
City of Belmont
6
Control measures described in this Long-Term Plan build upon actions taken to-date via the City of Belmont’s Short-Term Plan. A full description of control measures implemented via short and long-term plans is included in section 3.2. Outcomes associated with short-term plan implementation will be reported in the City of Belmont’s Fiscal Year 2013-14 Annual Report, scheduled for submittal to the Water Board by September 15, 2014.
1.3 Organization of Long-Term Plan
This Long-Term Plan is organized into the following sections:
1.0 Introduction; 2.0 Scope of the Trash Problem; 3.0 Trash Management Areas and Control Measures; 4.0 Progress Assessment Strategies; and 5.0 References
Section 2.0 is intended to provide a description of the extent and magnitude of the trash problem in the City of Belmont. Control measures that will be implemented by the City of Belmont as a result of this Long-Term Plan are described in section 3.0. Section 4.0 describes the methods that will be used to assess progress toward trash reduction targets.
Long-Term Trash Load Reduction Plan
7
2.0 SCOPE OF THE TRASH PROBLEM
2.1 Permittee Characteristics
Incorporated in 1926, the City of Belmont is located in San Mateo County, and has a jurisdictional area of 2956 acres. According to the 2010 Census, it has a population of 25,835 with a population density of 5,579.8 people per square mile and average household size of 2.95. Of the 25,835 residents who call the City of Belmont home, 20.9% are under the age of 18, 6.5% are between 18 and 24, 29.6% are between 25 and 44, 28.2% are between 45 and 64, and 14.9% are 65 or older. The median household income was $100,417 in 2010. The City of Belmont is home to Oracle, Cengage Learning, Nikon Precision, Safeway, Autobahn Motors and Silverado Senior Living. Other characteristics of the City of Belmont for identifying levels of trash generation include the following:
• A combined total of 16 private and public schools are located within the city limits and range from preschool to University.
• Shoreway Road is the main thoroughfare to the transfer station and is used by Recology, the City garbage service provider and citizens.
• El Camino Real and Highway 101 accumulate the highest trash levels. These are the responsibility of the State and outside of our jurisdiction.
• El Camino Real is State maintained; therefor the City is unable to install full trash capture devices along this road. Enhanced street sweeping is conducted by the City to remove trash along El Camino Real.
• Many areas of Belmont do not have storm drain lines where full trash capture devices cannot be installed.
Land uses within the City of Belmont depicted in Association of Bay Area Governments (ABAG) 2005 Land Use Class Identification are provided in Table 2. The City of Belmont is primary comprised of 7 land uses. These include…
• Commercial and Services • Industrial • Residential • Retail • K-12 Schools • Urban Parks • Other –(Colleges/Universities, Open Space, Rangeland, Forest land, Major Infrastructure)
City of Belmont
8
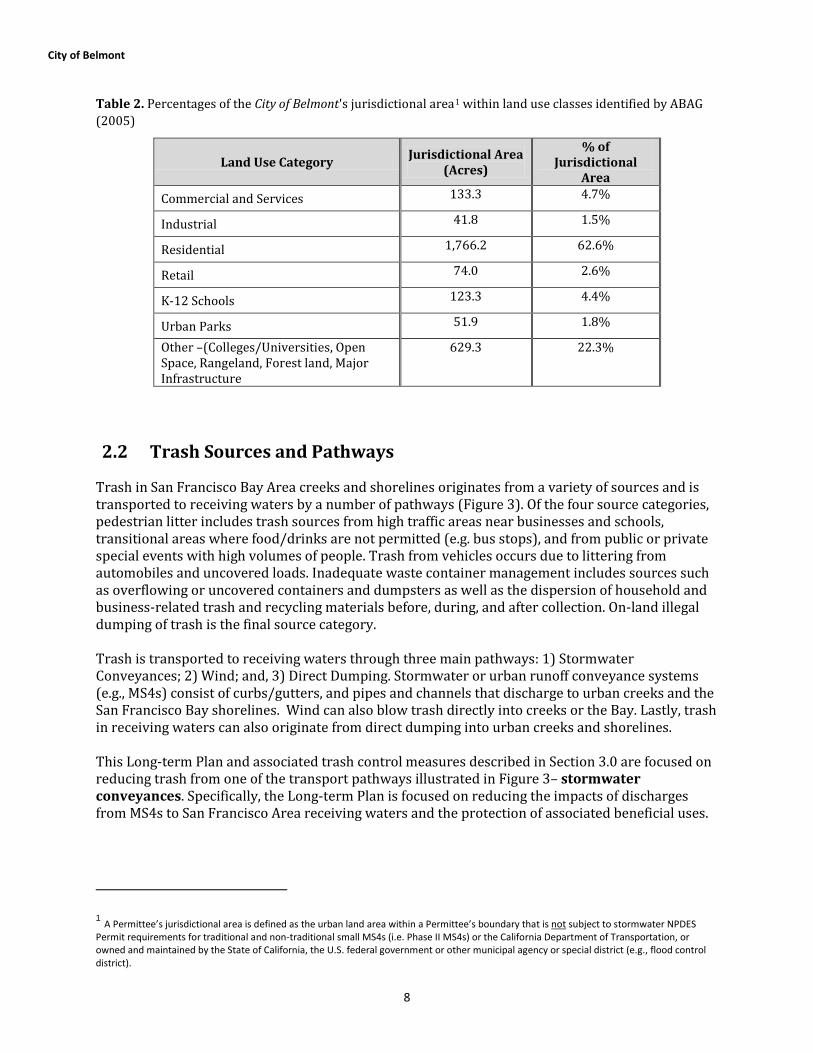
Table 2. Percentages of the City of Belmont's jurisdictional area1 within land use classes identified by ABAG (2005)
Land Use Category Jurisdictional Area (Acres)
% of Jurisdictional
Area Commercial and Services 133.3 4.7%
Industrial 41.8 1.5%
Residential 1,766.2 62.6%
Retail 74.0 2.6%
K-12 Schools 123.3 4.4%
Urban Parks 51.9 1.8%
Other –(Colleges/Universities, Open Space, Rangeland, Forest land, Major Infrastructure
629.3 22.3%
2.2 Trash Sources and Pathways
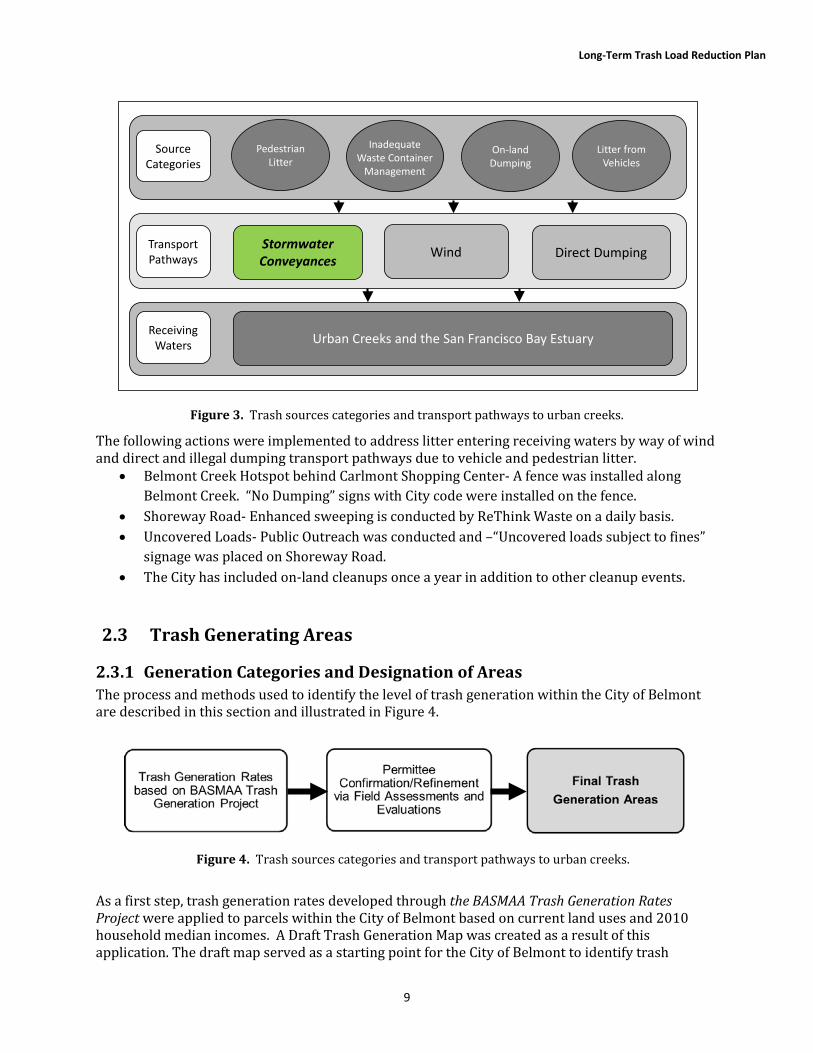
Trash in San Francisco Bay Area creeks and shorelines originates from a variety of sources and is transported to receiving waters by a number of pathways (Figure 3). Of the four source categories, pedestrian litter includes trash sources from high traffic areas near businesses and schools, transitional areas where food/drinks are not permitted (e.g. bus stops), and from public or private special events with high volumes of people. Trash from vehicles occurs due to littering from automobiles and uncovered loads. Inadequate waste container management includes sources such as overflowing or uncovered containers and dumpsters as well as the dispersion of household and business-related trash and recycling materials before, during, and after collection. On-land illegal dumping of trash is the final source category. Trash is transported to receiving waters through three main pathways: 1) Stormwater Conveyances; 2) Wind; and, 3) Direct Dumping. Stormwater or urban runoff conveyance systems (e.g., MS4s) consist of curbs/gutters, and pipes and channels that discharge to urban creeks and the San Francisco Bay shorelines. Wind can also blow trash directly into creeks or the Bay. Lastly, trash in receiving waters can also originate from direct dumping into urban creeks and shorelines. This Long-term Plan and associated trash control measures described in Section 3.0 are focused on reducing trash from one of the transport pathways illustrated in Figure 3– stormwater conveyances. Specifically, the Long-term Plan is focused on reducing the impacts of discharges from MS4s to San Francisco Area receiving waters and the protection of associated beneficial uses.
1 A Permittee’s jurisdictional area is defined as the urban land area within a Permittee’s boundary that is not subject to stormwater NPDES Permit requirements for traditional and non-traditional small MS4s (i.e. Phase II MS4s) or the California Department of Transportation, or owned and maintained by the State of California, the U.S. federal government or other municipal agency or special district (e.g., flood control district).
Long-Term Trash Load Reduction Plan
9
Figure 3. Trash sources categories and transport pathways to urban creeks.
The following actions were implemented to address litter entering receiving waters by way of wind and direct and illegal dumping transport pathways due to vehicle and pedestrian litter.
• Belmont Creek Hotspot behind Carlmont Shopping Center- A fence was installed along Belmont Creek. “No Dumping” signs with City code were installed on the fence.
• Shoreway Road- Enhanced sweeping is conducted by ReThink Waste on a daily basis. • Uncovered Loads- Public Outreach was conducted and –“Uncovered loads subject to fines”
signage was placed on Shoreway Road. • The City has included on-land cleanups once a year in addition to other cleanup events.
2.3 Trash Generating Areas
2.3.1 Generation Categories and Designation of Areas The process and methods used to identify the level of trash generation within the City of Belmont are described in this section and illustrated in Figure 4.
Figure 4. Trash sources categories and transport pathways to urban creeks.
As a first step, trash generation rates developed through the BASMAA Trash Generation Rates Project were applied to parcels within the City of Belmont based on current land uses and 2010 household median incomes. A Draft Trash Generation Map was created as a result of this application. The draft map served as a starting point for the City of Belmont to identify trash
Pedestrian Litter
Litter from Vehicles
On-land Dumping
Source Categories
Wind Direct Dumping
Urban Creeks and the San Francisco Bay Estuary
Transport Pathways
Receiving Waters
Stormwater Conveyances
Inadequate Waste Container
Management
City of Belmont
10
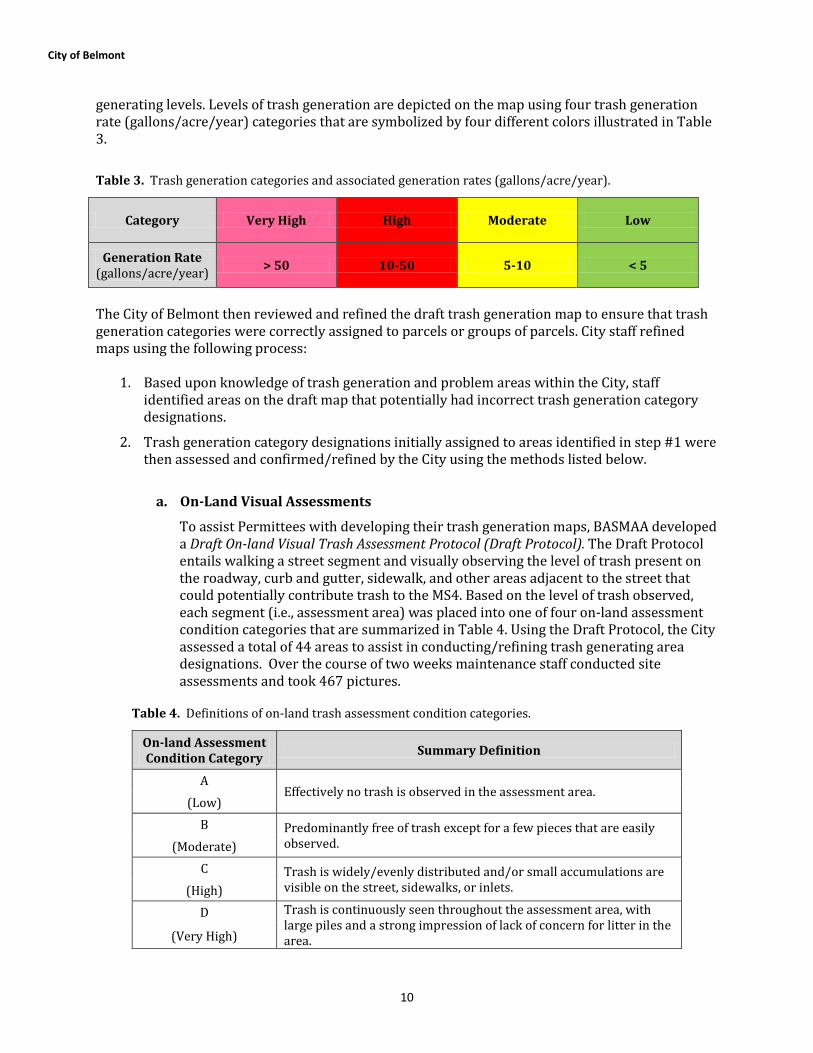
generating levels. Levels of trash generation are depicted on the map using four trash generation rate (gallons/acre/year) categories that are symbolized by four different colors illustrated in Table 3. Table 3. Trash generation categories and associated generation rates (gallons/acre/year).
Category Very High High Moderate Low
Generation Rate (gallons/acre/year) > 50 10-50 5-10 < 5
The City of Belmont then reviewed and refined the draft trash generation map to ensure that trash generation categories were correctly assigned to parcels or groups of parcels. City staff refined maps using the following process:
1. Based upon knowledge of trash generation and problem areas within the City, staff identified areas on the draft map that potentially had incorrect trash generation category designations.
2. Trash generation category designations initially assigned to areas identified in step #1 were then assessed and confirmed/refined by the City using the methods listed below.
a. On-Land Visual Assessments
To assist Permittees with developing their trash generation maps, BASMAA developed a Draft On-land Visual Trash Assessment Protocol (Draft Protocol). The Draft Protocol entails walking a street segment and visually observing the level of trash present on the roadway, curb and gutter, sidewalk, and other areas adjacent to the street that could potentially contribute trash to the MS4. Based on the level of trash observed, each segment (i.e., assessment area) was placed into one of four on-land assessment condition categories that are summarized in Table 4. Using the Draft Protocol, the City assessed a total of 44 areas to assist in conducting/refining trash generating area designations. Over the course of two weeks maintenance staff conducted site assessments and took 467 pictures.
Table 4. Definitions of on-land trash assessment condition categories.
On-land Assessment Condition Category Summary Definition
A Effectively no trash is observed in the assessment area.
(Low) B Predominantly free of trash except for a few pieces that are easily
observed. (Moderate) C Trash is widely/evenly distributed and/or small accumulations are
visible on the street, sidewalks, or inlets. (High) D Trash is continuously seen throughout the assessment area, with
large piles and a strong impression of lack of concern for litter in the area. (Very High)
Long-Term Trash Load Reduction Plan
11
b. Querying Municipal Staff or Members of the Public
The Maintenance Manager spoke with the Sweeper Operator and Maintenance Staff to identify locations and sources of trash within the city. A list was compiled and given to staff for the field verification process.
c. Reviewing Municipal Operations Data
Staff reviewed Service Requests from 2008-2013 to identify complaints of dumping activities and trash cleanup requests. Identified problem areas added to the field verification list.
d. Field Verification of Trash Generation Areas
The Field Supervisor and Field Maintenance Worker spent 160+ hours in the field conducting on-site assessments of 44 areas and documented their findings with 467 photos. A preliminary rating of low, medium, high and very high on-land assessment condition categories were established for the 44 areas. These preliminary findings were reviewed by a Quality Assurance Committee made up of Engineering and field staff and final ratings were established. After the Quality Assurance Committee review, field staff spot-checked areas for accuracy.
3. Based on assessments conducted to confirm/refine trash generation category designations,
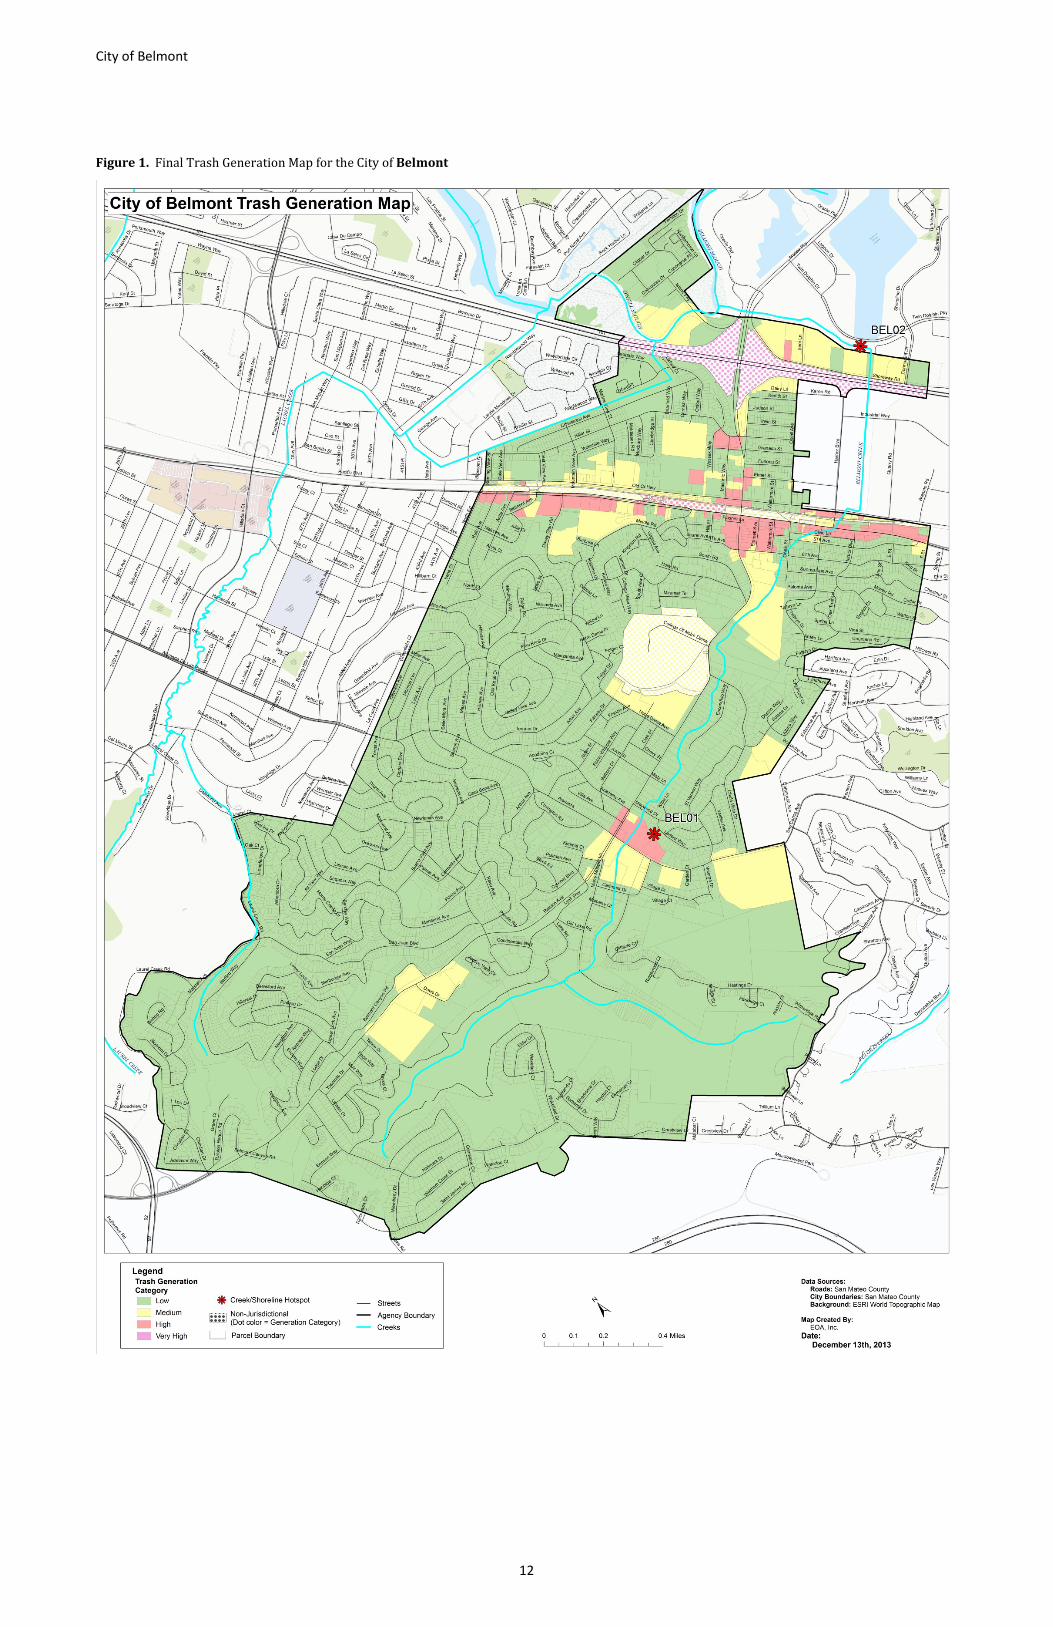
the City created a final trash generation map that depicts the most current understanding of trash generation within the City of Belmont. The City documented this process by tracking the information collected through the assessments and subsequent refinements to the Draft Trash Generation Map. The City of Belmont’s Final Trash Generation Map is included as Figure 5.
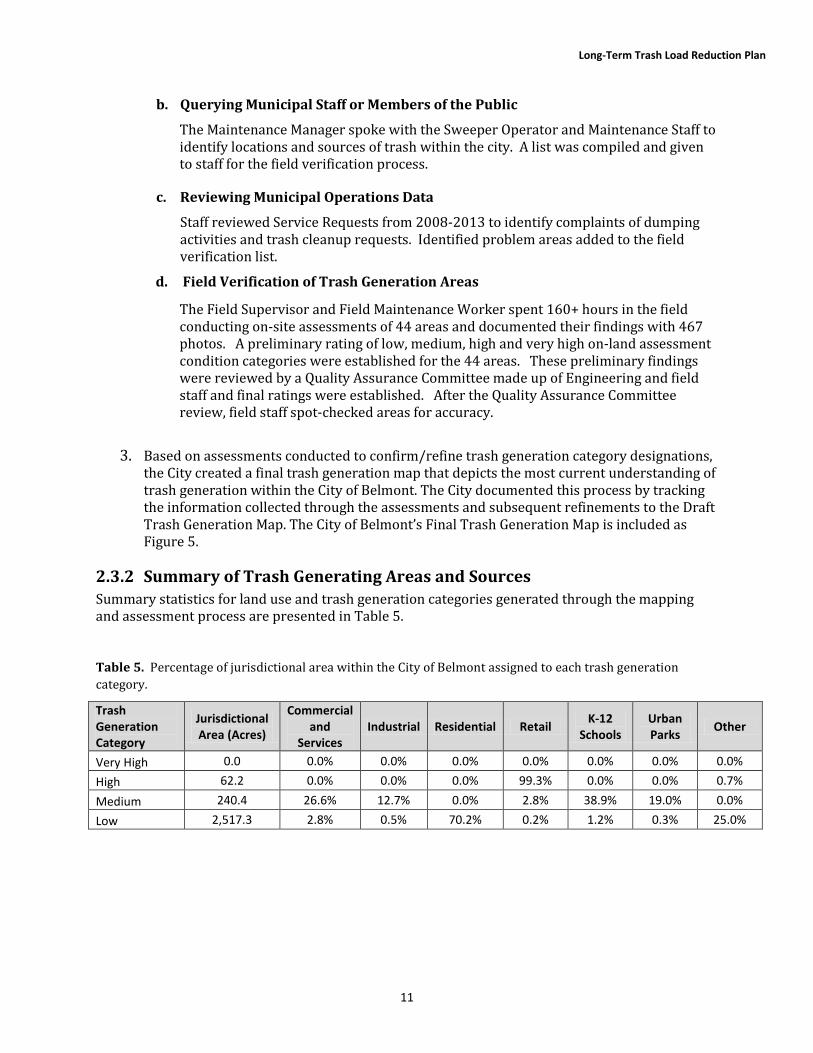
2.3.2 Summary of Trash Generating Areas and Sources Summary statistics for land use and trash generation categories generated through the mapping and assessment process are presented in Table 5.
Table 5. Percentage of jurisdictional area within the City of Belmont assigned to each trash generation category.
Trash Generation Category
Jurisdictional Area (Acres)
Commercial and
Services Industrial Residential Retail K-12
Schools Urban Parks Other
Very High 0.0 0.0% 0.0% 0.0% 0.0% 0.0% 0.0% 0.0% High 62.2 0.0% 0.0% 0.0% 99.3% 0.0% 0.0% 0.7% Medium 240.4 26.6% 12.7% 0.0% 2.8% 38.9% 19.0% 0.0% Low 2,517.3 2.8% 0.5% 70.2% 0.2% 1.2% 0.3% 25.0%
City of Belmont
12
Figure 1. Final Trash Generation Map for the City of Belmont

Long-Term Trash Load Reduction Plan
13
Page Intentionally Left Blank
City of Belmont
14
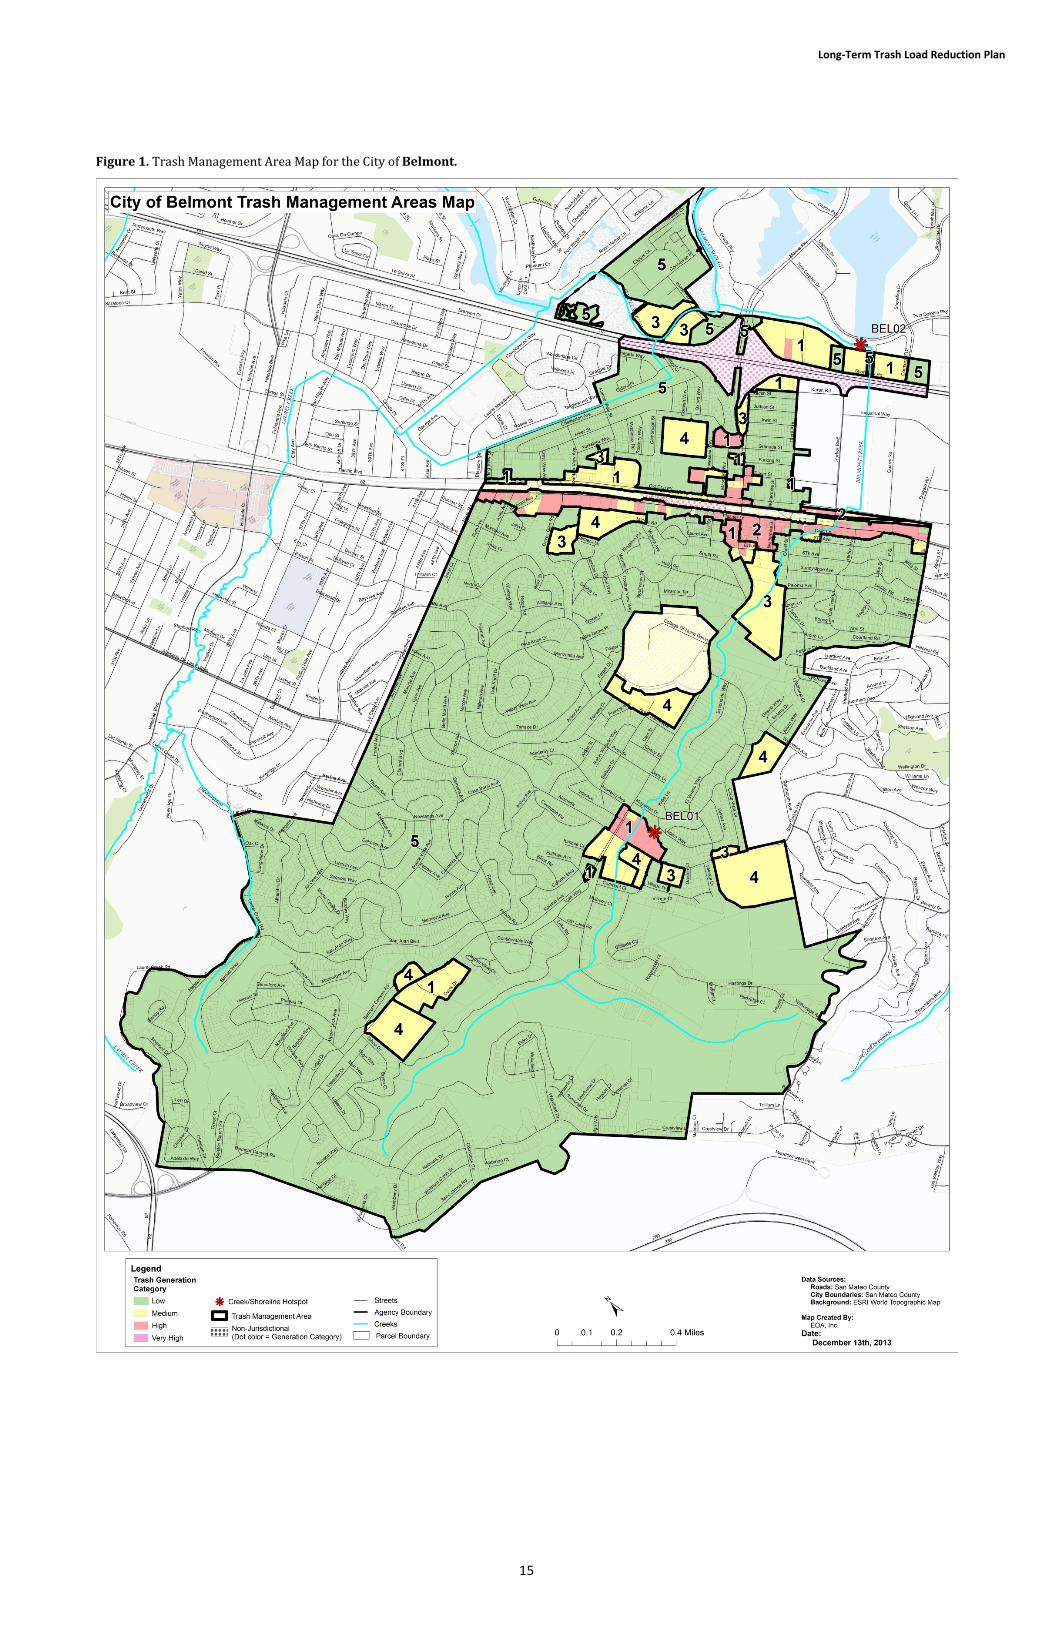
3.0 TRASH MANAGEMENT AREAS AND CONTROL MEASURES This section describes the control measures that the City of Belmont has or plans to implement to solve trash problems and achieve a target of 100% (i.e. full) trash reduction from their MS4 by July 1, 2022. The selection of control measures described in this section is based on the City of Belmont’s current understanding of trash problems within its jurisdiction and the effectiveness of control measures designed to reduce trash impacts associated with MS4 discharges. Information on the effectiveness of some trash control measures is currently lacking and therefore in the absence of this information, the City based its selection of control measures on existing effectiveness information, their experience in implementing trash controls and knowledge of trash problems, and costs of implementation. As knowledge is gained through the implementation of these control measures, the City may choose to refine their trash control strategy described in this section. If significant revisions or amendments are made, a revised Long-Term Plan will be submitted to the Water Board through the City of Belmont’s annual reporting process.
3.1 Management Area Delineation and Prioritization
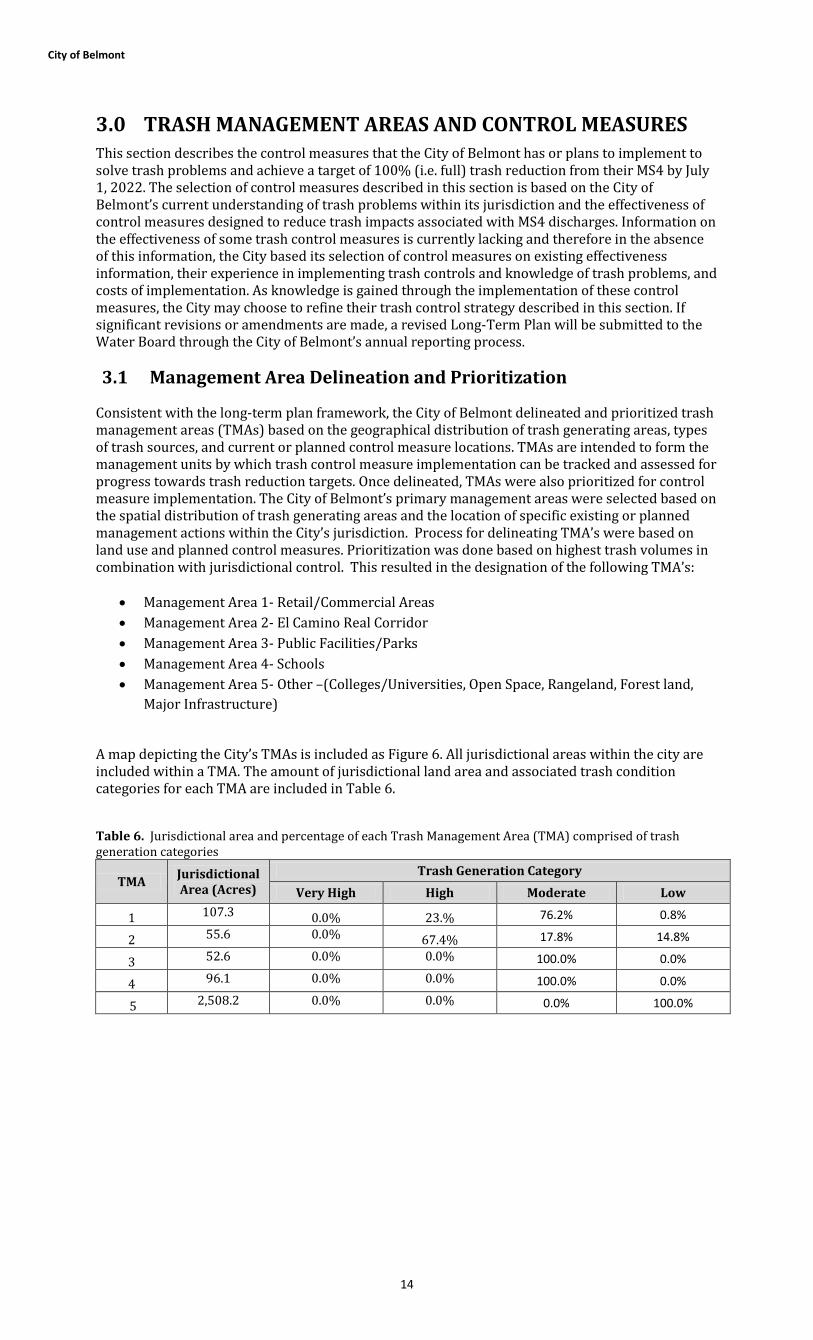
Consistent with the long-term plan framework, the City of Belmont delineated and prioritized trash management areas (TMAs) based on the geographical distribution of trash generating areas, types of trash sources, and current or planned control measure locations. TMAs are intended to form the management units by which trash control measure implementation can be tracked and assessed for progress towards trash reduction targets. Once delineated, TMAs were also prioritized for control measure implementation. The City of Belmont’s primary management areas were selected based on the spatial distribution of trash generating areas and the location of specific existing or planned management actions within the City’s jurisdiction. Process for delineating TMA’s were based on land use and planned control measures. Prioritization was done based on highest trash volumes in combination with jurisdictional control. This resulted in the designation of the following TMA’s:
• Management Area 1- Retail/Commercial Areas • Management Area 2- El Camino Real Corridor • Management Area 3- Public Facilities/Parks • Management Area 4- Schools • Management Area 5- Other –(Colleges/Universities, Open Space, Rangeland, Forest land,
Major Infrastructure)
A map depicting the City’s TMAs is included as Figure 6. All jurisdictional areas within the city are included within a TMA. The amount of jurisdictional land area and associated trash condition categories for each TMA are included in Table 6. Table 6. Jurisdictional area and percentage of each Trash Management Area (TMA) comprised of trash generation categories
TMA Jurisdictional Area (Acres)
Trash Generation Category Very High High Moderate Low
1 107.3 0.0% 23.% 76.2% 0.8%
2 55.6 0.0% 67.4% 17.8% 14.8%
3 52.6 0.0% 0.0% 100.0% 0.0%
4 96.1 0.0% 0.0% 100.0% 0.0%
5 2,508.2 0.0% 0.0% 0.0% 100.0%
Long-Term Trash Load Reduction Plan
15
Figure 1. Trash Management Area Map for the City of Belmont.

City of Belmont
16
Page Intentionally Left Blank
Long-Term Trash Load Reduction Plan
17
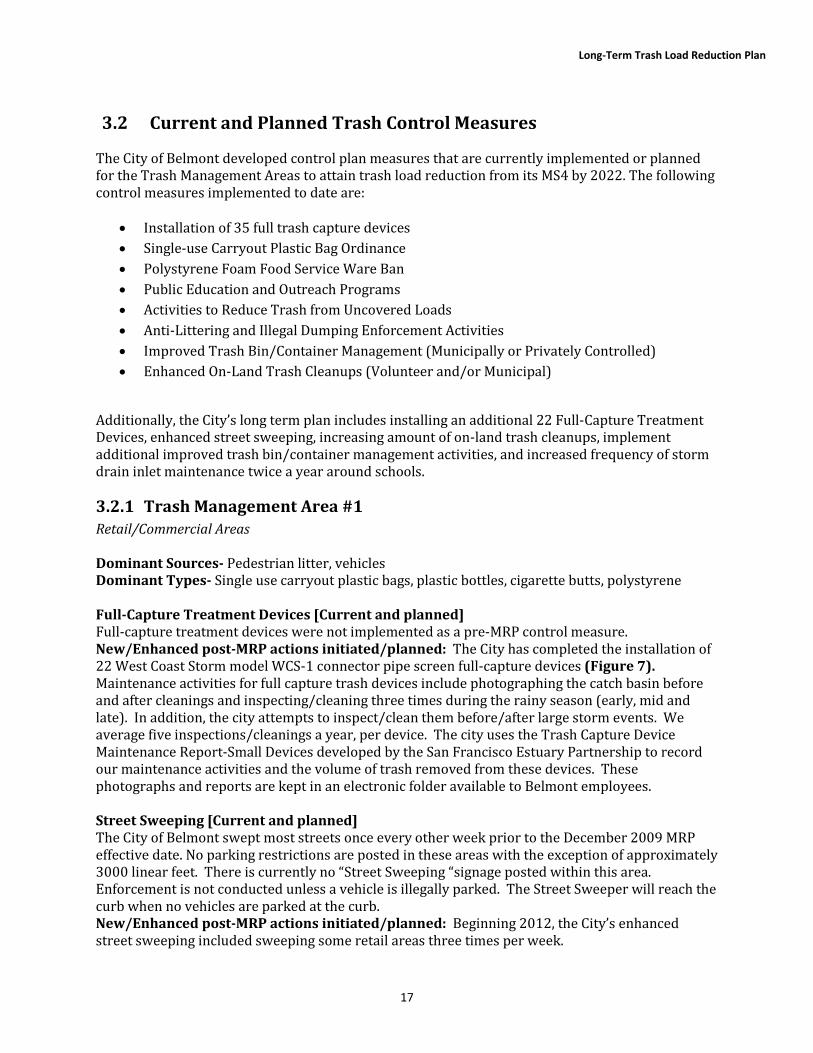
3.2 Current and Planned Trash Control Measures
The City of Belmont developed control plan measures that are currently implemented or planned for the Trash Management Areas to attain trash load reduction from its MS4 by 2022. The following control measures implemented to date are:
• Installation of 35 full trash capture devices • Single-use Carryout Plastic Bag Ordinance • Polystyrene Foam Food Service Ware Ban • Public Education and Outreach Programs • Activities to Reduce Trash from Uncovered Loads • Anti-Littering and Illegal Dumping Enforcement Activities • Improved Trash Bin/Container Management (Municipally or Privately Controlled) • Enhanced On-Land Trash Cleanups (Volunteer and/or Municipal)
Additionally, the City’s long term plan includes installing an additional 22 Full-Capture Treatment Devices, enhanced street sweeping, increasing amount of on-land trash cleanups, implement additional improved trash bin/container management activities, and increased frequency of storm drain inlet maintenance twice a year around schools.
3.2.1 Trash Management Area #1 Retail/Commercial Areas Dominant Sources- Pedestrian litter, vehicles Dominant Types- Single use carryout plastic bags, plastic bottles, cigarette butts, polystyrene Full-Capture Treatment Devices [Current and planned] Full-capture treatment devices were not implemented as a pre-MRP control measure. New/Enhanced post-MRP actions initiated/planned: The City has completed the installation of 22 West Coast Storm model WCS-1 connector pipe screen full-capture devices (Figure 7). Maintenance activities for full capture trash devices include photographing the catch basin before and after cleanings and inspecting/cleaning three times during the rainy season (early, mid and late). In addition, the city attempts to inspect/clean them before/after large storm events. We average five inspections/cleanings a year, per device. The city uses the Trash Capture Device Maintenance Report-Small Devices developed by the San Francisco Estuary Partnership to record our maintenance activities and the volume of trash removed from these devices. These photographs and reports are kept in an electronic folder available to Belmont employees. Street Sweeping [Current and planned] The City of Belmont swept most streets once every other week prior to the December 2009 MRP effective date. No parking restrictions are posted in these areas with the exception of approximately 3000 linear feet. There is currently no “Street Sweeping “signage posted within this area. Enforcement is not conducted unless a vehicle is illegally parked. The Street Sweeper will reach the curb when no vehicles are parked at the curb. New/Enhanced post-MRP actions initiated/planned: Beginning 2012, the City’s enhanced street sweeping included sweeping some retail areas three times per week.
City of Belmont
18
On-Land Trash Cleanups [Planned] There was no on-land cleanups conducted pre-MRP. New/Enhanced post-MRP actions initiated/planned: The City will include an on-land cleanup to target specific areas around Retail/Commercial. These cleanups will be Permittee-led. Activities to Reduce Trash from Uncovered Loads [Current] No activities to reduce trash from uncovered loads were implemented as a pre-MRP control measure. New/Enhanced post-MRP actions initiated/planned: In FY 2012-2013 the City performed a public outreach to citizens advising them that loads need to be covered. In addition, a sign advising motorists that uncovered loads are subject to fines was placed on Shoreway Road and Rethink Waste is conducting enhanced street sweeping daily along Shoreway Road. Anti-Littering and Illegal Dumping Enforcement Activities [Current] No activities for anti-littering and illegal dumping enforcement were implemented as a pre-MRP control measure. New/Enhanced post-MRP actions initiated/planned: “No Dumping” signs were placed on a new fence installed at Belmont Creek behind the Carlmont Shopping Center (one of Belmont’s trash hot spots). Improved Trash Bins/Container Management [Planned] Improved trash bin/container management was not implemented as a pre-MRP control measure. New/Enhanced post-MRP actions initiated/planned: The City went to a new garbage service in January 2011 that required covered bins for all residential and commercial users. The City installed a covered receptacle on the Shoreway Trail in 2010. Creek, Channel, Shoreline Cleanups [Current and planned] The City was required to hold one (1) citizen involvement event (creek cleanup) per year as stated in the number of involvement events per permittee population in section C.7.g of the MRP. The City met the MRP requirements. New/Enhanced post-MRP actions initiated/planned: Continued shoreline cleanups at O’Neill Slough and Belmont Slough will be scheduled annually and will be permittee led. These cleanups will be a single-day collaborative effort.

Long-Term Trash Load Reduction Plan
19
Figure 1. Trash Full Capture Device Map for the City of Belmont.

City of Belmont
20
Page Intentionally Left Blank
Long-Term Trash Load Reduction Plan
21
3.2.2 Trash Management Area #2 El Camino Real Corridor Dominant Sources- Pedestrian litter, vehicles Dominant Types- Single use carryout plastic bags, plastic bottles, cigarette butts, polystyrene Street Sweeping [Current and planned] The City of Belmont swept most streets once every other week prior to the December 2009 MRP effective date. No parking restrictions are posted in this area (State Highway 82). There is currently no “Street Sweeping “signage posted within this area. Enforcement is not conducted unless a vehicle is illegally parked. The Street Sweeper will reach the curb when no vehicles are parked at the curb. This area is swept prior to 5:30am when parking is minimal. New/Enhanced post-MRP actions initiated/planned: Beginning 2013, the City’s enhanced street sweeping included sweeping this corridor three times per week.
3.2.3 Trash Management Area #3 Public Facilities/Parks Dominant Sources- Pedestrian litter, vehicles Dominant Types- Single use carryout plastic bags, plastic bottles, cigarette butts, polystyrene Full-Capture Treatment Devices [Current and planned] Full-capture treatment devices were not implemented as a pre-MRP control measure. New/Enhanced post-MRP actions initiated/planned: The City has completed the installation of 1 West Coast Storm model WCS-1 connector pipe screen full-capture device in this trash management area. Maintenance activities for full capture trash devices include photographing the catch basin before and after cleanings and inspecting/cleaning three times during the rainy season (early, mid and late). In addition, the city attempts to inspect/clean them before/after large storm events. We average five inspections/cleanings a year, per device. The city uses the Trash Capture Device Maintenance Report-Small Devices developed by the San Francisco Estuary Partnership to record our maintenance activities and the volume of trash removed from these devices. These photographs and reports are kept in an electronic folder available to Belmont employees. Street Sweeping [Current and planned] The City of Belmont swept most streets once every other week prior to the December 2009 MRP effective date. No parking restrictions are posted in these areas with the exception of approximately 500 linear feet. There is currently no “Street Sweeping “signage posted within this area. Enforcement is not conducted unless a vehicle is illegally parked. The Street Sweeper will reach the curb when no vehicles are parked at the curb. New/Enhanced post-MRP actions initiated/planned: Beginning 2012, the City’s enhanced street sweeping included sweeping City Hall/Twin Pines Park area three times per week. On-Land Trash Cleanups [Planned] There was no on-land cleanups conducted pre-MRP. New/Enhanced post-MRP actions initiated/planned: The City will include an on-land cleanup to target areas around public parks in conjunction with other creek cleanups scheduled throughout the year. This will be a permittee led cleanup.
City of Belmont
22
Improved Trash Bins/Container Management [Current and planned] Improved trash bin/container management was not implemented as a pre-MRP control measure. New/Enhanced post-MRP actions initiated/planned: In 2011, the City went to a new garbage service that required covered bins for all residential and commercial users. The City replaced uncovered trash and recycling receptacles at two Twin Pines Park picnic areas in 2013. Additional covered bins for trash and recycling receptacles are planned (if funding becomes available) at other City parks within the next five years. Creek, Channel, Shoreline Cleanups [Current and planned] The City was required to hold one (1) citizen involvement event (creek cleanup) per year as stated in the number of involvement events per permittee population in section C.7.g of the MRP. The City met the MRP requirements. New/Enhanced post-MRP actions initiated/planned: Continued creek cleanups will be scheduled annually for Belmont Creek and will be permittee led. These cleanups will be a single-day collaborative effort.
3.2.4 Trash Management Area #4 Schools Dominant Sources- Pedestrian litter, vehicles Dominant Types- Single use carryout plastic bags, plastic bottles, cigarette butts, polystyrene Full-Capture Treatment Devices [Current and planned] Full-capture treatment devices were not implemented as a pre-MRP control measure. New/Enhanced post-MRP actions initiated/planned: The City has completed the installation of 3 West Coast Storm model WCS-1 connector pipe screen full-capture devices in this trash management area. Maintenance activities for full capture trash devices include photographing the catch basin before and after cleanings and inspecting/cleaning three times during the rainy season (early, mid and late). In addition, the city attempts to inspect/clean them before/after large storm events. We average five inspections/cleanings a year, per device. The city uses the Trash Capture Device Maintenance Report-Small Devices developed by the San Francisco Estuary Partnership to record maintenance activities and the volume of trash removed from these devices. These photographs and reports are kept in an electronic folder available to Belmont employees. On-Land Trash Cleanups [Planned] There was no on-land cleanups conducted pre-MRP. New/Enhanced post-MRP actions initiated/planned: The City will include an on-land cleanup to target areas around schools in conjunction with other creek cleanups scheduled throughout the year. This will be a permittee led cleanup. Enhanced Storm Drain Inlet Maintenance [Planned] Enhanced storm drain inlet maintenance was not implemented as a pre-MRP control measure. New/Enhanced post-MRP actions initiated/planned: Belmont is planning to implement enhanced storm drain inlet maintenance on 26 catch basins in this trash management area that will include inspection and cleaning twice a year.
Long-Term Trash Load Reduction Plan
23
Improved Trash Bins/Container Management [Planned] Improved trash bin/container management was not implemented as a pre-MRP control measure. New/Enhanced post-MRP actions initiated/planned: In 2011, The City went to a new garbage service that required covered bins for all residential and commercial users. The City plans to replace uncovered trash and recycling containers with covered receptacles at two school athletic fields by 2016.
3.2.5 Trash Management Area #5 Other-(Colleges/Universities, Open Space, Rangeland, Forest lane, Major Infrastructure) Dominant Sources- Pedestrian litter, vehicles Dominant Types- Single use carryout plastic bags, plastic bottles, cigarette butts, polystyrene Full-Capture Treatment Devices [Current and planned] Full-capture treatment devices were not implemented as a pre-MRP control measure. New/Enhanced post-MRP actions initiated/planned: The City has completed the installation of 9 West Coast Storm model WCS-1 connector pipe screen full-capture devices in this trash management area. Maintenance activities for full capture trash devices include photographing the catch basin before and after cleanings and inspecting/cleaning three times during the rainy season (early, mid and late). In addition, the city attempts to inspect/clean them before/after large storm events. We average five inspections/cleanings a year, per device. The city uses the Trash Capture Device Maintenance Report-Small Devices developed by the San Francisco Estuary Partnership to record our maintenance activities and the volume of trash removed from these devices. These photographs and reports are kept in an electronic folder available to Belmont employees. Street Sweeping [Current and planned] The City of Belmont swept most streets once every other week prior to the December 2009 MRP effective date. New/Enhanced post-MRP actions initiated/planned: In 2012, The City’s enhanced street sweeping for leaf control includes sweeping 2 neighborhoods (Chula Vista area, and portion of Sterling Downs) two times per week during the months of October, November and the first half of December. On-Land Trash Cleanups [Planned] There was no on-land cleanups conducted pre-MRP. New/Enhanced post-MRP actions initiated/planned: The City will include an on-land cleanup to target areas along Ralston Avenue from Alameda de las Pulgas to Christian Drive. This will be performed by city municipal staff. Improved Trash Bins/Container Management [Current and planned] Improved trash bin/container management consisted of replacing open containers with covered receptacles in 2004 at Vista Point and Water Dog Lake as a pre-MRP control measure. New/Enhanced post-MRP actions initiated/planned: In 2011, The City went to a new garbage service that required covered bins for all residential and commercial users. The City plans to replace open containers with covered receptacles in 5 parks within this management area by 2015.
City of Belmont
24
Creek, Channel, Shoreline Cleanups [Current and planned] The City was required to hold one (1) citizen involvement event (creek cleanup) per year as stated in the number of involvement events per permittee population in section C.7.g of the MRP. The City met the MRP requirements. New/Enhanced post-MRP actions initiated/planned: Continued creek cleanups will be scheduled annually along East Laurel Creek and will be permittee led. This cleanup will be a single-day collaborative effort.
3.2.6 Jurisdiction-wide Control Measures The City of Belmont participates in the San Mateo County-Wide Water Pollution Prevention Program (SMCWPPP) and conducts public education and outreach as a participating agency. The city also adopted the county’s Single-use Carryout Bag Policies and the Polystyrene Foam Food Service Ware Policies. Dominant Sources- Pedestrian litter, vehicles Dominant Types- Single use carryout plastic bags, plastic bottles, cigarette butts, polystyrene Single-Use Carryout Bag Policies [Current and planned] There was no Single-Use Carryout Bag Policy pre-MRP. New/Enhanced post-MRP actions initiated/planned: The City adopted the County-wide Single-Use Carryout Bag Policy which went into effect on April 22, 2013. Link to ordinance below: http://www.belmont.gov/Upload/Document/D240009310/Reusable%20Bag%20Ordinance%20No%201069.pdf Outreach efforts included 2 “Bag It” movie showings and tabling at the city’s Earth Day event to raise awareness of plastic bags in our environment and to inform residents of the upcoming reusable bag ordinance; free reusable bags, ordinance information, maintenance and tips on caring for your reusable bags were handed out at all three events. In addition, postings were included on the city’s Public Works Facebook/Twitter page and a webpage was created on the Environmental page. Link provided: http://www.belmont.gov/subContent.asp?CatID=240000276 On April 22, 2013-the day the ordinance went into effect- Free reusable bags were handed out in front of the Safeway Store at 1100 El Camino Real in Belmont. Polystyrene Foam Food Service Ware Policies [Current and planned] There was no Polystyrene Foam Food Service Ware Policies pre MRP. New/Enhanced post-MRP actions initiated/planned: The City adopted the County-wide “Prohibition on The Use of Polystyrene Based Disposable Food Service Ware by Food Vendors. This ordinance went into effect October 01, 2012. Link to ordinance below: http://www.belmont.gov/Upload/Document/D240008939/Polystyrene%20Ordinance.pdf Outreach included A Notice of Public Hearing which took place on July 10, 2012 to consider Belmont municipal code amendments regarding prohibition on the use of polystyrene based disposable food service ware by food vendors; Two public informational meetings were held on June 12, 2012 (2-3pm & 5-6pm) regarding who would have to follow the Ordinance, what the ordinance was expected to prohibit, and what food service ware the ordinance was expected to allow. Meeting notices were sent to all Belmont business license holders. Polystyrene ordinance
Long-Term Trash Load Reduction Plan
25
information was also included in two City Council meetings. The ordinance was posted in the newspaper and a webpage for polystyrene was included on the environmental page of the City’s website. Link to webpage below: http://www.belmont.gov/subContent.asp?CatID=240000276 Public Education and Outreach Programs [Current and planned] The City of Belmont implemented the following public education and outreach control measures prior to the effective date of the MRP and has continued to implement these measures since MRP adoption. SMCWPPP Public Information and Participation Program (Countywide)- Through participation and funding of the San Mateo Countywide Water Pollution Prevention Program’s (SMCWPPP) Public Information and Participation program (PIP), the City of Belmont plans to continue implementing litter reduction outreach to school-age children and youth. SMCWPPP currently oversees a contract to provide direct outreach to grades K-5 in a school setting on behalf of all permittees. The contract is currently held by the Banana Slug String Band, which performs a presentation called “We All Live Downstream.” Through songs and interactive exercises, the message of not putting anything in the stormdrains (including trash) is delivered, along with basic concepts of the water cycle and the impact of pollution on aquatic life. In addition, SMCWPPP has developed a presentation entitled “Water Pollution Prevention: Problems and Solutions that is delivered to high school students. This presentation is dedicated to watershed and stormdrain education, and the impact of litter on local creeks and waterways. Both efforts are managed to ensure that schools in each community in the County are reached. For communities without High Schools, the feeder schools in neighboring communities are specifically targeted for presentations. In addition to outreach at the school sites, a number of student activity guides and coloring books related to watershed health and littering are provided to children who attend outreach events. Schools are also directly targeted in promotion of Coastal Cleanup Day.
PIP also participates in a regional anti-littering campaign developed by BASMAA targeted at youth ages 14 to 24. As acting chair of the BASMAA PIP committee, SMCWPPP PIP has participated in the development and dissemination of campaign materials, and has conducted local events on behalf of all jurisdictions to promote the campaign. The campaign, entitled “Be The Street You Want to See”, will soon transition from building a community of youth dedicated to not littering to engaging that community in action. SMCWPPP, through its PIP program, plans to continue to conduct community outreach events on behalf of Permittees who request support. Outreach materials related to litter that are distributed include, in addition to the children’s materials listed above under Outreach to School-age Children or Youth, a promotional sign for cigarette smokers to discourage cigarette litter, and pocket ashtrays are given out. A general stormwater pollution prevention flyer in English and Spanish that includes litter reduction in its messaging is distributed. In addition to table outreach events conducted for specific Permittees, PIP also conducts a Countywide Event aimed to reach residents from throughout the County. PIP manages an online calendar which promotes cleanup events by non-profit organizations throughout the County. In FY 2012, PIP completed its 7th year acting as the county coordinator for Coastal Cleanup Day, increasing volunteer participation by 400% in that time, and trash removal increased by 300%. During the term of the MRP, new outreach materials have been disseminated to the public, including reusable shopping bags to encourage reduction in use of plastic carryout bags PIP has supported a countywide ban on carryout bags that began implementation on April 22, 2013. In addition, spring cleanups taking place in individual jurisdictions are promoted under one theme by
City of Belmont
26
PIP, entitled Spring Cleaning SMC. PIP assists in directing volunteers to cleanup events in their communities. SMCWPPP conducted a total of 11 outreach events on behalf of various jurisdictions within the County in the 2012-13 fiscal year. SMCWPPP will also continue maintaining an online calendar of cleanups on a monthly basis. In addition to using the SMCWPPP website, flowstobay.org, to promote cleanups, PIP is actively involved in social media platforms such as Facebook, Twitter, You Tube, and Instagram to deliver anti-littering and cleanup messages. Coastal Cleanup Day Promotion (Countywide)- On the countywide level, SMCWPPP also conducts annual press releases for Coastal Cleanup Day, and uses Twitter to promote cleanup events. These releases are intended to gain support and assistance for cleanup events conducted each September in local water bodies.
BASMAA Regional Media Relations Project (Regional)- Through participation and funding of the BASMAA Regional Media Relations Project, the City of Belmont is continuing to implement a media relations project partially designed to reduce littering from target audiences in the Bay Area. The goal of the BASMAA Media Relations Project is to generate media coverage that encourages individuals to adopt behavior changes to prevent water pollution, including littering. At least two press releases or PSAs focus on litter issues each year (e.g., creek clean-up activities, preventing litter by using reusable containers, etc.). In FY 12-13, the Media Relations project developed a press release new and recent bag bans in cities around the region. The pitch included information on the litter caused by plastic bags. Information ran on two radio stations-KBAY and KCBS, and on eight Bay Area Patch.com sites.
Local Program- Pre MRP, the City participated in the Annual California Coastal Cleanup Day. The locations were Belmont Creek and O’Neill Slough, which was permittee led. Our Water Our World (OWOW) handouts were available and displayed along with flowstobay litter reduction material. These activities have continued after the MRP effective date.
New/Enhanced Post-MRP Actions Initiated/Planned: In addition to the control measures continued post-MRP adoption, the City of Belmont is currently implementing or planning to implement the following public education and outreach control measures that were initiated after the MRP was adopted. BASMAA Youth Outreach Campaign (Regional)- Through participation and funding of the regional BASMAA Youth Outreach Campaign, the City of Belmont is implementing an outreach campaign designed to reduce littering from the target audience in the Bay Area. The Youth Outreach Campaign was launched in September 2011 and aims to increase the awareness of Bay Area Youth (ages 16-24) on litter and stormwater pollution issues, and eventually change their littering behaviors. Combining the ideas of Community Based Social Marketing with traditional advertising, the Youth Campaign aims to engage youth to enable the peer-to-peer distribution of Campaign messages. The Campaign will at least run through FY 13-14. A brief description of the Campaign activities is provided below:
• Raising Awareness: The Campaign is raising awareness of the target audience on litter and stormwater pollution issues. Partnerships with youth commissions, high schools, and other youth focused organizations have been developed to reach the target audience. Messages targeted to youth have been created and distributed via paid advertising, email marketing, Campaign website and social networking sites (e.g., Facebook and Twitter).
Engage the Youth - The advertisements encourage the audience to participate in the Youth Campaign by joining a Facebook page, entering a contest, taking an online quiz, etc., and providing their contact information. At the beginning of FY 12-13, a video contest was launched
Long-Term Trash Load Reduction Plan
27
to get Bay Area youth further involved in the Campaign. An online voting system was used to select the winning entry. Media advertising was conducted to promote the winning entry.
• Change Behaviors: To move the audience along the behavior change continuum, the Campaign is using electronic platforms such as email marketing and social networking sites to encourage participants to engage in increasingly more difficult behavior changes, such as participating in a clean-up, organizing a clean-up, etc.
• Maintain Engagement: The Campaign continues to interact with the target audience through email marketing and social media websites.
The Youth Campaign includes a pre and post campaign survey to evaluate the effectiveness of outreach. The pre-campaign survey was conducted in FY 11-12 and the post campaign survey will begin in FY 13-14. Other evaluation mechanisms, such as website hits, number of youth engaged in the Campaign’s social networking website, etc. are also being used to evaluate its effectiveness in increasing awareness and changing behavior. Activities in FY 12-13 included maintaining the website www.BetheStreet.org, Facebook page, and Instagram account. A video contest asking participants to submit their best anti-litter video was also conducted. The Be the Street campaign received 52 entries in response to the contest. The winning video was promoted on television, Pandora (online music site), YouTube, Google, and Facebook. Local Program- The City conducted multiple post MRP outreach events on the local level. For a listing and summary, please see section C.7-Public Outreach in the annual MRP.
3.2.7 Creek and Shoreline Hot Spot Cleanups The City of Belmont has two hot spot areas located in Trash Management Area 1; Belmont Creek behind Carlmont Shopping Center, and Belmont Slough. These areas are cleaned 2 times a year. Cubic yard totals of trash removed for FY 10/11, 11/12, and 12/13 are listed below along with dominant trash type. BEL01 –[Belmont Creek-behind Carlmont Shopping Center] Dominant Trash-Other plastic products, paper and cardboard, plastic bags, aluminum cans, and bottles. Trash Source- Trash accumulation, litter, illegal dumping Trash removed (cubic yards) FY2010/11- 0.748cy; FY2011/12- 1.485cy; FY2012/13- 0.297cy Frequency of hotspot cleanup- twice yearly to continue through 2022. BEL02 [O’Neill Slough-South] Dominant Trash-Plastic bags, other plastic products, paper and cardboard, convenience/fast food items, and bottles. Trash Source- Trash accumulation, litter Trash removed (cubic yards) FY2010/11- 0.198cy; FY2011/12- 0.545cy; FY2012/13- 0.297cy Frequency of hotspot cleanup- twice yearly to continue through 2022.
City of Belmont
28
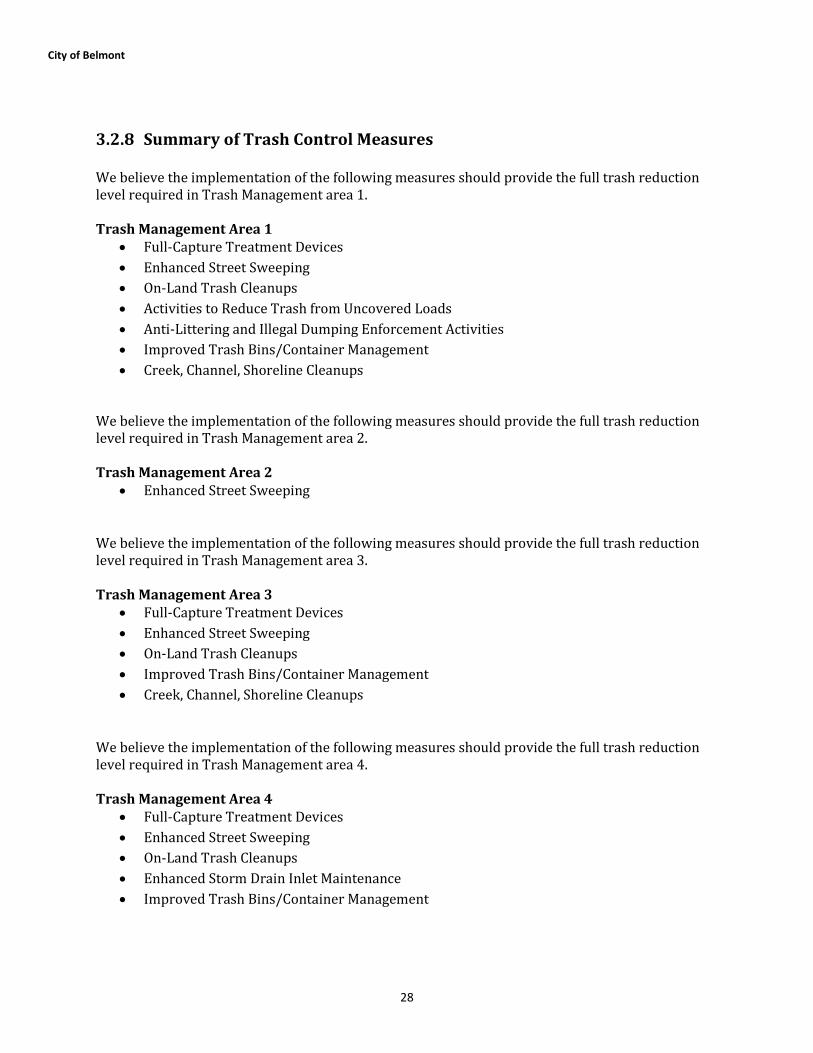
3.2.8 Summary of Trash Control Measures We believe the implementation of the following measures should provide the full trash reduction level required in Trash Management area 1. Trash Management Area 1
• Full-Capture Treatment Devices • Enhanced Street Sweeping • On-Land Trash Cleanups • Activities to Reduce Trash from Uncovered Loads • Anti-Littering and Illegal Dumping Enforcement Activities • Improved Trash Bins/Container Management • Creek, Channel, Shoreline Cleanups
We believe the implementation of the following measures should provide the full trash reduction level required in Trash Management area 2. Trash Management Area 2
• Enhanced Street Sweeping
We believe the implementation of the following measures should provide the full trash reduction level required in Trash Management area 3. Trash Management Area 3
• Full-Capture Treatment Devices • Enhanced Street Sweeping • On-Land Trash Cleanups • Improved Trash Bins/Container Management • Creek, Channel, Shoreline Cleanups
We believe the implementation of the following measures should provide the full trash reduction level required in Trash Management area 4. Trash Management Area 4
• Full-Capture Treatment Devices • Enhanced Street Sweeping • On-Land Trash Cleanups • Enhanced Storm Drain Inlet Maintenance • Improved Trash Bins/Container Management
Long-Term Trash Load Reduction Plan
29
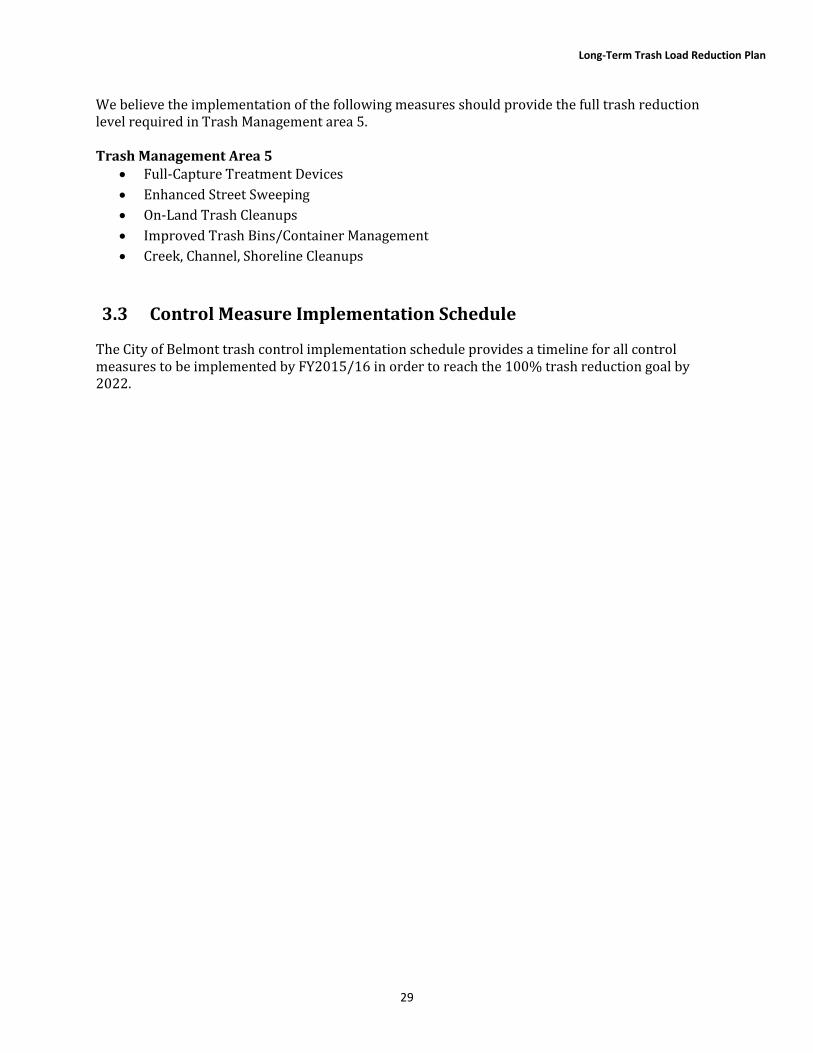
We believe the implementation of the following measures should provide the full trash reduction level required in Trash Management area 5. Trash Management Area 5
• Full-Capture Treatment Devices • Enhanced Street Sweeping • On-Land Trash Cleanups • Improved Trash Bins/Container Management • Creek, Channel, Shoreline Cleanups
3.3 Control Measure Implementation Schedule
The City of Belmont trash control implementation schedule provides a timeline for all control measures to be implemented by FY2015/16 in order to reach the 100% trash reduction goal by 2022.
City of Belmont
30
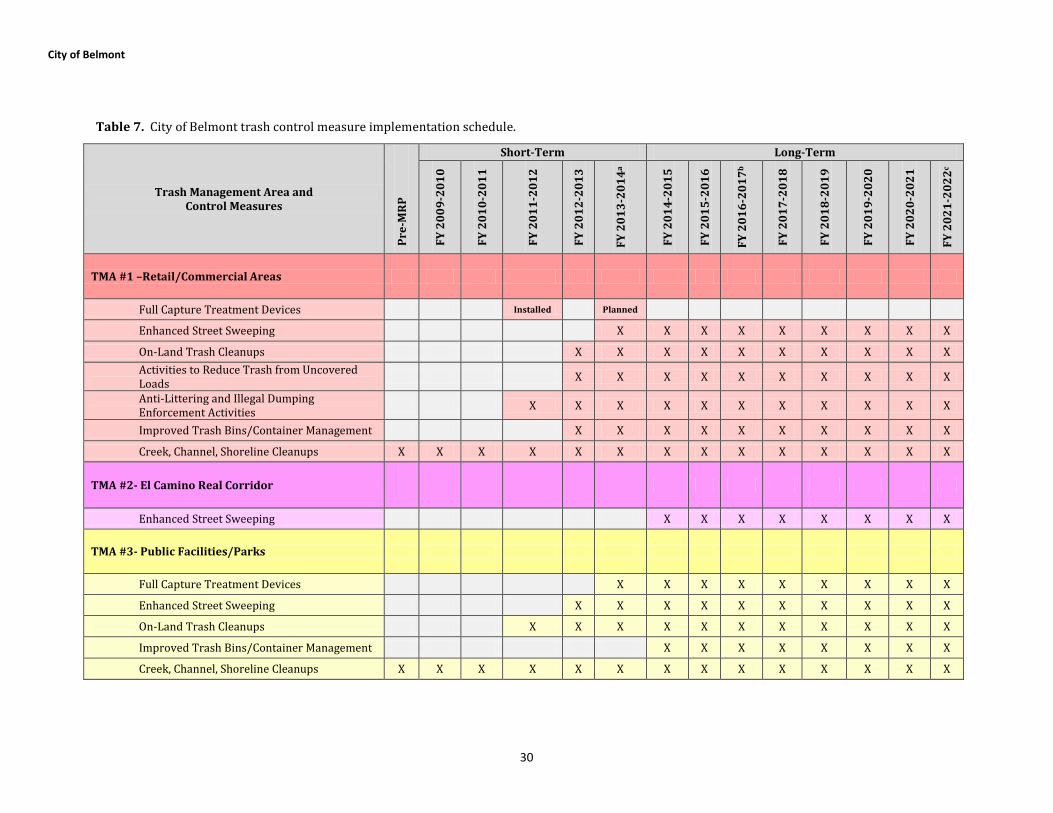
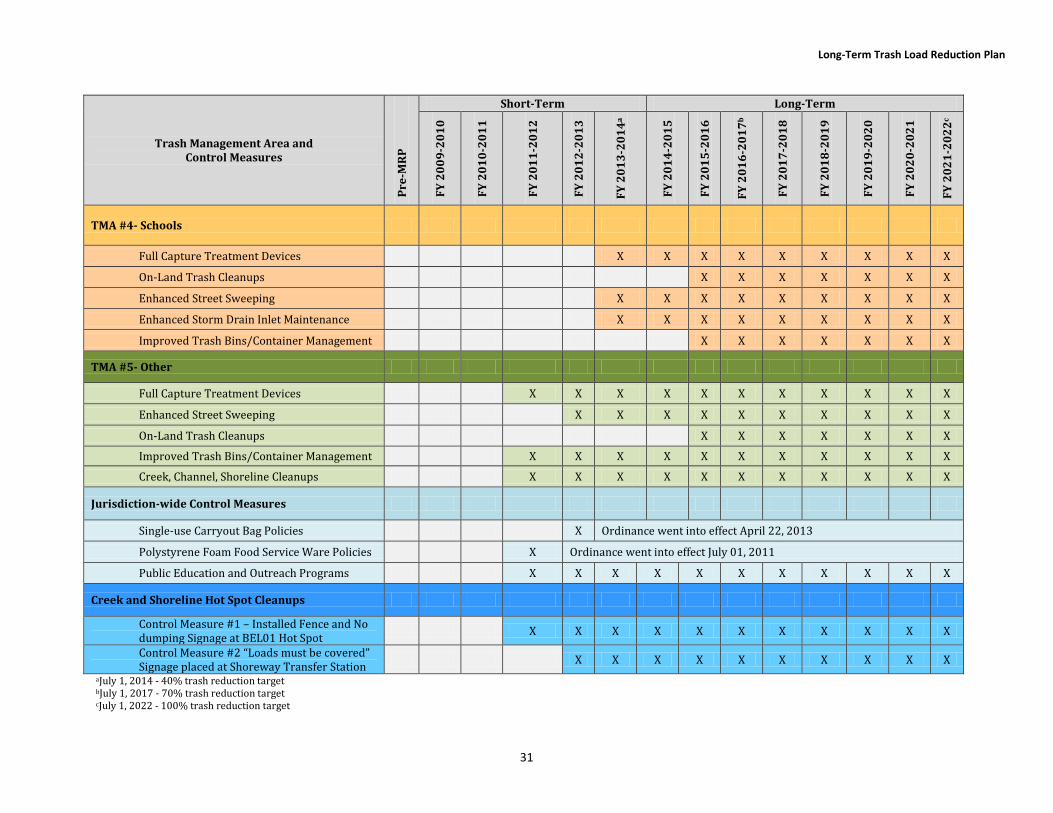
Table 7. City of Belmont trash control measure implementation schedule.
Trash Management Area and Control Measures
Pre-
MRP
Short-Term Long-Term
FY 2
009-
2010
FY 2
010-
2011
FY 2
011-
2012
FY 2
012-
2013
FY 2
013-
2014
a
FY 2
014-
2015
FY 2
015-
2016
FY 2
016-
2017
b
FY 2
017-
2018
FY 2
018-
2019
FY 2
019-
2020
FY 2
020-
2021
FY 2
021-
2022
c
TMA #1 –Retail/Commercial Areas
Full Capture Treatment Devices Installed Planned
Enhanced Street Sweeping X X X X X X X X X
On-Land Trash Cleanups X X X X X X X X X X Activities to Reduce Trash from Uncovered Loads X X X X X X X X X X
Anti-Littering and Illegal Dumping Enforcement Activities X X X X X X X X X X X
Improved Trash Bins/Container Management X X X X X X X X X X
Creek, Channel, Shoreline Cleanups X X X X X X X X X X X X X X
TMA #2- El Camino Real Corridor
Enhanced Street Sweeping X X X X X X X X
TMA #3- Public Facilities/Parks
Full Capture Treatment Devices X X X X X X X X X
Enhanced Street Sweeping X X X X X X X X X X
On-Land Trash Cleanups X X X X X X X X X X X
Improved Trash Bins/Container Management X X X X X X X X
Creek, Channel, Shoreline Cleanups X X X X X X X X X X X X X X
Long-Term Trash Load Reduction Plan
31
Trash Management Area and Control Measures
Pre-
MRP
Short-Term Long-Term
FY 2
009-
2010
FY 2
010-
2011
FY 2
011-
2012
FY 2
012-
2013
FY 2
013-
2014
a
FY 2
014-
2015
FY 2
015-
2016
FY 2
016-
2017
b
FY 2
017-
2018
FY 2
018-
2019
FY 2
019-
2020
FY 2
020-
2021
FY 2
021-
2022
c
TMA #4- Schools
Full Capture Treatment Devices X X X X X X X X X
On-Land Trash Cleanups X X X X X X X
Enhanced Street Sweeping X X X X X X X X X
Enhanced Storm Drain Inlet Maintenance X X X X X X X X X
Improved Trash Bins/Container Management X X X X X X X
TMA #5- Other
Full Capture Treatment Devices X X X X X X X X X X X
Enhanced Street Sweeping X X X X X X X X X X
On-Land Trash Cleanups X X X X X X X
Improved Trash Bins/Container Management X X X X X X X X X X X
Creek, Channel, Shoreline Cleanups X X X X X X X X X X X
Jurisdiction-wide Control Measures
Single-use Carryout Bag Policies X Ordinance went into effect April 22, 2013
Polystyrene Foam Food Service Ware Policies X Ordinance went into effect July 01, 2011
Public Education and Outreach Programs X X X X X X X X X X X
Creek and Shoreline Hot Spot Cleanups
Control Measure #1 – Installed Fence and No dumping Signage at BEL01 Hot Spot X X X X X X X X X X X
Control Measure #2 “Loads must be covered” Signage placed at Shoreway Transfer Station X X X X X X X X X X
aJuly 1, 2014 - 40% trash reduction target bJuly 1, 2017 - 70% trash reduction target cJuly 1, 2022 - 100% trash reduction target
Long-Term Trash Load Reduction Plan
32
4.0 PROGRESS ASSESSMENT STRATEGY Provision C.10.a.ii of the MRP requires Permittees to develop and implement a trash load reduction tracking method that will be used to account for trash load reduction actions and to demonstrate progress and attainment of trash load reduction targets. Early into the MRP, Permittees decided to work collaboratively to develop a trash load reduction tracking method through the Bay Area Stormwater Management Agencies Association (BASMAA). Permittees, Water Board staff and other stakeholders assisted in developing Version 1.0 of the tracking method. On behalf of all MRP Permittees, the Bay Area Stormwater Management Agencies Association (BASMAA) submitted Version 1.0 to the Water Board on February 1, 2012. The Trash Assessment Strategy (Strategy) described in this section is intended to serve as Version 2.0 of the trash tracking method and replace version 1.0 previously submitted to the Water Board. The Strategy is specific to Permittees participating in the San Mateo Countywide Water Pollution Prevention Program (SMCWPPP), including the City of Belmont. The City intends to implement the Strategy in phases and at multiple geographical scales (i.e., jurisdiction-wide and trash management area) in collaboration with SMCWPPP. Pilot implementation is scheduled for the near-term and as assessment methods are tested and refined, the Strategy will be adapted into a longer-term approach. The Strategy selected by the City is described in the following sections.
4.1 SMCWPPP Pilot Assessment Strategy
The following SMCWPPP Pilot Trash Assessment Strategy (SMCWPPP Pilot Strategy) was developed by SMCWPPP on behalf of the City and other San Mateo County Permittees. The SMCWPPP Pilot Strategy will be implemented at a pilot scale on a countywide basis and includes measurements and observations in the City of Belmont.
4.1.1 Management Questions The SMCWPPP Pilot Strategy is intended to answer the following core management questions over time as trash control measures outlined in section 3.0 are implemented and refined:
• Are the MS4 trash load reduction targets being achieved?
• Have trash problems in receiving waters been resolved?
• If trash problems in receiving waters exist, what are the important sources and transport pathways?
The SMCWPPP Pilot Strategy, including indicators and methods, is summarized in this section and fully described in the SMCWPPP Pilot Trash Assessment Strategy, a compendium document submitted to the Water Board on February 1, 2014 on behalf of all SMCWPPP Permittees (SMCWPPP 2014).
4.1.2 Indicators of Progress and Success The management questions listed in the previous section will be addressed by tracking information and collecting data needed to report on a set of key environmental indicators. Environmental indicators are simple measures that communicate what is happening in the environment. Since trash in the environment is very complex, indicators provide a more practical and economical way to track the state of the environment than if we attempted to record every possible variable.
Long-Term Trash Load Reduction Plan
33
With regard to municipal stormwater trash management, indicators are intended to detect progress towards trash load reduction targets and solving trash problems. Ideally, indicators should be robust and able to detect progress that is attributable to multiple types of trash control measure implementation scenarios. Assessment results should also provide Permittees with an adequate level of confidence that trash load reductions from MS4s have occurred, while also assessing whether trash problems in receiving waters have been resolved. Indicators must also be cost effective, relatively easy to generate, and understandable to stakeholders. Primary and secondary indicators that SMCWPPP Permittees will use to answer core management questions include:
Primary Indicators:
1-A Reduction in the level of trash present on-land and available to MS4s 1-B Effective full capture device operation and maintenance
Secondary Indicators:
2-A Successful levels of trash control measures implementation 2-B Reductions in the amount of trash in receiving waters
In selecting the indicators above, the City of Belmont in collaboration with SMCWPPP and other SMCWPPP Permittees recognize that no one environmental indicator will provide the information necessary to effectively determine progress made in reducing trash discharged from MS4s and improvements in the level of trash in receiving waters. Multiple indicators were therefore selected. The ultimate goal of municipal stormwater trash reduction strategies is to reduce the impacts of trash associated with MS4s on receiving waters. Indicators selected to assess progress towards this goal should ideally measure outcomes (e.g., reductions in trash discharged). The primary indicators selected by SMCWPPP are outcome-based and include those that are directly related to MS4 discharges. Secondary indicators are outcome or output-based and are intended to provide additional perspective on and evidence of, successful trash control measure implementation and improvements in receiving water condition with regard to trash. As described in Section 2.2, trash is transported to receiving waters from pathways other than MS4s, which may confound our ability to observe MS4-associated reductions in creeks and shorelines. Due to this challenge of linking MS4 control measure implementation to receiving water conditions, the receiving water based indicator is currently considered a secondary indicator. Evaluations of data on the amount of trash in receiving waters that are conducted over time through the Pilot Assessment Strategy will assist the City in further determinations of the important sources and pathways causing problems in local creeks, rivers and shorelines.
4.1.3 Pilot Assessment Methods This section briefly summarizes the preliminary assessment methods that the City of Belmont will implement through the SMCWPPP Pilot Strategy to generate indicator information described in the previous section. Additional information on each method can be found in the SMCWPPP Pilot Trash Assessment Strategy submitted to the Water Board by SMCWPPP on behalf of the City.
City of Belmont
34
1-A. On-land Visual Assessments
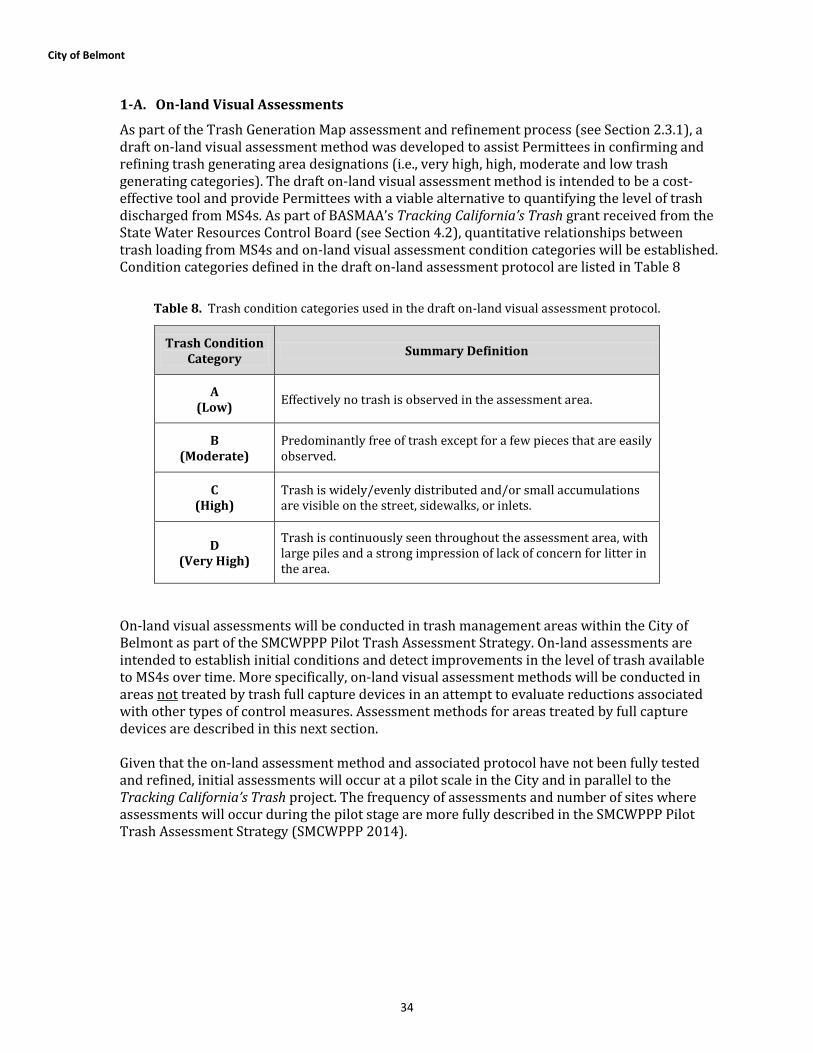
As part of the Trash Generation Map assessment and refinement process (see Section 2.3.1), a draft on-land visual assessment method was developed to assist Permittees in confirming and refining trash generating area designations (i.e., very high, high, moderate and low trash generating categories). The draft on-land visual assessment method is intended to be a cost-effective tool and provide Permittees with a viable alternative to quantifying the level of trash discharged from MS4s. As part of BASMAA’s Tracking California’s Trash grant received from the State Water Resources Control Board (see Section 4.2), quantitative relationships between trash loading from MS4s and on-land visual assessment condition categories will be established. Condition categories defined in the draft on-land assessment protocol are listed in Table 8
Table 8. Trash condition categories used in the draft on-land visual assessment protocol.
Trash Condition Category Summary Definition
A (Low) Effectively no trash is observed in the assessment area.
B (Moderate)
Predominantly free of trash except for a few pieces that are easily observed.
C (High)
Trash is widely/evenly distributed and/or small accumulations are visible on the street, sidewalks, or inlets.
D (Very High)
Trash is continuously seen throughout the assessment area, with large piles and a strong impression of lack of concern for litter in the area.
On-land visual assessments will be conducted in trash management areas within the City of Belmont as part of the SMCWPPP Pilot Trash Assessment Strategy. On-land assessments are intended to establish initial conditions and detect improvements in the level of trash available to MS4s over time. More specifically, on-land visual assessment methods will be conducted in areas not treated by trash full capture devices in an attempt to evaluate reductions associated with other types of control measures. Assessment methods for areas treated by full capture devices are described in this next section. Given that the on-land assessment method and associated protocol have not been fully tested and refined, initial assessments will occur at a pilot scale in the City and in parallel to the Tracking California’s Trash project. The frequency of assessments and number of sites where assessments will occur during the pilot stage are more fully described in the SMCWPPP Pilot Trash Assessment Strategy (SMCWPPP 2014).
Long-Term Trash Load Reduction Plan
35
1-B. Full Capture Operation and Maintenance Verification Consistent with the MRP, adequate inspection and maintenance of trash full capture devices is required to maintain full capture designation by the Water Board. The City of Belmont is currently developing an operation and maintenance verification program (Trash O&M Verification Program), via SMCWPPP, to ensure that devices are inspected and maintained at a level that maintains this designation. The SMCWPPP Trash O&M Verification Program will be modeled on the current O&M verification program for stormwater treatment controls implemented consistent with the Permit new and redevelopment requirements. Additional details regarding the Trash O&M Verification Program can be found in the SMCWPPP Pilot Trash Assessment Strategy (SMCWPPP 2014). 2-A. Control Measure Effectiveness Evaluations
In addition to on-land trash assessments and full capture operation and maintenance verification, the City will also conduct assessments of trash control measures implemented within their jurisdictional area. Assessment methods will be selected based on trash sources and the type of control measure being implemented. Control measure effectiveness evaluations are more fully described in the SMCWPPP Pilot Trash Assessment Strategy. The following are example assessment methods that may be used to demonstrate successful control measure implementation and progress towards trash reduction targets:
• Product-related Ordinances – Annually tracking and reporting the % of businesses in compliance with the ordinance and the percentage requiring a response.
• Street Sweeping – Reporting the frequency of sweeping and ability to sweep to the curb in specific areas where enhanced sweeping is implemented; and/or documenting the level of trash on streets directly after street sweeping during wet and dry weather seasons.
• Public/Private Trash Container Management – Reporting the magnitude and extent of enhanced actions; and/or visually assessing and documenting conditions around public trash containers before and after implementing enhanced control measures.
• Targeted Outreach and Enforcement – Reporting the magnitude and extent of enhanced actions; tracking and reporting the % increase in enforcement actions; and/or visually assessing and documenting the conditions in targeted areas before and after implementing control measures.
• Public Outreach Campaigns – Reporting the magnitude and extent of enhanced actions, and/or conducting pre and post campaign surveys.
• On-land Cleanups and Enforcement – Reporting the magnitude and extent of enhanced actions; visually assessing and documenting the conditions in targeted areas before and after control measure implementation; and/or tracking the volumes of trash removed.
• Illegal Dumping Prevention – Reporting the magnitude and extent of enhanced actions; and/or tracking and reporting improvements in the number of incidents.
• Business Improvement Districts – Reporting the magnitude and extent of enhanced actions; and/or visually assessing and documenting the conditions in BID areas before and after implementing control measures.

City of Belmont
36
• Prevention of Uncovered Loads - Reporting the magnitude and extent of enhanced actions; tracking and reporting the decreases in the number of incidents; and/or visually assessing and documenting the conditions in targeted areas before and after implementing control measures.
• Partial Capture Devices – Reporting the magnitude and extent of enhanced actions; and/or visually assessing and the amount of trash in storm drains or downstream of partial capture devices.
2-C. Receiving Water Condition Assessments
The ultimate goal of stormwater trash management in the Bay Area is to significantly reduce the amount of trash found in receiving waters. In the last decade, San Mateo County Permittees and volunteers have collected data on the amounts of trash removed during cleanup events. More recently, Permittees have conducted trash assessments in creek and shoreline hotspots using standardized assessment methods. In an effort to answer the core management question Have trash problems in receiving waters been resolved?, the City of Belmont plans to continue conducting receiving water condition assessments at trash hot spots a minimum of one time per year. Assessment will be conducted consistent with Permit hot spot cleanup and assessment requirements. Additional information on receiving water assessment methods can be found in the SMCWPPP Pilot Trash Assessment Strategy (SMCWPPP 2014).
4.2 BASMAA “Tracking California’s Trash” Project
The SMCWPPP Pilot Assessment Strategy described in the previous section recognizes that outcome-based trash assessment methods needed to assess progress toward trash reduction targets are not well established by the scientific community. In an effort to address these information gaps associated with trash assessment methods, the Bay Area Stormwater Management Agencies Association (BASMAA), in collaboration with SMCWPPP, the 5 Gyres Institute, San Francisco Estuary Partnership, the City of Los Angeles, and other stormwater programs in the Bay Area, developed the Tracking California’s Trash Project. The Project is funded through a Proposition 84 grant awarded to BASMAA by the State Water Resources Control Board (SWRCB) who recognized the need for standardized trash assessment methods that are robust and cost-effective. The Project is intended to assist BASMAA member agencies in testing trash assessment and monitoring methods needed to evaluate trash levels in receiving waters, establish control measures that have an equivalent performance to trash full capture devices, and assess progress in trash reduction over time. The following sections provide brief descriptions of tasks that BASMAA will conduct via the three-year Project. Full descriptions of project scopes, deliverables, and outcomes will be developed as part of the task-specific Sampling and Analysis Plans required by the SWRCB during the beginning of the Project. The Project is currently underway and will continue through 2016.

Long-Term Trash Load Reduction Plan
37
4.2.1 Testing of Trash Monitoring Methods BASMAA and the 5 Gyres Institute will evaluate the following two types of assessment methods as part of the Project:
• Trash Flux Monitoring – Trash flux monitoring is intended quantify the amount of trash flowing in receiving waters under varying hydrological conditions. Flux monitoring will be tested in up to four receiving water bodies in San Francisco Bay and/or the Los Angeles areas. Methods selected for evaluation and monitoring will be based on a literature review conducted during this task and through input from technical advisors and stakeholders. Monitoring is scheduled to begin in 2014 and will be completed in 2016.
• On-land Visual Assessments – As part of the Project, BASMAA will also conduct an evaluation of on-land visual assessment methods that are included in the SMCWPPP Pilot Assessment Strategy. The methods are designed to determine the level of trash on streets and public right-of-ways that may be transported to receiving waters via MS4s. BASMAA plans to conduct field work associated with the evaluation of on-land visual assessment at a number of sites throughout the region. To the extent practical, sites where the on-land methods evaluations take place will be coordinated with trash flux monitoring in receiving waters. On-land assessments will occur in areas that drain to trash full capture devices, and all sites will be assessed during wet and dry weather seasons in order to evaluate on-land methods during varying hydrologic conditions. Monitoring is scheduled to begin in 2014 and will be completed in 2016.
4.2.2 Full Capture Equivalent Studies Through the implementation of BASMAA’s Tracking California’s Trash grant-funded project, a small set of “Full Capture Equivalent” projects will also be conducted in an attempt to demonstrate that specific combinations of control measures will reduce trash to a level equivalent to full capture devices. Initial BMP combinations include high-frequency street sweeping, and enhanced street sweeping with auto-retractable curb inlet screens. Other combinations will also be considered. Studies are scheduled to begin in 2014 and will be completed in 2016.
4.3 Long-Term Assessment Strategy
The City of Belmont is committed to implementing standardized assessment methods post-2016 based on the lessons learned from pilot assessments and studies that will occur between 2014 and 2016. Assessment activities described in the previous sections will evaluate the utility of different assessment methods to demonstrate progress towards trash reduction targets and provide recommended approaches for long-term implementation. Lessons learned will be submitted to the Water Board with the FY 2015-2016 Annual Report and a revised Strategy will be developed and submitted, if necessary. The revised Strategy will include agreed upon assessment methods that will be used to demonstrate progress during the remaining term of trash reduction requirements. Reporting using the new/revised methods will begin with the FY 2016-17 Annual Report.
4.4 Implementation Schedule
The implementation schedule for the SMCWPPP Pilot Implementation Strategy, BASMAA’s Tracking California’s Trash project, and the Long-Term Assessment Strategy are included in Table 9. Load reduction reporting milestones are also denoted in the table. The schedule is consistent with the need for near-term pilot assessment results to demonstrate progress toward short-term targets,
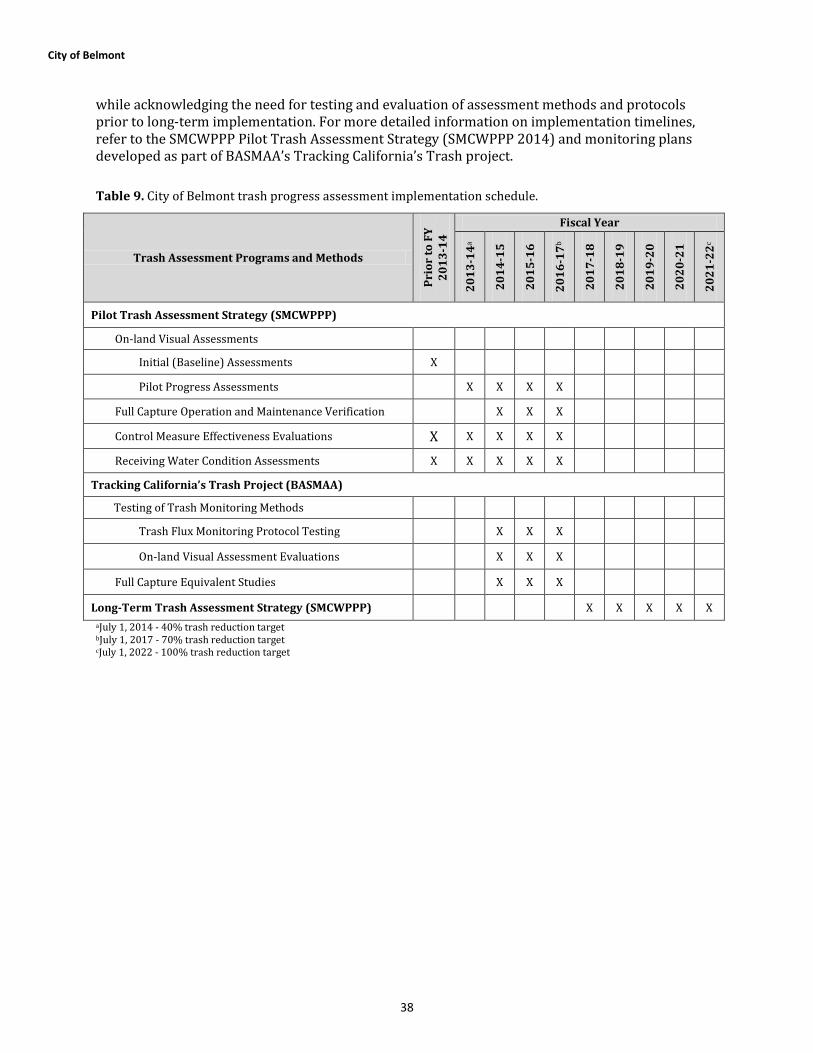
City of Belmont
38
while acknowledging the need for testing and evaluation of assessment methods and protocols prior to long-term implementation. For more detailed information on implementation timelines, refer to the SMCWPPP Pilot Trash Assessment Strategy (SMCWPPP 2014) and monitoring plans developed as part of BASMAA’s Tracking California’s Trash project.
Table 9. City of Belmont trash progress assessment implementation schedule.
Trash Assessment Programs and Methods
Prio
r to
FY
2013
-14
Fiscal Year
2013
-14a
2014
-15
2015
-16
2016
-17b
2017
-18
2018
-19
2019
-20
2020
-21
2021
-22c
Pilot Trash Assessment Strategy (SMCWPPP)
On-land Visual Assessments Initial (Baseline) Assessments X Pilot Progress Assessments X X X X
Full Capture Operation and Maintenance Verification X X X Control Measure Effectiveness Evaluations X X X X X Receiving Water Condition Assessments X X X X X
Tracking California’s Trash Project (BASMAA)
Testing of Trash Monitoring Methods
Trash Flux Monitoring Protocol Testing X X X On-land Visual Assessment Evaluations X X X
Full Capture Equivalent Studies X X X Long-Term Trash Assessment Strategy (SMCWPPP) X X X X X
aJuly 1, 2014 - 40% trash reduction target bJuly 1, 2017 - 70% trash reduction target cJuly 1, 2022 - 100% trash reduction target
Long-Term Trash Load Reduction Plan
39
5.0 REFERENCES Allison R.A. and F.H.S. Chiew 1995. Monitoring stormwater pollution from various land uses in an urban catchment.
Proceedings from the 2nd International Symposium on Urban Stormwater Management, Melbourne, 551-516.
Allison, R.A., T.A. Walker, F.H.S. Chiew, I.C. O’Neill and T.A McMahon 1998. From Roads to rivers: Gross pollutant removal from urban waterways. Report 98/6. Cooperative Research Centre for Catchment Hydrology. Victoria, Australia. May 1998.
Armitage, N. 2003. The removal of urban solid waste from stormwater drains. Prepared for the International Workshop on Global Developments in Urban Drainage Management, Indian Institute of Technology, Bombay, Mumbai India. 5-7 February 2003.
Armitage, N. 2007. The reduction of urban litter in the stormwater drains of South Africa. Urban Water Journal Vol. 4, No. 3: 151-172. September 2007.
Armitage N., A. Rooseboom, C. Nel, and P. Townshend 1998. “The removal of Urban Litter from Stormwater Conduits and Streams. Water Research Commission (South Africa) Report No. TT 95/98, Prestoria.
Armitage, N. and A. Rooseboom 2000. The removal of urban litter from stormwater conduits and streams: Paper 1 – The quantities involved and catchment litter management options. Water S.A. Vol. 26. No. 2: 181-187.
ABAG (Association of Bay Area Governments). 2005. Bay Area Land Use Geographical Information Systems Datalayer.
BASMAA (Bay Area Stormwater Management Agencies Association). 2011a. Progress Report on Methods to Estimate Baseline Trash Loads from Bay Area Municipal Stormwater Systems and Track Loads Reduced. February 2011.
BASMAA (Bay Area Stormwater Management Agencies Association). 2011b. Method to Estimate Baseline Trash Loads from Bay Area Municipal Stormwater Systems: Technical Memorandum #1. Prepared by EOA, Inc. April 2011.
BASMAA (Bay Area Stormwater Management Agencies Association). 2011c. Sampling and Analysis Plan. Prepared by EOA, Inc. April 2011.
BASMAA (Bay Area Stormwater Management Agencies Association). 2012. Trash Baseline Generation Rates: Technical Report. Prepared by EOA, Inc. February 1, 2012.
County of Los Angeles. 2002. Los Angeles County Litter Monitoring Plan for the Los Angeles River and Ballona Creek Trash Total Maximum Daily Load. May 30, 2002.
County of Los Angeles. 2004a. Trash Baseline Monitoring Results Los Angles River and Ballona Creek Watershed. Los Angeles County Department of Public Works. February 17, 2004.
County of Los Angeles 2004b. Trash Baseline Monitoring for Los Angles River and Ballona Creek Watersheds. Los Angeles County Department of Public Works. May 6, 2004.
Kim, L.H, M. Kayhanian, M.K. Stenstrom 2004. Event mean concentration and loading of litter from highways during storms. Science of the Total Environment Vol 330: 101-113.
Lippner, G., R. Churchwell, R. Allison, G. Moeller, and J. Johnston 2001. A Scientific Approach to Evaluating Storm Water Best Management Practices for Litter. Transportation Research Record. TTR 1743, 10-15.
SMCWPPP (San Mateo Countywide Water Pollution Prevention Program). 2014. Pilot Trash Assessment Strategy. Prepared by EOA. February 1.