Embed Size (px)
Citation preview
Long-term tree population dynamics and theirimplications for the conservation of the KakamegaForest, Kenya
PETER J. FASHING1,2,*, ALISON FORRESTEL1, CHRISTINA SCULLY1 andMARINA CORDS1
1Department of Ecology, Evolution, and Environmental Biology, Columbia University, 1200 AmsterdamAvenue, New York, NY 10027, USA; 2Department of Science and Conservation, Pittsburgh Zoo and PPGAquarium, One Wild Place, Pittsburgh, PA 15206, USA; *Author for correspondence (e-mail:[email protected])
Received 8 July 2002; accepted in revised form 24 February 2003
Key words: Cattle, Conservation, Human disturbance, Selective logging, Tropical forest
Abstract. Long-term studies of tree population dynamics play an important role in identifying the con-servation needs of tropical forest ecosystems. We examined changes in tree population structure andcomposition over an 18-year period (1981–1999) in three plots located at the center of the Isechenostudy site in the Kakamega Forest, Kenya, a forest with a history of logging and other anthropogenicdisturbance. DBH size class distribution took the shape of an ‘inverse J’ curve in both 1981 and 1999and did not differ significantly between the two study periods. Stem density increased significantly dur-ing the study with most of the increase occurring in the smallest stem size class (10–14 cm DBH).Nearly all of the most common species in 1981 remained among the most common in 1999, though thedensity of pioneer species decreased by 21% during the study. Our results suggest that forest in thestudy plots remained relatively undisturbed and in good condition over the study period. Forest in theplots also appeared still to be recovering from the selective logging of large trees that took place atIsecheno in the 1940s. In addition to our longitudinal study, we compared tree population parameters atthree additional Isecheno sites spread over a distance of � 1 km that have experienced different histo-ries of disturbance: (i) a lightly human disturbed site (LHD), (ii) a heavily human disturbed site (HHD),and (iii) a cattle disturbed site (CD). While all three sites were selectively logged in the 1940s, the mainsigns of disturbance today are footpaths at the LHD site, tree stumps at the HHD site, and wide cattlepaths at the CD site. Not surprisingly, of the disturbed sites, the LHD site was in the best condition.Trees at the HHD site exhibited extremely poor recruitment into the small size classes, a condition thatcan probably be attributed to human exploitation of small trees for poles. The CD site appeared to be atan earlier successional stage than the other disturbed sites with its low mean DBH, high overall stemdensity, and high pioneer species stem density. Browsing and trampling of vegetation by cattle may bethe source of the light gaps that have led to the abundance of pioneer species at this site. We concludethat conservation measures applied to central Isecheno, including the establishment of a forest stationnearby and ranger patrols, appear to have succeeded, but that the prognosis for the Kakamega Forest ingeneral is bleak if protection efforts are not increased in other parts of the forest, where anthropogenicdisturbance remains high. We also note the considerable variation in tree population structure and com-position that can occur within a small area depending on the local history of disturbance.
© 2004 Kluwer Academic Publishers. Printed in the Netherlands.Biodiversity and Conservation 13: 753–771, 2004.
Introduction
Tropical forest ecosystems are important because they act as reservoirs of biodi-versity, timber, medicinal plants, and oxygen, and play a critical role in watershedprotection (Richards 1996). Over the past century, growing human populations haveput increasing pressure on tropical forests, threatening to do irreversible damage tothese ecosystems. Long-term studies of tree population dynamics are critical to in-creasing our understanding of the conservation needs of tropical forest ecosystems(Hubbell and Foster 1992; Condit 1995; Sheil et al. 2000). At least one such studyhas been conducted in each of the major categories of tropical forests on earth(Condit 1995), yet the number of forests where long-term tree population dynamicshave been studied is still relatively small (Connell et al. 1984; Lieberman and Lie-berman 1987; Manokaran and Kochummen 1987; Milton et al. 1994; Taylor et al.1996; Chapman et al. 1997; Lwanga et al. 2000; Hart 2001; Sheil 2001). With thehigh rate of forest loss and degradation in many tropical regions, studies of long-term dynamics in forests threatened by human activities are particularly valuable.
Humans have affected tropical rainforests in many ways, particularly throughlogging and agriculture (Whitmore 1984). Several studies have examined the long-term effects of logging on forest structure and composition (Cannon et al. 1994;Plumptre 1996; Chapman and Chapman 1997; Struhsaker 1997). Studies from for-ests in Uganda in particular have shown that tree regeneration may remain pooreven >20 years after logging subsides (Struhsaker 1997), and that forest structurerequires >50 years to return to pre-logging conditions (Plumptre 1996). Severalstudies have also been conducted on the influence of shifting cultivation on forestregeneration. The results of these studies suggest that the rate at which tree regen-eration proceeds after agricultural disturbance varies widely between sites, therebyrendering it difficult to predict the rate of recovery for any particular site (Uhl andJordan 1984; Saldarriaga et al. 1988; Chapman and Chapman 1999; Duncan andChapman 1999).
As in most tropical countries where human populations are increasing rapidly,forest conservation is a critical issue in Kenya (Rugene 2001; Opala 2002). By thelate 1980s/early 1990s only 2% of Kenya remained covered by indigenous forest(Wass 1995), and 80% of this remaining forest cover occurred in agricultural areaswith high human densities (Tsingalia 1988). This scenario has produced an ongo-ing conflict between attempts at forest conservation and the land use needs of Ken-ya’s increasing human population (Tsingalia 1988; Wass 1995). A forest that epito-mizes this conflict is the Kakamega Forest, Kenya’s only remaining Guineo-Con-golian rainforest (Cords and Tsingalia 1982; Kokwaro 1988; Tsingalia 1988). TheKakamega Forest is one of the most important reservoirs of biodiversity in Kenya(Wass 1995), yet it is surrounded by a human population whose density exceeds175 individuals/km2 (Tsingalia 1988).
The high human density in the Kakamega area has led to considerable long-termhuman influence on the forest (Tsingalia 1988; Wass 1995). For example, localpeople have long used the forest as a thoroughfare for herding cattle to grasslandsin the forest interior and as a source of charcoal, fuelwood, gold, honey, medicinal
754
plants, and construction materials (Wass 1995). Furthermore, selective logging op-erations took place in the forest from the 1930s to 1982, though few official recordsof this logging have been preserved (Tsingalia 1988). Disturbance levels, however,are not uniform throughout the forest (Kiama and Kiyiapi 2001; personal observa-tion). Several sites, including the site of Isecheno where one of us (M.C.) has beenconducting research on nonhuman primates for >20 years, have been afforded someprotection via the establishment of forest stations, ranger patrols, and a 1982 presi-dential decree banning all indigenous tree species exploitation (Tsingalia 1988).
In this paper, we attempt to infer the extent to which these conservation mea-sures have succeeded in protecting the forest at Isecheno over the past two decadesby examining both temporal changes and geographical differences in forest struc-ture and composition. First, we use data from vegetation plots established at thecenter of Isecheno in 1981 and resampled in 1999 to examine changes in the treepopulation over this period. Second, we compare the results of tree censuses inlightly human disturbed areas at the center of Isecheno with those from currentlyheavily human disturbed areas and areas intensively used as cattle thoroughfareson the periphery of the site. As the first long-term study of tree population dynam-ics at Kakamega, our results have important implications for the conservation pros-pects of this forest. Furthermore, the nature of disturbance at Kakamega (e.g. polecutting, cattle grazing, past logging) is typical of many managed rainforests andour results may therefore help inform management decisions in other disturbedrainforests as well.
Methods
Study site
Research was conducted at Isecheno study site in the central region of the Kaka-mega Forest in western Kenya (0°19� N; 34°52� E; Elevation 1580 m), � 40 kmNW of Lake Victoria. Though the forest encompasses 240 km2, only � 100 km2 ofthis area is actually covered by indigenous forest (Brooks et al. 1999). The remain-ing portion of the reserve consists of plantations, tea fields, and grasslands (Wass1995). The indigenous forest at Kakamega has been fragmented into at least twoblocks, the largest of which is 86 km2 and includes Isecheno (Brooks et al. 1999).Isecheno was selectively logged for very large trees in the 1940s (Cords 1987) andsuffers from some illegal exploitation (tree felling for poles, liana cutting for re-moval of dead firewood, honey harvesting) by local people, particularly on its pe-riphery (Cords and Tsingalia 1982; Kokwaro 1988; Tsingalia 1988; personal obser-vation).
Tsingalia (1988) describes the Kakamega Forest as consisting of four layers: topcanopy, middle canopy, lower canopy, and herb layer. In most areas, includingIsecheno, the canopy is somewhat open and emergents rarely exceed 45 m. Basedon lists compiled by Tsingalia (1988) and Mutangah et al. (1992), pioneer species
755
at Kakamega include Acanthus sp., Albizia grandibracteata, A. gummifera, Bride-lia micrantha, Celtis africana, Croton macrostachyus, C. megalocarpus, Dombeyaburgessiae, Erythrina abyssinica, Harungana madagascariensis, Maesa lanceolata,Markhamia lutea, Polyscias fulva, Solanum giganteum, and Trema orientalis.
Rainfall at Kakamega averages approximately 2000 mm per year, with reportedfigures ranging from 1956 mm (Kokwaro 1988; Gathua 2000 – measured in anearby town over 40–60 years, from 1923 to 1998) to 2215 mm (Cords 1987 –measured at the study site, from 1976 to 1981). Average minimum monthly tem-peratures range from 11 to 21 °C while average maximum monthly temperaturesrange from 18 to 29 °C (Cords 1987).
Data collection
Long-term tree population dynamics in a single undisturbed areaChanges in tree population dynamics were studied over an 18-year period throughthe monitoring of three vegetation plots located at the center of Isecheno. Theseplots of 0.77 ha (Plot 1), 0.49 ha (Plot 2), and 0.49 ha (Plot 3) were established in1981 by Cords (1984). Plots were chosen so as not to be intersected by trailsthrough the forest and to be representative of the least disturbed areas of forest atIsecheno. Plots were broken down into 10 m × 10 m subplots and the perimeters ofthese subplots were demarcated with flagging. The species identity and girth atbreast height (GBH) of all trees � 30 cm GBH ( � 10 cm DBH) were recorded.GBH measurements were then converted to DBH values so as to be comparable tomost other studies of tropical rainforest tree populations (Condit 1995).
Cords’ three plots were relocated and recensused by Forrestel in 1999. Reloca-tion of these plots was made possible by the detailed descriptions of the plots’ lo-cations provided by Cords’ maps and field notes from 1981. The area surveyed inPlots 2 and 3 remained unchanged while the area surveyed in Plot 1 increasedslightly to 0.81 ha in 1999. Data on species identity, GBH, and DBH in 1999 weregathered via the same methods as in 1981.
Comparisons between areas with different disturbance regimesA study of tree population structure in peripheral regions of Isecheno with differentdisturbance regimes was conducted by Scully in 2000. Scully’s results from dis-turbed areas would ideally be compared with Forrestel’s 1999 results from rela-tively undisturbed areas. However, Scully enumerated trees along existing trails (i.e.transects) rather than in plots, thereby rendering comparisons between her resultsand Forrestel’s results problematic. We attempted to avoid this problem by com-paring Scully’s results to those produced from data collected by Fashing in 1998along existing trails in the same general area where Forrestel’s plots were located.Fashing’s transects were more disturbed than Forrestel’s plots by virtue of their fol-lowing existing trails, yet they could still be classified as relatively lightly disturbed(lightly human disturbed or LHD) since they are exploited primarily by humans asfootpaths. Trails were generally 1–2 m wide and used by monkey researchers, tour-
756
ists, forestry department personnel, and occasionally local people traveling throughthe forest.
In the studies by both Fashing and Scully, tree species identity and GBH wererecorded for all trees � 30 cm GBH whose trunks were located within 5 m on ei-ther side of the transect. GBH measurements were then converted to DBH values.Transects consisted of a series of adjacent 25 × 10 m segments that followed ex-isting trails through the forest. At Fashing’s LHD site, a total of nine transects werecensused through a relatively homogeneous area for a total of 4.15 ha surveyed.
In Scully’s study, two peripheral areas at Isecheno were evaluated. First, Scullycensused 0.85 ha of transects at a site (heavily human disturbed or HHD) whichwas located near a tea field and human settlement on the western edge of Isecheno.Local people are regularly spotted in this area and signs of ongoing forest disturb-ance (e.g. pole cutting and firewood collection) have been present throughout thepast two decades. Second, Scully censused 0.70 ha of transects at another site lo-cated deeper within the forest on the eastern periphery of Isecheno. Though it islocated further from human settlement and is therefore less accessible than the HHDsite, this second site (cattle disturbed or CD) has been used regularly over at leastthe last two decades as a cattle path by local people en route to a distant glade. TheHHD and CD sites are within � 0.5 km of the central Isecheno site censused byCords, Forrestel and Fashing, and were also subjected to the selective logging ofthe 1940s.
Data analysis
We updated the names of several species identified by Cords in 1981 to follow thetaxonomic conventions of Beentje (1994) used by the other authors of this paper.Basal area (BA) was not calculated for any of the sites discussed in this paper dueto the inclusion of both buttressed and non-buttressed trees in GBH measurements.Heavily buttressed trees do not make up a large proportion of the trees at Isecheno,but their inclusion in GBH measurements could nevertheless lead to large overes-timates of BA (Sheil 1995).
Species–area curves were generated by plotting cumulative number of speciesagainst area sampled using randomly selected 10 m × 10 m subplots in the plot-based studies and 50 m × 10 m subplots in the transect-based studies. Because thearea included in transect samples differed widely between sites, the rarefactionmethod was used to estimate species richness at these sites. Rarefaction was con-ducted using the free software program ‘Rarefact’ available online at http://www2.biology.ualberta.ca/jbrzusto/rarefact.php. Species diversity (H�) was calculated us-ing the Shannon–Wiener diversity index and species evenness (J) was calculatedvia the evenness index (Kent and Coker 1992). Because data were most often notnormally distributed, all statistical tests in this paper are nonparametric and two-tailed. Significance level was set at P � 0.05 for all tests.
757
Results
Long-term forest dynamics in central Isecheno
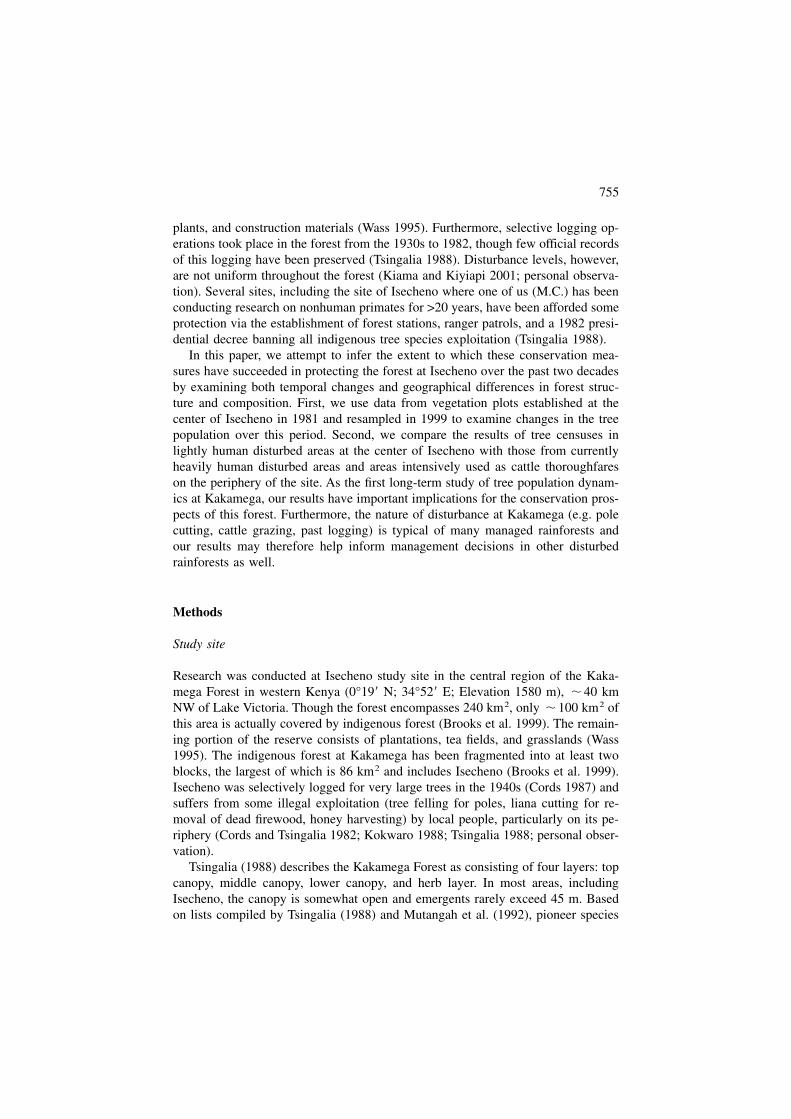
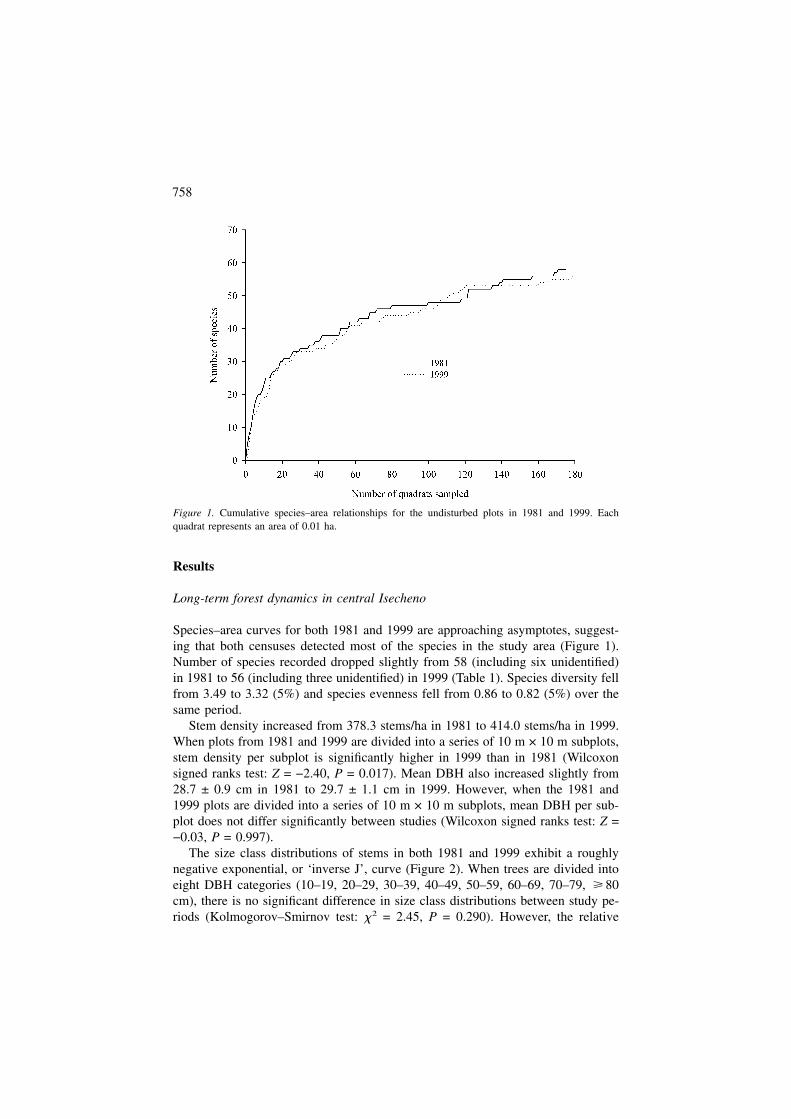
Species–area curves for both 1981 and 1999 are approaching asymptotes, suggest-ing that both censuses detected most of the species in the study area (Figure 1).Number of species recorded dropped slightly from 58 (including six unidentified)in 1981 to 56 (including three unidentified) in 1999 (Table 1). Species diversity fellfrom 3.49 to 3.32 (5%) and species evenness fell from 0.86 to 0.82 (5%) over thesame period.
Stem density increased from 378.3 stems/ha in 1981 to 414.0 stems/ha in 1999.When plots from 1981 and 1999 are divided into a series of 10 m × 10 m subplots,stem density per subplot is significantly higher in 1999 than in 1981 (Wilcoxonsigned ranks test: Z = −2.40, P = 0.017). Mean DBH also increased slightly from28.7 ± 0.9 cm in 1981 to 29.7 ± 1.1 cm in 1999. However, when the 1981 and1999 plots are divided into a series of 10 m × 10 m subplots, mean DBH per sub-plot does not differ significantly between studies (Wilcoxon signed ranks test: Z =−0.03, P = 0.997).
The size class distributions of stems in both 1981 and 1999 exhibit a roughlynegative exponential, or ‘inverse J’, curve (Figure 2). When trees are divided intoeight DBH categories (10–19, 20–29, 30–39, 40–49, 50–59, 60–69, 70–79, � 80cm), there is no significant difference in size class distributions between study pe-riods (Kolmogorov–Smirnov test: �2 = 2.45, P = 0.290). However, the relative
Figure 1. Cumulative species–area relationships for the undisturbed plots in 1981 and 1999. Eachquadrat represents an area of 0.01 ha.
758
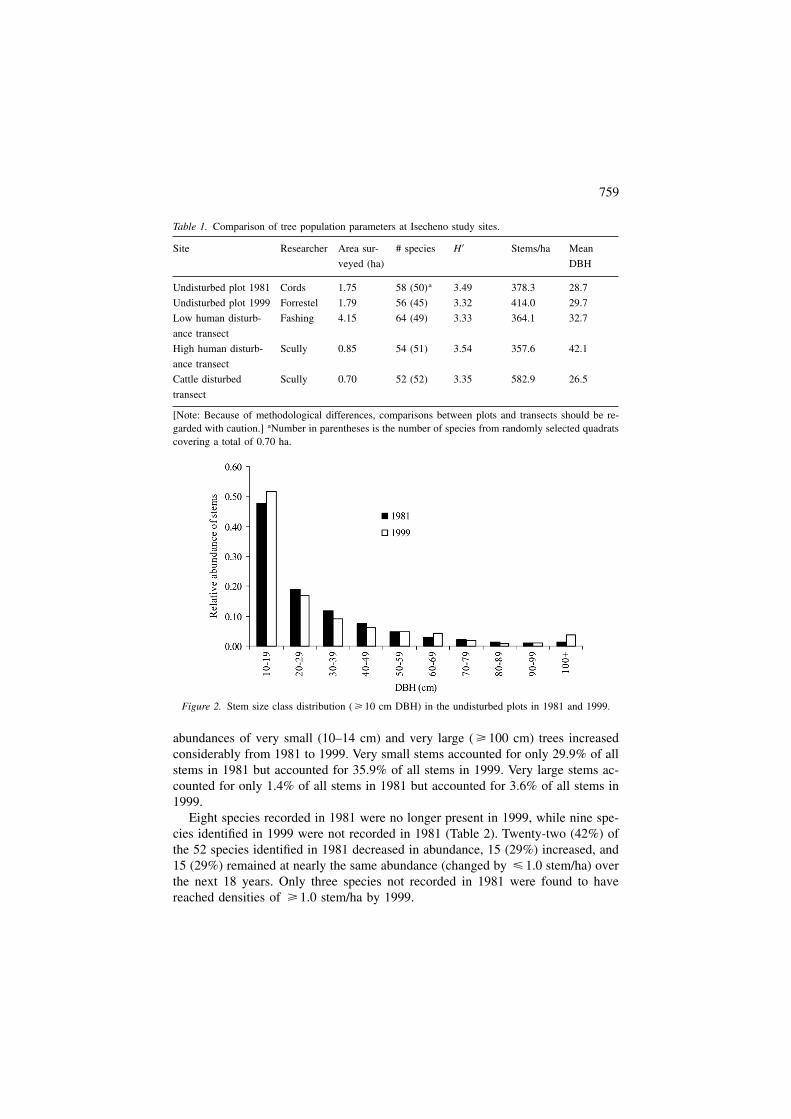
abundances of very small (10–14 cm) and very large ( � 100 cm) trees increasedconsiderably from 1981 to 1999. Very small stems accounted for only 29.9% of allstems in 1981 but accounted for 35.9% of all stems in 1999. Very large stems ac-counted for only 1.4% of all stems in 1981 but accounted for 3.6% of all stems in1999.
Eight species recorded in 1981 were no longer present in 1999, while nine spe-cies identified in 1999 were not recorded in 1981 (Table 2). Twenty-two (42%) ofthe 52 species identified in 1981 decreased in abundance, 15 (29%) increased, and15 (29%) remained at nearly the same abundance (changed by � 1.0 stem/ha) overthe next 18 years. Only three species not recorded in 1981 were found to havereached densities of � 1.0 stem/ha by 1999.
Table 1. Comparison of tree population parameters at Isecheno study sites.
Site Researcher Area sur-
veyed (ha)
# species H� Stems/ha Mean
DBH
Undisturbed plot 1981 Cords 1.75 58 (50)a 3.49 378.3 28.7
Undisturbed plot 1999 Forrestel 1.79 56 (45) 3.32 414.0 29.7
Low human disturb-
ance transect
Fashing 4.15 64 (49) 3.33 364.1 32.7
High human disturb-
ance transect
Scully 0.85 54 (51) 3.54 357.6 42.1
Cattle disturbed
transect
Scully 0.70 52 (52) 3.35 582.9 26.5
[Note: Because of methodological differences, comparisons between plots and transects should be re-garded with caution.] aNumber in parentheses is the number of species from randomly selected quadratscovering a total of 0.70 ha.
Figure 2. Stem size class distribution ( � 10 cm DBH) in the undisturbed plots in 1981 and 1999.
759
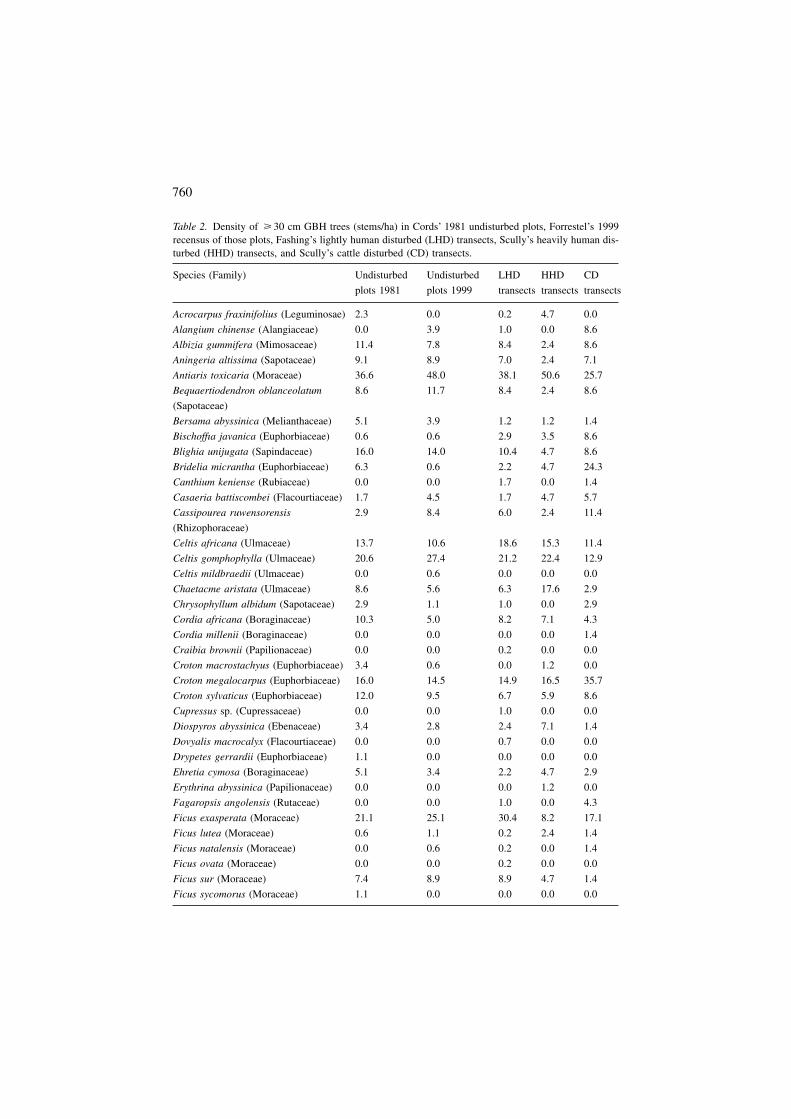
Table 2. Density of � 30 cm GBH trees (stems/ha) in Cords’ 1981 undisturbed plots, Forrestel’s 1999recensus of those plots, Fashing’s lightly human disturbed (LHD) transects, Scully’s heavily human dis-turbed (HHD) transects, and Scully’s cattle disturbed (CD) transects.
Species (Family) Undisturbed Undisturbed LHD HHD CD
plots 1981 plots 1999 transects transects transects
Acrocarpus fraxinifolius (Leguminosae) 2.3 0.0 0.2 4.7 0.0
Alangium chinense (Alangiaceae) 0.0 3.9 1.0 0.0 8.6
Albizia gummifera (Mimosaceae) 11.4 7.8 8.4 2.4 8.6
Aningeria altissima (Sapotaceae) 9.1 8.9 7.0 2.4 7.1
Antiaris toxicaria (Moraceae) 36.6 48.0 38.1 50.6 25.7
Bequaertiodendron oblanceolatum
(Sapotaceae)
8.6 11.7 8.4 2.4 8.6
Bersama abyssinica (Melianthaceae) 5.1 3.9 1.2 1.2 1.4
Bischoffıa javanica (Euphorbiaceae) 0.6 0.6 2.9 3.5 8.6
Blighia unijugata (Sapindaceae) 16.0 14.0 10.4 4.7 8.6
Bridelia micrantha (Euphorbiaceae) 6.3 0.6 2.2 4.7 24.3
Canthium keniense (Rubiaceae) 0.0 0.0 1.7 0.0 1.4
Casaeria battiscombei (Flacourtiaceae) 1.7 4.5 1.7 4.7 5.7
Cassipourea ruwensorensis
(Rhizophoraceae)
2.9 8.4 6.0 2.4 11.4
Celtis africana (Ulmaceae) 13.7 10.6 18.6 15.3 11.4
Celtis gomphophylla (Ulmaceae) 20.6 27.4 21.2 22.4 12.9
Celtis mildbraedii (Ulmaceae) 0.0 0.6 0.0 0.0 0.0
Chaetacme aristata (Ulmaceae) 8.6 5.6 6.3 17.6 2.9
Chrysophyllum albidum (Sapotaceae) 2.9 1.1 1.0 0.0 2.9
Cordia africana (Boraginaceae) 10.3 5.0 8.2 7.1 4.3
Cordia millenii (Boraginaceae) 0.0 0.0 0.0 0.0 1.4
Craibia brownii (Papilionaceae) 0.0 0.0 0.2 0.0 0.0
Croton macrostachyus (Euphorbiaceae) 3.4 0.6 0.0 1.2 0.0
Croton megalocarpus (Euphorbiaceae) 16.0 14.5 14.9 16.5 35.7
Croton sylvaticus (Euphorbiaceae) 12.0 9.5 6.7 5.9 8.6
Cupressus sp. (Cupressaceae) 0.0 0.0 1.0 0.0 0.0
Diospyros abyssinica (Ebenaceae) 3.4 2.8 2.4 7.1 1.4
Dovyalis macrocalyx (Flacourtiaceae) 0.0 0.0 0.7 0.0 0.0
Drypetes gerrardii (Euphorbiaceae) 1.1 0.0 0.0 0.0 0.0
Ehretia cymosa (Boraginaceae) 5.1 3.4 2.2 4.7 2.9
Erythrina abyssinica (Papilionaceae) 0.0 0.0 0.0 1.2 0.0
Fagaropsis angolensis (Rutaceae) 0.0 0.0 1.0 0.0 4.3
Ficus exasperata (Moraceae) 21.1 25.1 30.4 8.2 17.1
Ficus lutea (Moraceae) 0.6 1.1 0.2 2.4 1.4
Ficus natalensis (Moraceae) 0.0 0.6 0.2 0.0 1.4
Ficus ovata (Moraceae) 0.0 0.0 0.2 0.0 0.0
Ficus sur (Moraceae) 7.4 8.9 8.9 4.7 1.4
Ficus sycomorus (Moraceae) 1.1 0.0 0.0 0.0 0.0
760
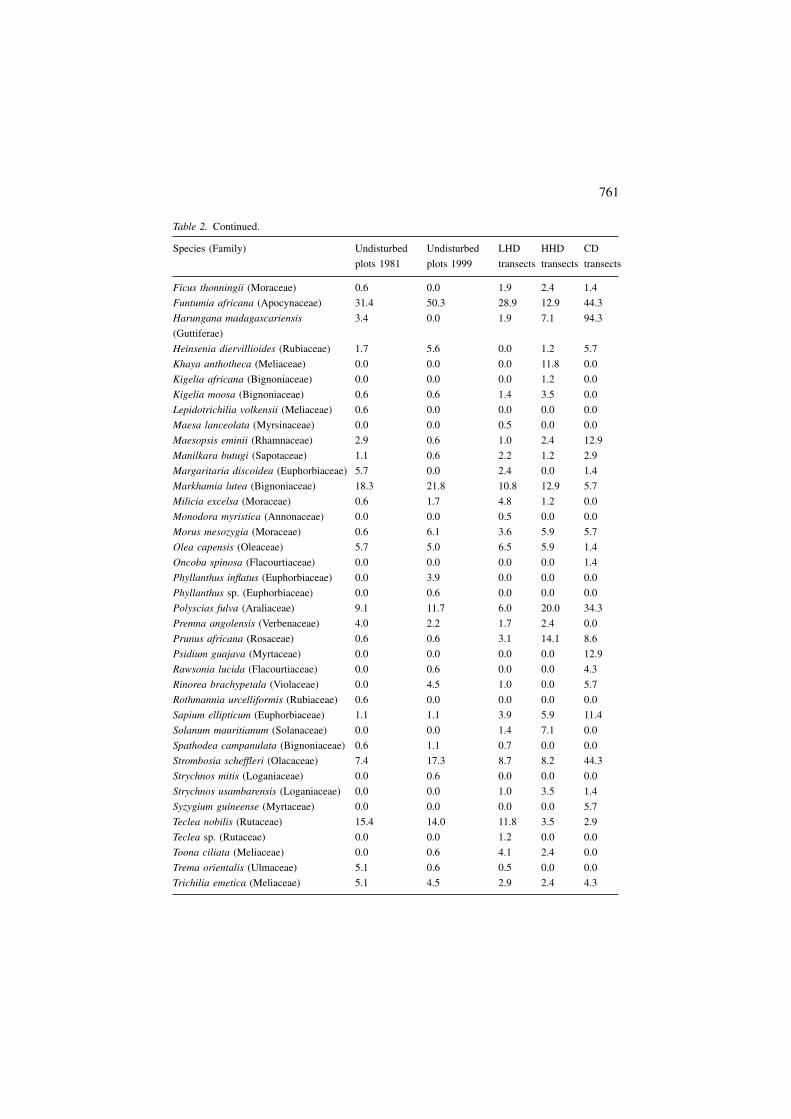
Table 2. Continued.
Species (Family) Undisturbed Undisturbed LHD HHD CD
plots 1981 plots 1999 transects transects transects
Ficus thonningii (Moraceae) 0.6 0.0 1.9 2.4 1.4
Funtumia africana (Apocynaceae) 31.4 50.3 28.9 12.9 44.3
Harungana madagascariensis
(Guttiferae)
3.4 0.0 1.9 7.1 94.3
Heinsenia diervillioides (Rubiaceae) 1.7 5.6 0.0 1.2 5.7
Khaya anthotheca (Meliaceae) 0.0 0.0 0.0 11.8 0.0
Kigelia africana (Bignoniaceae) 0.0 0.0 0.0 1.2 0.0
Kigelia moosa (Bignoniaceae) 0.6 0.6 1.4 3.5 0.0
Lepidotrichilia volkensii (Meliaceae) 0.6 0.0 0.0 0.0 0.0
Maesa lanceolata (Myrsinaceae) 0.0 0.0 0.5 0.0 0.0
Maesopsis eminii (Rhamnaceae) 2.9 0.6 1.0 2.4 12.9
Manilkara butugi (Sapotaceae) 1.1 0.6 2.2 1.2 2.9
Margaritaria discoidea (Euphorbiaceae) 5.7 0.0 2.4 0.0 1.4
Markhamia lutea (Bignoniaceae) 18.3 21.8 10.8 12.9 5.7
Milicia excelsa (Moraceae) 0.6 1.7 4.8 1.2 0.0
Monodora myristica (Annonaceae) 0.0 0.0 0.5 0.0 0.0
Morus mesozygia (Moraceae) 0.6 6.1 3.6 5.9 5.7
Olea capensis (Oleaceae) 5.7 5.0 6.5 5.9 1.4
Oncoba spinosa (Flacourtiaceae) 0.0 0.0 0.0 0.0 1.4
Phyllanthus inflatus (Euphorbiaceae) 0.0 3.9 0.0 0.0 0.0
Phyllanthus sp. (Euphorbiaceae) 0.0 0.6 0.0 0.0 0.0
Polyscias fulva (Araliaceae) 9.1 11.7 6.0 20.0 34.3
Premna angolensis (Verbenaceae) 4.0 2.2 1.7 2.4 0.0
Prunus africana (Rosaceae) 0.6 0.6 3.1 14.1 8.6
Psidium guajava (Myrtaceae) 0.0 0.0 0.0 0.0 12.9
Rawsonia lucida (Flacourtiaceae) 0.0 0.6 0.0 0.0 4.3
Rinorea brachypetala (Violaceae) 0.0 4.5 1.0 0.0 5.7
Rothmannia urcelliformis (Rubiaceae) 0.6 0.0 0.0 0.0 0.0
Sapium ellipticum (Euphorbiaceae) 1.1 1.1 3.9 5.9 11.4
Solanum mauritianum (Solanaceae) 0.0 0.0 1.4 7.1 0.0
Spathodea campanulata (Bignoniaceae) 0.6 1.1 0.7 0.0 0.0
Strombosia scheffleri (Olacaceae) 7.4 17.3 8.7 8.2 44.3
Strychnos mitis (Loganiaceae) 0.0 0.6 0.0 0.0 0.0
Strychnos usambarensis (Loganiaceae) 0.0 0.0 1.0 3.5 1.4
Syzygium guineense (Myrtaceae) 0.0 0.0 0.0 0.0 5.7
Teclea nobilis (Rutaceae) 15.4 14.0 11.8 3.5 2.9
Teclea sp. (Rutaceae) 0.0 0.0 1.2 0.0 0.0
Toona ciliata (Meliaceae) 0.0 0.6 4.1 2.4 0.0
Trema orientalis (Ulmaceae) 5.1 0.6 0.5 0.0 0.0
Trichilia emetica (Meliaceae) 5.1 4.5 2.9 2.4 4.3
761
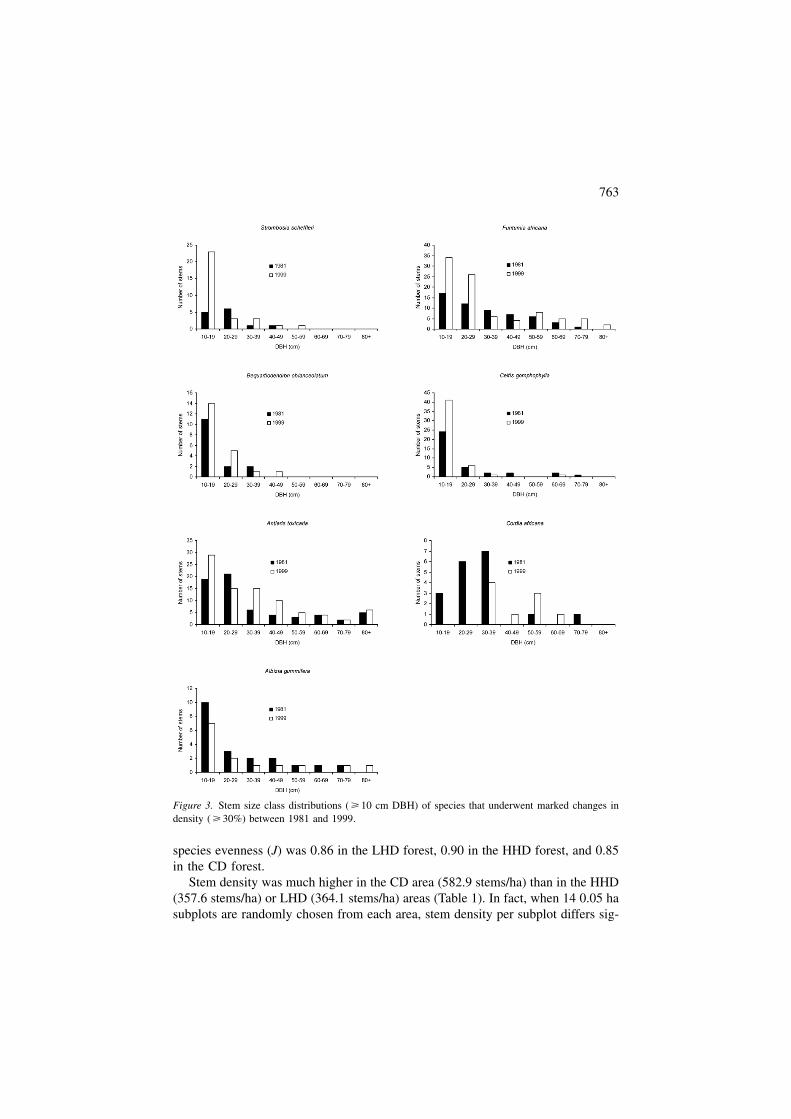
Statistically significant changes in stem density for individual species could notbe detected because no species was represented by � 100 stems (Condit 1995).However, there were several relatively common species ( � 10 stems/ha during ei-ther survey) that underwent marked changes in density ( � 30%) between 1981 and1999 (Figure 3). Among these species, stem density increased in Strombosia schef-fleri by 134%, Funtumia africana (syn. F. latifolia) by 60%, Bequartiodendronoblanceolatum by 36%, Celtis gomphophylla (syn. C. durandii) by 33%, and An-tiaris toxicaria by 31%. Stem density decreased markedly in only two commonspecies: Cordia africana by 51% and Albizia gummifera by 32%.
Of the top 10 species in terms of stem density in 1981, nine remained in the top10 in 1999. The only change involved Celtis africana, a pioneer species, droppingout of the top 10 and being replaced by Strombosia scheffleri, a climax species.Stem densities of all pioneer tree species combined fell from 86.7 stems/ha in 1981to 68.2 stems/ha in 1999, a decline of 21%. Most pioneer species present at Isech-eno exhibited very poor recruitment into the smaller stem size classes between 1981and 1999 (Figure 4).
Comparison of sites with different disturbance regimes
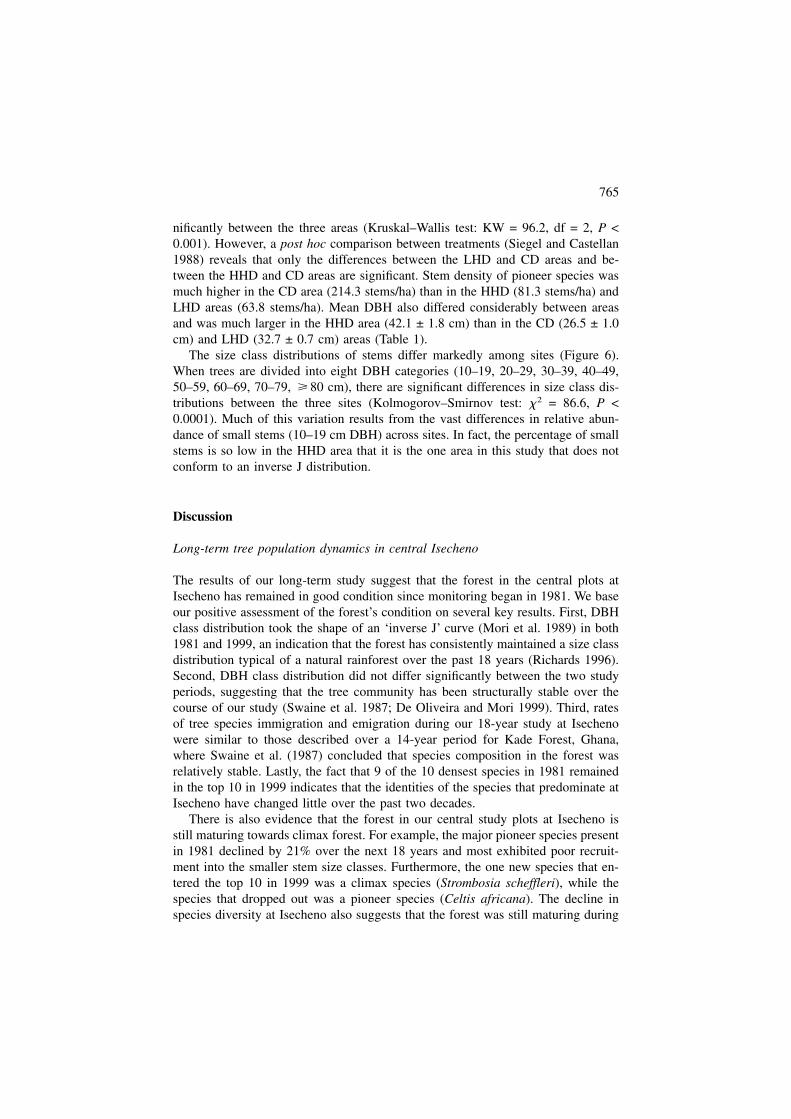
The species–area curve for the LHD site is approaching an asymptote, but thesmaller areas surveyed in the HHD and CD sites resulted in species–area curvesfor these sites that have yet to level off (Figure 5). A total of 64 species (1 uniden-tified) were recorded in the LHD forest, 53 species (1 unidentified) in the HHDforest, and 52 species (0 unidentified) in the CD forest (Table 1). However, whenrarefaction is used to account for differences in area sampled, species richness isestimated at 50.1 (±2.5) in the LHD area, 53.0 (±0.0) in the HHD area, and 48.4(±1.6) in the CD area. Controlling for area sampled by analyzing a randomly se-lected sample of 14 0.05 ha subplots in each study area, species diversity (H�) was3.33 in the LHD forest, 3.54 in the HHD forest, and 3.35 in the CD forest, while
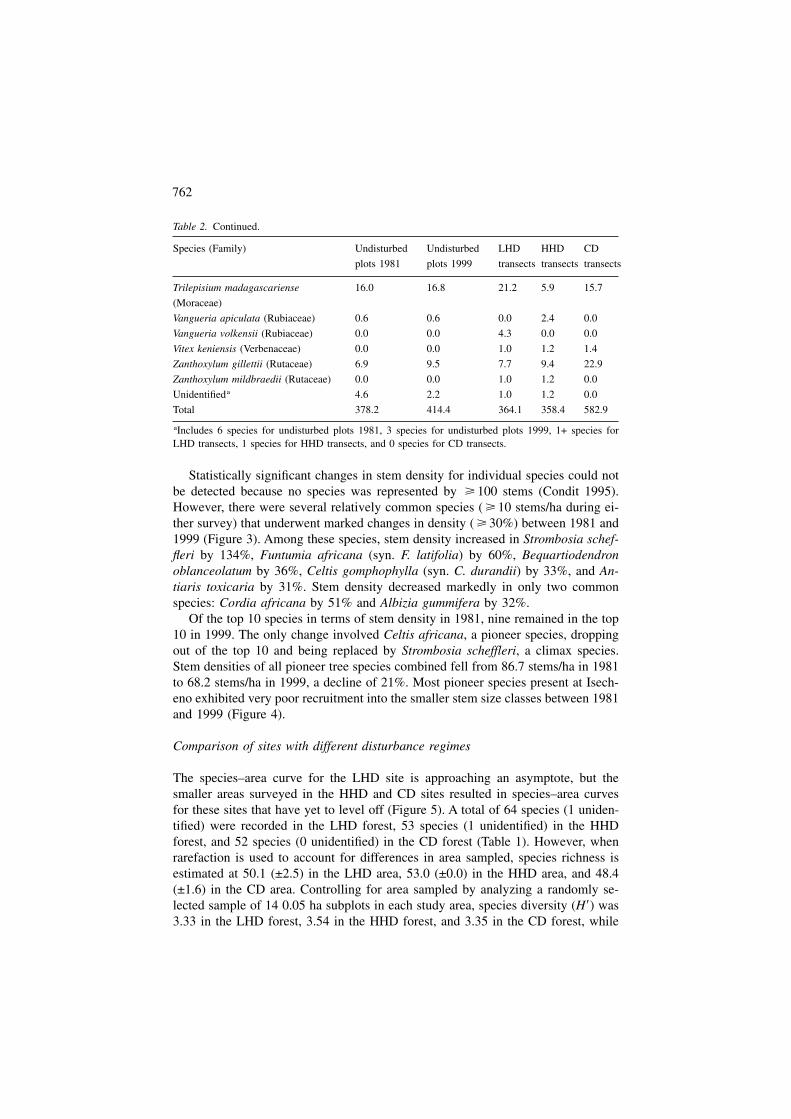
Table 2. Continued.
Species (Family) Undisturbed Undisturbed LHD HHD CD
plots 1981 plots 1999 transects transects transects
Trilepisium madagascariense
(Moraceae)
16.0 16.8 21.2 5.9 15.7
Vangueria apiculata (Rubiaceae) 0.6 0.6 0.0 2.4 0.0
Vangueria volkensii (Rubiaceae) 0.0 0.0 4.3 0.0 0.0
Vitex keniensis (Verbenaceae) 0.0 0.0 1.0 1.2 1.4
Zanthoxylum gillettii (Rutaceae) 6.9 9.5 7.7 9.4 22.9
Zanthoxylum mildbraedii (Rutaceae) 0.0 0.0 1.0 1.2 0.0
Unidentifieda 4.6 2.2 1.0 1.2 0.0
Total 378.2 414.4 364.1 358.4 582.9
aIncludes 6 species for undisturbed plots 1981, 3 species for undisturbed plots 1999, 1+ species forLHD transects, 1 species for HHD transects, and 0 species for CD transects.
762
species evenness (J) was 0.86 in the LHD forest, 0.90 in the HHD forest, and 0.85in the CD forest.
Stem density was much higher in the CD area (582.9 stems/ha) than in the HHD(357.6 stems/ha) or LHD (364.1 stems/ha) areas (Table 1). In fact, when 14 0.05 hasubplots are randomly chosen from each area, stem density per subplot differs sig-
Figure 3. Stem size class distributions ( � 10 cm DBH) of species that underwent marked changes indensity ( � 30%) between 1981 and 1999.
763
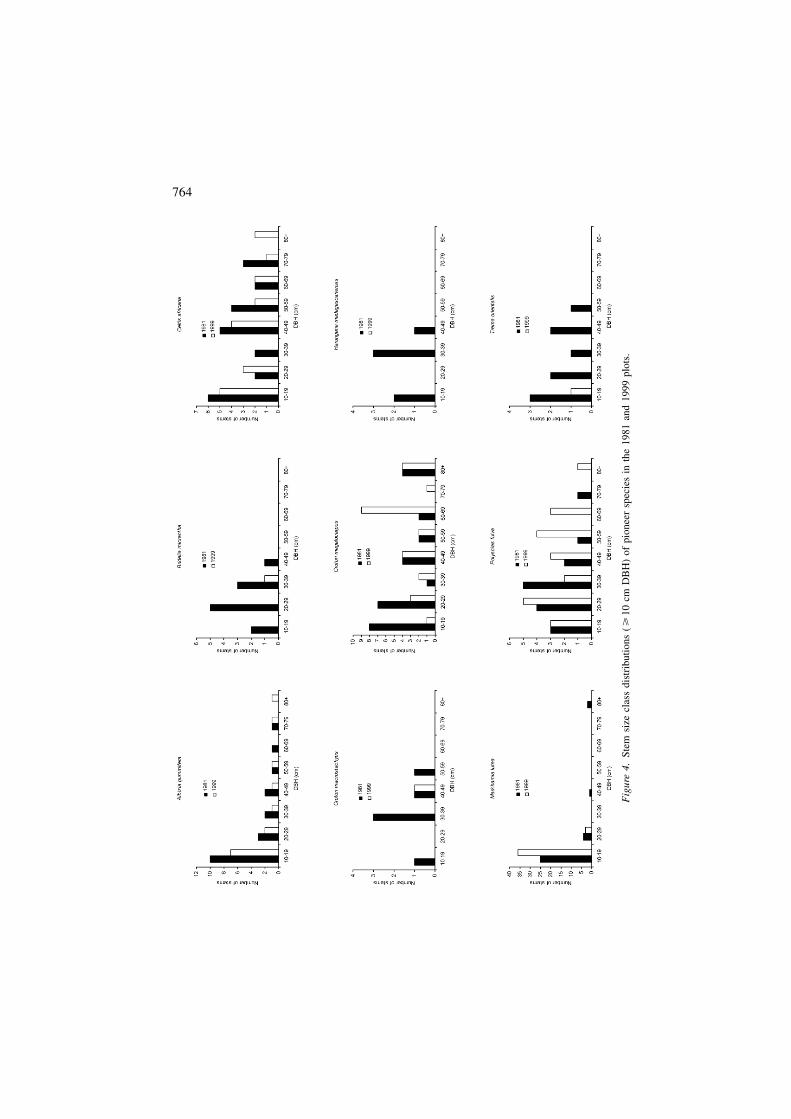
Fig
ure
4.St
emsi
zecl
ass
dist
ribu
tions
(�10
cmD
BH
)of
pion
eer
spec
ies
inth
e19
81an
d19
99pl
ots.
764
nificantly between the three areas (Kruskal–Wallis test: KW = 96.2, df = 2, P <0.001). However, a post hoc comparison between treatments (Siegel and Castellan1988) reveals that only the differences between the LHD and CD areas and be-tween the HHD and CD areas are significant. Stem density of pioneer species wasmuch higher in the CD area (214.3 stems/ha) than in the HHD (81.3 stems/ha) andLHD areas (63.8 stems/ha). Mean DBH also differed considerably between areasand was much larger in the HHD area (42.1 ± 1.8 cm) than in the CD (26.5 ± 1.0cm) and LHD (32.7 ± 0.7 cm) areas (Table 1).
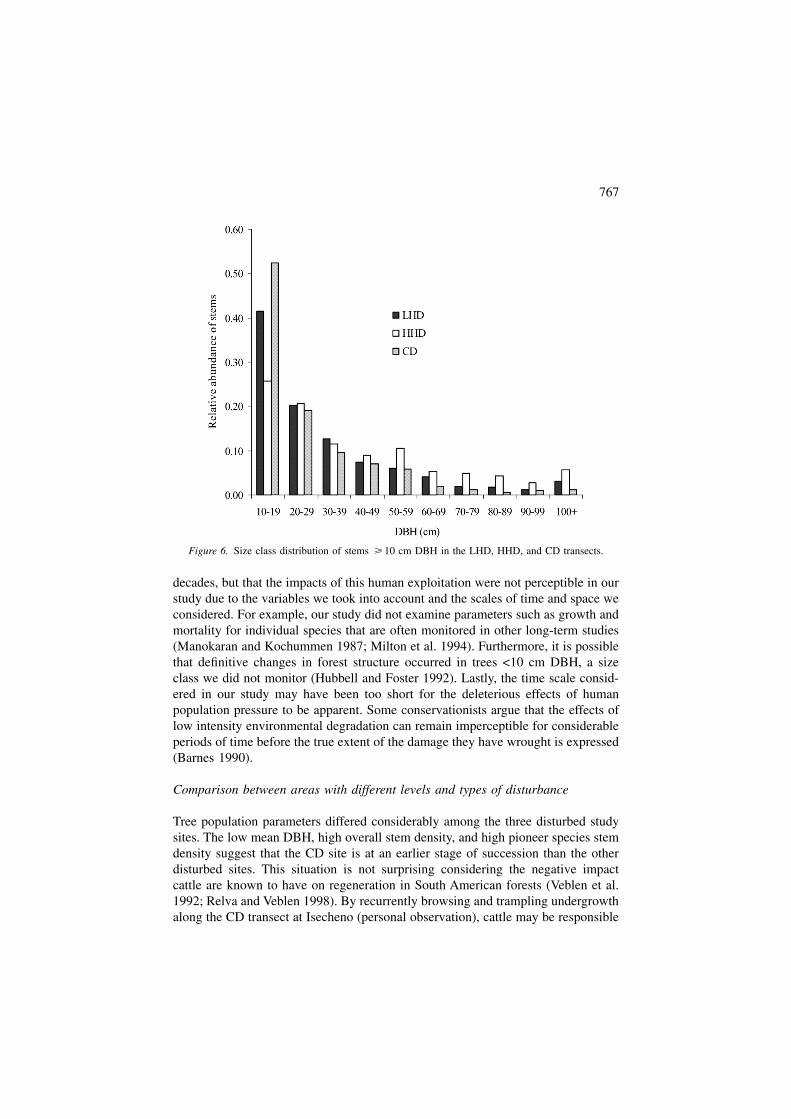
The size class distributions of stems differ markedly among sites (Figure 6).When trees are divided into eight DBH categories (10–19, 20–29, 30–39, 40–49,50–59, 60–69, 70–79, � 80 cm), there are significant differences in size class dis-tributions between the three sites (Kolmogorov–Smirnov test: �2 = 86.6, P <0.0001). Much of this variation results from the vast differences in relative abun-dance of small stems (10–19 cm DBH) across sites. In fact, the percentage of smallstems is so low in the HHD area that it is the one area in this study that does notconform to an inverse J distribution.
Discussion
Long-term tree population dynamics in central Isecheno
The results of our long-term study suggest that the forest in the central plots atIsecheno has remained in good condition since monitoring began in 1981. We baseour positive assessment of the forest’s condition on several key results. First, DBHclass distribution took the shape of an ‘inverse J’ curve (Mori et al. 1989) in both1981 and 1999, an indication that the forest has consistently maintained a size classdistribution typical of a natural rainforest over the past 18 years (Richards 1996).Second, DBH class distribution did not differ significantly between the two studyperiods, suggesting that the tree community has been structurally stable over thecourse of our study (Swaine et al. 1987; De Oliveira and Mori 1999). Third, ratesof tree species immigration and emigration during our 18-year study at Isechenowere similar to those described over a 14-year period for Kade Forest, Ghana,where Swaine et al. (1987) concluded that species composition in the forest wasrelatively stable. Lastly, the fact that 9 of the 10 densest species in 1981 remainedin the top 10 in 1999 indicates that the identities of the species that predominate atIsecheno have changed little over the past two decades.
There is also evidence that the forest in our central study plots at Isecheno isstill maturing towards climax forest. For example, the major pioneer species presentin 1981 declined by 21% over the next 18 years and most exhibited poor recruit-ment into the smaller stem size classes. Furthermore, the one new species that en-tered the top 10 in 1999 was a climax species (Strombosia scheffleri), while thespecies that dropped out was a pioneer species (Celtis africana). The decline inspecies diversity at Isecheno also suggests that the forest was still maturing during
765
our study, since it is common for species diversity to fall as a tropical rainforestpasses through the later successional stages after disturbance (Connell 1978; Crow1980). These results suggest that the forest in central Isecheno is still recoveringfrom the selective logging of large trees that occurred at the site in the 1940s. Thisscenario is supported by the fact that two of the three species most heavily exploitedby loggers at Kakamega in the past (Antiaris toxicaria, Funtumia africana, Crotonmegalocarpus; Tsingalia 1988) underwent unusually large increases in stem den-sity between 1981 and 1999.
Our results from Isecheno are consistent with Plumptre’s (1996) conclusion froma long-term study in the Budongo Forest, Uganda, that even 60–80 years might notbe enough time for forest structure to completely recover from selective logging.Unlike at Budongo, however, we have no record of what mature forest at Kaka-mega looks like and whether the climax stage is mixed rainforest or monodominantrainforest. The fact that Isecheno is not currently close to being dominated by oneor several self-replacing shade tolerant tree species (Eggeling 1947; Connell andLowman 1989; Hart et al. 1989) even 60 years after selective logging, however,suggests that the climax stage at Kakamega is characterized by mixed rather thanmonodominant forest.
It is encouraging that, despite the intense population pressure in the Kakamegaregion, forest in the central study plots at Isecheno showed no overt signs of dis-turbance and appeared to improve in condition between 1981 and 1999. An alter-native viewpoint, which can only be ruled out completely through continued long-term monitoring, is that the forest in the study plots has been disturbed in recent
Figure 5. The cumulative species–area relationships for the lightly human disturbed (LHD), heavilyhuman disturbed (HHD), and cattle disturbed (CD) transects. Each quadrat represents an area of 0.05ha.
766
decades, but that the impacts of this human exploitation were not perceptible in ourstudy due to the variables we took into account and the scales of time and space weconsidered. For example, our study did not examine parameters such as growth andmortality for individual species that are often monitored in other long-term studies(Manokaran and Kochummen 1987; Milton et al. 1994). Furthermore, it is possiblethat definitive changes in forest structure occurred in trees <10 cm DBH, a sizeclass we did not monitor (Hubbell and Foster 1992). Lastly, the time scale consid-ered in our study may have been too short for the deleterious effects of humanpopulation pressure to be apparent. Some conservationists argue that the effects oflow intensity environmental degradation can remain imperceptible for considerableperiods of time before the true extent of the damage they have wrought is expressed(Barnes 1990).
Comparison between areas with different levels and types of disturbance
Tree population parameters differed considerably among the three disturbed studysites. The low mean DBH, high overall stem density, and high pioneer species stemdensity suggest that the CD site is at an earlier stage of succession than the otherdisturbed sites. This situation is not surprising considering the negative impactcattle are known to have on regeneration in South American forests (Veblen et al.1992; Relva and Veblen 1998). By recurrently browsing and trampling undergrowthalong the CD transect at Isecheno (personal observation), cattle may be responsible
Figure 6. Size class distribution of stems � 10 cm DBH in the LHD, HHD, and CD transects.
767
for creating persistent light gaps which facilitate the success of pioneer species andprevent the emergence of shade-tolerant later successional species. Despite its ear-lier successional stage, this area holds some conservation promise in that it is rela-tively distant from human settlement, making it somewhat more impractical as asource of wood products. Thus, if cattle herding could be eliminated, the forestmight continue regenerating relatively unimpeded at this site.
The prospects for the other intensively disturbed site, HHD, are less promising.The most striking feature of the tree population at this site is that it fails to conformto the inverse J distribution typical of natural rainforests (Richards 1996). The highproportion of large DBH stems suggests recruitment into the smaller size classes isvery poor at this site. This poor recruitment is almost certainly due to the site’slocation on the edge of the forest adjacent to a tea field and human settlement. Lo-cal people appear to be heavily exploiting this site as a source of small stems to beused as building materials. For example, the density of the tree species most pre-ferred for pole-cutting in the Kakamega Forest, Funtumia africana (Tsingalia 1988),is 2.2–3.4× higher at the other two disturbed sites than it is at the HHD site. Fur-thermore, only 1 of the 11 F. africana stems recorded at the HHD site belonged tothe smallest size class, indicating poor recruitment for this species. Considering theongoing human disturbance and extremely poor overall recruitment that resultsfrom it, the forest at this site is likely to remain unnatural for years to come. Onlyif the human exploitation is curtailed will this site begin the process of increasingrecruitment into the small size classes again.
Not surprisingly, the LHD site appears to be in the best condition of the dis-turbed sites. Though comparisons between transects and plots must be made cau-tiously, tree population parameters for the LHD site are generally more similar tothose for Forrestel’s nearby relatively undisturbed plots than they are to those forthe other disturbed sites. The major differences in tree population parameters be-tween the LHD transects and Forrestel’s plots are that the overall stem density is12% lower and the density of stems in the smallest size class is 29% lower in theLHD transects. These results indicate poorer recruitment in the LHD transects thanin the plots, which suggests there may be some illegal pole-cutting even in thisarea by local people. Nevertheless, the inverse J distribution and the population pa-rameters that generally resemble those for the nearby plots suggest that the LHDtransects are in the best condition of the three disturbed sites.
Conclusions and recommendations
Our long-term research suggests that conservation activities carried out in centralIsecheno over the past few decades have been effective. Because of its proximity tothe forest station and perhaps also its location in the heart of an area where scien-tists have conducted biological research over the past three decades (Zimmerman1972; Cords 1987; Copeland et al. 1996; Fashing 2001), central Isecheno has notsuffered from the disturbance that has clearly affected the HHD and CD sites on its
768
periphery. While it is encouraging that central Isecheno appears to have fared wellin recent years, it is alarming to contemplate the level of disturbance that might beoccurring further afield if areas like the HHD and CD sites less than 1 km away arein such poor condition.
Indeed, the heterogeneity in forest condition over small spatial scales revealedby our study underscores the challenges of making representative surveys in forestslike this one, where human influence is not uniformly distributed in space. In theKakamega Forest, surveys are urgently needed to determine the status of the forestremaining outside of the relatively well-protected sites like Isecheno and Buyangu(Mutangah et al. 1992; Kiama and Kiyiapi 2001). Further long-term research ontree population dynamics in both undisturbed and disturbed regions of the forestwill be critical to improving our understanding of the levels and types of disturb-ance the forest can withstand before adverse effects begin to emerge. With the highhuman population in the region, it will be difficult to terminate illegal activities inthe forest, but protection efforts will need to increase if much forest is to remainoutside of the few areas which are currently effectively protected.
Acknowledgements
We would like to thank the experienced local naturalists, Jackson Gutwa, EmilyMujinji, Benjamin Okalo, and Wilberforce Okeka, for their vital assistance in iden-tifying and measuring trees as well as for their helpful methodological suggestionsduring this study. P.F. and M.C. thank the Wenner-Gren and L.S.B. Leakey Foun-dations for funding their research. M.C. also acknowledges support from the Na-tional Science Foundation (graduate fellowship, SBR 95-23623, BCS-98-08273),American Women in Science, Sigma Xi. A.F. and C.S. were supported as summerinterns by the Center for Environmental Research and Conservation at ColumbiaUniversity. We are grateful to the Kenyan government for permission to conductresearch in Kenya, the Zoology Department at the University of Nairobi for localsponsorship, and the local staff at the Kakamega Forest Station for their coopera-tion. We thank the staff of the Plant Sciences and Rhodes House libraries at OxfordUniversity for vainly searching their collections for any remaining records of co-lonial logging activities in the Kakamega Forest. We are grateful to the anonymousreviewers for their comments on this manuscript.
References
Barnes R.F.W. 1990. Deforestation trends in tropical Africa. African Journal of Ecology 28: 161–173.Beentje H.J. 1994. Kenya Trees, Shrubs and Lianas. National Museums of Kenya, Nairobi, Kenya.Brooks T.M., Pimm S.L. and Oyugi J.O. 1999. Time lag between deforestation and extinction in tropi-
cal forest fragments. Conservation Biology 13: 1140–1150.
769
Cannon C.H., Peart D.R., Leighton M. and Kartawinata K. 1994. The structure of lowland rain-forestafter selective logging in West Kalimantan, Indonesia. Forest Ecology and Management 67: 49–68.
Chapman C.A. and Chapman L.J. 1997. Forest regeneration in logged and unlogged forests of KibaleNational Park, Uganda. Biotropica 29: 396–412.
Chapman C.A. and Chapman L.J. 1999. Forest restoration in abandoned agricultural land: a case studyfrom East Africa. Conservation Biology 13: 1301–1311.
Chapman C.A., Chapman L.J., Wrangham R., Isabirye-Basuta G. and Ben-David K. 1997. Spatial andtemporal variation in the structure of a tropical forest. African Journal of Ecology 35: 287–302.
Condit R. 1995. Research in large, long-term tropical forest plots. Trends in Ecology and Evolution 10:18–22.
Connell J.H. 1978. Diversity in tropical rain forests and coral reefs. Science 199: 1302–1310.Connell J.H. and Lowman M.D. 1989. Low-diversity tropical rain forests: some possible mechanisms
for their existence. American Naturalist 134: 88–119.Connell J.H., Tracey J.G. and Webb L.J. 1984. Compensatory recruitment, growth, and mortality as fac-
tors maintaining rain-forest tree diversity. Ecological Monographs 54: 141–164.Copeland R.S., Okeka W. and Corbet P.S. 1996. Treeholes as larval habitat of the dragonfly Hadrothe-
mis camarensis. Aquatic Insects 18: 129–147.Cords M.A. 1984. Mixed Species Groups of Cercopithecus Monkeys in the Kakamega Forest, Kenya.
Ph.D. Thesis, University of California, Berkeley, California.Cords M. 1987. Mixed species association of Cercopithecus monkeys in the Kakamega Forest, Kenya.
University of California Publications in Zoology 117: 1–109.Cords M. and Tsingalia H.M. 1982. A Report on Harmful Exploitation of Indigenous Forest in Kaka-
mega (to the Ministry of Tourism and Wildlife). Wildlife Conservation and Management Division,Government of Kenya, Nairobi, Kenya.
Crow T.R. 1980. A rain forest chronicle: a 30 year record of change in structure and composition at ElVerde, Puerto Rico. Biotropica 12: 42–55.
De Oliveira A.A. and Mori S.A. 1999. A central Amazonian terra firme forest. I. High tree species rich-ness on poor soils. Biodiversity and Conservation 8: 1219–1244.
Duncan R.S. and Chapman C.A. 1999. Seed dispersal and potential forest succession in abandoned ag-riculture in tropical Africa. Ecological Applications 9: 998–1008.
Eggeling W.J. 1947. Observations on the ecology of Budongo rain forest, Uganda. Journal of Ecology34: 20–87.
Fashing P.J. 2001. Male and female strategies during intergroup encounters in guerezas (Colobusguereza): evidence for resource defense mediated through males and a comparison with other pri-mates. Behavioral Ecology and Sociobiology 50: 219–230.
Gathua J.M. 2000. Intraspecific Variation in Foraging Patterns of Redtail Monkeys (Cercopithecus as-canius) in the Kakamega Forest, Kenya. Ph.D. Thesis, Columbia University, New York.
Hart T.B. 2001. Forest dynamics in the Ituri Basin (DR Congo): dominance, diversity, and conservation.In: Weber W., White L.J.T., Vedder A. and Naughton-Treves L. (eds), African Rain Forest Ecologyand Conservation: An Interdisciplinary Perspective. Yale University Press, New Haven, Connecti-cut, pp. 154–164.
Hart T.B., Hart J.A. and Murphy P.G. 1989. Monodominant and species-rich forests of the humid trop-ics: causes of their co-occurrence. American Naturalist 133: 613–633.
Hubbell S.P. and Foster R.B. 1992. Short-term dynamics of a neotropical forest: why ecological re-search matters to tropical conservation and management. Oikos 63: 48–61.
Kent M. and Coker P. 1992. Vegetation Description and Analysis: A Practical Approach. CRC Press,Boca Raton, Florida.
Kiama D. and Kiyiapi J. 2001. Shade tolerance and regeneration of some tree species of a tropical rainforest in western Kenya. Plant Ecology 156: 183–191.
Kokwaro J.O. 1988. Conservation status of the Kakamega Forest in Kenya: the easternmost relic of theequatorial rain forests of Africa. Monographs in Systematic Botany Missouri Botanical Garden 25:471–489.
770
Lieberman D. and Lieberman M. 1987. Forest tree growth and dynamics at La Selva, Costa Rica(1969–1982). Journal of Tropical Ecology 3: 347–358.
Lwanga J.S., Butynski T.M. and Struhsaker T.T. 2000. Tree population dynamics in Kibale NationalPark, Uganda 1975–1998. African Journal of Ecology 38: 238–247.
Manokaran N. and Kochummen K.M. 1987. Recruitment, growth and mortality of tree species in a low-land dipterocarp forest in Peninsular Malaysia. Journal of Tropical Ecology 3: 315–330.
Milton K., Laca E.A. and Demment M.W. 1994. Successional patterns of mortality and growth of largetrees in a Panamanian lowland forest. Journal of Ecology 82: 79–87.
Mori S.A., Rabelo B.V., Tsou C.H. and Daly D. 1989. Composition and structure of an Eastern Ama-zonian forest at Camaipi, Amapa, Brazil. Boletim do Museu Paraense Emilio Goeldi, Serie Botanica5: 3–18.
Mutangah J.G., Mwangangi O. and Mwaura P.K. 1992. Kakamega Forest: A Vegetation Survey Report.Kenya Indigenous Forest Conservation Project, Nairobi, Kenya.
Opala K. 2002. Kenya: unlucky pawns in forests plunder. Daily Nation (January 22) 2002: 4–5.Plumptre A.J. 1996. Changes following 60 years of selective timber harvesting in the Budongo Forest
Reserve, Uganda. Forest Ecology and Management 89: 101–113.Relva M.A. and Veblen T.T. 1998. Impacts of introduced large herbivores on Austrocedrus chilensis
forests in northern Patagonia, Argentina. Forest Ecology and Management 108: 27–40.Richards P.W. 1996. The Tropical Rain Forest: An Ecological Study. Cambridge University Press, Cam-
bridge, UK.Rugene N. 2001. State challenged on conservation. Daily Nation (April 19) 2001: 4–5.Saldarriaga J.G., West D.C., Tharp M.L. and Uhl C. 1988. Long-term chronosequence of forest succes-
sion in the upper Rio Negro of Colombia and Venezuela. Journal of Ecology 76: 938–958.Sheil D. 1995. A critique of permanent forest plot methods and analysis with examples from Budongo
Forest, Uganda. Forest Ecology and Management 77: 11–34.Sheil D. 2001. Long-term observations of rain forest succession, tree diversity and responses to disturb-
ance. Plant Ecology 155: 183–199.Sheil D., Jennings S. and Savill P. 2000. Long-term permanent plot observations of vegetation dynamics
in Budongo, a Ugandan rain forest. Journal of Tropical Ecology 16: 765–800.Siegel S. and Castellan N.J. Jr. 1988. Nonparametric Statistics for the Behavioral Sciences. McGraw-
Hill, New York.Struhsaker T.T. 1997. Ecology of an African Rain Forest: Logging in Kibale and the Conflict Between
Conservation and Exploitation. University of Florida Press, Gainesville, Florida.Swaine M.D., Hall J.B. and Alexander I.J. 1987. Tree population dynamics at Kade, Ghana (1968–1982).
Journal of Tropical Ecology 3: 331–345.Taylor D.M., Hamilton A.C., Whyatt J.D., Mucunguzi P. and Bukenya-Ziraba R. 1996. Stand dynamics
in Mpanga Research Forest Reserve, Uganda, 1968–1993. Journal of Tropical Ecology 12: 583–597.Tsingalia M.H. 1988. Animals and the Regeneration of an African Rainforest Tree. Ph.D. Thesis, Uni-
versity of California, Berkeley, California.Uhl C. and Jordan C. 1984. Succession and nutrient dynamics following forest cutting and burning in
Amazonia. Ecology 65: 1460–1476.Veblen T.T., Mermoz M., Martin C. and Kitzberger T. 1992. Ecological impacts of introduced animals
in Nahuel Huapi National Park, Argentina. Conservation Biology 6: 71–83.Wass P. 1995. Kenya’s Indigenous Forests: Status, Management, and Conservation. IUCN, Gland, Swit-
zerland.Whitmore T.C. 1984. Tropical Rain Forests of the Far East. Clarendon Press, Oxford, UK.Zimmerman D.A. 1972. The avifauna of the Kakamega Forest, western Kenya, including a bird popu-
lation study. Bulletin of the American Museum of Natural History 149: 257–339.
771