Embed Size (px)
Citation preview

Long Long Term Waste Management Waste Management
Rev A, ‘Waste Energy History & Process Data’, May 16, 2011Rev B, ‘GENESIS Process Simulator & Operator Interface’, May 23, 2011Rev C, Syn-fuel data, Predicted Steam & Emission Levels, June 1st, 2011Rev D-2, Add/Mod Waste & Proc Diags, (7/7/11, 7-24-11), Added Fuel-Blend/Stm Diag - 8/8/11Rev E-1, Updated Graphics, Fig 3, Table 4 and added estimated project pay-out 11/23/11Rev F, Added Salvage material Revenue Chart, Updated Figures and Table 4 1-16-12Rev G-2, Updated Fuel Cube graphic, Table 5, Est. Pay out, EPA Ref, Inc. Unit Pres, Lower XS air- 2-13-12REV H, Published by Chemical Engineering, July 2012-Vol. 119, No. 1 REV I, Added Engineered Fuel Pellet Performance Data Based On Utility Model Prediction, 11-8-12REV J, Added Displays and Model steam material balance for Fuel Cube Power Generation REV K, Added Predicted Model Results for Homer City - Unit 3 engineered fuel combustion.REV L, Added Displays and Model Energy Balance for Homer City - Unit 3.REV M, Added Inside Boiler tube Heat Transfer Relationships for Improved Heat & Energy Response.Rev N, Added Generator Hydrogen Coolers
Producing Synthetic Fuel from Municipal Waste

Waste Management Produces More Renewable Energy Than Solar Industry
According to the Energy Information Administration (EIA)2, about 800,000 megawatts of solar energy were produced in the United States in 2009. In that same year, Waste Management’s 119 waste-fueled energy plants produced 8.6 million megawatts.
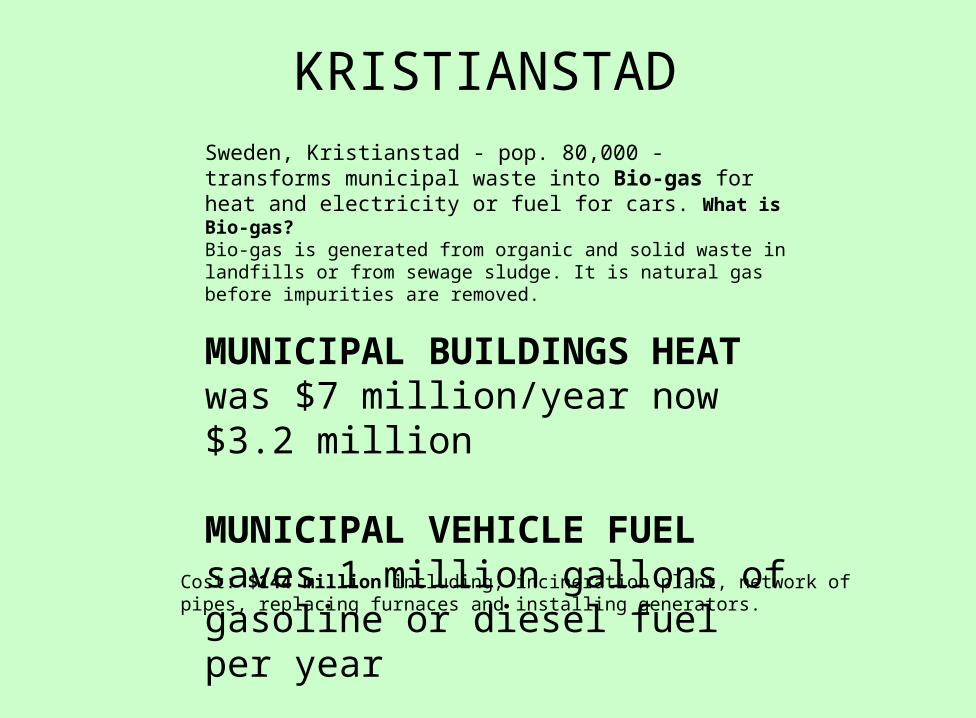
KRISTIANSTADSweden, Kristianstad - pop. 80,000 - transforms municipal waste into Bio-gas for heat and electricity or fuel for cars. What is Bio-gas?
Bio-gas is generated from organic and solid waste in landfills or from sewage sludge. It is natural gas before impurities are removed.
MUNICIPAL BUILDINGS HEATwas $7 million/year now $3.2 million
MUNICIPAL VEHICLE FUELsaves 1 million gallons of gasoline or diesel fuel per year
Cost: $144 million including, incineration plant, network of pipes, replacing furnaces and installing generators.

A 2010 study(1) has found that emissions from landfills versus municipal waste combustion using EPA’s life cycle assessment(LCA) model for the range and scenarios evaluated, that waste combustion outperforms land filling in terms of GHG emissions regardless of landfill gas management techniques.
Why landfills are not an effective environmental solution to man-made waste.

County landfills often receive 5000 tons of trash per day
What can be Done?
The Plan:Produce Synthetic Fuel from Bio-gas burning tire blended solid waste as the heat source
• Methanol may be sold on the open market or to a Methanol To Gasoline (MTG)(4) plant
• Steam is generated in the process that can be sold on contract or used to produce electricity
Spent sorbent can be sold for agriculture use or road grit.
Only non-usable ash need be interred in the landfill.
Bio-gas can be converted to methanol using existing process technology
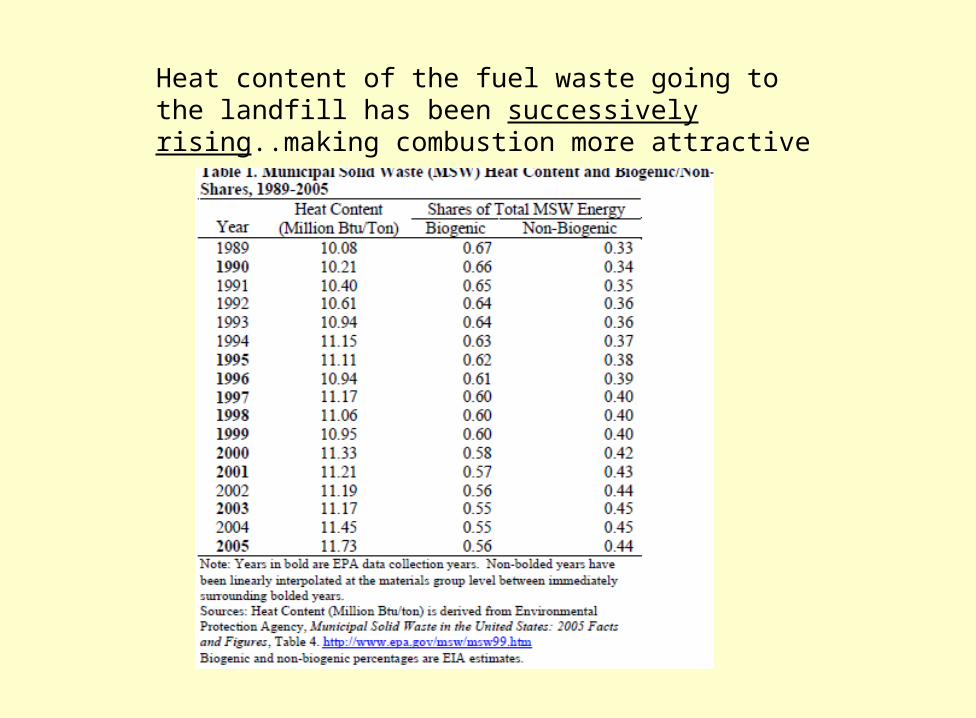
Heat content of the fuel waste going to the landfill has been successively rising..making combustion more attractive
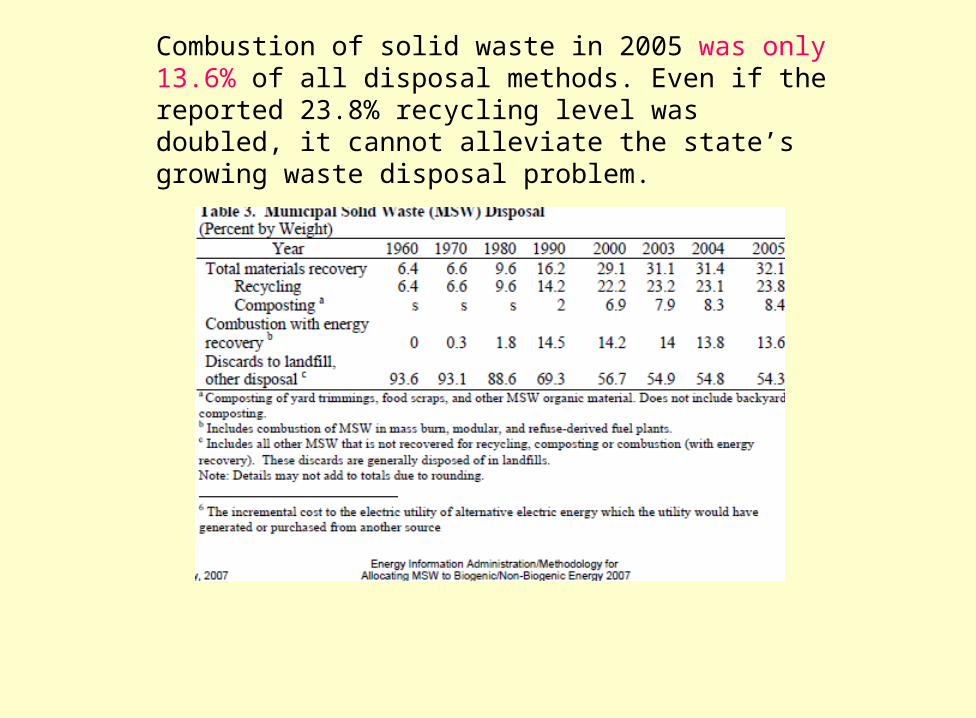
Combustion of solid waste in 2005 was only 13.6% of all disposal methods. Even if the reported 23.8% recycling level was doubled, it cannot alleviate the state’s growing waste disposal problem.
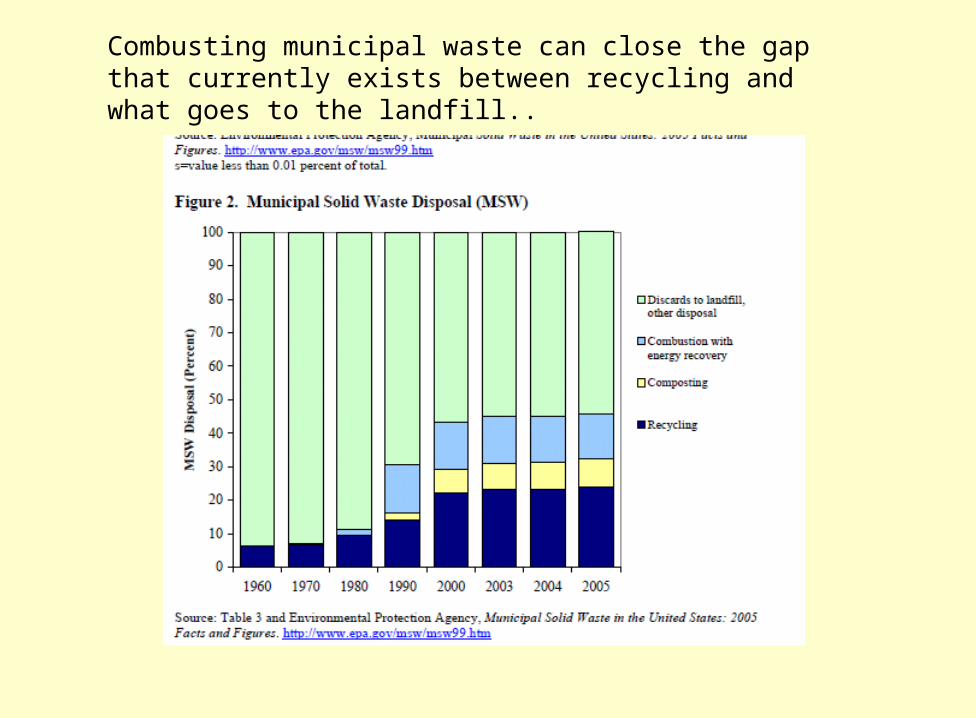
Combusting municipal waste can close the gap that currently exists between recycling and what goes to the landfill..

Carbon: 39.9%Hydrogen: 5.4%Sulfur: 0.12%Oxygen: 33.98%Nitrogen: 0.3%H20: 13.5%Ash: 6.8%
Typical 1984 Municipal Waste Composition by weight, 8.9 million Btu/ton...
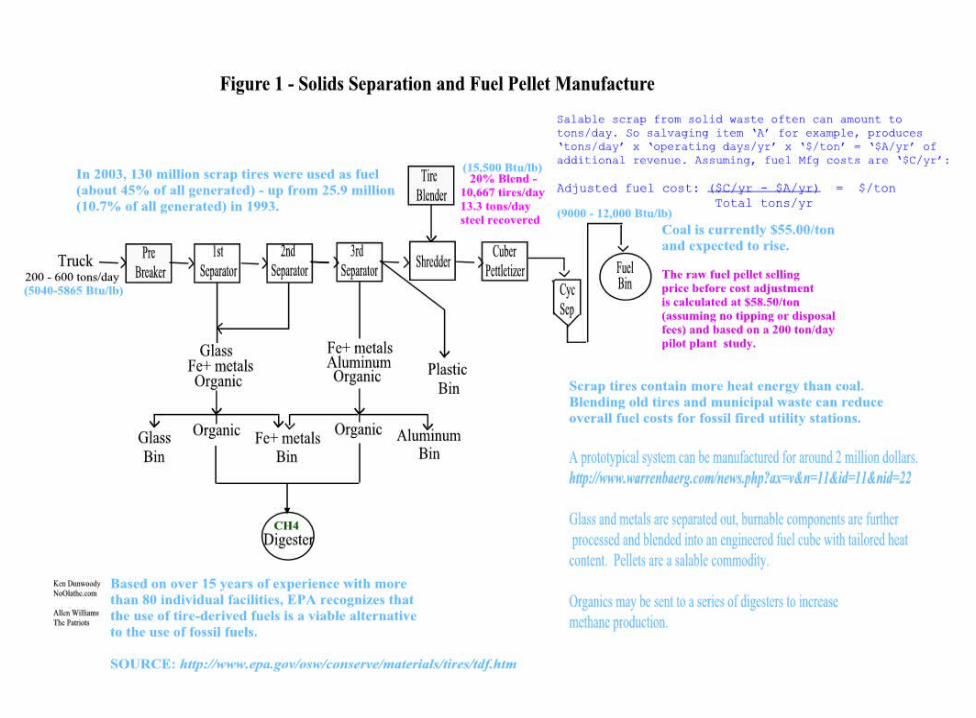
Mechanical separation will remove glass, cans and plastics from the collected waste for recycling before the combustion process.
Process modeling studies with this composition have demonstrated that 11 to 30+ tons per hour of solid waste can be combusted to make methanol, a synthetic fuel feedstock and generate steam. The tons of waste consumed depend on unit operating conditions and the type of combustor.
Emissions can be kept low using calcium carbonate injection into the Furnace.
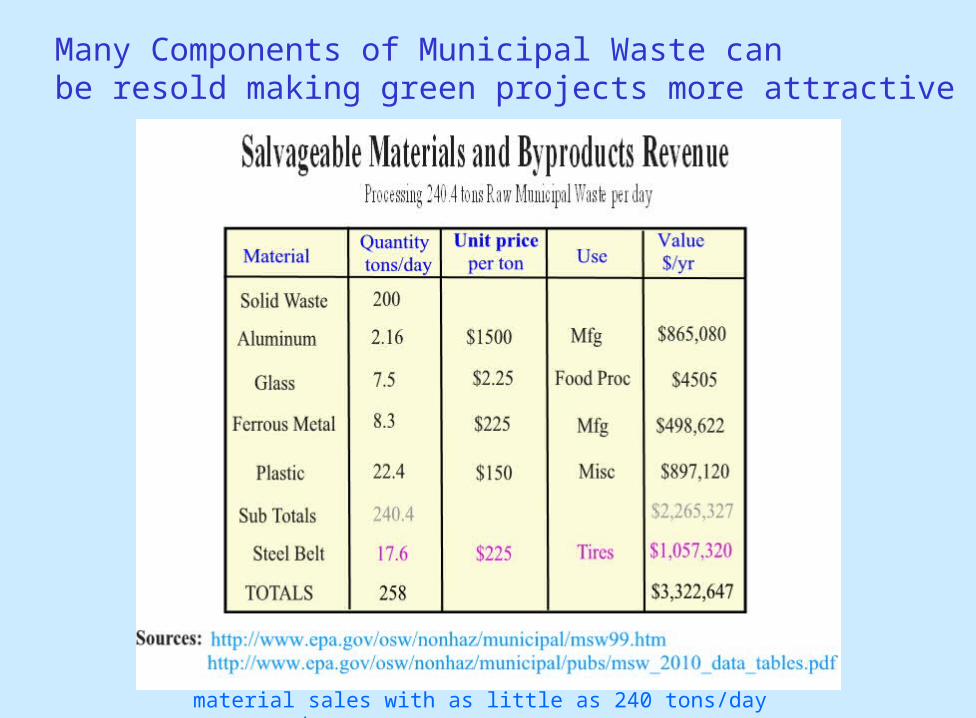
Many Components of Municipal Waste can be resold making green projects more attractive
Blending solid waste & scrap tires adds an additional $1,057,320 per year in salvage material sales with as little as 240 tons/day processed.

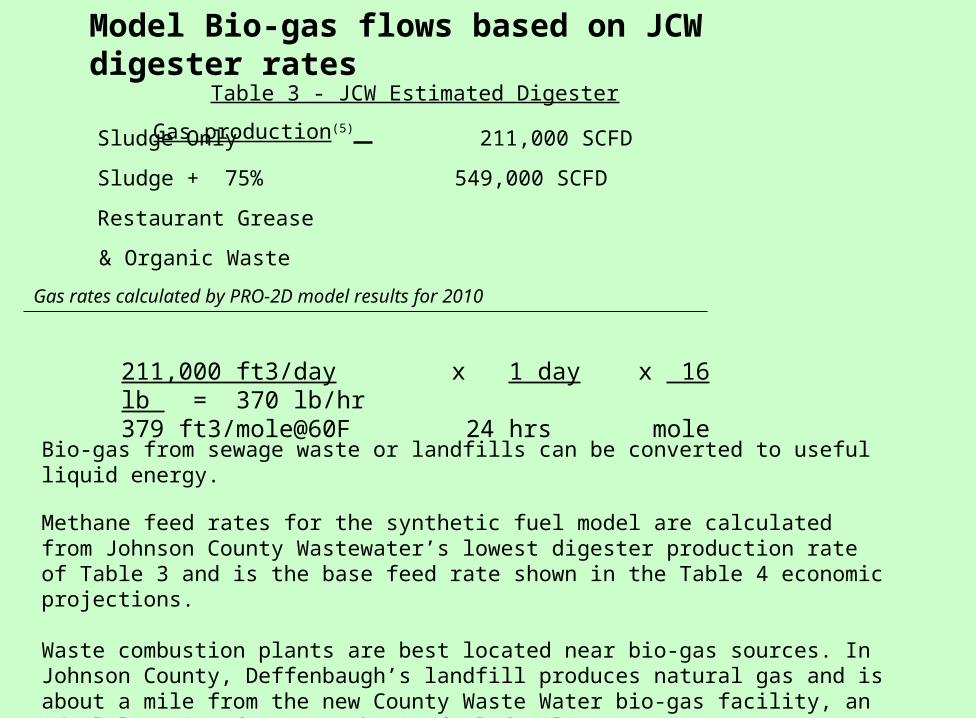
Bio-gas from sewage waste or landfills can be converted to useful liquid energy.
Methane feed rates for the synthetic fuel model are calculated from Johnson County Wastewater’s lowest digester production rate of Table 3 and is the base feed rate shown in the Table 4 economic projections.
Waste combustion plants are best located near bio-gas sources. In Johnson County, Deffenbaugh’s landfill produces natural gas and is about a mile from the new County Waste Water bio-gas facility, an ideal location for a synthetic fuel facility.
211,000 ft3/day x 1 day x 16 lb = 370 lb/hr379 ft3/mole@60F 24 hrs mole
Table 3 - JCW Estimated Digester Gas production(5)
Sludge Only 211,000 SCFD
Sludge + 75% 549,000 SCFD
Restaurant Grease
& Organic Waste
Gas rates calculated by PRO-2D model results for 2010
Model Bio-gas flows based on JCW digester rates

Syn-Fuel - from a Plan to a Reality (Special Requirements) - NONE
- All processes exist today -- All technology exists today -
Syn-Fuel Model
- Conveying new Fuel pellets
- satisfies material & energy balance
- based on real sizes & throughputs
- uses real kinetic rate data
- obeys the laws of conservation of mass and energy - conforms to the laws of thermodynamics
The computer model facilitates the design of artificial fuel and the feasibility of combustion processes utilizing this technology.
Model Development and Predictive Results were Published in the July 2012 issue titled,‘Evaluating Green Projects’
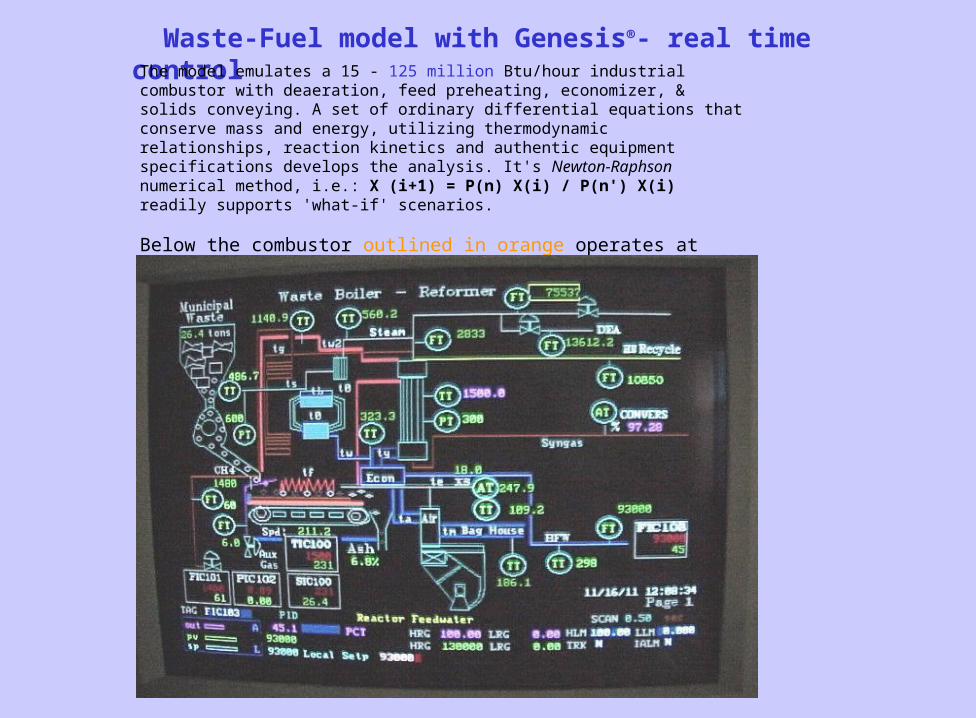
Waste-Fuel model with Genesis®- real time control The model emulates a 15 - 125 million Btu/hour industrial combustor with deaeration, feed preheating, economizer, & solids conveying. A set of ordinary differential equations that conserve mass and energy, utilizing thermodynamic relationships, reaction kinetics and authentic equipment specifications develops the analysis. It's Newton-Raphson numerical method, i.e.: X (i+1) = P(n) X(i) / P(n') X(i) readily supports 'what-if' scenarios.
Below the combustor outlined in orange operates at 1500°F, generating 75,000+ lbs/hr of 600 psi (560.2-486), 74.2°F superheated steam and syn-gas, matching its refinery prototype. 26.4 tons per hour of solid waste are consumed each hour.
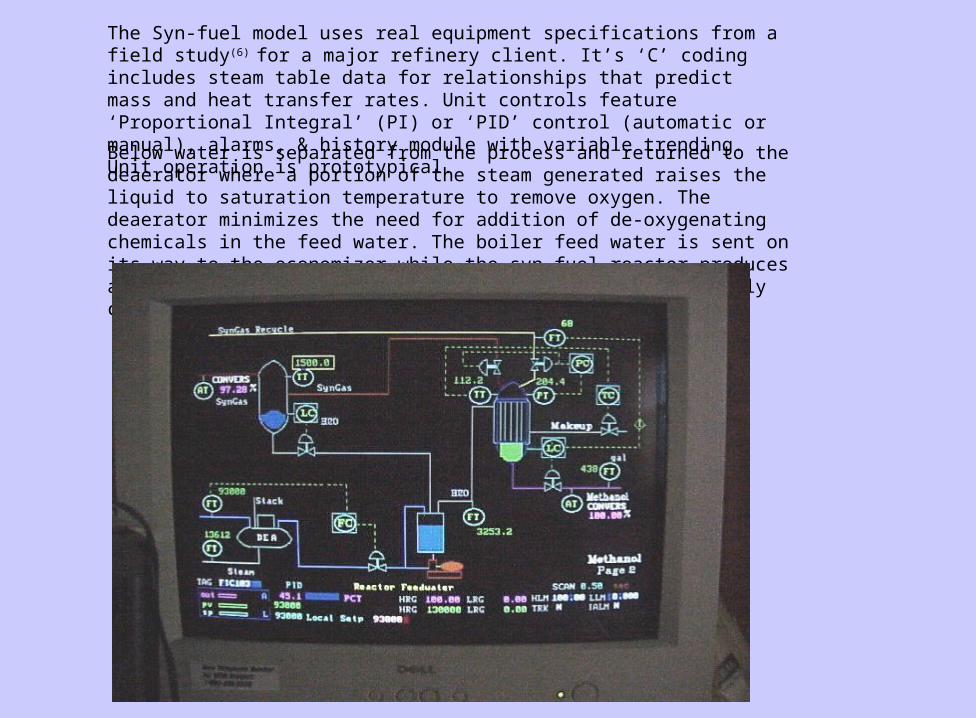
The Syn-fuel model uses real equipment specifications from a field study (6) for a major refinery client. It’s ‘C’ coding includes steam table data for relationships that predict mass and heat transfer rates. Unit controls feature ‘Proportional Integral’ (PI) or ‘PID’ control (automatic or manual), alarms, & history module with variable trending. Unit operation is prototypical.
Below water is separated from the process and returned to the deaerator where a portion of the steam generated raises the liquid to saturation temperature to remove oxygen. The deaerator minimizes the need for addition of de-oxygenating chemicals in the feed water. The boiler feed water is sent on its way to the economizer while the syn-fuel reactor produces anhydrous methanol. (Process control strategies are easily configured and tested.)

Waste Combustor Emissions(7)
SO2: Calcium carbonate is injected into the furnace with the waste fuel forming calcium oxide: CaCO3 CaO + CO2
CaO reacts with the SO2 in an exothermic chemical reaction called sulfation. This chemical process is temperature sensitive and the reaction rate is greatest between 1500F and 1600F. The model predicts 122,304 lbs/year of SO2 generation in the production of syn-gas of which 96% is captured, releasing just 4892 lbs/year to the stack.
CaO + SO2 + ½O2 CaSO4 The reaction typically removes 96% of the SO2.
EPA’s Clean Air Interstate Rule (CAIR) annual caps on emissions are 2.5 million tons of SO2 in the year 2015.
Furnace effluent is filtered in the bag house where fly ash is removed prior to stack release.
Thermal NOx: Nitrogen-oxygen compounds are formed during high temperature combustion processes. The nitrogen in the air is oxidized when the nitrogen and oxygen are dissociated and recombine to form NOx. The three principal reactions are:
(1) N2 + O N2O (2) N + O2 NO2 (3) N + OH NO + H+
The rate of reaction is temperature sensitive and oxygen dependent. The reaction becomes exponential above 2200F. EPA’s annual caps on NOx are 1.3 million tons in the year 2015.

Reducing NOx with primary air
The solid waste combustor is to operate between 1500F and 1600F to limit the formation of nitrogen compounds. Predicted emissions (in red above) for this temperature range and % excess air match the literature pilot studies well.
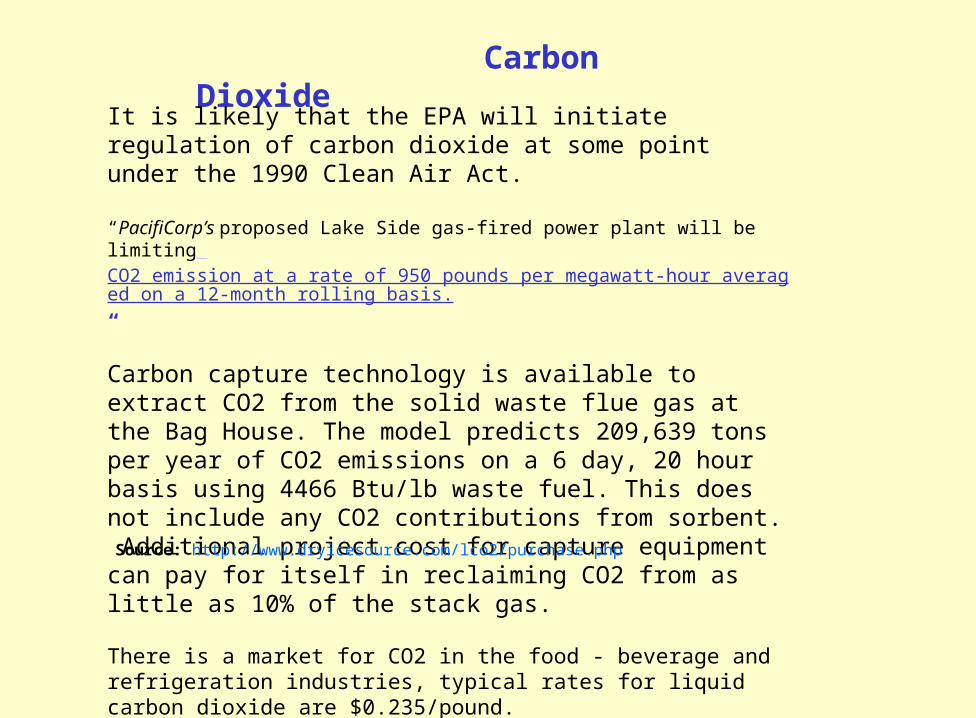
Carbon Dioxide
It is likely that the EPA will initiate regulation of carbon dioxide at some point under the 1990 Clean Air Act.
“PacifiCorp’s proposed Lake Side gas-fired power plant will be limiting CO2 emission at a rate of 950 pounds per megawatt-hour averaged on a 12-month rolling basis.“
Carbon capture technology is available to extract CO2 from the solid waste flue gas at the Bag House. The model predicts 209,639 tons per year of CO2 emissions on a 6 day, 20 hour basis using 4466 Btu/lb waste fuel. This does not include any CO2 contributions from sorbent. Additional project cost for capture equipment can pay for itself in reclaiming CO2 from as little as 10% of the stack gas.
There is a market for CO2 in the food - beverage and refrigeration industries, typical rates for liquid carbon dioxide are $0.235/pound.
Source: http://www.dryicesource.com/lco2/purchase.php

Monthly Rate8/10/00 9/1/01 9/1/02
Basic ServiceCharge $5.00 $6.00 $7.00 per customer per month
Commodity Charge Billing Months of June through November$6.55 $6.75 $6.95 per 1000 lbs. for the first 200,000 lbs.
$6.90 $7.15 $7.35per 1000 lbs. for all 1000 lbs. over200,000 lbs.
Billing Months of December through May$6.65 $6.85 $7.05 per 1000 lbs for the first 200,000 lbs.
$7.00 $7.25 $7.45per 1000 lbs. for all 1000 lbs. over200.000 lbs.
Source: http://www.lbwl.com/adm/0005-stm-rates.htm
Steam generation helps pay for combusting the waste. The following are typical of steam sales..
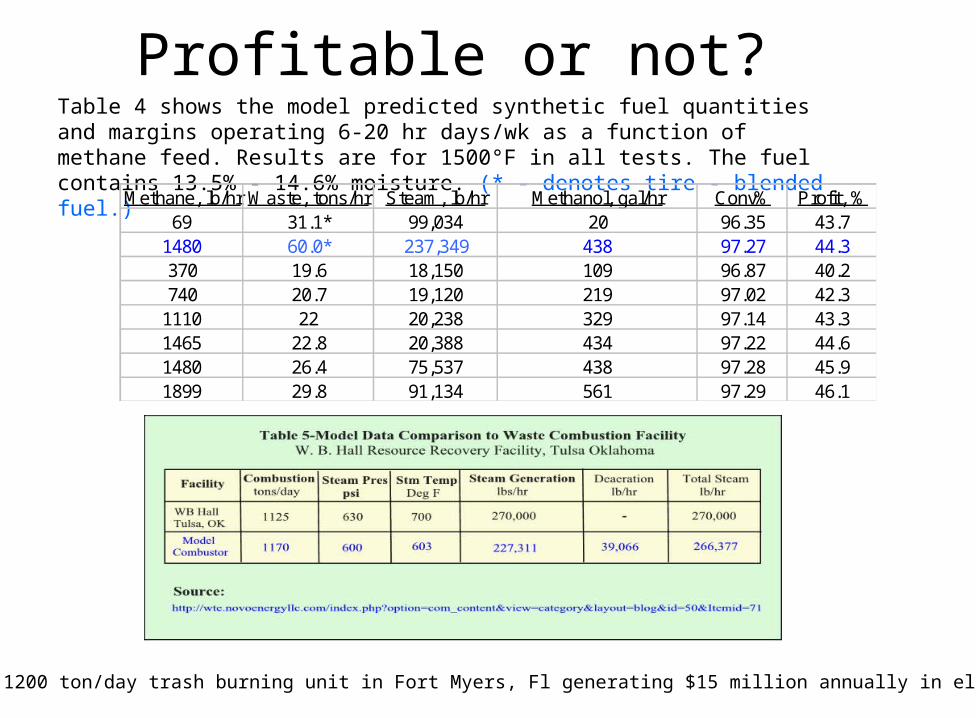
Profitable or not?Table 4 shows the model predicted synthetic fuel quantities and margins operating 6-20 hr days/wk as a function of methane feed. Results are for 1500°F in all tests. The fuel contains 13.5% - 14.6% moisture. (* - denotes tire - blended fuel.)
Methane, lb/hr Waste, tons/hr Steam, lb/hr Methanol, gal/hr Conv% Profit, %69 31.1* 99,034 20 96.35 43.7
1480 60.0* 237,349 438 97.27 44.3370 19.6 18,150 109 96.87 40.2740 20.7 19,120 219 97.02 42.3
1110 22 20,238 329 97.14 43.31465 22.8 20,388 434 97.22 44.61480 26.4 75,537 438 97.28 45.91899 29.8 91,134 561 97.29 46.1
Covanta operates a 1200 ton/day trash burning unit in Fort Myers, Fl generating $15 million annually in electricity sales.

Steam Generation Increases Solid Waste Consumption and Improves Profitability
Most plants will have an anticipated 40 year life span and cost about the same as WB Hall in Tulsa, OK.
A feasibility estimate of the modeled process capitalized equipment, exclusive of environmental permits, indicates a cost of $120, 000, 000 (8) for a comparable Covanta plant. An estimate of the depreciable equipment yields $37, 445,983. Assuming a 10% salvage value for the process equipment and a 40-year useful plant life, the annual straight-line depreciation is:
S.L. = $37,445,983 - 3,744,598 = $842,535/yr 40Methanol: 438 gal/hr x 20 hrs/day x $1.05/gal = $9198/day. The predicted steam generation gross profit:
Steam: $245,107 lbs/hr x $8.58/1000lbs x 20 hrs/day = $42,060.36/day (Alternatively, about 4+ Megawatts can be generated)
Annual revenue is: ($42,060.36 + $9198) x 313 working days/year = $16,043,867. The predicted pay out period, assuming no interest charges:
$120, 000, 000 = 7.11 years (Pay out increases to 8.6 years without methanol production)$842,535 + $16,043,867

30 tons per hour was selected as a convenient breakpoint for evaluating the blended fuels. Fuel moisture for these tests ran between 13% and 16% depending on blend composition.
The dashed lines represent the model-predicted pre-tax profits, adjusted for inflation. The lowerdashed line demonstrates the effect of a 20% decrease in plant throughput causing a 10%profitability loss.
The municipal waste combustion process continues to demonstrate a positive profit margin, even at the lowest commodity prices for steam and methanol.

Valuable fuel resources are being buried in the ground at a time of rising oil prices and petroleum supply caps initiated by the federal government.
Why bury Energy in the Ground?
* Synthetic fuels pay for combusting the waste and increase the local supply of motor grade fuel without the need for food based synthetics like ethanol.
* At 60 tons/hr waste combustion capacity, 24% less solids will go to a landfill.
* Syn-fuel production creates jobs and new revenue sources for the state with out new taxes.
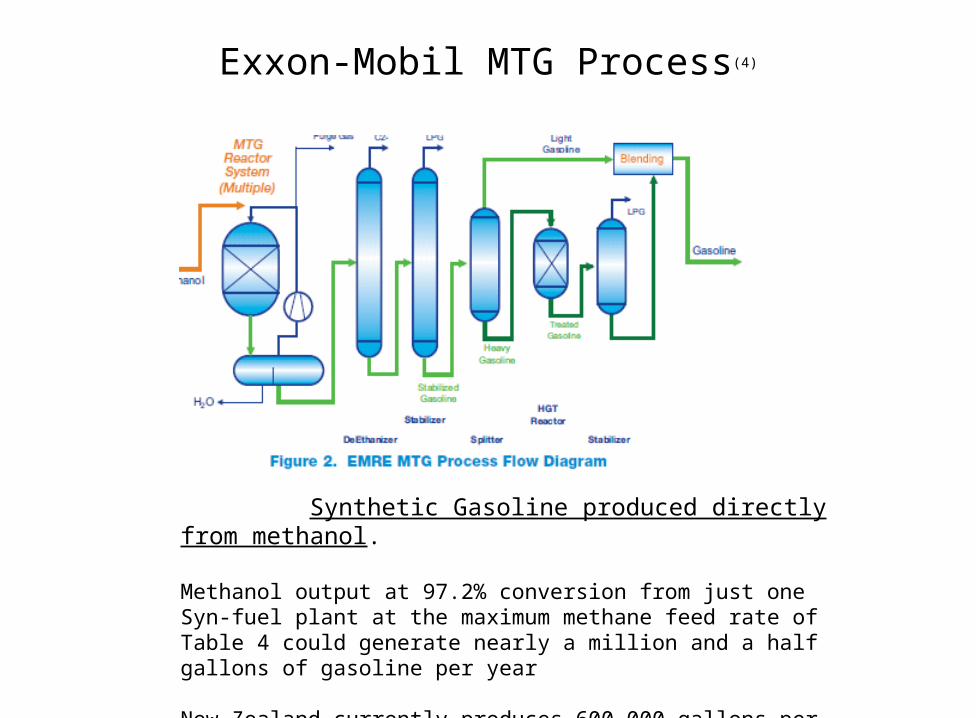
Exxon-Mobil MTG Process(4)
Synthetic Gasoline produced directly from methanol.
Methanol output at 97.2% conversion from just one Syn-fuel plant at the maximum methane feed rate of Table 4 could generate nearly a million and a half gallons of gasoline per year
New Zealand currently produces 600,000 gallons per year by this process

Exxon-Mobil Syn-Fuel Quality(low benzene and no sulfur contaminants)
Synthetic gasoline quality is superior to refinery processed gasoline
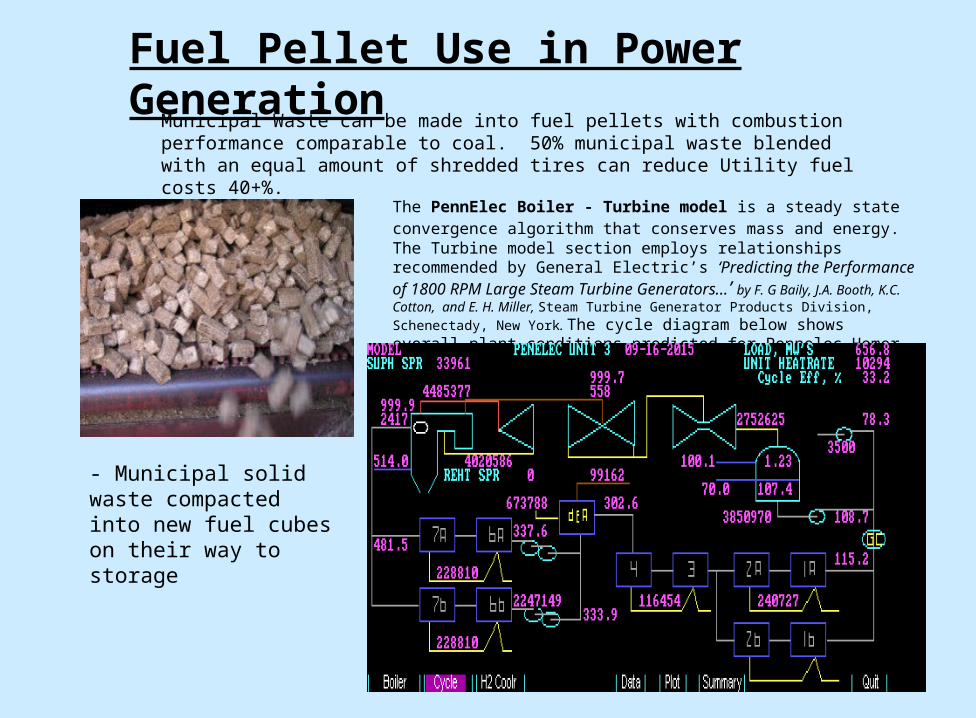
- Municipal solid waste compacted into new fuel cubes on their way to storage
Fuel Pellet Use in Power Generation
Municipal Waste can be made into fuel pellets with combustion performance comparable to coal. 50% municipal waste blended with an equal amount of shredded tires can reduce Utility fuel costs 40+%.
The PennElec Boiler - Turbine model is a steady state convergence algorithm that conserves mass and energy. The Turbine model section employs relationships recommended by General Electric’s ‘Predicting the Performance of 1800 RPM Large Steam Turbine Generators...’ by F. G Baily, J.A. Booth, K.C. Cotton,
and E. H. Miller, Steam Turbine Generator Products Division, Schenectady, New York. The cycle diagram below shows overall plant conditions predicted for Pennelec Homer City - Unit 3. The base is 100% coal.
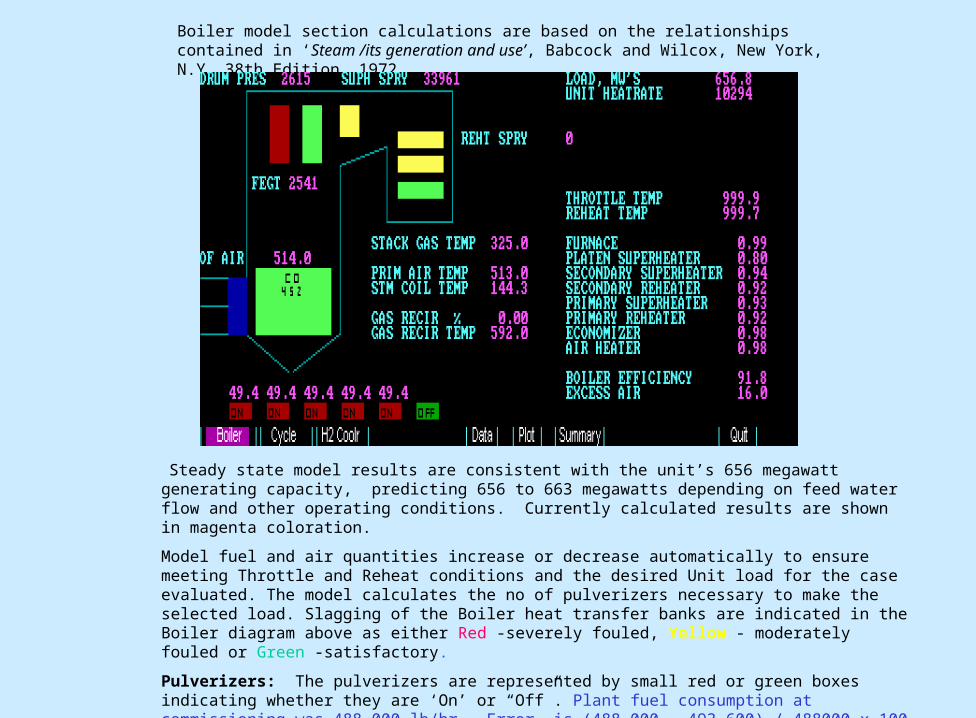
Steady state model results are consistent with the unit’s 656 megawatt generating capacity, predicting 656 to 663 megawatts depending on feed water flow and other operating conditions. Currently calculated results are shown in magenta coloration.
Model fuel and air quantities increase or decrease automatically to ensure meeting Throttle and Reheat conditions and the desired Unit load for the case evaluated. The model calculates the no of pulverizers necessary to make the selected load. Slagging of the Boiler heat transfer banks are indicated in the Boiler diagram above as either Red -severely fouled, Yellow - moderately fouled or Green -satisfactory.
Pulverizers: The pulverizers are represented by small red or green boxes indicating whether they are ‘On’ or “Off”. Plant fuel consumption at commissioning was 488,000 lb/hr. Error is (488,000 - 493,600) / 488000 x 100 = -1.147%
Upper Display: 493600 / (No of Pul ‘On’ x 2000) = 493600 / (5 x 2000) = 49.4
Boiler model section calculations are based on the relationships contained in ‘Steam /its generation and use’, Babcock and Wilcox, New York, N.Y.,38th Edition, 1972

Steam material balance:
The mass balance uses two independent methods to determine flows, (1) The difference in calculated steam extraction flows and (2) a Forward Euler numerical method algorithm that estimates internal turbine flows. The ration of the two methods determines the accuracy of the balance
Drum Flow + Superheat Spray flow = Main Steam Flow
Main Steam flow: 4485377 + 33961 = 4519338 lbs/hr
Reheat Steam Flow: Main Steam Flow - Feed water heaters 7a & 7b - Turbine Leakage
4519338 - 228810 - 228810 - 41132 = 4020586 lbs/hr
Turbine Exhaust: The calculated exhaust flow from extraction steam differences is 2752625 lbs/hr. The estimated exhaust flow from model differential calculations is 2797573 lbs/hr. The calculation error = (2752625 - 2797573) / 2797573 * 100 = -1.606%. Mass Balance Ratio: 2752625 / 2797573 = 0.984

Feedwater Conditions
Unit Emission Summary
Feed water mass balance: 3850970 lbs/hr + 3500 lbs/hr (make-up) + 673788 lbs/hr (drains to DEA) - 33961 lbs/hr = 4494297

Plant Gas, Steam, Air Heater and Feed water Energy Balance:
Energy Usage
Stack gas losses in the Gas Bank Temperature display below may be estimated from the page 3 Furnace Exit Gas quantity and specific heat..
Stack Has Energy Loss: 6357033 lbs/hr x 0.274 Btu/ lb F x (325.5.1F - 80F) = 4.276 E08
Plant HeatRate: PennElec Unit 3 actual was 10,187 Btu/kw The model estimates 10, 294 Btu/kw
Error: (10187 - 10294) / 10187 x 100 = - 1.05%
Energy Balance ratio: 4.375 E09 / 4.55 E09 = 0.961

Energy Balance:
An overall energy balance tabulation was made of all process streams to demonstrate model conservation. Subsequent Unit 3 equipment improvements are not modeled and model architecture has been adjusted so fuel combustion operations are closer to Homer City’s original commissioning.
Former Fuel Analysis: 0.672 % Carbon, 0.046% H2, 0.037% Sulfur, 0.087% O2, 0.013% N2, 0.027% Water, 0.118% Ash
Current Analysis: 0.75 % Carbon, 0.05% H2, 0.023% Sulfur, 0.0670% O2, 0.015% N2, 0.025% Water, 0.07% Ash
Total Heat input to Boiler:
Coal Consumed * Heat content of Coal - Stack Gas Loss + Energy input to Air heater
Heat In: Boiler: Coal flow * [Carbon content + Hydrogen Content] * Low Heating Value = Energy input
Stack Loss: Flue Gas Effluent * Heat capacity of Flue gas * (Stack gas Temp - Ambient Temp)
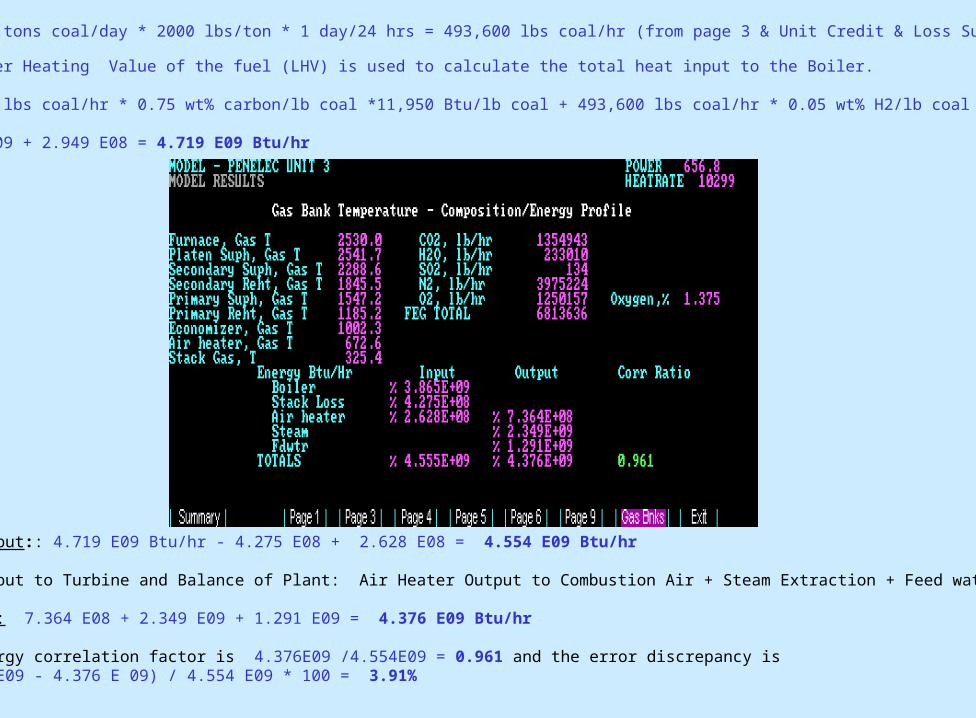
Net output:: 4.719 E09 Btu/hr - 4.275 E08 + 2.628 E08 = 4.554 E09 Btu/hr
Heat Input to Turbine and Balance of Plant: Air Heater Output to Combustion Air + Steam Extraction + Feed water heating
Turbine: 7.364 E08 + 2.349 E09 + 1.291 E09 = 4.376 E09 Btu/hr
The energy correlation factor is 4.376E09 /4.554E09 = 0.961 and the error discrepancy is (4.554 E09 - 4.376 E 09) / 4.554 E09 * 100 = 3.91%
5923.21 tons coal/day * 2000 lbs/ton * 1 day/24 hrs = 493,600 lbs coal/hr (from page 3 & Unit Credit & Loss Summary)
The Lower Heating Value of the fuel (LHV) is used to calculate the total heat input to the Boiler.
493,600 lbs coal/hr * 0.75 wt% carbon/lb coal *11,950 Btu/lb coal + 493,600 lbs coal/hr * 0.05 wt% H2/lb coal *11,950 Btu/lb coal
4.424 E09 + 2.949 E08 = 4.719 E09 Btu/hr

Site Power
Generation: 0.95 Power Factor
Gross Power: 676, 510 KW - 17, 539 KW - 2148 KW - 4.35 KW
Net Power = 656, 819 KW or 656.8 Megawatts (MW) an exact match of plant output for these conditions.
Actual Plant power generation is 656.8 Megawatts at 4497326 lbs/hr feedwater flow. The model predicts 656.8 MW at 4494298 (Pg 4)feedwater flow. Correcting for flow discrepancy: 4497326 / 4494298 * 656,819 = 657.3 MW.
Error is (656.8 - 657.3) / 656.8 = - 0.076%
Hydrogen Coolers:
The model was revised to allow makeup water to be blended with hot condensate before entering the hydrogen coolers. The heat transferred from the Generator demineralized water system is picked up by the heat exchanger and transferred to the condensate exiting the coolers. This modification enabled unit megawatt predictions to match the Homer City plant.

The Case For Engineered FuelHomer City, Unit 3 typically consumes approximately 1,600,000 tons of compliance coal per year.
A wet scrubber flue gas desulfurization system for Unit 3 was installed in 2001, which enables this unit tobe able to burn less expensive, higher sulfur coal, while still meeting environmental standards for emissioncontrol. SOURCE: http://www.getfilings.com/o0000912057-02-012778.html
Full load conditions were achieved even at the lowest fuel heat content of 9958 Btu/lb. Heat rates for wastefuel combustion are comparable to, and in some cases somewhat better than, the unit’s coal composition.The big advantage in engineered fuels is in lower sulfur emissions and generating costs.
Sulfur Reduction (worst case): (217.58 - 172.59)/ 217.58 x 100 = 20.7%Anticipated Fuel Savings: ($0.02302 - 0.01433)/ 0.02302 x 100 = 37.7%

Sources1. "Life-Cycle Assessment of Waste Management Greenhouse Gas Emissions Using Municipal Waste Combustor Data", J. Envir. Engrg. 136, 749 (2010); doi:10.1061/(ASCE)EE.1943-7870.0000189 (7 pages), Brian Bahor, Michael Van Brunt, P.E., Keith Weitz, and Andrew Szurgot
2. "Methodology for Allocating Municipal Solid Waste to Biogenic and Non-Biogenic Energy", Energy Information Administration, Office of Coal, Nuclear, Electric and Alternate Fuels, May 2007 Report
3. "Wastes - Non-Hazardous Waste - Municipal Solid Waste", http://www.epa.gov/msw/msw99.htm
4. "Methanol to Gasoline (MTG) Production of Clean Gasoline from Coal", Exxon-Mobil Research and Engineering Report, 2008
5. “Stepping on the Gas to Sustainability”, A&WMA Midwest Section Annual Environmental Conference, Jan 2011
6. “Hydrogen Controllability Study”, Brown & Root (ITI) company report, May 1989
7. “Bubbling Fluid Bed Boiler Emissions Firing Bark & Sludge”, D.L. Kraft, B&W, TAPPI Engineering Conference, Sept 1998
8. U.S. Environmental Protection Agency Office of Resource Conservation and Recovery, http://www.epa.gov/osw/nonhaz/municipal/pubs/msw_2010_data_tables.pdf “Municipal Solid Waste Generation, Recycling, and Disposal in the United States Tables and Figures for 2010”, Tables 1 - 29, Nov 2011
RETURN