Embed Size (px)
Citation preview
Long-wave infrared imaging ofvegetation for detecting leaking CO2 gas
Jennifer E. JohnsonJoseph A. ShawRick LawrencePaul W. NugentLaura M. DobeckLee H. Spangler
Downloaded From: http://remotesensing.spiedigitallibrary.org/ on 12/18/2012 Terms of Use: http://spiedl.org/terms
Long-wave infrared imaging of vegetation fordetecting leaking CO2 gas
Jennifer E. Johnson,a Joseph A. Shaw,a Rick Lawrence,b
Paul W. Nugent,a Laura M. Dobeck,c and Lee H. SpanglerdaMontana State University, Electrical and Computer Engineering Department, Bozeman,
Montana [email protected]
bMontana State University, Land Resources and Environmental Sciences Department,Bozeman, Montana 59717-3120
cEnergy Research Institute, Montana State University, Bozeman, Montana 59717-2465dMontana State University, Chemistry and Biochemistry Department, Bozeman,
Montana 59717-3780
Abstract. The commercial development of uncooled-microbolometer, long-wave infrared(LWIR) imagers, combined with advanced radiometric calibration methods developed atMontana State University, has led to new uses of thermal imagery in remote sensing applications.One specific novel use of these calibrated imagers is imaging of vegetation for CO2 gas leakdetection. During a four-week period in the summer of 2011, a CO2 leak was simulated in a testfield run by the Zero Emissions Research and Technology Center in Bozeman, Montana. AnLWIR imager was deployed on a scaffold before and during the CO2 release, viewing a vegeta-tion test area that included regions of high and low CO2 flux. Increased root-level CO2 con-centration caused plant stress that led to reduced thermal regulation of the vegetation, whichwas consistent with increased diurnal variation of IR emission observed in this study. In a linearregression, the IR data were found to have a strong relationship to the CO2 emission and to beconsistent with the location of leaking CO2 gas. Reducing the continuous data set to one imageper day weakened the regression fit, but maintained sufficient significance to indicate that thismethod could be implemented with once-daily airborne images. © 2012 Society of Photo-OpticalInstrumentation Engineers (SPIE). [DOI: 10.1117/1.JRS.6.063612]
Keywords: remote sensing; infrared imaging; thermal imaging; vegetation sensing.
Paper 12283P received Sep. 13, 2012; revised manuscript received . NaN, ; accepted for pub-lication Nov. 12, 2012; published online Dec. 10, 2012.
1 Introduction
The recent increase in availability and capabilities of ultra-compact, uncooled, microbolometerthermal imagers is enabling many new remote sensing applications. However, quantitativelydemanding applications require very careful calibration. At Montana State University, wehave developed novel methods for achieving and maintaining radiometric calibration forwide-angle, long-wave infrared (LWIR) microbolometer imagers, initially for measuring cloudsin climate science and Earth-space optical communications.1,2,3 These imagers are an order ofmagnitude smaller and cheaper, while also consuming less power than typical cooled IR imagers.Using the newly developed calibration methods allows the imagers to be calibrated in the labora-tory and deployed in the field without an onboard calibration target, thereby making them idealfor a variety of new remote sensing purposes.
One such application is the IR imaging of vegetation to detect a CO2 gas leak through aninduced change in plant stress. This was demonstrated experimentally in a controlled gas releaseexperiment conducted by the Zero Emissions Research and Technology (ZERT) Center in Boze-man, Montana. The field has been used from 2007 to 2012 for researching methods of detectingleaks at a geologic carbon sequestration facility. Technologies tested in these experiments
0091-3286/2012/$25.00 © 2012 SPIE
Journal of Applied Remote Sensing 063612-1 Vol. 6, 2012
Downloaded From: http://remotesensing.spiedigitallibrary.org/ on 12/18/2012 Terms of Use: http://spiedl.org/terms

include optical spectroscopic detection of gas leakage4 and hyperspectral and multispectralimaging to observe changes in the reflectance of vegetation exposed to elevated concentrationsof CO2 gas.
5–9 Here, we report on the use of LWIR imaging of vegetation to locate the leakinggas. The premise behind imaging the vegetation is that higher CO2 concentrations in the soil willstress the vegetation, leading to measurable changes in long-wave emission. Higher gas con-centrations in soil could result in less oxygen and water being drawn from the soil into theroots, causing the leaf stomata to close and changing the reflectance and emission propertiesof the vegetation. The mechanism that we expect will lead to changed LWIR emission is thatthe stressed vegetation experiences a reduced rate of transpiration,10 causing an impaired abilityto regulate its own temperature as the ambient air temperature changes during the day and night.During the summers of 2009, 2010, and 2011, we deployed a radiometrically calibrated LWIRmicrobolometer-based imager in the field to compare the radiance of exposed vegetation withthat of healthy vegetation, thereby identifying CO2 gas leak locations.
Thermal imaging of vegetation has been used numerous times in various studies. Satellite andairborne thermal IR imagers have been used to both classify terrain vegetation11 and determinesurface soil water content.12,13 These studies relate the satellite-derived surface radiant temperatureof the vegetation to the normalized difference vegetation index (NDVI) determined from satellitevisible and near-IR data. Airborne systems have also used thermal IR multispectral scanners tomeasure the thermal energy responses of vegetation for examining the thermal dynamics of urbanvegetation.14 Ground-level IR imagers have been used to determine the leaf-canopy temperaturesof vegetation for predicting high leaf water potential.15,16 Our research expands on these previousefforts to investigate the effect of CO2-induced stress on the thermal responses of vegetation.
2 Methodology
The ZERT field is a hayfield located just west of the Montana State University campus inBozeman, Montana. A horizontal well was buried at a nominal depth of 2 m and divided intosix segments. Approximately 0.55% of the pipe was open to allow the CO2 gas to escape.4 Thegas release periods were July 15 to August 12 in 2009, July 19 to August 15 in 2010, and July 15to August 15 in 2011. The flow rate of the CO2 through the well varied for each year of therelease: 0.2 tons∕day in 2009, 0.15 tons∕day in 2010, and 0.15 tons∕day in 2011.8,9 ReleasedCO2 exited the ground with a highly nonuniform distribution, creating localized regions ofelevated CO2 concentrations that we refer to as hot spots.
Within the ZERT field, a vegetation patch of approximately 400 m2 was the focus of theimaging experiments during the releases. The well ran along a single edge of the vegetationpatch. We deployed vegetation imagers on a 3-m-tall scaffold located at the edge of the vegetationpatch containing the well, as shown in Fig. 1. Images were acquired every 10 minutes throughouteach day for the 2009 CO2 release, every 5 minutes in 2010, and every 1 minute in 2011.
We used a FLIR Systems Inc. photon 320 camera to acquire thermal images at a nominally45° viewing angle. The well ran horizontally though the bottom of the images, and a hot-spotregion was located just to the right of the imaged area. Fig. 2 shows a wide-angle view of thevegetation test area seen from the top of the scaffold in the midst of the gas release experiment,with a white line denoting the approximate location of the underground horizontal well. The hotspot was at this time becoming visible to the eye, just below the white camera housing at thelower center portion of the image; however, the thermal images detected changes in the vegeta-tion near this hot spot well before the changes were visually obvious. We did not directly imagethe center of the hot spot because vegetation there degraded rapidly during the release experi-ment; rather, we used image pixels near the edge of the hot spot as a test region and pixels farfrom the hot spot as control regions.
The images were radiometrically calibrated to radiance [W∕ðm2 srÞ] using techniques devel-oped at Montana State University, which rely on full characterization of the camera with a large-area blackbody source operated with the camera inside a thermal chamber to calibrate the imagerat multiple operating temperatures.17 Custom MATLAB software (MathWorks, Natick, Massa-chusetts) was used to select regions of interest in the images. Images acquired in 2009 and 2010used a test region adjacent to the CO2 hot spot and a single control region at the upper-left edge
Johnson et al.: Long-wave infrared imaging of vegetation for detecting leaking . . .
Journal of Applied Remote Sensing 063612-2 Vol. 6, 2012
Downloaded From: http://remotesensing.spiedigitallibrary.org/ on 12/18/2012 Terms of Use: http://spiedl.org/terms

of the vegetation images, where the CO2 flux is generally near the background level. For the2011 data, two control regions were chosen, which we refer to as a horizontal control region anda vertical control region (owing to their locations relative to the hot spot), along with the hot-spotregion. Fig. 3 shows the location of the two control regions and the hot-spot region used togenerate the statistical radiance values for the 2011 images.
We chose to use two control regions to investigate concerns over the camera viewing angle.Since the thermal IR imager viewed such a large area of vegetation from relatively close to thesurface, the viewing angle changed notably between the bottom and top of the images. Using acontrol region in the same horizontal line as the hot-spot region, in addition to the control region
Fig. 1 Scaffold used to mount the thermal IR imager (in the white tube) and a visible-near-infraredmultispectral imager (in the white box with the open back).
Fig. 2 Wide-angle view of the vegetation test area (lower left) at the ZERT field in Bozeman,Montana, with the white line indicating the approximate location of the underground well fromwhich CO2 gas was released.
Johnson et al.: Long-wave infrared imaging of vegetation for detecting leaking . . .
Journal of Applied Remote Sensing 063612-3 Vol. 6, 2012
Downloaded From: http://remotesensing.spiedigitallibrary.org/ on 12/18/2012 Terms of Use: http://spiedl.org/terms

located diagonally from the hot spot, allowed this concern to be addressed by comparing anydifferences in the radiance emitted from both control regions. For each acquired image, wecalculated spatial and temporal statistics of the radiance values as follows: the maximumand minimum differences between each region temperature and the ambient air temperature,the maximum and minimum temperature differences between the horizontal control regionand the hot-spot region, and the maximum and minimum temperature differences betweenthe vertical control region and the hot-spot region. Linear regressions were calculated, usingexperiment day as the response variable and the radiance statistics as predictors.
3 Results
Early images acquired during the 2009 release led us to believe that the high concentrations ofCO2 in the soil had a substantial effect on the LWIR emission from the vegetation. Our compar-ison of the diurnal trends, or daily brightness temperature time-series plots, from before and afterthe release shows a divergence of the hot-spot vegetation from the control region vegetation.Examples of these diurnal plots are shown in Fig. 4(a) for July 11, 2009, before the start ofthe release, and in Fig. 4(b) for August 26, 2009, after the end of the CO2 release.
Fig. 3 Sample thermal IR image of the vegetation patch showing the regions of interest for the2011 release: (a) the vertical control region, (b) the horizontal control region, and (c) the hot-spotregion.
Fig. 4 Diurnal variation of the vegetation brightness temperature for (a) July 11, 2009, before thestart of the CO2 release and (b) August 26, 2009, after the end of the CO2 release (the horizontalaxes show a 24-hour period, plotted from midnight to midnight).
Johnson et al.: Long-wave infrared imaging of vegetation for detecting leaking . . .
Journal of Applied Remote Sensing 063612-4 Vol. 6, 2012
Downloaded From: http://remotesensing.spiedigitallibrary.org/ on 12/18/2012 Terms of Use: http://spiedl.org/terms

These plots show that the vegetation initially cooled off during the night and then graduallywarmed up due to solar heating during the daytime. The vegetation reached a maximum tem-perature in the afternoon, at which point it began cooling off with lower solar elevation anglesin the late afternoon. Before the start of the release, both the control region and the hot-spotregion behaved nearly identically. However, this changed by the end of the gas release experi-ment, as shown in Fig. 4(b). The same solar heating trends were observed in the diurnal plotsfrom before and after the CO2 release; however, there was a notable difference between thecontrol region and the hot-spot region during the warmest portion of the day by the end of therelease [Fig. 4(b)]. This provided evidence that the higher concentration of CO2 in the soil atthe hot-spot region was affecting the vegetation and impairing the vegetation’s ability to reg-ulate its temperature.
Motivated by the intriguing patterns observed in the 2009 diurnal data, we conductedextended deployments of the thermal imager at the vegetation test field during gas releasesin the summers of 2010 and 2011. Here, we show the results from the 2011 deployment,which again showed a difference in diurnal trends between the two control regions and thehot-spot region. Figure 5 shows that this difference was also readily observable in thermalimages acquired before and after the release.
The vegetation nearest to the hot-spot region showed markedly higher temperatures thanthe vegetation that was unexposed to leaking CO2. Figure 6 shows time-series plots of(a) the maximum temperature difference between the three regions and the ambient air
Fig. 5 LWIR images acquired at 10 a.m. (Mountain Daylight Time) on July 13, 2011 (a) andAugust 10, 2011 (b).
Fig. 6 Maximum temperature differences plotted versus day of the 2011 release, with the verticallines representing the start and end of the gas release: (a) temperature difference between eachvegetation region and the ambient air temperature, (b) temperature difference between the hotspot and each control region.
Johnson et al.: Long-wave infrared imaging of vegetation for detecting leaking . . .
Journal of Applied Remote Sensing 063612-5 Vol. 6, 2012
Downloaded From: http://remotesensing.spiedigitallibrary.org/ on 12/18/2012 Terms of Use: http://spiedl.org/terms
temperature, and (b) the maximum temperature difference between the two control regions andthe hot-spot region. These two plots were found to yield the strongest coefficients of determina-tion (R2 values). Both control regions behaved similarly, while the hot-spot region was distin-guishable from both of them. The temporal change of temperature near the hot spot consistentlyhad a steeper slope than the change in either of the control regions. The similarity between theregression lines for the two control regions indicated that there was no major concern over thecamera viewing angle.
The time-series plot of region differences in Fig. 6(b) is of particular interest since it shows adistinct change in the hot-spot brightness temperature almost immediately after the start of theCO2 release. Conversely, plots showing the minimum difference in region and air temperatureeach day and the minimum difference in region temperatures each day gave extremely low R2
values and provided very little useful information. The regression for the minimum difference inregion and air temperature resulted in the following R2 values: 0.112 (vertical control region),0.066 (horizontal control region), and 0.090 (hot-spot region). The minimum region differenceregression resulted in the following R2 values: 0.003 (vertical control region) and 0.003(horizontal control region).
We also found that it is possible to use images acquired during shorter time periods instead ofrelying on continual 24-hour time series. When we limited the data to the midday hours of10 a.m. to 2 p.m., the R2 values changed modestly. For the maximum difference of regionand air temperatures, similar to Fig. 6(a), we found R2 ¼ 0.288 at the vertical control, 0.006at the horizontal control, and 0.691 at the hot spot. For the maximum difference of region tem-peratures, similar to Fig. 6(b), we found R2 ¼ 0.800 for hot–spot vertical and 0.796 for hot–spothorizontal.
To explore the possibility of using thermal imaging for monitoring large areas or pipelines,perhaps from airborne platforms, we repeated the regressions using data from 1 p.m. and 3 a.m.,near the maximum and minimum temperature extremes of each day. In this case, the R2 valuesreduced to 0.163 for the vertical control and 0.497 for the hot spot, while increasing slightly to0.272 for the horizontal control. Similar to Fig. 6(a), the hot-spot region still exhibited a steeperslope and a higher R2 value than both control regions.
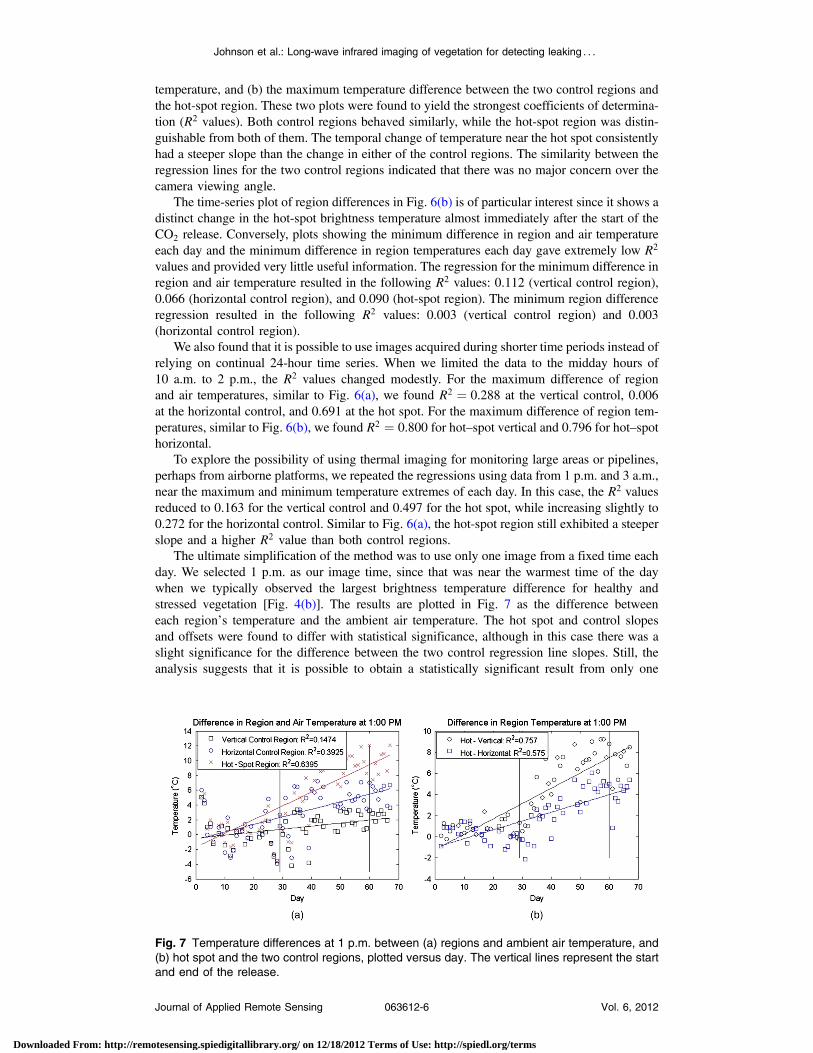
The ultimate simplification of the method was to use only one image from a fixed time eachday. We selected 1 p.m. as our image time, since that was near the warmest time of the daywhen we typically observed the largest brightness temperature difference for healthy andstressed vegetation [Fig. 4(b)]. The results are plotted in Fig. 7 as the difference betweeneach region’s temperature and the ambient air temperature. The hot spot and control slopesand offsets were found to differ with statistical significance, although in this case there was aslight significance for the difference between the two control regression line slopes. Still, theanalysis suggests that it is possible to obtain a statistically significant result from only one
Fig. 7 Temperature differences at 1 p.m. between (a) regions and ambient air temperature, and(b) hot spot and the two control regions, plotted versus day. The vertical lines represent the startand end of the release.
Johnson et al.: Long-wave infrared imaging of vegetation for detecting leaking . . .
Journal of Applied Remote Sensing 063612-6 Vol. 6, 2012
Downloaded From: http://remotesensing.spiedigitallibrary.org/ on 12/18/2012 Terms of Use: http://spiedl.org/terms

image at a fixed time each day. In any of these methods, the thermal images would be used tolocate regions to undergo further testing, and final confirmation of a leak would be made usingin situ sensors.
4 Conclusion
Radiometrically calibrated microbolometer-based thermal imagers can substantially simplify themonitoring of carbon sequestration sites. They require no calibration target at the site, makingimaging easy and practical. Our experiments showed that plant stress is evident in thermalimagery obtained from radiometrically calibrated imagers, allowing detection of vegetationaffected by elevated levels of CO2. Statistically, the thermal images showed a significantdifference between the healthy vegetation and the exposed vegetation. This difference beganalmost immediately after the start of the CO2 release and lasted throughout the test, indicatingthat it was not an artifact of coincidental environmental changes. The rapid change of exposedvegetation within a few days of the start of the CO2 release showed that the thermal images aresensitive to vegetation changes induced by elevated ground-level gas concentrations. In all themaximum temperature difference plots, the hot-spot region was distinguishable from bothcontrol regions. While there was a slight difference between the two control regions, thedifference was small enough to indicate that there was no major concern with the camera viewingangle. A method that relied on a single image instead of continuous imaging was explored andfound to provide a sufficiently strong coefficient of determination for the hot spot. Since the hotspot is noticeably different from either control region, this method proves useful for distinguish-ing among locations with and without CO2 leaks in a large monitoring area, thereby enabling theuse of airborne thermal imaging.
Acknowledgments
This material is based upon work supported by the Department of Energy under awardnumber DE-FE0000397. This report was prepared as an account of work sponsored by anagency of the U.S. government. Neither the U.S. government nor any agency thereof, norany of their employees, makes any warranty, express or implied, or assumes any legal liabilityor responsibility for the accuracy, completeness, or usefulness of any information, apparatus,product, or process disclosed, or represents that its use would not infringe privately ownedrights. Reference herein to any specific commercial product, process, or service by tradename, trademark, manufacturer, or otherwise does not necessarily constitute or imply its endor-sement, recommendation, or favoring by the U.S. government or any agency thereof. The viewsand opinions of authors expressed herein do not necessarily state or reflect those of the U.S.government or any agency thereof.
References
1. J. A. Shaw et al., “Radiometric cloud imaging with an uncooled microbolometer thermalinfrared camera,” Opt. Exp. 13(15), 5807–5817 (2005), http://dx.doi.org/10.1364/OPEX.13.005807.
2. B. Thurairaijah and J. A. Shaw, “Cloud statistics measured with the infrared cloud imager,”IEEE Trans. Geosci. Rem. Sens. 43(9), 2000–2007 (2005), http://dx.doi.org/10.1109/TGRS.2005.853716.
3. P. W. Nugent, J. A. Shaw, and S. Piazzolla, “Infrared cloud imaging in support of Earth-space optical communication,” Opt. Exp. 17(10), 7862–7872 (2009), http://dx.doi.org/10.1364/OE.17.007862.
4. L. H. Spangler et al., “A shallow subsurface controlled release facility in Bozeman,Montana, USA, for testing near surface CO2 detection techniques and transportmodels,” Env. Earth Sci. 60(2), 227–239 (2010), http://dx.doi.org/10.1007/s12665-009-0400-2.
Johnson et al.: Long-wave infrared imaging of vegetation for detecting leaking . . .
Journal of Applied Remote Sensing 063612-7 Vol. 6, 2012
Downloaded From: http://remotesensing.spiedigitallibrary.org/ on 12/18/2012 Terms of Use: http://spiedl.org/terms

5. E. J. Male et al., “Using hyperspectral plant signatures for CO2 leak detection during the2008 ZERT CO2 sequestration field experiment in Bozeman, Montana,” Env. Earth Sci.60(2), 251–261 (2010), http://dx.doi.org/10.1007/s12665-009-0372-2.
6. G. J. Bellante, “Hyperspectral remote sensing as a monitoring tool for geological carbonsequestration,” M.S. Thesis, Montana State University, Bozeman, http://etd.lib.montana.edu/etd/view/item.php?id=1440 (2011).
7. J. H. Rouse et al., “Multi-spectral imaging of vegetation for detecting CO2 leaking fromunderground,” Env. Earth Sci. 60(2), 313–323 (2010), http://dx.doi.org/10.1007/s12665-010-0483-9.
8. J. A. Hogan et al., “Low-cost multispectral vegetation imaging system for detecting leakingCO2 gas,” Appl. Opt. 51(4), 59–66 (2012), http://dx.doi.org/10.1364/AO.51.000A59.
9. J. A. Hogan et al., “Detection of leaking CO2 gas with vegetation reflectance measured by alow-cost multispectral imager,” IEEE J. Selected Topics Appl. Earth Obs. Remote Sens.5(3), 699–706 (2012), http://dx.doi.org/10.1109/JSTARS.2012.2202880.
10. H. G. Jones and E. Rotenberg, “Energy, radiation, and temperature regulation in plants,” inEncyclopedia of Life Sciences, Wiley (2001).
11. C. P. Lo, D. A. Quattrochi, and J. C. Luvall, “Application of high-resolution thermal infraredremote sensing and GIS to assess the urban heat island effect,” Int. J. Remote Sens. 18(2),287–304 (1997), http://dx.doi.org/10.1080/014311697219079.
12. R. R. Gillies and T. N. Carlson, “Thermal remote sensing of surface soil water content withpartial vegetation cover for incorporation into climate models,” J. Appl. Meteorol. 34(4),745–756 (1995), http://dx.doi.org/10.1175/1520-0450(1995)034<0745:TRSOSS>2.0.CO;2.
13. I. Sandholt, K. Rasmussen, and J. Andersen, “A simple interpretation of the surface tem-perature/vegetation index space for assessment of surface moisture status,” Remote Sens.Environ. 79(2–3), 213–224 (2002), http://dx.doi.org/10.1016/S0034-4257(01)00274-7.
14. D. A. Quattrochi, “Analysis of vegetation within a semi-arid urban environment using highspatial resolution airborne thermal infrared remote sensing data,” Atmos. Environ. 32(1),19–33 (1998), http://dx.doi.org/10.1016/S1352-2310(97)00179-9.
15. A. Blum, J. Mayer, and G. Gozlan, “Infrared thermal sensing of plant canopies as a screen-ing technique for dehydration avoidance in wheat,” Field Crop. Res. 5, 137–146 (1982),http://dx.doi.org/10.1016/0378-4290(82)90014-4.
16. I. Leinonen and H. G. Jones, “Combining thermal and visible imagery for estimatingcanopy temperature and identifying plant stress,” J. Exp. Bot. 55(401), 1423–1431(2004), http://dx.doi.org/10.1093/jxb/erh146.
17. P. W. Nugent, J. A. Shaw, and N. J. Pust, “Correcting for focal plane array temperaturedependence in microbolometer infrared cameras lacking thermal stabilization,” Opt. Eng.52(6), in press (2013)
Jennifer Johnson received a bachelor’s degree in mechanical engineeringfrom Montana State University in 2009. She then got a master’s degree inelectrical engineering from Montana State University in 2012. The focus ofher research was remote sensing applications of uncooled LWIR imagers.
Joseph A. Shaw is the director of the Optical Technology Center, a pro-fessor of electrical and computer engineering, and an affiliate professor ofphysics at Montana State University in Bozeman, Montana. He receivedPhD and MS degrees in optical sciences from the University of Arizona,an M.S. degree in electrical engineering from the University of Utah, anda BS degree in electrical engineering from the University of Alaska–Fairbanks. He is a fellow of the Optical Society of America and SPIE.He conducts research on the development and application of radiometric,polarimetric, and laser-based optical remote sensing systems.
Johnson et al.: Long-wave infrared imaging of vegetation for detecting leaking . . .
Journal of Applied Remote Sensing 063612-8 Vol. 6, 2012
Downloaded From: http://remotesensing.spiedigitallibrary.org/ on 12/18/2012 Terms of Use: http://spiedl.org/terms

Rick Lawrence is a professor of remote sensing at Montana State Univer-sity and director of its Spatial Sciences Center. He received his B.A. inpolitical science from Claremont McKenna College, a J.D. from ColumbiaUniversity, and an M.S. and Ph.D in forest resources from Oregon StateUniversity.
Paul W. Nugent is a research engineer with the Electrical and ComputerEngineering Department at Montana State University and president ofNWB Sensors Inc., in Bozeman, Montana. He received his M.S. andB.S. degrees in electrical engineering from Montana State University.His research activities include radiometric thermal imaging and opticalremote sensing.
Laura M. Dobeck received a B.S. degree in chemistry from the Universityof Wisconsin–Madison in 1991, and M.S. and Ph.D degrees in physicalchemistry from Cornell University in Ithaca, New York, in 1994 and1999, respectively. She has studied reaction dynamics of small moleculesin the gas phase using laser spectroscopy and electron transfer in thesolution phase with ultrafast laser systems. Her current interests includestudying the transport of CO2 in the near-ground surface and testingand evaluating surface and near-subsurface monitoring techniques to beapplied to geological carbon dioxide sequestration. She currently serves
as the field site manager for the ZERT shallow subsurface CO2 controlled release facility atMontana State University in Bozeman. She is a member of the American Geophysical Union.
Lee H. Spangler received a B.A. degree at Washington & JeffersonCollege in 1980 and a Ph.D in physical chemistry at the University ofPittsburgh in 1985. He was a postdoctoral researcher at Los AlamosNational Laboratory in New Mexico from 1985 to 1987. He joined thechemistry faculty at Montana State University in 1987, where he nowserves as the director of the Energy Research Institute and associatevice president for research.
Johnson et al.: Long-wave infrared imaging of vegetation for detecting leaking . . .
Journal of Applied Remote Sensing 063612-9 Vol. 6, 2012
Downloaded From: http://remotesensing.spiedigitallibrary.org/ on 12/18/2012 Terms of Use: http://spiedl.org/terms