Embed Size (px)
Citation preview

Longitudinal Analysis of Public Response to Wildland Fire and Fuel Management: Examining Citizen Responses and Fire Management Decisions from 2002-2008
Thesis
Presented in Partial Fulfillment of the Requirements for The Degree Master of Science in the Graduate School of The Ohio State University
By
James B. Bennett, M.A.
Environment and Natural Resources Graduate Program
The Ohio State University
2010
Thesis Committee:
Eric Toman, Advisor
Tomas Koontz
Robyn Wilson

Copyright by
James B. Bennett
2010

ii
Abstract
Wildland fire is one of the foremost land management issues impacting both public and
private resources throughout the United States. Since 2000, the average annual acres
burned nearly doubled from the previous decade (National Interagency Fire Center 2010).
The human population within the wildland-urban interface (WUI) has increased greatly
while a century of national fire suppression policy has allowed adjacent fuel levels to
reach unprecedented levels. In the midst of this volatile and high stakes situation, public
land managers are tasked with implementing fuel reduction programs designed to reduce
the excessive forest vegetation that can lead to catastrophic wildfires and threaten
communities. Public acceptance is an essential element to successful implementation of
fuel management activities. This longitudinal study examined public opinion of agency
fuel reduction strategies in seven states (AZ, CO, OR, UT, MI, MN, WI) over a six-year
period (2002-2008). Responses provide information on citizen support and contributing
factors and allow examination of differences between locations and over time. The study
also examined the decision-making environment of fire managers in the three lake states
where fuel management programs were in early stages of development. These findings
provide descriptive information about the types of treatments used, management
objectives, and the factors that influence fuel management decisions in these locations.

iii
Dedication
Dedicated to our nation’s wildland firefighters.

iv
Acknowledgments
The completion of this project would not have been possible without the patience and
support of many individuals. I would like to thank my advisor, Dr. Eric Toman, for his
outstanding guidance, support, and leadership throughout this process. I also wish to
thank my graduate advisory committee members, Dr. Tom Koontz and Dr. Robyn
Wilson, for their advice and recommendations. I would like to acknowledge the
administrative staff of the School of Environment and Natural Resources for all of their
help and support. I would like to thank the Joint Fire Science Program for project funding
and the citizens and wildland fire managers in Arizona, Colorado, Oregon, Utah,
Michigan, Minnesota, and Wisconsin who were willing to participate in this research. I
wish to thank my wife, Katie, for her unwavering love and support and my parents for
teaching me the value of hard work and perseverance. I also wish to thank Mark Giese,
Amy Schmidt, Dr. Jerry Bigham, Dr. Neil Andrew, Dr. David Hix, Dr. Charles Goebel,
Dr. R. Gregory Corace III, Dr. Bruce Shindler, and each and every professor who shared
with me their valuable experience and insight.

v
Vita
2001…...……………………………………………………………….Logan High School
2007…………………….…………………….…………….B.S. Environment and Natural
Resources, Ohio State University 2007……………………………………………………….……….M.A. Public Policy and
Management, Ohio State University
Fields of Study
Major Field: Environment and Natural Resources

vi
Table of Contents
Abstract……………………………………………………………………………………ii
Dedication………………………………………………………………………………...iii Acknowledgments………………………………………………………………………..iv Vita………………………………………………………………………………………...v List of Tables………………………………………………………………………….…vii List of Figures…………………………………………………………………………....xv Chapter 1: Introduction……………………………………………………………………1 Chapter 2: Longitudinal Analysis of Public Response to Wildland Fire and Fuel Management……………………………………….8 Chapter 3: Examining the Decision-Making Environment of Fire Managers in the Northern Lake States.…...……………………….38 Chapter 4: Conclusion……………………………………………………………………70 References………………………………………………………………………………..74 Appendix A: Frequency Report of Longitudinal Analysis Responses…………………..79 Appendix B: Frequency Report of Northern Lake States’ Responses………………….129

vii
List of Tables
Table 2.1. Study Locations………………………………………………………………17
Table 2.2. Summary of Study Participants………………………………………………18
Table 2.3. Citizens’ perceived likelihood of a local wildfire event………………….…..20 Table 2.4. Public acceptability of fuel reduction practices………………………………21
Table 2.5. Concerns with the use of prescribed fire …………………………………….23 Table 2.6. Trust in forest agency to implement specific treatment………………………24
Table 2.7. Citizen-agency interactions and trust…………………………………………25 Table 2.8. Bivariate correlations between respondents’ characteristics and support for prescribed fire and mechanized thinning, 2008 survey…………………26 Table. 2.9 Logistic regression analysis………..…………………………………………30
Table 3.1. Summary of web-based survey respondents………………………………….48
Table 3.2. Utilization of methods to achieve objectives, state by state comparison……..49 Table 3.3. Objectives associated with treatment methods, state by state comparison…...51
Table 3.4. Factors influencing forest restoration and fuel management decisions………53
Table 3.5. Sources of fire management information, state by state comparison………...57
Table 3.6. Usefulness of methods to exchanging fire science information..………….…59
Table 3.7. Barriers to information exchange, state by state comparison……………..….60
Table A.1. Distance from home to area where wildfire might burn……………….…….79 Table A.2. Likelihood of wildfire occurring near home in next five years……………...80 Table A.3. Public opinion of prescribed fire……………………………………………..81

viii
Table A.4. Public opinion of mechanical vegetation removal…………………………...82 Table A.5. Public opinion of thinning…………………………………………………...83 Table A.6. Concern regarding damage to private property……………………………...84 Table A.7. Concern regarding decreased recreation opportunities………………………84 Table A.8. Concern regarding loss of wildlife habitat…………………………………...85 Table A.9. Concern regarding fire going out of control…………………………………85 Table A.10. Concern regarding the economic loss of useable timber…………………...86 Table A.11. Concern regarding reduced scenic quality………………………………….86 Table A.12. Concern regarding increased levels of smoke……………………………...87 Table A.13. Concern regarding deteriorated public water supply……………………….87 Table A.14. Concern regarding increased soil erosion…………………………………..88 Table A.15. Confidence in forest agency to use prescribed fire…………………………88 Table A.16. Confidence in forest agency to use mechanical vegetation removal……….89 Table A.17. Confidence in forest agency to use thinning………………………………..89 Table A.18. Opinion of smoke from prescribed fire……………………………………..90 Table A.19. Ratings of informational brochures………………………………………...91 Table A.20. Ratings of television public service messages……………………………...92 Table A.21. Ratings of visitor centers and interpretive signs……………………………92 Table A.22. Ratings of internet web pages………………………………………………93 Table A.23. Ratings of guided field trips to forest sites…………………………………93 Table A.24. Ratings of government public meetings……………………………………94 Table A.25. Ratings of conversations with agency staff………………………………...94 Table A.26. Ratings of newsletters………………………………………………………95

ix
Table A.27. Ratings of educational workshops………………………………………….95 Table A.28. Ratings of sites demonstrating management practices……………………..96 Table A.29. Ratings of agency managers who meet with homeowner groups…………..96 Table A.30. Ratings of agency incorporation of public concerns………………………..97 Table A.31. Environmental/Economic orientation………………………………………98 Table A.32. Overall condition of public forests, comparative data……………………...99 Table A.33. Overall condition of public forests, 2008 data…………………………….100 Table A.34. Recent wildfire occurrence………………………………………………..100 Table A.35. Proximity of homes to recent wildfires……………………………………101 Table A.36. Experience with smoke from recent wildfires…………………………….101 Table A.37. Evacuations from recent wildfires………………………………………...102 Table A.38. Damage to personal property from recent wildfires………………………102 Table A.39. Beliefs that prescribed fire will reduce scenic quality…………………….103 Table A.40. Beliefs that prescribed fire will create more smoke in the short-term, but less over time…………………..…………………..103 Table A.41. Beliefs that prescribed fire will save money by reducing the cost of fighting a wildfire……………………………………...104 Table A.42. Beliefs that prescribed fire will restore forests to a more natural condition……………………………………………………...104 Table A.43. Beliefs that prescribed fire will improve conditions for wildlife………….105 Table A.44. Beliefs that prescribed fire will effectively reduce fire risk………………105 Table A.45. Beliefs that thinning will reduce scenic quality…………………………...106 Table A.46. Beliefs that thinning will extract useable wood products…………………106 Table A.47. Beliefs that thinning will save money by reducing the cost of fighting a wildfire……………………………………………...107

x
Table A.48. Beliefs that thinning will restore forests to a more natural condition…….107 Table A.49. Beliefs that thinning will improve conditions for wildlife………………...108 Table A.50. Beliefs that thinning will effectively reduce fire risk……………………..108 Table A.51. Beliefs that thinning will result in more harvesting than necessary………109 Table A.52. Trust in forest agency to respond to and fight forest fires……………...…109 Table A.53. Trust in forest agency to use thinning practices effectively………………110 Table A.54. Trust in forest agency to effectively plan and implement prescribed burns…………………………………………………..110 Table A.55.Trust in forest agency to provide adequate information…………………...111 Table A.56. Trust in forest agency to provide current, timely information…………….112 Table A.57. Trust in forest agency to provide credible information…………………...112 Table A.58. Change in level of trust in forest agency……………………………….…113 Table A.59. Influence of media on public opinion…………………………………..…114 Table A.60. Influence of neighbors on public opinion…………………………………114 Table A.61. Influence of city or county fire department on public opinion……………115 Table A.62. Influence of local forest agency on public opinion………………………..115 Table A.63. Influence of wildfire threat on public opinion…………………………….116 Table A.64. Influence of actual wildfire occurrence on public opinion………………..116 Table A.65. Level of action taken to protect home from wildfire……………………...117 Table A.66. Citizen-agency interactions, incorporating public input into management decisions………………………………………………..117 Table A.67. Citizen-agency interactions, incorporating public input into management plans……………………………………………………118 Table A.68. Citizen-agency interactions, building trust and cooperation………………118

xi
Table A.69. Citizen-agency interactions, providing information about management activities………………………………………………119 Table A.70. Citizen-agency interactions, skepticism of agency information…………..119 Table A.71. Citizen-agency interactions, providing adequate opportunities for citizen participation in planning processes…………………………..120 Table A.72. Citizen-agency interactions, influence of national restrictions on local agency……………………………………………………120 Table A.73. Importance of citizen inclusion in the planning process on judgments of forest agency actions…………………………………………121 Table A.74. Importance of personal property implications on judgments of forest agency actions………………………………………………….121 Table A.75. Importance of knowing management objectives on judgments of forest agency actions……………………………………....122 Table A.76. Importance of maintaining recreational forest access on judgments of forest agency actions…………………………………...122 Table A.77. Importance of maintaining or restoring conditions on judgments of forest agency actions……………………………………...123 Table A.78. Importance of trust in the decision-maker on judgments of forest agency actions………………………………………………….123 Table A.79. Importance of giving top priority to environmental considerations on judgments of forest agency actions………………………………….124 Table A.80. Importance of the role that scientists play on judgments of forest agency actions…………………………………………….124 Table A.81. Importance of visual impacts on judgments of forest agency actions…….125 Table A.82. Importance of supporting the local economy on judgments of forest agency actions……………………………………….125 Table A.83. Importance of giving top priority to economic considerations on judgments of forest agency actions………………………………….126 Table A.84. Number of retirees in study………………………………………………..126

xii
Table A.85. Amount of communities with a Community Wildfire Protection Plan…...127 Table A.86. Membership in community defensible space organization………………..127 Table A.87. Concern regarding a wildfire impacting quality of life…………………...128 Table B.1. Amount of prescribed fire use in the northern lake states………………..…129 Table B.2. Amount of wildland fire use in the northern lake states……………………129 Table B.3. Amount of mechanized thinning use in the northern lake states………...…130 Table B.4. Amount of mowing use in the northern lake states……………..………..…130 Table B.5. Amount of herbicide use in the northern lake states………….…………….130 Table B.6. Prescribed fire utilization to accomplish management objectives.................131 Table B.7. Wildland fire use to accomplish management objectives…………………..131 Table B.8. Mechanized thinning utilization to accomplish management objectives…...132 Table B.9. Mowing utilization to accomplish management objectives………………...132 Table B.10. Herbicide utilization to accomplish management objectives……………...133 Table B.11. Satisfaction with amount of prescribed fire utilization……………………133 Table B.12. Satisfaction with amount of wildland fire use……………………………..134 Table B.13. Satisfaction with amount of mechanized thinning utilization……………..134 Table B.14. Satisfaction with amount of mowing utilization…………………………..134 Table B.15. Satisfaction with amount of herbicide utilization…………………………135 Table B.16. Influence of budget constraints on management decisions………………..135 Table B.17. Influence of laws on management decisions………………………………136 Table B.18. Influence of habitat requirements on management decisions……………..136 Table B.19. Influence of competing agency interests on management decisions……...136 Table B.20. Influence of agency mandates on management decisions…………………137

xiii
Table B.21. Influence of interface constraints on management decisions……………...137 Table B.22. Influence of pressure from public stakeholders on management decisions………………………………………………...137 Table B.23. Influence of forest plan on management decisions………………………..138 Table B.24. Influence of past personal experiences on management decisions………..138 Table B.25. Influence of previous agency actions on management decisions………….138 Table B.26. Influence of the scientific community on management decisions………...139 Table B.27. Influence of professional societies on management decisions…………….139 Table B.28. Use of management colleagues in information exchange…………………140 Table B.29. Use of agency research scientists in information exchange……………….140 Table B.30. Use of academic research scientists in information exchange…………….140 Table B.31. Use of professional societies in information exchange……………………141 Table B.32. Usefulness of conferences/professional meetings to information exchange……………………………………………………...141 Table B.33. Usefulness of trips to field sites to information exchange………………...142 Table B.34. Usefulness of virtual meetings to information exchange………………….142 Table B.35. Usefulness of telephone conferences to information exchange…………...142 Table B.36. Usefulness of General Technical Reports to information exchange………143 Table B.37. Usefulness of condensed research summaries to information exchange….143 Table B.38. Usefulness of newsletters from professional societies to information exchange………………………………………...144 Table B.39. Usefulness of newsletters from research organizations to information exchange…………………………………………………144 Table B.40. Usefulness of internet web sites maintained by professional societies to information exchange……………………………………..145

xiv
Table B.41. Usefulness of internet web sites maintained by research organizations to information exchange…………………………………….145 Table B.42. Usefulness of email listserves to information exchange…………………..146 Table B.43. Information accessibility as a challenge to information exchange………..146 Table B.44. Time as a challenge to information exchange……………………………..147 Table B.45. Knowing where to look as a challenge to information exchange…………147 Table B.46. Information credibility as a challenge to information exchange…………..148 Table B.47. Information applicability as a challenge to information exchange………..148 Table B.48. Managers’ perceived role in shaping research information……………….149 Table B.49. Managers’ desire to be involved in future information exchange activities………………………………………………….149

xv
List of Figures
Figure 3.1. Fire and Fuel Management Decision Support Framework…………………..44

1
Chapter 1: Introduction
HISTORICAL PERSPECTIVE
Wildland fire is one of the foremost land management issues affecting both public
and private resources throughout the United States. A century of fire exclusion, grazing
by domestic livestock and widespread establishment of exotic species have altered fire
regimes, fuel loadings, and vegetation composition and structure (Barrett et al. 1991,
Brown et al. 1994, Ford and McPherson 1999). Indeed, it is estimated that fire regimes on
over half of all federal and non-federal lands (excluding agricultural, barren, and
urban/developed lands) have been moderately or significantly altered from their historical
range (Schmidt et al. 2002). In many locations, fire exclusion has resulted in ecological
changes, such as shifting species composition, increasing vegetative density, and
declining ecological health (e.g., Langston 1995, Agee 1997). Persistent regional drought
conditions coupled with the recent trend of long, hot fire seasons have combined to create
a volatile situation that places an enormous burden on collective fire management
resources. At the same time, a recent analysis of the Wildland Urban Interface (WUI),
where structures and other human developments meet or intermingle with wildland
vegetation, found a 10.9% growth in total area and a 17.6% growth in housing units from
1990-2000 in California, Oregon, and Washington alone (Hammer et al. 2007). This

2
increasing human dimension adds an additional layer of complexity to the equation,
meaning that many wildfires previously considered “remote” now have the potential to
impact homes and entire forest communities.
In recent years, scientific inquiry and landscape observation have shed
considerable light on the critical role of fire in maintaining healthy forest ecosystems.
Fire disturbance in most forest regimes is now better understood as playing a vital role in
sustaining ecosystem integrity and biodiversity (Beschta et al. 2004). Thus, in addition to
suppression activities, contemporary fire management aims to proactively manage forest
structure with two main objectives, reduction of fire risk and restoration of forest health
(Mutch et al. 1993, Agee 1997).
Furthermore, overall public understanding and acceptance of fuel treatments has
steadily increased over the past decades. Early studies found that citizens generally
overestimated the negative impacts of fire; not surprisingly, a majority preferred
complete fire suppression (Stankey 1976). But over the last several years, an increasing
number of citizens recognize the role of fire on the landscape (Loomis et al. 2001,
Shindler and Brunson 2003).
Land management agencies are increasingly tasked with implementing
comprehensive fuel reduction programs with multiple objectives including 1) restoring
over-stocked forests to within the range of historical variability, 2) reducing the
accumulation of available fuel from forest environments, and 3) promoting the adoption
and maintenance of defensible space programs by forest residents.
Multiple factors will influence the ability to achieve these objectives. Two issues
of particular importance to successful restoration of forest conditions and reduction of

3
fire risk include 1) improved understanding of the factors that influence public
acceptance of management practices (e.g. prescribed fire, thinning, mechanical
vegetation removal) used to treat forest fuels, and 2) development and communication of
relevant scientific information to support comprehensive fuel management programs that
are appropriate for the ecological, social, and political characteristics of a particular
region.
MANAGEMENT CONTEXT
Issue 1: Public Acceptance of Fuel Management Programs.
In order to proactively accomplish the overarching objective of decreasing the
public’s risk to wildfire, agencies are designing and implementing comprehensive fuel
reduction programs that include the utilization of forest management practices such as
prescribed fire, thinning, and mechanical vegetation removal. Because a major objective
of these programs is to reduce the risk of wildfire to those living in forest communities,
there is a strong human component inherent in the process. The fuel reduction solution is
much more complex than simply lighting a match or starting a chainsaw. Many of these
projects are conducted on public land located immediately adjacent to communities
within the WUI; thus, treatments receive a high level of scrutiny from public
stakeholders.
While residents in forest communities enjoy the benefits of such treatments, they
also bear the costs of any negative impacts ranging from smoke or damage to private
property to altered stand composition and changing forest values. Given such conditions,

4
fuel treatment programs require a supportive local constituency to be successful (e.g.,
Shindler and Toman 2003, Brunson and Shindler 2004). Regardless of how well
conceived a particular fuel reduction program may be from a technical standpoint,
implementation of these treatments will be difficult in the absence of public support.
From a management perspective, understanding the factors that influence public
acceptance of fuel management programs has the potential to pay large dividends on the
ground by creating a roadmap of principles on which to focus for success.
To date, research suggests acceptance is influenced by multiple factors including
awareness of potential outcomes (e.g., Loomis et al. 2001, Brunson and Shindler 2004),
citizen involvement in developing treatment plans (e.g., Winter et al. 2002, Blanchard
and Ryan 2007), existence of high quality relationships between residents and agency
personnel (Fleeger 2008), trust in agency managers (e.g., Shindler and Toman 2003), as
well as situationally specific variables (e.g., size of treatment, proximity to homes,
weather conditions, etc., Winter et al. 2002).
Issue 2: Exchange of Fire Science Information.
Fire and fuel management are complex issues that involve multiple ecological as
well as social variables. Moreover, treatment programs vary in application depending on
site-specific variables such as forest ecotype, climate, fire season, WUI population, and
acres to manage, among others. There is certainly no one-size-fits-all approach to fuel
management that is effective or appropriate in every situation. Effective management
activities will be based on unique local conditions (ecological, social, and political) and

5
current, relevant information compiled and shared among management colleagues,
professional societies, as well as agency and research scientists.
It is critical that management professionals have established methods to access
available and emerging information to support their management decisions. While
valuable information may be available, this availability does not necessarily mean it is
communicated in the manner most effective to support decision-making (National
Research Council 2009).
The process of making this type of information useful and relevant for practical
decision making is known as decision support. Understanding the factors that promote
effective information exchange and decision support activities will provide managers
with the opportunity to develop contemporary, effective management plans based on
scientific information applicable to their situation. To date, research suggests decision
support activities are most successful when research is based primarily on end users’
needs rather than scientific research priorities, communication is collaborative and
ongoing between information producers and information users, a strong leader is present
to shepherd and guide the overall decision support process, and decision support
networks are able to function in a long-term capacity, rather than via short term
interactions (National Research Council 2009, Zand 1997).
PROJECT OVERVIEW
As the above discussion illustrates, public acceptance and effective information
exchange are critical to the development and implementation of successful fuel
6
management programs. This study provides a rare perspective on the issue of public
acceptance by completing a longitudinal analysis of citizen responses across a six-year
study period (2002-2008) in seven locations (Arizona, Colorado, Oregon, Utah,
Michigan, Minnesota, and Wisconsin). Findings, thus, enable comparisons across time—
to identify changes in citizen responses and analyze influencing factors—and between
geographic locations—to recognize commonalities as well as key differences in citizen
responses. In addition, the study examines the decision-making environment of fire
managers in the three lake states (MI, MN, WI). The project is centered around the
following research objectives:
1. To identify and analyze citizen support for fuel management practices
(particularly prescribed fire and mechanical vegetation removal) over time (2002-
2008) and across locations (AZ, CO, OR, UT, MI, MN, WI).
2. To examine the factors (e.g., awareness, trust, citizen-agency interactions) that
influence public acceptability of fuel management programs.
3. To explore the decision-making environment of fire managers and examine the
factors that influence their decisions (e.g., availability of information and tools,
institutional constraints, perceived attitudes of public stakeholders).
CONCLUSION
The extent of fire activity has increased in recent years and now affects a growing
number of individual homeowners and entire forest communities in many regions across
the United States. Forest fuels have reached unprecedented levels that serve to increase

7
fire severity and decrease forest health. Public agencies have adopted fuel management
programs designed to proactively counteract this dangerous situation and fire managers
must evaluate available tools and local conditions and implement the most appropriate
fuel reduction strategy for their management unit. This study is designed to evaluate the
public acceptance of these fuel management programs by examining public responses
over time and across geographic locations while also exploring the decision-making
environment of fire managers in a subset of locations as they build fire management
programs. Findings reflect the perspectives of citizens who live adjacent to public
forestlands and the fire managers who strive to keep them safe–both critical stakeholders
in the context of wildland fire management. This study provides a direct link to the field
of natural resources as the findings will help identify public acceptance of agency
programs, factors that influence their acceptance over time, and the tradeoffs and factors
weighed by managers as they develop programs to reduce forest fuels and restore the
ecological health of public forest resources.
8
Chapter 2: Longitudinal Analysis of Public Response to Wildland Fire and Fuel Management
INTRODUCTION
Wildfire impacts have increased in extent and severity in recent years. The
average annual acres burned from 2000 to 2009 (6.1 million acres) is nearly double that
of the 1990’s (3.3 million acres) and a total of more than 8 million acres have burned in
four separate years since 2000 (National Interagency Fire Center 2010). In addition to the
striking increase in amount of acres burned, there has been a trend toward larger fires
(Calkin et al. 2005). While the annual number and average size of fires is on the increase,
a recent analysis of the Wildland Urban Interface (WUI), where structures and other
human developments meet or intermingle with wildland vegetation, found a 10.9%
growth in total area and 17.6% growth in housing units from 1990-2000 in California,
Oregon, and Washington alone (Hammer et al. 2007). This increasing human dimension
adds an additional layer of complexity to the equation, meaning that many wildfires
previously considered “remote” now have the potential to impact homes and entire forest
communities.
Fires that occur in the WUI can be particularly catastrophic, as evidenced by
several recent examples. In 2002, the Hayman Fire in Colorado and the Rodeo-Chediski
Fire in Arizona destroyed a combined 1,026 structures (National Interagency Fire Center

9
2010). In 2003, 2,400 structures were burned during a single California fire (the Cedar
Fire) while a series of wildfires in autumn 2007 forced an estimated 1 million residents to
evacuate their homes. These and other examples demonstrate the high stakes that are in
play when wildfires occur within and adjacent to areas of human population (WUI).
Over the last few decades, wildland fire policy in the U.S. has increasingly
emphasized proactive efforts to reduce the likelihood of fire (Stewart et al. 2006). The
use of fuel treatments, such as prescribed fire and mechanized thinning, is a primary
approach used to reduce fuel levels on public lands. As research has recognized, citizen
support is a basic requirement to project implementation and long-term success of fuel
treatment programs (e.g., Manfredo et al. 1990, Shindler and Toman 2003). At the local
level, such support is critical to implementing treatments on public lands, particularly in
those areas adjacent to forest communities.
A growing body of research provides evidence of increasing support for the use of
fuel treatments in many regions of the U.S. (e.g., Manfredo et al. 1990, Winter et al.
2002, Brunson and Shindler 2004, Blanchard and Ryan 2007). However, most of these
studies consist of data collected at a single point in time. Resulting data provide a
“snapshot” of a cross-section of the population at one specific point in time. Although
careful analysis of cross-sectional data can provide considerable insight, there are
limitations in our ability to understand ongoing processes with data collected from a
single reference point (Babbie 1995). To overcome these limitations, longitudinal
research designs provide for the collection and analysis of responses over time.
To date, few longitudinal studies have been completed on wildland fire. McCool
and Stankey (1986) completed a trend analysis of users of the Selway-Bitterroot

10
Wilderness Area (following up on Stankey’s original 1976 study). Results demonstrated
increased awareness of the effects of wildland fire on forest ecosystems as well as
increased support for the use of fire in management activities. More recently, Shindler
and Toman (2003) completed a panel study of residents in northeast Oregon and
southeast Washington communities five years after a previous study. While findings
showed citizen acceptance of both prescribed fire and mechanized thinning treatments
had remained relatively stable across the study period, they also revealed a declining
relationship between participants and resource managers. This finding was particularly
critical given the strong correlation between positive citizen-agency relationships and
acceptance of fuel management activities. These studies demonstrate the value of
longitudinal studies to examine how people react to changing conditions and test how
specific variables contribute to their response to agency fire and fuels programs over
time.
This study is designed to begin to fill the existing research gap by completing a
longitudinal analysis of residents in seven different study locations. The study replicates
research originally conducted in Arizona, Colorado, Oregon, Utah, Michigan, Minnesota,
and Wisconsin in 2002. The follow-up study was conducted in 2008 using the same
measures and participants; where appropriate, new questions were added in 2008 to
reflect current management challenges. The purpose of this study was to examine
acceptance of agency fuel treatment activities, factors that contribute to citizen support,
and compare responses over time and between locations.

11
Management and Research Context.
Throughout much of the previous century federal fire policy was directed at
excluding fire from the landscape. In many locations, fire exclusion and traditional
management practices have resulted in ecological changes, such as shifting species
composition, increasing vegetative density, and declining ecological health (e.g.,
Langston 1995, Agee 1997). These changes have greatly increased the risk of large
wildfires.
In recent years, resource managers and scientists have increasingly recognized the
complex and often beneficial role that fire plays in forest and rangeland ecosystems. In
addition to suppression activities, contemporary fire management aims to proactively
manage forest structure with two main objectives, reduction of fire risk and restoration of
forest health (Mutch et al. 1993, Agee 1997). Several recent federal initiatives (e.g., the
National Fire Plan, Ten Year Comprehensive Strategy, Healthy Forests Restoration Act)
have focused on fire and fuel management. Two main themes run through these
initiatives. First, they emphasize the use of fuel treatments, such as prescribed fire and
mechanized thinning, to reduce the risk of fire.
Second, these policies recognize the wildland fire problem is extensive and
solutions will require an unprecedented degree of interaction with a broad array of
stakeholders. Indeed, these policies encourage, and in some cases require, local
partnerships to identify and accomplish fuel management objectives. Thus, resource
professionals require an understanding of citizen awareness and acceptance of the tools
used by managers to reduce the likelihood of fire.

12
A growing body of research evaluates public opinion about the use of prescribed
fire, thinning treatments, and their associated impacts. Several important findings emerge
from this work. Decades of research demonstrate that citizens with higher fire-related
knowledge are more supportive of fuel management activities such as prescribed fire and
thinning programs (e.g., Stankey 1976, Carpenter et al. 1986, Manfredo et al. 1990). In
1971, a study tested visitors on their knowledge of fire's effects upon the ecosystem in
Montana's Selway-Bitterroot Wilderness (Stankey, 1976). Results of the true/false test
indicated that the average visitor could correctly identify about half of the statements that
related to fire's effects upon the ecosystem. However, the study found that greater fire
knowledge related to an increase in support for less direct fire suppression activities. In
1989, a study surveyed individuals in the Montana-Wyoming region (the area most
affected by the 1988 Yellowstone fires) and individuals from the rest of the nation
(Manfredo et al. 1990). Five true-false questions were replicated from previous studies
(Stankey 1976, McCool and Stankey 1986). Results suggested that as knowledge about
fires and fire policy increased, support for prescribed fire policy also increased. These
findings have been verified in more recent work (Loomis et al. 2001, Parkinson et al.
2003, Shindler and Toman 2003). For example, in their 2000 survey of residents in the
Blue Mountains of eastern Oregon and Washington, Shindler and Toman (2003)
identified a strong direct relationship between knowledge level and support for both
prescribed fire and mechanized thinning. The more knowledgeable individuals were
about a practice, the more likely they were to support its use.
In addition, overall public understanding and acceptance of fuel treatments has
steadily increased over the past decades. Early studies found that citizens generally

13
overestimated the negative impacts of fire; not surprisingly, a majority preferred
complete fire suppression (Stankey 1976). But in recent years, an increasing number of
citizens recognize the role of fire on the landscape (McCool and Stankey 1986, Loomis et
al. 2001, Shindler and Brunson 2003). McCool and Stankey (1986) returned to the
Selway-Bitterroot Wilderness to re-sample visitors about their perceptions and attitudes
toward fire. Results showed that the public had grown more knowledgeable about fire's
effects and correctly answered 64% of the true/false questions, compared to 53% in 1971.
Results also showed that seven out of ten visitors supported letting fires burn in
wilderness areas, compared to 38% in their original study. In their survey of Florida
residents, Loomis et al. (2001) found strong support for the use of prescribed fire as a
management tool and also concluded that this support could be increased by the
introduction of educational materials that explained the beneficial aspects of prescribed
fire.
In addition to citizen knowledge, findings across several locations indicate that
acceptance of fuel treatments is influenced by multiple factors including awareness of
potential outcomes (e.g., Loomis et al. 2001, Brunson and Shindler 2004), citizen
involvement in developing treatment plans (e.g., Winter et al. 2002, Blanchard and Ryan
2007), existence of high quality relationships between residents and agency personnel
(Fleeger 2008), trust in agency managers (e.g., Shindler and Toman 2003), as well as
situationally specific variables (e.g., size of treatment, proximity to homes, weather
conditions, etc., Winter et al. 2002).
In their survey of citizens in Arizona, Colorado, Oregon, and Utah, Brunson and
Shindler (2004) found that acceptability judgments about prescribed fire were

14
significantly influenced by cognitive beliefs about the effectiveness of this tool in
influencing wildfire intensity and frequency, and by affective responses to concerns about
scenic quality and increased smoke levels. For mechanical vegetation removal,
acceptability judgments were significantly influenced by cognitive beliefs about the
effect of this practice on wildfire intensity or frequency and fuel loads. Additional
analysis showed that acceptability judgments themselves were inter-correlated, meaning
that persons who found prescribed fire to be acceptable also tended to find mechanical
treatment acceptable.
Blanchard and Ryan (2007) surveyed citizens in Massachusetts and found that
previous experience with wildland fire and knowledge about different fire management
strategies were important factors that influenced support for fire hazard reduction
strategies. In addition, participants in the study strongly supported involving the public in
fire planning efforts, with questions about public participation in fire management
planning receiving the highest ratings of any in the survey.
Fleeger (2008) examined the factors leading to the successful development and
implementation of the Sitgreaves Community Wildfire Protection Plan (CWPP) in
Arizona’s White Mountains. He concluded that several key factors in the process were
the commitment of the local forest agency to engage in collaborative processes with
forest residents, share their technical expertise, and build positive working relationships
with stakeholders. The multijurisdictional planning process established procedures for
mitigating wildfire risk in the WUI, including the use of fuel treatment practices.
Citizen trust in agency managers is also an important factor influencing support
for fuel treatment practices. Indeed, Shindler and Toman (2003) found that, among all

15
variables tested, trust in the forest agency to implement a responsible and effective fire
program held the strongest association with support for prescribed fire utilization.
Finally, situationally specific variables have been shown to influence support for
treatment practices. In their focus group study of residents in California, Florida, and
Michigan, Winter et al. (2002) found that support for treatments was influenced by
specific factors such as the size of the treatment, the degree of planning that preceded
implementation, the amount of resources (human, equipment, and fiscal) available to the
managing agency, and the proximity of the fuel treatment to developed areas.
While much has been learned from this prior research that can help inform fire
and fuel management, most of the prior research has consisted of studies conducted in
one location at a single point in time. The study reported here extends this prior research
by replicating measures across a six-year study period in seven locations. Findings, thus,
enable comparisons across both time, to identify changes in citizen responses and analyze
influencing factors, and geographic locations, to recognize commonalities as well as key
differences in citizen responses.
RESEARCH DESIGN
In 2002, mail surveys were sent to a random sample of participants in seven
locations (AZ, CO, OR, UT, MI, MN, WI). Samples from Colorado and Utah, which
contained large metropolitan areas, were stratified by oversampling rural households to
ensure sufficient levels of participation from WUI residents while the Lake States sample

16
(MI, MN, WI) was drawn from counties adjacent to National Forest land. Of the 2,686
surveys that were delivered, 1,325 responses were completed for a 49% response rate.
The follow-up survey was based on the 2002 questionnaire resulting in the
replication of several measures, and also included additional variables to examine
emerging issues at each location. These new questions were developed based on
interviews conducted with resource managers in each location as well as a review of
similar studies as reported in the literature since the 2002 survey. Questions included
Likert-type scales and closed-choice question sets as well as semantic differential scales
requiring respondents to choose between two opposing statements associated with fire
and fuel management decisions. Surveys were implemented following a modified version
of the “total design method” (Dillman 1978).
Mailings were sent in three waves. First, a complete mail packet (cover letter,
questionnaire, and stamped return envelope) was sent to all respondents. After two
weeks, a reminder postcard was sent to all participants who had not yet replied. Complete
packets were sent again to all non-respondents, two more times at two-week intervals.
After accounting for respondents who had moved from the study regions or were unable
to complete the follow-up survey (they were deceased or incapacitated), a combined total
of 1000 individuals remained in the sample for 2008. Of these, 546 completed the survey
for a 55% overall response rate (see Table 2.1).
Data analysis included multiple steps. The data was first summarized using
descriptive statistics. Next, responses were paired across pre-test and post-test measures
and compared using paired t-tests with individual respondents serving as the unit of

17
Study Locations (relevant management units)
2008 adjusted sample
2008 completed
surveys
2008 response rate
AZ Yavapai County 111 59 53% (Prescott National Forest)
CO Boulder and Larimer Counties 121 71 59% (Rocky Mountain National Park, Arapahoe-Roosevelt
NF)
OR Deschutes and Jefferson Counties 122 71 58% (Deschutes NF, Bureau of Land Mgmt Prineville
District)
UT Salt Lake City and Tooele County 134 68 51% (BLM West Desert District, Uinta-Wasatch-Cache NF) MI All communities adjacent to national forests 151 81 54% (Huron Manistee NF, Ottawa NF, Hiawatha NF) MN All communities adjacent to national forests
179 99 55% (Chippewa NF, Superior NF)
WI All communities adjacent to national forests 181 96 53% (Chequamegon-Nicolet NF)
Total 1000 545 55%
Table 2.1. Study Locations
analysis. This enabled assessment of change in individual responses between 2002 and
2008. Chi-square tests, which are robust against differences in sample size (Cohen and
Lea 2004), were used to compare responses across study locations. In the following
section, significant differences between locations and over time are indicated in the
presented results. The results section finishes with a presentation of correlations and
logistic regression models designed to examine the influence of contributory factors on
participant acceptance of prescribed fire and mechanized thinning treatments.

18
FINDINGS
Summary of participants.
Table 2.2 provides an overview of several key respondent characteristics. The
majority of study participants were adult males with a median age of 62. Fewer than half
had completed a bachelor’s degree. A majority of participants in all western states
reported fire activity in their area during the study period, with a high of 93% in Utah.
Results on this item were significantly different across locations; however, more than
one-fourth in every state acknowledged a wildfire had occurred in their area in the
previous six years. As for impacts from these fires, most indicated they experienced some
discomfort from smoke, but few respondents were evacuated (9% in AZ, 7% in OR, 5%
in MN, 4% in CO), and none experienced any damage to their property. Overall, a
majority also indicated that their local forests were healthy; however, significant
differences on this response were observed across geographic locations. Among residents
2008a Gender (% male) 78 Median Age (years) 62 Percent with 4 year degree 44** A wildfire occurred in the area during the study period (% yes) 56** Forest health (% rating local forest as very/somewhat healthy) 62** Estimated distance from home to an area where fire might burn (miles) 3.5 Environmental/Economic Orientation (mean score) 3.7 ** 2008 responses are significantly different between locations at p ≤ .05. a Displaying overall results across all study locations.
Table 2.2. Summary of Study Participants

19
of the lake states, the number who rated their forests as healthy was 79% in Wisconsin,
76% in Minnesota, and 73% in Michigan. In contrast, Colorado residents rated their
forests as the least healthy among the seven states surveyed with a solid majority (69%)
classifying their public forests as unhealthy.
In both 2002 and 2008, respondents were asked to estimate the distance from their
home to a natural area where a wildfire might burn. Participants lived close to natural
areas in all locations, with a mean distance of 3.4 miles in 2002 and 3.5 miles in 2008.
Across all states, average distances varied from a low of just over 2 miles in Minnesota
and Wisconsin to just under 6 miles in Utah. Estimates were generally similar across the
study period. It is noteworthy that although the western United States receives greater
attention in terms of fire activity, in 2008 residents of Minnesota and Wisconsin reported
the closest distance from their homes to an area where wildfire might occur (with nearly
three-fourths indicating such an area was directly adjacent to their property). Even in
Utah, which had the highest average distance, 70% of participants indicated they were
within 5 miles of where a wildfire might burn.
Lastly, given the economic and environmental tradeoffs often associated with
managing public natural resources, participants indicated their preference for agency
management decisions on a 7-point scale developed by Shindler et al. (1993) ranging
from 1 (priority given to environmental conditions even if there are negative economic
consequences) to 7 (priority given to economic considerations even if there are negative
environmental consequences); with responses at the midpoint seeking a balance between
environmental and economic considerations. Responses slightly favored priority be given
to economic considerations; however, the most common selected response was the

20
midpoint indicating that management decisions should strike a balance between
environmental and economic factors.
Perceived likelihood of wildfire.
Respondents were asked to evaluate the likelihood of a wildfire occurring near
their home within the next five years on a 4-point scale ranging from “very likely” to
“very unlikely”. Responses in Table 2.3 demonstrate that a strong majority overall in
both 2002 (67%) and 2008 (63%) believed a fire was somewhat or very likely to occur.
Significant differences. Responses differed across geographic regions. In 2008, at
least 80% in each western state indicated a fire was likely to occur. Responses in these
states ranged from a high of 87% in Oregon to a low of 80% in both Arizona and
Colorado. In contrast, significantly fewer residents in the lake states believed a fire was
equally likely to occur near their home. Responses ranged from a high of 50% in
Michigan to a low of 35% in Minnesota. In aggregate responses, participants indicated
the likelihood of a future wildfire in their area significantly decreased from 2002 to 2008.
Statement Very
Likely Somewhat
Likely Somewhat Unlikely
Very Unlikely
Mean Score*
How would you rate the likelihood that a wildfire could occur in the forests or rangelands near your home in the next five years?**
2002 31% 36% 19% 9% 2.05 2008 25% 38% 22% 11% 2.18 * 2002 and 2008 responses are significantly different at p ≤ .05. ** 2008 responses are significantly different between locations at p ≤ .05.
"Don't Know" responses are omitted for presentation purposes.
Table 2.3. Citizens’ perceived likelihood of a local wildfire event

21
Attitudes about treatments.
Responses in Table 2.4 show that overall support for prescribed fire and
mechanized thinning remained relatively high and stable throughout the study period. For
each treatment, participants selected one of four options regarding their acceptance of
treatment use. Overall, in 2008 85% of respondents supported some level of prescribed
fire use; 44% believed the local forest agency should have full discretion for its use,
while an additional 41% said the agency should use prescribed fire only in carefully
selected areas. A similar number supported mechanized thinning with nearly two-thirds
giving agency managers full discretion for its use.
Significant differences. Significant differences were observed across study
locations. In 2008, substantially more participants in Arizona and Oregon (at least 60% in
each location) were willing to give managers full discretion to use prescribed fire than
Prescribed Mechanized Fire** Thinning
Statement 2002 2008 2002 2008 The use of fuel treatments on public forests and rangelands… Is a legitimate tool that resource managers should be able to use whenever they see fit
45% 44% 59% 62%
Is something that should be done infrequently, only in carefully selected areas
45 41 26 24
Is a practice that should not be considered because it creates too many negative impacts
3 5 3 2
Is an unnecessary practice 2 2 3 2
** 2008 responses are significantly different between locations at p ≤ .05. "Don't Know" responses are omitted for presentation purposes.
Table 2.4. Public acceptability of fuel reduction practices

22
respondents in other locations. Also in 2008, a majority in each state gave managers full
discretion to use mechanical treatments. Scores for this option ranged from 50%
agreement in Michigan to 75% in Arizona. Across the study period, responses remained
similar for prescribed fire while there was a slight overall increase in acceptance of
mechanized thinning.
Concerns with use of prescribed fire.
While fuel reduction treatments are designed to reduce the potential for a wildfire,
the treatments themselves have the potential to result in negative outcomes. Participants
were asked to indicate their level of concern with eight potential risks associated with the
use of prescribed fire on a 4-point scale ranging from “not a concern” to “great concern”
(see Table 2.5). The particular risks noted here had been identified as concerns in
previous research and included items ranging from the loss of wildlife habitat to damage
to private property and decreased recreation opportunities.
Significant differences. The chi-square test indicated significant differences
between locations on five of the eight risks. Michigan residents showed the highest level
of concern for three of these risks, while Arizonan’s generally exhibited the fewest
concerns. In aggregate responses, concern about six of these eight potential risks declined
significantly across the study period. Concerns over increased soil erosion, damage to
private property, deteriorated public water supply, and decreased recreation
opportunities declined by double-digit margins. Concerns with only one item, the
economic loss of useable timber, increased between 2002 and 2008.

23
Statement 2002 2008 P-value
Please indicate how concerned you are about the following possible effects of prescribed fire. Increased levels of smoke** 44% 40% 0.014 Loss of wildlife habitat* 43 39 0.001 Increased soil erosion** 49 39 0.000 Economic loss of useable timber 35 38 0.071 Reduced scenic quality 40 35 0.053 Damage to private property** 47 32 0.000 Deteriorated public water supply** 37 25 0.000 Decreased recreation opportunities** 35 19 0.000 * 2002 and 2008 responses are significantly different at p ≤ .05. ** 2002 and 2008 responses are significantly different at p ≤ .05. and 2008 responses are significantly different between locations at p ≤ .05.
Data reflect percentage of respondents who rated concern as great/moderate on a four-point scale (none, slight, moderate, great).
Table 2.5. Concerns with the use of prescribed fire
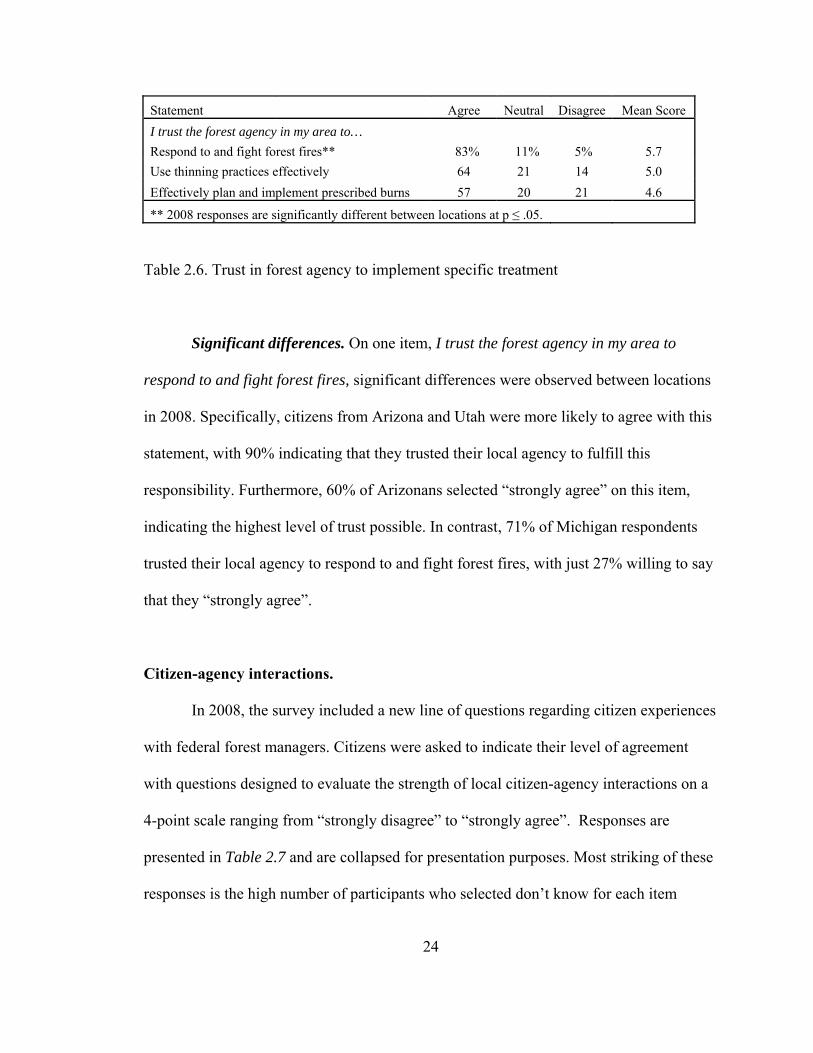
Trust in forest agency.
In 2008, participants indicated their level of trust in their local forest agency to
respond to forest fires and implement specific fuel reduction treatments on a 7-point scale
ranging from “strongly disagree” to “strongly agree”. Results are displayed in Table 2.6
and have been condensed for presentation purposes (responses of 1 - 3 = disagree,
responses of 4 = neutral, responses of 5 - 7 = agree). In aggregate, a majority of
respondents expressed trust in their local forest agency’s ability to fulfill the historical
role of fire suppression (trust the agency to respond to and fight forest fires). However,
respondents expressed less trust in their local agency’s ability to use treatment practices
on the ground, with just a slight majority agreeing that they trusted the agency to
effectively plan and implement prescribed burns.
24
Statement Agree Neutral Disagree Mean Score I trust the forest agency in my area to… Respond to and fight forest fires** 83% 11% 5% 5.7 Use thinning practices effectively 64 21 14 5.0 Effectively plan and implement prescribed burns 57 20 21 4.6
** 2008 responses are significantly different between locations at p ≤ .05.
Table 2.6. Trust in forest agency to implement specific treatment
Significant differences. On one item, I trust the forest agency in my area to
respond to and fight forest fires, significant differences were observed between locations
in 2008. Specifically, citizens from Arizona and Utah were more likely to agree with this
statement, with 90% indicating that they trusted their local agency to fulfill this
responsibility. Furthermore, 60% of Arizonans selected “strongly agree” on this item,
indicating the highest level of trust possible. In contrast, 71% of Michigan respondents
trusted their local agency to respond to and fight forest fires, with just 27% willing to say
that they “strongly agree”.
Citizen-agency interactions.
In 2008, the survey included a new line of questions regarding citizen experiences
with federal forest managers. Citizens were asked to indicate their level of agreement
with questions designed to evaluate the strength of local citizen-agency interactions on a
4-point scale ranging from “strongly disagree” to “strongly agree”. Responses are
presented in Table 2.7 and are collapsed for presentation purposes. Most striking of these
responses is the high number of participants who selected don’t know for each item

25
Statement Agree Disagree Don't Know
Managers do a good job of providing information about management activities
47%
21%
31%
Agency managers build trust and cooperation with local citizens** 47 20 33 The agency is open to public input and uses it to shape management decisions
47 19 34
There are adequate opportunities for citizens to participate in the local agency planning process**
37 23 40
I am skeptical of information from the forest agency in my area** 23 55 21
** 2008 responses are significantly different between locations at p ≤ .05.
Table 2.7. Citizen-agency interactions and trust
(ranging from 21% to 40%); suggesting a high number of participants have had little
direct experience with forest agencies despite their proximity to federally managed lands.
Moreover, responses provide a rather tepid assessment of citizen-agency interactions. In
aggregate, just under half agreed forest agencies do a good job of providing information
about management activities, that agency managers build trust and cooperation with local
citizens, or are open to public input and use it to shape management decisions. Even
fewer believed there were adequate opportunities for citizens to participate in agency
planning processes at the local level. Moreover, nearly one quarter were skeptical of
information received from forest agencies.
Significant differences. On three items, managers build trust and cooperation
with local citizens, there are adequate opportunities for citizens to participate in the local
agency planning process, and I am skeptical of information from the forest agency in my
area, significant differences were observed across locations in 2008. The number of
respondents agreeing with these statements ranged from a high of 56% in AZ to a low of

26
41% in MI (managers build trust and cooperation with local citizens), from a high of
47% in CO to a low of 27% in UT (there are adequate opportunities for citizens to
participate in the local agency planning process), and from a high of 31% in MN to a
low of 18% in AZ (I am skeptical of information from the forest agency in my area).
Influencing variables.
Correlation analysis. One objective of this study was to identify and examine
those variables that influence acceptance of treatment use. We first ran a correlation
analysis to identify variables significantly associated with acceptance of treatments (see
Table 2.8). While Steel et al. (1997) found that public attitudes about natural resource
issues are often associated with socio-demographic characteristics, data here provided
Characteristic
Acceptance of Prescribed
Fire
Acceptance of Mechanized
Thinning Age 0.005 -0.018 Gender 0.058 0.053 Education 0.095 * 0.086 Regional Location (Western vs. Lake States) .109 * .123 ** Perceived likelihood of wildfire 0.009 -0.039 Wildfire impacts on quality of life 0.074 -0.023 Distance to area where wildfire might burn -0.003 -0.006 Environmental / Economic Orientation 0.063 .222 ** Trust in agency managers to implement specific treatment .524 ** .336 ** Treatment outcomes (index variable) .536 ** .408 ** Trust in agency information (index variable) .293 ** .165 ** Agency interactions with local community (index variable) .236 ** .095 Agrees that agency incorporates public concerns .325 ** .142 ** * Significant at p ≤ .05., ** Significant at p ≤ .01.
Table 2.8. Bivariate correlations between respondents’ characteristics and support for prescribed fire and mechanized thinning, 2008 survey

27
limited evidence of influence on citizen acceptance of agency practices from
demographic variables such as age (not significant), gender (not significant), or education
(significant, though weak, direct influence on acceptance of prescribed fire). The lack of
relationships with socio-demographic variables parallels findings from other wildfire
studies (e.g., Shindler and Toman 2003).
Several index variables were created and incorporated within the data analysis. To
analyze the influence of geographic location on treatment acceptance, respondents from
each of the seven states were re-coded into the “regional location” variable (with 1
representing AZ, CO, OR, UT and 2 representing MI, MN, WI). This variable was found
to have a significant influence on acceptance for both treatments.
The “treatment outcomes” variable was created by combining responses to
individual questions asking respondents to evaluate the likelihood that treatments would
generate positive outcomes. Individual questions were evaluated using a Likert-type scale
where 1 = not at all likely and 5 = extremely likely. When necessary, responses to
individual questions were reverse-coded to maintain consistency in the scale of
responses. Potential outcomes of prescribed fire included reducing scenic quality
(reverse-coded), saving money by reducing the cost of fighting a wildfire, restoring
forests to a more natural condition, improving conditions for wildlife, effectively
reducing fire risk, and creating more smoke in the short term but less smoke over time.
Potential outcomes of mechanized thinning included reducing scenic quality (reverse-
coded), saving money by reducing the cost of fighting a wildfire, restoring forests to a
more natural condition, improving conditions for wildlife, effectively reducing fire risk,
and allowing for more harvesting than necessary (reverse-coded). The index was created

28
by combining responses to these six individual questions for each treatment; therefore,
each respondent displayed an overall likelihood of the treatment resulting in positive
outcomes that ranged from 6 to 30. Results show that treatment outcomes had a
significant, direct influence on acceptance for both treatments.
The “trust in agency information” variable was created by combining responses to
individual questions asking respondents to rate their trust in local agency information.
Individual questions were evaluated using a Likert-type scale where 1 = strongly disagree
and 7 = strongly agree. Questions included in the trust in agency information index
variable evaluated respondents’ belief that their agency provided credible information
about fuel reduction activities, enough information to allow for actions to be taken about
fire and fire safety, and current, timely information about forest fire issues. The index
was created by combining responses to these three individual questions; therefore, each
respondent displayed an overall level of trust in agency information that ranged from 3 to
21. Results show that trust in agency information had a significant, direct influence on
acceptance for both treatments.
The “agency interactions with local community” variable was created by
combining responses to individual questions (displayed in Table 2.7) asking respondents
to evaluate the strength of local citizen-agency interactions. Individual questions were
evaluated using a Likert-type scale where 1 = strongly disagree and 4 = strongly agree.
When necessary, responses to individual questions were reverse-coded to maintain
consistency in the scale of responses. Questions included in the variable evaluated citizen
agreement with the following questions: the agency is open to public input and uses it to
shape management decisions, agency managers create plans without input from local

29
communities (reverse-coded), managers build trust and cooperation with local citizens,
managers do a good job of providing information about management activities, I am
skeptical of information from forest agencies (reverse-coded), and there are adequate
opportunities for citizens to participate in the agency planning process. The index was
created by combining responses to these six individual questions; therefore, each
respondent displayed an overall assessment of agency interactions with the local
community that ranged from 6 to 24. Results show that agency interactions with the local
community had a significant, direct influence on acceptance for prescribed fire.
Remaining variables that indicated a significant influence on one or both
treatments included: environmental/economic orientation, trust in agency managers to
implement specific treatments, and agreement that public concerns are incorporated into
agency plans. Each of the variables that indicated a significant association with one or
both treatments were included in the further analysis reported below.
Logistic regression. To explore the relative influence of the variables presented
here on treatment acceptability, we dichotomized responses to the acceptability questions
presented in Table 2.4 (with 1 representing responses indicating the treatment is “a
legitimate tool and should be used whenever managers see fit” or “something that should
be used in carefully selected areas” and 0 representing all other responses --“a practice
that should not be considered because it creates too many negative impacts”, “an
unnecessary practice”, and “know too little to make a judgment”). We then used logistic
regression to examine the influence of the eight independent variables that were
significantly correlated with acceptance of prescribed fire and mechanized thinning

30
Variable Acceptance of Prescribed Fire
Acceptance of Mechanized
Thinning
β (Sig.) β (Sig.) Education .262 (.117) -.133 (.431) Regional Location (Western vs. Lake States) -1.020 (.049) * -.079 (.882) Environmental / Economic Orientation -.127 (.509) -.038 (.844) Trust in agency managers to implement specific treatment
.669 (<.001) *** .369 (.047) *
Treatment outcomes Index: 6-30 (Belief that treatment will result in positive outcomes)
.299 (<.001) *** .227 (<.001) ***
Trust in agency information Index: 3-21 (Trust in agency information)
-.045 (.557) -.046 (.605)
Agency interactions with local community Index: 6-24 (Ratings of citizen-agency interactions)
.009 (.888) .079 (.172)
Agrees that agency incorporates public concerns
.024 (.948) .222 (.591)
Chi-square 118.085 *** 44.252 *** Percent correctly classified 93.5 94.9 Nagelkerke R2 0.575 0.316
Significance levels: *p ≤ .05; ***p ≤ .001
Table 2.9. Logistic regression analysis
(displayed in Table 2.8). The resulting logistic regression models are presented above
(Table 2.9).
The chi-square statistics for both models are statistically significant, indicating the
combination of independent variables in the model significantly influence treatment
acceptability. Each model was also successful in classifying at least 93% of cases. Also
displayed is the Nagelkerke R2, which provides an estimate of the variance predicted by
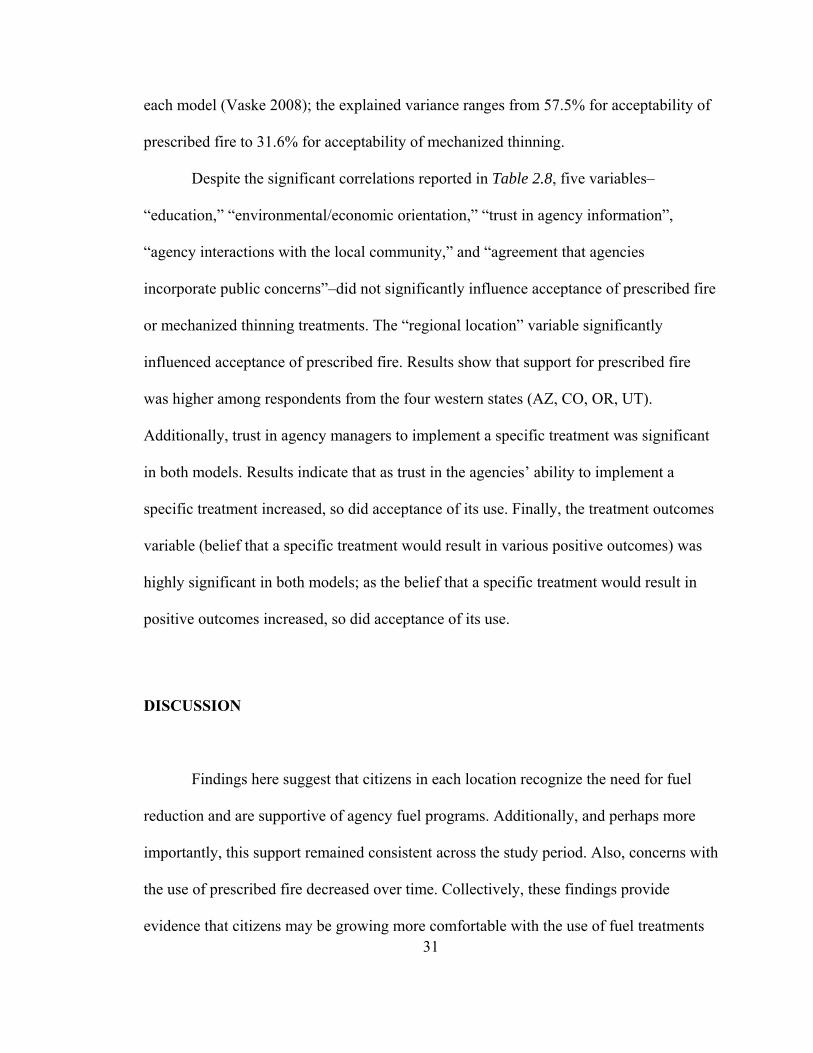
31
each model (Vaske 2008); the explained variance ranges from 57.5% for acceptability of
prescribed fire to 31.6% for acceptability of mechanized thinning.
Despite the significant correlations reported in Table 2.8, five variables–
“education,” “environmental/economic orientation,” “trust in agency information”,
“agency interactions with the local community,” and “agreement that agencies
incorporate public concerns”–did not significantly influence acceptance of prescribed fire
or mechanized thinning treatments. The “regional location” variable significantly
influenced acceptance of prescribed fire. Results show that support for prescribed fire
was higher among respondents from the four western states (AZ, CO, OR, UT).
Additionally, trust in agency managers to implement a specific treatment was significant
in both models. Results indicate that as trust in the agencies’ ability to implement a
specific treatment increased, so did acceptance of its use. Finally, the treatment outcomes
variable (belief that a specific treatment would result in various positive outcomes) was
highly significant in both models; as the belief that a specific treatment would result in
positive outcomes increased, so did acceptance of its use.
DISCUSSION
Findings here suggest that citizens in each location recognize the need for fuel
reduction and are supportive of agency fuel programs. Additionally, and perhaps more
importantly, this support remained consistent across the study period. Also, concerns with
the use of prescribed fire decreased over time. Collectively, these findings provide
evidence that citizens may be growing more comfortable with the use of fuel treatments

32
to mitigate wildland fire risk. They also suggest that this existing base of supportive
stakeholders could be a central asset in building future management programs.
Results here also emphasize the importance of tailoring programs to address local
needs. There were several notable differences in responses between locations on items
including perceived health of local forests, strength of citizen-agency interactions, and
attitudes about treatments. These differences highlight the importance of developing a
strong understanding of relevant concerns, information needs, preferred communication
methods, and opportunities to engage residents at the local level. Ultimately, residents in
these forest communities are directly affected by agency fire and fuel management
efforts. While residents enjoy the benefits of such treatments, they also bear the costs of
any negative impacts ranging from smoke or damage to private property from the use of
prescribed fire to altered stand composition and resulting changes to forest values.
While this research provides evidence of sustained acceptance for fuel treatments
over time, trouble spots still exist. Findings here suggest low levels of trust in forest
agencies to implement specific treatments on the ground. Indeed, more than one in five
respondents in 2008 did not trust agency personnel to effectively plan and implement
prescribed burns. This finding is particularly concerning given the strong connection
between trust in agency managers to implement specific treatments and treatment
acceptance, as evidenced in the correlation analysis and the logistic regression models.
Responses here also highlight frustration with a lack of opportunities for citizen
involvement in agency planning and decision-making processes. The level of such
concern varied between locations, but participants in each study site called for increased
33
participation over current levels. As responses here and elsewhere illustrate, citizens want
an expanded role beyond what is typically available through standard scoping meetings.
A primary objective of this paper was to examine the factors that influence
acceptance of treatments in the study locations. As suggested by prior literature, we
expected treatment acceptance would likely vary across locations and would be
influenced by multiple factors including awareness of potential outcomes (e.g., Loomis et
al. 2001, Brunson and Shindler 2004), citizen involvement in developing treatment plans
(e.g., Winter et al. 2002, Blanchard and Ryan 2007), existence of high quality
relationships between residents and agency personnel (Fleeger 2008), as well as trust in
agency managers (e.g., Shindler and Toman 2003). In addition, we were interested in the
influence of demographic variables (age, gender, education), as well as other variables
specific to this research such as environmental/economic orientation, distance from home
to an area where a wildfire might burn, concern that a wildfire could impact quality of
life, and perceived likelihood of a local wildfire event.
Our correlation analysis indicated significant associations between the potential
explanatory variables and treatment acceptance levels at the 0.05 level on 8 of the 13
variables examined: education, regional location, environmental/economic orientation,
trust in the agency to implement the specific treatment, belief that the treatment would
result in positive outcomes, trust in agency information, ratings of agency interactions
with the local community, and agreement that the agency incorporates public concerns.
Interestingly, the correlations did not provide evidence that treatment acceptance is
associated with the perceived likelihood of a local wildfire occurrence, concern that a
wildfire could impact quality of life, or the distance from one’s home to an area where a
34
wildfire might burn. The lack of observed association between these factors and
treatment acceptance is noteworthy as it suggests that respondents’ perception of a future
wildfire impacting their life did not influence their acceptance of treatment practices
designed to reduce the risk of future wildfires.
The further analysis of potential influencing factors through the logistic regression
models identified three variables that significantly influenced treatment acceptance:
regional location (significant in predicting acceptance of prescribed fire), trust in agency
managers to implement specific treatments (significant in predicting acceptance of
prescribed fire and thinning), and belief that treatments would result in various positive
outcomes (significant in predicting acceptance of prescribed fire and thinning).
Prior research has uncovered regional variation in citizen concerns about the use
of prescribed fire (e.g. Winter et al. 2002, Brunson and Shindler 2004). In this study,
regional location was significant in predicting acceptance of prescribed fire treatments;
specifically, support for this practice was more likely among respondents from the
western states. This finding may be attributed to the higher frequency with which the
practice is used in the western states and the fact that residents there have grown more
comfortable with prescribed fire treatments and the outcomes that can be achieved.
Citizens in the lake states may be waiting to see if similar results can be achieved
on their local forests before granting an equal level of support for the treatment;
additionally, Michigan managers, specifically, must address negative public perceptions
that persist partially as a result of prior mishaps with escaped prescribed burns (e.g. the
1980 Mack Lake Fire). These factors indicate that increased support in the lake states

35
may hinge largely on local managers’ ability to use prescribed fire consistently,
effectively, and responsibly.
The other two variables that were found to significantly influence treatment
acceptance, trust in agency managers to implement specific treatments and belief that
treatments would result in various positive outcomes, lend further credibility to earlier
research that has identified trust in agency managers and beliefs about treatment
outcomes as having an influence on treatment acceptability (e.g. Shindler and Toman
2003, Brunson and Shindler 2004). Given this growing body of knowledge, resource
managers should think of building trust with stakeholders as a primary goal of agency
programs and not simply expect it to result as a by-product of developing science-based
management plans. Trust-building is a lengthy, cumulative process and trustworthy
relationships are the sum of many individual interactions with local stakeholders. One
mistake can replace a thousand successes and may result in the rapid erosion of trust,
particularly when prescribed fire is the tool of choice. In the aftermath of an escaped
prescribed burn in Utah in 2003, citizens indicated significantly lower levels of trust in
the US Forest Service and Bureau of Land Management to make good decisions about
wildfires and fire prevention (Brunson and Evans 2005). Trust must be built over time
and will be a reflection not only of the strength of agency interactions with citizens, but
also of the ability of agency managers to use treatments effectively on a consistent basis.
Regarding beliefs about treatment outcomes, these findings suggest that agency
managers should take a proactive approach at reaching out to their stakeholders to
communicate the positive results that can be achieved when fuel treatments are utilized
effectively. Interactive communication approaches, such as conversations with agency

36
personnel, guided field trips, workshops, and informational sessions, may provide the
type of venues necessary to not only communicate these outcomes to the public, but also
build trustworthy relationships and establish credibility. Findings elsewhere indicate that
interactive methods can be more effective at encouraging attitude or behavior change
(Erwin 2001, Rogers 2003). In addition, trust is more likely to develop in the context of
personal relationships than in anonymous information provision (Jamieson 1994). While
it may be more efficient to use standardized, agency-wide communication devices, such
approaches are unlikely to be as effective as messages that target local priorities and
specific environmental context (Brunson and Shindler 2004). Given the important role of
trust in agency managers and beliefs about treatment outcomes in influencing
acceptability levels, the additional time required for agency managers to engage their
stakeholders in more personal, interactive ways is likely to translate into positive
outcomes at the local level.
CONCLUSIONS
Fuel reduction programs have become a key piece of the federal forest
management puzzle across much of the nation. Because a major objective of these
programs is to reduce the risk of wildfire to those living in forest communities, there is a
strong human component inherent in the process. Therefore, public acceptance is critical
to the long-term success and sustainability of effective fuel reduction programs.
This article describes a longitudinal study designed to develop a more complete
understanding of the factors that contribute to public awareness and acceptance of agency

37
planning processes and fuel reduction treatments over time and across geographic
locations. A central finding of this study is that, overall, public support for prescribed fire
and mechanized thinning treatments remained relatively strong and remarkably stable
throughout the study period in each of our locations. In addition, beliefs about most
potential concerns associated with prescribed fire decreased from 2002 to 2008, both
positive signs for land managers.
However, this study also shows that support is very much site-dependent and
often hinges on the ability of individual managers to communicate effectively with forest
residents while building credibility and providing opportunities for meaningful
involvement in the management process. Additionally, findings highlight the critical link
between trust in the agency to implement treatments, perceived treatment outcomes, and
support for treatment methods. Armed with this information, managers have the ability to
fine-tune their local outreach approach and focus not only on implementing effective
treatments but also on building effective programs to engage local residents and
strengthen those variables (e.g., public involvement, incorporating public concerns, trust
building, communicating positive outcomes) that are shown to be related to treatment
support.

38
Chapter 3: Examining the Decision-Making Environment of Fire Managers in the Northern Lake States
INTRODUCTION The northern lake states region, comprised of the northern Lower and the Upper
Peninsulas of Michigan, northern Wisconsin, and northern Minnesota, is dominated by a
variety of forest ecosystem types characterized as fire-dependent (Drobyshev et al. 2008,
Radeloff et al. 2001). These include: jack pine (Pinus banksiana Lamb.) forest ecosystem
types, including pine barrens; upland mixed-pine forest ecosystem types dominated by
red pine (P. resinosa Ait.) and eastern white pine (P. strobus L.); peatland forest
ecosystem types dominated by black spruce (Picea mariana) and other woody plant
species; as well as coastal pine forest ecosystem types distributed along the coasts of
Lake Huron, Lake Michigan, and Lake Superior dominated by eastern white pine, red
pine, jack pine and northern red oak (Quercus rubra L.).
The major organizations responsible for the management of these fire-dependent
ecosystem types in the northern lake states are the US Forest Service, the US Fish and
Wildlife Service, the National Park Service, the Bureau of Indian Affairs, state natural
resource management departments, tribal entities, and non-profit organizations such as
The Nature Conservancy. Efforts by managing agencies to reduce hazardous fuel levels
and restore these forest ecosystems to more natural conditions are often complicated

39
by the need for managers to focus on multiple objectives as directed by guiding
legislation such as the Multiple Use Sustained Yield Act of 1960 and the 1976 National
Forest Management Act, among others. Management objectives commonly include the
protection of wildlife habitat, commodity production, provision of recreational
opportunities, and amenity values. In some instances these objectives may be
complementary, while in others they involve difficult tradeoffs. Resource managers
balance these multiple influences when making decisions about management activities.
As these decisions have increased in complexity over time, managers have increasingly
looked for additional information to understand potential outcomes of different
management approaches.
The present paper describes a study designed to examine the decision-making
context of fire managers in the northern lake states region (MI, WI, MN). We use in-
depth interviews and a web-based survey of land managers in Michigan, Wisconsin, and
Minnesota to understand 1) methods currently used to achieve forest restoration and/or
fuel reduction objectives, 2) factors that influence decisions regarding the adoption of
these different methods, and 3) availability of information exchange and decision
support.
Summary of Related Research.
Tasked with implementing complex fire and fuel management programs,
managers in the northern lake states region must rely on various forms of scientific
information when making decisions. Often this information is generated by the academic
community and may not be easily decipherable to the majority of fire managers. The term

40
“decision support”, in a general sense, describes the process of making such scientific
information useful and relevant for practical decision making (National Research Council
2009). The process is meant to provide tools, data, and other types of information
products that make scientific information both accessible and understandable to decision
makers on the ground. Recently, decision support has broadened to include a set of
processes intended to create the conditions for the production and application of decision-
relevant information. In this process, ongoing communication between the producers
(scientific community) and users (management community) of information is critical to
achieving the optimum outcome. Communication between information producers and
users will likely be more effective when it is continuous and iterative, rather than a one-
time, linear activity.
The effectiveness of decision support can be judged by the extent to which it
increases the likelihood that decision-relevant information is produced and enables
decision-makers to use it appropriately (National Research Council 2009). To increase
effectiveness, prior research suggests several overarching principles that improve the
effectiveness of decision support systems. Perhaps most importantly, decision support
activities should be driven by users’ needs, rather than scientific research priorities.
Although this may seem intuitive, much research that is intended to be decision relevant
is begun and conducted without consultation with the envisioned end users (McNie 2007;
Sarewitz and Pielke 2007). This can lead to an outcome in which decision-makers feel as
though the resulting information is not applicable to their situation.
Additionally, evidence emphasizes the importance of building strong,
collaborative relationships between information producers and users, even to the extent

41
that relationship-building is a higher priority than the information products themselves. If
interpersonal interactions are mismanaged, the resulting disconnects can reduce the
quality of relationships between users and producers of information, the usefulness of
information, and, ultimately, the quality of decisions (Mitchell et al. 2006, Reid et al.
2007).
Finally, decision support has been shown most effective when it continues over
time rather than via short-term pilot projects or small, short-lived interactions between
information producers and users. The element of time allows trust and relationships to
strengthen and ideas to be fully investigated, thus providing decision-makers with a
wealth of information designed specifically to address the unique questions important to
their situation. Therefore, the formal institutionalization of a decision support system is
often necessary to ensure longevity and maximize success (National Research Council
2009). Establishing focused decision support centers within or affiliated with academic
institutions has been successful at the regional level (e.g. The Great Lakes Regional
Assessment), while other decision support systems may be formalized to serve a
particular temporary policy purpose (e.g. advisory councils appointed in support of state
or national policy decisions).
Given the need for relevant and applicable information, decision support
approaches are most effective when tailored to specific decision-making environments
(National Research Council 2009). To date, limited research has examined the decision-
making environment of fire managers in the lake states. In one recent study, interviews
were conducted with managers from The Nature Conservancy, Michigan Department of
Natural Resources, and two federal agencies-the US Forest Service and the US Fish and

42
Wildlife Service (Wilson et al. 2009). This study found that the reduction of fuel loads to
prevent future catastrophic fire was a primary fire management objective across the
region. Forest management decisions were often focused on achieving environmental
objectives, with the three most cited objectives being to promote wildlife diversity,
promote habitat diversity, and coordinate management efforts across landscapes. Results
also indicated managers exhibited a strong desire to use more prescribed fire in their
management programs (62% selected this as their most desired management change) but
were limited from doing so by mandates and statutes, lack of ecosystem knowledge, lack
of resources, public perceptions, and wildland-urban interface constraints. In addition,
most managers also stated they were concerned about risks posed by fire to human life,
timber products, and other property, suggesting that risk aversion may also be a factor in
the decision to suppress a wildfire or postpone a prescribed burn. Overall, although
managers recognized the importance of fire in mixed-pine forest ecosystems, they found
it difficult to implement in practice (Wilson et al. 2009).
Management Context.
Although in the United States, wildland fires are generally viewed as an issue
with regional importance to the western or southern states, there have been several
significant fires in Michigan, Wisconsin, and Minnesota in recent years. In 2005,
Wisconsin’s Cottonville Fire became the state’s largest blaze in over 25 years, burning
over 3,400 acres. Minnesota’s 2006 Cavity Lake Fire consumed 32,000 acres, while the
2007 Ham Lake Fire destroyed 60 homes. Most recently, Michigan’s 2010 Meridian
Boundary Fire forced the evacuation of numerous homeowners and consumed over 8,500

43
acres of dense jack-pine forest. As of August 2010, the three states had experienced a
combined 3,549 wildfires that had consumed over 46,200 acres year-to-date (National
Interagency Fire Center 2010). In addition, the region has experienced several high-
profile incidents involving escaped prescribed burns, including Michigan’s Mack Lake
Fire in 1980 that escaped control lines and burned 20,000 acres, resulting in one
firefighter fatality and the destruction of 44 homes and buildings.
Several region-specific factors contribute to the wildfire risk. Public lands in the
northern lake states are frequently characterized by a highly fragmented ownership
pattern where small publicly-owned parcels are mixed with private property and rural
neighborhoods. Human populations are dense, with nearly all forests in the region located
within 25km of densely populated communities (Radeloff et al. 2005). In addition, most
fires in the region are of human origin. Debris-burning, a practice commonly used to
dispose of trash and debris from land clearing, is the cause of most fire starts across the
region. Arson is also a primary concern; more than half of all fires over 40 ha in size are
deliberately set (Cardille and Ventura 2001). Finally, fire management plans must
incorporate the habitat requirements of the federally protected Kirtland’s Warbler (listed
as endangered under the Endangered Species Act), a ground-nesting, Neotropical migrant
that breeds in the fire-dependent jack-pine ecosystems of the Upper Midwest (Corace et
al. 2010, Probst and Weinrich 1993).
While forest restoration and fuel management programs that utilize prescribed fire
have long been in place throughout much of the western U.S., these programs are
relatively new to the northern lake states region. Following a series of federal initiatives
that emerged in 2000 and subsequent years (e.g., the National Fire Plan, Ten Year
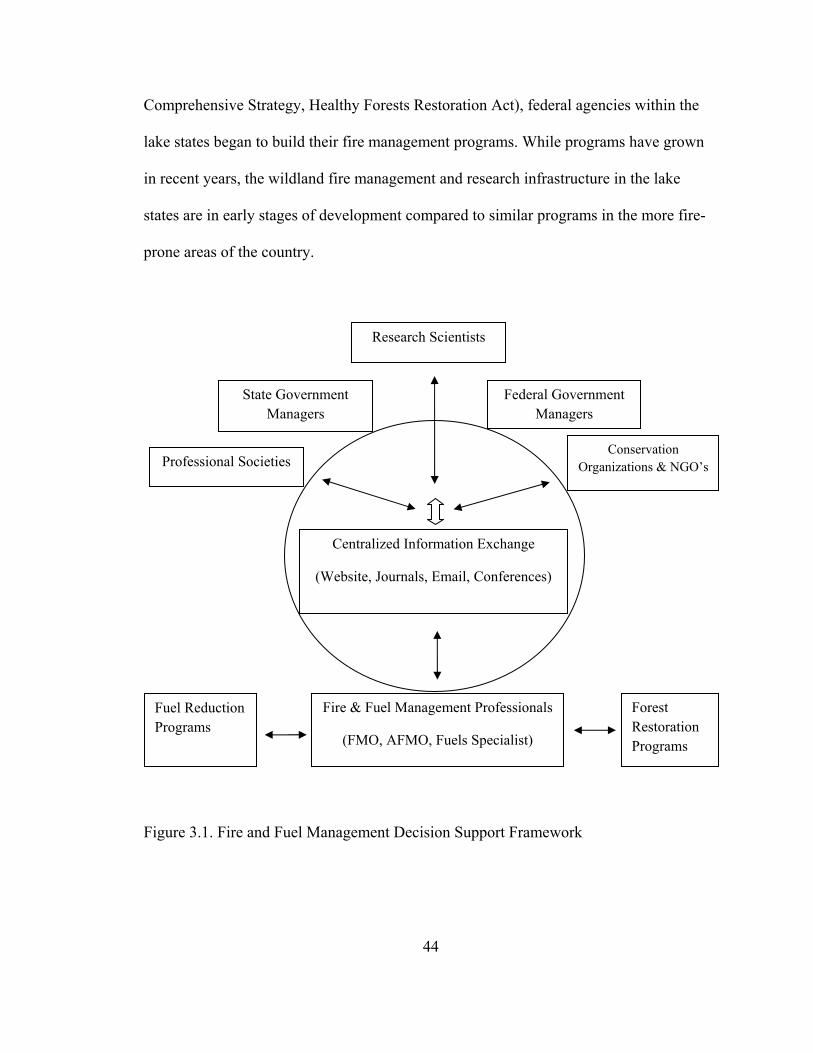
44
Comprehensive Strategy, Healthy Forests Restoration Act), federal agencies within the
lake states began to build their fire management programs. While programs have grown
in recent years, the wildland fire management and research infrastructure in the lake
states are in early stages of development compared to similar programs in the more fire-
prone areas of the country.
Figure 3.1. Fire and Fuel Management Decision Support Framework
Research Scientists
State Government Managers
Professional Societies
Federal Government Managers
Conservation Organizations & NGO’s
Centralized Information Exchange
(Website, Journals, Email, Conferences)
Fire & Fuel Management Professionals
(FMO, AFMO, Fuels Specialist)
Forest Restoration Programs
Fuel Reduction Programs

45
Given the relatively short history of fire and fuel management programs within
the region, limited research has been completed to date to examine the context of these
programs as well as the decision-making environment of managers as they strive to
implement, manage, and refine programs that accomplish multiple objectives. The long-
term goal of this line of inquiry is to develop a comprehensive decision-support network
of fire professionals and researchers, allowing decision-makers across the region to
access and apply the latest information applicable to their unique situation, rather than
relying solely on past experience or status quo tactics. Figure 3.1 provides a
conceptualization of the decision support framework and the flow of information within
the context of fire and fuel management.
RESEARCH DESIGN
The present research was conducted in two phases. First, semi-structured,
telephone interviews were conducted with 12 managers from Michigan and Minnesota.
Participants were employees of the US Forest Service, US Fish and Wildlife Service,
National Park Service, Bureau of Indian Affairs, The Nature Conservancy, as well as
state natural resource departments. Interview questions included a series of open-ended
questions designed to elicit a broad range of individual responses on topics such as fuel
reduction and forest restoration methods, factors affecting method implementation,
factors that influence management decisions, and preferred sources and methods for
communicating emerging fire science information.
In the second phase, an Internet survey was developed based on prior research as
well as findings from the phone interviews that allowed us to target questions to local

46
management strategies and concerns. Survey items included closed-choice questions that
again addressed the issues of fuel reduction and forest restoration methods, factors
affecting method implementation, factors that influence management decisions, and
preferred sources and methods for communicating emerging fire science information.
Survey questions allowed respondents to write open-ended responses in addition to
selecting among the closed-choice options.
The web-based survey targeted managers from across the northern lake states
region (MI, WI, MN) who were employed by state, federal, tribal, and non-governmental
natural resource management organizations that were actively utilizing fire as a land
management tool. Potential participant lists were obtained from agency contacts across
the region. In addition, participants who completed the survey were asked to provide
contact information for colleagues that should be included in the sample.
Survey implementation followed a modified version of the ‘total design method’
(Dillman 1978), using a series of emails to encourage participation. An introductory
email was sent to potential participants in mid-December, 2009 explaining the objectives
of the project and notifying them that they would soon receive an invitation to complete
an Internet survey. Shortly thereafter, the first invitation was sent via email inviting
participants to take the survey. Two additional e-mail invitations were sent to non-
respondents in January and February, 2010 encouraging survey participation. Of the 120
people contacted, 81 returned completed surveys, resulting in a 68% response rate. A
response at this level is regarded as sufficient for a descriptive study of this nature
(Lehman 1989, Needham and Vaske 2008).

47
Qualitative analysis of interview data was conducted by organizing responses by
thematic area to determine the frequency of responses. Quantitative analysis of survey
responses included multiple steps. The data was first summarized using descriptive
statistics. Findings were then compared across study locations using chi-square tests to
determine notable differences among states. Findings enable comparisons to be made
across the region and allow for the discussion of several strategies to guide the direction
of future research and improve the communication of scientific information throughout
the northern lake states region.
FINDINGS
The following sections describe findings from both the qualitative and
quantitative portions of this research. Displayed percentages and statistical tests are
conducted on survey responses. When appropriate, interview themes and quotes are
described to provide additional details and explanation of survey results.
Summary of study participants.
Study participants were employed as fire managers (41%), forest managers
(19%), wildlife biologists (12%), researchers (7%), and in other natural resource
management occupations (21%) including wildlife refuge manager, fuels specialist, and
conservation director. Respondents represented the states of Michigan (40%), Minnesota
(41%), and Wisconsin (19%), respectively, and were drawn from a variety of employers
including state and federal government agencies, non-profit land management

48
MI MN WI Total
Results by Title Fire Manager 12 14 7 33 Forest Manager 9 4 2 15 Wildlife Biologist 3 5 2 10 Researcher/Scientist 1 3 2 6 Other 7 7 3 17
Results by Agency State DNR 14 10 9 33 USFS 8 9 2 19 USFWS 6 4 1 11 NPS 2 1 1 4 BIA 0 4 0 4 Private/Non-governmental (e.g. TNC) 2 5 3 10 Total Respondents 32 33 16 81 Results represent number of respondents.
Table 3.1. Summary of web-based survey respondents
organizations, tribal organizations, and the forest products industry. Table 3.1 provides a
complete breakdown of survey respondents by state, title, and employer.
Forest restoration and fuel reduction methods.
Respondents were asked to indicate the frequency with which they utilized
various methods to achieve forest restoration and/or fuel reduction objectives (Table 3.2).
In aggregate, managers throughout the lake states region were most likely to use
mechanized thinning and prescribed fire, while herbicides and wildland fire use (actively
managing a wildfire to accomplish land management objectives instead of engaging in
immediate suppression) were much less prevalent.

49
Statement MI MN WI Average Chi-
square How often are the following methods utilized to achieve your forest restoration and/or fuel reduction objectives…
Mechanized thinning 0.773 Often/Always 66% 67% 56% 64% Never/Rarely 13% 12% 13% 12% Prescribed fire** 0.012 Often/Always 22 58 75 47 Never/Rarely 19 12 13 15 Mowing 0.415 Often/Always 25 21 50 28 Never/Rarely 34 46 25 37 Herbicide** 0.016 Often/Always 9 12 44 17 Never/Rarely 59 52 25 49 Wildland fire use 0.876 Often/Always 3 3 0 2 Never/Rarely 78 82 81 80
** Responses are significantly different between locations at p ≤ .05.“Sometimes” responses are omitted for presentation purposes.
Table 3.2. Utilization of methods to achieve objectives, state by state comparison
Geographic variation. Significant geographical variation was found between
states regarding the frequency with which the various methods were used. For example,
managers in Michigan were significantly less likely to use prescribed fire than their
colleagues in Minnesota and Wisconsin. Less than one in four Michigan managers (22%)
reported using prescribed fire often or always, compared to more than one half of
managers in Minnesota (58%) and three out of four in Wisconsin (75%). Interview
responses from Michigan managers provide evidence that this may be due in part to past
incidents with prescribed fire in the state and a lack of public support for the practice.

50
According to one manager “There is a history of large escaped fires in the area, people
don’t forget those. The Mack Lake fire still impacts public opinion.”
Notable differences were also observed between states regarding herbicide use.
Managers in Wisconsin were significantly more likely to use herbicide treatments than
their colleagues in Michigan and Minnesota, with almost one half of Wisconsin managers
(44%) reporting that they used the practice often or always, compared to 12% in
Minnesota and just 9% in Michigan. Certain practices were used rarely throughout the
region; for example, few managers made use of wildland fire use in any of the three
states.
Objectives of treatment use.
While the frequency of treatment use is helpful in determining how often various
methods are utilized in fire and fuel management programs throughout the region, it is
also important to understand the underlying objectives managers seek to achieve through
treatment implementation. Table 3.3 provides an analysis of five treatment methods and
the primary objectives for which they are used by managers throughout the lake states.
When asked if a treatment was used primarily to restore forest conditions, reduce forest
fuels, or a combination of both, more than half of all managers in aggregate reported that
prescribed fire (78%) and mechanized thinning (57%) were used primarily to accomplish
both. Herbicides (43%) and mowing (27%) were cited most often as being used primarily
to restore forest conditions. Interestingly, reducing forest fuels was not the primary
objective for any of the five methods discussed, suggesting that fuel reduction may be a
secondary priority throughout the region.

51
Statement MI MN WI Average Chi-
square Does your management area utilize these methods primarily to restore forest conditions, reduce forest fuels, or both…
Mechanized thinning 0.282 Restore forest conditions 25% 30% 25% 27% Both 63% 46% 69% 57% Reduce forest fuels 6% 21% 0% 11% Don't use the practice 6% 3% 6% 5% Prescribed fire 0.063 Restore forest conditions 6 12 38 15 Both 81 82 63 78 Reduce forest fuels 6 6 0 5 Don't use the practice 6 0 0 3 Mowing 0.65 Restore forest conditions 25 24 38 27 Both 28 21 25 25 Reduce forest fuels 22 24 31 25 Don't use the practice 25 30 6 24 Herbicide 0.44 Restore forest conditions 44 39 50 43 Both 22 12 25 19 Reduce forest fuels 9 3 6 6 Don't use the practice 25 46 19 32 Wildland fire use 0.926 Restore forest conditions 13 9 13 11 Both 22 27 25 25 Reduce forest fuels 3 0 0 1 Don't use the practice 63 64 63 63
Table 3.3. Objectives associated with treatment methods, state by state comparison
Geographic variation. Again, key differences emerged between states when we
examined the primary objectives associated with treatment implementation. While
prescribed fire was used by a majority of managers in all three states to accomplish a
combination of fuel reduction and forest restoration objectives, the number who reported
52
using prescribed fire primarily to restore forest conditions was far greater in Wisconsin
(38%) than in Minnesota (12%) or Michigan (6%). In addition, managers in Minnesota
(21%) were much more likely than their colleagues in Michigan (6%) and Wisconsin
(0%) to use mechanized thinning primarily as a means to reduce forest fuels. These
differences highlight the unique approaches that are utilized across the region.
To get a sense of constraints influencing management, participants were asked to
indicate if they would prefer to use any of these treatments more than their current levels.
Nearly all respondents, 95%, agree that they would like to use prescribed fire more often
while majorities would also like to increase their use of wildland fire use (64%) and
mechanized thinning (52%). On two treatments, mowing and herbicide, a majority of
managers indicated they were content with their current levels of use. Regarding
increased use of fire throughout the region, several participants noted the challenge at
doing so due to interface constraints and resulting agency liability. As one manager
stated, “When you choose to manage a fire for fire use, you open up a huge amount of
liability and responsibility to the agency”.
Influencing factors.
Given the varying frequencies and differing objectives for treatment use, we were
interested in the factors that influence forest restoration and fuel management decisions
throughout the northern lake states. Natural resource management decisions are complex
and rarely consist of a single set of circumstances or a sole group of interested
stakeholders. Rather, managers must operate in a complex environment in which
decisions are made depending upon the interactions of available resources, legal

53
obligations, agency mandates, public pressures, and other factors. Seeking to develop a
more thorough understanding of this environment, we asked managers to rate the degree
to which certain factors influenced their forest restoration or fuel management decisions.
Survey participants were asked to evaluate 12 closed-choice response options for
their level of influence on management decisions (Table 3.4). Possible response options
were developed from prior literature as well as interview findings from phase 1 of this
research. Results demonstrate that, indeed, there are a variety of factors that play a large
role in influencing agency managers. Across all states and all agencies, budget constraints
were the primary variable reported by managers as having a great deal of influence on
management decisions.
Statement Not at
all Slightly Moderately A great
deal How much do the following factors influence your forest restoration and/or fuel management decisions…
Budget constraints 0% 7% 35% 58% Competing agency interests 3 26 44 27 Interface constraints 4 30 40 27 Agency mandates 9 38 35 19 Previous agency actions 12 35 37 16 Your forest plan 14 35 37 15 Laws 5 48 33 14 Habitat requirements 9 31 47 14 Pressure from public stakeholders 6 44 41 9 Past personal experiences 21 43 27 9 The scientific community 28 48 17 6 Professional societies 56 37 6 1
Table 3.4. Factors influencing forest restoration and fuel management decisions

54
More than one in four managers (27%) indicated that they were greatly influenced
by competing agency interests, often described as the differing objectives held by
individual management sectors such as wildlife, recreation, timber, engineering, etc. In
addition, another quarter of participants reported a great deal of influence from interface
constraints (27%), defined as the limitations presented by managing lands in close
proximity to human development and/or private lands. Within the northern lake states
region, the proximity of public lands to highly developed areas and complex public-
private ownership patterns are important factors that exacerbate the effect that interface
constraints can have on management implementation.
In contrast, responses also indicated the limited influence of professional societies
and the scientific community. Given the fact that the overall wildland fire management
and research infrastructure is less developed in the lake states than in other regions of the
country, this finding may be attributable to the relatively short time-frame in which these
types of relationships have been allowed to develop. However, these responses suggest
ample opportunities for these two entities to expand their role in interacting with
managers on the ground and influencing agency management decisions.
Interview findings provide additional insight into these responses. Regarding the
influence of budget constraints, one interviewee stated the following, “Land managers are
frustrated by not being able to accomplish the treatments they propose. Funding is a
major barrier to treatment implementation and I believe our agency’s prescribed fire
program will decrease in years to come.” Competing agency interests were also
commonly mentioned as an influencing factor in treatment utilization, with one

55
interviewee saying, “We would love to use more prescribed fire, but competitive interests
like recreation, timber and wildlife often prevent that.”
Although often citing the difficulty of implementing fire and fuel management
treatments within the context of shrinking budgets and a multiple use management
structure, participants also displayed an inventive, team-oriented approach to solving
problems. One respondent stated, “Budgets are limiting, but if we work with wildlife,
timber, etc. we can pool money to stretch our dollars. But, this requires trust,
communication, and a little give and take among everyone involved.” Another
interviewee said, “Competing interests often complicate my plans. But, we must take a
team approach.” These quotes demonstrate not only the impact of certain influencing
variables on management decisions, but also the willingness of managers throughout the
region to embrace challenges in an effort to find collaborative solutions.
Geographic variation. Although no significant differences existed across
locations, several notable variances were observed. For example, when asked about
competing agency interests (e.g. recreation, timber, wildlife, etc.) managers from
Wisconsin (50%) were much more likely than their colleagues in Michigan (22%) or
Minnesota (21%) to report the factor as having a great deal of influence on their
management decisions. Managers from Minnesota appear to be less influenced by legal
requirements, with 12% of Minnesota managers reporting that laws have no influence on
their decisions, compared to managers in Michigan (0%) and Wisconsin (0%). Similarly,
25% of Wisconsin managers reported their forest plan as having no influence on their
management decisions, compared to their colleagues in Minnesota (12%) and Michigan

56
(9%), suggesting that forest plans are perhaps less utilized as a decision-making tool in
Wisconsin.
Sources of fire-science information.
The process by which emerging fire science information is generated,
communicated, and incorporated into management applications is incredibly complex,
involving a number of processes that must be completed to successfully disseminate new
information from the laboratory to the practitioners in the field. Information is generated
regularly by the scientific community; however, the generation of information and the
dissemination of information to the intended target audience (e.g. fire managers) are two
very separate processes. In order to communicate emerging fire science information in
the most effective manner, we sought to better understand how managers currently use
and receive fire science information, the most effective format(s) for communicating new
information, and the common barriers that inhibit successful communication between the
scientific and the management communities.
We began by asking managers to describe how often they use various sources to
acquire information on fire management and forest restoration (Table 3.5). Findings show
that, overwhelmingly, management colleagues are utilized most often to acquire fire
management information. In aggregate, more than three out of four respondents (80%)
said that they used colleagues either often or always as a source of information. In
decreasing order, this was followed by agency research scientists (40%), academic
research scientists (24%), and professional societies (14%).

57
Statement MI MN WI Average Chi-
Square How often do you use the following sources to get information on fire management and forest restoration…
Management colleague 0.052 Often/Always 81% 79% 81% 80% Never/Rarely 3% 3% 0% 2% Agency research scientist 0.464 Often/Always 34 39 50 40 Never/Rarely 22 36 13 26 Academic research scientist 0.889 Often/Always 19 27 25 24 Never/Rarely 28 27 31 29 Professional society 0.643 Often/Always 19 9 13 14 Never/Rarely 53 73 63 63
“Sometimes” responses are omitted for presentation purposes.
Table 3.5. Sources of fire management information, state by state comparison
We further explored this issue by asking respondents to indicate the two sources
from which they most preferred to receive information. Again, management colleagues
(86%) and agency research scientists (70%) were the most preferred sources, while
academic research scientists (27%) and professional societies (12%), were less preferred
among all respondents.
When asked to articulate the various reasons why certain sources are preferred
over others, survey respondents were quick to point out the important elements of trust,
personal connection, and practical “on the ground” experience as reasons why they prefer
to receive information directly from management colleagues. When asked to explain who
they preferred to receive fire science information from, one manager wrote “Personal
operational experience is perhaps the best source of unbiased info...not cluttered with

58
required documentation or reference citings. The profession of fire applications is best
informed by professional people who actually implement projects. Not to be insulting,
but unless someone knows what it takes to implement on the ground projects, it's very
difficult to prescribe activities.” In similar fashion, another manager wrote “I prefer to
receive my information from people that have worked on a fireline, not people that have
gained all their experience with fire from the academic world. People that talk about fire,
but have never worked on a fire scare the hell out of me!”
Yet another respondent focused on the technical time and personnel components
that are critical to successful fire operations, stating “I prefer to get information from
other management colleagues because they have usually ground-truthed it, and most
importantly they know the time and personnel requirements”. Similarly, another
respondent said, “They (management colleagues) are in touch with what is happening on
the ground, and best understand real world management.” Finally, one manager
summarized their reasons for preferring to receive information from management
colleagues by writing simply three words, “Trust, experience, availability”, while another
summarized it by saying “Essentially, it is a trust factor.” These findings highlight the
critical role of trust in information exchange and make it clear that management
colleagues carry a great deal of credibility within the world of professional fire
management.

59
Formats for communicating fire-science information.
Communication consists of both the content to be communicated and the method
used to exchange information. Both components play an important role in the effective
exchange of information. Therefore, we asked managers to rate the usefulness of eleven
commonly used methods for communicating fire science information (Table 3.6). In
these ratings, one method, trips to field/demonstration sites stood apart from the others as
it was rated as very or extremely useful by a large majority of participants (81%). This
was followed by conferences/professional meetings (59%) and condensed research
summaries (53%) that were rated very/extremely useful by just over a majority of
participants. Approximately one-third of participants gave the next three methods similar
ratings – General Technical Reports (38%), internet websites maintained by research
organizations (33%), and newsletters from research organizations (31%).
Statement Not at all/ Slightly Moderately
Very/ Extremely
Chi-Square
How useful is each of the following methods to exchanging information…
Trips to field/demonstration sites 3% 16% 81% 0.793 Conferences/professional meetings 9 31 59 0.526 Condensed research summaries 13 33 53 0.726 General Technical Reports 25 37 38 0.623 Internet websites by research organizations 24 42 33 0.406 Newsletters from research organizations 26 43 31 0.963 Internet websites by professional societies 35 37 22 0.055 Email listserves 40 38 19 0.734 Newsletters from professional societies 47 35 17 0.256 Virtual meetings 37 48 11 0.661 Telephone conference 48 42 9 0.052 “No Opinion” responses are omitted for presentation purposes.
Table 3.6. Usefulness of methods to exchanging fire science information

60
Few participants found the final methods to be very useful. It is notable that these
methods included several technologically based methods.
Barriers to fire-science information exchange.
Regarding barriers to information exchange, respondents overwhelmingly agreed
that time was the greatest obstacle they faced in obtaining the best information to inform
their management decisions (Table 3.7). In aggregate, 68% of managers, including a
majority in each state (82% in MN, 63% in WI, 56% in MI) agreed that they did not have
MI
Average Chi-
square Statement MN WI Indicate your level of agreement regarding the following challenges to receiving the best fire science information available… Don't have time to look for information** 0.013 Agree 56% 82% 63% 68% Disagree 9% 18% 13% 14% Information is not easily accessible 0.795 Agree 47 36 44 42 Disagree 22 25 25 24 Information is not applicable to me 0.603 Agree 25 42 38 35 Disagree 31 27 31 30 Don't know where to look for information 0.447 Agree 38 27 31 32 Disagree 38 46 25 38 Concerns about information credibility 0.415 Agree 16 18 13 16 Disagree 53 30 31 40
** Responses are significantly different between locations at p ≤ .05. "Neither disagree nor agree" responses are omitted for presentation purposes.
Table 3.7. Barriers to information exchange, state by state comparison

61
enough time to look for information. Further, more than one in three agreed that
information was not easily accessible (42%) or not applicable to them (35%). On a
positive note, information credibility was not a major concern, with only 16% of
respondents agreeing that they have concerns about the credibility of the information that
is available.
Respondents were given the opportunity to elaborate on their responses via open-
ended comment boxes. When asked about barriers to obtaining current information, one
manager wrote, “Time is the big one (barrier), for all aspects of the job. There is a need
for quick access to bite size nuggets of applicable information with links to more
information of especially appropriate material”.
Although it may seem logical to assume that more information is always better,
the large amount of information available was often cited as something that makes it
difficult for managers to locate findings that are applicable to their specific management
context. For instance, one manager wrote, “There is sometime(s) too much information
out there.” Yet another stated, “The volume of available information is overwhelming,
having information broken down by geographic area is helpful.” A third manager
reported, “Given the diversity of forest conditions within the northern great lakes, the
applicability of information that is specific enough to the local situation is the biggest
challenge.”
Highlighting the importance of the method selected to communicate information,
one manager summarized the situation by stating, “Publications from academic
researchers are often not in a format easily accessible to resource practitioners. Peer-
reviewed journals are important, but other venues of sharing research results must be

62
emphasized. These could include workshops, field demonstrations, conferences oriented
towards land managers, and short research summaries shared via email or the Internet.”
Finally, we asked managers if they had the opportunity to help shape the
information that is generated through ongoing and future research. Results indicate that,
as a whole, managers do not feel involved in shaping research projects within the region.
A majority (54%) selected “no” or “unsure” (among possible response options of yes, no,
and unsure) when asked if they currently had the means to help shape the information
that is generated through research. However, respondents believed strongly that they
should be more involved in this process, with one manager stating “There needs to be
some way for managers to engage. There’s lots of good ideas that just never get heard by
the research community.” When asked to further elaborate on specific ways in which the
management community could be involved in shaping research, many ideas were
presented. One respondent said that managers should “Indicate what research is needed
for direct management application and not just research for the sake of looking at
something generally interesting. General research is useful for the overall knowledge
base, but front line managers need information in a manner that can be immediately
applied.” Similarly, another manager stated that “Too often I hear of research going on
that is interesting, but has no practical applications. The most meaningful and useful
research is that which is driven at the request of managers to solve real problems
experienced on the ground.”
Several participants highlighted the importance of developing an iterative,
proactive channel for ongoing communication between managers and researchers through
the entire cycle of the research process. In particular, managers were interested in being

63
involved in the initial stages by contributing to research questions rather than the
currently common practice of viewing them simply as consumers of information resulting
from research conducted with little or no engagement of managers. Respondents often
stated their on the ground experience afforded them a unique perspective as to the
important issues requiring further research, with one interviewee saying “Managers are
frequently the first to see issues and hear what the public and stakeholders are saying
(both positive and negative) in regards to fire and fuels management”. Another
respondent stated, “They (managers) should be active in the development of the research
questions being addressed on the front end in the development of research projects.
Rather than once the research is done attempting to form fit the research to our
questions.” Still another said, “They (managers) should be identifying most of the
priorities or at least highlighting the practical questions to help set research priorities.”
Finally, one respondent suggested a more systematic approach to facilitating
collaboration between the management and research communities. “At least in the Forest
Service regional office where I work, there should be an annual mechanism (regionally)
to identify prioritized research needs and funding sources. Currently it appears to me that
researchers go to whomever will give them money but the research is not necessarily
focused on regional priorities (because there don't seem to be any)”. Perhaps one of the
most important elements in cultivating a more productive relationship is communication,
summarized nicely by one interviewee when asked how managers could be involved in
the research process. “Be in communication with your researchers! We (managers)
cannot influence the research if we don't build these relationships”.

64
Finally, and perhaps most encouraging, 90% of managers surveyed indicated that
they would like to be involved in the development and operation of a comprehensive
decision support system within the northern lake states region. This is an encouraging
finding as it indicates that managers not only see the need for such a system, but also that
they are willing to be active in fulfilling the intent of the system to promote information
exchange and allow for the integration of emerging fire science information into
management decisions.
DISCUSSION
This study was designed to explore the decision-making context of fire managers
in the northern lake states. Findings provide important information regarding the ongoing
management activities within the region and preferences for the development of a
comprehensive decision-support network for fire management personnel. Several
important points are noteworthy.
First, it is evident that managers utilize methods at varying rates of frequency and
seek different objectives from their management programs across the region. Although it
may be convenient to think of the northern lake states region as a geographical unit upon
which common standards could be applied, results here suggest vastly different fire and
fuel management programs are in place. This should not be surprising given the large
number of varying forest ecosystem types and the number of managing agencies across
these three states. This variability lends further credence to the need for a decision-

65
support system that can develop localized information for specific needs, rather than
broad recommendations that are only moderately applicable to each unique situation.
Consistent with prior research in the region (Wilson et al. 2009), the majority of
managers in aggregate indicated a strong desire to use more prescribed fire and wildland
fire use to accomplish management objectives. This is an encouraging finding as it
suggests that managers recognize the role of fire in restoring healthy forest ecosystems.
However, several region-specific factors place limitations on managers’ ability to use fire
across the landscape. Results also provide further evidence of the importance of using fire
carefully, as it appears that Michigan managers are still trying to overcome past mishaps
(Mack Lake Fire) with prescribed fire. Lastly, although Wilson et al. (2009) found that
62% of managers believed reducing fuel loads was a primary concern throughout the
region, results here suggest that the reduction of forest fuels is rarely the primary
objective of forest managers across the region. Instead, it appears that fuel reduction is
often accomplished in conjunction with or as a secondary benefit of the restoration of
forest conditions.
Second, managers develop, implement, and refine management programs within
the framework of numerous, sometimes counteracting variables that influence their
decisions. Across all agencies and all locations, the lack of financial resources to
implement treatments was reported as having the greatest influence on management
decisions. Budget constraints have often been an important consideration in natural
resource management, although not necessarily one that applies only to management
agencies in the lake states. Creative solutions will need to become more commonplace if
treatment programs are to continue in the midst of shrinking resources. During the

66
interviews, several managers exhibited willingness to pool financial resources and
overcome increasing budget limitations. Given the relative lack of expansive public lands
with the region, such efforts will be important not only to overcome limited resources but
also to achieve many of the ecological objectives of managers.
One troubling finding from this research was the degree to which competing
agency interests were discussed as a limiting factor in forest restoration and fuel
management decisions. The multiple use objectives for which much of the land in the
northern lake states is managed demands that fire and fuel management programs take
into consideration many factors other than strictly forest restoration and/or fuel load
reduction. However, managers here expressed a good deal of frustration with their ability
to work together with their wildlife, recreation, and timber colleagues to effectively
manage lands to achieve larger, overarching goals.
The take away message regarding influencing variables is that fire and fuel
management in the northern lake states does not occur in a vacuum where managers
simply receive and apply the latest scientific information to accomplish their preferred
objectives. Indeed, many interview participants indicated that, for many of the reasons
discussed here, they rarely have the luxury of using their preferred method or using it as
often as they would like. Instead, decisions must take into account a multitude of factors
(both internal and external) and weigh the costs and benefits of varying options until an
approach is determined that is agreeable to all stakeholders involved. Managers expressed
frustration that this approach rarely yields their most preferred fire and fuel management
methods on the ground. However, with regard to stakeholder involvement, prior research
does suggest that treatment acceptance is influenced by the amount of citizen

67
involvement in developing the treatment plans (e.g., Winter et al. 2002, Blanchard and
Ryan 2007). These findings, combined with the multiple-use objectives throughout the
northern lake states, suggest that although this increases the management complexity,
incorporating multiple management disciplines is necessary to achieve the long-term
goals of managing agencies.
Finally, findings here provide a great deal of insight into the current processes of
information exchange and decision support within the region. First, it is apparent that
managers throughout the region rely heavily on management colleagues and agency
research scientists to acquire information on fire management and forest restoration
issues. These two groups were the most often used and the most preferred sources of
information. This appears to be due largely to the fact that managers believe these two
groups have greater “on the ground” experience and they therefore place a greater degree
of trust in these individuals and the information they provide.
One surprising finding from this research is the limited degree to which
professional societies and the scientific community are used to acquire fire science
information throughout the region. These two entities were the least often used and the
least preferred sources of information among all respondents and have limited influence
on management decisions among all the options provided. While this may be alarming to
these communities, it should be noted that the relatively young nature of many fire and
fuel management programs throughout the region suggests that the relationships between
managers and these two entities may not yet be fully developed. In addition, this finding
suggests there is a great deal of opportunity for additional involvement from professional
societies and the research community and provides further justification for the

68
establishment of a decision support system that brings together information producers
and information users to promote increased information exchange.
Also, it is apparent that the method of communication influences the effectiveness
of communication activities. Interactive methods, such as trips to field/demonstration
sites and conferences/professional meetings were appreciated by a majority of
participants. Consistent with responses regarding the limited time managers had to
research available information, condensed research summaries were also highly rated by
managers. These findings suggest that while some mass communication methods may be
necessary to build awareness of emerging information, managers are looking for methods
that provide a means to tailor emerging information to their specific decision-making
environments (National Research Council 2009). Similar findings have been identified
regarding agency communication methods with the public in fire affected communities
and are consistent with findings from adult learning (Toman et al. 2004).
Time and accessibility were rated as the greatest barriers to information exchange,
further justifying the need for the production of decision-relevant information that is
condensed and easily accessible. Interestingly, field trips and conferences are generally
time consuming activities. Thus, while such methods were highly rated, it is likely that
additional communication methods, with lower time requirements, will also play an
important role in a comprehensive decision-support program. It is also important to note
that despite the expressed challenges to receiving information, managers were not
concerned with the credibility of the research community in the region.

69
CONCLUSIONS
This study was designed to begin to examine the decision-making context of fire
managers in the northern lake states region (MI, WI, MN) to understand 1) methods
currently used to achieve forest restoration and/or fuel reduction objectives, 2) factors
that influence decisions regarding the adoption of these different methods, and 3)
availability of information exchange and decision support. It is clear that important
differences exist across the region, numerous factors influence management decisions,
and that managers use various approaches to accomplish their objectives.
To be successful, a region-specific decision support system will need to take these
differences into consideration. In addition, professional societies and academic research
scientists would do well to focus on building trust and credibility with managers while
considering the preferred methods and formats for communicating fire science
information reported in this study. It is clear that managers desire a greater degree of
involvement in the research process and believe that they have a lot to offer in terms of
informing the direction of future research. Given the important role of management
colleagues in exchanging information, a decision support system would benefit greatly
from the presence of a vocal manager to spearhead the operation and disseminate
emerging information to the field. Finally, the overwhelming support and recognition for
such a system by area managers reported in this study suggests that a decision support
system in the northern lake states would have the stakeholder support needed to succeed.

70
Chapter 4: Conclusion
Across the U.S., wildland fire is impacting a growing number of citizens. Human
populations within the Wildland Urban Interface (WUI), average fire size, and the annual
number of acres burned have all increased dramatically in recent years. As this paper was
being finalized in August, 2010, the Fourmile Canyon Fire became the most destructive
wildfire in Colorado state history, destroying 169 structures and resulting in the
evacuation of thousands of forest residents in the WUI foothills west of Boulder,
Colorado. The devastation provides a timely example of the high stakes that are present
in the increasingly complex interactions between people, fires, and forests. In response to
this growing threat, a series of federal initiatives have been implemented including the
National Fire Plan, Ten Year Comprehensive Strategy, and the Healthy Forests
Restoration Act. Two main themes run through these initiatives. First, they emphasize the
use of fuel treatments, such as prescribed fire and mechanized thinning, to reduce the risk
of fire. Second, these policies encourage, and in some cases require, local partnerships to
identify and accomplish fuel management objectives.
As managers strive to operate within the framework established by these
initiatives, multiple factors will influence their ability to achieve their desired objectives.
Two issues of particular importance to successful restoration of forest conditions and
reduction of fire risk include 1) improved understanding of the factors that influence

71
public acceptance of management practices (e.g. prescribed fire, thinning, mechanical
vegetation removal) used to treat forest fuels, and 2) development and communication of
relevant scientific information to support comprehensive fuel management programs that
are appropriate for the ecological, social, and political characteristics of a particular
region.
This study was designed to evaluate the public acceptance of fuel management
programs by examining public responses over time and across geographic locations while
also exploring the decision-making environment of fire managers in a subset of locations
as they build fire management programs. This project was centered around the following
research objectives:
1. To identify and analyze citizen support for fuel management practices
(particularly prescribed fire and mechanical vegetation removal) over time (2002-
2008) and across locations (AZ, CO, OR, UT, MI, MN, WI).
2. To examine the factors (e.g., awareness, trust, citizen-agency interactions) that
influence public acceptability of fuel management programs.
3. To explore the decision-making environment of fire managers and examine the
factors that influence their decisions (e.g., availability of information and tools,
institutional constraints, perceived attitudes of public stakeholders).
Findings reflect the perspectives of citizens who live adjacent to public
forestlands and the fire managers who strive to keep them safe–both critical stakeholders
in the context of wildland fire management. Results suggest that most citizens recognized
the need for fuel treatments and were willing to support some level of use on public lands
in both 2002 and 2008. Important differences emerged across locations regarding citizen

72
support for fuel management practices, highlighting the importance of tailoring programs
to address the specific characteristics that are present at the local level.
Regional location, trust in agency managers to effectively implement treatments,
and belief that treatments would result in various positive outcomes were all shown to
significantly predict acceptance levels of fuel treatment programs. Thus, we believe that
managers should focus first on building a strong foundation of trust with local citizens
that can support and promote future positive interactions. Forest agencies are advised to
engage public stakeholders in a manner that allows for the simultaneous building of trust
and communication of the positive outcomes that can result from proper treatment
utilization. Interactive communication approaches, such as trips to demonstration sites
and forest tours, may provide the appropriate venue for these types of interactions.
Finally, it is clear that numerous factors influence the decisions made by fire
managers in the northern lake states, with budget constraints, competing agency interests,
and interface constraints having the greatest degree of influence. Regional variation was
observed in terms of how often treatments were used and the objectives sought by
treatment implementation; however, managers across the region expressed a strong desire
to be involved in a network of professionals designed to promote the exchange of
emerging fire science information.
Overall, this project provides a great deal of insight into citizen perspectives on
fire and fuel management practices as well as the various factors that influence
management decisions and the manner in which information is exchanged within the fire
management community. Findings can be helpful to forest agencies as they continue to

73
strive to build public support for their fuel treatment programs and create programs that
take advantage of the best available scientific information.

74
References
Agee, J.K. 1997. Fire management for the 21st century. In Creating a forestry for the 21st century, eds. K. Kohm and J. Franklin, 191-201. Washington, DC: Island Press. Babbie, E. 1995. The practice of social research. 7ed. Belmont, CA: Wadsworth Publishing Company. Barrett, S.W., S.F. Arno & C.H. Key. 1991. Fire regimes of western larch-lodgepole pine forests in Glacier National Park, Montana. Canadian Journal of Forest Research 21: 1711-1720. Beschta, R.L., J.J. Rhodes, J.B. Kauffman, R.E. Gresswell, G.W. Minshall, J.R. Karr, D.A. Perry, F.R. Hauer & C.A. Frissell. 2004. Postfire Management on Forested Public Lands of the Western United States. Conservation Biology 18(4): 957-967. Blanchard, B. & R.L. Ryan. (2007) Managing the wildland-urban interface in the northeast: Perceptions of fire risk and hazard reduction strategies. Northern Journal of Applied Forestry 24: 203-208. Brown, J.K., S.F. Arno, S.W. Barrett & J.P. Menakis. 1994. Comparing the prescribed natural fire program with presettlement fires in the Selway-Bitterroot Wilderness. International Journal of Wildland Fire 4(3): 157-168. Brunson, M. & B. Shindler. 2004. Geographic variation in the social acceptability of wildland fuels management in the western U.S. Society and Natural Resources 17: 661-678.
Brunson, M. & J. Evans. 2005. Badly Burned? Effects of an Escaped Prescribed Burn on Social Acceptability of Wildland Fuels Treatments. Journal of Forestry 103: 134-138.
Calkin, D.E., K.M. Gerbert, J.G. Jones & R.P. Nelson. 2005. Forest Service large fire area burned and suppression expenditure trends, 1970-2002. Journal of Forestry 103(4): 179-183.
Cardille, J.A. & S.J. Ventura. 2001. Occurrence of wildfire in the northern Great Lakes Region: effects of land cover and land ownership assessed at multiple scales. International Journal of Wildland Fire 10: 145-154.

75
Carpenter, E.H., J.G. Taylor, H.J. Cortner, P.D. Gardner, M.J. Zwolinski & T.C. Daniel. 1986. Targeting audiences and content for forest fire information programs. Journal of Environmental Education 17(3): 33–42. Cohen, B.H. & R.B. Lea. 2004. Essentials of statistics for the social and behavioral sciences. New Jersey: John Wiley & Sons, Inc. 289 p. 13
Corace, R.G. III, P.C. Goebel & D.L. McCormick. 2010. Kirtland’s Warbler habitat management and multi-species bird conservation: considerations for planning and management across jack pine (Pinus banksiana Lamb.) habitat types. Natural Areas Journal 30: 174-190.
Dillman, D. 1978. Mail and Telephone Surveys: the Total Design Method. Wiley: New York.
Drobyshev, I., P.C. Goebel, D.M. Hix, R.G. Corace III & M.E. Semko-Duncan. 2008. Pre- and post-European settlement fire history of red pine dominated forest ecosystems of Seney National Wildlife Refuge, Upper Michigan. Canadian Journal of Forest Research 38: 2497-2514. Erwin, P. 2001. Attitudes and persuasion. Taylor and Francis: Philadelphia.
Fleeger, W.E. 2008. Collaborating for success: community wildfire protection planning in the Arizona White Mountains. Journal of Forestry 106: 78-82(5).
Ford, P. L. & G.R. McPherson. 1999. Ecology of fire in shortgrass communities of the Kiowa National Grassland. In: Warwick, C.,ed. Fifteenth North American prairie conference proceedings; 1996 October; St. Charles, IL. Bend, OR: The Natural Areas Association: 71-76.
Hammer, R.B., V.C. Radeloff, J.S. Fried & S.I. Stewart. 2007. Wildlife Urban Interface housing growth during the 1990s in California, Oregon, and Washington. International Journal of Wildland Fire 16: 255-265.
Jamieson, D. 1994. Problems and prospects for a forest service program in the human dimensions of global change. In Breaking the mold: Global change, social responsibility, and natural resource management, eds. K. Geyer and B. Shindler, 23-28. U.S. Department of Agriculture, Forest Service research report. Oregon State University: Corvallis, OR. Langston, N. 1995. Forest dreams, forest nightmares: The paradox of old growth in the inland West. Seattle: University of Washington Press. Lehman, D.E. 1989. Market Research and Analysis. Irwin Press: Boston, MA. Loomis, J.B., L.S. Bair & A. Gonzalez-Caban. 2001. Prescribed fire and public support: Knowledge gained, attitudes changed in Florida. Journal of Forestry 99(11): 18-22.

76
Manfredo, M.J., M. Fishbein, G.E. Haas & A.E. Watson. 1990. Attitudes toward prescribed fire policies: The public is widely divided in its support. Journal of Forestry 88: 19-23.
McCool, S.F. & G.H. Stankey. 1986. Visitor attitudes toward wilderness fire management policy—1971-84. Research Paper INT-357 Ogden, UT: USDA Forest Service, Intermountain Research Station.
McNie, E.C. 2007. Reconciling the supply of scientific information with user demands: An analysis of the problem and review of the literature. Environmental Science & Policy 10: 17-38.
Mitchell, R.B., W.C. Clark, D.W. Cash & N.M. Dickson. 2006. Global Environmental Assessments: Information, Institutions, and Influence. Cambridge, MA: The MIT Press.
Mutch, R.W., S.F. Arno, J.K. Brown, C.E. Carlson, R.D. Ottmar & J.L. Peterson. 1993. Forest health in the Blue Mountains: A management strategy for fire-adapted ecosystems. Gen. Tech. Rep. PNW-GTR-310. Portland, OR: USDA Forest Service, Pacific Northwest Research Station.
National Interagency Fire Center. 2010. Wildland fire statistics. Boise, ID: NIFC. Last accessed August 28, 2010. Available from www.nifc.gov/fire_info/fire_stats.htm.
National Research Council. 2009. Informing Decisions in a Changing Climate. Panel on Strategies and Methods for Climate-Related Decision Support, Committee on the Human Dimensions of Global Change. Division of Behavioral and Social Sciences and Education. Washington, DC: The National Academies Press.
Needham, M.D. & J.J. Vaske. 2008. Survey implementation, sampling, and weighting data. In ‘Survey Research and Analysis: Applications in Parks, Recreation, and Human Dimensions’. (Ed. JJ Vaske) (Venture Publishing: State College, PA). Parkinson, T.M., J.E. Force & J.K. Smith. 2003. Hands-on learning: Its effectiveness in teaching the public about wildland fire. Journal of Forestry 101(7): 21-26. Probst, J.R. & J. Weinrich. 1993. Relating Kirtland’s warbler population to changing landscape composition and structure. Landscape Ecology 8: 257-271.
Radeloff, V.C., R.B. Hammer, P.R. Voss, A.E. Hagen, D.R. Field & D.J. Mladenoff. 2001. Human demographic trends and landscape level forest management in the northwest Wisconsin Pine Barrens. Forest Science 47: 229-241.
Radeloff V.C., R. Hammer & S. Stewart. 2005. Rural and suburban sprawl in the U.S. Midwest from 1940 to 2000 and its relation to forest fragmentation. Conservation Biology 19(3): 793-805.
77
Reid, W.V., F. Berkes, T.J. Wilbanks & D. Capistrano. 2007. Bridging Scales and Knowledge Systems: Concepts and Applications in Ecosystem Assessment. Washington, DC: Island Press.
Rogers, E.M. 2003. Diffusion of innovations, 5th ed. Free Press: New York.
Sarewitz, D. & R.A. Pielke, Jr. 2007. The neglected heart of science policy: Reconciling supply of and demand for science. Environmental Science & Policy 10: 5-16. Schmidt, K.M., J.P. Menakis, C.C. Hardy, W.J. Hann & D.L. Bunnell. 2002. Development of Coarse-Scale Spatial Data for Wildland Fire and Fuel Management. USDA Forest Service General Technical Report RMRS-87, Rocky Mountain Research Station, Fort Collins, CO. Shindler, B., P. List & B. Steel. 1993. Managing Federal Forests: Public Attitudes in Oregon and Nationwide. Journal of Forestry 91(7): 36-42. Shindler, B. & M. Brunson. 2003. Fire conditions on public forests and rangelands: a nationwide survey of citizens. Research Report for Joint Fire Science Program. Corvallis, OR: Oregon State University. Shindler, B. & E. Toman. 2003. Fuel reduction strategies in forest communities: A longitudinal analysis. Journal of Forestry 101(6): 8-15. Shindler, B., E. Toman & S. McCaffrey. 2009. Public Perspectives of Fire, Fuels, and the Forest Service in the Great Lakes Region: A Survey of Citizen-Agency Communication and Trust. International Journal of Wildland Fire 18: 157-164. Stankey, G.H. 1976. Wilderness fire policy: An investigation of visitor knowledge and beliefs. Research Paper INT-180. Ogden, UT: USDA Forest Service, Intermountain Forest and Range Experiment Station.
Steel, B.S., P. List & B. Shindler. 1997. Managing federal forests: National and regional public orientations. In Public Lands Management in the West: Citizens, Interest Groups, and Values, edited by B. S. Steel. Westport, CT: Praeger. Stewart, S.I., Radeloff, V.C. & R.B. Hammer. 2006. The wildland-urban interface in the United States. In The Public and Wildland Fire Management: Social Science Findings for Managers; GTR-NRS-1 (ed S.M. McCaffrey), pp. 197-202. USDA Forest Service, Northern Research Station, Newtown Square, PA.
Toman, E., B. Shindler & M. Reed. 2004. Prescribed fire: The influence of site visits on citizen attitudes. Journal of Environmental Education 35(3): 13-18. Vaske, J.J. 2008. Survey research and analysis: Applications in parks, recreation, and human dimensions. Venture Publishing, Inc., State College, Pennsylvania.

78
Wilson, R.L., D.M. Hix, P.C. Goebel & R.G. Corace III. 2009. Identifying Land Manager Objectives and Alternatives for Mixed-Pine Forest Ecosystem Management and Restoration in Eastern Upper Michigan. Ecological Restoration 27(4): 407-416.
Winter, G.J., C. Vogt & J.S. Fried. 2002. Fuel treatments at the wildland-urban interface: Common concerns in diverse regions. Journal of Forestry 100(1): 15-21. Zand, D.E. 1997. The Leadership Triad: Knowledge, Trust, and Power. New York: Oxford University Press.

79
Appendix A: Frequency Report of Longitudinal Analysis Responses
Table values are percents unless otherwise noted. P-values reflect paired t-test scores (with “don’t know” or “no opinion” responses excluded) unless noted. 1. How far is it from your home to a natural area where a wildfire might burn (average miles)? 2002 2008 P-value
Total 3.4 3.5 0.822 AZ 3.6 3.7 0.966 CO 2.6 3.9 0.048 OR 1.2 2.5 0.029 UT 4.9 5.7 0.365 MI 4.2 4.7 0.685
MN 4.3 2.3 0.136 WI 2.4 2.4 0.955
Table A.1. Distance from home to area where wildfire might burn

80
2. How would you rate the likelihood that a wildfire could occur in the forests or rangelands near your home in the next five years?
Very likely
Somewhat likely
Somewhat unlikely
Very unlikely Don’t know
P-value
2002 2008 2002 2008 2002 2008 2002 2008 2002 2008
Total 31 25 36 38 19 22 9 11 4 5 0.008
AZ 40 35 37 45 17 10 5 10 2 0 0.666CO 41 47 38 33 10 13 9 3 2 4 0.404OR 56 50 35 37 4 6 4 6 0 1 0.435UT 54 37 27 49 9 9 6 4 4 1 0.242MI 21 10 35 40 26 31 13 13 5 6 0.202
MN 15 5 39 30 28 39 11 16 7 10 0.011WI 9 10 42 36 28 33 13 17 8 5 0.219
Table A.2. Likelihood of wildfire occurring near home in next five years

81
3. In my opinion, using prescribed fires on public forests and rangelands is:
A legitimate
tool that resource managers should be able to use whenever
they see fit.
Something that should
be done infrequently,
only in carefully selected areas.
A practice that should
not be considered because it creates too
many negative impacts.
An unnecessary
practice.
I know too little to make a judgment about this
topic.
P-value
(X2
test) 2002 2008 2002 2008 2002 2008 2002 2008 2002 2008
Total 45 44 45 41 3 5 2 2 5 9 <.001
AZ 50 61 47 25 0 7 2 0 2 7 <.001 CO 52 34 42 56 3 3 1 1 1 6 0.194 OR 55 60 37 30 7 7 1 0 0 3 <.001 UT 40 41 52 50 3 3 0 0 6 6 0.001 MI 35 31 38 42 9 6 1 1 17 19 0.004
MN 53 45 44 45 0 3 1 3 2 4 <.001 WI 34 38 53 35 1 7 5 4 7 15 <.001
Table A.3. Public opinion of prescribed fire

82
4. In my opinion, mechanical vegetation removal is:
A legitimate tool that resource managers should be able to use whenever
they see fit.
Something that should
be done infrequently,
only in carefully selected areas.
A practice that should
not be considered because it creates too
many negative impacts.
An unnecessary
practice.
I know too little to make a judgment about this
topic.
P-value
(X2
test) 2002 2008 2002 2008 2002 2008 2002 2008 2002 2008 Total 59 62 26 24 3 2 3 2 9 10 <.001
AZ 76 75 16 10 3 3 2 0 3 12 0.249 CO 63 70 24 20 3 4 3 0 7 6 0.169 OR 67 68 21 22 6 1 1 1 4 7 0.002 UT 56 57 34 31 0 2 0 2 10 9 <.001 MI 47 50 31 32 4 3 4 4 15 12 0.012
MN 60 67 28 21 1 1 3 3 8 8 0.071 WI 50 52 26 27 4 2 5 1 15 17 0.001
Table A.4. Public opinion of mechanical vegetation removal

83
5. In my opinion, thinning is:
A legitimate tool that resource managers should be able to use whenever
they see fit.
Something that should
be done infrequently,
only in carefully selected areas.
A practice that should
not be considered because it creates too
many negative impacts.
An unnecessary
practice.
I know too little to make a judgment about this
topic.
P-value
(X2
test) 2002 2008 2002 2008 2002 2008 2002 2008 2002 2008 Total 67 68 23 23 1 1 3 1 1 7 <.001
AZ - 75 - 17 - 3 - 0 - 5 - CO - 76 - 20 - 0 - 0 - 4 - OR 78 80 18 16 5 0 1 1 1 3 0.032 UT - 62 - 26 - 1 - 0 - 10 - MI 59 55 25 27 3 5 5 3 11 10 0.003
MN 74 71 19 24 1 0 3 1 3 4 0.171 WI 57 60 29 26 3 0 1 3 10 11 0.003
Table A.5. Public opinion of thinning

84
6. The use of prescribed fire may create concerns for some people. Please indicate how concerned you are about the following possible effects in your area. a. Damage to private property. Great
concern Moderate concern
Slight concern
Not a concern
P-value
2002 2008 2002 2008 2002 2008 2002 2008 Total 20 10 27 22 40 44 13 24 <.001
AZ 7 7 30 12 47 50 17 31 0.033 CO 20 14 38 41 35 34 7 11 0.344 OR 23 6 21 20 41 46 16 29 <.001 UT 21 8 28 25 38 52 13 15 0.038 MI 30 21 24 14 31 44 16 22 0.03
MN 16 6 27 22 42 48 14 24 0.001 WI 19 11 25 19 47 39 10 31 <.001
Table A.6. Concern regarding damage to private property b. Decreased recreation opportunities.
Great concern
Moderate concern
Slight concern
Not a concern
P-value
2002 2008 2002 2008 2002 2008 2002 2008 Total 11 5 24 14 33 32 33 49 <.001
AZ 9 5 14 13 33 32 44 50 0.458 CO 7 4 20 19 35 33 38 44 0.381 OR 9 6 24 14 36 30 31 50 0.001 UT 13 5 28 21 32 43 27 31 0.046 MI 19 13 31 28 26 29 24 30 0.171
MN 8 2 20 16 32 34 39 48 0.016 WI 10 3 26 23 36 24 29 49 0.01
Table A.7. Concern regarding decreased recreation opportunities

85
c. Loss of wildlife habitat.
Great
concern Moderate concern
Slight concern
Not a concern
P-value
2002 2008 2002 2008 2002 2008 2002 2008 Total 19 12 24 27 28 28 28 32 0.024
AZ 14 12 17 27 33 30 33 32 0.409 CO 13 9 24 35 33 31 27 25 0.645 OR 19 11 23 16 26 27 31 46 0.001 UT 22 9 25 30 28 36 18 25 0.175 MI 27 19 26 26 25 33 22 22 0.246
MN 15 14 24 26 27 21 33 38 0.671 WI 20 13 26 25 25 34 29 28 0.163
Table A.8. Concern regarding loss of wildlife habitat d. Risk of fire going out of control. Great
concern Moderate concern
Slight concern
Not a concern
P-value
2002 2008 2002 2008 2002 2008 2002 2008 Total 31 27 24 33 33 32 13 9 0.266
AZ 14 31 17 32 45 32 24 5 <.001 CO 20 41 21 35 46 18 13 6 <.001 OR 22 21 13 31 36 40 29 7 0.006 UT 24 28 21 37 41 28 16 7 0.047 MI 54 29 17 24 21 35 7 11 <.001
MN 35 18 31 36 27 33 6 12 0.001 WI 35 25 38 33 22 33 5 10 0.006
Table A.9. Concern regarding fire going out of control

86
e. Economic loss of useable timber. Great
concern Moderate concern
Slight concern
Not a concern
P-value
2002 2008 2002 2008 2002 2008 2002 2008 Total 13 12 22 26 27 31 37 30 0.027
AZ 7 12 12 17 29 28 52 43 0.188 CO 3 4 19 25 19 27 60 44 0.038 OR 16 15 27 21 24 31 34 34 0.596 UT 9 12 24 29 27 35 40 26 0.099 MI 18 19 26 28 22 32 35 22 0.228
MN 21 11 25 35 30 32 25 22 0.593 WI 13 14 22 26 38 33 28 27 0.392
Table A.10. Concern regarding the economic loss of useable timber f. Reduced scenic quality. Great
concern Moderate concern
Slight concern
Not a concern
P-value
2002 2008 2002 2008 2002 2008 2002 2008 Total 14 12 26 23 36 39 24 26 0.168
AZ 9 14 21 22 43 39 28 25 0.273 CO 10 10 23 25 43 42 24 23 0.909 OR 13 12 27 15 29 37 31 37 0.1 UT 18 12 25 33 38 39 19 16 0.911 MI 22 20 32 25 30 34 17 22 0.266
MN 8 7 26 22 38 42 27 28 0.45 WI 16 13 28 22 33 37 23 28 0.21
Table A.11. Concern regarding reduced scenic quality
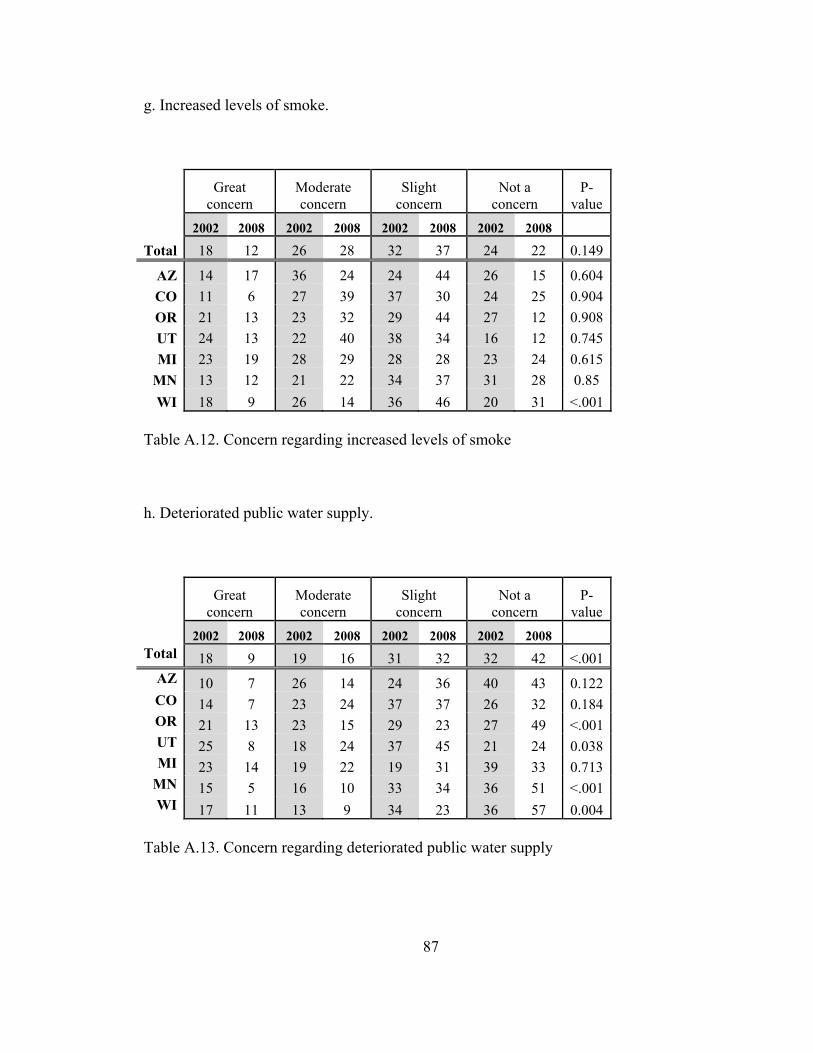
87
g. Increased levels of smoke.
Great
concern Moderate concern
Slight concern
Not a concern
P-value
2002 2008 2002 2008 2002 2008 2002 2008 Total 18 12 26 28 32 37 24 22 0.149
AZ 14 17 36 24 24 44 26 15 0.604 CO 11 6 27 39 37 30 24 25 0.904 OR 21 13 23 32 29 44 27 12 0.908 UT 24 13 22 40 38 34 16 12 0.745 MI 23 19 28 29 28 28 23 24 0.615
MN 13 12 21 22 34 37 31 28 0.85 WI 18 9 26 14 36 46 20 31 <.001
Table A.12. Concern regarding increased levels of smoke h. Deteriorated public water supply. Great
concern Moderate concern
Slight concern
Not a concern
P-value
2002 2008 2002 2008 2002 2008 2002 2008 Total 18 9 19 16 31 32 32 42 <.001
AZ 10 7 26 14 24 36 40 43 0.122 CO 14 7 23 24 37 37 26 32 0.184 OR 21 13 23 15 29 23 27 49 <.001 UT 25 8 18 24 37 45 21 24 0.038 MI 23 14 19 22 19 31 39 33 0.713
MN 15 5 16 10 33 34 36 51 <.001 WI 17 11 13 9 34 23 36 57 0.004
Table A.13. Concern regarding deteriorated public water supply

88
i. Increased soil erosion. Great
concern Moderate concern
Slight concern
Not a concern
P-value
2002 2008 2002 2008 2002 2008 2002 2008 Total 22 13 27 26 34 37 18 24 <.001
AZ 12 17 29 24 40 34 19 25 0.905 CO 17 11 34 35 41 41 7 13 0.212 OR 23 13 24 19 37 39 17 29 0.006 UT 31 13 29 39 24 40 16 8 0.301 MI 26 14 30 29 30 29 14 28 0.006
MN 17 9 19 24 37 37 26 29 0.136 WI 23 15 27 16 30 37 20 32 0.001
Table A.14. Concern regarding increased soil erosion 7. How much confidence do you have in the forest agency in your area to use the following practices as part of a responsible and effective fuels management program? a. Confidence in forest agency to use prescribed fire.
Full Moderate Limited None No Opinion P-
value 2002 2008 2002 2008 2002 2008 2002 2008 2002 2008
Total 18 22 43 43 27 21 7 7 6 7 0.126 AZ 25 34 52 41 18 20 5 5 0 0 0.695 CO 13 10 49 51 32 23 4 10 1 6 0.504 OR 13 29 59 36 19 23 6 10 3 1 0.678 UT 13 25 43 51 37 13 3 4 3 6 0.008 MI 14 15 36 37 20 23 13 5 18 19 0.314
MN 23 21 43 49 24 22 3 5 6 2 0.833 WI 22 21 27 35 33 22 12 11 6 10 0.595
Table A.15. Confidence in forest agency to use prescribed fire

89
b. Confidence in forest agency to use mechanical vegetation removal.
Full Moderate Limited None No Opinion
P-value
2002 2008 2002 2008 2002 2008 2002 2008 2002 2008 Total 25 26 41 38 21 20 5 8 8 8 0.317
AZ 35 33 40 38 15 21 10 3 0 5 0.828 CO 21 25 44 38 27 16 1 16 7 6 0.458 OR 28 35 46 36 21 21 3 8 3 0 0.557 UT 18 31 49 40 25 19 0 3 8 7 0.419 MI 23 21 33 37 18 19 6 10 21 14 0.597
MN 27 25 47 41 16 21 3 7 7 7 0.219 WI 23 20 32 35 26 24 10 9 8 12 0.827
Table A.16. Confidence in forest agency to use mechanical vegetation removal c. Confidence in forest agency to use thinning
Full Moderate Limited None No Opinion
P-value
2002 2008 2002 2008 2002 2008 2002 2008 2002 2008 Total 31 29 39 36 16 20 6 7 9 7 0.075
AZ - 32 - 41 - 19 - 3 - 5 - CO - 24 - 39 - 20 - 13 - 4 - OR 35 44 46 27 12 23 6 6 6 0 0.758 UT - 33 - 36 - 16 - 4 - 10 - MI 31 24 35 38 15 19 5 6 15 14 0.194
MN 33 27 47 37 11 24 3 6 6 5 0.032 WI 27 25 31 36 24 20 8 8 6 11 0.645
Table A.17. Confidence in forest agency to use thinning
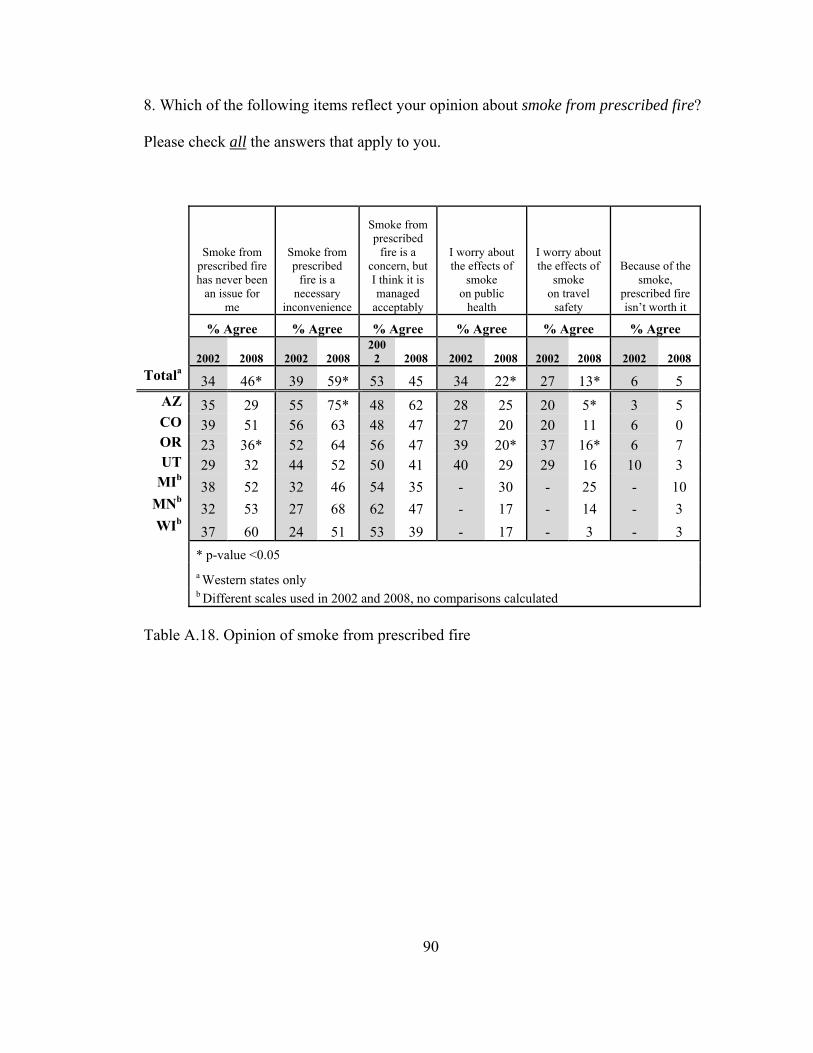
90
8. Which of the following items reflect your opinion about smoke from prescribed fire? Please check all the answers that apply to you.
Smoke from prescribed fire has never been
an issue for me
Smoke from prescribed
fire is a necessary
inconvenience
Smoke from prescribed
fire is a concern, but I think it is managed
acceptably
I worry about the effects of
smoke on public
health
I worry about the effects of
smoke on travel
safety
Because of the smoke,
prescribed fire isn’t worth it
% Agree % Agree % Agree % Agree % Agree % Agree
2002 2008 2002 2008 2002 2008 2002 2008 2002 2008 2002 2008
Totala 34 46* 39 59* 53 45 34 22* 27 13* 6 5 AZ 35 29 55 75* 48 62 28 25 20 5* 3 5 CO 39 51 56 63 48 47 27 20 20 11 6 0 OR 23 36* 52 64 56 47 39 20* 37 16* 6 7 UT 29 32 44 52 50 41 40 29 29 16 10 3
MIb 38 52 32 46 54 35 - 30 - 25 - 10 MNb 32 53 27 68 62 47 - 17 - 14 - 3 WIb 37 60 24 51 53 39 - 17 - 3 - 3
* p-value <0.05 a Western states only b Different scales used in 2002 and 2008, no comparisons calculated
Table A.18. Opinion of smoke from prescribed fire

91
9. Agency managers use various programs to provide information about management activities. How helpful and trustworthy have the following sources of information been to you? Check the “no experience” box if you’ve had no experience with an information source. Note: Only participants with experience responded to the helpful and trustworthy questions. a. Informational brochures.
No experience
How helpful is the Trustworthy? information to you?
Not Slightly Very Yes No 2002 2008 2002 2008 2002 2008 2002 2008 2002 2008 2002 2008 Total 36 45 7 9 46 50 48 41 89 92 11 8
AZ 24 51 5 14 38 36 58 50 95 91 5 10 CO 34 38 10 5 27 56 63 39 95 97 5 3 OR 19 39 6 5 40 40 54 55 94 97 6 3 UT 42 52 3 7 58 63 39 30 100 96 0 4 MI 50 53 8 13 47 56 44 31 86 80 14 20
MN 31 43 8 10 47 52 45 39 80 91 20 9 WI 44 41 6 8 61 49 33 43 75 91 25 9
Table A.19. Ratings of informational brochures

92
b. TV public service messages.
No experience
How helpful is the Trustworthy? information to you?
Not Slightly Very Yes No 2002 2008 2002 2008 2002 2008 2002 2008 2002 2008 2002 2008 Total 12 31 8 12 49 52 43 36 76 90 24 10
AZ 13 32 4 5 41 42 54 53 91 97 9 3 CO 27 53 15 19 49 53 36 28 81 80 19 20 OR 16 29 6 7 39 49 55 44 89 95 11 5 UT 11 23 5 6 52 60 43 34 89 90 11 11 MI 13 28 15 13 44 53 41 33 64 88 36 12
MN 3 23 8 18 51 46 41 37 71 87 29 13 WI 7 31 5 11 59 63 36 26 61 92 39 8
Table A.20. Ratings of television public service messsages c. Visitor centers and interpretive signs No
experience How helpful is the
Trustworthy? information to you? Not Slightly Very Yes No 2002 2008 2002 2008 2002 2008 2002 2008 2002 2008 2002 2008 Total 24 34 6 7 40 40 53 53 92 93 8 7
AZ 7 45 4 7 27 48 69 45 96 92 4 8 CO 11 40 9 3 35 51 56 46 93 94 7 6 OR 14 29 4 7 23 45 74 48 96 93 4 8 UT 17 29 6 9 32 37 63 54 92 92 4 8 MI 36 32 13 9 51 41 36 50 86 90 14 10
MN 32 33 6 8 45 30 48 62 94 93 6 8 WI 35 31 4 7 68 37 28 56 87 96 13 4
Table A.21. Ratings of visitor centers and interpretive signs

93
d. Internet web pages.
No experience
How helpful is the Trustworthy? information to you?
Not Slightly Very Yes No 2002 2008 2002 2008 2002 2008 2002 2008 2002 2008 2002 2008 Total 64 72 27 25 41 38 31 37 63 86 37 14
AZ 77 69 17 22 33 22 50 56 67 93 33 7 CO 66 69 13 29 39 33 48 38 86 100 14 0 OR 73 69 13 30 53 45 33 25 71 88 29 12 UT 67 70 48 21 38 37 14 42 61 83 39 17 MI 62 76 35 38 38 38 27 25 42 82 58 18
MN 54 74 29 8 41 50 29 42 59 81 41 19 WI 56 73 27 32 43 36 30 32 64 79 36 21
Table A.22. Ratings of internet web pages e. Guided field trips to forest sites
No experience
How helpful is the Trustworthy? information to you?
Not Slightly Very Yes No 2002 2008 2002 2008 2002 2008 2002 2008 2002 2008 2002 2008 Total 54 71 9 34 30 32 61 34 93 83 7 17
AZ 64 79 16 50 16 17 68 33 88 78 12 22 CO 53 82 7 25 30 42 63 33 93 100 7 0 OR 58 68 4 35 22 30 74 35 96 93 4 7 UT 55 70 11 21 32 32 57 47 100 75 0 25 MI 57 67 16 46 28 32 56 23 90 76 10 24
MN 45 68 8 25 31 46 62 29 92 83 8 17 WI 54 68 5 38 43 21 53 42 92 83 8 17
Table A.23. Ratings of guided field trips to forest sites

94
f. Government public meetings.
No experience
How helpful is the Trustworthy? information to you?
Not Slightly Very Yes No 2002 2008 2002 2008 2002 2008 2002 2008 2002 2008 2002 2008 Total 50 61 20 27 45 47 36 26 64 77 36 24
AZ 54 64 17 29 33 24 50 48 76 88 24 13 CO 62 62 21 24 42 60 38 16 57 88 44 13 OR 70 60 12 42 65 33 24 25 67 85 33 15 UT 57 68 37 20 48 70 15 10 40 71 60 29 MI 49 68 40 33 29 42 32 25 62 75 38 25
MN 38 62 9 28 48 47 43 25 76 63 24 37 WI 33 51 13 18 50 53 37 30 63 77 37 24
Table A.24. Ratings of government public meetings g. Conversations with agency staff.
No experience
How helpful is the Trustworthy? information to you?
Not Slightly Very Yes No 2002 2008 2002 2008 2002 2008 2002 2008 2002 2008 2002 2008 Total 46 55 11 13 32 41 57 46 79 88 21 12
AZ 49 58 22 16 26 48 52 36 67 84 33 16 CO 44 54 8 7 31 45 61 48 88 96 12 4 OR 42 59 12 12 27 35 62 54 76 90 24 10 UT 52 56 7 11 58 30 36 59 74 96 26 4 MI 56 59 18 21 33 52 49 28 75 88 25 13
MN 36 52 5 14 25 41 69 46 88 82 12 18 WI 44 50 10 10 33 38 57 52 76 86 24 14
Table A.25. Ratings of conversations with agency staff

95
h. Newsletters.
No experience
How helpful is the Trustworthy? information to you?
Not Slightly Very Yes No 2002 2008 2002 2008 2002 2008 2002 2008 2002 2008 2002 2008 Total 48 58 10 18 53 53 37 30 80 85 20 15
AZ 55 59 4 13 44 52 52 35 91 89 9 11 CO 45 59 11 4 51 63 38 33 94 95 6 5 OR 57 44 4 14 44 49 52 37 83 97 17 3 UT 49 57 6 15 55 62 39 23 90 68 10 32 MI 46 61 15 31 61 46 24 23 76 79 24 21
MN 40 63 13 18 52 65 36 18 73 79 27 21 WI 48 57 12 27 60 35 29 38 67 85 33 15
Table A.26. Ratings of newsletters i. Educational workshops.
No experience
How helpful is the Trustworthy? information to you?
Not Slightly Very Yes No 2002 2008 2002 2008 2002 2008 2002 2008 2002 2008 2002 2008 Total 72 29 31 40 - 86 - 14
AZ - 69 - 28 - 28 - 44 - 93 - 7 CO - 80 - 17 - 33 - 50 - 100 - 0 OR 61 71 5 39 27 22 68 39 92 85 8 15 UT - 77 - 14 - 29 - 57 - 91 - 9 MI - 76 - 59 - 24 - 18 - 70 - 30
MN - 70 - 26 - 37 - 37 - 86 - 14 WI - 63 - 20 - 37 - 43 - 82 - 18
Table A.27. Ratings of educational workshops
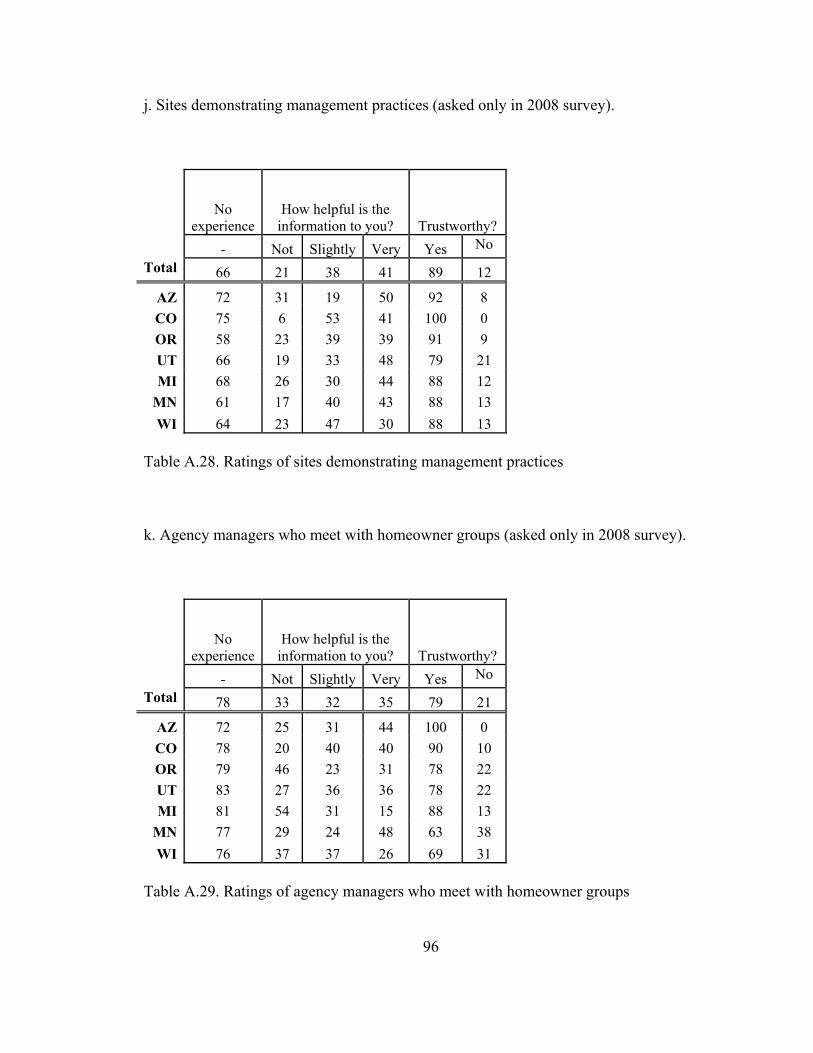
96
j. Sites demonstrating management practices (asked only in 2008 survey).
No
experience How helpful is the
information to you? Trustworthy? - Not Slightly Very Yes No
Total 66 21 38 41 89 12
AZ 72 31 19 50 92 8 CO 75 6 53 41 100 0 OR 58 23 39 39 91 9 UT 66 19 33 48 79 21 MI 68 26 30 44 88 12
MN 61 17 40 43 88 13 WI 64 23 47 30 88 13
Table A.28. Ratings of sites demonstrating management practices
k. Agency managers who meet with homeowner groups (asked only in 2008 survey).
No
experience How helpful is the
information to you? Trustworthy? - Not Slightly Very Yes No
Total 78 33 32 35 79 21
AZ 72 25 31 44 100 0 CO 78 20 40 40 90 10 OR 79 46 23 31 78 22 UT 83 27 36 36 78 22 MI 81 54 31 15 88 13
MN 77 29 24 48 63 38 WI 76 37 37 26 69 31
Table A.29. Ratings of agency managers who meet with homeowner groups

97
10. In your opinion, how well has the forest agency in your area incorporated public concerns into its management strategies?
Excellent, public
concerns are always
considered
Good, public
concerns are usually
considered
Fair, public concerns are sometimes considered
Poor, public concerns are
rarely considered
I have no basis for an opinion on this topic
P-value (X2 test)
2002 2008 2002 2008 2002 2008 2002 2008 2002 2008 Total 5 8 32 39 38 25 14 8 12 20 <.001
AZ 7 19 37 45 40 21 16 5 - 10 - CO 6 4 42 46 48 22 5 7 - 20 - OR 6 11 26 35 31 27 20 3 17 24 <.001 UT 2 5 31 38 54 28 14 9 - 20 - MI 4 3 22 39 26 24 17 12 31 22 0.511
MN 5 12 32 34 35 23 8 10 19 21 0.381 WI 6 6 33 37 34 29 17 7 9 22 0.096
Table A.30. Ratings of agency incorporation of public concerns

98
11. Public land management often involves difficult trade-offs between natural environmental conditions (wildlife, old growth forests) and economic considerations (employment, tax revenues). Please locate yourself on the following scale concerning these issues. 1 = highest priority should be given to maintaining natural environmental conditions even if there are negative economic consequences, 7 = highest priority should be given to economic considerations even if there are negative environmental consequences, 4 = both environmental and economic factors should be given equal priority.
1 2 3 4 5 6 7 Mean Score
P-value
02 08 02 08 02 08 02 08 02 08 02 08 02 08 02 08
Total 11 7 12 8 15 10 47 53 10 12 4 8 1 1 3.5 3.7 0.001 AZ 10 7 5 5 13 9 58 56 8 9 3 11 2 4 3.7 4 0.069 CO 25 18 28 19 13 18 25 34 7 4 1 7 1 0 2.7 3.1 0.01 OR 6 4 10 13 14 4 52 52 16 17 3 8 0 1 3.7 4 0.03 UT 3 6 6 5 19 11 56 63 8 6 7 8 0 0 3.8 3.8 0.925 MI - 8 - 8 - 6 - 53 - 13 - 11 - 1 - 3.9 -
MN - 2 - 3 - 11 - 63 - 13 - 5 - 2 - 4.1 - WI - 8 - 6 - 14 - 49 - 16 - 5 - 1 - 3.8 -
Table A.31. Environmental/Economic orientation

99
12. How would you rate the overall condition of public forests in your area?
Very healthy Somewhat
healthy Somewhat unhealthy
Very unhealthy Don’t know
2002 2008 2002 2008 2002 2008 2002 2008 2002 2008 Total 3 15 14 47 49 24 29 5 5 9
AZ - 9 - 47 - 33 - 7 - 4 CO - 0 - 24 - 59 - 10 - 7 OR - 59 - 44 - 35 - 7 - 7 UT - 15 - 49 - 21 - 0 - 16 MI 4 20 11 53 50 7 25 6 8 14
MN 3 24 18 52 50 12 24 4 6 8 WI 2 25 12 54 48 13 37 1 2 7
Table A.32. Overall condition of public forests, comparative data

100
Section 2: The following questions were asked only in the 2008 survey 1. How would you rate the overall condition of public forests in your area?
Very healthy
Somewhat healthy
Somewhat unhealthy
Very unhealthy
Don’t know
Total 15 47 24 5 9
AZ 9 47 33 7 4 CO 0 24 59 10 7 OR 59 44 35 7 7 UT 15 49 21 0 16 MI 20 53 7 6 14
MN 24 52 12 4 8 WI 25 54 13 1 7
Table A.33. Overall condition of public forests, 2008 data 2. Have there been any wildfires in your area in the last six years? Yes No Total 56 44
AZ 76 24 CO 66 34 OR 78 22 UT 93 7 MI 40 60
MN 38 62 WI 28 72
Table A.34. Recent wildfire occurrence

101
If yes, please answer the following…. a. About how far away from your home was the wildfire?
less than 1-5
miles
more than 5 miles 1 mile
Total 4 48 48
AZ 0 53 47 CO 0 50 50 OR 8 51 42 UT 2 47 52 MI 9 41 50
MN 5 49 46 WI 12 35 54
Table A.35. Proximity of homes to recent wildfires b. Did you experience discomfort from smoke? Yes No Total 45 55
AZ 73 27 CO 43 57 OR 66 34 UT 58 42 MI 16 84
MN 24 76 WI 0 100
Table A.36. Experience with smoke from recent wildfires

102
c. Were you evacuated? Yes No Total 4 96
AZ 9 91 CO 4 96 OR 7 93 UT 0 100 MI 0 100
MN 5 95 WI 0 100
Table A.37. Evacuations from recent wildfires d. Did you suffer damage to your personal property? Yes No Total 0 100
AZ 0 100 CO 0 100 OR 2 98 UT 0 100 MI 0 100
MN 0 100 WI 0 100
Table A.38. Damage to personal property from recent wildfires

103
3. How likely do you think it is that prescribed burning will generate the following outcomes?
a. Reduce scenic quality.
Extremely likely
Very Somewhat likely
Slightly likely
Not at all likely
Don’t know likely
Total 9 16 27 30 13 5
AZ 10 10 24 37 17 2 CO 10 16 36 26 9 3 OR 9 12 27 30 22 0 UT 6 21 27 30 9 6 MI 13 14 28 21 14 10
MN 6 22 22 39 9 1 WI 9 16 26 26 13 10
Table A.39. Beliefs that prescribed fire will reduce scenic quality
b. Create more smoke in the short-term, but less smoke over time.
Extremely likely
Very Somewhat likely
Slightly likely
Not at all likely
Don’t know likely
Total 15 33 24 11 7 10
AZ 15 45 15 12 8 5 CO 20 30 29 6 6 9 OR 22 41 15 13 3 6 UT 9 29 37 8 5 12 MI 10 16 26 21 12 16
MN 16 42 21 11 4 6 WI 15 29 24 9 9 15
Table A.40. Beliefs that prescribed fire will create more smoke in the short-term, but less smoke over time

104
c. Save money by reducing the cost of fighting a wildfire.
Extremely likely
Very Somewhat likely
Slightly likely
Not at all likely
Don’t know likely
Total 24 34 20 9 7 6
AZ 33 37 12 10 7 2 CO 25 39 25 4 4 3 OR 42 33 12 1 7 4 UT 18 43 25 6 1 6 MI 10 28 21 13 13 15
MN 32 35 20 8 4 1 WI 14 29 23 14 9 10
Table A.41. Beliefs that prescribed fire will save money by reducing the cost of fighting a wildfire d. Restore forests to a more natural condition.
Extremely likely
Very Somewhat likely
Slightly likely
Not at all likely
Don’t know likely
Total 23 36 18 8 9 6
AZ 25 42 17 5 7 5 CO 22 50 12 4 6 6 OR 36 35 17 3 9 0 UT 16 36 21 12 7 7 MI 14 28 14 15 17 12
MN 29 36 23 5 4 2 WI 16 29 20 11 15 9
Table A.42. Beliefs that prescribed fire will restore forests to a more natural condition

105
e. Improve conditions for wildlife.
Extremely likely
Very Somewhat likely
Slightly likely
Not at all likely
Don’t know likely
Total 23 32 20 9 9 8
AZ 25 30 17 8 7 13 CO 20 32 25 10 7 6 OR 31 32 19 4 7 6 UT 17 38 21 11 5 9 MI 17 27 19 10 17 10
MN 32 36 17 5 6 4 WI 16 27 24 12 12 8
Table A.43. Beliefs that prescribed fire will improve conditions for wildlife
f. Effectively reduce fire risk.
Extremely likely
Very Somewhat likely
Slightly likely
Not at all likely
Don’t know likely
Total 27 34 21 7 6 5
AZ 38 35 12 5 8 2 CO 26 39 20 6 4 4 OR 43 30 20 0 3 3 UT 18 38 25 11 3 5 MI 18 27 22 12 12 10
MN 35 37 19 4 3 1 WI 15 32 26 13 5 8
Table A.44. Beliefs that prescribed fire will effectively reduce fire risk
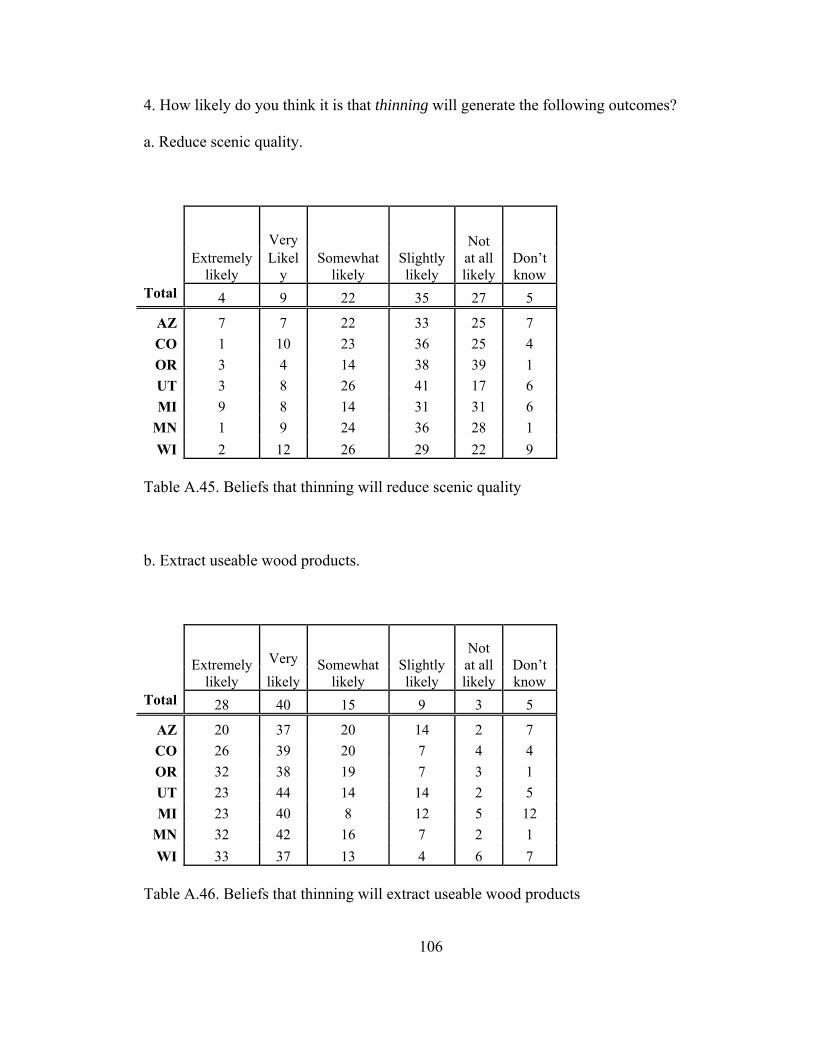
106
4. How likely do you think it is that thinning will generate the following outcomes? a. Reduce scenic quality.
Extremely likely
Very Somewhat
likely Slightly likely
Not at all likely
Don’t know
Likely
Total 4 9 22 35 27 5
AZ 7 7 22 33 25 7 CO 1 10 23 36 25 4 OR 3 4 14 38 39 1 UT 3 8 26 41 17 6 MI 9 8 14 31 31 6
MN 1 9 24 36 28 1 WI 2 12 26 29 22 9
Table A.45. Beliefs that thinning will reduce scenic quality b. Extract useable wood products.
Extremely likely
Very Somewhat likely
Slightly likely
Not at all likely
Don’t know likely
Total 28 40 15 9 3 5
AZ 20 37 20 14 2 7 CO 26 39 20 7 4 4 OR 32 38 19 7 3 1 UT 23 44 14 14 2 5 MI 23 40 8 12 5 12
MN 32 42 16 7 2 1 WI 33 37 13 4 6 7
Table A.46. Beliefs that thinning will extract useable wood products

107
c. Save money by reducing the cost of fighting a wildfire.
Extremely likely
Very Somewhat likely
Slightly likely
Not at all likely
Don’t know likely
Total 27 33 21 8 5 6
AZ 42 30 10 8 3 7 CO 21 44 24 6 3 1 OR 38 43 9 3 1 6 UT 28 30 27 4 4 6 MI 16 29 17 16 13 10
MN 33 32 26 6 2 1 WI 14 29 27 10 10 10
Table A.47. Beliefs that thinning will save money by reducing the cost of fighting a wildfire d. Restore forests to a more natural condition.
Extremely likely
Very Somewhat likely
Slightly likely
Not at all likely
Don’t know likely
Total 21 30 24 10 8 7
AZ 31 32 19 7 3 8 CO 21 43 20 7 3 6 OR 35 35 19 6 1 4 UT 12 33 22 13 9 10 MI 13 17 30 16 17 8
MN 26 28 25 10 8 2 WI 10 28 29 8 14 11
Table A.48. Beliefs that thinning will restore forests to a more natural condition

108
e. Improve conditions for wildlife.
Extremely likely
Very Somewhat likely
Slightly likely
Not at all likely
Don’t know likely
Total 21 30 24 10 7 8
AZ 27 27 20 7 3 17 CO 17 37 26 9 6 6 OR 28 38 18 3 7 6 UT 15 27 38 12 2 6 MI 15 17 26 12 21 10
MN 30 33 18 11 3 4 WI 13 33 24 15 8 8
Table A.49. Beliefs that thinning will improve conditions for wildlife f. Effectively reduce fire risk.
Extremely likely
Very Somewhat likely
Slightly likely
Not at all likely
Don’t know likely
Total 27 33 21 8 6 6
AZ 43 28 18 0 3 7 CO 25 41 23 3 6 3 OR 35 45 13 3 1 3 UT 24 30 28 9 3 6 MI 17 26 19 17 12 9
MN 34 33 20 8 3 2 WI 16 27 23 13 10 10
Table A.50. Beliefs that thinning will effectively reduce fire risk
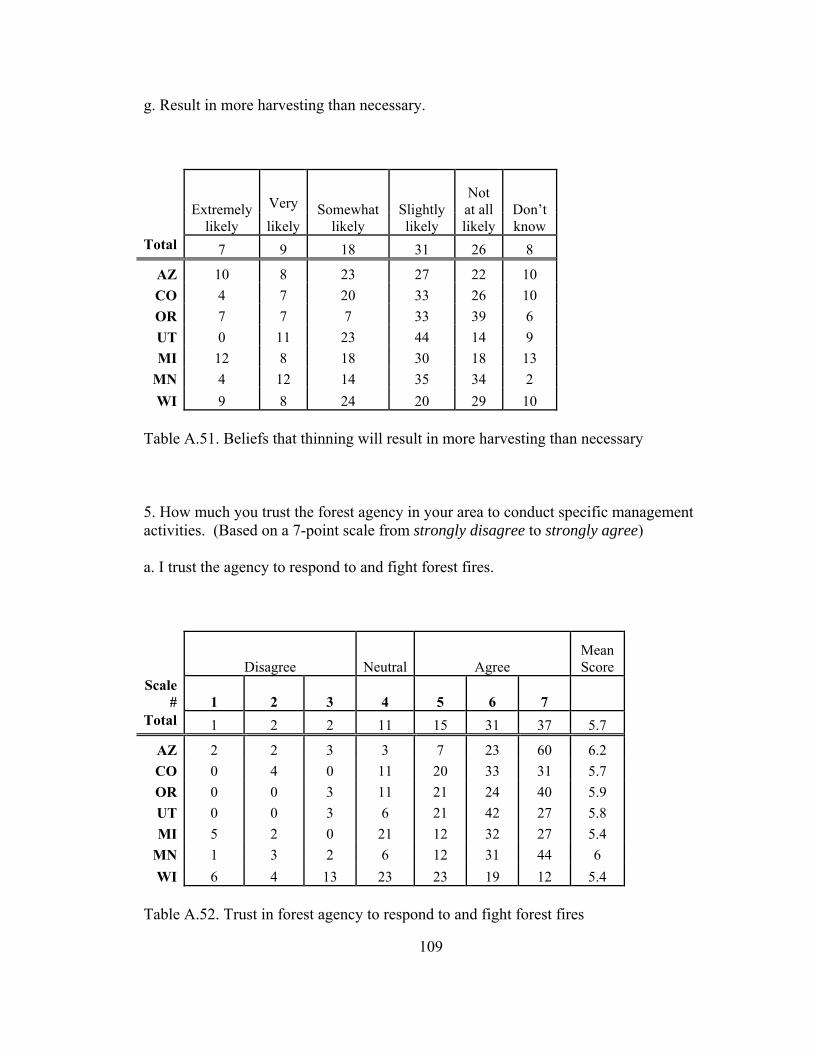
109
g. Result in more harvesting than necessary.
Extremely likely
Very Somewhat likely
Slightly likely
Not at all likely
Don’t know likely
Total 7 9 18 31 26 8
AZ 10 8 23 27 22 10 CO 4 7 20 33 26 10 OR 7 7 7 33 39 6 UT 0 11 23 44 14 9 MI 12 8 18 30 18 13
MN 4 12 14 35 34 2 WI 9 8 24 20 29 10
Table A.51. Beliefs that thinning will result in more harvesting than necessary 5. How much you trust the forest agency in your area to conduct specific management activities. (Based on a 7-point scale from strongly disagree to strongly agree) a. I trust the agency to respond to and fight forest fires.
Disagree Neutral Agree Mean Score
Scale # 1 2 3 4 5 6 7
Total 1 2 2 11 15 31 37 5.7
AZ 2 2 3 3 7 23 60 6.2 CO 0 4 0 11 20 33 31 5.7 OR 0 0 3 11 21 24 40 5.9 UT 0 0 3 6 21 42 27 5.8 MI 5 2 0 21 12 32 27 5.4
MN 1 3 2 6 12 31 44 6 WI 6 4 13 23 23 19 12 5.4
Table A.52. Trust in forest agency to respond to and fight forest fires

110
b. I trust the agency to use thinning practices effectively.
Disagree Neutral Agree Mean Score
Scale # 1 2 3 4 5 6 7
Total 4 4 6 21 24 22 18 5
AZ 3 2 5 23 10 33 23 5.3 CO 4 6 7 15 31 14 23 5 OR 3 3 6 23 23 21 21 5.1 UT 0 2 3 24 30 33 6 5 MI 9 6 5 25 23 19 14 4.6
MN 4 6 7 18 22 20 22 5 WI 2 5 10 22 24 20 16 4.9
Table A.53. Trust in forest agency to use thinning practices effectively c. I trust the agency to effectively plan and implement prescribed burns.
Disagree Neutral Agree Mean Score
Scale # 1 2 3 4 5 6 7
Total 6 4 11 20 25 20 12 4.6
AZ 10 3 5 14 25 25 17 4.8 CO 7 11 10 18 30 18 6 4.3 OR 7 1 11 16 24 20 20 4.9 UT 1 3 9 27 27 30 1 4.7 MI 9 5 9 28 26 15 9 4.4
MN 5 3 14 17 24 18 18 4.8 WI 6 4 13 23 23 19 12 4.6
Table A.54. Trust in forest agency to effectively plan and implement prescribed burns

111
6. Please tell us about your trust in information from the forest agency in your area about their management programs for reducing the risk of wildfire. (Based on a 7-point scale from strongly disagree to strongly agree) a. I trust the agency to provide enough information so that I can decide on actions I should take about fire and fire safety.
Disagree Neutral Agree Mean Score
Scale # 1 2 3 4 5 6 7
Total 3 3 5 13 18 37 20 4.9
AZ 4 7 3 21 24 27 13 5.3 CO 6 3 3 18 24 25 21 4.9 OR 0 8 15 23 26 22 6 5.1 UT 5 4 4 31 26 22 8 4.6 MI 1 7 6 23 19 25 20 4.7
MN 4 5 8 26 25 19 13 5 WI 3 5 6 23 23 25 14 4.7
Table A.55. Trust in forest agency to provide adequate information

112
b. I trust the agency to provide current, timely information about forest fire issues.
Disagree Neutral Agree Mean Score
Scale # 1 2 3 4 5 6 7
Total 3 5 8 20 22 27 15 4.9
AZ 5 3 5 12 17 37 22 5.3 CO 1 7 6 19 27 30 10 4.9 OR 4 4 3 18 23 27 21 5.2 UT 0 9 12 15 27 29 8 4.8 MI 6 3 9 31 23 17 10 4.5
MN 3 4 9 16 16 31 20 5.1 WI 3 5 9 24 25 20 14 4.8
Table A.56. Trust in forest agency to provide current, timely information c. I trust the agency to provide credible information about their fuel reduction activities.
Disagree Neutral Agree Mean Score
Scale # 1 2 3 4 5 6 7
Total 3 5 7 20 17 32 17 4.7
AZ 4 3 7 26 24 26 10 5 CO 4 4 10 18 23 21 20 4.8 OR 0 12 7 30 24 22 4 4.9 UT 8 3 6 35 23 19 5 4.5 MI 1 8 8 23 18 26 15 4.4
MN 5 9 8 29 26 15 8 4.9 WI 4 6 8 26 22 23 11 4.4
Table A.57. Trust in forest agency to provide credible information

113
7. Please tell us if your trust in the forest agency in your area has changed over the last six years because of how it has handled its fire and fuel management activities.
My trust in the agency has:
Increased Not
changed DecreasedTotal 14 74 11
AZ 32 52 17 CO 11 79 10 OR 24 59 17 UT 9 84 7 MI 10 78 12
MN 8 80 10 WI 10 82 9
Table A.58. Change in level of trust in forest agency

114
8. How much have the following influenced your opinion of the forest agency practices in your area to reduce the risk of wildfire? a. Media (TV, newspapers).
Not at
all Slightly Moderately
A great deal
Total 32 28 29 11
AZ 22 28 33 17 CO 37 28 24 10 OR 35 29 28 9 UT 26 32 32 9 MI 40 21 30 9
MN 28 34 28 10 WI 36 23 28 13
Table A.59. Influence of media on public opinion b. My neighbors.
Not at
all Slightly Moderately
A great deal
Total 58 19 16 7
AZ 55 11 25 9 CO 47 26 20 8 OR 66 12 15 6 UT 69 14 14 3 MI 53 25 14 8
MN 57 19 18 7 WI 61 21 11 7
Table A.60. Influence of neighbors on public opinion

115
c. City or county fire department.
Not at
all Slightly Moderately
A great deal
Total 33 25 28 13
AZ 21 21 36 22 CO 31 31 25 14 OR 29 20 27 24 UT 32 32 27 9 MI 42 26 27 5
MN 38 22 28 12 WI 36 26 28 10
Table A.61. Influence of city or county fire department on public opinion d. Forest agency in your area.
Not at
all Slightly Moderately
A great deal
Total 18 26 39 17
AZ 12 19 39 30 CO 18 26 43 12 OR 16 17 36 31 UT 17 35 43 5 MI 26 31 28 15
MN 17 24 43 16 WI 17 26 42 15
Table A.62. Influence of local forest agency on public opinion

116
e. Threat of a wildfire in my area.
Not at
all Slightly Moderately
A great deal
Total 29 26 27 18
AZ 14 16 46 23 CO 19 25 33 23 OR 18 27 22 33 UT 30 35 25 10 MI 39 22 28 11
MN 34 27 28 11 WI 36 28 24 13
Table A.63. Influence of wildfire threat on public opinion
f. An actual wildfire occurring in my area.
Not at
all Slightly Moderately
A great deal
Total 36 22 23 19
AZ 14 16 46 23 CO 30 33 12 25 OR 23 21 20 36 UT 31 22 31 16 MI 45 15 21 18
MN 45 25 19 10 WI 54 19 16 11
Table A.64. Influence of actual wildfire occurrence on public opinion

117
9. Have you taken action on your property to protect your home from wildfires? Yes No Total 44 56
AZ 68 32 CO 58 42 OR 66 34 UT 25 75 MI 24 76
MN 36 64 WI 41 59
Table A.65. Level of action taken to protect home from wildfire 10. Agency interactions with the local community. a. The agency is open to public input and uses it to shape management decisions.
Strongly Disagree Disagree Agree
Strongly Agree
Don’t know
Total 5 14 41 6 34
AZ 3 10 40 16 31 CO 3 9 47 1 40 OR 4 11 37 10 38 UT 5 14 40 2 40 MI 5 15 38 1 40
MN 5 16 36 7 35 WI 7 17 50 7 19
Table A.66. Citizen-agency interactions, incorporating public input into management decisions

118
b. Agency managers usually create plans without input from local communities.
Strongly Disagree Disagree Agree
Strongly Agree
Don’t know
Total 5 28 21 8 37
AZ 9 28 23 9 32 CO 4 31 21 6 38 OR 11 31 11 7 39 UT 3 26 23 8 40 MI 0 29 22 7 42
MN 4 24 23 8 40 WI 6 28 26 10 30
Table A.67. Citizen-agency interactions, incorporating public input into management plans c. Agency managers build trust and cooperation with local citizens.
Strongly Disagree Disagree Agree
Strongly Agree
Don’t know
Total 4 16 41 6 33
AZ 3 12 37 19 29 CO 4 10 49 1 35 OR 1 11 44 6 38 UT 5 15 45 2 34 MI 3 19 37 4 37
MN 4 19 37 7 33 WI 8 23 39 3 26
Table A.68. Citizen-agency interactions, building trust and cooperation

119
d. Managers do a good job of providing information about management activities.
Strongly Disagree Disagree Agree
Strongly Agree
Don’t know
Total 3 18 41 6 31
AZ 3 16 43 17 21 CO 4 13 46 3 34 OR 1 13 46 6 34 UT 5 22 39 3 31 MI 7 19 32 1 41
MN 2 21 36 9 31 WI 2 21 45 6 26
Table A.69. Citizen-agency interactions, providing information about management activities e. I am skeptical of information from the forest agency in my area.
Strongly Disagree Disagree Agree
Strongly Agree
Don’t know
Total 18 37 17 6 21
AZ 40 26 14 4 16 CO 22 41 15 4 18 OR 23 43 16 3 16 UT 13 47 16 5 20 MI 8 36 18 5 33
MN 15 31 23 8 23 WI 15 37 17 10 21
Table A.70. Citizen-agency interactions, skepticism of agency information

120
f. There are adequate opportunities for citizens to participate in the local agency planning process.
Strongly Disagree Disagree Agree
Strongly Agree
Don’t know
Total 4 19 32 5 40
AZ 7 14 29 14 36 CO 3 9 43 4 41 OR 3 11 42 3 41 UT 6 22 25 2 46 MI 7 19 27 3 45
MN 1 24 24 6 44 WI 6 26 35 3 30
Table A.71. Citizen-agency interactions, providing adequate opportunities for citizen participation in planning processes g. Local agency staff are prohibited from doing their jobs because of national restrictions or regulations.
Strongly Disagree Disagree Agree
Strongly Agree
Don’t know
Total 4 15 19 10 51
AZ 10 12 16 12 50 CO 3 18 16 10 53 OR 4 8 24 18 45 UT 5 14 17 6 58 MI 3 16 18 4 59
MN 4 18 19 8 51 WI 3 15 25 14 43
Table A.72. Citizen-agency interactions, influence of national restrictions on local agency

121
12. Public opinion and support are important factors in the success of forest policies. We want to know what influences your opinion of management decisions. Rate each of the following factors 1 through 7 (1 = not important, 7 = extremely important) on how important they are when making judgments about forest agency actions and decisions in your area.
a. When local citizens have been included in the planning process. 1 2 3 4 5 6 7 Mean Total 1 2 7 20 23 28 20 5.3
AZ 0 2 10 17 22 26 22 5.3
CO 0 4 10 11 35 28 11 5.1
OR 2 0 6 29 21 20 23 5.2
UT 0 0 6 20 26 28 20 5.4
MI 1 3 7 24 21 20 24 5.2
MN 2 2 4 20 18 30 23 5.3
WI 1 2 6 16 18 40 18 5.4
Table A.73. Importance of citizen inclusion in the planning process on judgments of forest agency actions b. How the decision affects my personal property.
1 2 3 4 5 6 7 Mean Total 5 3 5 18 15 24 30 5.3
AZ 10 3 7 21 2 22 34 5.1
CO 1 6 7 18 15 25 27 5.2
OR 4 7 0 16 13 25 35 5.4
UT 3 0 5 22 26 20 25 5.3
MI 5 4 4 16 12 24 34 5.3
MN 6 0 4 12 16 21 40 5.6
WI 7 2 5 21 20 26 19 5
Table A.74. Importance of personal property implications on judgments of forest agency actions

122
c. When I know the objectives of a proposed management action.
1 2 3 4 5 6 7 Mean Total 1 2 6 21 26 27 18 5.2
AZ 0 4 4 25 14 29 25 5.4
CO 0 3 4 12 35 29 17 5.4
OR 0 0 5 22 27 31 16 5.3
UT 0 0 5 25 32 26 12 5.2
MI 1 1 6 28 25 19 20 5.1
MN 2 2 6 18 27 24 20 5.2
WI 2 2 9 22 19 31 15 5.1
Table A.75. Importance of knowing management objectives on judgments of forest agency actions d. The decision maintains forest access for recreation.
1 2 3 4 5 6 7 Mean Total 2 2 7 17 26 26 21 5.2
AZ 0 5 11 11 30 16 28 5.3
CO 3 4 10 21 23 24 14 4.9
OR 1 1 7 18 28 21 24 5.3
UT 0 0 3 18 21 36 21 5.6
MI 1 1 7 20 18 34 19 5.3
MN 4 1 8 10 28 25 24 5.3
WI 0 1 4 22 23 32 17 5.2
Table A.76. Importance of maintaining recreational forest access on judgments of forest agency actions

123
e. The decision leads to active management to maintain or restore conditions.
1 2 3 4 5 6 7 Mean Total 1 1 5 24 29 27 13 5.1
AZ 0 0 5 29 25 21 20 5.2
CO 1 0 1 21 31 21 24 5.4
OR 0 0 3 27 29 29 12 5.2
UT 0 0 6 27 33 30 4 5
MI 1 4 11 23 27 23 10 4.8
MN 0 0 3 15 36 34 11 5.4
WI 1 1 7 31 21 28 10 5
Table A.77. Importance of maintaining or restoring conditions on judgments of forest agency actions f. My trust in the decision-maker. 1 2 3 4 5 6 7 Mean Total 2 2 7 23 23 27 16 5.1
AZ 2 3 9 16 26 22 22 5.2
CO 1 0 4 23 32 26 13 5.1
OR 3 0 7 27 19 33 10 5
UT 0 0 3 30 24 36 7 5.2
MI 4 1 7 22 22 29 14 5
MN 1 3 10 19 19 25 22 5.2
WI 0 4 8 26 22 22 17 5
Table A.78. Importance of trust in the decision-maker on judgments of forest agency actions

124
g. Environmental consequences are given top priority.
1 2 3 4 5 6 7 Mean Total 2 3 10 24 21 22 18 5
AZ 5 0 19 19 28 9 21 4.7
CO 0 9 4 14 21 24 27 5.3
OR 1 6 19 21 24 16 13 4.6
UT 1 1 9 33 22 19 13 4.9
MI 3 3 8 26 18 22 22 5
MN 0 1 8 22 23 32 13 5.2
WI 1 2 8 34 16 22 17 5
Table A.79. Importance of giving top priority to environmental considerations on judgments of forest agency actions h. When scientists play a role by reviewing management alternatives.
1 2 3 4 5 6 7 Mean Total 3 4 7 24 26 24 13 4.9
AZ 0 4 11 32 18 19 18 4.9
CO 3 3 0 24 30 27 13 5.1
OR 2 2 11 24 23 29 11 4.9
UT 0 2 5 22 37 25 11 5.1
MI 8 8 7 26 18 23 10 4.5
MN 3 3 9 22 20 26 16 5
WI 3 4 9 20 34 20 10 4.8
Table A.80. Importance of the role that scientists play on judgments of forest agency actions

125
i. Visual impacts of the activity.
1 2 3 4 5 6 7 Mean Total 1 5 13 24 24 20 12 4.8
AZ 2 7 16 24 26 14 12 4.6
CO 0 7 14 20 31 19 9 4.7
OR 0 6 10 36 23 13 12 4.6
UT 0 3 6 20 34 26 11 5.1
MI 3 8 9 20 23 20 16 4.8
MN 0 3 16 26 14 23 17 4.9
WI 2 4 15 21 24 24 9 4.7
Table A.81. Importance of visual impacts on judgments of forest agency actions j. When actions help support the local economy.
1 2 3 4 5 6 7 Mean Total 2 6 10 33 23 15 10 4.5
AZ 2 5 17 34 12 17 12 4.5
CO 3 14 14 42 19 3 4 3.9
OR 1 3 6 34 21 24 10 4.8
UT 2 3 3 37 31 17 8 4.7
MI 3 7 11 33 27 12 7 4.4
MN 2 5 8 19 31 23 11 4.9
WI 3 6 11 39 19 9 13 4.4
Table A.82. Importance of supporting the local economy on judgments of forest agency actions

126
k. Economic consequences are given top priority.
1 2 3 4 5 6 7 Mean Total 3 6 14 36 19 15 6 4.3
AZ 5 10 7 33 24 7 14 4.4
CO 9 10 22 35 16 9 0 3.7
OR 1 4 13 28 22 26 4 4.7
UT 2 3 14 41 17 20 5 4.5
MI 5 7 11 31 19 19 8 4.4
MN 1 3 16 34 25 14 6 4.5
WI 2 5 15 45 11 13 8 4.3
Table A.83. Importance of giving top priority to economic considerations on judgments of forest agency actions 13. Are you retired? No Yes Total 48 52
AZ 37 63 CO 70 30 OR 48 52 UT 62 38 MI 38 62
MN 44 56 WI 41 59
Table A.84. Number of retirees in study

127
14. Does your community have a Community Wildfire Protection Plan?
No Yes Don’t know
Total 13 24 63
AZ 12 50 38 CO 16 33 51 OR 10 45 45 UT 12 13 75 MI 12 12 77
MN 16 16 67 WI 14 12 75
Table A.85. Amount of communities with a Community Wildfire Protection Plan 15. Do you belong to a homeowners association or property group that has (or is organizing) a fire-safe or similar program to create more open space around neighborhood homes?
No Yes
If so, is this program required?
If so, is this program
voluntary? Total 90 10 16 84
AZ 78 22 31 69 CO 87 13 11 89 OR 72 28 18 82 UT 97 3 0 100 MI 96 4 0 100
MN 97 3 0 100 WI 96 4 0 100
Table A.86. Membership in community defensible space organization

128
16. How concerned are you that a wildfire could change your quality of life?
Not too concerned
Somewhat concerned
Very concerned
Extremely concerned
Total 34 29 23 14
AZ 32 33 18 17 CO 19 31 31 19 OR 21 35 23 21 UT 43 37 13 7 MI 34 34 22 9
MN 28 38 23 11 WI 34 41 17 7
Table A.87. Concern regarding a wildfire impacting quality of life

129
Appendix B: Frequency Report of Northern Lake States’ Responses
Table values are percents unless otherwise noted.
1. Please evaluate the following methods in terms of how often they are utilized by your management area to achieve your forest restoration and/or fuel reduction methods. a. Prescribed fire. Never Rarely Sometimes Often AlwaysTotal 3 12 38 38 9
MI 6 13 59 22 0 MN 0 12 30 42 15 WI 0 13 13 63 12
Table B.1. Amount of prescribed fire use in the northern lake states b. Wildland fire use. Never Rarely Sometimes Often AlwaysTotal 49 31 17 1 1
MI 44 34 19 3 0 MN 55 27 15 0 3 WI 50 31 17 1 1
Table B.2. Amount of wildland fire use in the northern lake states

130
c. Mechanized thinning. Never Rarely Sometimes Often AlwaysTotal 4 9 24 58 6
MI 0 13 22 59 6 MN 6 6 21 58 9 WI 6 6 31 56 0
Table B.3. Amount of mechanized thinning use in the northern lake states d. Mowing. Never Rarely Sometimes Often AlwaysTotal 12 25 35 28 0
MI 9 25 41 25 0 MN 18 27 33 21 0 WI 6 19 25 50 0
Table B.4. Amount of mowing use in the northern lake states e. Herbicide. Never Rarely Sometimes Often AlwaysTotal 20 30 33 16 1
MI 13 47 31 9 0 MN 30 21 36 12 0 WI 13 13 31 38 6
Table B.5. Amount of herbicide use in the northern lake states

131
2. Does your management area utilize the following methods primarily to restore forest conditions, to reduce forest fuels, or both? a. Prescribed fire.
Restore forest
conditions Both Reduce
forest fuels We don't use this practice
Total 15 78 5 3 MI 6 81 6 6
MN 12 82 6 0 WI 38 63 0 0
Table B.6. Prescribed fire utilization to accomplish management objectives b. Wildland fire use.
Restore forest
conditions Both Reduce
forest fuels We don't use this practice
Total 11 25 1 63 MI 13 22 3 63
MN 9 27 0 64 WI 13 25 0 63
Table B.7. Wildland fire use to accomplish management objectives

132
c. Mechanized thinning.
Restore forest
conditions Both Reduce
forest fuels We don't use this practice
Total 27 57 11 5 MI 25 63 6 6
MN 30 46 21 3 WI 25 69 0 6
Table B.8. Mechanized thinning utilization to accomplish management objectives d. Mowing.
Restore forest
conditions Both Reduce
forest fuels We don't use this practice
Total 27 25 25 24 MI 25 28 22 25
MN 24 21 24 30 WI 38 25 31 6
Table B.9. Mowing utilization to accomplish management objectives

133
e. Herbicide.
Restore forest
conditions Both Reduce
forest fuels We don't use this practice
Total 43 19 6 32 MI 44 22 9 25
MN 39 12 3 46 WI 50 25 6 19
Table B.10. Herbicide utilization to accomplish management objectives 3. Of these methods, are there any that you would like to use more than you are currently able to? a. Prescribed fire. Yes No
Total 95 5 MI 97 3
MN 91 9 WI 100 0
Table B.11. Satisfaction with amount of prescribed fire utilization

134
b. Wildland fire use. Yes No
Total 64 36 MI 72 28
MN 61 39 WI 56 44
Table B.12. Satisfaction with amount of wildland fire use c. Mechanized thinning. Yes No
Total 52 48 MI 37 63
MN 58 42 WI 69 31
Table B.13. Satisfaction with amount of mechanized thinning utilization d. Mowing. Yes No
Total 23 77 MI 16 84
MN 30 70 WI 25 75
Table B.14. Satisfaction with amount of mowing utilization

135
e. Herbicide. Yes No
Total 30 70 MI 28 72
MN 30 70 WI 31 69
Table B.15. Satisfaction with amount of herbicide utilization 4. How much do the following factors influence your forest restoration and/or fuel management decisions? a. Budget constraints.
Not at all Slightly ModeratelyA great
deal Total 0 7 35 58
MI 0 6 38 56 MN 0 12 27 61 WI 0 0 44 56
Table B.16. Influence of budget constraints on management decisions

136
b. Laws (e.g. NEPA, ESA).
Not at all Slightly ModeratelyA great
deal Total 5 48 33 14
MI 0 59 28 13 MN 12 33 39 15 WI 0 56 31 13
Table B.17. Influence of laws on management decisions c. Habitat requirements (e.g. Kirtland’s warbler or other species).
Not at all Slightly ModeratelyA great
deal Total 9 31 47 14
MI 6 22 53 19 MN 9 39 42 9 WI 13 31 44 13
Table B.18. Influence of habitat requirements on management decisions d. Competing agency interests (e.g. recreation, timber, wildlife).
Not at all Slightly ModeratelyA great
deal Total 3 26 44 27
MI 3 31 44 22 MN 3 27 49 21 WI 0 13 38 50
Table B.19. Influence of competing agency interests on management decisions

137
e. Agency mandates.
Not at all Slightly ModeratelyA great
deal Total 9 38 35 19
MI 3 34 41 22 MN 9 42 33 15 WI 19 38 25 19
Table B. 20. Influence of agency mandates on management decisions f. Interface constraints (e.g. presence of homes, public safety).
Not at all Slightly ModeratelyA great
deal Total 4 30 40 27
MI 0 22 47 31 MN 9 36 30 24 WI 0 31 44 25
Table B.21. Influence of interface constraints on management decisions g. Pressure from public stakeholders.
Not at all Slightly ModeratelyA great
deal Total 6 44 41 9
MI 6 56 34 3 MN 9 36 39 15 WI 0 38 56 6
Table B.22. Influence of pressure from public stakeholders on management decisions

138
h. Your forest plan.
Not at all Slightly ModeratelyA great
deal Total 14 35 37 15
MI 9 50 28 13 MN 12 24 46 18 WI 25 25 38 13
Table B.23. Influence of forest plan on management decisions i. Past personal experiences.
Not at all Slightly ModeratelyA great
deal Total 21 43 27 9
MI 16 44 31 9 MN 30 30 33 6 WI 13 69 6 13
Table B.24. Influence of past personal experiences on management decisions j. Previous agency actions (e.g. normal operating procedures).
Not at all Slightly ModeratelyA great
deal Total 12 35 37 16
MI 6 31 41 22 MN 21 27 39 12 WI 6 56 25 13
Table B.25. Influence of previous agency actions on management decisions

139
k. The scientific community (e.g. researchers).
Not at all Slightly ModeratelyA great
deal Total 28 48 17 6
MI 28 53 13 6 MN 36 39 21 3 WI 13 56 19 13
Table B.26. Influence of the scientific community on management decisions l. Professional societies.
Not at all Slightly ModeratelyA great
deal Total 56 37 6 1
MI 50 47 3 0 MN 64 30 6 0 WI 50 31 13 6
Table B.27. Influence of professional societies on management decisions

140
5. There are several different places one can get information. Please rate how often you use the following sources to get information on fire management and forest restoration. a. Management colleague. Never Rarely Sometimes Often Always
Total 0 2 17 63 17 MI 0 3 16 53 28
MN 0 3 18 79 0 WI 0 0 19 50 31
Table B.28. Use of management colleagues in information exchange b. Agency research scientist. Never Rarely Sometimes Often Always
Total 6 20 35 31 9 MI 9 13 44 25 9
MN 6 30 24 33 6 WI 0 13 38 38 13
Table B.29. Use of agency research scientists in information exchange c. Academic research scientist. Never Rarely Sometimes Often Always
Total 5 24 48 24 0 MI 6 22 53 19 0
MN 6 21 46 27 0 WI 0 31 44 25 0
Table B.30. Use of academic research scientists in information exchange

141
d. Professional society. Never Rarely Sometimes Often Always
Total 17 46 24 14 0 MI 16 38 28 19 0
MN 15 58 18 9 0 WI 25 38 25 13 0
Table B.31. Use of professional societies in information exchange 6. There are several different methods used to communicate information. Please indicate how useful each of the following methods are to exchanging information on fire management and forest restoration. a. Conferences/professional meetings.
Not at all Slightly Moderately Very Extremely No
Opinion Total 0 9 31 52 7 1
MI 0 13 38 41 6 3 MN 0 0 30 55 6 0 WI 0 0 19 69 13 0
Table B.32. Usefulness of conferences/professional meetings to information exchange

142
b. Trips to field sites/demonstration sites.
Not at all Slightly Moderately Very Extremely No
Opinion Total 0 3 16 48 33 0
MI 0 0 22 44 34 0 MN 0 3 12 52 33 0 WI 0 6 13 50 31 0
Table B.33. Usefulness of trips to field sites to information exchange c. Virtual meetings (video teleconference or online webinars).
Not at all Slightly Moderately Very Extremely No
Opinion Total 6 31 48 11 0 4
MI 3 25 53 13 0 6 MN 9 36 49 6 0 0 WI 6 31 38 19 0 6
Table B.34. Usefulness of virtual meetings to information exchange d. Telephone conference with multiple participants.
Not at all Slightly Moderately Very Extremely No
Opinion Total 4 44 42 9 0 1
MI 0 41 41 19 0 0 MN 3 49 46 3 0 0 WI 13 44 38 0 0 6
Table B.35. Usefulness of telephone conferences to information exchange

143
e. General Technical Reports.
Not at all Slightly Moderately Very Extremely No
Opinion Total 0 25 37 32 6 0
MI 0 31 31 31 6 0 MN 0 21 33 39 6 0 WI 0 19 56 19 6 0
Table B.36. Usefulness of General Technical Reports to information exchange f. Condensed research summaries (e.g. 1 to 2 page summaries of findings and implications).
Not at all Slightly Moderately Very Extremely No
Opinion Total 1 12 33 41 12 0
MI 3 19 31 38 9 0 MN 0 9 39 39 12 0 WI 0 6 25 50 19 0
Table B.37. Usefulness of condensed research summaries to information exchange

144
g. Newsletters from professional societies (e.g. SAF).
Not at all Slightly Moderately Very Extremely No
Opinion Total 7 40 35 16 1 1
MI 6 44 34 16 0 0 MN 12 33 33 21 0 0 WI 0 44 38 6 6 6
Table B.38. Usefulness of newsletters from professional societies to information exchange h. Newsletters from research organizations (e.g. the USFS Northern Research Station).
Not at all Slightly Moderately Very Extremely No
Opinion Total 5 21 43 24 7 0
MI 6 22 38 25 9 0 MN 3 24 42 24 6 0 WI 6 13 56 19 6 0
Table B.39. Usefulness of newsletters from research organizations to information exchange

145
i. Internet web sites maintained by professional societies.
Not at all Slightly Moderately Very Extremely No
Opinion Total 7 28 37 20 2 5
MI 6 16 41 25 3 9 MN 3 49 30 18 0 0 WI 19 13 44 13 6 6
Table B.40. Usefulness of internet web sites maintained by professional societies to information exchange j. Internet web sites maintained by research organizations.
Not at all Slightly Moderately Very Extremely No
Opinion Total 5 19 42 24 9 3
MI 6 13 41 25 9 6 MN 3 30 33 24 9 0 WI 6 6 63 19 6 0
Table B.41. Usefulness of internet web sites maintained by research organizations to information exchange

146
k. Email listserves used to provide scientific information.
Not at all Slightly Moderately Very Extremely No
Opinion Total 12 28 38 12 6 3
MI 16 34 31 9 6 3 MN 6 27 42 18 6 0 WI 19 19 44 6 6 6
Table B.42. Usefulness of email listserves to information exchange 7. Please indicate your level of agreement with each of the following statements regarding challenges you face to acquiring the best information to help you achieve your fire and restoration objectives. a. The information is not easily accessible.
Strongly Disagree Disagree
Neither Disagree nor Agree Agree
Strongly Agree
Total 3 21 35 36 6 MI 0 22 31 44 3
MN 3 21 39 30 6 WI 6 19 31 31 13
Table B.43. Information accessibility as a challenge to information exchange

147
b. I don’t have the time to look for the latest information.
Strongly Disagree Disagree
Neither Disagree nor Agree Agree
Strongly Agree
Total 3 11 19 47 21 MI 3 6 34 44 13
MN 0 18 0 49 33 WI 6 6 25 50 13
Table B.44. Time as a challenge to information exchange c. I don’t know where to look for the information.
Strongly Disagree Disagree
Neither Disagree nor Agree Agree
Strongly Agree
Total 2 36 30 27 5 MI 3 34 25 28 9
MN 0 46 27 24 3 WI 6 19 44 31 0
Table B.45. Knowing where to look as a challenge to information exchange
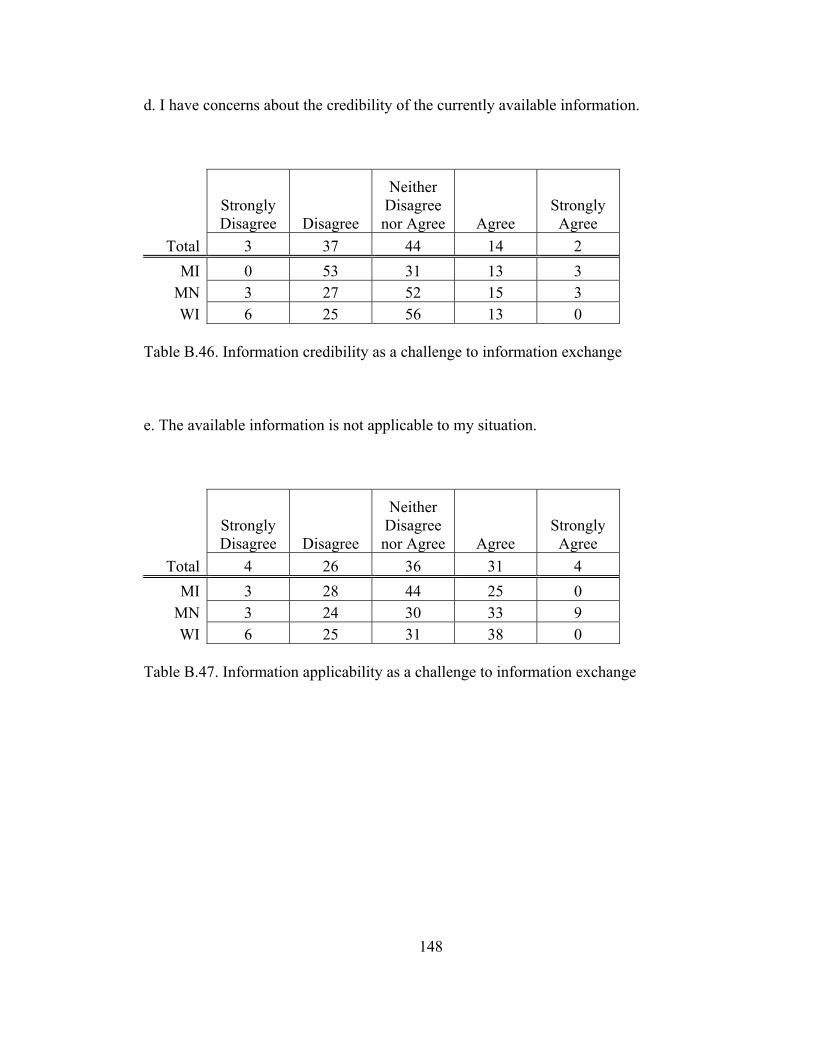
148
d. I have concerns about the credibility of the currently available information.
Strongly Disagree Disagree
Neither Disagree nor Agree Agree
Strongly Agree
Total 3 37 44 14 2 MI 0 53 31 13 3
MN 3 27 52 15 3 WI 6 25 56 13 0
Table B.46. Information credibility as a challenge to information exchange e. The available information is not applicable to my situation.
Strongly Disagree Disagree
Neither Disagree nor Agree Agree
Strongly Agree
Total 4 26 36 31 4 MI 3 28 44 25 0
MN 3 24 30 33 9 WI 6 25 31 38 0
Table B.47. Information applicability as a challenge to information exchange

149
8. Currently, do you, or management personnel in general, have a means to help shape the information that is generated through ongoing/future research? Yes No Unsure
Total 46 22 32 MI 50 19 31
MN 42 27 30 WI 44 19 38
Table B.48. Managers’ perceived role in shaping research information 9. As the network further develops, are you interested in participating in additional activities? (e.g. receive invitations for workshops, virtual meetings, and other future communication activities) Yes No
Total 90 10 MI 84 16
MN 94 6 WI 94 6
Table B.49. Managers’ desire to be involved in future information exchange activities