Embed Size (px)
Citation preview
1
Longitudinal study of local authority child and family social workers (Wave 1) Research report
August 2019
Claire Johnson, Sarah Coburn, Alfie Sanders-Earley, Jonnie Felton, Mark Winterbotham (IFF Research); Prof. Hugh McLaughlin and Dr. Sarah Pollock (Manchester Metropolitan University); Dr. Helen Scholar and Susan McCaughan (University of Salford)

2

3
Contents
Acknowledgements 6
List of figures 7
List of tables 10
Executive Summary 11
1 Introduction 19
Background 19
Aims and objectives 21
Methodology 22
The structure of this report 26
2 Who works in local authority child and family social work? 27
Gender and age 27
Ethnicity 28
Disability or long-term health condition 29
Caring responsibilities 30
3 Entry routes into local authority child and family social work 32
Motivations for becoming a social worker 32
Qualification routes into the profession 34
Views on the effectiveness of different qualification routes 37
Pathways into child and family social work after qualifying 41
Experiences of the Assessed and Supported Year in Employment (ASYE) 42
4 Current employment and career history 44
Current employment 44
Career history 46
Job role and area of practice 48
Prior experience outside of child and family social work 51
5 Workplace well-being 52
Contracted and actual working hours 52
Caseloads 56
Stress levels and workload demands 59
Manager consideration of work-life balance 70

4
Use of various flexible working arrangements 71
6 Views on employer, manager and working environment 75
Feeling valued by and loyal to their employer 75
Views on line management 78
Overall confidence in managers’ decisions 81
Experiences of receiving and providing reflective supervision 82
Receiving reflective supervision 82
Providing reflective supervision 85
Access to and support for learning and development 86
Views on working environment and resources 89
7 Job satisfaction 92
Aspects of the job 92
The work itself 94
Pay and job security 97
Public respect for the profession 100
Overall job satisfaction 102
8 Views on career progression 105
Whether career progression has met expectations, so far 105
Perceived enablers to career progression 106
Perceived barriers to career progression 109
Ways to maximise enablers and address barriers 111
9 Short-term career plans and reasons for wanting to leave social work 114
Career plans in the next 12 months and beyond 114
Reasons for leaving or considering leaving child and family social work 115
Potential influences on retention 116
11 Conclusions 121
Appendix 1: Methodology 123
Overview of methodology 123
Local Authority recruitment and profile 123
Social worker invitations 124
Pilot and soft launch 125

5
Mainstage 126
Weighting and statistical significance 130
Qualitative follow-up research 131
Appendix 2: Wave 1 survey questionnaire 133
Appendix 3: Guide for qualitative follow-up interviews 176
Appendix 4: References 182
6
Acknowledgements The authors would like to thank all of the local authorities that facilitated the first wave of this research, either by taking part in the preliminary qualitative stage, by providing sample, or by sending out the open link survey invite to their child and family social workers on our behalf. We would also like to express our thanks to Jessica Dunn, Julian Ward, Jane Simmonds and Jessica Higgins at the Department for Education, as well as the members of the study’s Advisory Group, for their advice and support throughout this first year of the project. Finally, we would like to thank all of the individual child and family social workers who gave their valuable time so generously to complete the survey or take part in a qualitative interview.
7
List of figures Figure 2.1: Age profile of social workers who participated in the survey, overall and by gender .............................................................................................................................. 28
Figure 2.2: Ethnicity, by region ........................................................................................ 29
Figure 3.1: Reasons for embarking on a career in social work ........................................ 33
Figure 3.2: Entry route into child and family social work .................................................. 35
Figure 3.3: Subject studied by those who did not enter the profession through a social work qualification ............................................................................................................. 37
Figure 3.4: Social workers’ views on how well they felt their entry route into social work prepared them for social work .......................................................................................... 38
Figure 3.5: Social workers’ views on how well they felt their entry route prepared them for social work, by entry route ............................................................................................... 39
Figure 3.6: Social workers’ views on how well they felt their entry route prepared them for social work, by undergraduate subject ............................................................................. 40
Figure 3.7 Social workers’ views on how well they felt their entry route prepared them for social work, by current area of practice............................................................................ 41
Figure 3.8: Perceived usefulness of the ASYE ................................................................ 43
Figure 4.1 Current employment ....................................................................................... 44
Figure 4.2 Reasons for agency work ............................................................................... 46
Figure 4.3 Career history ................................................................................................. 47
Figure 4.4 Job role and area of practice .......................................................................... 49
Figure 4.5 Experience of other areas of social work ........................................................ 51
Figure 5.1 Number of cases held ..................................................................................... 56
Figure 5.2 Mean cases by contracted hours, job role and area of practice ...................... 57
Figure 5.3 Mean cases by region and Ofsted rating ........................................................ 58
Figure 5.4 Overall agreement levels regarding stress and workload demands................ 60
Figure 5.5 Agreement regarding stress levels and workload demands, by caseload ...... 61

8
Figure 5.6 Agreement regarding stress levels and workload demands, by length of time in child and family social work ............................................................................................. 62
Figure 5.7 Agreement regarding stress levels and workload demands by job role .......... 63
Figure 5.8 Reasons for feeling stressed .......................................................................... 66
Figure 5.9 Extent of social worker’s agreement that their manager is considerate of their life outside of work ........................................................................................................... 70
Figure 5.10 Use of flexible working arrangements ........................................................... 71
Figure 5.11 Use of flexible working arrangements by length of time with employer ......... 72
Figure 5.12 Use of flexible working arrangements by job role ......................................... 73
Figure 6.1: Social workers’ perceptions of loyalty to and feeling valued by their employer ......................................................................................................................................... 75
Figure 6.2: Loyalty to and feeling valued by employer, by Ofsted rating .......................... 77
Figure 6.3: Social workers’ views on their line manager .................................................. 79
Figure 6.4: Proportion of social workers agreeing with the statement: my manager motivates me to be more effective in my job, by Ofsted rating ......................................... 80
Figure 6.5: Frequency of receiving reflective supervision, and views on its adequacy .... 83
Figure 6.6: Confidence in ability to provide reflective supervision .................................... 86
Figure 6.7: Access to and support for learning and development, by job role.................. 88
Figure 6.8: Views on working environment and resources .............................................. 89
Figure 7.1: Social workers’ satisfaction with various aspects of their job, by job role ...... 93
Figure 7.2: Satisfaction with job security and the amount of pay they receive, by employment status ........................................................................................................... 98
Figure 7.3: Satisfaction with public respect for the profession, by age band.................. 101
Figure 7.4: Extent of agreement with overall job satisfaction, by health condition ......... 103
Figure 8.1: Social workers’ impression of their career progression so far, by Ofsted rating ....................................................................................................................................... 105
Figure 8.2 Social workers’ reported enablers to career progression, ranked by main enabler (prompted) ........................................................................................................ 107
9
Figure 8.3: Social workers’ reported barriers to career progression, ranked by main barrier ............................................................................................................................ 110
Figure 9.1: Where social workers see themselves in 12 months’ time ........................... 114
Figure 9.2: Reasons for leaving, or considering leaving, local authority social work ..... 116
Figure 9.3: Factors that would influence social workers to remain or return to local authority child and family social work ............................................................................. 117

10
List of tables Table 1.1: Responses by local authority region and Ofsted rating .................................. 24
Table 1.2: Response rates by local authority region and Ofsted rating ........................... 25
Table 4.1 Length of experience as a qualified social worker, by job role ........................ 48
Table 5.1 Contracted working hours versus actual working hours ................................... 53
Table 5.2 Agreement with each statement, by practice area ........................................... 64
Table 5.3 Reasons for feeling stressed by their job, by role ............................................ 67
Tables A.1-A.3: The profile of participating Local Authorities in England ....................... 124
Table A.4: Telephone survey outcomes......................................................................... 126
Table A.5: Responses by local authority region and Ofsted rating ............................... 128
Table A.6: Response rates by local authority region and Ofsted rating ........................ 129
Table A.7 Profile of achieved interviews compared with DfE workforce statistics .......... 130

11
Executive Summary
Introduction and background In 2018, the Department for Education (DfE) commissioned a consortium led by IFF Research, working with social work academics at Manchester Metropolitan University and the University of Salford, to conduct a major new longitudinal study tracking the careers of local authority child and family social workers in England over five years. The aim of this landmark new study is to collect robust evidence on recruitment, retention and progression in child and family social work. In particular it aims to establish a much stronger understanding of child and family social work recruitment issues, career pathways, choices and decisions and how these differ across different individual, job and employer characteristics.
This report covers the first year (Wave 1) of the survey and follow-up qualitative research, which was conducted between November 2018 and March 2019. The study comprises three core components:
• Preliminary face-to-face qualitative interviews with 25 child and family social workers in five different local authorities, to explore issues around recruitment and retention and inform questionnaire development;
• A mixed-methods online and telephone survey, which achieved completed responses from 5,621 local authority child and family social workers (a response rate of 27%) in 95 local authorities: amounting to more than one in six of the population of local authority child and family social workers in England1; and
• Forty follow-up qualitative telephone interviews with a structured sample of ‘stayers’ and ‘leavers’ – defined as those who indicated that they planned to stay in local authority child and family social work over the next 12 months, and those who indicated they were planning to leave.
Where we refer to ‘social workers’ in the report, we mean social workers who have responded to this survey. All findings reported below are from the survey, unless stated that they are based on the qualitative interviews. In terms of the survey, only statistically significant differences are discussed.
1 The latest Department for Education (DfE) child and family social work workforce data shows there were 31,720 child and family social workers employed by local authorities (LAs) at the 30th September 2018.

12
Demographic profile of local authority child and family social workers The respondent profile was representative of the known population of local authority child and family social workers by gender, age band and ethnic group. The data were weighted by region and agency employment, to correct for differences between the achieved profile and the population2.
The vast majority of social workers who participated in the survey were women (82%), reflecting the population. Respondents were evenly distributed by age band, with around a quarter aged either 34 or under (25%); 35 to 44 (26%); or 45 to 54 (27%). The proportion aged 55 to 64 dropped to 20%. Three quarters were White British (73%), with the next largest ethnic groups Black African (7%) and Black Caribbean (3%). The social workers based in London local authorities were from much more diverse ethnic backgrounds compared with all other regions.
The majority (82%) reported that they did not have a disability or long-term physical or mental health condition (defined as one that had lasted 12 months or more). Those who did (15%) were more likely to be older, in particular aged 55+.
Just over half (52%) had some form of childcare or other caring responsibilities. They were most likely to care for school-aged children (34%) followed by caring for other family members or friends (13%) and caring for pre-school aged children (11%). Social workers in the 35-44 age group were the most likely to have some form of caring responsibilities (only 25% did not have any).
Entry routes into the profession Reasons for entering the profession centred on altruism/wanting to make a difference (a factor for 67% of social workers, and the main reason for 46%) and wanting to work with children (a factor for 58%, and the main reason for 18%). The qualitative research found that the origin of this impulse to help others varied, but was related to a combination of personal values, education and personal experiences.
By far the most common entry route was a university degree, either an undergraduate (46%) or a postgraduate (31%) degree in social work. A Diploma in Social Work (DipSW) (19%) and the Certificate of Qualification in Social Work (CQSW) (8%) were less common, while only a very small proportion entered through work-based programmes such as the Step Up to Social Work (3%) or the Frontline programme (1%), as might be expected given their relatively recent introduction and small scale. The type of
2 DfE Children's social work workforce data 2018

13
qualification route differed by seniority of job role, age and length of time in the profession. This reflects the fact that the CQSW and DipSW are historic qualifications.
Social workers were largely positive about how well their entry qualification had prepared them for their job, with results somewhat more positive in relation to how well prepared they felt for working in social work (73%) rather than working in child and family social work specifically (68%). Those who entered child and family social work via an undergraduate degree were least positive, whereas those who entered via the recently introduced Frontline and Step Up routes were more positive, at this point in time.
Almost two-fifths (39%) of social workers who participated in this research had completed the Assessed and Supported Year in Employment (ASYE) and a further six per cent were currently in their ASYE. Perceptions about the usefulness of the ASYE varied among those who had completed it; around two thirds (65%) found the ASYE useful while around one third (35%) did not. The qualitative research identified a definite shift in perception among some social workers who began to feel less positive about the role as they moved out of the ASYE, and encountered more of the ‘reality’ of the job in terms of workload pressures and paperwork.
Current employment Most social workers were directly employed by their local authority (84%) and a further 14% were employed via an agency: this data has been weighted to bring it in line with the population data, as agency social workers were under-represented in the achieved sample. The remainder were employed on another basis, such as self-employment or secondment. Reflecting this, it was most common for social workers to be working on a permanent or open-ended contract (82%).
Agency workers were more likely to work in Greater London (32% compared with 13% of social workers employed directly) and in the South West (18% compared with 7% employed directly). They were also more likely to work at a local authority rated by Ofsted as inadequate (21%, compared with 8% who were employed directly). Half of agency-employed social workers (50%) cited increased flexibility and almost half (49%) cited better pay as reasons why they had moved into an agency-based role, with higher pay being by far the most commonly cited single driving factor (29% cited this as their only or main reason).
The most common job roles among social workers were front line practitioners (55%), team managers (13%) and practice supervisors (7%). The most common areas of practice were child in need / child protection (52%), looked after children (31%) and assessment (26%). Those in the ‘duty/ first response/ front door/ MASH’, assessment, and ‘child in need and child protection’ roles typically had less experience than those in other areas.

14
In the qualitative research, social workers talked positively about the opportunities there had been to gain a range of experience across different practice areas during their first few years in practice by changing roles or teams, often within the same local authority. Some of those who had moved away from front line child protection/ first response roles did so because they found the nature of the work so demanding of their time, emotions and energy, and so incompatible with their personal lives, that they preferred to move to a different area of practice.
Working hours and workplace wellbeing The majority of social workers were contracted to work full-time; the mean number of contracted hours was 35, with the majority (77%) contracted to work between 36-40 hours a week. Working on a part-time contract (in particular, 30 hours per week or below) was twice as common among women as men (15% compared with 7%), and – as might be expected – more prevalent among those who had any caring responsibilities (21%, compared with 6% of those who did not have caring responsibilities). This was especially the case for people who had young children (below school age). The qualitative interviews included several social workers who had changed to part-time working to cater for family commitments or to reduce their workload to manageable levels.
The mean number of actual hours worked reported by social workers was 42 (compared with the mean of 35 contracted hours). This suggests that, on average, social workers are working an extra seven hours a week.
The mean number of cases (among those who said they were working in a case-holding role) was 19. Reported caseloads increased with the number of contracted hours (ranging from 16 among those contracted to work for up to 35 hours to 20 among those contracted to work 41 hours or more) and level of seniority (ranging from 17 among ASYE social workers to 23 among practice leaders.
Around half of social workers felt stressed by their job (51%); felt their overall workload was too high (51%); and felt they were being asked to fulfil too many different roles in their job (47%). Agreement with each statement peaked among those who had been in the profession for 2-3 years, supporting the suggestion that this is a particularly demanding point in the career of a child and family social worker. Social workers in a local authority with a ‘requires improvement’ Ofsted rating were the least positive about their experience, being more likely than average to agree that their workload was too high (56%); they were being asked to fulfil too many roles (53%) and they felt stressed by their job (53%).
The most common causes of stress at work were: too much paperwork (68%); too many cases (50%); insufficient time for direct work with children and families (44%); working culture / practices (42%); and lack of resources to support families (36%). Front line

15
social workers in the qualitative research raised concerns about the balance between direct work with families and children as opposed to the bureaucratic requirements of the task or meeting the requirements of the computer system. This could lead to a gap between initial expectation and the reality of the job.
Views on their employer, line manager and working environment Although social workers’ loyalty to their employer was fairly high (71% agreed, while 8% disagreed), only just over half of them felt valued by their employer (54%). Increased time spent with the organisation, and better Ofsted rating, were both positively associated with feeling loyal to their employer, yet negatively associated with the extent to which social workers felt valued.
Social workers were generally positive about their line manager, with around four-fifths agreeing that they were open to ideas (82%) and that their manager recognised when they had done their job well (81%). However, they were less positive about feedback received from their manager, in terms of both frequency and quality; only around seven in ten agreed that they received regular feedback on their performance (69%) and that the feedback received helped them to improve their performance (67%).
Social workers were less positive about their working environment. Only around half agreed that: the physical environment in their offices was appropriate for the work they do (54% agreed); they had the right resources available to do their job effectively (53% agreed); and the IT systems and software supported them to do their jobs (50% agreed). However, social workers were more positive about having the right tools to do their jobs (72% agreed).
Job satisfaction Three-quarters (74%) of social workers agreed they found their job satisfying and just one in 10 disagreed (11%). The qualitative interviews explored how the very nature of social work practice meant that it was difficult to give a definite answer in relation to how satisfied they were in their role: practitioners understood satisfaction as fluid, often dependent on things that were happening in their immediate practice environment.
When asked about various aspects of their job, satisfaction was highest for having scope to use their own initiative (84%) and the sense of achievement they get from their work (83%). Satisfaction levels gradually weakened across the other measures (although still in the majority); around three-quarters felt challenged in their job (78%) and were satisfied with the opportunity to develop their skills (72%), and around two-thirds were satisfied with the amount of influence they had over their job (68%).

16
Front line practitioners who had been in child and family social work for 2-3 years tended to be less satisfied on a range of measures, highlighting that this appears to be a critical point for social workers.
In relation to their pay, more social workers were satisfied (49%) than dissatisfied (32%), with roughly one in five (19%) neutral. In comparison, satisfaction with job security was much higher (75%, with 8% dissatisfied). Agency workers were significantly more satisfied than directly-employed social workers when it came to pay (65% compared with 46%) However, as might be expected, they were less satisfied with job security.
Views on career progression to date Over half of social workers (57%) considered their career progression to be ‘in line with expectations’. However, they were more likely to rate their career progression as ‘below expectations’ (19%) than ‘above expectations’ (11%). Those who were thinking of leaving local authority child and family social work within the next 12 months were more likely than those who were staying to rate their career progression as below expectations. This was particularly true of those intending to leave for the private/voluntary sector (35%), moving to a different type of social work (36%) or leaving social work altogether (43%).
The three most commonly cited career enablers, each mentioned by roughly three-fifths of social workers, were: a good relationship with other colleagues (63%); personal determination and ambition (60%); and good support from managers (59%). This was followed by availability of training/ Continuing Professional Development (CPD) (42%), flexibility/ taking on diverse roles (30%), and the amount and/or quality of supervision they received (25%). Social workers from authorities with an ‘outstanding’ Ofsted rating were more likely than others to report that virtually every factor had helped them to progress in their career, suggesting they benefited from a more supportive work environment generally.
The vast majority (85%) of social workers reported facing at least one barrier to career progression. Too high a workload was, by a considerable margin, the most commonly perceived barrier, mentioned by around half (48%) of social workers, followed by poor organisational leadership (26%) and poor support from managers (25%), highlighting the importance of senior figures within the local authority context. A ‘lack of meaningful progression opportunities’ was cited by just over one fifth (22%) of social workers.
Short-term career plans and reasons for leaving All social workers, including agency staff, were asked where they expected to be working in 12 months’ time: almost three-quarters (72%) planned to be working directly in local authority child and family social work, with one in ten (11%) planning to be in agency

17
work. A further 11% planned to move out of the sector and/or profession, including moving into different areas of social work.
When it came to reasons for leaving, issues with general workload and working time were prominent: 30% mentioned the high caseload, 28% the amount of paperwork and 24% the general working hours. Another important driver was disliking the culture of local authority social work (28%). Other commonly cited reasons were the job being incompatible with their family or relationship commitments (21%) and social workers feeling that they were not making the best use of their skills or experience (20%).
Among those who were thinking of leaving, social workers commonly cited improvements around workloads and remuneration as factors which would encourage them to reconsider. Those undertaking an ASYE, front line practitioners and those with a physical or mental health condition were more likely to report that more manageable workloads could be a factor in them remaining or returning to child and family social work in future.
Conclusions Overall, the majority of social workers who took part in the survey were motivated to enter the profession for altruistic reasons, found their job satisfying, felt loyal to their employer, and planned to stay in child and family social work in the next 12 months. They were generally positive about their line manager, in particular that they were open to ideas and recognised when they had done their job well. The majority of social workers also felt their entry route had prepared them well for the profession.
It appears that 2-3 years post qualification is a crucial point, as people move out of the ASYE year. ASYE was viewed positively given its focus on managed caseloads and time for post-qualifying learning. For some, the experience after this was a shock as they felt no longer protected and were expected to be functioning as an experienced social worker. Front line practitioners who had been in child and family social work for 2-3 years tended to be less satisfied on a range of measures, and reported the highest levels of stress. There is a need to explore how to better support the transition out of ASYE into experienced practitioner roles in order to support retention and develop resilience.
The majority of social workers who took part in the study worked more than their contracted hours and expected to do so in order to fulfil their roles. On average this amounted to working seven hours per week more than they were contracted to work. Flexible working arrangements were welcomed as a way to manage this issue. However, even part-time staff worked more hours than they were contracted to, and in the qualitative interviews, part-time work itself was perceived as a barrier to progression. This is something that can be explored in future waves of the research.

18
Around half of the social workers who took part in the survey felt stressed by their job. In particular, where practitioners felt they had an excessive caseload or unmanageable workload, they recognised that this impacted on their ability to engage and work successfully with families. Often bureaucratic procedures and paperwork were seen as getting in the way of this engagement, and there is a need to explore ways to reduce unnecessary bureaucracy.
One of the most striking features of the qualitative interviews was the similarity in responses and how precarious the positioning was between staying and (thinking of) leaving. Any one of the features identified in the report, except for the leavers at the extreme end of the spectrum, was not enough to tip a worker from staying to leaving. It is unclear how many of the negative features need to be present before child and family social workers decide it is time to move on, or what combination of factors need to be present to retain them, and this will be explored in future years of the study.

19
1 Introduction In 2018, the Department for Education (DfE) commissioned a consortium led by IFF Research, working with social work academics at Manchester Metropolitan University and the University of Salford, to conduct a major new longitudinal study tracking the careers of local authority child and family social workers. This report covers the first year (Wave 1) of the survey and follow-up qualitative research, setting out the current picture on social workers’ employment backgrounds and current experiences, their views on a range of issues including overall job satisfaction and career progression, and their career plans for the next 12 months. As well as offering valuable insights into the current working lives of child and family social workers, the report provides a baseline for future longitudinal analysis.
In this chapter we set out the background to this research and summarise its aims and objectives. We then provide an outline of the methodology for Wave 1 of the study, before discussing the structure of the report.
Background The latest Department for Education (DfE) child and family social work workforce data3 shows there were 31,720 child and family social workers employed by local authorities (LAs) at the 30 September 2018, of whom 29% were aged 50 or over, suggesting high levels of upcoming replacement demand. The staff turnover rate was 16% (based on headcount), up slightly from 15% the previous year. The number of reported vacancies was 5,810 (full-time equivalents), similar to the previous year. The national vacancy rate of 16% (based on full-time equivalents) remained stable, but there were large regional variations: Yorkshire & Humberside had the lowest vacancy rate at 6% and London the highest at 26%.
In 2013 Baginsky (2013) stated that poor retention in social work results in a workforce with insufficient numbers of experienced staff capable of dealing with the complexity of the work, and of providing appropriate leadership and support to less experienced colleagues. High staff turnover impacts upon service provision; may affect public confidence; limits opportunities for individual and organisational learning; and offers a low return on investment in social work education (RiP, 2015).
It is during qualifying education that social work students build upon their initial commitment to the profession (Collins, 2016). Professional commitment is one factor said to predict intention to leave a role, along with organisational commitment, burnout and job
3DfE Children's social work workforce data 2018

20
satisfaction, (Mor Barak, Nissly & Levin, 2001), and consequently social work education has an important role in laying strong foundations for students’ futures in the profession.
Since 2007 there have been a series of reforms in social work education and training, intended to improve the quality of recruitment, to better prepare students for social work practice and increase retention. Two postgraduate accelerated routes have been introduced in child and family social work - Step Up to Social Work, in 2010, and Frontline, in 2013. While early evaluations of Step Up and Frontline are generally positive (Maxwell, Scourfield et al 2016), these programmes have not been running for long enough to determine their impact on longer term retention. Findings from a longitudinal study of Step Up to Social Work found that 85% of Cohort 1 graduates were still practising in child and family social work three years after qualifying and 73% five years after (Smith et al, 2018).
Giving students a more ‘realistic’ view of what social work practice will be like has been highlighted as a possible way of improving retention (Webb & Carpenter, 2012), with implications for the engagement of employers in social work education (McLaughlin, Shardlow et al. 2010). The Social Work Reforn Board (2010, 2012) recommended a professional capabilities framework that would be useable at all levels from student to senior practitioner. This has since been supplemented by the 10 key knowledge and skills areas for child and family practitioners (DfE, 2014).
The DfE workforce statistics (2019) indicate that 68% (FTE) of children and family social workers leaving within the reference year had been in service in their local authority for less than five years (up from 63% the previous year). Evaluations of the Newly Qualified Social Worker and Early Professional Development pilot schemes, which developed into the current Assessed and Supported Year in Employment (ASYE), suggest that targeted programmes to support new workers may help to boost retention (Carpenter et al, 2012; Blewett et al 2013). However, there is currently a lack of longitudinal robust and reliable evidence on recruitment, retention and progression among child and family social workers. The DfE workforce statistics data presents experimental data, and is not yet capturing the impact of new initiatives; the reasons why people leave their job; or indeed, whether they leave social work altogether.

21
Aims and objectives The aim of this landmark new longitudinal study is therefore to collect robust evidence on recruitment, retention and progression in child and family social work. In particular it aims to establish a much stronger understanding of recruitment issues, career pathways, choices and decisions and how these differ according to demographics (age, gender, ethnicity etc), different entry routes, roles and responsibilities, region, LA performance and local labour markets.
Within this, the specific study objectives are to:
• Explore what attracted respondents to child and family social work and how they feel their training path (and ASYE) have prepared them for this career.
• Investigate career aspirations, change over time and between different roles.
• Distinguish how the experience of performance management, CPD (and, in the longer-term, Knowledge and Skills Statements) impact on retention and progression.
• Identify specific issues facing particular groups (e.g. people from Black and Minority Ethnic (BME) backgrounds, those with caring responsibilities, returners).
• Explore whether these issues impact similarly across different roles and practice areas within children’s services.
• Understand pull and push factors that influence social workers remaining in post, moving within children’s services or leaving the profession.
• Find out where social workers go when they leave and why.
For the purposes of the study, a child and family social worker is defined as a qualified social worker registered with the Health and Care Professions Council (HCPC), working in a local authority or Children’s Trust4, in a children’s services department or (if working in an authority where the services are joined up) a social worker that works exclusively on children and families work. This includes social workers regardless of their position in the organisation, i.e. at all levels of seniority and in all relevant areas of practice. Agency social workers employed in local authorities were also included. Social workers on secondment to Regional Adoption Agencies were also included within the scope of the research.
4 Where we refer to local authorities in the remainder of this report this includes Children’s Trusts.

22
Methodology The study comprised three core components:
• Preliminary face-to-face qualitative interviews with 25 child and family social workers in five different local authorities, to explore issues around recruitment and retention and inform questionnaire development;
• A longitudinal mixed-methods online and telephone survey of child and family social workers, to be conducted across five years (with 2018/19 being the first year, or Wave 1, conducted between November 2018 and March 2019) – including an extensive pilot phase in September-October 2018;
• At the end of each survey wave, 40 follow-up qualitative telephone interviews with a structured sample of ‘stayers’ and ‘leavers’ – defined as those who indicated that they planned to stay in local authority child and family social work over the next 12 months, and those who indicated they were planning to leave (in Wave 1 only – in subsequent waves, the ‘leavers’ sample will comprise actual leavers).
In order to build a sample of local authority child and family social workers, IFF wrote to Directors of Children’s Services in all 152 local authorities/ Children’s Trusts in England to invite them to take part in the research. Ninety-five local authorities/ Children’s Trusts agreed to participate in the study (approximately two-thirds of all local authorities/ Trusts in England, providing a good spread by region and Ofsted rating) – see Tables A.1 to A.3 in Appendix 1. Areas took part either by providing a census of their in-scope staff work email addresses, and in some cases work telephone numbers (via a secure transfer site), or by sending out an open link to their in-scope staff on our behalf. Where sample was provided direct to IFF it was possible to send an individualised survey link, targeted reminders, and (where a work phone number was provided) to conduct a final top-up survey using Computer Assisted Telephone Interviewing (CATI). Where the survey was conducted using an open link, the relevant local authorities were asked to send out reminders to staff, but these could not be targeted at non-responders and therefore were less frequent.
The survey design adopted a “unimode” approach and online and CATI data collection was conducted using the Dimensions platform, which means the data from both modes is integrated on one system for reduction and analysis. The survey data was largely in line with population statistics in the DfE workforce data collection (see Table A.7 in Appendix 1). It was weighted to correct for minor differences in the achieved profile of the sample and the population according to the latest DfE census return on the following two variables: whether or not the social worker was directly employed by their local authority or employed through an agency; and by region.
The sample outcomes and response rates are shown in the tables overleaf. It is difficult to calculate an exact response rate as the survey was only distributed directly to relevant

23
social workers in around two-thirds of the local authorities which took part in the study: in the remainder, the local authorities distributed the survey themselves and we can only estimate how many social workers they sent this to, based on the DfE’s published workforce statistics on headcount by local authority. Using this, combined with what we know about the exact number of leads provided in the local authorities which provided direct sample, the estimated overall response rate to the survey is 27%. This varied from 33% of direct sample (who we were able to telephone as well as email) to 15% who responded via the open link emailed to them by their own local authority (see Table 1.2).

24
Table 1.1: Responses by local authority region and Ofsted rating
Sampled responses Open-link responses Sampled & open link TOTAL
Online [valid emails
provided]
Telephone [approached via
telephone]
Total sampled response
[Online and telephone]
Online [Anticipated: social
workforce 2017 data]
Anticipated population
[social workforce 2017 data]
Overall 3,000 1,411 4,411 1,177 5,588
Region
North East 275 128 403 23 426
North West 250 144 394 86 480
Yorks and Humber 107 17 124 284 408
East Midlands 394 201 595 39 634
West Midlands 353 80 433 41 474
East of England 380 118 498 281 779
South East 549 232 781 124 905
South West 181 113 294 127 421
Greater London 511 378 889 172 1,061
Ofsted
Outstanding 15 14 29 0 29
Good 1,252 717 1,969 691 2,660
Req. improvement 1,289 517 1,806 416 2,222
Inadequate 444 163 607 70 677

25
Table 1.2: Response rates by local authority region and Ofsted rating
Sampled responses Open-link responses Sampled & open link TOTAL
Online [valid emails
provided]
Telephone [approached via
telephone]
Total sampled response
[as % of anticipated population from social workforce
2017 data]
Online [Anticipated: social
workforce 2017 data]
Anticipated population
[social workforce 2017 data]
Overall 23% 24% 33% 15% 27%
Region North East 22% 21% 30% 16% 28%
North West 21% 21% 30% 7% 19%
Yorks and Humber 20% 16% 17% 23% 21%
East Midlands 28% 25% 43% 9% 35%
West Midlands 18% 19% 22% 9% 20%
East of England 26% 28% 34% 28% 32%
South East 26% 25% 35% 11% 27%
South West 23% 21% 44% 17% 29%
Greater London 20% 28% 39% 14% 30%
Ofsted Outstanding 16% 21% 23% - 23%
Good 25% 27% 38% 17% 29%
Req. improvement 22% 22% 30% 16% 26%
Inadequate 20% 21% 28% 7% 21%

26
The structure of this report This report is structured as follows:
• Chapter 2 outlines the main demographic characteristics of the sample;
• Chapter 3 focuses on entry routes into local authority child and family social work, including motivations for entering the profession;
• Chapter 4 details current employment and provides an overview of career histories, in terms of length of time employed in the profession altogether, and any prior work experience;
• Chapter 5 explores workplace well-being, including reported caseloads, and experiences of work-related stress;
• Chapter 6 focuses on social workers’ views about loyalty to and feeling valued by their employer, views on their relationship with their line manager, and their working environment more generally;
• Chapter 7 looks at various aspects of job satisfaction, and overall satisfaction with their current job;
• Chapter 8 explores views on career progression to date, and perceptions of the enablers and barriers to career progression; and
• Chapter 9 discusses short-term career plans (in the next 12 months) and reasons for wanting to leave social work, including what measures might encourage people to stay (or return).
Throughout the report, the survey and qualitative data are reported by theme/ topic area as far as possible, making it clear which findings are based on the survey and which are drawn from the qualitative research. Only statistically significant survey findings (at the 95% confidence interval) are reported.

27
2 Who works in local authority child and family social work? This chapter examines the demographic profile of the social workers who participated in the study, looking specifically at gender; age; ethnicity; disability; and caring responsibilities, and how these inter-relate.
Gender and age The vast majority of social workers who participated in the survey were female (82%). One in six were male (16%) – the remainder did not answer the question, identified as ‘Other’ or chose not to answer the question (1%). This reflects the population of local authority child and family social workers from 20185, where 86%6 of social workers were women and the remainder (14%) were men (based on headcount).
Social workers were evenly distributed by age band, with around a quarter aged either 34 or under (25%); 35 to 44 (26%); or 45 to 54 (27%). The proportion aged 55 to 64 dropped to 20%, possibly as people take early retirement. Although no direct comparison between our sample and the DfE social work workforce statistics can be made7, the majority (79%) of social workers were aged between 30 and 60 years old, which is broadly reflected in the survey’s age profile.
The proportion of male social workers was higher among:
• agency workers (25% of agency-employed social workers were male compared with 15% of LA-employed social workers);
• White non-British (29%) and Black African/ Caribbean/ British social workers (23%), compared with 15% among White British social workers; and
• social workers aged 45 or over (20% male compared with 13% of those aged under 45).
Figure 2.1 below shows the age profile of respondents by gender. It is notable that as the age profile increases there is an increasing proportion of men (albeit they remain in the minority). This may suggest that more women leave the profession in mid-career, leading to a reduced gender difference among the older age groups.
5 DfE Children’s social work workforce data 2018 6 Full-time equivalent 7 Age band categories are different across the workforce statistics and the survey. In the workforce statistics, these are: 20-29 years old; 30-39 years old etc. In the survey, they were 34 years old or under; 35-44 years old etc.

28
Figure 2.1: Age profile of social workers who participated in the survey, overall and by gender
2%
23%
26% 27%
20%
1%1%
18%
23%
31%*
24%*
1%3%*
25%* 26%* 26%
19%
1%
<25 years 25-34 years 35-44 years 45-54 years 55-64 years 65+ years
All Male FemaleBase: All respondents (all= 5,621; <25 years: 145; 25-34 years: 1,389; 35-44 years: 1,465; 45-54 years: 1,457; 55-64 years: 1,043; 65+ years: 59) * denotes a significant difference from the average
Respondents from the South West were more likely than the average to be aged between 55-64 years old (25%, compared with the 20% average), suggesting that future replacement demand due to retirement will be higher in that region than elsewhere. Those in London and the North East were more likely to be between 35-44 years old (31% for both compared with the 26% average).
Ethnicity Three quarters of social workers who responded to the survey were White British (73%) (and 76% were White, overall), with the next largest groups Black African (7%) and Black Caribbean (3%) (11% were Black/ Black British, overall). Three per cent were Asian/ Asian British, with two per cent from an ‘other’ ethnic group. This is fairly similar to the workforce population figures, with two thirds (65%) being White and one in 10 (10%) being Black, although a relatively high proportion of ‘unknown’ in the workforce statistics (17%, compared with 5% in the survey) means that these comparisons should be treated with caution. Excluding all unknown responses, 81% of respondents in the survey were White, compared with 79% in the workforce statistics, and 10% were Black, compared with 11% in the workforce statistics.
29
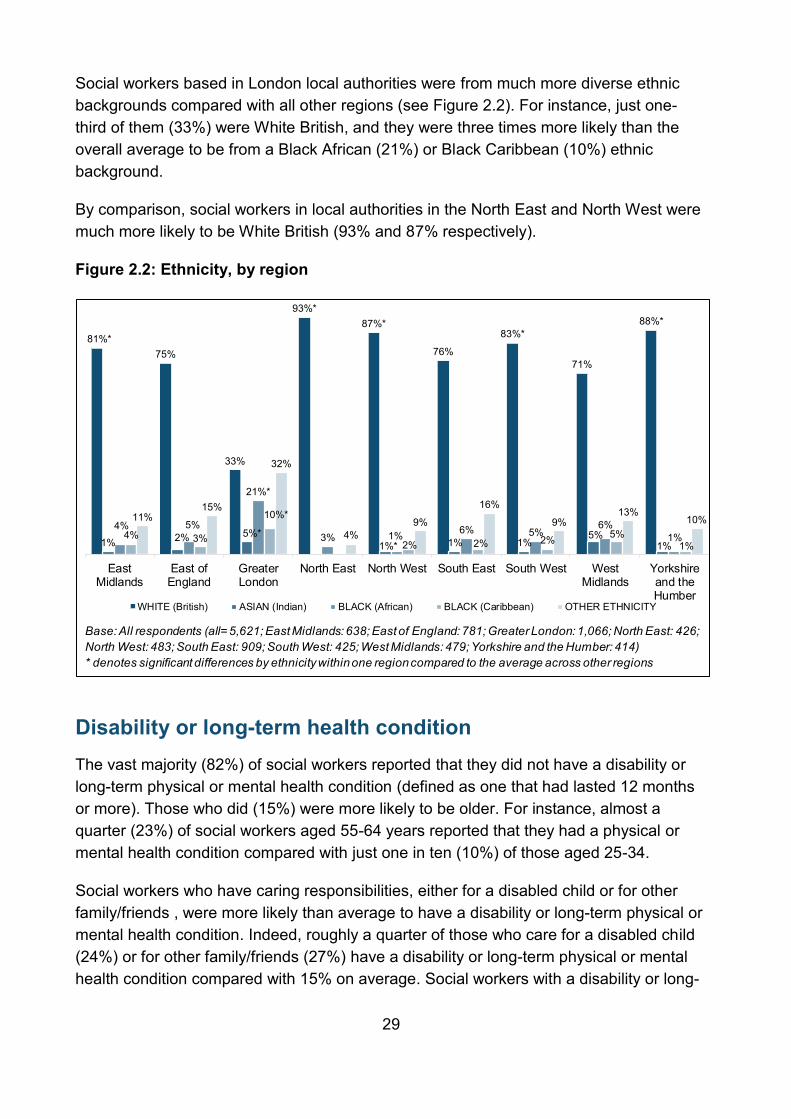
Social workers based in London local authorities were from much more diverse ethnic backgrounds compared with all other regions (see Figure 2.2). For instance, just one-third of them (33%) were White British, and they were three times more likely than the overall average to be from a Black African (21%) or Black Caribbean (10%) ethnic background.
By comparison, social workers in local authorities in the North East and North West were much more likely to be White British (93% and 87% respectively).
Figure 2.2: Ethnicity, by region
81%*75%
33%
93%*87%*
76%
83%*
71%
88%*
1% 2% 5%*1%* 1% 1%
5%1%
4% 5%
21%*
3% 1% 6% 5%6%
1%4% 3%
10%*
2% 2% 2% 5%1%
11%15%
32%
4%9%
16%
9%13%
10%
EastMidlands
East ofEngland
GreaterLondon
North East North West South East South West WestMidlands
Yorkshireand theHumber
WHITE (British) ASIAN (Indian) BLACK (African) BLACK (Caribbean) OTHER ETHNICITY
Base: All respondents (all= 5,621; East Midlands: 638; East of England: 781; Greater London: 1,066; North East: 426; North West: 483; South East: 909; South West: 425; West Midlands: 479; Yorkshire and the Humber: 414)* denotes significant differences by ethnicity within one region compared to the average across other regions
Disability or long-term health condition The vast majority (82%) of social workers reported that they did not have a disability or long-term physical or mental health condition (defined as one that had lasted 12 months or more). Those who did (15%) were more likely to be older. For instance, almost a quarter (23%) of social workers aged 55-64 years reported that they had a physical or mental health condition compared with just one in ten (10%) of those aged 25-34.
Social workers who have caring responsibilities, either for a disabled child or for other family/friends , were more likely than average to have a disability or long-term physical or mental health condition. Indeed, roughly a quarter of those who care for a disabled child (24%) or for other family/friends (27%) have a disability or long-term physical or mental health condition compared with 15% on average. Social workers with a disability or long-
30
term health condition were also more likely to be employed directly by local authorities (16%) or on a self-employed/ freelance basis (20%) rather than through an agency (9%).
By region, the proportion of social workers with a physical or mental health condition varied widely, ranging from one in five in Yorkshire and the Humber (20%) to one in nine in London (11%). This in part reflects age, as London also had the lowest proportion of social workers aged 55-64 or above (15%).
Caring responsibilities Just over half (52%) of social workers had some form of childcare or other caring responsibilities. They were most likely to care for school-aged children (34% of all social workers), followed by caring for other family members or friends (13%) and caring for pre-school aged children (11%). A minority cared for children with disabilities (2%).
Social workers in the 35-44 age group were the most likely to have some form of caring responsibilities (only 25% did not have any). Three in five of this age group had school-aged children (61%) and one in five (19%) had younger children who had not yet started school. Social workers aged 45 to 54 and 55 to 64 were the most likely to be looking after other family or friends (19% and 22% respectively) whereas those aged under 25 were the least likely to have any caring responsibilities at all, as might be expected (89% said they had none).
Notably, men were more likely than women to report they had any caring responsibilities at all (55% compared with 50%) and in particular were more likely to report caring responsibilities for school-aged children (39%, compared with 33% of women) or pre-school aged children (16%, compared with 11%). Women were more likely than men to have caring responsibilities for other family or friends (14%, compared with 10%).
The contrast between male and female caring responsibilities was particularly pronounced within the older age categories (45-54 years; 55-64 years; 65 years and over). Men were significantly more likely than women in these age categories to have some form of caring responsibilities (54% of men compared with 47% of women).
Working on a part-time contract was linked with having caring responsibilities. For instance, around eight in 10 (82%) social workers who were contracted to work between 16 and 20 hours per week had some form of caring responsibilities, compared with fewer than half (47%) of those contracted to work between 36 and 40 hours per week. A greater proportion of women worked part-time in comparison to men (22% of women worked part-time – less then 36 hours per week – compared with 16% of men), suggesting gender and contract type are connected to caring responsibilities independently.

31
Respondents with caring responsibilities were also more likely to work in certain areas of child and family social work. For instance, those working in services for children with disabilities (5%) were significantly more likely than the average (2%) to be caring for a child or children with disabilities themselves. And those in prevention and early help services (15%) were significantly more likely than the average (11%) to be caring for a pre-school aged child or children.
32
3 Entry routes into local authority child and family social work An important part of the research was to explore what attracted people into child and family social work as a career and how well they felt their entry routes prepared them for working in the profession. This chapter explores:
• motivations for becoming a child and family social worker;
• qualification entry routes into the profession and their perceived effectiveness in terms of how well-prepared people felt for the role;
• whether social workers came straight into the profession after qualifying; and
• experiences of the Assessed and Supported Year in Employment (ASYE).
Motivations for becoming a social worker Social workers were asked why they wanted to work in the profession, and (if they gave multiple reasons) what was their one main motivation. As shown in Figure 3.1, reasons for entering the profession centred on altruism/wanting to make a difference (a factor for 67% of social workers, and the main reason for 46%) and wanting to work with children (a factor for 58%, the main reason for 18%). The qualitative research found that the origin of this impulse to help others varied, but was related to a combination of personal values, education and personal experiences.
Another fairly common factor was having worked in a related area previously, such as health and social care or education (a factor for 36% of social workers, and the main reason for 13%). In the qualitative research, several people had studied health and social care post-16, and had moved on from there into employment in the sector and subsequently to social work qualifying programmes.
When I was about 19 I got a job as a support worker…And then, you just drift along don’t you? And then…in 2011 I did the Access course and in 2012 I started at university [Leaver 32]
Amongst those who had been employed in the health and social care sector before becoming social workers, most had worked with children and families in some capacity. A common theme in their accounts of why they decided to qualify was their view that as qualified social workers they would be able to do more, or to work differently, to bring about change for children and families than was possible in their previous roles.
It was a natural transition for me to go into social work and work with the whole family and not just the young person [Leaver 29]

33
I worked in schools previously and I was a pastoral leader, so I was working with some aspects of social work and I wanted a profession that would allow me to work at a deeper level with young people. [Stayer 11]
The qualitative interviews found that career-changers came from diverse backgrounds including teachers, youth workers, midwives, and counsellors.The catalyst to make the move into social work included redundancy and funding cuts, and dissatisfaction in their roles, related to a desire to work with people in a different way.
Figure 3.1: Reasons for embarking on a career in social work
Base: All respondents (5,621).
67%
58%
36%
28%
21%
9%
19%
21%
4%
5%
12%
6%
46%
18%
13%
5%
3%
3%
2%
2%
1%
1%
1%
3%
1%
I wanted to help people / make a difference
I wanted to work with children and families
I was working in a related area (e.g. a youth worker)
I have a long-term commitment to social work as a career
It aligns with my political or ideological beliefs
I had a positive personal experience of social work
Funding/bursary was available for the course
I wanted a stable job
I saw it as a springboard to another career
I had a negative personal experience of social work
I wanted a decent salary
Other
Don't know / prefer not to say
Reason forembarking oncareer
Main reason forembarking oncareer
Other motivations for becoming a social worker which were frequently reported as a factor in their decision, but were rarely the primary reason, included: having a long-term commitment to social work as a career, it aligning with their political or ideological beliefs, and wanting a stable job.
One in seven social workers were motivated to start their career, at least in part, by either a positive or negative past experience of social work themselves (14% in total mentioned this as a factor in their decision to become a social worker: 9% having had a positive personal experience in the past, and 5% having had a negative one and 1% having experienced both). The qualitative research highlighted that some entrants were motivated by personal experience of vulnerability or disadvantage, either their own or that of close relatives, or of growing up with foster children in their family. This group was more likely to have encountered social workers in their professional capacity, and to have

34
some awareness of their role and responsibilities. For some people, these experiences had influenced their education or employment/career choices from quite an early stage.
My parents…became qualified as foster carers when I was a teenager so I’d been introduced to this idea of this world of social work and this idea that there are children out there that can’t live with [their] families. [Leaver 31]
My dad was a looked-after child. So, we often had conversations about his early life experiences….I came out of university and there was a shortage of graduate jobs so I thought it could be an option….. as soon as I started doing placements ...realised that it was kind of the role for me. [Stayer19]
Qualification routes into the profession Social work is a degree level profession, but there are currently a number of pathways through which people can achieve the undergraduate or postgraduate qualification which will allow them to apply for registration as a qualified social worker.
All social workers were asked about the qualification they took to enter the profession, i.e. the qualification(s) that first enabled them to register as a social worker (multicode responses were possible). By far the most common entry route was a university degree, either an undergraduate (46%) or a postgraduate (31%) degree in social work (Figure 3.2). A Diploma in Social Work (DipSW) (19%) and the Certificate of Qualification in Social Work (CQSW) (8%) were less common, while only a very small proportion entered through work-based programmes such as the Step Up to Social Work (3%) or the Frontline programme (1%), as might be expected given their relatively recent introduction and small scale.
The type of qualification route differed by seniority of job role, age and length of time in the profession. For example, those who were still undertaking an ASYE and front line practitioners were more likely to have entered through an undergraduate degree (52% of ASYE and 49% of front line practitioners, compared with 46% on average), while those in more senior positions were more likely to have a CQSW or a DipSW. For example, 35% of service managers, 32% of team managers and 31% of practice leaders had first qualified as a social worker by completing a DipSW (compared with 19% on average) while 27% of senior service managers or directors had a CQSW compared with 8% on average. Similar patterns were apparent in terms of length of time in the profession. This reflects the fact that the CQSW and DipSW are historic qualifications that have subsequently been replaced by social work degrees.
That said, agency-employed social workers were more likely to have entered the profession through an undergraduate degree than those employed directly by a local authority (52% compared with 45%), despite the older age profile of agency workers.

35
Figure 3.2: Entry route into child and family social work
46%
31%
19%
8%
3%
1%
1%
3%
An undergraduate degree in social work (e.g. BSc or BA)
A postgraduate degree in social work (e.g. PGDip/MSc/MA)
Diploma in Social Work (DipSW)
Certificate of Qualification in Social Work (CQSW)
The 'Step Up to Social Work' programme
Other employment-based programme (e.g. Ready for Practice)
The 'Frontline' programme
Other
Base: All respondents (5,621)
The qualitative interviews covered a range of qualifying programmes, and highlighted the importance of work-based training routes as an entry point into the profession, in particular for people who wanted to re-train but who could not afford or did not want to go back into full-time study:
The Step Up programme came out …..So , I would never really have got into it without that. I’d always wanted to, but I’d, kind of, got to the point where I then couldn’t afford to go back and study. I’d looked into it a few times. So, yes, then I got on that. [Stayer 17]
Analysis of qualification grade is complicated by the range of different types and levels of qualifications and their differing classification systems. Of those who entered their career with an undergraduate social work degree, around half (48%) had passed with a 2.1 classification, with one-quarter who passed with a 2.2 (24%) and one in seven who gained a first (15%).
Looking at those who started in social work with a postgraduate social work degree, there is a wider range of classifications, with the most common being a pass (30%) or merit (27%). One in ten (11%) gained a distinction. People who qualified through Step Up to Social Work were more likely than other entrants with a postgraduate degree in social work to have gained a distinction (18%) while people who qualified through Frontline were more likely to have gained a merit (49%) than other postgraduate entrants.
36
Social workers were also asked the institution they were registered at for their first social work qualification. Insitutions were then coded into ‘high’, ‘medium’ and ‘low’ UCAS tariff8 based on the ranking of the institution9. The UCAS tariff is a measure of prior attainment which is used in the university admissions process and is an indicator of the selectivity of an institution. It should be noted that this analysis was only possible for institutions which are still operational and which are based in England, and also that tariffs can change over time: the analysis was based on current rankings only, even if the social worker attended the institution several years ago. Findings indicate that the social workers who responded to the survey most commonly attended low (41%) or medium (36%) ranking institutions; just over two in ten (23%) attended a ‘high’ ranking institution.
Entry route also differed by UCAS tariff level of the institution where the social worker studied. Those who studied at an institution with a ‘high’ tariff ranking were more likely to have taken a postgraduate qualification (61% compared with 28% of those at ‘medium’ tariff and 22% of those at ‘low’ tariff institutions) or to have done a CQSW (11% compared with 8% at ‘medium’ and 6% at low tariff institutions). Conversely, those who entered the profession through an undergraduate degree were most likely to have attended an institution with a ‘low’ (53%) or ‘medium’ (50%) tariff (compared with 46% on average).
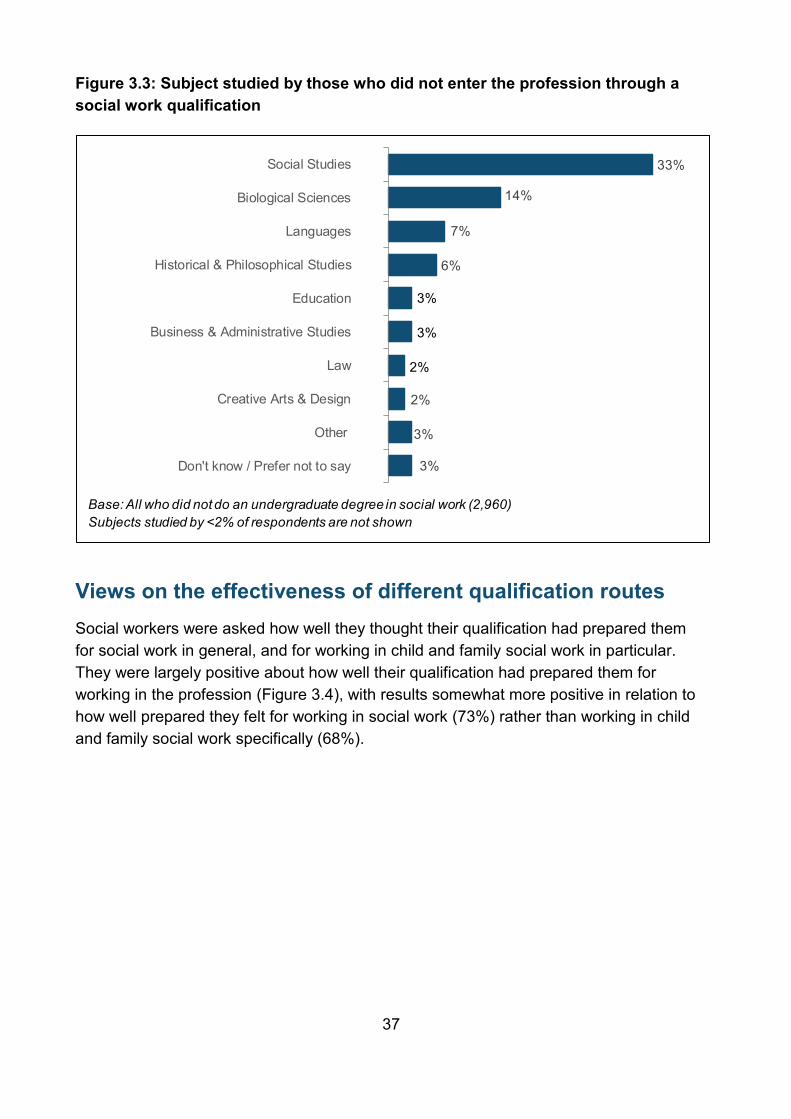
For those who had not entered the profession through an undergraduate degree in social work (around half – 53% of respondents), it was most common that they had studied a subject within social studies (33%), for example psychology or sociology. As shown in Figure 3.3, the most common subjects other than social studies were Biological Sciences (14%), Languages (7%), and Historical and Philosophical studies (6%).
8 By tariff level, we mean the average number of A-level or equivalent 16-18 qualification ‘points’ a typical entrant to that institution has. 9 Tariff level was assigned using the same approach taken in IFF’s evaluation of the Teaching Excellence Framework (TEF).
37
Figure 3.3: Subject studied by those who did not enter the profession through a social work qualification
33%
14%
7%
6%
3%
3%
2%
2%
3%
3%
Social Studies
Biological Sciences
Languages
Historical & Philosophical Studies
Education
Business & Administrative Studies
Law
Creative Arts & Design
Other
Don't know / Prefer not to say
Base: All who did not do an undergraduate degree in social work (2,960)Subjects studied by <2% of respondents are not shown
Views on the effectiveness of different qualification routes Social workers were asked how well they thought their qualification had prepared them for social work in general, and for working in child and family social work in particular. They were largely positive about how well their qualification had prepared them for working in the profession (Figure 3.4), with results somewhat more positive in relation to how well prepared they felt for working in social work (73%) rather than working in child and family social work specifically (68%).

38
Figure 3.4: Social workers’ views on how well they felt their entry route into social work prepared them for social work
Career in social work
Career in child and family social work
24%
21%
7%
6%
46%
50%
22%
24%
Not very well Quite well Very well
Base: All respondents who indicated their entry route into social work (5,619)
73%
68%
Well (%)
Not at all well
Figure 3.5 shows that social workers who entered the profession after doing an undergraduate social work degree were least positive about the extent to which their qualification prepared them for social work generally and the extent to which it prepared them for child and family social work specifically. However, the majority of them still felt quite or very well prepared (70%). For example, 70% of those who first qualified with an undergraduate social work degree reported this prepared them well for a career in social work, compared with 75% of those who first qualified with a postgraduate social work degree, and 75% who undertook a Diploma in Social Work. This rose to 89% of those who entered the profession via Step Up to Social Work and 94% who entered via the Frontline programme, both relatively recent training routes.

39
Figure 3.5: Social workers’ views on how well they felt their entry route prepared them for social work, by entry route
An undergraduate degree in social work
A postgraduate degree in social work
The 'Step Up to Social Work' programme
The 'Frontline' programme
Certificate of Qualification in Social Work (CQSW)
Diploma in Social Work (DipSW)
Other employment-based programme
24%*
19%
8%
4%*
17%*
18%*
12%
6%
5%
3%
2%
3%*
6%
3%*
49%
52%*
52%
43%
51%
50%
32%*
21%*
23%
37%*
51%*
28%*
25%
51%*
Not very well Not at all well Quite well Very well
70%*
Well (%)
75%
89%*
94%*
80%*
75%
82%
Base: All respondents who indicated their entry route into social work (all=5,619; undergraduate degree: 2,632; postgraduate degree: 1,723; Step Up to Social Work: 149; Frontline programme: 82; CQSW: 430; DipSW: 1,062; Other: 80)* denotes a significant difference from the average
Figure 3.6 shows that those who study Education as an undergraduate degree were the most positive about how well their entry route had prepared them for a career in social work (91% reported it had prepared them well compared with 73% on average). They were closely followed by those who had studied on a creative arts and design degree (89%). Patterns by university tarrif were unclear, with those who studied their social work qualification at a medium tariff institution significantly less likely to report that their entry route had prepared them well than those from either low tariff or high tariff institutions (70% of those who studied at a medium tariff institution compared with 74% who studied at a low tariff and 75% who studied at a high institution).

40
Figure 3.6: Social workers’ views on how well they felt their entry route prepared them for social work, by undergraduate subject
21%
7%
8%*
13%
19%
18%
15%
22%
19%
19%
19%
17%
6%
2%
4%
6%
1%*
3%
6%
4%
5%
6%
7%
50%
55%
61%
52%
58%*
54%
54%
55%
47%
50%
49%
45%
24%
36%*
27%
28%
22%
25%
25%
23%
29%
25%
27%
29%
Not very well Not at all well Quite well very well
Base: All able to recall their entry route into social work (5,619) Education (86), Creative arts & design (54), Law (61), Historical and philosophical studies (174), Languages (197), mass comms. & documentation (38), Subjects allied to medicine (36), business & admin. Studies (69), social studies (968), biological sciences (432). • denotes a significant difference from the average• ** subjects with a base <25 are not shown
Well (%)
91%*
89%*
81%
80%*
80%*
80%
78%
76%
76%
75%
Education
Creative arts & design
Law
Historical & philosophical studies
Languages
Mass comms. & documentation
Subjects allied to medicine
Business & admin. studies
Social studies
Biological sciences
No UG degree
All
75%
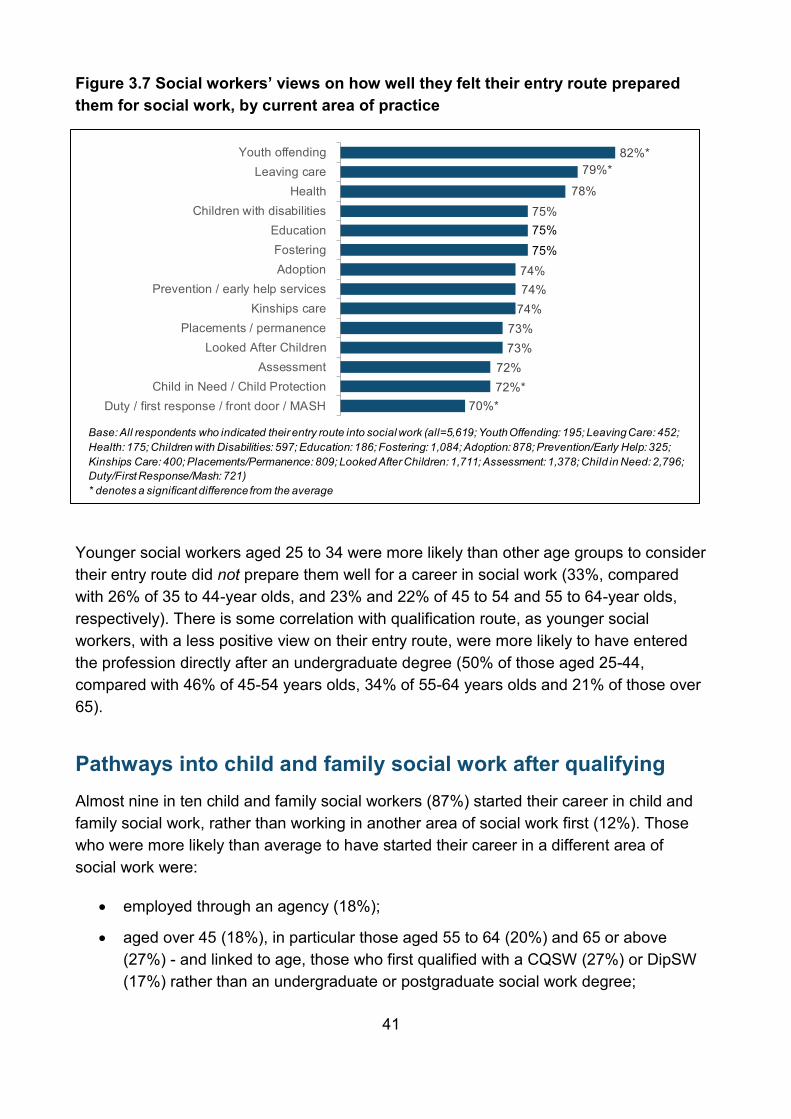
Differences by area of practice are explored in Figure 3.7. Social workers in youth offending (82%) and leaving care (79%) were more likely to report that they felt prepared for a career in social work than those in other areas, whereas those working in duty/first response/ ‘front door’/ MASH services (70%) and child in need/child protection (72%) felt least prepared. Similar patterns apply when considering how well-prepared people felt for a career in child and family social work specifically. That said, those in child in need/child protection did not emerge as significantly different from the average, whereas those in Assessment did emerge as significantly less likely to report that they felt well prepared.
41
Figure 3.7 Social workers’ views on how well they felt their entry route prepared them for social work, by current area of practice
Base: All respondents who indicated their entry route into social work (all=5,619; Youth Offending: 195; Leaving Care: 452; Health: 175; Children with Disabilities: 597; Education: 186; Fostering: 1,084; Adoption: 878; Prevention/Early Help: 325; Kinships Care: 400; Placements/Permanence: 809; Looked After Children: 1,711; Assessment: 1,378; Child in Need: 2,796; Duty/First Response/Mash: 721)* denotes a significant difference from the average
82%*79%*
78%75%75%75%
74%74%
74%73%73%
72%72%*
70%*
Youth offendingLeaving care
HealthChildren with disabilities
EducationFosteringAdoption
Prevention / early help servicesKinships care
Placements / permanenceLooked After Children
AssessmentChild in Need / Child Protection
Duty / first response / front door / MASH
Younger social workers aged 25 to 34 were more likely than other age groups to consider their entry route did not prepare them well for a career in social work (33%, compared with 26% of 35 to 44-year olds, and 23% and 22% of 45 to 54 and 55 to 64-year olds, respectively). There is some correlation with qualification route, as younger social workers, with a less positive view on their entry route, were more likely to have entered the profession directly after an undergraduate degree (50% of those aged 25-44, compared with 46% of 45-54 years olds, 34% of 55-64 years olds and 21% of those over 65).
Pathways into child and family social work after qualifying Almost nine in ten child and family social workers (87%) started their career in child and family social work, rather than working in another area of social work first (12%). Those who were more likely than average to have started their career in a different area of social work were:
• employed through an agency (18%);
• aged over 45 (18%), in particular those aged 55 to 64 (20%) and 65 or above (27%) - and linked to age, those who first qualified with a CQSW (27%) or DipSW (17%) rather than an undergraduate or postgraduate social work degree;
42
• based in Greater London (16%); and
• men (17% compared with 12% of women).
The qualitative interviews found that most stayers and leavers had taken their first social work posts in children and families work as this had been the focus of their final placement, and many obtained jobs in the local authority in which they had been placed as students.
Experiences of the Assessed and Supported Year in Employment (ASYE) The Assessed and Supported Year in Employment (ASYE) was introduced in 2012 as a way to better support newly qualified social workers into the profession. Across England around 2,800 people start the ASYE in child and family social work each year. Almost two-fifths (39%) of social workers who participated in this research had completed an ASYE and a further 6% were currently in their ASYE.
Perceptions about the usefulness of the ASYE varied among those who had completed it (Figure 3.8); around two thirds (65%) found the ASYE useful (24% very useful and 41% fairly useful) while around one third (35%) did not.
The amount of supervision received also appeared to impact upon the perceived usefulness of the ASYE (71% of those who received supervision at least once every three or four weeks reported that they found the ASYE useful compared with 61% who received supervision once every five weeks or less).
Other differences include:
• Those who qualified by doing an undergraduate or postgraduate degree in social work found doing the ASYE more useful than those who qualified through Step Up to Social Work or the Frontline programme (66% and 65%, compared with 56% and 39% respectively).
• By region, social workers at local authorities in the East of England (71%) were most likely, and those at local authorities in the North East (54%) were least likely to find their ASYE useful. There was no clear correlation with Ofsted rating.
• Social workers who had recently completed their ASYE were most likely to view it positively: 74% of those who had been working in child and family social work for one year thought the ASYE was useful, compared with 65% of all social workers who had completed an ASYE.
The qualitative research identified a definite shift in perception among some social workers who began to feel less positive about the role as they moved out of the ASYE,

43
and encountered more of the ‘reality’ of the job in terms of workload pressures and paperwork:
My ASYE year […] was probably the most productive year, and the only year where I was actually able to do the things I came into social work to do [Leaver 36]
Figure 3.8: Perceived usefulness of the ASYE
24%
18%*
27%
20%
27%
11%
8%
12%
8%
11%
41%
46%
37%*
42%
41%
24%
28%
24%
29%*
20%
Not very useful Fairly useful Very useful
Base: All respondents who had completed an ASYE (all=2,134; 1 year in CAFSW: 212; 2-3 years in CAFSW: 613; reflective supervision at least every 3-4 weeks: 2,168; reflective supervision every 5-6 weeks or less: 1,640)* denotes a significant difference from the average
Not at all useful
All
1 year in CAFSW
2-3 years in CAFSW
Receive reflective supervision at least every 3-4 weeks
Receive reflective supervision every 5-6 weeks or less
65%
Useful (%)
74%*
62%
71%
61%
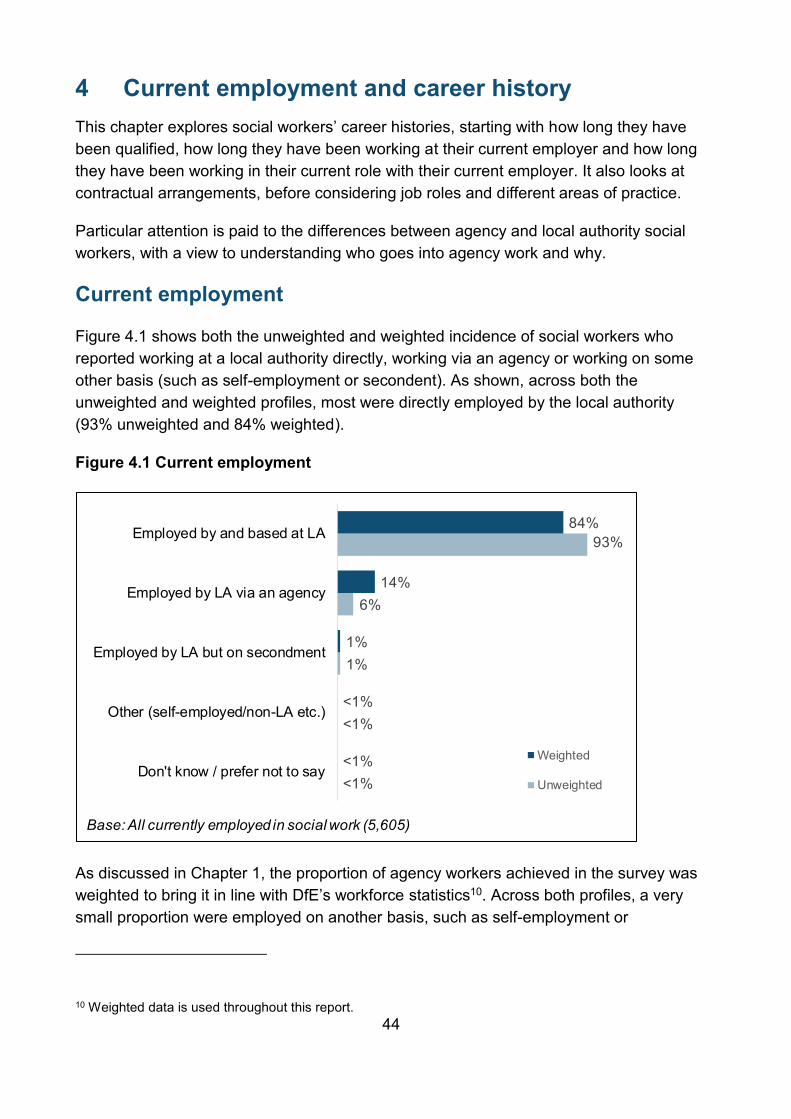
44
4 Current employment and career history This chapter explores social workers’ career histories, starting with how long they have been qualified, how long they have been working at their current employer and how long they have been working in their current role with their current employer. It also looks at contractual arrangements, before considering job roles and different areas of practice.
Particular attention is paid to the differences between agency and local authority social workers, with a view to understanding who goes into agency work and why.
Current employment
Figure 4.1 shows both the unweighted and weighted incidence of social workers who reported working at a local authority directly, working via an agency or working on some other basis (such as self-employment or secondent). As shown, across both the unweighted and weighted profiles, most were directly employed by the local authority (93% unweighted and 84% weighted).
Figure 4.1 Current employment
Base: All currently employed in social work (5,605)
<1%
<1%
1%
6%
93%
<1%
<1%
1%
14%
84%
Don't know / prefer not to say
Other (self-employed/non-LA etc.)
Employed by LA but on secondment
Employed by LA via an agency
Employed by and based at LA
Weighted
Unweighted
As discussed in Chapter 1, the proportion of agency workers achieved in the survey was weighted to bring it in line with DfE’s workforce statistics10. Across both profiles, a very small proportion were employed on another basis, such as self-employment or
10 Weighted data is used throughout this report.

45
secondment. Reflecting this, it was most common for social workers to be working on a permanent or open-ended contract (82%) with temporary or agency contracts the second most common (12%).
Agency working
Agency workers were more likely to work in Greater London (32% compared with 13% of social workers employed directly) and in the South West (18% compared with 7% employed directly). They were also more likely to work at a local authority rated by Ofsted as inadequate (21% compared with 8% employed directly) and less likely to work at an authority rated by Ofsted as outstanding (3% compared with 10% employed directly).
As might be expected given their employment status, agency workers were more likely to be working on a temporary contract (82% compared with less than 1% of those employed directly) although 5% reported that they were working on a permanent or open ended contract.
Looking by job role and area of practice, agency workers were more likely to be front line practitioners (70% compared with 52% of social workers employed directly) and to work in the child in need / child protection practice area (64% compared with 51% employed directly) and assessment (31% compared with 25% employed directly).
In terms of demographics, agency workers were more likely to:
• Be older (26% were aged 55-64 compared with 18% employed directly and 14% were aged 25-34 compared with 25% employed directly);
• Be male (25% compared with 15% employed directly);
• Identify as Black African/ Caribbean/ Black British (33%, compared with 7% of those employed directly); and
• Less frequently report physical or mental health conditions (9% compared with 16% employed directly).
Agency-employed social workers tended to have more experience in the profession. For example, 54% had been working in child and family social work for 10 years or more compared with 45% of directly-employed social workers, and 28% of agency workers had 6-10 years of experience compared with 19% who were directly employed. Conversely, and as might be expected given the greater likelihood that they would move between roles and be on short-term contracts, agency staff had worked with their employer, and in their current role, for less time. For example, 82% had worked for their employer for up to one year compared with 38% of directly-employed social workers.

46
Agency-employed social workers were asked about why they went into agency work and then to indicate their main reason. As shown in Figure 4.2, half (50%) cited flexibility of working and almost half (49%) cited better pay. Despite the earlier finding that salary was not a key motivation for entering the profession, pay was by far the most commonly cited single driving factor (29% cited this as their only or main reason). Substantial proportions also explained that agency work appealed because of more opportunities to gain experience of different roles (34%), they were dissatisfied with permanent employment (25%) and that agency work offered better work-life balance (21%) and greater professional autonomy (16%). In contrast, lack of availability of local permanent jobs does not appear to be a major push factor into agency work (cited by just 6% as a reason for entering agency work).
Figure 4.2 Reasons for agency work
Base: All social workers working for an agency (315)
50%
49%
34%
25%
21%
16%
6%
9%
3%
22%
29%
13%
11%
7%
3%
3%
6%
5%
I have more flexibility about when I work
The pay is better
More opportunities to gain experience of different roles
Dissatisfaction with permanent employment
Better work-life balance
I have more professional autonomy
Lack of available local jobs
Other
Don't know / prefer not to say FactorMain factor
Career history
Figure 4.3 shows that around half of respondents (47%) reported that they had been qualified as a social worker for over ten years. However, just one-quarter (25%) had worked for the same employer for over ten years, with the majority (61%) having been with their current employer for five years or less. Nearly half had been in their current role with their current employer for up to one year (45%).

47
Figure 4.3 Career history
47%21%
12%10%10%
25%14%
13%20%
28%
8%9%
12%26%
45%
More than 10 years6 to 10 years4 to 5 years2 to 3 yearsUp to 1 year
More than 10 years6 to 10 years4 to 5 years2 to 3 yearsUp to 1 year
More than 10 years6 to 10 years4 to 5 years2 to 3 yearsUp to 1 year
“How long have you worked…”
As a qualified social worker
At your current employer
In your current role, with your current employer
Base: All currently employed in child and family social work (5,508)
Length of experience as a qualified social worker tended to increase with seniority of role (Table 4.1). For example, the vast majority of senior service manager/directors had more than ten years’ experience (94%) whereas this fell to 67% among practice leaders, 48% among practice supervisors and 36% among front line practitioners. Added to this, the range of years spent in child and family social work was broadest among front line practitioners.

48
Table 4.1 Length of experience as a qualified social worker, by job role11
Average ASYE Front line
practitioner
Practice supe.
Team mngr.
Practice leader
Senior service mngr. /director
More than 10 years 47% - 36% 48% 73% 67% 94%
6 to 10 years 21% - 22% 32% 22% 25% 4%
4 to 5 years 12% - 17% 15% 4% 7% 2%
2 to 3 years 10% 8% 17% 4% 1% 1% -
Up to 1 year 10% 88% 8% <1% - - -
Base: all currently employed in child and family social work.
5,508 338 2,991 433 713 213 319
Grey and italicised fonts denote percentage that are not significantly different from the average
Job role and area of practice
Social workers were asked to indicate their current job role along with the main focus of their work. Job roles are outlined Figure 4.4, in order of seniority, along with area of practice. Social workers were given the opportunity to select more than one area of practice as their ‘main focus’, hence the figures sum to more than 100%.
11 Although it is implied that the ASYE will take one year, social workers can typically complete their ASYE within the first three years of qualifying. At the beginning of the ASYE the precise timings are agreed between the social worker and the employer. This will take into account working patterns or long-term absences, such as maternity leave or sick-leave.

49
Figure 4.4 Job role and area of practice
6%3%4%
13%7%
55%6%
OtherSenior service manager /director
Practice leaderTeam manager
Practice supervisorFront line practioner
ASYE
Which ONE of the following best describes your current role?
5%3%3%4%6%8%8%
11%14%15%16%
19%26%
31%52%
OtherYouth offending
HealthEducation
Prevention / early help servicesLeaving careKinship care
Children with disabilitiesDuty / first response etc.
Placements / permanenceAdoptionFostering
AssessmentLooked After Children
Child in Need / Child Protection
What is the main focus of your work?
Base: All currently employed in child and family social work (5,508). Don’t know responses were negligible, so are not shown
The most common job roles among social workers were front line practitioners (55%), team managers (13%) and practice supervisors (7%). The most common areas of practice were child in need / child protection (52%), looked after children (31%) and assessment (26%).
Those in the duty/ first response/ front door/ MASH services, assessment and child in need and child protection roles typically had less experience than those in other areas. For example, 43% of those working in duty/first response/ front door/ MASH, 41% of those in assessment and 39% of those in child in need and child protection had been in social work for more than ten years compared with 47% of social workers on average. Social workers with ten or more years’ experience were more likely than average to work in most areas, with the exception of Assessment (22% compared with 26% average) and Duty / first response / front door / MASH (13% compared with 14% average).
Amongst both stayers and leavers in the qualitative research, there were several respondents who had started their careers in front line child protection roles, but had moved out of this into other areas of children’s social work. Some of those who had made this move did so because they found the nature of the work so demanding of their time, emotions and energy, and so incompatible with their personal lives, that they were unable or unwilling to continue. One leaver, talking about her move from child protection into a fostering team said:

50
I now have the opportunity to develop myself…I felt like I was just constantly fire-fighting within my role which wasn’t good…that transition to the fostering team allowed me the capacity to reflect, take that time to think and get my passion for social work back a bit. I’d just been absolutely overwhelmed. [Leaver 53]
The qualitative research found a number of examples of stayers who moved away from front line posts due to stress and subsequently forfeited their retention bonus to protect their wellbeing. Many of the stayers acknowledged that they would not be able to stay in front line work for more than a few years due to burnout, and liked the variety of roles that a social work career offered to enable moving at the right time. Moving teams/roles was thus a form of resilience in terms of acting as a protective factor against stress and burnout.
Just in terms of how long you can actually, kind of, maintain staying in the job at that pace and the stress of it…. people tend to go into, like a different area, so the Looked-After Children or the Fostering and Adoption teams which are still stressful, but I don’t think as, kind of, fast paced. Lots of people move into Adult Care as well. [Stayer 9]
As stress was an expected aspect of the social worker role it was surprising that so few of the qualitative interviewees had clear stress management strategies. The major support for staff was their team and both stayers and leavers talked about how critical this was for keeping them in social work practice. For most of the respondents their team manager was also an important factor here although in a few cases, particularly leavers, the team manager was seen as part of the problem and particularly where they were described as not listening. For others family, partners and children were positive ways to reduce stress. Those with the most developed stress management strategies were those who had suffered from stress causing them to have had time off work requiring counselling. Strategies for managing stress included meditation, hypnotherapy, and regular exercise.
Stayers and leavers alike talked positively about the opportunities there had been to gain a range of experience across different practice areas during their first few years in practice by changing roles or teams, often within the same local authority. Some of these respondents suggested that by building their confidence and exploring the different aspects of children’s social work, they hoped to identify a longer term plan.
I have moved teams, you know, probably every couple of years…so I think sometimes just having a change can help your perspective…you build your social work skills, and I feel more confident. [Leaver 2]
I’ve only ever done long-term, child-in-need, child protection…now I’m doing duty and assessment, so I think I probably just want to try a few areas in children and
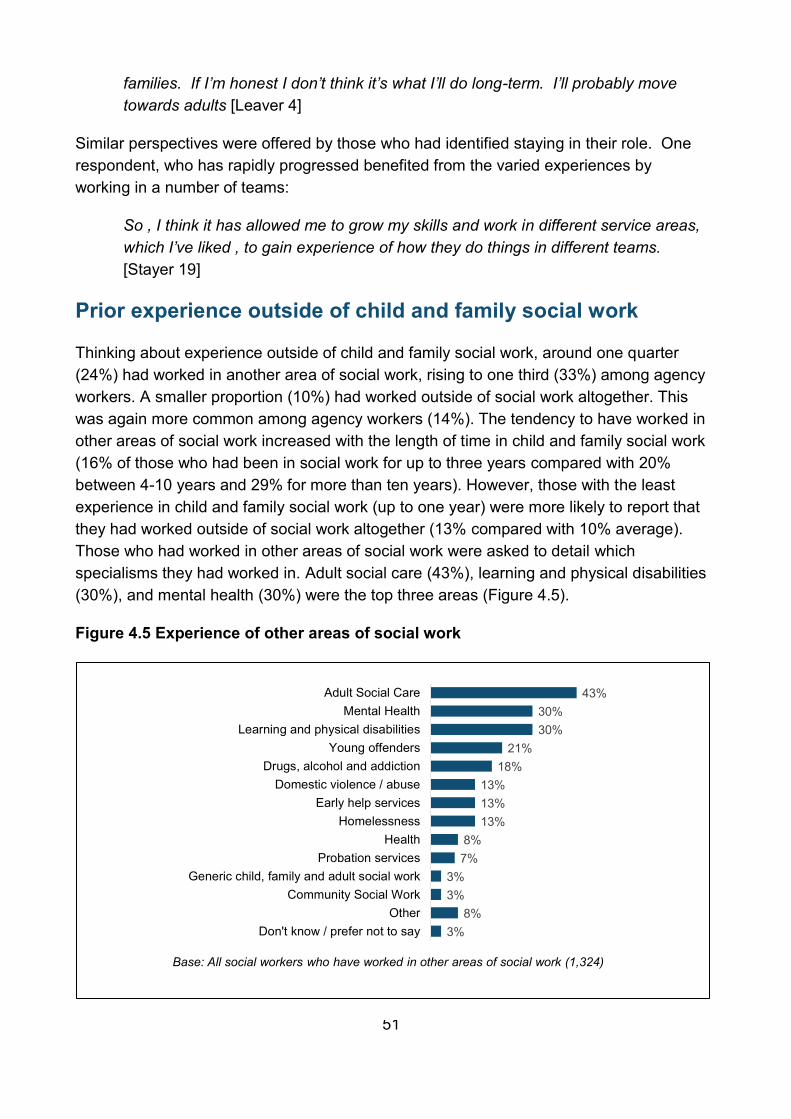
51
families. If I’m honest I don’t think it’s what I’ll do long-term. I’ll probably move towards adults [Leaver 4]
Similar perspectives were offered by those who had identified staying in their role. One respondent, who has rapidly progressed benefited from the varied experiences by working in a number of teams:
So , I think it has allowed me to grow my skills and work in different service areas, which I’ve liked , to gain experience of how they do things in different teams. [Stayer 19]
Prior experience outside of child and family social work
Thinking about experience outside of child and family social work, around one quarter (24%) had worked in another area of social work, rising to one third (33%) among agency workers. A smaller proportion (10%) had worked outside of social work altogether. This was again more common among agency workers (14%). The tendency to have worked in other areas of social work increased with the length of time in child and family social work (16% of those who had been in social work for up to three years compared with 20% between 4-10 years and 29% for more than ten years). However, those with the least experience in child and family social work (up to one year) were more likely to report that they had worked outside of social work altogether (13% compared with 10% average). Those who had worked in other areas of social work were asked to detail which specialisms they had worked in. Adult social care (43%), learning and physical disabilities (30%), and mental health (30%) were the top three areas (Figure 4.5).
Figure 4.5 Experience of other areas of social work
www.iffresearch.com6
3%8%
3%3%
7%8%
13%13%13%
18%21%
30%30%
43%
Don't know / prefer not to sayOther
Community Social WorkGeneric child, family and adult social work
Probation servicesHealth
HomelessnessEarly help services
Domestic violence / abuseDrugs, alcohol and addiction
Young offendersLearning and physical disabilities
Mental HealthAdult Social Care
Base: All social workers who have worked in other areas of social work (1,324)

52
5 Workplace well-being This chapter explores social worker well-being by considering working hours and caseloads, reported stress levels and workload demands, views on the extent of managerial support for work-life balance, and access to flexible working arrangements.
Contracted and actual working hours Social workers were asked how many hours they were contracted to work per week. Throughout this section full-time work is considered to be more than 35 hours and part-time as any range between 1-35 hours, recognising that 31-35 hours is on the cusp of full-time work.
The majority of social workers were contracted to work full-time; the mean number of contracted hours was 35, with the majority (77%) contracted to work between 36-40 hours a week.
Working on a part-time contract (in particular, 30 hours per week or below) was twice as common among women than men (15% compared with 8%), and – as might be expected – more prevalent among those who had any caring responsibilities (21%, compared with 7% of those who did not have caring responsibilities). This was especially the case for people who had young children (below school age) among whom just over one third (37%) were contracted to work 30 hours per week or below, followed by 20% among those with children of school age. Related to this, social workers aged 35-44 years were more likely than average to be contracted to work 30 hours per week or below (18%, compared with 14% overall). Older social workers aged 55 to 64 (18%) and 65 or older (48%) were also more likely to be contracted to work part-time.
The qualitative interviews included several social workers who had changed to part-time working to cater for family commitments or to reduce their workload to manageable levels. It also provided an opportunity for them to consider whether they still wished to be a social worker or not. Those who did not (yet) have children reflected that if they became parents, they would consider reducing their hours whilst those in current front line services also suggested they would consider moving to another team with a more predictable workload and less crisis work. A manager planning to stay in their role stated:
I couldn’t do this job if I had children, and I don’t have children at the moment. [Stayer 15]
A child protection social worker planning to stay in their current team explained:
I don’t think that this kind of job is… I don’t think it’s very easy to juggle two children, I often come home late, I don’t think I’d be able to do that… [Stayer 4]
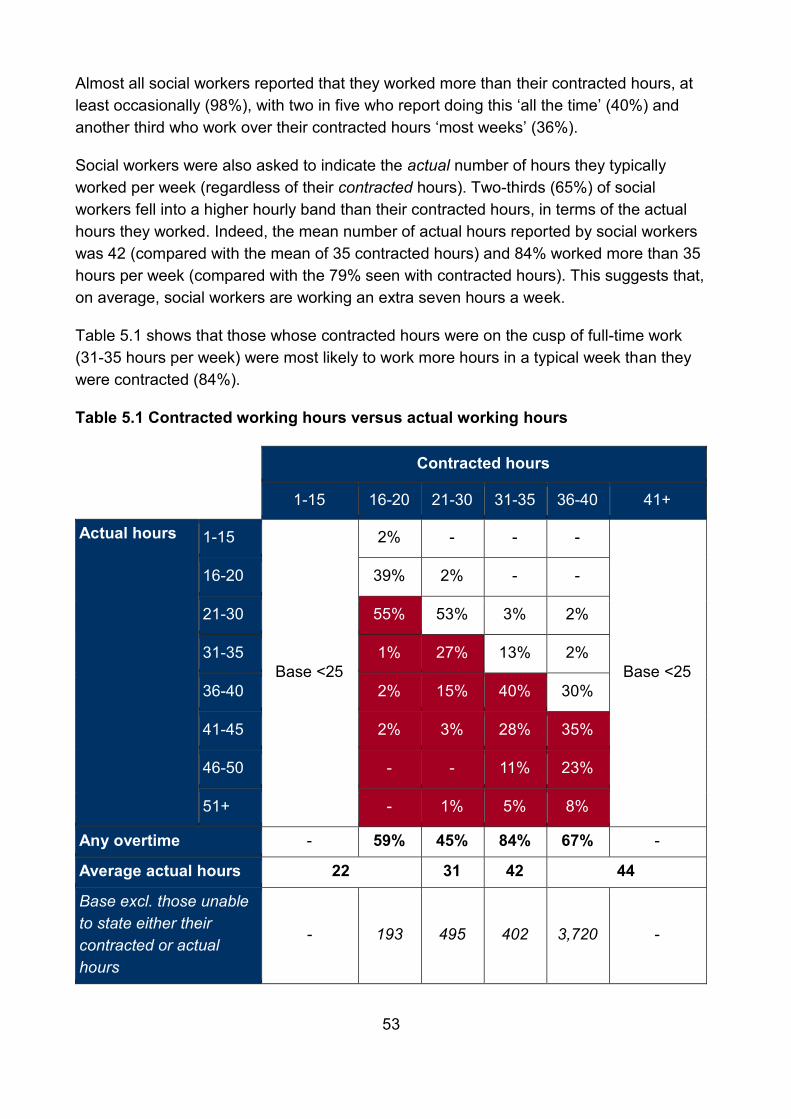
53
Almost all social workers reported that they worked more than their contracted hours, at least occasionally (98%), with two in five who report doing this ‘all the time’ (40%) and another third who work over their contracted hours ‘most weeks’ (36%).
Social workers were also asked to indicate the actual number of hours they typically worked per week (regardless of their contracted hours). Two-thirds (65%) of social workers fell into a higher hourly band than their contracted hours, in terms of the actual hours they worked. Indeed, the mean number of actual hours reported by social workers was 42 (compared with the mean of 35 contracted hours) and 84% worked more than 35 hours per week (compared with the 79% seen with contracted hours). This suggests that, on average, social workers are working an extra seven hours a week.
Table 5.1 shows that those whose contracted hours were on the cusp of full-time work (31-35 hours per week) were most likely to work more hours in a typical week than they were contracted (84%).
Table 5.1 Contracted working hours versus actual working hours
Contracted hours
1-15 16-20 21-30 31-35 36-40 41+
Actual hours 1-15
Base <25
2% - - -
Base <25
16-20 39% 2% - -
21-30 55% 53% 3% 2%
31-35 1% 27% 13% 2%
36-40 2% 15% 40% 30%
41-45 2% 3% 28% 35%
46-50 - - 11% 23%
51+ - 1% 5% 8%
Any overtime - 59% 45% 84% 67% -
Average actual hours 22 31 42 44
Base excl. those unable to state either their contracted or actual hours
- 193 495 402 3,720 -

54
This was also the case, albeit to a lesser extent, for those on full-time contracts (67%, compared with 45% of those contracted to work 21-30 hours per week and 59% of those contracted to work 16-20 hours a week).
Those working in child and family social work for 2-3 years were more likely to report working over and above their contracted hours ‘all the time’ (44%, compared with 40% on average and 22% of those who had been in the profession for less than a year). This finding does not appear to be linked to job role however, as those in more senior roles – who tended to have worked in social work for longer than 2-3 years – more likely to report working overtime. For example, 59% of those in senior service manager or director roles reported working overtime ‘all the time’ as did 50% of team managers. Perhaps reflective of this, the prevalence of working overtime increased with age (35% of those aged under 45 reported working overtime ‘all the time’ compared with 44% of those aged 55-64).
Looking by practice area, those working in child protection and looked after children were more likely to report working over their contracted hours ‘all the time’ (44% and 45% respectively, compared with the 40% average).
Other demographic differences of particular note include:
• Those working for organisations with an Ofsted rating of ‘requires improvement’ were more likely to report working more than their contracted hours ‘all of the time’ (43% compared with 40% average); and
• Those with caring responsibilities for family and friends were more likely to report working overtime ‘all of the time’ and those with caring responsibilities for pre-school aged children were the least likely (45% and 33% respectively, compared with 40% average).
The qualitative interviews found that working beyond their contracted hours was an accepted part of being a social worker: for instance, in needing to meet with families or young people outside normal working hours, or to respond to a family crisis, or to complete computer-based forms and assessments.
A part-time practitioner contracted to 25 hours per week described:
I’m doing 25 hours but effectively I’m working full-time, and that’s just about manageable, but if I was working 37 hours, I’d have to put in those extra hours, and I wouldn’t be able to cope with that. [Stayer 11]
Whilst working overtime was an accepted norm it was acknowledged that this was very difficult to sustain over a long period of time. Those working in front line child and family posts appeared to suffer most from this. One child-protection practitioner planning to stay in her current role identified:

55
For whatever reason you’re going and doing your visit outside of hours, or I’ve had families where it’s very difficult to see them in the evening, so you have to go first thing in the morning, so actually you’re already working before your working day is due to start. [Stayer 61]
An ex-front line practitioner intending to leave stated:
It’s the work-life balance for me, to be honest. I think it’s the hours that we have to work. It’s hard to keep that going over a sustainable period. [Leaver 25]
When she and her colleagues raised this with a manager they were told ‘That’s just social work, that’s the way it is.’ One respondent described the cycle of trying to keep up with an intense workload and the feelings of frustration and resentment that this could create:
I move between, and I know my colleagues move between, working to try and keep up, becoming resentful of that and then not doing that, but finding they are so far behind that they have to do that. It’s going through that, kind of, cycle. [Leaver 33]
It was also noted by another leaver that this can also have negative effects on team cohesion and support due to the amount of ‘intense work’ that might come in at already busy periods:
It’s almost that we’ve become a bit more selfish because we are only able to manage what we can manage. So, when there’s been moments of crisis, it’s kind of, ‘Well you’re on your own,’ kind of mentality, which I don’t like. I don’t believe in that. [Leaver 17]
However, this comment was in stark contrast to the number of stayers and leavers who stated that their team was highly supportive:
I think having supportive colleagues around you is a big difference. [Stayer 9]

56
Caseloads Social workers were asked how many cases they were currently allocated to12. Those who were working in a relevant caseholder role reported a wide range of numbers, from one case to 150 cases13. As shown in Figure 5.1, it was most common for those in relevant caseholder roles to fall into the range of 16-20 cases (reported by 28%), with the mean number of reported cases resting at 19.
Figure 5.1 Number of cases held
www.iffresearch.com17
3%
11%
21%
28%
21%
16%
1-5
6-10
11-15
16-20
21-25
26+
Base: All currently employed in child and family social work in a relevant, case-holding role (3,401)
Mean: 19
As shown in Figure 5.2, the mean number of reported cases varied considerably by contracted hours, job role and area of practice. As would be expected, reported caseloads increased with the number of contracted hours (ranging from 16 among those contracted to work for up to 35 hours to 20 among those contracted to work 41 hours or more) and level of seniority (ranging from 17 among ASYE social workers to 23 among practice leaders)14. Those working in the area of youth offending and those working in the area of fostering fostering reported the lowest caseload (a mean of 17).
12 Cases were defined as “an individual allocated to a social worker (for example a family of three siblings would be three individual cases) and/or a carer or carers allocated to a social worker for the purposes of fostering or adoption.” 13 Indepdent Reviewing Officers, Conference Chairs and Team Managers have been removed from the calculations, as they are more likely to take an overseeing role as opposed to an ‘on the ground’ role. 14 The results by the more senior job roles should be treated with caution, as it is possible that these social workers have included the cases of other social workers they manage, in their response.

57
Figure 5.2 Mean cases by contracted hours, job role and area of practice
www.iffresearch.com18
Base – all in a relevant case holder role, who gave an integer value: Overall (3,401), contracted hours (1-15: 17, 16-20: 136, 21-30: 360, 31-35: 275, 36-40: 2,580, 41+: 28), job role (ASYE: 323, Front line practitioner: 2,673, practice supervisor: 241, practice leader: 48), area of practice, from youth offending down to duty/first response (88, 663, 124, 198, 202, 970, 445, 82, 330, 888, 81, 487, 1,765, 347)* denotes a significant difference from the average
21*21*20*2020*20
19191919
1818
17*17*
23*1919
17*
1920*
1816*
12*13
19
Duty / first responseChild in Need / Child Protection
AdoptionHealth
AssessmentChildren with disabilities
EducationPlacements / permanence
Looked After ChildrenLeaving careKinship care
Prevention / early help servicesFostering
Youth offending
Practice leaderPractice supe.
Front line practitionerASYE
41+36-4031-3521-3016-20
1-15
Overall
(Contracted hours)
16
20
Patterns by length of time in child and family social work are reflective of patterns that have emerged elsewhere. Specifically, those who had been in the profession for up to one year reported an average of 16 cases (compared to the average of 19), whereas those who had worked for two to three years reported an average of 20 cases (compared to the average of 19).The caseload of agency workers was higher than those employed directly at the local authority; those working in full-time front line agency positions reported an average caseload of 20 compared with 18 among those working in full-time front line positions employed directly by the local authority.
Figure 5.3 explores reported caseloads by Ofsted rating and region. As shown, there was some variation by region, with reported caseload highest in the North East and Yorkshire and the Humberside and lowest in the East of England. As elsewhere, this is likely to be linked to Ofsted rating. The pattern by Ofsted rating is not as one might expect however; those working for a local authority with a rating of inadequate reported a similar average caseload as those working for a local authority rated as outstanding (each 17 and 18, respectively), with higher caseloads seen in the two middle bands.

58
Figure 5.3 Mean cases by region and Ofsted rating
www.iffresearch.com19
17*19
20*18*
21*21*
2019191919
1816*
19
OutstandingGood
Requires improvementInadequate
North EastYorkshire and the Humber
North WestWest Midlands
Greater LondonSouth East
East MidlandsSouth West
East of England
Overall
Base: Overall (3,401), Region, from East of England down to North East (492,235,413,584,643,274,264,212,284), Ofsted (Inadequate: 300, Requires improvement: 1,087, Good: 1,704, Outstanding: 310)denotes a significant difference from the average
The qualitative interviews revealed that caseloads were not experienced as static entities: they fluctuated over time and this in itself could be difficult for social workers to deal with. Although there were complaints about the size of their caseload and how it impacted upon their ability to give children and families the amount of time they felt they needed and deserved, it was accepted that work came in waves, so you could be in a lull one day and over-extended the next. One of the leavers noted that it depended which of these days it was as to whether they were thinking about leaving or not:
It’s really strange, because in this job, you can catch somebody on one day and get a positive and perhaps on another day you’ll get… I think for that reason alone it’s hard to judge where the service is, because day to day it’s so different for different members of staff [Stayer 17]
Both stayers and leavers reported caseload pressures.
You’re literally sat with what you had planned to do, with work flying in. A couple of us have got annual leave tomorrow, but ‘it doesn’t matter it’s your caseload’, ‘if you’ve got less than the maximum you will be getting some more’ [Stayer 17]
Travel time was raised as an additional, complicating factor by a worker in a rural area who had previously worked in a city centre, who described the extra pressures of having to manage multiple cases across a larger area:
I’ve been in (County) for two or three years… where we are based is very rural so we’re doing a lot of travelling one place to another but our caseloads remain the same. If you’d asked me 4 weeks ago, then (I) would have been really stressed
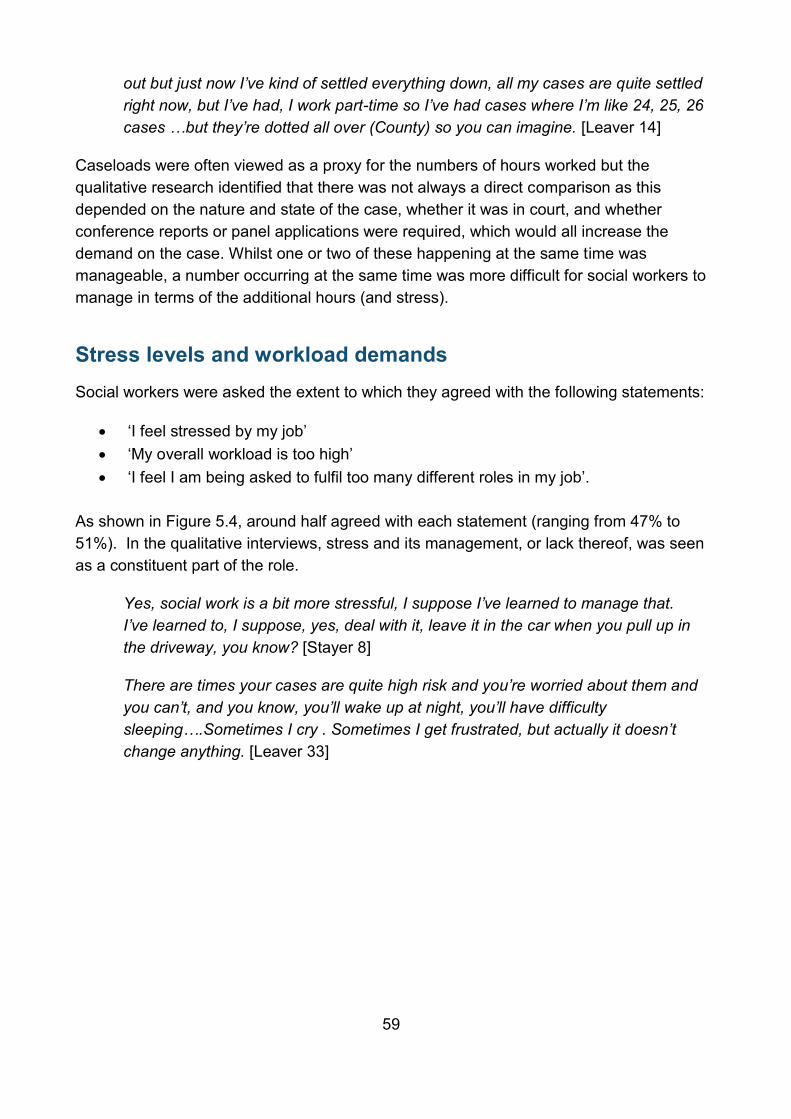
59
out but just now I’ve kind of settled everything down, all my cases are quite settled right now, but I’ve had, I work part-time so I’ve had cases where I’m like 24, 25, 26 cases …but they’re dotted all over (County) so you can imagine. [Leaver 14]
Caseloads were often viewed as a proxy for the numbers of hours worked but the qualitative research identified that there was not always a direct comparison as this depended on the nature and state of the case, whether it was in court, and whether conference reports or panel applications were required, which would all increase the demand on the case. Whilst one or two of these happening at the same time was manageable, a number occurring at the same time was more difficult for social workers to manage in terms of the additional hours (and stress).
Stress levels and workload demands Social workers were asked the extent to which they agreed with the following statements:
• ‘I feel stressed by my job’ • ‘My overall workload is too high’ • ‘I feel I am being asked to fulfil too many different roles in my job’.
As shown in Figure 5.4, around half agreed with each statement (ranging from 47% to 51%). In the qualitative interviews, stress and its management, or lack thereof, was seen as a constituent part of the role.
Yes, social work is a bit more stressful, I suppose I’ve learned to manage that. I’ve learned to, I suppose, yes, deal with it, leave it in the car when you pull up in the driveway, you know? [Stayer 8]
There are times your cases are quite high risk and you’re worried about them and you can’t, and you know, you’ll wake up at night, you’ll have difficulty sleeping….Sometimes I cry . Sometimes I get frustrated, but actually it doesn’t change anything. [Leaver 33]
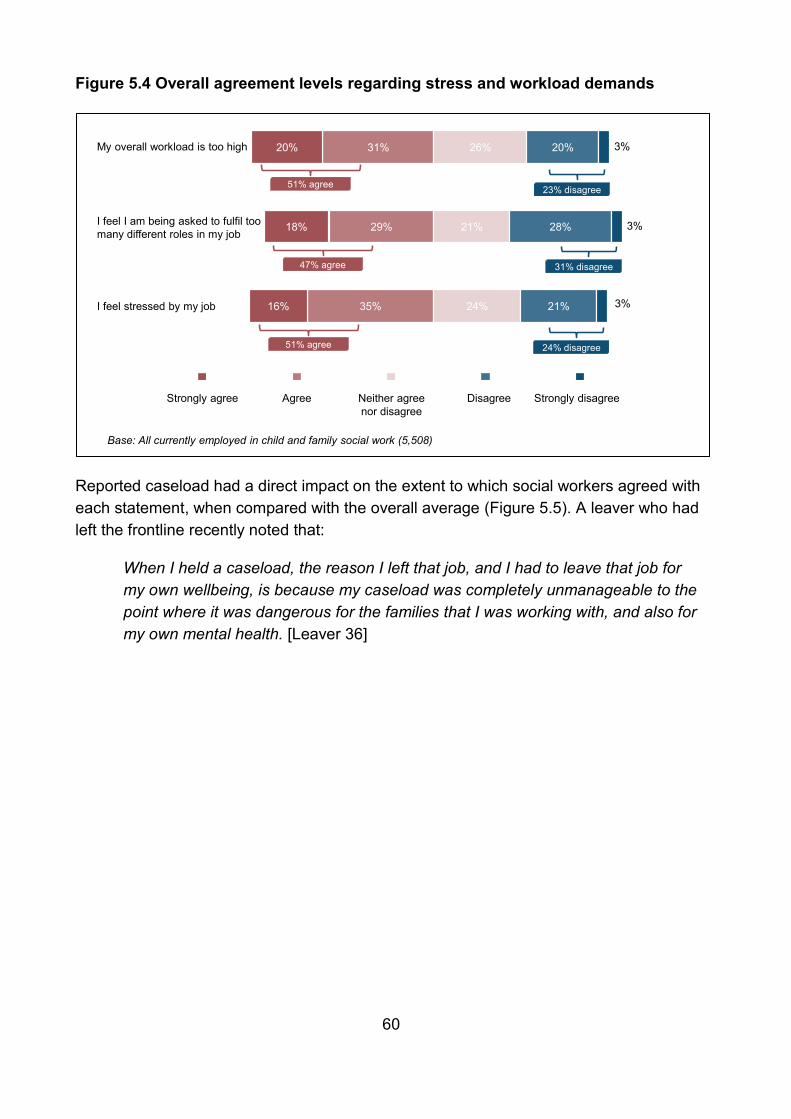
60
Figure 5.4 Overall agreement levels regarding stress and workload demands
www.iffresearch.com8
31%
29%
35%
20%
18%
16%
26%
21%
24%
20%
28%
21%
3%
3%
3%
51% agree
47% agree
51% agree
23% disagree
31% disagree
24% disagree
To what extent do you agree that….
My overall workload is too high
I feel I am being asked to fulfil too many different roles in my job
I feel stressed by my job
Strongly agree Agree Neither agree nor disagree
Disagree Strongly disagree
Base: All currently employed in child and family social work (5,508)
Reported caseload had a direct impact on the extent to which social workers agreed with each statement, when compared with the overall average (Figure 5.5). A leaver who had left the frontline recently noted that:
When I held a caseload, the reason I left that job, and I had to leave that job for my own wellbeing, is because my caseload was completely unmanageable to the point where it was dangerous for the families that I was working with, and also for my own mental health. [Leaver 36]

61
Figure 5.5 Agreement regarding stress levels and workload demands, by caseload
www.iffresearch.com9
51%*19%
*25%*38%
53%*70%
*84%
Average1-5
6-1011-1516-2021-25
26+
Base: All currently employed in child and family social work (5,508) and all currently employed in child and family social work in a relevant, case-holding role (1-5: 112, 6-10: 409, 11-15: 782, 16-20: 975, 21-25: 652, 26+: 471)* denotes a significant difference from the average
48%*26%
*34%*39%
49%*62%
*65%
Average1-5
6-1011-1516-2021-25
26+
51%*34%
*42%53%
*63%*69%
*72%
Average1-5
6-1011-1516-2021-25
26+
My overall workload is too high
I feel I am being asked to fulfil too many different roles in my job
I feel stressed by my job
Agreement levels by caseload
Figure 5.6 outlines levels of agreement with each statement by length of time in child and family social work. Agreement with each statement peaked among those who had been in the profession for 2-3 years, supporting the suggestion that this is a particularly demanding point in the career of a child and family social worker.

62
Figure 5.6 Agreement regarding stress levels and workload demands, by length of time in child and family social work
51%43%*
60%*56%*
49%
AverageUp to 1 year
2-3 years4-5 years6+ years
My overall workload is too high
I feel I am being asked to fulfil too many different roles in my job
I feel stressed by my job
47%39%*
57%*50%
46%
AverageUp to 1 year
2-3 years4-5 years6+ years
51%61%*
70%*61%*
45%*
AverageUp to 1 year
2-3 years4-5 years6+ years
Base: All currently employed in child and family social work (all=5,508; up to 1 year: 532, 2-3 years: 682, 4-5 years: 676, 6+ years: 3,572)* denotes a significant difference from the average
There were also some clear trends by job role (Figure 5.7). For example, front line practitioners were significantly more likely to agree with each statement. The experience of ASYE social workers also appears to be distinct from the average. Like front line practitioners, a higher proportion of ASYE social workers agreed that they felt stressed by their job than average (62% compared with 51%). However, unlike front line practitioners, smaller proportions agreed that they felt their overall workload was too high (37% compared with 51% average) and that they were being asked to fulfil too many different roles (38% compared with 47% average). This suggests that there are other factors that contribute to stress levels among those in their ASYE, which we will go on to explore.

63
Figure 5.7 Agreement regarding stress levels and workload demands by job role
www.iffresearch.com11
51%*37%
*53%48%
54%48%50%
AverageASYE
Frontline practitionerPractice supervisor
Team managerPractice leader
Senior service manager /director
Base: All currently employed in child and family social work (all=5,508; ASYE: 338, Frontline practitioner: 2,991, practice supervisor: 433, Practice leader (213); Senior service manager/director: 319, Team manager: 713)* denotes a significant difference from the average
47%*38%
*49%49%51%
46%45%
AverageASYE
Frontline practitionerPractice supervisor
Team managerPractice leader
Senior service manager /director
51%*62%
*58%44%45%44%
34%
AverageASYE
Frontline practitionerTeam manager
Practice supervisorPractice leader
Senior service manager /director
My overall workload is too high
I feel I am being asked to fulfil too many different roles in my job
I feel stressed by my job
To what extent do you agree that….
Looked after children, placements/permanence and support for children with disabilities were all practice areas where social workers were more likely to agree that their workload was too high or that they were being asked to fulfil too many roles (Table 5.2). Added to this, despite having a higher than average caseload, those working in the duty/ first response/ front door / MASH service area were less likely to agree with all three statements. In contrast, those working in child in need/ child protection, who also had a higher than average caseload, were more likely to agree with all three statements, indicating it is a particularly stressful area of practice.

64
Table 5.2 Agreement with each statement, by practice area
Red shading denotes a finding significantly higher than the average, green shading denotes a finding significantly lower than the average.
Avg. Children
with disabilities
Placements / permanence
Leaving care
Youth offending
Duty / first
response/ MASH
Health Education Adoption Fostering Assess ment
Child in Need / Child
Protection
Looked After
Children
Prevention / early help
Kinship care
Overall workload too high
51% 55% 55% 53% 41% 46% 49% 49% 50% 47% 51% 55% 56% 41% 51%
Feel stressed by job
51% 52% 53% 49% 44% 44% 56% 52% 47% 47% 53% 56% 53% 37% 46%
Asked to fulfil too many roles
47% 53% 55% 53% 44% 42% 56% 52% 48% 47% 48% 51% 53% 47% 49%
Base 5,508 598 810 453 196 721 176 187 879 1,086 1,379 2,797 1,712 325 400

65
Despite a higher caseload, agency social workers were less likely than to report feeling stressed; 45% agreed they felt stressed by their job compared with 53% of directly-employed local authority social workers, and 43% agreed they were being asked to fulfil too many different roles compared with 48% of directly-employed local authority social workers.
Social workers in a local authority with a ‘requires improvement’ Ofsted rating were the least positive about their experience, being more likely than average to agree that their workload is too high (56%); they were being asked to fulfil too many roles (53%) and they felt stressed by their work (53%). Conversely, social workers in ‘outstanding’ rated local authorities were the most positive, with agreement levels lower than average at all three statements (workload is too high: 39%; asked to fulfil too many roles: 36%; and feeling stressed by their work: 44%).
Despite a higher caseload and more overtime, those who identify as Black /African/ Caribbean/ Black British were less likely to agree that they felt stressed by their job (42% compared with 51% average) and that they were being asked to fulfil too many different roles (39% compared with 47% average). This may be linked to their greater likelihood of working in agency positions.
Reasons for feeling stressed Social workers who agreed with the statement ‘I feel stressed by my work’ were asked what factors they felt were causing this stress and to identify the main factor, if there was more than one.
Figure 5.8 shows that the top five issues were: too much paperwork (68%); too many cases (50%); insufficient time for direct work with children and families (44%); working culture / practices (42%) and lack of resources to support families (36%). The same five factors appear when looking at the main causes of stress, although in a slightly different order.

66
Figure 5.8 Reasons for feeling stressed
www.iffresearch.com13
Base: All social workers who report feeling stressed by their job (2,845).
68%
50%
44%
42%
36%
31%
28%
27%
21%
7%
3%
<1%
30%
21%
4%
13%
4%
5%
6%
2%
6%
2%
3%
2%
I have too much paperwork
I have too many cases
Insufficient time for direct work with children and families
Working culture / practices
Lack of resources to support families
High staff turnover in my team / area of practice
Having to make emotional or difficult decisions
Lack of administrative / business support
Insufficient quality of management / support
Other
Nothing in particular, it is simply a stressful job
Don't know / prefer not to say Factor
Main factor
Concerns among front line practitioners were distinct from others (Table 5.3). Specifically, they were more likely to report that feeling stressed by their work was caused by having too much paperwork (72% compared with 68% average), too many cases (58% compared with 50% average), insufficient time for direct work with children and families (53% compared with 44% average) and having to make difficult or emotional decisions (30% compared with 28% average). Those in their ASYE year were also more likely to cite insufficient time for direct work with children and families (55% compared with 44% average) and having to make difficult or emotional decisions (34% compared with 28% average) as having an influence on feeling stressed.
This suggests that the concerns of front line practitioners and those in their ASYE year are more related to their day-to-day roles rather than strategic or organisational issues. Indeed, people in more senior or strategic roles were more likely to cite concerns about working cultures or practices as a cause of feeling stressed by their work (59% of practice leaders, 50% practice supervisors and 50% of team managers).

67
Table 5.3 Reasons for feeling stressed by their job, by role
Red shading denotes a finding significantly higher than the average, green shading denotes a finding significantly lower than the average.
Stress factor Avg. ASYE Front line
Practice supervisor
Team manager
Practice leader
Senior service mngr.
/director
Too much paperwork
68% 70% 72% 66% 58% 67% 44%
Too many cases 50% 45% 58% 40% 31% 22% 17%
Insufficient time for direct work with children and families
44% 55% 53% 33% 12% 17% 6%
Working culture / practices
42% 29% 39% 50% 50% 59% 49%
Lack of resources to support families
36% 33% 37% 36% 40% 24% 27%
High staff turnover
31% 35% 30% 27% 32% 35% 26%
Having to make emotional or difficult decisions
28% 34% 30% 26% 22% 24% 23%
Lack of administrative / business support
27% 12% 27% 33% 38% 24% 30%
Insufficient quality of management / support
21% 20% 21% 22% 24% 20% 18%
Other 7% 5% 6% 7% 10% 8% 8%
Nothing in particular, simply a stressful job
3% 4% 2% 5% 5% 6% 15%
Base 2,845 201 1,753 193 308 102 114

68
Although those in their ASYE mainly shared similar concerns to front line practitioners, they were less likely to cite lack of administrative or business support (12% compared with 27% of front line practitioners) and about having too many cases (45% compared with 58% of front line practitioners). This is perhaps reflective of the earlier finding that those in their ASYE year had fewer cases than front line practitioners on average (17 compared with 19) and were less likely to report that they were being asked to fulfil too many different roles (38% compared with 49%).
In the qualitative research, stayers and leavers alike complained that too much of their work time was spent completing paperwork as opposed to undertaking direct work with children and their families. There was a feeling that some of this was driven by Ofsted requirements - or their local authorities’ interpretation of these requirements - which had led to layers of additional paperwork.
70% of my time is spent writing up what I’ve observed in the other 30% of my time [Leaver 22]
Now we have to do a pathway plan review. That’s 18 pages, and a social worker’s report, which should have been replaced by the pathway plan. That’s 11 pages. And a care plan which is as long as it needs to be, just for one document. [Leaver 23]
Front line social workers commonly raised concerns in the interviews about the balance between direct work with a family or child as opposed to the bureaucratic requirements of the task or meeting the requirements of the computer system. This could lead to a gap between initial expectation and the reality of the job.
I think it’s obviously a lot more paperwork, bureaucracy than I realised. I think I’ve worked in teams where I’ve worked alongside family support workers and I have started to look at their role after I first qualified and thought ‘Oh, I suppose that’s more what I thought I would be doing. [Stayer 53]
Several of the qualitative interviews were with people who had taken time off for stress-related reasons. A leaver who identified themselves as having significant time off for stress cited caseload issues, aggravated by how their manager had handled assigning cases when another staff member left at short notice:
I was completely spiralling out. And ending up not really myself, and really, really quite unwell, so I brought it to ….the service manager. I was sort of promised that things would be put in place etc. and then the following week, we had an agency worker who abruptly left, and the manager just sent me an email saying I needed to pick up five of these families, three of which were in court, and now I’d be responsible for the court documentation. [Leaver 29]

69
One stayer who had taken a period off with stress explained how their employer realised they had not managed requests for support well in the past, and tried to redress this on their return to work:
So, I went to them and said ‘I’m working really late, and it’s affecting my mental health, I don’t think I can do this anymore I’m feeling, you know, unsafe really in my practice’ they sort of, ignored that. And then I felt I had no choice but to have time off and when I went back in, my manager kind of recognised that they’d made a mistake and I think that was when they went through everything. [Stayer 16]
Agency workers who reported feeling stressed by their work cited fewer reasons for this than average and were significantly less likely to report the following:
• Too much paperwork (mentioned by 58% of agency workers compared with 69% of directly-employed local authority social workers);
• Insufficient time for direct work with children and families (mentioned by 34% of agency workers compared with 45% of directly-employed local authority social workers); and
• High staff turnover (23% of agency workers compared with 32% of directly-employed local authority social workers).
Whilst stress was seen as inherent to the role, strategies for coping with it were not as clearly developed. The stayers and leavers interviewed in the qualitative research were aware of their local authority’s counselling services, but one leaver was concerned about the confidentiality of this service and had not used it because of this. A stayer also lacked confidence in their local authority’s counselling service, and had paid privately as a result:
I also paid for it, out of my own pocket, I paid for counselling […] I’ve done lots of different kinds of therapies and stuff like that before and I know what works for me and what doesn’t now, and I just knew that they’d recommend things that I’d done before and that didn’t work. [Stayer 16]
Another stayer stated their employer had implemented a compulsory lunchbreak, closing the building to the public and providing a ‘bistro’ for staff to take a break:
They’ve changed one of the rooms in the building too, what we call a bistro, it’s a room with tables, and you know, we go down there and we sit and eat away from our desk, there is a sign in reception that says, you know, that we’re not available from 12-1 […] it’s just half an hour away from your desk, it makes a difference. [Stayer 90]
This authority had also organised wellbeing days to teach their employees about mindfulness and relaxation, and the benefits of exercise. Other strategies for managing stress identified in the qualitative research included; the importance of being able to

70
leave things in the workplace, although this was not possible for everyone; the importance of supportive colleagues and managers including good supervision; supportive family; moving away from front line teams; changing teams regularly; and taking regular holiday.
Manager consideration of work-life balance Despite the high proportion of social workers who were working more than their contracted hours, three quarters (76%) agreed that ‘my manager is considerate of my life outside work’, 14% were neutral and 9% disagreed (Figure 5.9).
www.iffresearch.com
1% 3% 6% 14% 42% 34%
Don't know / prefer not to say Strongly disagree Disagree Neither agree no disagree Agree Strongly agree
14
Base: All respondents still working in child and family social work (5,508).
76% agree 9% disagree
To what extent do you agree that….
Figure 5.9 Extent of social worker’s agreement that their manager is considerate of their life outside of work
Those in their first year of child and family social work were the most likely to agree (84% compared with 76% average), although those doing their ASYE were no more likely to agree. Length of time in the profession and job role aside, people with caring responsibilities were also more likely to agree (78% compared with 75% of those without caring responsibilities), particularly those caring for pre-school-aged children (80%). A key exception was those who had caring responsibilities for family members or friends, who were significantly less likely to agree (72%). These are more likely to be aged 45 or above, suggesting they are working alongside caring for elderly relatives (39% were aged 45-54 compared with 27% average and 32% were aged 55-64 compared with 20% average).

71
Use of various flexible working arrangements Social workers were also asked about whether they had made use of flexible working arrangements at their current employer, specifically time off in lieu (TOIL), flexi-time, paid overtime and job-sharing. As shown in Figure 5.10, time off in lieu (TOIL) was by far the most common arrangement that social workers used (82%) followed by flexi-time (58%). By comparison, a relatively small proportion of social workers reported paid overtime (15%) and even fewer reported the use of job sharing arrangements (5%).
Figure 5.10 Use of flexible working arrangements
www.iffresearch.com14
Base: All currently employed in child and family social work (5,508)
5%
15%
58%
82%
Job sharing
Paid over time
Flexi time
Time off in lieu
During your time at your current employer, have you made use of any of the following arrangements...?
The proportion of social workers who used any of these flexible working arrangements increased with the length of time they had spent with their employer, particularly among those who had been with their employer for six years or more (Figure 5.11). This suggests that these arrangements develop over time as the employee-employer relationship becomes more established.
72
Figure 5.11 Use of flexible working arrangements by length of time with employer
Base: All currently employed in child and family social work (all=5,508; up to 1 year: 532, 2-3 years: 682, 4-5 years: 676, 6+ years: 3,572)* denotes a significant difference from the average
9%*
21%*
61%*
86%*
3%*
13%
59%
85%*
2%*
13%
59%
80%*
2%*
10%*
52%*
77%*
5%
15%
58%
82%
Job sharing
Paid over time
Flexi time
Time off in lieu
Average
Up to 1 year
2-3 years
4-5 years
6+ years
Figure 5.12 explores flexible working arrangements by job role. Of particular note, front line practitioners were more likely to report the use of TOIL, particularly when compared with those in their ASYE and also senior service managers and directors (84% compared with 82% on average, 73% of those on their ASYE and 75% of senior service managers and directors).
This is consistent with earlier findings, such as higher caseloads and higher levels with agreement among front line social workers with the statement “my overall workload is too high”. In addition to TOIL, senior service managers and directors were also less likely to report flexi-time and paid overtime, but more likely to report job-sharing.

73
Figure 5.12 Use of flexible working arrangements by job role
Base: All currently employed in child and family social work (all=5,508; ASYE: 338, Frontline practitioner: 2,991, practice supervisor: 433, Practice leader (213); Senior service manager/director: 319, Team manager: 713)* denotes a significant difference from the average
8%
10%
53%
75%
7%*
14%*
59%*
86%*
6%
17%
58%
81%
3%
18%
61%
84%
4%*
15%
58%
84%*
2%*
13%
56%
73%*
5%
15%
58%
82%
Job sharing
Paid over time
Flexi time
Time off in lieu
AverageASYEFrontline practitionerPractice supervisorTeam managerPractice leaderSenior service manager /director
Other important subgroup differences include:
• Directly-employed local authority social workers were more likely than their agency counterparts to report using each type of arrangement (TOIL: 84% compared with 75% agency workers; Flexi-time: 60% compared with 49%; paid over-time: 16% compared with 8%; Job sharing: 5% compared with 2%).
• Flexi-time and job-sharing arrangements were more common among those with childcare responsibilities (63% of whom had used flexi-time compared with 52% without caring responsibilities and 7% of whom used job-sharing compared with 3% without caring responsibilities). Flexi-time was particularly common among those with caring responsibilities for pre-school aged children (71%). This is likely to reflect the need to navigate commitments during standard working hours (such as the childcare pick-up or drop-off).
The qualitative research highlighted that local authorities and teams within them recognised that the social work workload did not fit into normal working hours and there were a number of adjustments local authorities had made including: compressed hours, working from home, flexible working, moving to part-time working, changing work areas and time off in lieu. Where these opportunities were available they were valued, especially by those with caring responsibilities.
74
The paperwork side of it you can do from home. I can work the actual assessment side of it around my own hours. That works better for me because I’ve got children. [Leaver 31]
My workplace is very good, in terms of flexibility. So, because they know that, it’s kind of, constant, constant barrage of things to be dealt with , and the pace just never ever stops, there’s no breather, they, they’re quite flexible, in terms of you can request to have a day working from home , or you can have leave at short notice, if you’re really, really feeling like you need to have a break. [Leaver 36]
Taking time off in lieu (TOIL) for hours worked above those contracted was viewed in mixed terms: on the one hand, it enabled people to get at least some time off for some of the additional hours they had worked, but on the other hand, it could be difficult to fit in with their workloads, unless actively encouraged and supported by managers and the culture of the organisation:
TOIL days are kind of a must, so we, as you can imagine, often do visits after 5pm or before 8:30 in the morning, and actually we are encouraged to, quite greatly, take a TOIL day once a month. [Stayer 19]
You can have two days maximum TOIL a month’ but generally when you sit down and work out your hours and work out what you work a week, a month’s extra work for no pay, that’s an awful lot to give. [Leaver 36]

75
6 Views on employer, manager and working environment To help fully understand the day-to-day work experiences of social workers, the survey explored how they felt about their employer, line manager and working environment. This chapter therefore explores social workers’ feelings of loyalty to and being valued by their employer; relationship with their managers; experiences of receiving and providing reflective supervision; access to learning and development opportunities, and views on the resources at their disposal and their working environment.
Feeling valued by and loyal to their employer Social workers were asked the extent to which they felt loyal to, and valued by, their employer. As shown in Figure 6.1, loyalty to the organisation was fairly high (71% agreed, while 8% disagreed – 21% were neutral) but only just over half of social workers felt valued by their employer (54%). Almost a quarter (22%) did not feel valued. A similar proportion (24%) were neutral.
Figure 6.1: Social workers’ perceptions of loyalty to and feeling valued by their employer
1%
1%
2%
6%
6%
16%
21%
24%
46%
41%
25%
13%
I feel loyal to myorganisation
I feel valued by myemployer
Don't know / prefer not to say Strongly disagree Disagree Neither agree no disagree Agree Strongly agree
Base: All currently employed in child and family social work (5,508)
Time spent with the organisation had a positive impact on feeling loyal to their employer, yet a detrimental impact on the extent to which social workers felt valued: 66% of those who had been with their employer less than a year felt loyal to the organisation rising to 68% of those who had been with their employer for 1-3 years and 74% for four years or more. Conversely, 61% of those who had been with their employer for less than a year

76
felt valued, falling to 57% of those who had been with their employer for 1-3 years and for 50% among those who had worked there for four years or more.
By job role, more social workers on their ASYE felt valued by their organisation (61%) than front line practitioners (50%), although this increased amongst team managers (59%), practice supervisors (59%), practice leaders (62%) and senior service managers/directors (70%). So relatively new recruits – on ASYE – are more likely to feel valued, but this declines sharply among front line workers, then starts to rise again as people progress into more senior roles.
Social workers employed by a local authority were more likely to feel loyal to their employer than those working for an agency, as might be expected (72% compared with 65%), but – a key finding - less likely to feel valued (53% compared with 60%). This may reflect the previous findings on how feeling valued is linked to length of time in the role (as agency staff had typically spent less time in their role compared with their local authority counterparts). It may also reflect pay differentials between directly-employed and agency staff, for doing similar work.
Social workers in fostering, placements, services for children with disabilities and health reported lower levels of loyalty and feeling valued than other service areas, which is consistent with these workers’ views across other experience measures: 68% of those working in fostering or placements, and 66% of those in services for children with disabilities reported feeling loyal, while 46% of those in health, 49% of those in fostering and 50% in placements and children with disabilities said they felt valued by their employer. By contrast, those in child in need / child protection and prevention / early help services were more likely (57% and 60% respectively).
As Figure 6.2 shows, the proportion of social workers who felt loyal to, and valued by, their employer increased with Ofsted rating: 67% of those working for a local authority deemed by Ofsted as ‘inadequate’ and 66% working for a local authority rated as ‘requires improvement’ felt loyal compared with 74% working for a ‘good’ authority and 79% working for an ‘Outstanding’ authority. With regards to feeling valued, 44% of those working for an ‘inadequate’ local authority felt valued compared for 48% working for a local authority rated as ‘requires improvement’, 60% for a ‘good’ authority and 65% for an ‘Outstanding’ authority.

77
Figure 6.2: Loyalty to and feeling valued by employer, by Ofsted rating
54%
65%*
60%*
48%*
44%*
All
Outstanding
Good
Requires improvement
Inadequate
Feeling loyal to employer
Base: All currently employed in child and family social work (5,508: Outstanding: 521; Good: 2,666; Requires improvement: 1,853; Inadequate: 468)
71%
79%*
74%*
66%*
67%*
All
Outstanding
Good
Requires improvement
Inadequate
Feeling valued by employer
Importantly, there was also a link between job satisfaction and feeling loyal/ feeling valued. Social workers who were satisfied with their current job were far more likely than those who were not to agree they felt loyal to their organisation (79% compared with 45%). In a similar vein, those satisfied with their current job were also far more likely to feel valued (65%) than those who were dissatisfied (22%).
Other demographic differences are reflective of patterns seen elsewhere. These include:
• Black African / Caribbean / Black British social workers were more likely to feel loyal (75% compared with 71% on average) and less likely to not feel valued (17% compared with 22% on average).
• Those with a disability or health condition were less likely to feel loyal (63%) or valued by their employer (43%) than those who did not have a disability or health condition (73% felt loyal and 57% felt valued). Linked to this, social workers aged 55-64 years were less likely to feel valued (45%) and feel loyal (67%) in comparison to the average (54% and 71% respectively).
• Those with caring responsibilities for family or friends were less likely to feel loyal (65% agreed) or valued (44% agreed) than average.
In the qualitative research, social workers distinguished between feeling valued by their employing organisation; feeling valued by their immediate team and line manager; and feeling valued by the families they worked with.

78
Some interviewees had joined the local authority as students, and stayed due to the culture of supportive feedback; the availability of flexible working; and wider emphasis on staff wellbeing. A key aspect of feeling valued was being given feedback by managers:
If you've done something good, if something good has happened, something positive, it's acknowledged. [Stayer 8]
Feeling loyal to the organisation was also linked with being offered flexibility. For example, one stayer had returned to the local authority where she had done her ASYE after a career break to go travelling. Three years on, she expressed how loyal she felt to the organisation and was happy to commute the two-hour round trip to work, having agreed she could work at home one day per week. She emphasised that supportive managers created a culture of feeling valued: in her local authority the service manager had been promoted from within the organisation and remained very approachable.
Stayers and leavers both identified similar factors that encouraged them to feel supported by and loyal to their immediate teams. The voices of the respondents echoed throughout with examples including:
It’s not the council that retains the staff, it’s the social workers that retain social workers. [Stayer 76]
We all went away together as a team for the weekend. It made everybody see everybody in a different light and that in itself broke a lot of barriers. [Leaver 17]
There were a small number of conflicting voices who did not identify with feeling valued and supported by their organisation (particularly following a restructure) but in contrast they felt valued by the families they worked with:
I feel loyal to the organisation in that I feel loyal to the cases that I’m carrying and the people that I’m working with …. If my cases were all changed tomorrow, I would start looking for a different job. [Stayer 11]
Views on line management Social workers were asked about various aspects of their relationship with their line manager(s). Figure 6.3 shows that they were generally positive about their manager, with roughly four-fifths agreeing that they were open to ideas (82%) and that their manager recognised when they had done their job well (81%). However, social workers were less positive about feedback received from their manager, in terms of both frequency and quality; around seven in ten agreed that they received regular feedback on their performance (69%) and that the feedback received helped them to improve their performance (67%).

79
Figure 6.3: Social workers’ views on their line manager
2%
2%
2%
2%
3%
3%
3%
3%
4%
5%
5%
6%
6%
8%
11%
9%
11%
12%
14%
14%
14%
17%
17%
20%
50%
45%
46%
44%
42%
44%
44%
42%
33%
35%
33%
32%
34%
27%
25%
26%
My manager is open to my ideas
My manager recognises when I havedone my job well
Overall, I have confidence in thedecisions made by my manager
My manager encourages me to developmy skills
My manager is considerate of my lifeoutside work
My manager motivates me to be moreeffective in my job
I receive regular feedback on myperformance
The feedback I receive helps me toimprove my performance
Strongly disagree Disagree Neither agree nor disagree Agree Strongly Agree
Base: All currently employed in child and family social work (5,508)
82%
69%
67%
72%
76%
76%
79%
81%
Social workers doing their ASYE were more positive about their manager than average, and in particular when compared with team managers’ views of their own line manager, suggesting that line management could be strengthened at this level. ASYE social workers were more likely to agree that their line manager:
• Recognised when they had done a good job (83%, compared with 81% average and 75% of team managers);
• Motivated them (80%, compared with 72% average and 68% of team managers);
• Provided feedback that helped them to improve their performance (78%, compared with 67% average and 65% of team managers); and
• Provided them with regular feedback (75%, compared with 69% average and 64% of team managers).
This pattern broadly matches time employed in child and family social work: those who had been in their roles for under a year were more positive than average, those in their roles for between 1-10 years broadly in line with average and those in their role for 10+ years tended to be less positive about their managers.
Social workers were more likely to report positively about their manager if they worked for a local authority with an ‘outstanding’ or ‘good’ Ofsted rating and less positively if they worked at one rated ‘requires improvement’ or ‘inadequate’ (for example, see Figure 6.4).
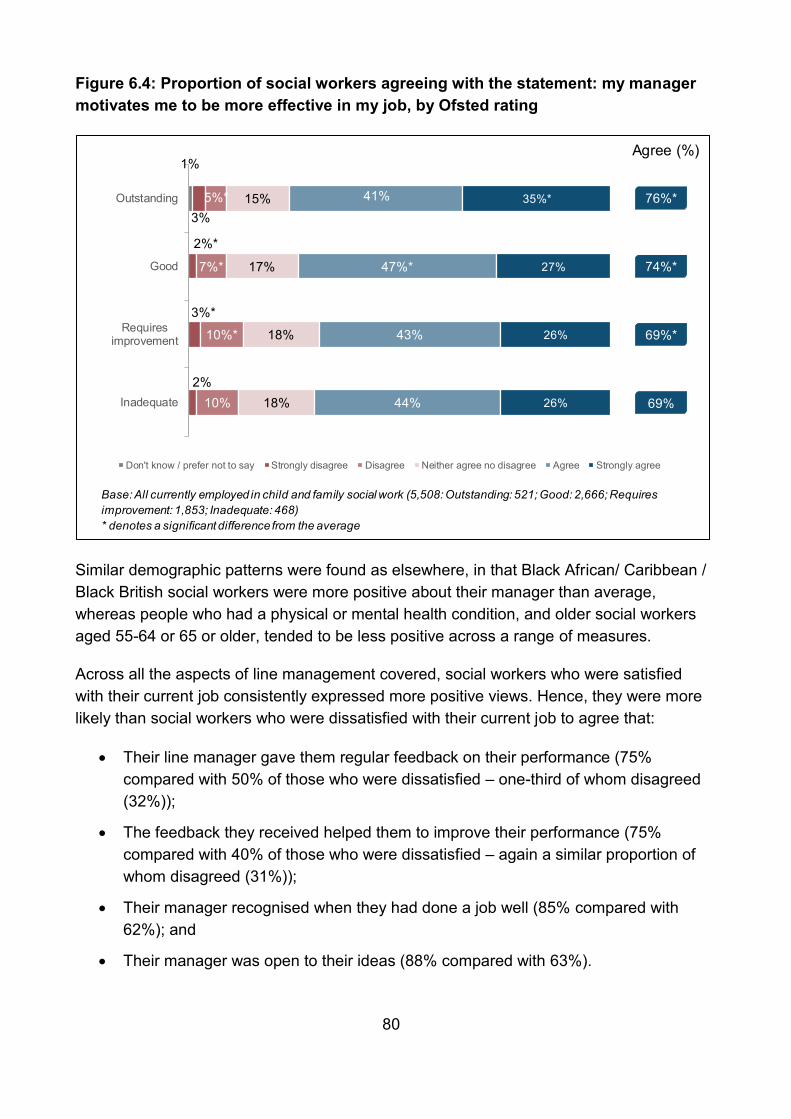
80
Figure 6.4: Proportion of social workers agreeing with the statement: my manager motivates me to be more effective in my job, by Ofsted rating
1%
3%
2%*
3%*
2%
5%*
7%*
10%*
10%
15%
17%
18%
18%
41%
47%*
43%
44%
35%*
27%
26%
26%
Outstanding
Good
Requiresimprovement
Inadequate
Don't know / prefer not to say Strongly disagree Disagree Neither agree no disagree Agree Strongly agree
Base: All currently employed in child and family social work (5,508: Outstanding: 521; Good: 2,666; Requires improvement: 1,853; Inadequate: 468)* denotes a significant difference from the average
76%*
69%*
Agree (%)
74%*
69%
Similar demographic patterns were found as elsewhere, in that Black African/ Caribbean / Black British social workers were more positive about their manager than average, whereas people who had a physical or mental health condition, and older social workers aged 55-64 or 65 or older, tended to be less positive across a range of measures.
Across all the aspects of line management covered, social workers who were satisfied with their current job consistently expressed more positive views. Hence, they were more likely than social workers who were dissatisfied with their current job to agree that:
• Their line manager gave them regular feedback on their performance (75% compared with 50% of those who were dissatisfied – one-third of whom disagreed (32%));
• The feedback they received helped them to improve their performance (75% compared with 40% of those who were dissatisfied – again a similar proportion of whom disagreed (31%));
• Their manager recognised when they had done a job well (85% compared with 62%); and
• Their manager was open to their ideas (88% compared with 63%).

81
Respondents in the qualitative interviews gave a range of examples of the characteristics shared by good immediate line managers. These included the manager’s contribution to team culture, their approachability, their knowledge of a worker’s personal circumstances, professional capabilities and the nature of their caseload and the provision of appropriate support and supervision. One interviewee, with management experience from a previous role, emphasised the importance of managers allowing people to exercise autonomy, within appropriate boundaries:
When you’re managing a knowledge worker, which is what we are, the best way is to set very clear boundaries...and allow people to then go off and work out their own strategies to stay within those boundaries. That takes a lot of trust. [Leaver 25]
Another emphasised the need for trust and support:
There’s got to be someone having your back and I think that’s what the manager's role should be. [Stayer 10]
High turnover among managers was viewed as having a negative impact on staff experience. One leaver complained that in four years there had been eight different service managers, while other interviewees commented on the drawbacks of having agency workers as managers: they ‘would come and go willy-nilly’; ‘they do the job, they go and they move on’.
Several interviewees who were leaving social work or thinking about it said that their perception was that senior managers did not deal effectively with issues such as poor practice, bullying, or ineffective or inadequate supervision by team managers:
My senior manager, my service manager, knows about how we feel and she hasn’t approached us at all. So that’s why I think it’s a wider organisation problem, because it’s not being tackled. [Leaver 16]
A related issue was the perceived remoteness of some senior managers:
Senior management ….they’re very detached from work that happens on the ground. [Stayer 11]
Overall confidence in managers’ decisions As shown in Figure 6.3, social workers were generally confident in the decisions made by their managers. Four in five (79%) agreed (including one in three (33%) who strongly agreed) while only a small minority (7%) disagreed.
Key demographic differences broadly align with other views on line management. Social workers were more likely to agree that they had confidence in their managers’ decision

82
making if they were: undertaking an ASYE (84% compared with an average of 79%); in their first year of child and family social work (85%); working in a local authority rated as good (81%), and were less likely to agree if they: were employed in a local authority rated as requires improvement (76%); working in fostering (75%), leaving care (75%), placements (74%), services for children with disabilities (72%) or health (71%); had a physical or mental health condition (72%), or had caring responsibilities for family or friends (74%).
Experiences of receiving and providing reflective supervision Exploring social workers’ experience of reflective supervision is important in understanding perceptions of professional development and performance management. Where relevant, social workers were asked about their experiences of both receiving and providing reflective supervision.
Receiving reflective supervision
Overall there was a wide variation in the amount of reflective supervision received by social workers in non-managerial roles (Figure 6.5). Two in five social workers received reflective supervision every three to four weeks (44%) with another one in five who received it every five to six weeks (21%). One in ten had not received any reflective supervision since joining their employer (9%). Those who had been with their employer for the least amount of time (less than one year) were more likely to report that they had not yet received any reflective supervision (13% compared with 9% on average).

83
Figure 6.5: Frequency of receiving reflective supervision, and views on its adequacy
6%
44%
21%
17%
9%
At least once every two weeks
Once every three or four weeks
Once every five or six weeks
Less frequently than every sixweeks
Have not received reflectivesupervision since joining
current employer
Base: All who are in a non-managerial role (4,290)
Too much: 2% About right: 92%Not enough: 5%
Too much: 1% About right: 73%Not enough: 24%
Too much: <1% About right: 20%Not enough: 77%
Too much: 0% About right: 4%Not enough: 91%
Too much: 6% About right: 90%Not enough: 3%
Job role was linked to the amount of reflective supervision received, with those undertaking an ASYE far more likely than others to receive reflective supervision at least once every two weeks (27% compared with 4% of frontline practitioners, and 2% of practice supervisors, team managers and senior service managers or directors). Furthermore, frequency of reflective supervision decreased with seniority: 23% of practice leaders received reflective supervision less frequently than every six weeks, compared with 17% average and 13% of those on an ASYE and 17% of frontline practitioners. There was a similar relationship between time spent at employer and time spent in child and family social work.
Agency workers were more likely than directly-employed local authority social workers to have received no reflective supervision at their current employer (15% compared with 8%), which is understandable given that some of them are likely to have been at the employer for a relatively short period of time.
Other key differences of note were that:
• local authorities with higher Ofsted ratings delivered reflective supervision more frequently than those with lower Ofsted ratings. For instance, 57% of social workers in outstanding-rated local authorities received reflective supervision at least every three to four weeks, or more often – compared with 46% of those in local authorities rated as requires improvement or inadequate.
84
• social workers who were satisfied with their job received more regular reflective supervision than those who were dissatisfied (54% received it at least every three to four weeks or more often, compared with 31% who were dissatisfied).
Social workers who received regular reflective supervision were more likely to feel the amount they received was suitable. Over nine in ten of those receiving it every four weeks or more often reported that this was ‘about right’ (92% receiving it every three to four weeks and 90% of those receiving it every two weeks or less), while over three quarters (77%) receiving it every six weeks or less and one quarter (24%) of those receiving it every five or six weeks said that this was ‘not enough’. Over nine in ten (91%) who had never received it, wanted it:
If I just knew that someone knew what I had on my plate...sometimes for me that would be all I needed. [Leaver 8]
Respondents who had received reflective supervision generally felt that it was of a good quality. Around three quarters (77%) agreed that it was good (60% said ‘good’ and 17% ‘very good’), while less than one fifth (18%) rated the reflective supervision as poor (16% ‘poor’ and 2% ‘very poor’).
The following groups were significantly more likely to rate the quality of the supervision they received as either good or very good:
• Social workers on ASYE (87% compared with 77% average)
• Those working for local authorities with higher Ofsted ratings (85% ‘outstanding’ and 80% ‘good’ compared with 73% requires improvement and 73% inadequate)
• Black African, Caribbean or Black British social workers (85% compared with 77% average); and
• Social workers without a physical or mental health condition (78% compared with 71% with).
The qualitative interviews provided further insights into experiences of reflective supervision. One aspect of supervision that was promoted positively was the combination of having both a personal and professional session by separating the case management from wider professional development issues.
It is sometimes rushed, I’m not going to lie, but we both have to make time for that, really. [Stayer 15]
Reflective supervision was promoted as invaluable. One social worker who had had a traumatic experience in a court team and had recently moved to a less pressurised assessments team commented:

85
If you've got a great manager, and you can bounce off who supervises you and gives you reflection time, then it's invaluable and I think if you don’t have that, it’s impossible. [Stayer 10]
We talk through cases, it's very reflective in terms of what's gone well this month, what we're worried about for our own self, and then it's doing the same for the families that we're working with. [Stayer 15]
Where reflective supervision did not work as well, it was felt to be too sporadic and focused on documenting the process of cases rather than taking a more developmental approach:
What I get is a form of “When was the child last seen? What are we worried about? What do you think needs to happen?” And just documenting it. I could do all my cases one month and then not do [supervision] again for a few months. [Leaver 23]
Providing reflective supervision
One quarter (25%) directly supervised other child and family social workers. These were more likely to be in mid-level or senior positions and to have been in child and family social work for at least 2-3 years (the proportion of those in supervisory roles increased incrementally with time in child and family social work).
The vast majority (94%) of those responsible for providing reflective supervision were confident in their ability to do so (33% were ‘very’ confident and 62% ‘fairly confident’). Only a small minority (5%) were not confident.

86
Figure 6.6: Confidence in ability to provide reflective supervision
5%
13%*
4%*
1%*
62%
62%
63%
55%*
33%
25%
33%
44%*
Not very confident Confident Very confident
Base: All supervisors (all=1,382: Frontline practitioner: 136; Team manager: 639: Senior service manager: 188)* denotes a significant difference from the average
All social workers
Frontline practitioners
Team managers
Senior service managers
Unsurprisingly, those in senior positions were more confident in their ability to provide supervision than those is more junior ones (Figure 6.6). For example, almost all (99%) senior service managers / directors and team managers (96%) reported being confident, compared with 87% of front line practitioners and 94% average. Further, those who had been in child and family social work for over 10 years were significantly more likely to report that they were confident in their ability to give supervision (97%) than those who had been in the sector for 10 years or less (89%). A similar pattern was seen with age: the older the social worker, the higher their confidence in their ability to provide reflective supervision.
Access to and support for learning and development The survey explored social workers’ views of the support they received for learning and development in terms of encouragement from their manager to develop their skills, access to the right learning and development opportunities when needed, and satisfaction with opportunities to develop their skills.
Overall, social workers were fairly positive about all of these aspects (Figure 6.7), particularly encouragement received from their manager (76% agreed). Around seven in ten were satisfied with the opportunities to develop skills (72%) or agreed that they had

87
access to the right learning and development opportunities when they needed them (69%).
Similar to other findings throughout the report, those undertaking an ASYE, or who had been in child and family social work for one year or less, were more positive about their access to learning and development opportunities than more senior, experienced staff.
However, this positivity quickly dissipates, as frontline practitioners were generally less positive about such opportunities than any other job role. For example, those undertaking an ASYE were more likely than others to: agree that their manager encouraged them to develop their skills (84% compared with 76% average); that they were able to access the right learning and development opportunities (84% compared with 69% average); and to be satisfied with the opportunities they had to develop their skills (82% compared with 72% average).
Patterns consistent with other findings emerged here. The following groups of social workers were more likely than other groups to agree that they were able to access the right learning and development opportunities when needed (they were also generally more positive about the available support for learning and development opportunities):
• Employed directly by a local authority (71% agreed, compared with 59% of those employed by an agency);
• At local authorities with a higher Ofsted rating (79% of social workers from outstanding-rated local authorities agreed, compared with 72% good-rated, 65% requires improvement and 66% of those from inadequate-rated authorities); and
• Of Black African / Caribbean / Black British ethnicity (74% agreed, compared with the average of 69%).

88
Figure 6.7: Access to and support for learning and development, by job role
www.iffresearch.com19
76%84%*
76%80%
70%76%
74%*
AverageASYE
Frontline practitionerPractice supervisor
Team managerPractice leader
Senior service manager /director
Base: All currently employed in child and family social work (all=5,508; ASYE: 338, Frontline practitioner: 2,991, practice supervisor: 433, Team manager: 713, Practice leader (213); Senior service manager/director: 319)* denotes a significant difference from the average
69%84%*
65%*72%73%*
77%74%*
AverageASYE
Frontline practitionerPractice supervisor
Team managerPractice leader
Senior service manager /director
72%82%*
68%*72%
76%75%*
79%*
AverageASYE
Frontline practitionerPractice supervisor
Team managerPractice leader
Senior service manager /director
My manager encourages me to develop my skills
I am able to access the right learning and development opportunities when I need to
I am satisfied with the opportunities to develop my skills in my job
To what extent do you agree that….
Stayers and leavers alike in the qualitative interviews, with just a few exceptions, were encouraged to participate in a variety of training opportunities and some were able to access courses via online booking systems. A proactive approach to learning and development was welcomed and social workers were encouraged to take up opportunities for particular courses.
Places on courses were available and generally social workers were able to organise their own diaries to enable attendance. There was support from some local authorities to enrol at local higher education providers for specific training modules and many had participated in practice educator training as a commitment to working with students and for their own potential for promotion.
One leaver who worked in a geographically large rural area said that attending training events which were usually held at the head office involved travelling 100 miles each way; and another leaver found that working on the duty team found that this limited the sessions she was able to attend. Both leavers and stayers mentioned other forms of delivery, such as online material, as valuable ways of accessing learning and development in these circumstances.
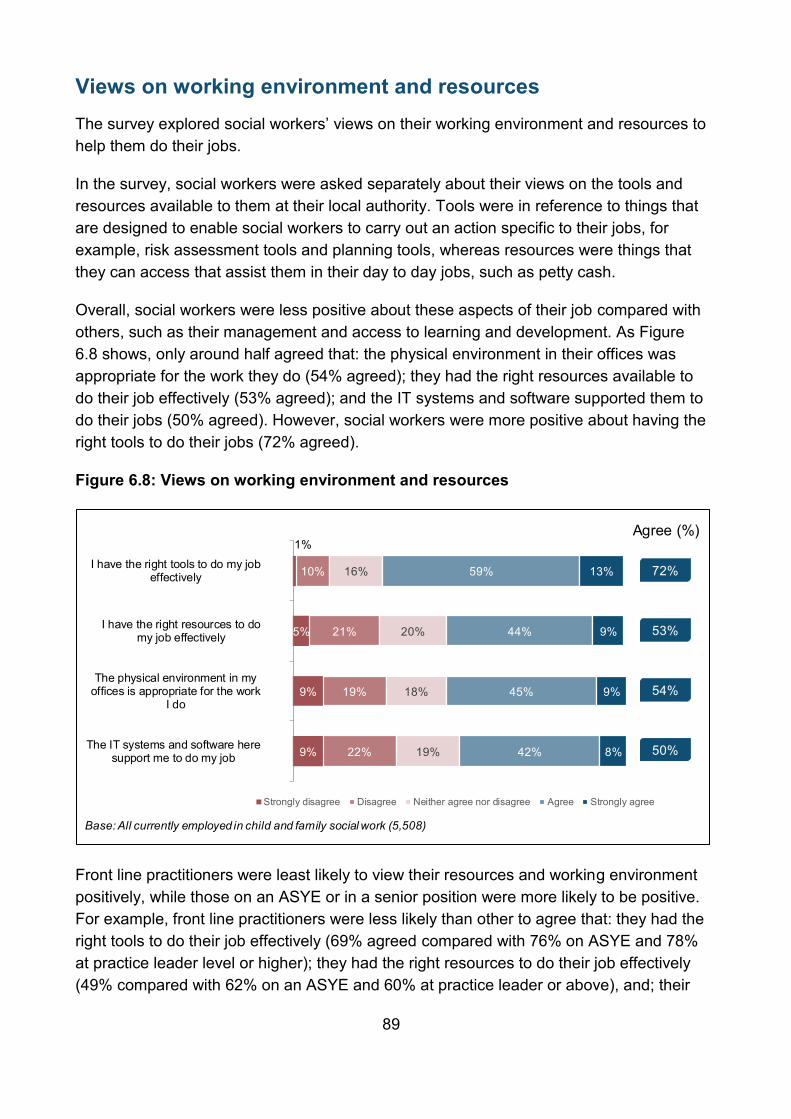
89
Views on working environment and resources The survey explored social workers’ views on their working environment and resources to help them do their jobs.
In the survey, social workers were asked separately about their views on the tools and resources available to them at their local authority. Tools were in reference to things that are designed to enable social workers to carry out an action specific to their jobs, for example, risk assessment tools and planning tools, whereas resources were things that they can access that assist them in their day to day jobs, such as petty cash.
Overall, social workers were less positive about these aspects of their job compared with others, such as their management and access to learning and development. As Figure 6.8 shows, only around half agreed that: the physical environment in their offices was appropriate for the work they do (54% agreed); they had the right resources available to do their job effectively (53% agreed); and the IT systems and software supported them to do their jobs (50% agreed). However, social workers were more positive about having the right tools to do their jobs (72% agreed).
Figure 6.8: Views on working environment and resources
1%
5%
9%
9%
10%
21%
19%
22%
16%
20%
18%
19%
59%
44%
45%
42%
13%
9%
9%
8%
I have the right tools to do my jobeffectively
I have the right resources to domy job effectively
The physical environment in myoffices is appropriate for the work
I do
The IT systems and software heresupport me to do my job
Strongly disagree Disagree Neither agree nor disagree Agree Strongly agree
Base: All currently employed in child and family social work (5,508)
Agree (%)
72%
50%
54%
53%
Front line practitioners were least likely to view their resources and working environment positively, while those on an ASYE or in a senior position were more likely to be positive. For example, front line practitioners were less likely than other to agree that: they had the right tools to do their job effectively (69% agreed compared with 76% on ASYE and 78% at practice leader level or higher); they had the right resources to do their job effectively (49% compared with 62% on an ASYE and 60% at practice leader or above), and; their

90
office environment is appropriate for the work they do (52% compared with 62% ASYE and 58% at practice leader or higher).
Social workers were more likely to give high ratings if they worked at a local authority with a good or outstanding Ofsted rating: for example, 80% of those working at outstanding local authorities and 76% of those working at good local authorities agreed that they had the right tools to do their jobs effectively, compared with 67% at those that require improvement and 68% at those judged inadequate. Similarly, 63% of respondents from outstanding local authorities and 57% from good local authorities agreed they had the right resources to do their jobs effectively, compared with 48% at those judged as requiring improvement and 50% at those judged inadequate. Similar patterns were observed in social workers’ views on their physical environment and the IT systems at their local authority.
Those working in placements/permanence and fostering service areas were most likely to view their resources and working environments negatively.
In the qualitative interviews, one theme that was identified as an aspect for both stayers and leavers was the quality of the office environment and external factors including parking. The physical office buildings ranged from modern with good facilities, to a more ‘rundown’ environment. One interviewee referred to an overcrowded office with only one kitchen:
It’s really difficult to manage that and also just really have the time to think and reflect on things.
Parking was discussed by a number of the stayers who identified the positive of it being close to their location and being free, given the nature of their job. It was recognised that some teams have to pay for parking, walking some distance which detracts from the nature of routine visits and emergency work. Some respondents said there was such limited parking available that they had to move their cars every three hours, or risk being fined, which was disruptive to meetings and added to the stress of the job. For one leaver, the parking situation would be the thing that could ‘tip her over the edge’:
I had to park a mile down the road and then I’d turn up at the meeting all hot and sweaty and all flustered. Those were the things that were stressful, not the work with the children and families. [Leaver 53]
Hot desking engendered plenty of discussion with similar views expressed by both stayers and leavers, in that most people would prefer to have their own desk, ideally sitting with their own team. One interviewee had experienced a restructure and her team was now dispersed across the office: she felt this detracted from their team spirit, which had been the main positive of the job for her.
The teamwork was the only thing that's keeping us happy …. So go back to the old system, yes, not have hot desking. [Stayer 11]

91
This issue has been listened to by a number of local authorities that had returned to fixed desk space to enhance staff well-being. One manager interviewed in the qualitative research stated:
We don't hot desk here… there was talk at one point but people were not happy, and I think people like to have their own space. [Stayer 90]
The issue of technical support generated discussion with a number of respondents from both leaver and stayer groups who mentioned that they had recently been or were waiting for an upgrade to IT resources such as mobile devices. The change from use of older technology to new smart phones was welcomed. The staff considered that good technology enabled agile working. It was particularly helpful to be able to use technology effectively in the car, between meetings.

92
7 Job satisfaction This chapter examines how satisfied social workers were with various aspects of their job, and overall.
Aspects of the job Social workers were asked how satisfied they were with:
• The sense of achievement they get from their work
• The scope for using their own initiative
• The amount of influence they have over their job
• The extent to which they feel challenged
• The opportunity to develop their skills in their job
The majority of social workers (over two-thirds across all aspects) were satisfied with each aspect of their day-to-day job (Figure 7.1).
Satisfaction was highest for having scope to use their own initiative (84%) and the sense of achievement they get from their work (83%). Satisfaction levels gradually weakened across the other measures (although still in the majority); around three-quarters felt challenged in their job (78%) and were satisfied with the opportunity to develop their skills (72%), and around two-thirds were satisfied with the amount of influence they have over their job (68%).

93
Figure 7.1: Social workers’ satisfaction with various aspects of their job, by job role
84%
83%
78%
72%
68%
89%*
93%*
89%*
79%*
86%*
82%
80%
77%
68%
64%
85%
82%
87%*
82%*
64%
The scope for using your own initiative
The sense of achievement you get from your work
The extent to which you feel challenged
The opportunity to develop your skills in your job
The amount of influence you have over your job
All
Senior servicemanager/director
Frontlinepractitioner
ASYE
Base: All currently employed in child and family social work (all=5,508; ASYE: 338; Frontline practitioner: 2,991; Senior service manager/director: 319) * denotes a significant difference from the average
Job satisfaction varied by job role (Figure 7.1): social workers in front line practitioner roles tended to be the least satisfied, in line with findings elsewhere in this report. They were less likely to feel satisfied than more senior members of staff (such as senior service managers) in relation to the amount of influence they have over their job (64% of front line practitioners compared with 86% of senior service managers) and the sense of achievement they get from their job (80% of front line practitioners compared with 93% of senior service managers). On other measures, they were less likely than those entering the profession (on an ASYE) to be satisfied with the opportunity to develop their skills in the job (68% of front line practitioners compared with 82% of ASYE social workers) and the extent to which they feel challenged (77% of front line practitioners compared with 87% of ASYE social workers).
Comparable, if less marked, findings were observed in terms of the length of time social workers had been in the profession. For instance, in relation to the amount of influence social workers have over their job, those who had been in the profession for less than 1 year were more satisfied (71%) than those who had been in the profession for 2-3 years (63%) who were in turn less satisfied than those who had been in the profession for 4-5 years (70%) or more.
This pattern supports earlier findings that this period – relating to front line practitioners who have been in child and family social work for 2-3 years – highlighting that this

94
appears to be a critical point for social workers where there is a ‘dip’ in satisfaction across a range of measures.
Social workers working in youth offending and education were consistently more satisfied than those working in services for children with disabilities, and fostering, in relation to the various aspects of their job. Most markedly, over three-quarters of those in youth offending (78%) and education (76%) were satisfied with the opportunity they had to develop skills, compared with 68% of those working in services for children with disabilities, or fostering.
For every aspect of their job, social workers from local authorities with an outstanding Ofsted rating were significantly more likely than social workers from authorities with a requires improvement rating to be satisfied. For example, around three-quarters (76%) of those in local authorities rated as outstanding were satisfied with the amount of influence they had over their job compared with two-thirds (65%) of those in authorities rated as requires improvement.
In line with previous findings, those with a physical or mental health condition were significantly less satisfied with all aspects of their job in comparison to those without. For example, 78% of those with a health condition reported feeling satisfied with the scope they had to use their own initiative compared with 85% of those without.
The role of managers within the local authority context also has a significant impact on levels of satisfaction. The vast majority (89%) of social workers who agreed that their manager was open to their ideas were satisfied with the the scope they had for using their initiative in their current job compared with half (50%) who disagreed with the statement. A similar proportion (86%) of social workers who agreed that their manager motivates them to be more effective at their job were satisfied with the extent to which they feel challenged in their job compared with just over half (52%) of those who disagreed with the statement.
The work itself Over three-quarters (78%) of social workers were satisfied with the nature of the work itself, with around one in 12 (8%) dissatisfied. Similar to the findings explored earlier in this chapter, satisfaction with the work itself was linked to:
• level of job (being lower amongst front line practitioners, at 74%, especially compared with more senior managers such as practice leaders (84%), team managers (88%) and service managers (also 88%); and
• the Ofsted rating of the local authority (being lower in local authorities rated as requires improvement (76%) compared with those rated outstanding (82%) or good (80%).

95
In the qualitative interviews with stayers and leavers alike, there were many examples of respondents getting satisfaction from seeing positive changes in people’s lives, particularly where whole families were involved, but also in circumstances where families were unable to stay together:
Getting a family to a stage where they are in a different position, and they are in a much better place. It sounds horrible, but sometimes where children are put into somewhere of safety [sic] [Leaver 23]
I think it’s rewarding when you get positive feedback from children and from families, or that you’ve actually been able to work with a child and make a change in their lives. [Leaver 2]
Practitioners acknowledged that because of the nature of their work, it was often difficult for families to thank them explicitly, rather, they were satisfied with witnessing positive outcomes for the people they worked with. Often this came in the way of ‘small wins’:
I guess the really rewarding things tend to be the really small wins […] I think those are the things that I’ve really liked and drawn on, is to, kind of, remember those things where you’ve just made a small change to someone’s life that may seem small to you but is actually quite big to them. [Stayer 16]
Although most of the leavers were able to identify positive aspects of their work, there were some amongst them who said they rarely found the work rewarding, such as one who said the only sense of achievement she felt was when it was possible to close a case, which did not happen often; and another who said that in her current role, she did not feel she was able to move families on, but felt she was following processes and was on a “hamster wheel”. However, she said that she did value the work she did in mentoring and supporting peers.
Another leaver, who was able to identify positive aspects of her work, suggested that collectively, social workers were not always good at doing so:
If you ever ask a social worker what they are proud of they will say, “Nothing”, because we are always so focused on things that aren’t quite going the right way. [Leaver 23]
Practitioners from both groups described the families they worked alongside with respect and recognised the importance of their role:
You know, it’s a privilege to be able to go into people’s homes and actually be part of their life and have insight into it, and working with the children it’s the most rewarding part of it. I think when you just know that if you’ve removed a child from a dangerous situation and, you know, made plans to make them safe, and once you know they’re safe it’s really relieving and rewarding. [Stayer 9]

96
Even though it doesn’t always feel like it, it’s certainly a privilege to be a social worker. There isn’t really another job that would allow you to be a part of people’s private lives in such a way. [Leaver 31]
It was in this context that the amount of time spent on paperwork impacted so negatively on their ability to form relationships with and respond to the families in their care. One stayer described this frustration;
I think it can be a frustration when, you know, your job is to make sure that everything is recorded properly and that there are lots of different forms and systems and all those things, that you sometimes feel like ‘I want to be out there working with families rather than sitting at a computer.’ [Stayer 53]
Some leavers suggested that the emphasis on recording and form-filling was linked to public criticism of social workers, and the need to justify and account for practice.
When you’re working with people you’re the first target if anything goes wrong...so we need to make sure we document support, whatever you’re doing. So, accountability is key. [Leaver 8]
The way that local authorities responded to Ofsted was seen as having some responsibility for this, in terms of placing more emphasis on data-gathering than face-to-face work with children and families:
We had a good Ofsted...there is now a drive for outstanding, and that push for outstanding has resulted in focus on performance and timescales, and not on practitioners and their quality [Leaver 36]
On the other hand, one leaver said that their poor Ofsted had been responded to positively by their local authority, and that she and some of the other social workers were enjoying their involvement with the ‘improvement journey’.
This struggle to balance direct work and office-based tasks was further inhibited by budget cuts, which practitioners in both groups recognised as having a detrimental impact on their ability to conduct positive work with families.
We’re seeing voluntary services disappear, and the early help services that are out there that could support us and support the family as well moving forward, all of them are disappearing and that’s really hard, it’s very hard for the families. [Stayer 90]
Some leavers were particularly vocal about the impact of austerity on vulnerable families, and the implications for children’s social work. Several of them talked about the challenges facing families as a result of poverty, and suggested that the reduction in service provision was resulting in their difficulties intensifying to the point where problems became intractable, with consequences for social work and social workers:

97
Make the job easier by putting more money into public services, so people can access services...You know, you reduce the problem at source rather than trying to fix the problem as it’s gone further on. Then you start getting staff leaving because it’s such a humongous task that you’re asking them to do. [Leaver 25]
Several linked financial constraints to organisational processes determining access to resources for families, which they sometimes interpreted as undermining professional autonomy:
You can’t make a difference. It’s the panels that say if you can make a difference or not...You’re not valued as an individual social worker. You’re just a person to give allocations to. [Leaver 11]
Some practitioners were able to reconcile this issue, and accepted that there were limitations to their role, however for others this was too challenging, and the emotional responsibility was overwhelming. One stayer described;
Sometimes, it’s just accepting that you’re not able to do everything you want to do. [Stayer 9]
Pay and job security In relation to their pay, more social workers were satisfied (49%) than dissatisfied (32%), with roughly one in five (19%) neutral (Figure 7.2). In comparison, satisfaction with job security was much higher (75%, with 8% dissatisfied).
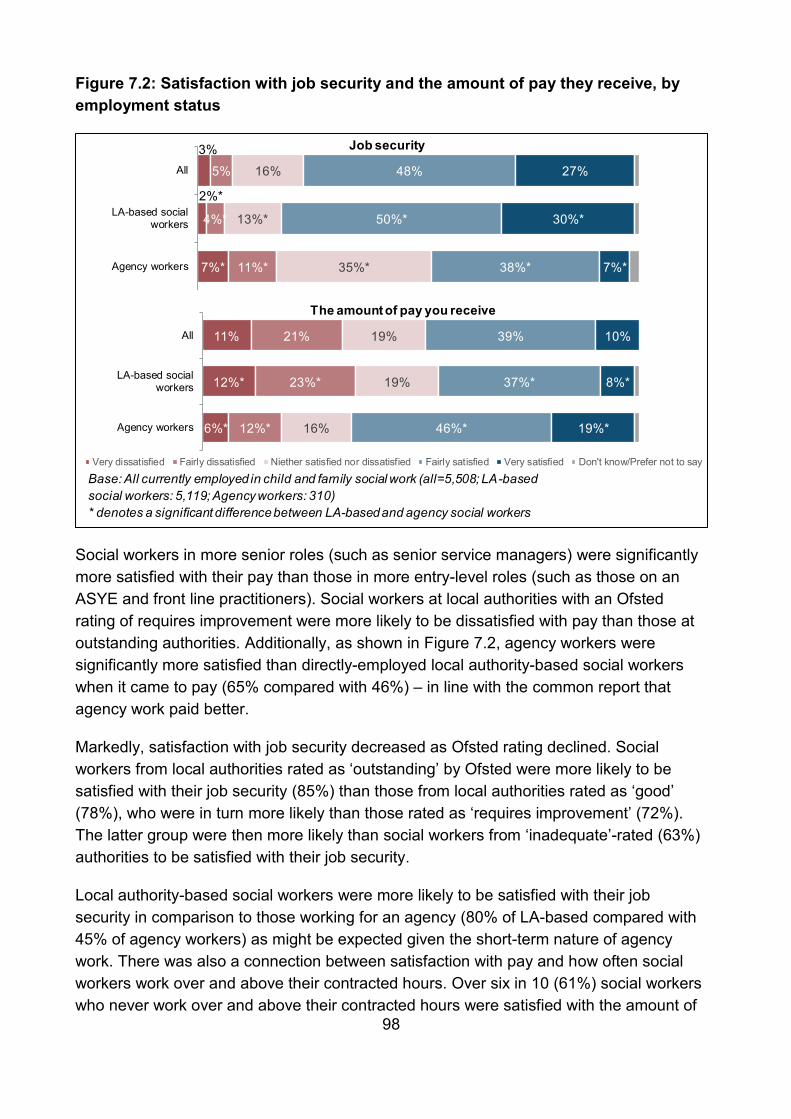
98
Figure 7.2: Satisfaction with job security and the amount of pay they receive, by employment status
3%
2%*
7%*
5%
4%*
11%*
16%
13%*
35%*
48%
50%*
38%*
27%
30%*
7%*
All
LA-based socialworkers
Agency workers
Job security
Base: All currently employed in child and family social work (all=5,508; LA-based social workers: 5,119; Agency workers: 310)* denotes a significant difference between LA-based and agency social workers
11%
12%*
6%*
21%
23%*
12%*
19%
19%
16%
39%
37%*
46%*
10%
8%*
19%*
All
LA-based socialworkers
Agency workers
Very dissatisfied Fairly dissatisfied Niether satisfied nor dissatisfied Fairly satisfied Very satisfied Don't know/Prefer not to say
The amount of pay you receive
Social workers in more senior roles (such as senior service managers) were significantly more satisfied with their pay than those in more entry-level roles (such as those on an ASYE and front line practitioners). Social workers at local authorities with an Ofsted rating of requires improvement were more likely to be dissatisfied with pay than those at outstanding authorities. Additionally, as shown in Figure 7.2, agency workers were significantly more satisfied than directly-employed local authority-based social workers when it came to pay (65% compared with 46%) – in line with the common report that agency work paid better.
Markedly, satisfaction with job security decreased as Ofsted rating declined. Social workers from local authorities rated as ‘outstanding’ by Ofsted were more likely to be satisfied with their job security (85%) than those from local authorities rated as ‘good’ (78%), who were in turn more likely than those rated as ‘requires improvement’ (72%). The latter group were then more likely than social workers from ‘inadequate’-rated (63%) authorities to be satisfied with their job security.
Local authority-based social workers were more likely to be satisfied with their job security in comparison to those working for an agency (80% of LA-based compared with 45% of agency workers) as might be expected given the short-term nature of agency work. There was also a connection between satisfaction with pay and how often social workers work over and above their contracted hours. Over six in 10 (61%) social workers who never work over and above their contracted hours were satisfied with the amount of

99
pay they receive compared with just over four in 10 (42%) who work over and above their contracted hours all the time.
The qualitative research unveiled a wide range of attitudes towards pay and job security, although this was not as significant an issue for stayers or leavers as might have been expected. However some practitioners in both groups felt that the difficult role of a social worker could be better financially rewarded. One key issue was pay inconsistency between local authorities:
I think pay is a massive thing, in terms of keeping people retained and I think, from the government’s perspective if you look across the whole country, every single local authority pays social workers something different and I don’t really understand why, it’s the same job! [Stayer 71]
Fairness in pay, not only the amount, was a concern for some of the leavers. For example, one felt that the difference in levels of responsibility between some family support workers and front line social workers, was not reflected in a pay differential of only £1000 p.a.; and another identified that as a result of a merger with another local authority, she would be working alongside social workers at the same level as her who were paid considerably more.
There were mixed feelings amongst both stayers and leavers about the introduction of retention fees implemented by some local authorities, with some recognising the positives that this could bring to areas such as child protection, where retention has been a challenge. Others however, had personally felt the frustration of having lost out on these payments as a result of sideways moves out of front line child and family work. One stayer had moved into another team due to difficult working relationships and missed out on a retention payment:
I was aware that I wouldn’t get it if I moved to fostering but I just felt like, you know, it was worth more than money not to work in that team any more. [Stayer 32]
There were strong feelings about the parity of the retention payments, with some saying it had caused resentment between staff:
There is a market supplement to try and retain staff, but it does cause discrepancy in terms of feeling valued because - yes, we end up… giving supervision….to those in frontline because they don’t have the experience ...but then it can feel…. ‘you’re being paid more than me’. [Stayer 12]
In the qualitative interviews, stayers were more likely to value the security of a permanent local authority position over working for an agency, whereas some leavers were planning to leave their local authority employment to register with an agency.
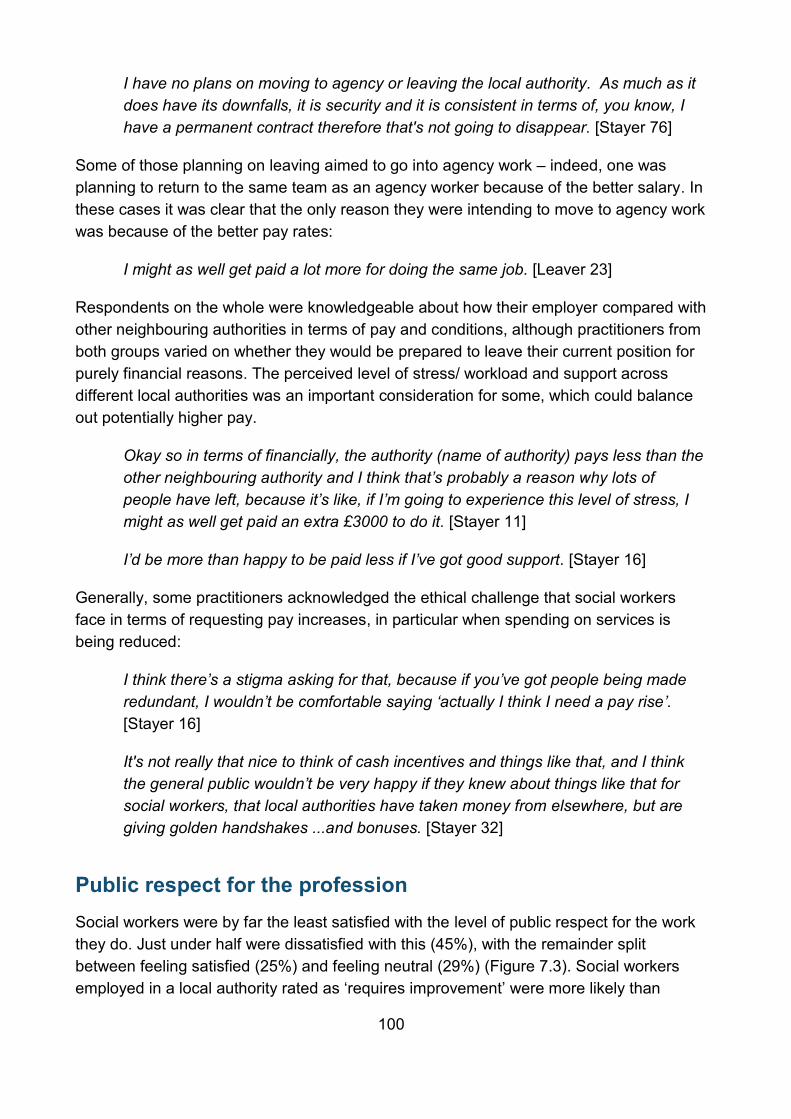
100
I have no plans on moving to agency or leaving the local authority. As much as it does have its downfalls, it is security and it is consistent in terms of, you know, I have a permanent contract therefore that's not going to disappear. [Stayer 76]
Some of those planning on leaving aimed to go into agency work – indeed, one was planning to return to the same team as an agency worker because of the better salary. In these cases it was clear that the only reason they were intending to move to agency work was because of the better pay rates:
I might as well get paid a lot more for doing the same job. [Leaver 23]
Respondents on the whole were knowledgeable about how their employer compared with other neighbouring authorities in terms of pay and conditions, although practitioners from both groups varied on whether they would be prepared to leave their current position for purely financial reasons. The perceived level of stress/ workload and support across different local authorities was an important consideration for some, which could balance out potentially higher pay.
Okay so in terms of financially, the authority (name of authority) pays less than the other neighbouring authority and I think that’s probably a reason why lots of people have left, because it’s like, if I’m going to experience this level of stress, I might as well get paid an extra £3000 to do it. [Stayer 11]
I’d be more than happy to be paid less if I’ve got good support. [Stayer 16]
Generally, some practitioners acknowledged the ethical challenge that social workers face in terms of requesting pay increases, in particular when spending on services is being reduced:
I think there’s a stigma asking for that, because if you’ve got people being made redundant, I wouldn’t be comfortable saying ‘actually I think I need a pay rise’. [Stayer 16]
It's not really that nice to think of cash incentives and things like that, and I think the general public wouldn’t be very happy if they knew about things like that for social workers, that local authorities have taken money from elsewhere, but are giving golden handshakes ...and bonuses. [Stayer 32]
Public respect for the profession Social workers were by far the least satisfied with the level of public respect for the work they do. Just under half were dissatisfied with this (45%), with the remainder split between feeling satisfied (25%) and feeling neutral (29%) (Figure 7.3). Social workers employed in a local authority rated as ‘requires improvement’ were more likely than
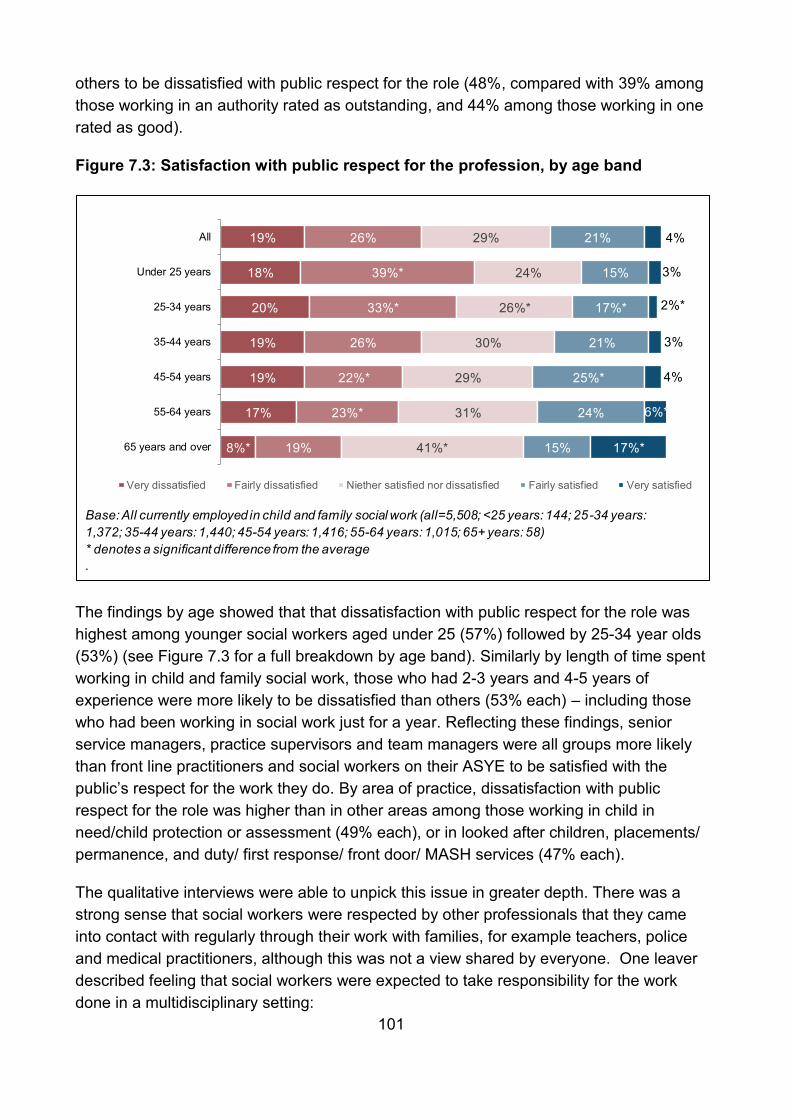
101
others to be dissatisfied with public respect for the role (48%, compared with 39% among those working in an authority rated as outstanding, and 44% among those working in one rated as good).
Figure 7.3: Satisfaction with public respect for the profession, by age band
Base: All currently employed in child and family social work (all=5,508; <25 years: 144; 25-34 years: 1,372; 35-44 years: 1,440; 45-54 years: 1,416; 55-64 years: 1,015; 65+ years: 58)* denotes a significant difference from the average.
19%
18%
20%
19%
19%
17%
8%*
26%
39%*
33%*
26%
22%*
23%*
19%
29%
24%
26%*
30%
29%
31%
41%*
21%
15%
17%*
21%
25%*
24%
15%
4%
3%
2%*
3%
4%
6%*
17%*
All
Under 25 years
25-34 years
35-44 years
45-54 years
55-64 years
65 years and over
Very dissatisfied Fairly dissatisfied Niether satisfied nor dissatisfied Fairly satisfied Very satisfied
The findings by age showed that that dissatisfaction with public respect for the role was highest among younger social workers aged under 25 (57%) followed by 25-34 year olds (53%) (see Figure 7.3 for a full breakdown by age band). Similarly by length of time spent working in child and family social work, those who had 2-3 years and 4-5 years of experience were more likely to be dissatisfied than others (53% each) – including those who had been working in social work just for a year. Reflecting these findings, senior service managers, practice supervisors and team managers were all groups more likely than front line practitioners and social workers on their ASYE to be satisfied with the public’s respect for the work they do. By area of practice, dissatisfaction with public respect for the role was higher than in other areas among those working in child in need/child protection or assessment (49% each), or in looked after children, placements/ permanence, and duty/ first response/ front door/ MASH services (47% each).
The qualitative interviews were able to unpick this issue in greater depth. There was a strong sense that social workers were respected by other professionals that they came into contact with regularly through their work with families, for example teachers, police and medical practitioners, although this was not a view shared by everyone. One leaver described feeling that social workers were expected to take responsibility for the work done in a multidisciplinary setting:

102
I spend my whole life chasing other people. It’s enormous. It’s ridiculous. An onerous task. Other people need to be as accountable as we are. [Leaver 11]
When it came to the general public, there was a sense amongst both stayers and leavers that they lacked awareness of the social work role, often reverting to popular stereotypes. Many referenced the negative portrayal of the profession by the print media and television as contributing to the negative public image. Some social workers also felt that media representations could erect barriers to work with families:
I just think that when you knock on a family’s door, you already have all those misconceptions to deal with before you start. [Leaver 36]
Another stayer was concerned about how unfair representation could impact on recruitment:
We’re not attracting people that could be really good social workers …. All they hear is negativity, so we're preventing people coming into the field that could be really good. [Stayer 19]
In addition to the professional, public and media perspectives, many practitioners felt that government could promote a more positive image of the profession, with some understanding this as a lack of political interest in the role. Interviewees had a strong sense that social work does not get as much support as other public sector services such as the NHS and emergency services, and described it as ‘a lonely profession’. Some practitioners described how they purposely withheld their profession when meeting people, until they could judge how this would be received:
I don’t necessarily straight away tell people I’m a social worker, I feel that, especially if they’ve got their own children, and I’m meeting with them and discussing in general conversation with people that you have on the day-to-day. I would always say I work in children’s services. It’s not until I get to know someone that I will then say ‘oh yes, I am a social worker’ I feel that’s just because, especially if they have children themselves, they’re quite easy to judge. [Stayer 15]
Overall job satisfaction Taking everything else into account, social workers were asked the extent to which they agreed that their current job was satisfying. Three-quarters (73%) agreed and just one in 10 disagreed (11%) (Figure 7.4) – agreement was higher in local authorities rated as outstanding (78%) or good (75%).

103
Figure 7.4: Extent of agreement with overall job satisfaction, by health condition
Base: All currently employed in child and family social work (all=5,508; physical or mental health condition: 862; no health condition: 4,516)* denotes a significant difference between social workers with a healthcondition and those without
3%
4%*
3%*
8%
11%*
8%*
15%
15%
14%
54%
50%*
55%*
19%
19%
20%
All
Physical or mental healthcondition
No health condition
Strongly disagree Disagree Neither agree nor disagree Agree Strongly agree
Again, front line practitioners were significantly less satisfied with their job overall than social workers in all other roles. Only 69% of front line practitioners agreed their current job was satisfying, compared with 86% of senior service managers and 79% of practice leaders. Other notable demographic differences were:
• Black African/ Caribbean/ Black British social workers were less satisfied than other ethnicities (69% - compared with 75% of White British social workers, for example) – this finding is interesting given that they were more positive on a range of other measures;
• Social workers who had a long term physical or mental health condition were less satisfied than those who did not have any health condition (69% compared with 73%) (see Figure 7.4); and
• Those who had caring responsibilities for family or friends were less satisfied than those who had other forms of caring responsibilities, or none at all (69%, compared with 75% of those with childcare responsibilities and 74% of those with no caring responsibilities at all).
Job satisfaction was strongly linked to future plans for staying in or leaving the profession, as might be expected. For instance, job satisfaction was highest among those planning to stay in child and family social work (81%) and lowest among those planning to leave local authority child and family social work:
• to move into the private or voluntary sector (45%);

104
• to move into a different area of social work, away from child and family roles (43%); and
• to move outside of social work altogether (32%).
Overall job satisfaction was also dependent on social workers’ primary motivation for entering the profession. High satisfaction with the job overall was associated with wanting to work with children and families (78%) and lower satisfaction was associated with those who wanted a stable job (65%). Notably, significantly fewer social workers who wanted to help people or make a difference generally (72%) were satisfied in comparison to those who had been motivated specifically by working with children and families.
The qualitative interviews explored how the very nature of social work practice meant that it was difficult to give a definite answer in relation to how satisfied they were in their role. Like many of their responses, practitioners understood satisfaction as fluid, often dependent on things that were happening in their immediate practice environment. Many practitioners described that whether they were satisfied or not would depend on what day, or even what time of the day, they were asked.

105
8 Views on career progression This chapter explores social workers’ reflections on their career to date, including a look at the factors contributing to, and barriers hindering, career progression.
Whether career progression has met expectations, so far Social workers were more likely to rate their career progression as ‘below my expectations’ (19%) than ‘above my expectations’ (11%) (Figure 8.1). Over half (57%) considered their career progression to be ‘in line with expectations’ and a minority either did not have any expectations (7%) or felt it was too early to make this judgement (4%).
Figure 8.1: Social workers’ impression of their career progression so far, by Ofsted rating
1% 2%* 1% 2%*7% 5%7%* 7%
11%*4%4%
4% 4%6%*
19%17%
18% 21%*20%
57%60%
57% 57%54%
11% 14%* 12%* 11%* 7%
All Oustanding Good Req. improvement Inadequate
Above myexpectations
In line with myexpectations
Below myexpectations
Too early to say
I don't have anyexpectations aboutcareer progression
Don't know / prefernot to say
Base: All currently employed in child and family social work (all=5,508; Outstanding: 521; Good: 2,666; Requires improvement: 1,853; Inadequate: 468)* denotes a significant difference between social workers at LAs with different Ofsted ratings.
Figure 8.1 shows that social workers from local authorities rated ‘outstanding’ (14%) by Ofsted were significantly more likely than those from authorities rated as ‘requires improvement’ (11%) or ‘inadequate’ (7%) to rate their career progression as above expectations.
A quarter (24%) of front line practitioners reported that their career progression so far had been below their expectations compared with 19% average. These findings did not, however, directly correspond to the length of time spent in child and family social work, where results were more polarised. Social workers who had worked in the profession for

106
any time over 2-3 years were consistently more likely to say their career progression had been below rather than above their expectations. For instance, 21% of those who had worked in the profession for more than 10 years said their progression had been below their expectations, whereas only 11% said it had been above.
By demographics, it is notable that women were more likely than men to say their progression had been above their expectations (12% compared with 9% of men). Conversely, the groups more likely to consider progression had fallen short of their expectations were social workers from Black African/ Caribbean/ Black British and Asian/ Asian British ethnic backgrounds (29% and 25% respectively, compared with 17% of White British social workers). Social workers who had a physical or mental health condition were also more likely than those who did not to consider their career progression to date had been below their expectations (26% compared with 18%).
As might be expected, those who were thinking of leaving local authority child and family social work within the next 12 months were more likely than those who were staying to rate their career progression as below expectations – particularly those leaving for the private/voluntary sector (35%), moving to a different type of social work (36%) or leaving social work altogether (43%).
This was supported by the qualitative research which found that stayers were predominantly happy with the speed at which they had progressed; understandably those who had been promoted in relatively short period were more satisfied.
I only graduated, sort of, at the end of August time 2014 and I’m already in a team leader or about to move into, well I’m in a management role, where, you know, that’s quite short in terms of by career progression! [Stayer 20]
Comparably, leavers were less content with their positions:
I would have liked to progress for the money, but there are not many senior jobs around and they tend to go to people who have been here the longest, and they’re the ones that get the promotions. Every manager has their own favourites within the team and lots of people have been working here before me. [Leaver 53]
Perceived enablers to career progression After rating their career progression, social workers considered which factors helped them to progress in their career, followed by the one main factor (Figure 8.2). The three most commonly cited career enablers, mentioned by roughly three-fifths of social workers each, were: a good relationship with other colleagues (63%); personal determination and ambition (60%); and good support from managers (59%). This was followed by availability of training/ Continuing Professional Development (CPD) (42%), flexibility/

107
taking on diverse roles (30%), and the amount and/or quality of supervision they received (25%).
Figure 8.2 Social workers’ reported enablers to career progression, ranked by main enabler (prompted)
Base: All currently employed in child and family social work (5,508)
60%
59%
63%
42%
30%
17%
21%
17%
25%
19%
15%
11%
7%
3%
8%
3%
28%
23%
17%
6%
3%
3%
2%
2%
1%
1%
1%
1%
1%
3%
3%
Personal determination / ambition
Good support from managers
Good relationship with other colleagues
Availability of training / CPD opportunities
Flexibility / being able to take on diverse roles
A manageable workload
Good organisational leadership
Quality of initial social work training
Amount and / or quality of supervision
Flexible working / TOIL
Opportunities for innovation
ASYE
Ability to relocate
Working in a single practice model
Other
Nothing has helped me
Enabler
Enabler: Main
The most commonly cited main enabler to career progression was ‘personal determination and ambition’, mentioned by more than a quarter (28%), followed by ‘good support from managers’ (23%) and ‘good relationships with other colleagues’ (17%). The next most common main enabler was the ‘availability of training opportunities’, with around one in 20 social workers (6%) reporting this.
Social workers who were directly employed by the local authority were significantly more likely than agency workers to say good relationships with other colleagues had helped them to progress in their career (65% of directly-employed social workers compared with 53% of agency workers).
Social workers from authorities with an ‘outstanding’ Ofsted rating were more likely to than others to report that virtually every factor had helped them to progress in their career, suggesting they benefited from a more supportive work environment generally. For instance, two-thirds (67%) of those in ‘outstanding’ authorities reported that good support from managers had helped them to progress in comparison to less than six in 10 in ‘inadequate’ authorities (56%).
Focusing on the main enabler only, there were some key differences by demographics. Women were more likely than men to cite personal determination/ ambition (29%

108
compared with 25%). Black African/ Caribbean/ Black British social workers were also more likely to cite this compared with some other ethnic groups (33%, compared with 28% of White British social workers).
The length of time spent in child and family social work was also a key factor, showing that those who had been in the profession for one year or 2-3 years prioritised relationships with colleagues as a key enabler (33% and 24% respectively, compared with 17% overall); while those who had been in the profession for 4-5 years or longer were far more likely to cite personal determination/ ambition (mentioned by 32% of those who had worked in the profession for ten or more years, compared with 28% overall). Similar patterns were found by age and seniority of role, which are all linked.
Social workers interviewed in the qualitative research felt there was a clear progression route within their authorities, from ASYE through to advanced practitioner, consultant and principal social worker. Factors that enabled practitioner’s progression along this route included management support, willingness of employers to fund continuing professional development (CPD), sideways moves into other teams, and individual worker characteristics. Progression was felt to be transparent, in terms of the pathway from ASYE into senior social worker roles:
There’s very clear guidance on progression of social workers from ASYE to fully qualified social worker, to tier 4, which is what is essentially senior social worker.[Stayer 20]
Availability of continuing professional development was recognised as an important enabler, in relation to both access to internal resources and willingness of employers to fund external qualifications and training. Generally there was a positive experience of internal CPD:
There are lots of training opportunities available, I went on some really good training yesterday, and that’s literally just look on the system, what training is available, and book it […] we’re encouraged at team meetings ‘Make sure you’re going on training – keep up with your development’. [Stayer 11]
I’ve been encouraged to do my practice educator course and I think in line with that they would encourage you to go for a senior post or an advanced practitioner post once you’ve got that. [Leaver 2]
Ability to attend CPD activities was affected by practitioner’s availability. Pressures of trying to organise caseloads around time out to attend training was often identified as challenging. Another stayer who had recently moved into an advanced practitioner role described:
You can be so overwhelmed with the work and the task that you’re doing that actually you don’t even have the space to think. [Stayer 2]

109
I could either be booked onto them and I couldn’t do it because I’d have other things that would be prioritised over it. That would be court attendance, which was something I couldn’t stop…. I found myself in other training opportunity...and I had made allowances to go for, but because my mind was on other things, I wasn’t able to absorb myself in it. I’d still be getting phone calls and emails, and pulled in different directions. [Leaver 38]
Support from both direct line managers and the senior management team was seen as crucial in determining successful career progression. A practitioner planning to become a consultant social worker described how their manager has facilitated this:
That’s about how supportive your manager is, and how much your manager trusts you, I think, and so me and my manager came up with a plan about how we would do that in a stepped way. [Stayer 16]
However, this support was perceived by both groups as inequitably distributed and there was a sense that specific individuals were targeted for progression and offered favourable treatment by management in order to facilitate promotion.
I think it’s dependent on managers, if you’ve got a supportive manager, some people get advanced and other people don’t. [Leaver 1]
Perceived barriers to career progression The vast majority (85%) of social workers reported barriers to career progression. Too high a workload was, by a considerable margin, the most commonly perceived barrier, mentioned by around half (48%) of social workers, followed by poor organisational leadership (26%) and poor support from managers (25%), highlighting the importance of senior figures within the local authority context. A ‘lack of meaningful progression opportunities’ was cited by just over one fifth (22%) of social workers.
In comparison to enablers, a lower proportion of social workers reported barriers to career progression either because they did not want to progress to more senior roles (11%) or because they had not experienced any barriers to progression (15%), equating a quarter (25%) of all social workers.
As seen in Figure 8.3, too high a workload (28%) was nearly three times more likely to be reported as the main barrier to career progression than any other factor.

110
Figure 8.3: Social workers’ reported barriers to career progression, ranked by main barrier
www.iffresearch.com
Barriers to career progression
9
14%
6%
3%
1%
1%
1%
2%
3%
4%
8%
9%
10%
28%
15%
11%
6%
9%
3%
7%
17%
10%
15%
25%
26%
22%
48%
None - no barriers
Not wanting to progress to more senior role
Other
Lack of flexible working / TOIL
Unable to relocate
The quality of initial social work training
Poor quality or lack of supervision
Childcare responsibilities
Lack of training / CPD opportunities
Poor support from managers
Poor organisational leadership
Lack of clear / meaningful progression opps
Too high a workload
Barrier
Barrier: Main
Base: All respondents still working in child and family social work (5508)
Fig 8.3
The longer a social worker had been in the profession, the more likely they were to report barriers to progression. For instance, social workers who had been in the profession for more than 10 years were significantly more likely than average to report that poor support from managers (29%), poor organisational leadership (29%) and a lack of training opportunities (16%) had been barriers to career progression.
Additionally, social workers with physical or mental health conditions were significantly more likely to report several of the barriers to career progression than those without a condition, most markedly in relation to poor support they received from managers (34% of those with a condition reported this as a barrier in comparison to 23% of those without).
The qualitative research also explored barriers to progression and identified a number of key issues in addition to those raised by the survey. Part-time practitioners felt that in order to be considered for progression opportunities, particularly for management roles, they would have to move to a full-time contract.
Working part time, you’re very limited in your promotion opportunities because it’s all 37 hours. [Stayer 10]
A number of leavers also noted that not being in a high profile front line team e.g. fostering and adoption or working with children with disabilities was not seen as positive for gaining promotion.

111
Respondents in both groups also felt that having a young family or going on maternity leave may influence their success in securing a promotion. Where some respondents felt they were making a choice to wait until they had a more stable family life to apply for promotion, others felt that presumptions about their availability may impact on the opportunities they were offered. A stayer who was due to go on maternity leave stated:
I’ve already had a period of maternity leave for my first child and obviously now I’m about to go off on maternity with my second, so obviously things have halted a little bit because obviously that took priority. Once I come back after this period of maternity, I fully intend to progress then with that I want to do in terms of stepping up to the next stage [Stayer 66]
Both stayers and leavers identified that progression opportunities were limited by the number of management positions available. So, in order to be promoted into a more advanced role, the person currently occupying this position would have to leave. Although working in a longstanding team was seen as a positive compared with having a high staff turnover, it was also recognised as a barrier to promotion. One stayer hoping to progress to advanced practitioner describes the impact of this:
If there’s not a consultant post available, then you can’t really progress and that also means that your pay is stuck at a certain level [Stayer 53]
There are opportunities but it’s very slow, you know, and it’s very hard. You put a lot of work in going up a grade and by the time you get there. In terms of monetary reward, it’s kind of everything else has gone up, you know, living costs, so it feels like experienced workers are not valued very much. [Leaver 1]
Both groups felt like promotion into a management role would remove them from front-line work as it was widely accepted that managers didn’t carry caseloads. For some this was presented as a dilemma as they were passionate about their work with families:
I wouldn’t want to be a manager because I wouldn’t get to do the job that I love, which is going out on the ground and working with people [Stayer 11]
Anything, kind of, a step up the career ladder would take me further away from families and that’s not something I want to do [Stayer 53]
Ways to maximise enablers and address barriers The qualitative research delved deeper into views and examples of ways that enablers to progression could be maximised and barriers suppressed. Alongside identifying the enablers and barriers to progression, practitioners in both groups also made suggestions to address the issues they raised.

112
One key factor that social workers mentioned was flexibility to move around between different teams, for example if there were no senior posts available within one particular area.
So, if you’re prepared to do that and move with it, kind of, the opportunities that come around and you’re prepared to travel a little further, that’s probably the biggest impact on whether you’ll be able to take those roles [Stayer 20]
Stayers and leavers were clear that opportunities should be fair and equally distributed amongst employees, even when they had benefited from this inequity themselves. They felt that a more transparent career development path for the profession would be of benefit. One stayer who had recently accessed training themselves stated:
I think there probably should be a bit of a clearer expectation and career development path that actually, you know, ‘this is what you do and this is what has to be done’ so for those who are less keen, and for a fairer distribution for those who are, you know… [Stayer 2]
A unique response to progression challenges had been developed by one employer in the form of a ‘coaching team’. This team was available to practitioners to support them in developing the skills required to progress. One stayer had utilised this team and had a positive experience:
There are designated people that we can talk to about that, in terms of our career progression as well, which is what I went to speak to someone about, in terms of whether I wanted to make the next level and progress in my career, and how I went about that, really. [Stayer 15]
Both stayers and leavers were keen to progress in alternative directions to team management. Many practitioners had innovative and creative ideas about roles they would ‘ideally’ hold but felt these were not always possible to pursue within the available progression framework. Opening up channels to discuss these ideas could facilitate the creation of new roles for practitioners that would function as alternative progression routes to team management roles. This would also reduce the ‘bottle-neck’ in progression noted by many respondents; where practitioners are waiting for a colleague to leave before being able to achieve promotion into their role.
One advanced practitioner looking to move into management suggested a hybrid role which would enable them to combine two areas of practice they were passionate about:
I’d really like to sort of, do the team manager type role but also, look at having a strategic look at… I quite like doing projects and that type of thing. So, something that’s a hybrid of those would be great, although that probably doesn’t exist. [Stayer 19]

113
Another stayer in a management role suggested developing ‘champions’ in specific practice areas as a way of progressing those not interested in management:
People want to expand their knowledge in other ways, maybe they want to think about a specialism in some subjects that they become a champion for. I think there just needs to be more opportunity to entice people to stay once they’ve got a bit of experience and that they don’t have to sit and wait for a senior post to come up to be able to progress in their career. [Stayer 53]

114
9 Short-term career plans and reasons for wanting to leave social work Identifying social workers’ short-term career plans and reasons for leaving or wanting to leave their current positions is important to help to understand how retention might be improved. This chapter explores career plans over the next 12 months, perceived transferability of social work skills outside the sector, reasons for leaving and potential influences on retention. The aim is to better understand pull/push factors that lead to social workers remaining in their position, moving within the sector or leaving the sector altogether and to find out where social workers go when they leave, and why.
Career plans in the next 12 months and beyond All social workers, including agency staff, were asked where they expected to be working in 12 months’ time, if at all. Figure 9.1 shows that almost three-quarters (72%) planned to be working directly in local authority child and family social work, with one in ten (11%) planning to be in agency work. A further 11% planned to move out of the sector and/or profession, including moving into different areas of social work.
Figure 9.1: Where social workers see themselves in 12 months’ time
www.iffresearch.com15
72%
11%
3%
3%
5%
2%
4%
Working in CAFSW for a local authority -directly
Working in CAFSW for a local authority - via anagency
Working in CAFSW - in the private or voluntarysector
Working in social work, but outside of CAFSW
Working outside of social work altogether
Not working at all
Don't know / prefer not to say
Base: All those currently employed in child and family social work (5,508)
Figure 9.1
The likelihood of continuing to work for a local authority directly in the next 12 months increased with time spent at the employer. For example, those who had been employed by the local authority for 4 years or more were more likely to intend to be working there in 12 months’ time than those who had been employed for three years or less (80% compared with 64%). Those who had been employed by the local authority for a shorter length of time were more likely to expect to be working at an agency in the next 12

115
months (18% of those who had been at the employer for three years or less, compared with 4% of those who had been there for 4 years or more).
Expectations of being employed directly by a local authority in the next 12 months were lower among front line practitioners: while four in five (80%) were employed directly by a local authority at the time of the survey, only two-thirds (68%) expected to still be in that type of employment a year later (compared with 72% overall). Frontline practitioners were more likely than those in other job roles to expect to work for agencies, with children and families in the voluntary or private sector, or outside of child and family social work altogether. Those on an ASYE were more likely than average to plan on working in another area of social work (6% vs. 3% on average), which may suggest that new entrants plan to experience a range of social work areas.
Expected movement between direct employment by a local authority and agency was most common in social workers employed by agencies at the time of the survey, with a quarter (25%) of agency staff expecting to be employed directly by a local authority in 12 months’ time. A small minority (3%) of local authority staff were expecting to make the reverse switch.
All social workers who had left or were considering moving to a new sector (5% of all respondents) were asked how much they thought they would use the skills they had acquired in social work outside the sector. The majority (85%) of these social workers perceived that their skills were transferable beyond the sector (49% to a ‘great extent’ and 35% to ‘some extent’). Only a minority were more negative about the use of their skills in other sectors: 6% said they did not expect to use them very much while just 4% said ‘not at all’.
Reasons for leaving or considering leaving child and family social work The survey explored the reasons for leaving, or considering leaving, child and family social work. Those that were considering leaving, or had left, were asked why, followed by their main reason if they provided more than one (Figure 9.2).
Issues with general workload and working time were relatively prominent: 30% mentioned the high caseload, 28% the amount of paperwork and 24% the general working hours. Another important driver was the culture (28% reported that they did not like the working culture of local authority social work), while the job being incompatible with their family or relationship commitments (21%) and social workers feeling that they were not making the best use of their skills or experience (20%) were also mentioned relatively frequently.

116
When asked for the single main reason for leaving or considering leaving local authority social work, the most common reason cited was the dislike of the working culture (13%), followed by retirement and a high caseload (both 12%), not making the most of skills or experience (10%) and the job being incompatible with family or relationship commitments (9%). Only 3% cited the pay/benefits package and 4% the general working hours as the main reason.
www.iffresearch.com16
Base: Social workers who have left, or are considering leaving, social work (617)
28%
15%
30%
20%
21%
9%
13%
28%
24%
4%
14%
6%
9%
13%
12%
12%
10%
9%
6%
5%
4%
4%
4%
3%
5%
10%
I don't like the culture of local authority social work
I will be retiring / retired
The high caseload
I did not/am not making the best use of the skills or experience Ihave
It is not compatible with family or relationship commitments
Personal reasons (e.g. health)
It is just not the right type of job for me
The amount of paperwork
The working hours in general
More suitable opportunities/opportunities for progression in relatedfields
The pay / benefits package
Other
Don't know / prefer not to say
Reasons forconsideringleaving
Main reason forconsideringleaving
Reasons for leaving / considering leaving local authority social workFigure 9.2
Figure 9.2: Reasons for leaving, or considering leaving, local authority social work
Issues around workloads were felt most keenly by those in more junior positions, particularly those undertaking an ASYE. For example, those on an ASYE or frontline practitioners were more likely than average to cite the high caseload as a reason for leaving or considering leaving (61% by ASYE, 35% by frontline practitioners, compared with 30% on average) and the amount of paperwork (44% and 33% respectively, compared with 28% on average).
Those employed directly by a local authority were more likely to cite workload and working time issues than those who worked for an agency (29% of local authority employees cited the amount of paperwork and 24% the working hours, compared with only 9% and 10% respectively for agency staff).
Potential influences on retention Social workers who said they had left or were considering leaving (10% of all survey participants) were asked what may encourage them to remain in or return to local authority child and family social work in future.

117
Figure 9.3: Factors that would influence social workers to remain or return to local authority child and family social work
www.iffresearch.com17
Base: Social workers who have left, or are considering leaving, social work (617)
41%
36%
36%
22%
22%
20%
19%
5%
19%
1%
5%
13%
11%
18%
8%
13%
21%
11%
11%
7%
2%
2%
2%
2%
1%
1%
0%
0%
0%
18%
6%13%
A more manageable workload (caseload)
Higher pay
A more manageable workload (admin / paperwork)
Better / more promotion/ progression opps
Better working environment/ technology
The ability to work from home
Flexi-time
Job-sharing
Other financial incentives such as overtime pay
Improvements to job satisfaction
Subsidised childcare
Better / more training opportunities
The ability to take time off in lieu (TOIL)
No, nothing would encourage me
Other
Don't know / prefer not to say
Factors
Main factors
As shown by Figure 9.3, social workers commonly cited improvements around workloads and remuneration. For example, the most commonly mentioned factors were: a more manageable caseload (41% said this would be a factor and 21% said this would be the single main influence), higher pay and a more manageable workload in terms of admin and paperwork (36% said this would be a factor for both). While other factors were mentioned fairly commonly under ‘all factors’, such as: better progression opportunities (22%), better working environment and technology (22%), the ability to work from home (20%), and flexi-time (19%), these were rarely cited as a single main factor that would encourage a social worker to remain in or return to child and family social work.
Of the 18% who reported that there was nothing that would encourage them to remain or return, over half (53%) of these were not planning on working at all in 12 months’ time, mostly due to retirement, while over one third (37%) were planning on leaving child and family social work altogether.
As with reasons for leaving or considering leaving the sector, it was those undertaking an ASYE, front line practitioners and those with a physical or mental health condition who were more likely to report that more manageable workloads could be a factor in them remaining or returning to child and family social work in future.
Qualitative participants talked about the range of issues that have already been mentioned in the report, such as workloads, bureaucracy and paperwork, out of hours

118
working, the emotional demands of the work and organisational factors. However, these intersected with individual issues including health problems (sometimes attributed to work pressures), family commitments, changes in personal circumstances, financial pressures and career aspirations.
Interview respondents who expressed an intention to leave their posts, or who had actually done so since completing the survey, were asked about their reasons; if they had changed their minds since the survey they were asked what had happened to bring this about. At the time of writing this report 20 ‘stayers’ had been interviewed and all were anticipating remaining in their posts. Two had moved house but were keen to continue to commute as they liked the local authority they worked for, and had been there for 5 years. Two discussed in some depth that they would consider moving to other local authorities if there was any repetition of negative experiences with their managers and one highlighted that her main reason to stay was the ability to work flexibly which helped with family life.
Of the 20 ‘leavers’ interviewed, who had indicated an intention to leave their posts within 12 months of the survey, five were no longer intending to do so, although most of these remained ambivalent about the prospect of remaining in social work over the next five years. Some of these who were intending to stay in their current post for the foreseeable future had started new roles since the survey. One leaver was serving a notice period before moving to another local authority closer to her home, where she hoped things would be different, and that there would be less pressure to work additional unpaid hours:
I have to see that for myself before I decide whether or not this is career-wise what I want to do for the long term [Leaver 36]
Others seemed simply to have decided to carry on for the time being, and one had discovered she was pregnant and planned to stay at least for the period of her maternity leave.
I really felt that I couldn’t do any longer within that team before getting pregnant…I think I’ll probably consider my options when I’m on maternity leave and look at different careers completely. I feel at the moment that social work’s not for me any more [Leaver 16]
Of those with clear intentions to leave, four were planning to leave social work altogether. One individual had worked for many years with children and families, but only qualified as a social worker more recently. She had found that as a qualified social worker she had little direct contact with children, and was frustrated with timescales, bureaucracy and organisational culture, but the tipping point for her was her perception that a grievance was not adequately managed by her organisation. She was planning to leave, but leaving the children and families she worked with was difficult:

119
Nobody will tell me I have to meet this, or tick a box…It’s a doddle compared with what I do now. There is nothing that frightens me in that scenario. Yes…I’m gutted, I will be so…oh, I’m filling up… [Leaver 11]
Another was finding the emotional and practical demands of the work were impacting on her availability to her own children, and was about to leave to take a lower paid job as a support worker, and planning to prepare to retrain as a midwife.
The third individual was considering options for a role outside social work, probably still working with children but in a more positive, less stressful way, such as teaching children’s yoga. Another was returning to study in order to qualify as a drama therapist in order to work therapeutically with children. This person had sought support from his employer to undertake the qualification but this was not available. He thought he might return to statutory social work if there was a role available in which he would be able to use his therapeutic skills.
Amongst the ‘leaver’ group who were now intending to remain in children’s social work, there were three other respondents who were intending to move to work for agencies. Two of them said that the reason for this was primarily financial. One was a career changer who said that after 40 years in the public sector, latterly in management positions, the rate of pay as a recently qualified social worker was not enough for him to be able to meet all his financial commitments. Agency work would allow him to
“…generate an income that will pay my rent and pay my bills, and give me the flexibility to spend time with my son over the school holidays.” [Leaver 25]
The key motivation for moving into agency work was financial, followed by greater flexibility.
“There’s such a shortage of social workers, you see people coming in and they’re earning so much more money than you…There’s no reason for me to stay doing what I’m doing if I can earn more money and still do it.” [Leaver 29]
Another respondent was ‘probably’ going to become an independent social worker within the next 12 months. She was dissatisfied with the unrealistic caseload, amount of paperwork and rate of pay in her current post and thought that it would be little different in any local authority. Becoming independent would mean that she could would have control over the work she did and how much she took on.
The other ‘leavers’ were still dissatisfied with aspects of their jobs (such as pay, paperwork, and team structures), and were considering their options. For example, one leaver was generally positive about her experience as a social worker, but felt there were limited progression opportunities in her authority and was unhappy that her team was the only front line team who had not been included in a retention scheme, which had seen other frontline social workers receive a bonus payment. She said that if the retention

120
payment was extended, or if an opportunity arose for her to move into a more specialised role with greater opportunity to develop she might consider staying in the local authority.
Another leaver spoke for many of those interviewed when she said that she often doubted whether she could continue as a social worker, and would like to work with children and young people in a more direct way, and in a less stressful role, perhaps in the voluntary sector or in support work:
“When you’re having a really good week, you feel really satisfied and think, “This is why I went into this career and this is why I wanted to do this job.” Other times, when you’re having a really difficult, sort of high-pressured time, you think “Can I continue? Is it really worth it?” [Leaver 28]

121
11 Conclusions The findings in this report provide a comprehensive picture of the issues facing local authority child and family social workers and the factors influencing job satisfaction and retention. Overall, the majority of social workers who took part in the survey were motivated to enter the profession for altruistic reasons, found their job satisfying, felt loyal to their employer, and planned to stay in local authority child and family social work in the next 12 months. Most were positive about their line manager, in particular that they were open to ideas and recognised when they had done their job well. When asked about various aspects of their job, satisfaction was highest for having scope to use their own initiative and the sense of achievement they get from their work. The majority of social workers also felt their entry route had prepared them well for the profession.
It appears that 2-3 years post qualification is a crucial point, as people move out of the ASYE year. ASYE was viewed positively given its focus on managed caseloads and time for post-qualifying learning. For some, the experience after this was a shock as they felt no longer protected and were expected to be functioning as an experienced social worker. Front line practitioners who had been in child and family social work for 2-3 years tended to be less satisfied on a range of measures, and reported the highest levels of stress. There is a need to explore how to better support the transition out of ASYE into experienced practitioner roles in order to support retention and develop resilience.
The majority of social workers who took part in the survey worked more than their contracted hours and the qualitative research revealed that social workers often expected to do so in order to fulfil their roles. On average this amounted to working seven hours per week more than they were contracted to work. Even those who worked part-time, often because of caring responsibilities or to manage their well-being, reported regularly working on days for which they were not paid. Social workers in the qualitative interviews felt that front line work did not fit well with caring responsibilities outside of work, such as having young children. Both those with such caring responsibilities and those without, recognised this as a challenge. Flexible working arrangements were welcomed as a way to manage this issue, such as being able to work from home or while travelling, enabled by good IT. However, in the qualitative interviews, part-time work was perceived as a barrier to progression. This is something that can be explored in future waves of the research.
Around half of the social workers who took part in the survey felt stressed by their job. In particular, where practitioners felt they had an excessive caseload or unmanageable workload, they recognised that this impacted on their ability to engage and work successfully with families. Often bureaucratic procedures and paperwork were seen as getting in the way of this engagement, and there is a need to explore ways to reduce unnecessary bureaucracy.

122
The qualitative interviews identified that the major source of support for social workers was their relationship with their colleagues/ team, and both stayers and leavers talked about how critical this was for keeping them in social work practice. The team manager was also an important factor here. Overall, there was variety in the way respondents felt they were supported by their employers in relation to their well-being, with some organisations providing a spectrum of much needed support and others providing very little. It is evident that organisational culture has a role to play in encouraging healthy working practices and increasing employee confidence in accessing the available support.
There was a strong feeling that the public did not really understand what social workers were doing on their behalf. However, respondents were positive about the level of respect they received from other professionals. In terms of recruitment, this public perception is something that needs to be addressed in order to raise the profile of and respect for the profession more widely, which could help to attract more applicants.
One of the most striking features of the qualitative interviews was the similarity in responses and how precarious the positioning was between staying and (thinking of) leaving. Any one of the features identified in the report, except for the leavers at the extreme end of the spectrum, was not enough to tip a worker from staying to leaving. It is unclear how many of the negative features need to be present before child and family social workers decide it is time to move on, or what combination of factors need to be present to retain them, and this will be explored in future years of the study.

123
Appendix 1: Methodology
Overview of methodology The study comprised three core components:
• Preliminary face-to-face qualitative interviews with 25 child and family social workers in five different local authorities, to explore issues around recruitment and retention and inform questionnaire development;
• A longitudinal mixed-methods online and telephone survey of child and family social workers, to be conducted across five years (with 2018/19 being the first year, or Wave 1, conducted between November 2018 and March 2019) – including an extensive pilot phase in September-October 2018;
• At the end of each survey wave, 40 follow-up qualitative telephone interviews with a structured sample of ‘stayers’ and ‘leavers’ – defined as those who indicated that they planned to stay in local authority child and family social work over the next 12 months, and those who indicated they were planning to leave (in Wave 1 only – in subsequent waves, the ‘leavers’ sample will comprise actual leavers).
Local Authority recruitment and profile In order to build a sample of local authority child and family social workers, IFF wrote to Directors of Children’s Services in all 152 local authorities/ Children’s Trusts to invite them to take part in the research. Ninety five local authorities/ Children’s Trusts in England agreed to participate in the study. This accounted for approximately two-thirds of all local authorities/ Trusts in England, providing a good spread by region and Ofsted rating (see Tables A.1-A.3 overleaf for a detailed breakdown).
Sixty-four areas agreed to take part by providing a census of their in-scope staff work email addresses, and in some cases work telephone numbers (via a secure transfer site) and a further 31 agreed to sending out an open link to their in-scope staff on our behalf.

124
Tables A.1-A.3: The profile of participating Local Authorities in England
Number invited 152
Number agreed 95 LA sending invitations 31 IFF sending invitations 64
% agreed to participate 63%
Declined to take part 40
Region
Total LAs in England
Agreed to participate
% of LAs in each region that
agreed to participate
North East 12 9 75% North West 23 13 57% Yorkshire and the Humber 15 7 47% East Midlands 9 7 78% West Midlands 14 9 64% East of England 11 8 73% South East 19 11 58% South West 16 9 56% Greater London 33 22 70% TOTAL (ENGLAND) 152 95 63%
Ofsted Rating15
Total LAs in England
Agreed to participate
% of LAs in each category that agreed to
participate 1 (Outstanding) 3 1 33% 2 (Good) 54 39 72% 3 (Requires improvement) 72 45 64% 4 (Inadequate) 23 10 43% TOTAL (ALL CATEGORIES) 152 95 63%
Social worker invitations Where sample was provided direct to IFF it was possible to send an individualised survey link, targeted reminders, and (where a work phone number was provided) to conduct a
15 Local authority children’s services departments are regularly inspected by Ofsted and therefore their ratings are subject to change. The distribution in this table is based on Single Inspection Framework (SIF) Ofsted ratings as of June 2018, when local authorities were first approached about taking part in the research. The information is published by the Association of Directors of Children’s Services (ADCS): https://adcs.org.uk/inspection/article/sif-outcomes-summary

125
final top-up survey using Computer Assisted Telephone Interviewing (CATI). Where the survey was conducted using an open link, the relevant local authorities were asked to send out reminders to staff, but these could not be targeted at non-responders and therefore were less frequent.
Pilot and soft launch Two pilot exercises were carried out in advance of the full survey launch, each with a small sample of social workers (75 and 400 respectively).
The first pilot commenced on 3 October 2018 and lasted for six days. The second commenced on 19 October 2018 and lasted for 12 days. The purpose of each exercise was predominantly to test the content and length of the survey. Each exercise also presented the opportunity to examine the achieved response rate (11% and 13% respectively) and to consider the best means for maximising the return.
Following the pilot phase, a two-day soft launch commenced on 7 November 2018, with a sample of 2,000 social workers. IFF ran the data collected as part of this exercise through a series of quality control checks, to ensure the survey was working and interpreted as intended. Respondents were also given the opportunity to email queries to a dedicated survey inbox, which was reviewed before the survey was signed off for mainstage.
Feedback from pilot participants was positive, with little need for revisions. Deletions were made between the two pilots to address the length of the survey however, which was approximately three minutes over the target interview length (20 minutes) in the first pilot.
A number of different reasons were considered for the lower than desired pilot response rate. These were subsequently built into the mainstage strategy and included:
• The impact of local authority firewalls and email filters, with local authorities asked to whitelist communications from the IFF Domain.
• Content and timing of the survey invitations: between pilots, the survey invitation was condensed and reviewed to ensure the content was inviting and easily digestible. In the second pilot, two different subject lines were tested and found to yield a similar level of response.16 As a result, different subject lines were used and alternated throughout the mainstage.
16 ‘Have your say on social work’ for the first mailing and then changing to ‘Take part in landmark social work research’

126
• Survey endorsement and engagement activities carried out by DfE, IFF and relevant sector bodies.
Mainstage The mainstage launched on 12 November 2018 with the online survey, and concluded on 13 March 2019; the telephone survey launched on 10 January 2019 and also concluded on 13 March 2019. Although the average length of time taken to complete the online survey was 20 minutes, the average length of the telephone survey was 25 minutes (due to time taken to read out the questions to the respondent and inevitable dialogue throughout the interview).
A total of seven online reminders were sent via the direct link in this time. Alongside this, participating local authorities were contacted a total of four times with an update on their achieved response rate and a request for them to promote the survey among their staff, where possible. Suggested reminder email text was shared with open link local authorities as part of these communications.
The telephone outcomes are outlined in Table A.4 below. The telephone response rate was 24% overall: as a proportion of all completed usable contacts this equates to 80%.
Table A.4: Telephone survey outcomes
n % Total starting sample 5,829 - All confirmed unusable sample 1,525 26% Unobtainable 568 9.7% No longer works at LA, no forwarding number 324 5.6% Requested to complete online 294 5.0% Wrong / invalid number 69 1.2% Not available during fieldwork 120 2.1% Not eligible for research 39 0.7% Subsequently completed online 111 1.9% All confirmed usable sample: no outcome during fieldwork period 2,543 44%
Completed contacts 1,761 30% Refusals 321 5.5% Breakdown of interview 29 0.5% Completed interviews 1,411 24.2%
A breakdown of response rates by mode are shown in Tables A.5 and A.6 overleaf. It is difficult to calculate an exact response rate as the survey was only distributed directly to relevant social workers in around two-thirds of the local authorities which took part in the study: in the remainder, the local authorities distributed the survey themselves and we

127
can only estimate how many social workers they sent this to, based on the DfE’s published workforce statistics on headcount by local authority. Using this, combined with what we know about the exact number of leads provided in the local authorities which provided direct sample, the estimated overall response rate to the survey is 27%. This varied from 33% of direct sample (who we were able to telephone as well as email) to 15% who responded via the open link emailed to them by their own local authority.
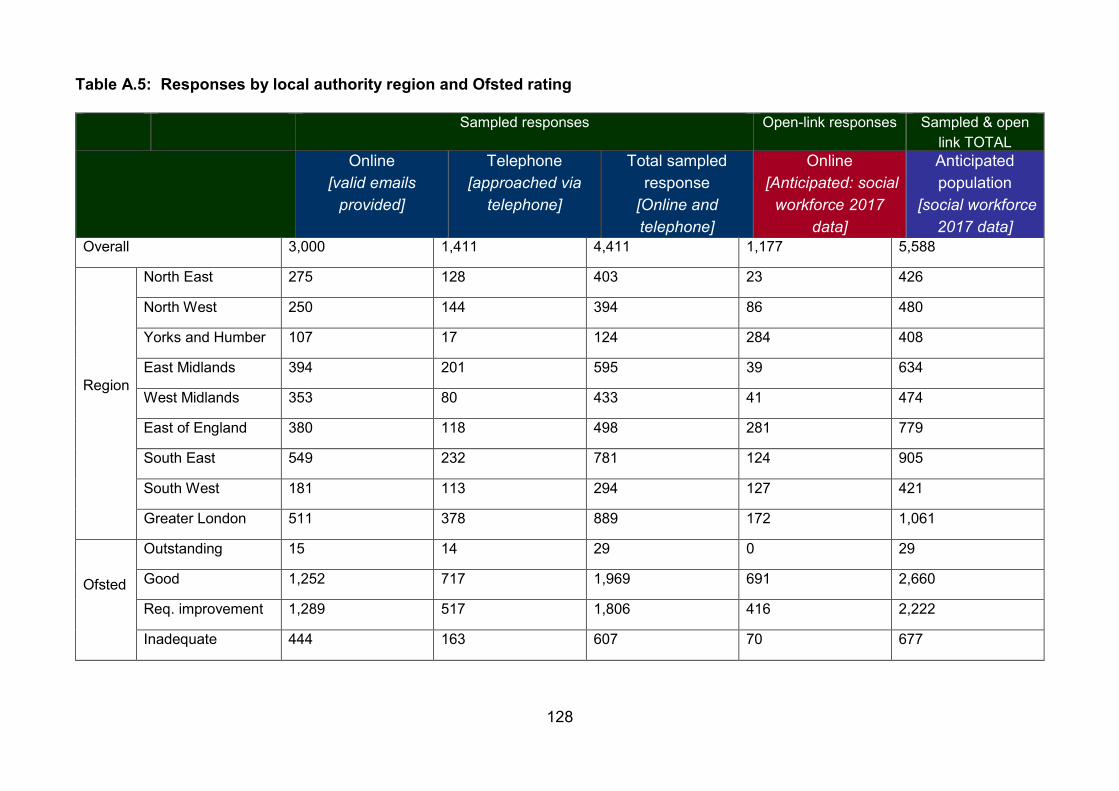
128
Table A.5: Responses by local authority region and Ofsted rating
Sampled responses Open-link responses Sampled & open link TOTAL
Online [valid emails
provided]
Telephone [approached via
telephone]
Total sampled response
[Online and telephone]
Online [Anticipated: social
workforce 2017 data]
Anticipated population
[social workforce 2017 data]
Overall 3,000 1,411 4,411 1,177 5,588
Region
North East 275 128 403 23 426
North West 250 144 394 86 480
Yorks and Humber 107 17 124 284 408
East Midlands 394 201 595 39 634
West Midlands 353 80 433 41 474
East of England 380 118 498 281 779
South East 549 232 781 124 905
South West 181 113 294 127 421
Greater London 511 378 889 172 1,061
Ofsted
Outstanding 15 14 29 0 29
Good 1,252 717 1,969 691 2,660
Req. improvement 1,289 517 1,806 416 2,222
Inadequate 444 163 607 70 677
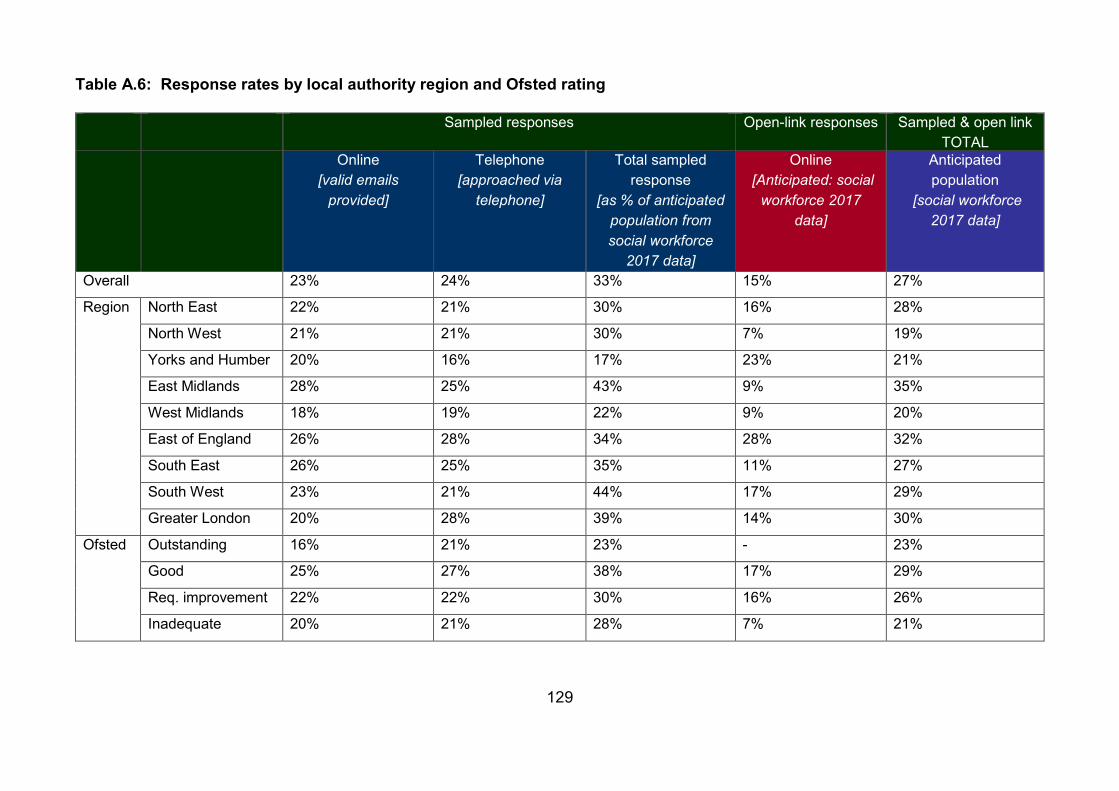
129
Table A.6: Response rates by local authority region and Ofsted rating
Sampled responses Open-link responses Sampled & open link TOTAL
Online [valid emails
provided]
Telephone [approached via
telephone]
Total sampled response
[as % of anticipated population from social workforce
2017 data]
Online [Anticipated: social
workforce 2017 data]
Anticipated population
[social workforce 2017 data]
Overall 23% 24% 33% 15% 27%
Region North East 22% 21% 30% 16% 28%
North West 21% 21% 30% 7% 19%
Yorks and Humber 20% 16% 17% 23% 21%
East Midlands 28% 25% 43% 9% 35%
West Midlands 18% 19% 22% 9% 20%
East of England 26% 28% 34% 28% 32%
South East 26% 25% 35% 11% 27%
South West 23% 21% 44% 17% 29%
Greater London 20% 28% 39% 14% 30%
Ofsted Outstanding 16% 21% 23% - 23%
Good 25% 27% 38% 17% 29%
Req. improvement 22% 22% 30% 16% 26%
Inadequate 20% 21% 28% 7% 21%

130
Weighting and statistical significance The survey data was weighted to correct for minor differences in the achieved profile of the sample and the population according to the latest DfE workforce statistics, where possible. The age bands used in the survey differed from those used by the DfE workforce statistics, however unpublished data indicated that the age distribution was broadly in line with the population. As shown in Table A.7, weighting was applied by whether or not the social worker was directly employed by their local authority or employed through an agency, and by region.
Table A.7 Profile of achieved interviews compared with DfE workforce statistics
Demographic Survey (n) Survey (%) DfE statistics
Age band
Under 25 years 145 3% n/a 25 – 34 years 1,389 25% n/a 35 – 44 years 1,465 26% n/a 45 – 54 years 1,457 26% n/a 55 – 64 years 1,043 19% n/a 65 years + 59 1% n/a Prefer not to say 63 1%
Gender
Male 869 15% 14% Female 4,672 83% 86% Other 6 0.1% - Prefer not to say 74 1% -
Agency worker WEIGHTED Yes 315 6% 15%
Region of LA WEIGHTED
East Midlands 638 11% 8% North East 426 8% 6% South East 909 16% 15% East of England 781 14% 9% Greater London 1,066 19% 16% North West 483 9% 14% South West 425 8% 9% West Midlands 479 9% 11% Yorkshire and the Humber 414 7% 12%
Ofsted rating of LA17 Outstanding 526 9% 9% Good 2,708 48% 37%
17 Local authority children’s services departments are regularly inspected by Ofsted and therefore their ratings are subject to change. The distribution in this table is based on Single Inspection Framework (SIF) Ofsted ratings as of June 2018, when local authorities were first approached about taking part in the research. The information is published by the Association of Directors of Children’s Services (ADCS): https://adcs.org.uk/inspection/article/sif-outcomes-summary
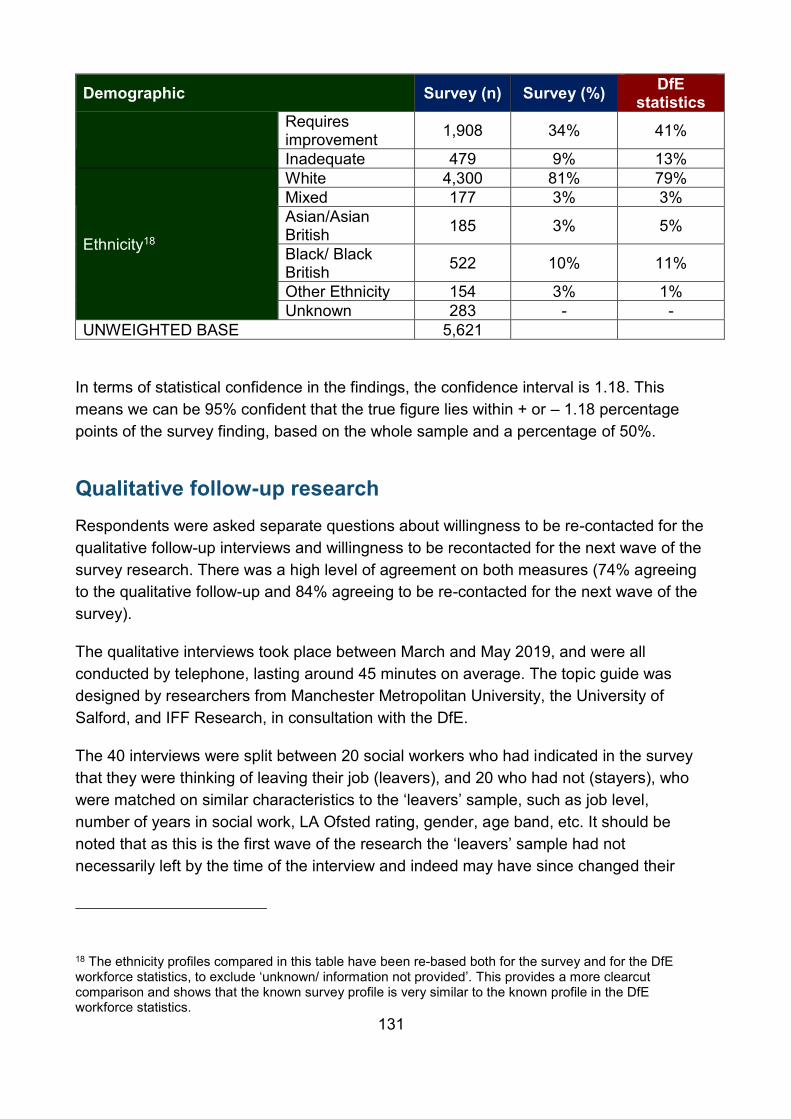
131
Demographic Survey (n) Survey (%) DfE statistics
Requires improvement 1,908 34% 41%
Inadequate 479 9% 13%
Ethnicity18
White 4,300 81% 79% Mixed 177 3% 3% Asian/Asian British 185 3% 5%
Black/ Black British 522 10% 11%
Other Ethnicity 154 3% 1% Unknown 283 - -
UNWEIGHTED BASE 5,621
In terms of statistical confidence in the findings, the confidence interval is 1.18. This means we can be 95% confident that the true figure lies within + or – 1.18 percentage points of the survey finding, based on the whole sample and a percentage of 50%.
Qualitative follow-up research Respondents were asked separate questions about willingness to be re-contacted for the qualitative follow-up interviews and willingness to be recontacted for the next wave of the survey research. There was a high level of agreement on both measures (74% agreeing to the qualitative follow-up and 84% agreeing to be re-contacted for the next wave of the survey).
The qualitative interviews took place between March and May 2019, and were all conducted by telephone, lasting around 45 minutes on average. The topic guide was designed by researchers from Manchester Metropolitan University, the University of Salford, and IFF Research, in consultation with the DfE.
The 40 interviews were split between 20 social workers who had indicated in the survey that they were thinking of leaving their job (leavers), and 20 who had not (stayers), who were matched on similar characteristics to the ‘leavers’ sample, such as job level, number of years in social work, LA Ofsted rating, gender, age band, etc. It should be noted that as this is the first wave of the research the ‘leavers’ sample had not necessarily left by the time of the interview and indeed may have since changed their
18 The ethnicity profiles compared in this table have been re-based both for the survey and for the DfE workforce statistics, to exclude ‘unknown/ information not provided’. This provides a more clearcut comparison and shows that the known survey profile is very similar to the known profile in the DfE workforce statistics.

132
minds or still be wavering about their decision. People who indicated they were leaving the profession due to upcoming retirement were excluded from the qualitative sample, which focused on people who reported wanting to leave the sector or move into agency work.
Interviews were digitally recorded with the permission of respondents, and transcribed. The transcriptions formed the material for analysis. Respondents were offered a £20 voucher incentive as a thank-you for their participation.

133
Appendix 2: Wave 1 survey questionnaire A Telephone screener
ASK PERSON WHO ANSWERS PHONE S1 Good morning / afternoon / evening. My name is NAME and I'm calling from IFF Research.
Please can I speak to [NAME]?
Respondent answers phone 1 CONTINUE
Transferred to respondent 2
Hard appointment 3 MAKE APPOINTMENT
Soft Appointment 4
Engaged 5 CALL BACK
No reply / Answer phone
Refusal 6
CLOSE
Not available in deadline 7
Fax Line 8
Business Number 10
Dead line 11
Wrong telephone number 15
Person no longer works here 14
Request reassurances 12 GO TO REASSURANCES
Request reassurance email 13
COLLECT EMAIL ADDRESS THEN CONTINUE OR MAKE APPOINTMENT
(SEE APPENDIX FOR EMAIL TEXT)

134
ASK CORRECT RESPONDENT (S1 = 1 OR 2) S2 Good morning / afternoon, my name is NAME, calling from IFF Research, an independent
market research company, on behalf of the Department for Education (DFE).
We have been commissioned by DFE to carry out a landmark new research study into the career experiences of child and family social workers.
The interview should last around 20 minutes. Would you have some time to go through the questions now?
ADD IF NECESSARY:
The research will improve understanding about what motivates people to enter child and family social work, why they stay or leave, and what impacts on their job satisfaction and career development. We are interested in your experiences, even if you are thinking of changing your job or of leaving the profession.
All responses will be anonymous and analysed in aggregate form. No individual staff or local authorities will be identified in the reporting.
For further information you can email [email protected].
PROVIDE LINK TO THE PRIVACY NOTICE ON REQUEST:PRIVACY STATEMENT: www.iffresearch.com/longitudinal-study-of-child-and-family-social-workers-privacystatements
INTERVIEWER NOTE: YOU MUST GET A CLEAR ‘YES’, OR SIMILAR RESPONSE, TO INDICATE CONSENT TO TAKING PART
Continue 1 CONTINUE
Hard appointment 2 MAKE APPOINTMENT
Soft appointment 3
Refusal 4
GO TO S3 Refusal – company policy 5
Refusal – taken part in recent survey 6
Not available in deadline 7 THANK AND CLOSE
Request reassurances 8 GO TO REASSURANCES
Request reassurance email 9
COLLECT EMAIL ADDRESS THEN CONTINUE OR MAKE APPOINTMENT
(SEE APPENDIX FOR EMAIL TEXT)

135
ASK IF NAMED RESPONDENT NOT ON SITE (S1=14) S2a Do you have an alternative number we could reach NAME on?
Yes (please type in number) 1
THANK AND CLOSE (THIS BECOMES THE ‘REFERRAL NUMBER’)
No / Don’t know 2 THANK AND CLOSE
(GOES INTO UNUSABLE)
IF REFUSED (S2=4-6)
S3 Would you be willing to take part online instead?
Yes 1 CHECK EMAIL ADDRESS, CORRECT IF NEEDED, AND THANK AND CLOSE
No 2 THANK AND CLOSE
IF AGREED TO TAKE PART (S2 =1)
S4 Before we begin, I just need to read out a quick statement based on GDPR legislation: Firstly, I want to reassure you that all of the information you provide will be treated in the strictest confidence, and that you have the right to the following:
1) A copy of your data
2) Amending your data
3) Withdrawing from the research at any point
To guarantee this, and as part of our quality control procedures, all interviews are recorded automatically.
Based on this information, are you willing to take part?
Yes 1
No 2 THANK AND CLOSE
REASSURANCES TO USE IF NECESSARY
Your details were given to us by [INSERT LA ON SAMPLE].
If respondent wishes to confirm validity of survey or get more information about aims and objectives, they can contact: (add IFF Contacts)

136
S Online landing page
Thank you for your interest in this landmark national study on the career experiences of child and family social workers. Your contribution will be invaluable to the research, even if you are thinking of changing job or of leaving the profession. The research is being conducted by IFF Research, Manchester Metropolitan University and the University of Salford on behalf of the Department for Education (DfE).
For further information about the study, or to find out what happens to the survey data and how it is stored, please click here.
Taking part is voluntary and you may withdraw at any point. If at the end of the survey you’d like to request access to your data or have this deleted please go to http://www.iffresearch.com/gdpr/ for more information. All information collected will be treated in the strictest confidence, in accordance with the Market Research Society Code of Conduct.
• If you are willing to take part please click ‘Next’.
• IF INDIVIDUALISED LINK: Please note, you can stop and start as many times as you like and pick up where you left off. To do this you just need to use the link provided in your email invitation.
• When completing the survey, please only use the ’Next’ button on the page rather than the ’Back’ and ’Forward’ buttons in your browser.
ASK IF ACCESSING SURVEY VIA OPEN LINK Want to take a break or lost connection? Simply provide us with your email address below and we can send you a link to re-enter the survey at the last question you answered, so you won’t have to start again from the beginning.
WRITE IN
Prefer not to say 1

137
B Current Employment Situation
IF ONLINE DISPLAY TO ALL / IF TELEPHONE READ OUT TO ALL: Please note: throughout this survey, where we refer to ‘local authority’ we also include Children's Trusts delivering LA Children's Services.
ASK ALL OPEN LINK RESPONDENTS B1b Before we begin, could I just confirm which Local Authority you are currently working for?
This is just to make sure we’re speaking to the right people. To confirm, results will not be analysed by individual Local Authority.
IF ONLINE DISPLAY: PLEASE SELECT FROM THE DROP-DOWN LIST.
DS: DROP DOWN LIST TO INCLUDE ‘NONE OF THE ABOVE’ CODE. IF ‘NONE OF THE ABOVE’ IS SELECTED, PLEASE THANK AND CLOSE.
DO NOT READ OUT: Don’t know / prefer not to say 1 THANK AND
CLOSE
ASK ALL B1 Are you currently working in child and family social work? By this we mean any role in child
and family social work, including more senior roles which do not have a direct caseload.
ADD IF NECESSARY: If you are on extended leave – such as maternity leave, or sick leave – but still on the payroll of your employer, then please count this as employed.
PLEASE GIVE ONE ANSWER
Yes 1 CONTINUE
No – but I’m still in social work 2 GO B2 & B3 &B4 THEN ASK SECTION C
No – I am employed, but have left social work altogether 3 GO TO SECTION C
No – I am unemployed and looking for work 4 GO TO SECTION C
No – I am undertaking full-time further study. Please note: if you were studying part-time alongside work, then please select from the relevant work option (either option 1, 2 or 3)
5 THANK AND CLOSE
No – I am on a career break (for example, travelling, caring responsibilities etc.) 6
No – I am doing something else (for example retired, ill-health etc.) 7
IF TELEPHONE DISPLAY: “(DO NOT READ OUT)”: Don’t know / prefer not to say 8
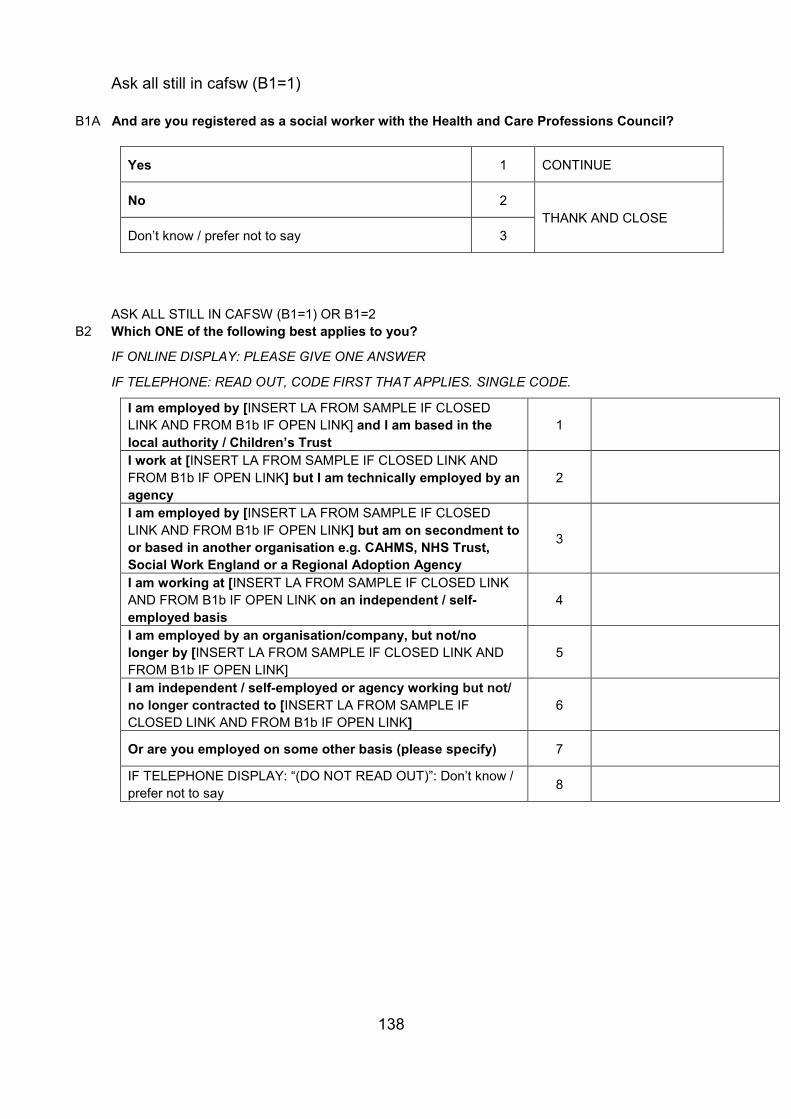
138
Ask all still in cafsw (B1=1)
B1A And are you registered as a social worker with the Health and Care Professions Council?
Yes 1 CONTINUE
No 2 THANK AND CLOSE
Don’t know / prefer not to say 3
ASK ALL STILL IN CAFSW (B1=1) OR B1=2 B2 Which ONE of the following best applies to you?
IF ONLINE DISPLAY: PLEASE GIVE ONE ANSWER
IF TELEPHONE: READ OUT, CODE FIRST THAT APPLIES. SINGLE CODE.
I am employed by [INSERT LA FROM SAMPLE IF CLOSED LINK AND FROM B1b IF OPEN LINK] and I am based in the local authority / Children’s Trust
1
I work at [INSERT LA FROM SAMPLE IF CLOSED LINK AND FROM B1b IF OPEN LINK] but I am technically employed by an agency
2
I am employed by [INSERT LA FROM SAMPLE IF CLOSED LINK AND FROM B1b IF OPEN LINK] but am on secondment to or based in another organisation e.g. CAHMS, NHS Trust, Social Work England or a Regional Adoption Agency
3
I am working at [INSERT LA FROM SAMPLE IF CLOSED LINK AND FROM B1b IF OPEN LINK on an independent / self-employed basis
4
I am employed by an organisation/company, but not/no longer by [INSERT LA FROM SAMPLE IF CLOSED LINK AND FROM B1b IF OPEN LINK]
5
I am independent / self-employed or agency working but not/ no longer contracted to [INSERT LA FROM SAMPLE IF CLOSED LINK AND FROM B1b IF OPEN LINK]
6
Or are you employed on some other basis (please specify) 7
IF TELEPHONE DISPLAY: “(DO NOT READ OUT)”: Don’t know / prefer not to say 8
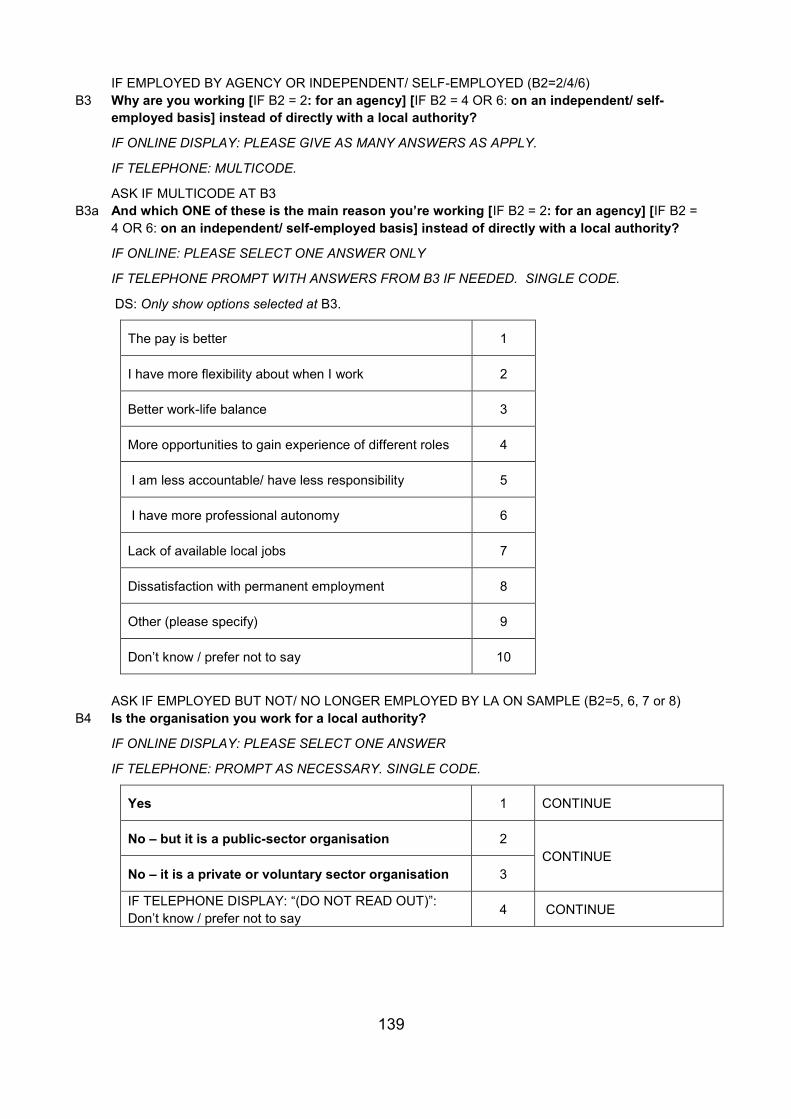
139
IF EMPLOYED BY AGENCY OR INDEPENDENT/ SELF-EMPLOYED (B2=2/4/6) B3 Why are you working [IF B2 = 2: for an agency] [IF B2 = 4 OR 6: on an independent/ self-
employed basis] instead of directly with a local authority?
IF ONLINE DISPLAY: PLEASE GIVE AS MANY ANSWERS AS APPLY.
IF TELEPHONE: MULTICODE.
ASK IF MULTICODE AT B3 B3a And which ONE of these is the main reason you’re working [IF B2 = 2: for an agency] [IF B2 =
4 OR 6: on an independent/ self-employed basis] instead of directly with a local authority?
IF ONLINE: PLEASE SELECT ONE ANSWER ONLY
IF TELEPHONE PROMPT WITH ANSWERS FROM B3 IF NEEDED. SINGLE CODE.
DS: Only show options selected at B3.
The pay is better 1
I have more flexibility about when I work 2
Better work-life balance 3
More opportunities to gain experience of different roles 4
I am less accountable/ have less responsibility 5
I have more professional autonomy 6
Lack of available local jobs 7
Dissatisfaction with permanent employment 8
Other (please specify) 9
Don’t know / prefer not to say 10
ASK IF EMPLOYED BUT NOT/ NO LONGER EMPLOYED BY LA ON SAMPLE (B2=5, 6, 7 or 8)
B4 Is the organisation you work for a local authority?
IF ONLINE DISPLAY: PLEASE SELECT ONE ANSWER
IF TELEPHONE: PROMPT AS NECESSARY. SINGLE CODE.
Yes 1 CONTINUE
No – but it is a public-sector organisation 2 CONTINUE
No – it is a private or voluntary sector organisation 3
IF TELEPHONE DISPLAY: “(DO NOT READ OUT)”: Don’t know / prefer not to say 4 CONTINUE

140
ASK ALL: The next few questions are about your current role.
ASK ALL STILL IN CAFSW (B1=1) B5 Which ONE of the following best describes your current role?
IF ONLINE DISPLAY: PLEASE GIVE ONE ANSWER
IF TELEPHONE: READ OUT. SINGLE CODE.
Assessed and supported year in employment (ASYE) 1
Frontline practitioner 2
Practice supervisor 3
Practice leader 4
Senior service manager or Director not directly involved in practice 5
Team manager 8
Other (please specify) 6
IF TELEPHONE DISPLAY: “(DO NOT READ OUT)”: Don’t know / prefer not to say 7
B6 THERE IS NO B6.
ASK ALL STILL IN CAFSW (B1=1) B7a Do you mainly work with children only, with families/ carers only, or with both?
IF ONLINE DISPLAY: PLEASE GIVE ONE ANSWER
IF TELEPHONE: SINGLE CODE.
Children only 1
Families/carers only 2
Both 3
Other (please specify) 4
IF TELEPHONE DiSPLAY: “(DO NOT READ OUT)”: Don’t know / prefer not to say 5
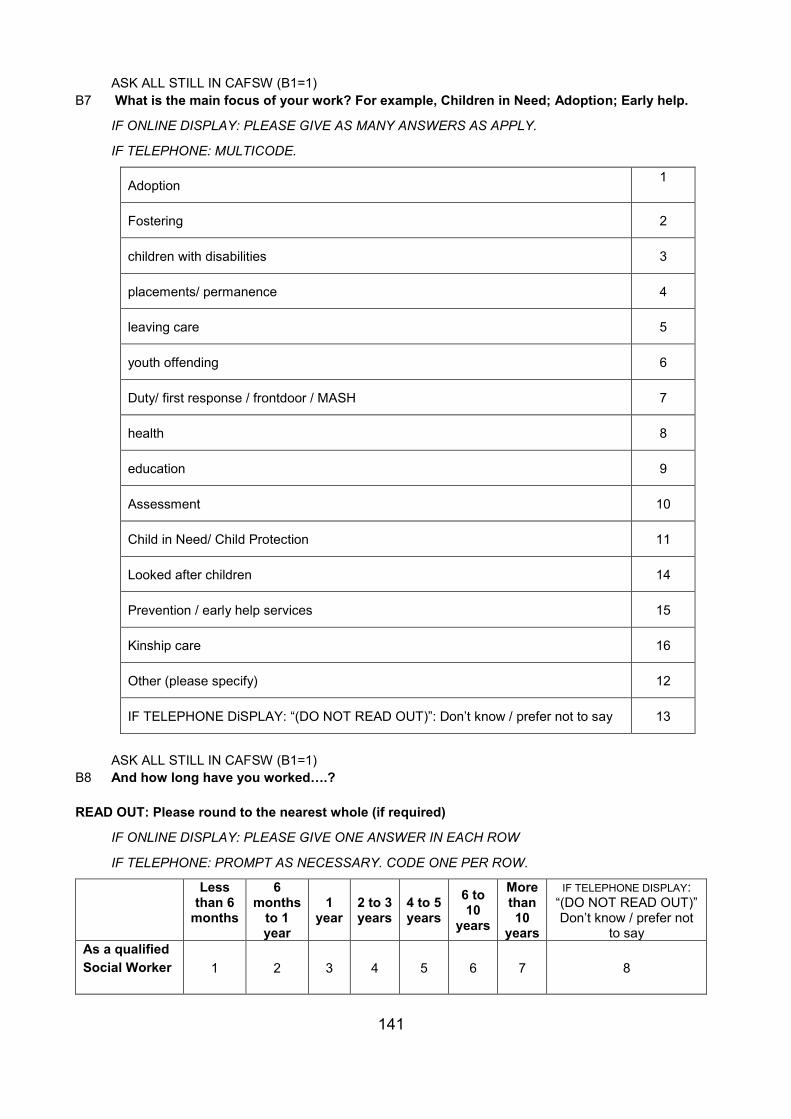
141
ASK ALL STILL IN CAFSW (B1=1) B7 What is the main focus of your work? For example, Children in Need; Adoption; Early help.
IF ONLINE DISPLAY: PLEASE GIVE AS MANY ANSWERS AS APPLY.
IF TELEPHONE: MULTICODE.
Adoption 1
Fostering 2
children with disabilities 3
placements/ permanence 4
leaving care 5
youth offending 6
Duty/ first response / frontdoor / MASH 7
health 8
education 9
Assessment 10
Child in Need/ Child Protection 11
Looked after children 14
Prevention / early help services 15
Kinship care 16
Other (please specify) 12
IF TELEPHONE DiSPLAY: “(DO NOT READ OUT)”: Don’t know / prefer not to say 13
ASK ALL STILL IN CAFSW (B1=1)
B8 And how long have you worked….? READ OUT: Please round to the nearest whole (if required)
IF ONLINE DISPLAY: PLEASE GIVE ONE ANSWER IN EACH ROW
IF TELEPHONE: PROMPT AS NECESSARY. CODE ONE PER ROW.
Less than 6
months
6 months
to 1 year
1 year
2 to 3 years
4 to 5 years
6 to 10
years
More than 10
years
IF TELEPHONE DISPLAY: “(DO NOT READ OUT)” Don’t know / prefer not
to say As a qualified Social Worker 1 2 3 4 5 6 7 8

142
Less than 6
months
6 months
to 1 year
1 year
2 to 3 years
4 to 5 years
6 to 10
years
More than 10
years
IF TELEPHONE DISPLAY: “(DO NOT READ OUT)” Don’t know / prefer not
to say At your current employer 1 2 3 4 5 6 7 8
In your current role, with your current employer
1 2 3 4 5 6 7 8
ASK ALL STILL IN CAFSW (B1=1)
B9 Thinking about your contractual arrangements, are you on a permanent contract or something different?
IF ONLINE DISPLAY: PLEASE GIVE ONE ANSWER
IF TELEPHONE: PROMPT AS NECESSARY IF NOT ON PERMANENT CONTRACT. SINGLE CODE.
Permanent / open ended contract 1
Fixed term contract lasting 12 months or longer 2
Fixed term contract lasting less than 12 months 3
Temporary agency or casual contract 4
Consultancy contract 5
Secondment
Some other contractual arrangement (please specify) 6
IF TELEPHONE DISPLAY: “(DO NOT READ OUT)”: Don’t know / prefer not to say 7
ASK ALL STILL IN CAFSW (B1=1)
B10 How many cases are allocated to you currently? Please note, by ‘case’ we mean either:
• An individual allocated to a social worker (for example a family of three siblings would be
three individual cases); and/or • A carer or carers allocated to a social worker for the purposes of fostering or adoption

143
WRITE IN
Not applicable: non-case-holding role 1
DO NOT READ OUT: Don’t know / prefer not to say 2
IF DK AT B10 (B10=2) B10a Please could you estimate the number of cases allocated to you currently, using the bands
below? READ OUT: Please round to the nearest whole (if required)
IF TELEPHONE: PROMPT AS NECESSARY. SINGLE CODE
1-5 1
6-10 2
11-15 3
16-20 4
21-25 5
26+ 6
IF TELEPHONE DISPLAY: “(DO NOT READ OUT)”: Don’t know / prefer not to say 8
ASK ALL STILL IN CAFSW (B1=1)
B11 How many hours are you contracted to work per week?
IF ONLINE DISPLAY / IF TELEPHONE READ OUT TO ALL: If no week is ‘typical’ then please think about the last full week that you worked.
DS: ALLOW RANGE OF 0-168 HOURS
WRITE IN
Not applicable e.g. self-employed, zero-hours contracts 1
DO NOT READ OUT: Don’t know / prefer not to say 2

144
IF DK AT B11 (B11=2)
B11a Please could estimate which of the following hourly bands you are contracted to work per week?
READ OUT: Please round to the nearest whole (if required).
IF TELEPHONE: PROMPT AS NECESSARY. SINGLE CODE
1-15
16-20
21-30
31-35
36-40
41-45
46-50
51+
IF TELEPHONE DISPLAY: “(DO NOT READ OUT)”: Don’t know / prefer not to say
Not applicable e.g. self-employed, zero-hours contracts
ASK ALL STILL IN CAFSW (B1=1)
B12 And how often would you say you work over and above your contracted hours to keep up with your workload?
IF ONLINE: PLEASE GIVE ONE ANSWER.
IF TELEPHONE: READ OUT. SINGLE CODE.
Never 1
Occasionally 2
Most weeks 3
All the time 4
Not applicable e.g. self-employed, zero-hours contract 5
IF TELEPHONE DISPLAY: “(DO NOT READ OUT)”: Don’t know / prefer not to say 6
B13 THERE IS NO B13.

145
DS: B14 AND B15 TO BE DISPLAYED ON ONE PAGE.
IF ONLINE DISPLAY / IF TELEPHONE READ OUT TO ALL: How many hours in a typical week do you spend doing the following…
IF ONLINE DISPLAY / IF TELEPHONE READ OUT TO ALL: if no week is ‘typical’ then please think about the last full week that you worked.
ASK ALL STILL IN CAFSW (B1=1) B14 1) …Working? Please exclude any time spent travelling from your answer. DS: ALLOW RANGE OF 0-168 HOURS
WRITE IN
Not applicable e.g. self-employed, zero-hours contracts 1
Don't know / prefer not to say 2
IF DK AT B14 (B14=2)
B14a Please could you estimate the number of hours you spend working in a typical week? READ OUT: Please round to the nearest whole (if required)
IF ONLINE DISPLAY / IF TELEPHONE ADD IF NECESSARY: If no week is ‘typical’ then please think about the last full week that you worked.
IF TELEPHONE: PROMPT AS NECESSARY. SINGLE CODE
1-15
16-20
21-30
31-35
36-40
41-45
46-50
51+
IF TELEPHONE DISPLAY: “(DO NOT READ OUT)”: Don’t know / prefer not to say
Not applicable e.g. self-employed, zero-hours contracts

146
ASK ALL WHO WORK WITH CHILDREN AND/OR FAMILIES (IF (B7A = 1, 2 OR 3) B15 2) Doing direct work with children and families/ carers?
WRITE IN
Not applicable e.g. self-employed, zero-hours contracts 1
Don't know / prefer not to say 2
IF DK AT B14 (B14=2)
B15a Please could you estimate the number of hours in a typical week you spend doing direct work with children and families / carers?
READ OUT: Please round to the nearest whole (if required)
IF ONLINE DISPLAY / IF TELEPHONE ADD IF NECESSARY: If no week is ‘typical’ then please think about the last full week that you worked.
IF TELEPHONE: PROMPT AS NECESSARY. SINGLE CODE
0-2 hours 1
3-5 hours 2
6-10 hours 3
11-15 hours 4
16-20 hours 5
More than 20 hours 6
Not applicable 7
IF TELEPHONE DISPLAY: “(DO NOT READ OUT)”: Don’t know / prefer not to say 8
B16 THERE IS NO B16.
ASK ALL STILL IN CAFSW (B1=1) B17 During your time at your current employer have you made use of any of the following
arrangements…?
IF ONLINE: PLEASE GIVE ONE ANSWER PER ROW.
IF TELEPHONE: READ OUT. CODE ONE PER ROW.

147
Yes No Can’t remember
Flexi-time 1 2 3
Job sharing (sharing a full-time job with someone) 1 2 3
Time off in lieu (TOIL) 1 2 3
Paid overtime 1 2 3
C Entry Route to Social Work
IF ONLINE DISPLAY TO ALL / IF TELEPHONE READ OUT TO ALL: We’d now like to understand a bit more about how you got into social work.
ASK ALL STILL IN CAFSW (B1=1) OR RECENTLY LEFT BUT STILL ACTIVE IN LABOUR MARKET (B1 =2,3,4)
C1 So just to start, why did you decide you wanted to embark upon a career in social work?
IF ONLINE: PLEASE GIVE AS MANY ANSWERS AS APPLY
IF TELEPHONE: PROMPT AS NECESSARY. MULTICODE.
ASK IF MULTICODE AT C1 C1a And which ONE of these is the main reason?
IF ONLINE: PLEASE GIVE ONE ANSWER ONLY
IF TELEPHONE: PROMPT IF NECESSARY. SINGLE CODE.
DS: only show options selected at C1.
C1 C1a
I wanted to help people / make a difference 1 1
I wanted to work with children and families 2 2
I wanted a stable job 3 3
I saw it as a springboard to another career 4 4
I was working in a related area (e.g. a youth worker or family support worker) 5 5
It aligns with my political or ideological beliefs 6 6
I had a positive personal experience of social work 7 7
I had a negative personal experience of social work 8 8
Funding/ bursary was available for the course 9 9

148
C1 C1a
I have a long-term commitment to social work as a career 10 10
I wanted a decent salary 11 11
Other (please specify) 12 12
IF TELEPHONE DISPLAY: “(DO NOT READ OUT”): know / prefer not to say 13 13
ASK ALL STILL IN CAFSW (B1=1) OR RECENTLY LEFT BUT STILL ACTIVE IN LABOUR MARKET (B1 =2,3,4)
C2 What entry route did you take into social work …?
IF ONLINE: PLEASE GIVE AS MANY ANSWERS AS APPLY
IF TELEPHONE: PROMPT AS NECESSARY. MULTICODE
An undergraduate degree in social work (e.g. BSc or BA) 1
A postgraduate degree in social work (e.g. PGDip/MSc/MA) 2
The ‘Step Up to Social Work’ programme 3
The ‘Frontline’ programme 4
Certificate of Qualification in Social Work (CQSW) 5
Diploma in Social Work (DipSW) 6
Other (please specify) 7
Don’t know / can’t remember 8
ASK ALL STILL IN CAFSW (B1=1) OR RECENTLY LEFT BUT STILL ACTIVE IN LABOUR MARKET (B1 =2,3,4)
C3 What is the name of the institution or organisation at which you were registered for your first completed social work qualification? By this we meant the qualification which allowed you to register as a qualified social worker.
TIP: Please type the name of the institution below and select from the list. If it does not appear,
please type it out in full.
DS: DROP DOWN LIST TO INCLUDE CODES AT THE END FOR ‘OVERSEAS INSTITUTION’
DO NOT READ OUT: Don’t know / prefer not to say 1

149
ASK ALL STILL IN CAFSW (B1=1) OR RECENTLY LEFT BUT STILL ACTIVE IN LABOUR MARKET (B1 =2,3,4)
C4 What classification or grade did you achieve for your first completed social work qualification?
PROMPT AS NECESSARY. SINGLE CODE
First class 1
2:1 2
2:2 3
3rd class 4
Unclassified 5
Distinction 6
Merit 7
Pass 8
Other (specify) 9
Don’t know/ prefer not to say 10
ASK IF DID NOT DO AN UNDERGRADUATE QUALIFICATION IN SOCIAL WORK (IF CODES 2-7 AT C2 AND NOT CODE 1 AT C2)
C4A What if any undergraduate subject area were you studying before you trained in social work?
TIP: Please type your course below and select from the list. If it does not appear, or you studied multiple subjects, please type it out in full.
ADD JACS CODES
DO NOT READ OUT: DON’T KNOW / PREFER NOT TO SAY 1
I DO NOT HAVE AN UNDERGRADUATE DEGREE 2

150
ASK ALL STILL IN CAFSW (B1=1) OR RECENTLY LEFT BUT STILL ACTIVE IN LABOUR MARKET (B1 =2,3,4)
C5 And was your first job in social work in the area of child and family social work?
Yes 1
No 2
Don’t know/prefer not to say 3
C6 THERE IS NO C6.
C7 MOVED TO D3 AND D4.
ASK ALL (B1 =2,3,4) UNLESS C2 = 8 C8 And thinking about your career in social work to date, how well do you think your entry route
into social work prepared you for…?
IF ONLINE DISPLAY: PLEASE GIVE ONE ANSWER PER ROW.
IF TELEPHONE: READ OUT. CODE ONE PER ROW.
Very well Quite well
Not very well
Not at all well
IF TELEPHONE
DISPLAY: “(DO NOT
READ OUT)”: Don’t know / prefer
not to say Working in social work
1 2 3 4 5
Working in child and family social work 1 2 3 4 5
ASK ALL UNLESS B5=1 C9 Did you undertake the Assessed and Supported Year in Employment (ASYE)?
Yes 1 ASK C10
No 2 CHECK D1
Don’t know 3
ASK IF UNDERTOOK ASYE (C9=1)
C10 How useful did you find the ASYE?
IF TELEPHONE: READ OUT AND SINGLE CODE

151
Very useful 1
Fairly useful 2
Not very useful 3
Not at all useful 4
IF TELEPHONE DISPLAY: “(DO NOT READ OUT”): Don’t know 5
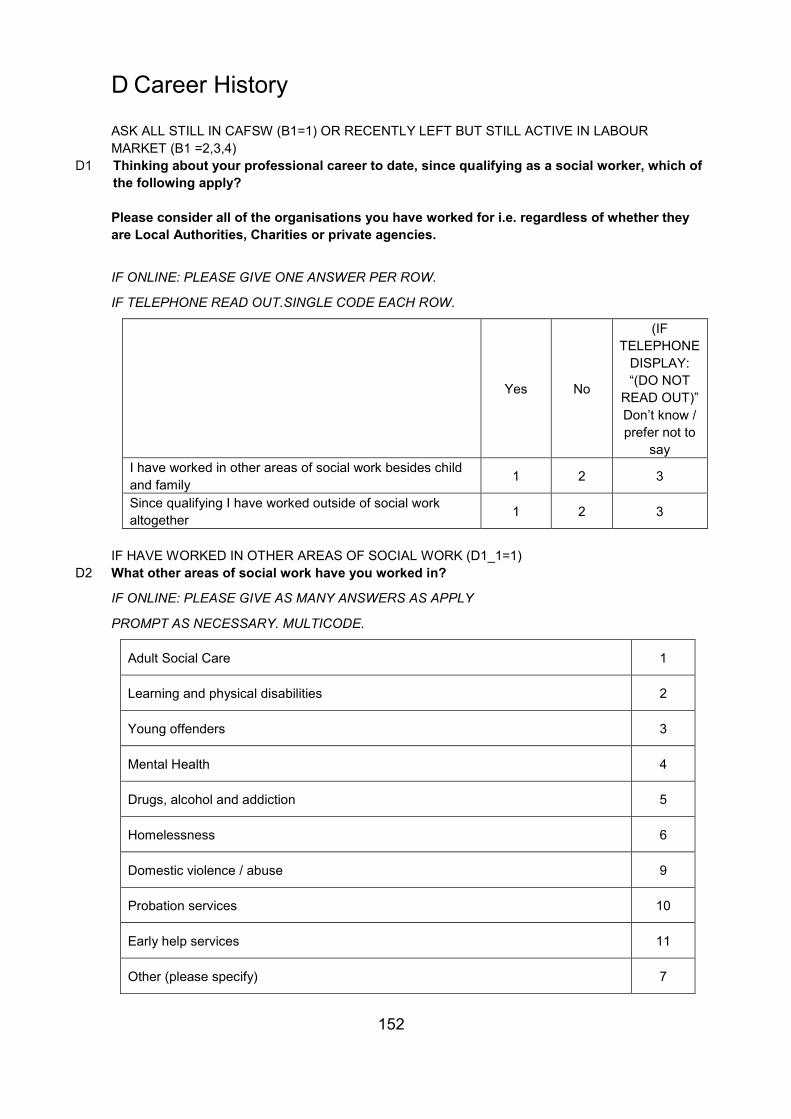
152
D Career History
ASK ALL STILL IN CAFSW (B1=1) OR RECENTLY LEFT BUT STILL ACTIVE IN LABOUR MARKET (B1 =2,3,4)
D1 Thinking about your professional career to date, since qualifying as a social worker, which of the following apply?
Please consider all of the organisations you have worked for i.e. regardless of whether they are Local Authorities, Charities or private agencies.
IF ONLINE: PLEASE GIVE ONE ANSWER PER ROW.
IF TELEPHONE READ OUT.SINGLE CODE EACH ROW.
Yes No
(IF TELEPHONE
DISPLAY: “(DO NOT
READ OUT)” Don’t know / prefer not to
say I have worked in other areas of social work besides child and family 1 2 3
Since qualifying I have worked outside of social work altogether 1 2 3
IF HAVE WORKED IN OTHER AREAS OF SOCIAL WORK (D1_1=1)
D2 What other areas of social work have you worked in?
IF ONLINE: PLEASE GIVE AS MANY ANSWERS AS APPLY
PROMPT AS NECESSARY. MULTICODE.
Adult Social Care 1
Learning and physical disabilities 2
Young offenders 3
Mental Health 4
Drugs, alcohol and addiction 5
Homelessness 6
Domestic violence / abuse 9
Probation services 10
Early help services 11
Other (please specify) 7

153
Adult Social Care 1
(IF TELEPHONE DISPLAY: “(DO NOT READ OUT)” Don’t know / prefer not to say 8
D3 How long have you….
IF TELEPHONE: PROMPT AS NECESSARY. MULTICODE.
Less
than 6 months
6 months
to 1 year
1 year
2 to 3 years
4 to 5 years
6 to 10
years
More than 10
years
IF TELEPHONE DISPLAY: “(DO NOT READ OUT)” Don’t
know / prefer not to say ASK ALL STILL IN CAFSW (B1=1) OR RECENTLY LEFT BUT STILL ACTIVE IN LABOUR MARKET (B1 =2,3,4) Worked in child and family social work
1 2 3 4 5 6 7 8
IF HAVE WORKED IN OTHER AREAS OF SOCIAL WORK (D1_1=1) spent working in other areas of social work
1 2 3 4 5 6 7 8
IF HAVE WORKED OUTSIDE OF SOCIAL WORK ALTOGETHER (D1_2=1) spent working outside of social work altogether
1 2 3 4 5 6 7 8

154
D4 THERE IS NO D4. D5 THERE IS NO D5. D6 THERE IS NO D6. D7 THERE IS NO D7. D8 THERE IS NO D8.
ASK ALL STILL IN CAFSW (B1=1) OR RECENTLY LEFT BUT STILL ACTIVE IN LABOUR MARKET (B1 =2,3,4)
D9 Thinking about your career in child and family social work specifically, have you ever had a career break lasting one month or more? Please include any periods of paid or unpaid extended leave, such as maternity leave.
IF ONLINE: PLEASE GIVE AS MANY ANSWERS AS APPLY
IF TELEPHONE: IF “YES” - PROMPT FROM LIST IF NECESSARY (MULTICODE OK)
Yes: Maternity leave 1
Yes: Sick leave 2
Yes: Time out in order to travel 3
Yes: Caring responsibilities, for family or friends 4
Yes: Time out to study 5
Yes - OTHER: (Please specify) 6
No 7
IF TELEPHONE DISPLAY “(DO NOT READ OUT)”: Don’t know / prefer not to say 8

155
E Overall views of employer
ASK ALL STILL IN CAFSW (B1=1) E1 To what extent do you agree or disagree with the following statements about working in child
and family social work at your current employer?
IF ONLINE: PLEASE GIVE ONE ANSWER PER ROW
IF TELEPHONE: READ OUT. CODE ONE PER ROW.
Strongly agree
Agree Neither
agree nor disagree
Disagree Strongly disagree
IF TELE DISPLAY: “(DO
NOT READ OUT)”: Don’t know / prefer not to say
I feel loyal to my organisation 1 2 3 4 5 6
I feel valued by my employer 1 2 3 4 5 6
I am proud to tell people that I am a child and family social worker
1 2 3 4 5 6

156
ASK ALL STILL IN CAFSW (B1=1) E2 Now thinking about the managers at your current employer, to what extent do you agree or
disagree with each of the following?
IF ONLINE: PLEASE GIVE ONE ANSWER PER ROW
IF TELEPHONE: READ OUT. CODE ONE PER ROW.
Strongly agree
Agree
Neither agree nor
disagree
Disagree
Strongly
disagree
IF TELEPHONE DISPLAY “DO
NOT READ OUT)”: Don’t know / prefer
not to say
My manager encourages me to develop my skills
1 2 3 4 5 6
My manager motivates me to be more effective in my job
1 2 3 4 5 6
My manager is considerate of my life outside work
1 2 3 4 5 6
My manager is open to my ideas
1 2 3 4 5 6
Overall, I have confidence in the decisions made by my manager
1 2 3 4 5 6
My manager recognises when I have done my job well
1 2 3 4 5 6
I receive regular feedback on my performance
1 2 3 4 5 6
The feedback I receive helps me to improve my performance
1 2 3 4 5 6

157
ASK IF B5=1/2/3/4/6 E3 How frequently, if at all, have you received reflective supervision since you joined your
current employer?
READ OUT: Please round to the nearest whole (if required)
IF TELEPHONE: PROMPT AS NECESSARY. SINGLE CODE.
At least once every two weeks 1
ASK E4
Once every three or four weeks 2
Once every five or six weeks 3
Less frequently than every six weeks 4
Have not received reflective supervision since joining current employer 5
Don’t know / prefer not to say 6 ASK E6
ASK ALL ANSWERING E3 EXCEPT ‘DON’T KNOW’ (E3=1-5)
E4 And in your view, is this…
IF TELEPHONE: READ OUT. SINGLE CODE.
SHOW FOR ALL EXCEPT CODE 5 AT E3 ‘Have not received reflective supervision since joining current local authority: Too much 1
About right 2
Not enough 3
IF TELEPHONE DISPLAY “(DO NOT READ OUT)”: Don’t know / prefer not to say 4
ASK ALL WHO HAVE RECEIVED SUPERVISION (E3=1-4)
E5 How would you rate the quality of the reflective supervision you have received at your current employer since you joined?
IF TELEPHONE: READ OUT. SINGLE CODE.
Very good 1
Good 2
Poor 3
Very poor 4
IF TELEPHONE DISPLAY “(DO NOT READ OUT)”: Don’t know / prefer not to say 5

158
THERE IS NO E6
ASK ALL STILL IN CAFSW (B1=1) E7 Are you currently responsible for directly supervising any of the qualified Child and Family
Social Workers at your current employer?
Yes (please specify how many): 1 ASK E8
No 2 ASK E9
Don’t know / prefer not to say 3
ASK IF CURRENTLY A SUPERVISOR (E7=1)
E8 How confident are you in your ability to provide reflective supervision?
IF TELEPHONE: READ OUT. SINGLE CODE.
Very confident 1
Fairly confident 2
Not very confident 3
Not at all confident 4
IF TELEPHONE DISPLAY “(DO NOT READ OUT)”: Don’t know / prefer not to say 5

159
ASK ALL STILL IN CAFSW (B1=1) E9 And to what extent do you agree or disagree that…
IF ONLINE: PLEASE GIVE ONE ANSWER PER ROW.
IF TELEPHONE: READ OUT. CODE ONE PER ROW.
Strongly agree
Agree
Neither agree nor
disagree
Disagree Strongly disagree
IF TELE DISPLAY”(DO NOT
READ OUT)”: Don’t know / prefer not to say
I am able to access the right learning and development opportunities when I need to
1 2 3 4 5 6
I have the right tools (e.g. risk assessment tools, planning tools, etc.) to do my job effectively
1 2 3 4 5 6
I have the right resources (e.g. equipment, petty cash, etc.) to do my job effectively
1 2 3 4 5 6
The IT systems and software here support me to do my job
1 2 3 4 5 6
The physical environment in my offices is appropriate for the work I do
1 2 3 4 5 6
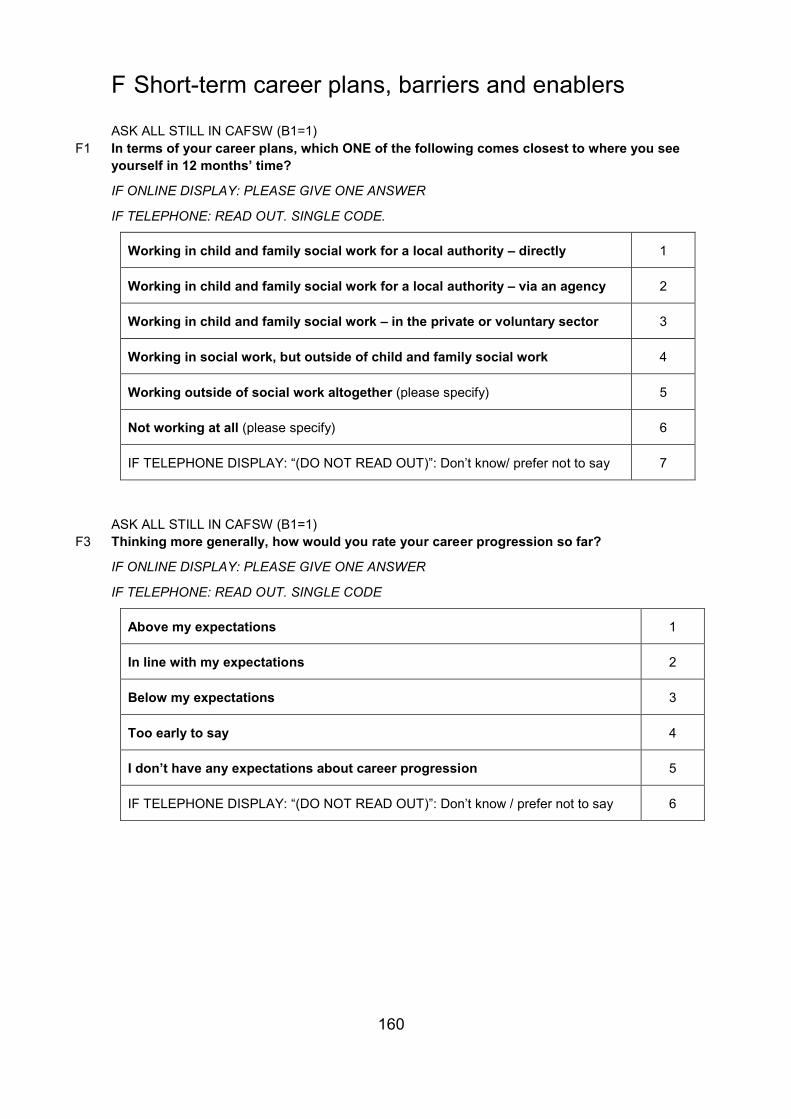
160
F Short-term career plans, barriers and enablers
ASK ALL STILL IN CAFSW (B1=1) F1 In terms of your career plans, which ONE of the following comes closest to where you see
yourself in 12 months’ time?
IF ONLINE DISPLAY: PLEASE GIVE ONE ANSWER
IF TELEPHONE: READ OUT. SINGLE CODE.
Working in child and family social work for a local authority – directly 1
Working in child and family social work for a local authority – via an agency 2
Working in child and family social work – in the private or voluntary sector 3
Working in social work, but outside of child and family social work 4
Working outside of social work altogether (please specify) 5
Not working at all (please specify) 6
IF TELEPHONE DISPLAY: “(DO NOT READ OUT)”: Don’t know/ prefer not to say 7
ASK ALL STILL IN CAFSW (B1=1)
F3 Thinking more generally, how would you rate your career progression so far?
IF ONLINE DISPLAY: PLEASE GIVE ONE ANSWER
IF TELEPHONE: READ OUT. SINGLE CODE
Above my expectations 1
In line with my expectations 2
Below my expectations 3
Too early to say 4
I don’t have any expectations about career progression 5
IF TELEPHONE DISPLAY: “(DO NOT READ OUT)”: Don’t know / prefer not to say 6
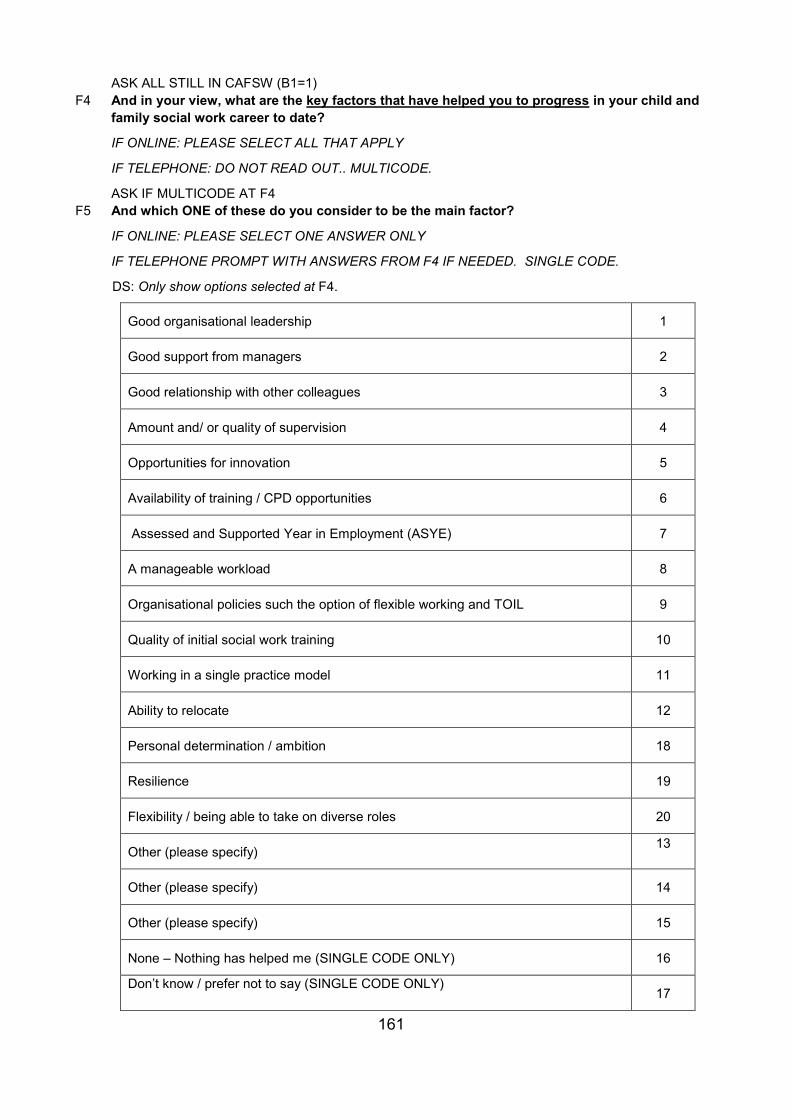
161
ASK ALL STILL IN CAFSW (B1=1) F4 And in your view, what are the key factors that have helped you to progress in your child and
family social work career to date?
IF ONLINE: PLEASE SELECT ALL THAT APPLY
IF TELEPHONE: DO NOT READ OUT.. MULTICODE.
ASK IF MULTICODE AT F4 F5 And which ONE of these do you consider to be the main factor?
IF ONLINE: PLEASE SELECT ONE ANSWER ONLY
IF TELEPHONE PROMPT WITH ANSWERS FROM F4 IF NEEDED. SINGLE CODE.
DS: Only show options selected at F4.
Good organisational leadership 1
Good support from managers 2
Good relationship with other colleagues 3
Amount and/ or quality of supervision 4
Opportunities for innovation 5
Availability of training / CPD opportunities 6
Assessed and Supported Year in Employment (ASYE) 7
A manageable workload 8
Organisational policies such the option of flexible working and TOIL 9
Quality of initial social work training 10
Working in a single practice model 11
Ability to relocate 12
Personal determination / ambition 18
Resilience 19
Flexibility / being able to take on diverse roles 20
Other (please specify) 13
Other (please specify) 14
Other (please specify) 15
None – Nothing has helped me (SINGLE CODE ONLY) 16
Don’t know / prefer not to say (SINGLE CODE ONLY) 17

162
ASK ALL STILL IN CAFSW (B1=1) F6 In your view, what are the key barriers you have faced to progressing in your child and family
social work career to date?
IF ONLINE: PLEASE SELECT ALL THAT APPLY
IF TELEPHONE: DO NOT READ OUT. MULTICODE.
ASK IF MULTICODE AT F6 F7 And which ONE of these do you consider to be the main barrier?
IF ONLINE: PLEASE SELECT ONE ANSWER ONLY
IF TELEPHONE PROMPT WITH ANSWERS FROM F6 IF NEEDED. SINGLE CODE.
DS: Please only show options selected at F6.
Poor organisational leadership 1
Poor support from managers 2
Poor relationships with other colleagues 3
Poor quality or lack of supervision 4
Lack of training / CPD opportunities 5
Too high a workload 6
Lack of organisational policies such as flexible working and TOIL 7
The quality of initial social work training 8
Working in a single practice model 9
Unable to relocate 10
Childcare responsibilities 16
Lack of clear/meaningful progression opportunities within my team/area 17
Not wanting to progress to a more senior role 18
Other (please specify) 11
Other (please specify) 12
Other (please specify) 13
None – Have not experienced any barriers (SINGLE CODE ONLY) 14
Don’t know / prefer not to say (SINGLE CODE ONLY) 15

163
G Job satisfaction
ASK ALL STILL IN CAFSW (B1=1) G1 How satisfied are you with the following aspects of your current job?
IF ONLINE: PLEASE GIVE ONE ANSWER PER ROW.
IF TELEPHONE: READ OUT. CODE ONE PER ROW.
Very satisfied
Fairly satisfied
Neither satisfied nor dissatisfied
Fairly dissatisfied
Very dissatisfied
IF TELE DISPLAY: “(DO NOT READ OUT)”: Don’t know / prefer not to say
The sense of achievement you get from your work
1 2 3 4 5 6
The scope for using your own initiative 1 2 3 4 5 6
The amount of influence you have over your job
1 2 3 4 5 6
The extent to which you feel challenged 1 2 3 4 5 6
The opportunity to develop your skills in your job
1 2 3 4 5 6
The amount of pay you receive 1 2 3 4 5 6
Your job security 1 2 3 4 5 6
The work itself 1 2 3 4 5 6
Public respect for the sort of work you do 1 2 3 4 5 6

164
ASK ALL STILL IN CAFSW (B1=1) G2 And to what extent do you agree with the statement: “Overall, I find my current job satisfying”
IF TELEPHONE: READ OUT AND SINGLE CODE
Strongly agree 1
Agree 2
Neither agree nor disagree 3
Disagree 4
Strongly disagree 5
IF TELEPHONE DISPLAY: “(DO NOT READ OUT)”: Don’t know / prefer not to say 6

165
H Workplace well-being
H1 The next few questions are about wellbeing in the workplace. The research team will be analysing the data anonymously and so will not be following up individual responses.
ASK ALL STILL IN CAFSW (B1=1) H1 How much do you agree or disagree with the following statements:
IF ONLINE: PLEASE GIVE ONE ANSWER PER ROW.
IF TELEPHONE: READ OUT. CODE ONE PER ROW.
Strongly
agree Agree
Neither agree nor
disagree
Disagree Strongly disagree
IF TELE DISPLAY
: “(DO NOT
READ OUT)”: Don’t know /
prefer not to say
My overall workload is too high 1 2 3 4 5 6
I feel I am being asked to fulfil too many different roles in my job
1 2 3 4 5 6
I feel stressed by my job 1 2 3 4 5 6
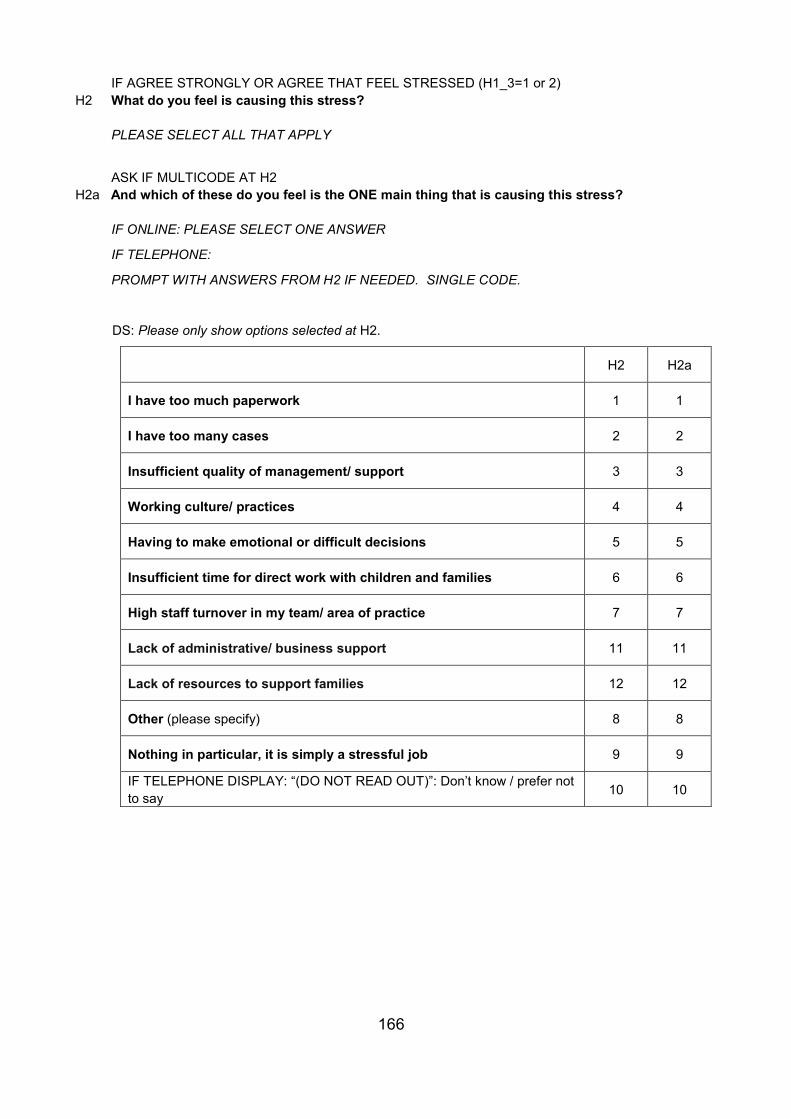
166
IF AGREE STRONGLY OR AGREE THAT FEEL STRESSED (H1_3=1 or 2) H2 What do you feel is causing this stress?
PLEASE SELECT ALL THAT APPLY
ASK IF MULTICODE AT H2
H2a And which of these do you feel is the ONE main thing that is causing this stress?
IF ONLINE: PLEASE SELECT ONE ANSWER
IF TELEPHONE:
PROMPT WITH ANSWERS FROM H2 IF NEEDED. SINGLE CODE.
DS: Please only show options selected at H2.
H2 H2a
I have too much paperwork 1 1
I have too many cases 2 2
Insufficient quality of management/ support 3 3
Working culture/ practices 4 4
Having to make emotional or difficult decisions 5 5
Insufficient time for direct work with children and families 6 6
High staff turnover in my team/ area of practice 7 7
Lack of administrative/ business support 11 11
Lack of resources to support families 12 12
Other (please specify) 8 8
Nothing in particular, it is simply a stressful job 9 9
IF TELEPHONE DISPLAY: “(DO NOT READ OUT)”: Don’t know / prefer not to say 10 10
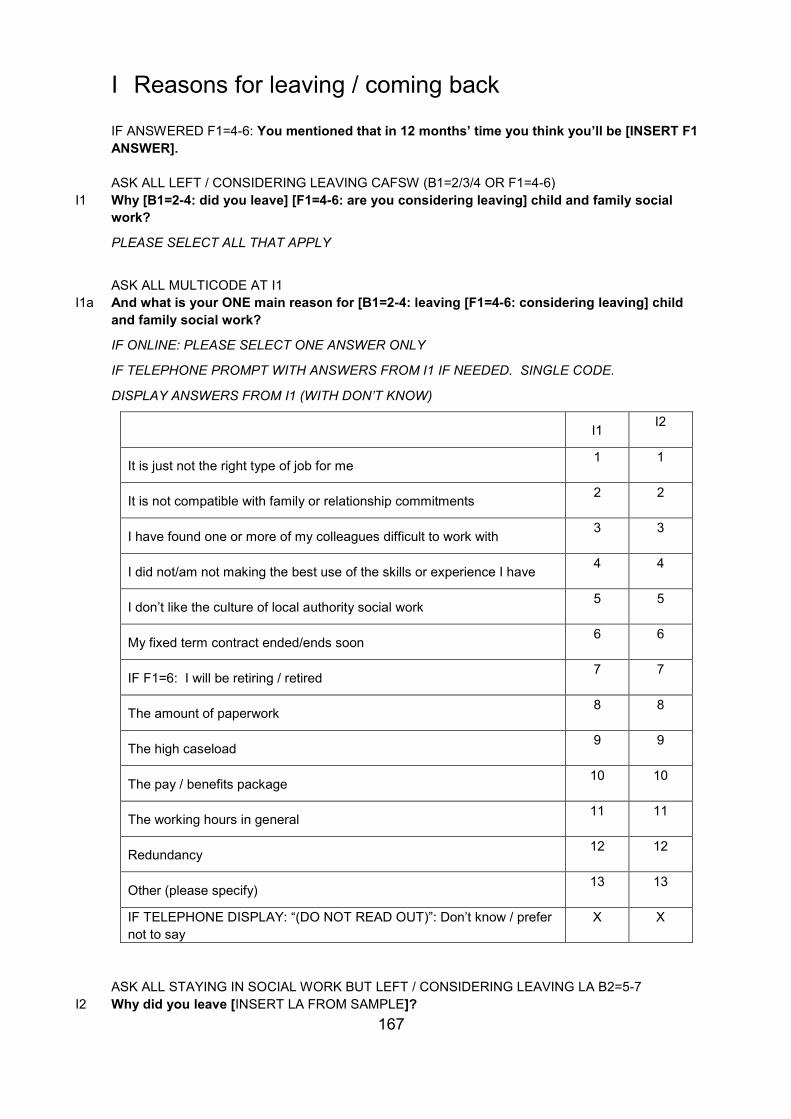
167
I Reasons for leaving / coming back
IF ANSWERED F1=4-6: You mentioned that in 12 months’ time you think you’ll be [INSERT F1 ANSWER].
ASK ALL LEFT / CONSIDERING LEAVING CAFSW (B1=2/3/4 OR F1=4-6) I1 Why [B1=2-4: did you leave] [F1=4-6: are you considering leaving] child and family social
work?
PLEASE SELECT ALL THAT APPLY
ASK ALL MULTICODE AT I1
I1a And what is your ONE main reason for [B1=2-4: leaving [F1=4-6: considering leaving] child and family social work?
IF ONLINE: PLEASE SELECT ONE ANSWER ONLY
IF TELEPHONE PROMPT WITH ANSWERS FROM I1 IF NEEDED. SINGLE CODE.
DISPLAY ANSWERS FROM I1 (WITH DON’T KNOW)
I1 I2
It is just not the right type of job for me 1 1
It is not compatible with family or relationship commitments 2 2
I have found one or more of my colleagues difficult to work with 3 3
I did not/am not making the best use of the skills or experience I have 4 4
I don’t like the culture of local authority social work 5 5
My fixed term contract ended/ends soon 6 6
IF F1=6: I will be retiring / retired 7 7
The amount of paperwork 8 8
The high caseload 9 9
The pay / benefits package 10 10
The working hours in general 11 11
Redundancy 12 12
Other (please specify) 13 13
IF TELEPHONE DISPLAY: “(DO NOT READ OUT)”: Don’t know / prefer not to say
X X
ASK ALL STAYING IN SOCIAL WORK BUT LEFT / CONSIDERING LEAVING LA B2=5-7
I2 Why did you leave [INSERT LA FROM SAMPLE]?

168
PLEASE SELECT ALL THAT APPLY
ASK ALL MULTICODE AT I2
I2a And what is your ONE main reason for leaving [INSERT LA FROM SAMPLE ]?
IF ONLINE: PLEASE SELECT ONE ANSWER ONLY
IF TELEPHONE PROMPT WITH ANSWERS FROM I2 IF NEEDED. SINGLE CODE.
DISPLAY ANSWERS FROM I2 (WITH DON’T KNOW)
I2 I2a
I have found one or more of my colleagues difficult to work with 1 1
I feel I have learnt all that I can from working here 2 2
I would like to try working for a different local authority 3 3
I would like to try working for a different type of organisation altogether 4 4
I am not making the best use of the skills or experience here 5 5
I don’t like the social work culture here 6 6
My fixed term contract ends soon 7 7
I am relocating 8 8
I am retired / retiring 9 9
The amount of paperwork I have to do 10 10
The high caseload 11 11
The pay / benefits package 12 12
The working hours in general 13 13
Other (please specify) 14 14
IF TELEPHONE DISPLAY: “(DO NOT READ OUT)” Don’t know / prefer not to say X X
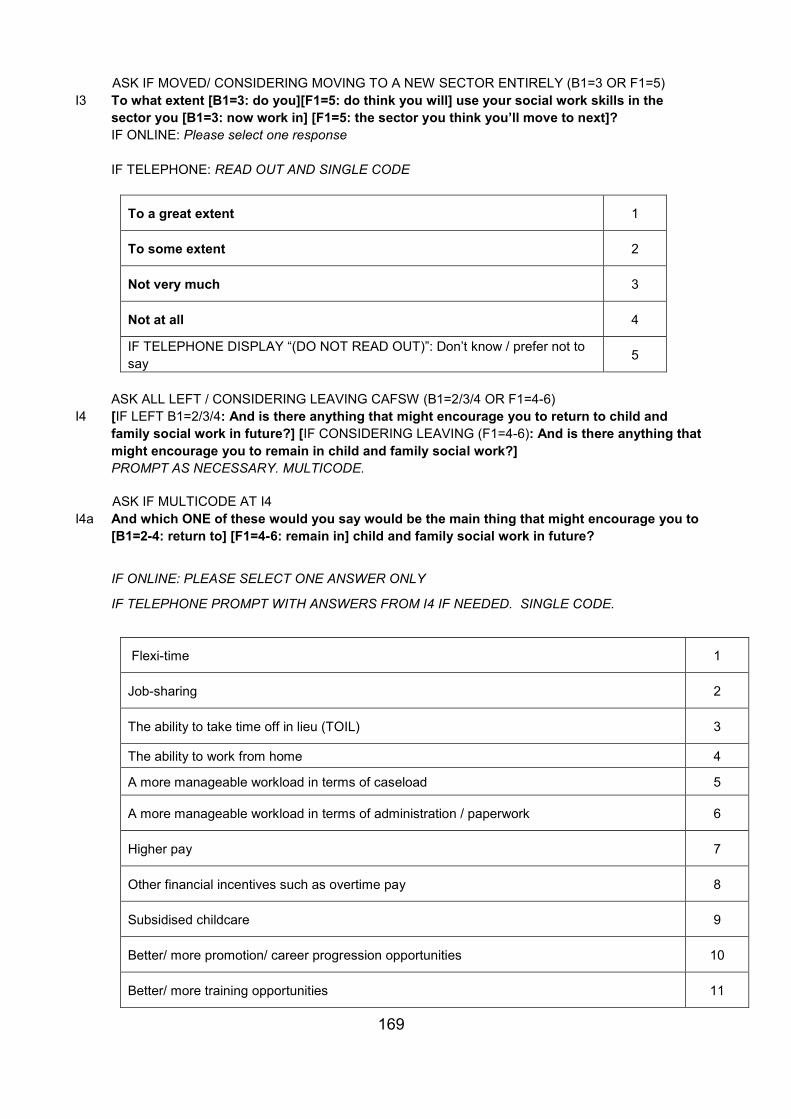
169
ASK IF MOVED/ CONSIDERING MOVING TO A NEW SECTOR ENTIRELY (B1=3 OR F1=5) I3 To what extent [B1=3: do you][F1=5: do think you will] use your social work skills in the
sector you [B1=3: now work in] [F1=5: the sector you think you’ll move to next]? IF ONLINE: Please select one response IF TELEPHONE: READ OUT AND SINGLE CODE
To a great extent 1
To some extent 2
Not very much 3
Not at all 4
IF TELEPHONE DISPLAY “(DO NOT READ OUT)”: Don’t know / prefer not to say 5
ASK ALL LEFT / CONSIDERING LEAVING CAFSW (B1=2/3/4 OR F1=4-6)
I4 [IF LEFT B1=2/3/4: And is there anything that might encourage you to return to child and family social work in future?] [IF CONSIDERING LEAVING (F1=4-6): And is there anything that might encourage you to remain in child and family social work?] PROMPT AS NECESSARY. MULTICODE.
ASK IF MULTICODE AT I4 I4a And which ONE of these would you say would be the main thing that might encourage you to
[B1=2-4: return to] [F1=4-6: remain in] child and family social work in future?
IF ONLINE: PLEASE SELECT ONE ANSWER ONLY
IF TELEPHONE PROMPT WITH ANSWERS FROM I4 IF NEEDED. SINGLE CODE.
Flexi-time 1
Job-sharing 2
The ability to take time off in lieu (TOIL) 3
The ability to work from home 4
A more manageable workload in terms of caseload 5
A more manageable workload in terms of administration / paperwork 6
Higher pay 7
Other financial incentives such as overtime pay 8
Subsidised childcare 9
Better/ more promotion/ career progression opportunities 10
Better/ more training opportunities 11

170
Flexi-time 1
Better working environment/ technology 12
Other (please specify) 13
DS EXCLUSIVE CODE: No, nothing would encourage me to return to/ stay in social work 14
Don’t know / prefer not to say 15

171
J Demographics
IF TELEPHONE READ OUT TO ALL, IF ONLINE DISPLAY TO ALL: We’d like to end by asking you a few questions about yourself, to help us in our analysis.
ASK ALL J1 What is your age?
READ OUT: Please round to the nearest whole (if required)
Under 25 years 1
25 – 34 years 2
35 – 44 years 3
45 – 54 years 4
55 – 64 years 5
65 years and over 6
Prefer not to say 7
ASK ALL
J2 Outside of work, do you have any care or childcare responsibilities?
IF TELEPHONE: IF ‘YES’ PROMPT FOR CATEGORIES. MULTICODE OK
Yes: for school-aged child/children 1
Yes: for pre-school aged child/children 2
Yes: for child/ children with disabilities 3
Yes: caring for other family member or friends 4
No 5
Don’t know / prefer not to say 6

172
IF ONLINE DISPLAY / IF TELEPHONE READ OUT: The next few questions are about your gender, ethnicity and whether you have a disability or long-term health condition. You can refuse to answer any or all of these questions.
ASK ALL J3 What is your gender?
Male 1
Female 2
Other (please specify) 3
Prefer not to say 4
ASK ALL
J4 Do you have any physical or mental health conditions or illnesses lasting or expecting to last 12 months or more?
Yes 1
No 2
Don’t know / prefer not to say 3

173
ASK ALL J5 What is your ethnic group?
IF ONLINE: PLEASE GIVE ONE ANSWER.
IF TELEPHONE SINGLE CODE. PROMPT AS NECESSARY.
WHITE English/Welsh/Scottish/Northern Irish/British 1
WHITE Irish 2
WHITE Gypsy or Irish Traveller 3
WHITE Any other White background (please specify) 4
MIXED/MULTIPLE ETHNIC GROUPS White and Black Caribbean 5
MIXED/MULTIPLE ETHNIC GROUPS White and Black African 6
MIXED/MULTIPLE ETHNIC GROUPS White and Asian 7
MIXED/MULTIPLE ETHNIC GROUPS Any other Mixed/Multiple ethnic background (please specify) 8
ASIAN OR ASIAN BRITISH Indian 10
ASIAN OR ASIAN BRITISH Pakistani 11
ASIAN OR ASIAN BRITISH Bangladeshi 12
ASIAN OR ASIAN BRITISH Chinese 13
Any other Asian background (please specify) 14
BLACK / AFRICAN / CARIBBEAN / BLACK BRITISH African 15
BLACK / AFRICAN / CARIBBEAN / BLACK BRITISH Caribbean 16 BLACK / AFRICAN / CARIBBEAN / BLACK BRITISH Any other Black / African / Caribbean background (please specify) 17
OTHER ETHNIC GROUP Arab 18
OTHER ETHNIC GROUP Any other ethnic group (please specify) 19
IF TELEPHONE DISPLAY: “(DO NOT READ OUT”): Don’t know / Prefer not to say 20

174
K Recontact
ASK ALL K1 Would you be willing to take part in a follow-up survey in one year’s time? This will involve
doing a similar – but much shorter – survey to find out what you are doing then and whether your views have changed.
ADD AS NECESSARY: Following up will help us to build a picture of what influences social worker’s career experiences and decisions over time. We would still like people to take part next year even if they have left or are thinking of leaving the profession.
Yes (am willing to be re-contacted for the follow-up survey) 1
No(am not willing to be re-contacted for the follow-up survey) 2
ASK ALL
K2 We will also be conducting some follow-up telephone interviews in the next couple of months which will cover these issues in more depth. The interviews will last around 45 minutes and you will be given £20 voucher as a thank you. Would you be willing to help us with this?
Yes (can re-contact me for the qualitative research) 1
No (cannot re-contact me for the qualitative research) 2
K3 And would you be willing for us to contact you for quality control purposes, if we need to
clarify any of the information you have given today?
Yes 1
No 2
ASK IF AGREE TO RECONTACT AT K1 or K2 OR K3
K4 Thank you very much. Could we just take your name and home contact details? This will only be used to recontact you about this research, and is just in case your work details change.
WRITE IN FIRST NAME AND SURNAME
WRITE IN HOME EMAIL ADDRESS
Refused X

175
WRITE IN FIRST NAME AND SURNAME
WRITE IN HOME TELEPHONE NUMBER (LANDLINE OR MOBILE)
Refused X
Thanks for taking part and supporting this research, we really appreciate your time.
176
Appendix 3: Guide for qualitative follow-up interviews
A Introduction – 5 mins
• Interviewer and IFF introduction / Academic institution and background: Good morning / afternoon. My name is <NAME> and I work at IFF Research / academic institution. We have been commissioned by the Department for Education, to better understand the experiences of local authority child and family social workers in order to explore recruitment, retention and progression issues in the sector. IF RELEVANT SAMPLE: As part of this we want to interview people who have either left or who said in their survey response that they are thinking of leaving.
• As you are already aware, the interview will take around 45 minutes and we would like to thank you for taking part by offering you a £20 Amazon or Love 2 Shop voucher.
Before we begin, I just need to read out a few quick statements and gain your explicit permission to take part based on GDPR legislation.
• Firstly, you don’t have to answer any of the questions. You are welcome to skip any questions or stop the interview at any point.
• MUST READ: Please be assured that anything you say during the interview will be treated in the strictest confidence and results will be anonymised in any reporting so that they cannot be linked back to you. • MRS Code of Conduct: IFF Research operates under the strict guidelines of the Market Research Society’s Code of Conduct. Only the core members of the research team will have access to any of your details. We will not pass any of your personal details on to the Department for Education or any other companies and all the information we collect will be kept in the strictest confidence and used for research purposes only. • MUST READ:
You have the right to have a copy of your data, change your data, or withdraw from the research at any point. You can find out more information about your rights under the new data protection regulations by going to iffresearch.com/gdpr. We can also email this to you if you’d like.
• MUST READ OUT: I would like to record our conversation. The recording will only be used for our analysis purposes and may be transcribed; all recordings and transcripts/notes will be stored securely and deleted after 12 months. Are you happy for me to record the conversation?
Yes CONTINUE
No CONTINUE Take detailed notes
Please can you confirm that you have understood the nature of the research and that you consent to taking part?
177
B Guide – 30 - 35 mins
Please note: the topic guide is intended to be used alongside the participant’s survey data. Prompts are not intended to be used as a list to read through with every participant. Warm Up Questions
1. I would like to start by asking you about your expectations of social work when you entered the profession and your experiences since.
• Why did you want to become a social worker? • How does the everyday experience of working in child and family social
work match your expectations? • How do you feel that social work as a profession is regarded by the general
public, the media, other professions and the government? • What have been the rewards and challenges of being a social worker for
you?
2. I want to move on to talking about your career plans and how these have changed and developed. • What was your long-term career plan when you became a social worker? • Has this changed – why/why not? • Are you satisfied with your career so far? Why/why not? (Sense of
achievement, scope to use own initiative, influence, feeling challenged – check survey response)
Current Position
3. When you completed the survey, you told us that you were employed by XXXX (employer) in XXXX (post).
• Has anything changed since you completed the survey? • New job (probe for details of new post, role, remuneration, location) • Changes in current job (e.g. hours, reorganisation, increase/decrease in
caseload, management/team changes. Ofsted) • Personal issues (e.g. moving house, sickness, caring responsibilities)
4. When you completed the survey, you told us that you were intending to
leave/stay in your post. We would like to know more about your experience in that post.
• How long have/had you been in that post? • How did you arrive there? (e.g. first post after qualifying, came from placement,
promotion, move into a preferred area of practice) • Why were/are you intending to leave/stay in that post? (leavers: probe for why
they wanted to leave; stayers, probe for why they are loyal to the organisation)

178
• Do/did you feel valued by that organisation? Why/why not? (probe for anything more that the organisation could do/have done to make them feel valued?)
• How have you coped with work place stress? What are your strategies/how does your organisation support this?
Organisational Factors
5. I would like to explore any positive things about working in this organisation
in more detail? (Pick up positive points mentioned in the survey relating to the issues below and probe for detail as to how and why they regard these as positive) Values of the organisation (Opportunities to innovate, remuneration and conditions of service, flexible working, CPD and career development) Culture (team cohesion, support, quality supervision, learning and development opportunities) Working practices and environment (workloads, type of work, IT systems and processes, experiences of performance management)
6. What could your employer do/have done to improve things about working in
this organisation, and (for leavers) to make you want to stay? (Pick up any issues mentioned in the survey – items in the list below are prompts and probe for how things need to change) Values of the organisation (Opportunities to innovate, remuneration and conditions of service, flexible working, CPD and career development) Culture (team cohesion, support, quality supervision, learning and development opportunities) Working practices and environment (workloads, type of work, IT systems and processes, experiences of performance management)
Future Plans
We would like to know about your short and long term career plans.
7. What are your career plans over the next 12 months? • Do you envisage staying in Children’s social work (or whatever particular role they
are in?) Why/ why not? • Do you envisage moving to a different role? If so what? Eg Looked After Children
(LAC); children with disabilities; adult social work; leaving a managerial role? Why?

179
• Do you envisage staying in this LA/moving to another LA/ voluntary sector/ moving to agency work? Why/why not?
• Do you envisage moving out of social work altogether? Why/why not? If not, what will you do?
• Are you looking for a promotion? To what role? And if not, why not? • Do you face any barriers to progression? What are they/ why/ how could they be
overcome?
8. What are your career plans over the next 5 Years?
• Do you envisage staying in Children’s social work (or whatever particular role they are in?) Why/ why not?
• Do you envisage moving to a different role? If so what? Eg Looked After Children (LAC); children with disabilities; adult social work; leaving a managerial role? Why?
• Do you envisage staying in this LA/moving to another LA/ voluntary sector/ moving to agency work? Why/why not?
• Do you envisage moving out of social work altogether? Why/why not? If not, what will you do?
• Are you looking for a promotion? To what role? And if not, why not? • Do you face any barriers to progression? What are they/ why/ how could they be
overcome?
9. Can you think of anything that would change your career plans in future?
• Personal issues (in or outside work) • Organisational issues (caseload, balance of caseload, job sharing, TOIL) • Remuneration/conditions of service • Wider/national context (e.g. regulatory framework; accreditation requirements etc) • Media, public perception
10. What could do you think could be done to improve retention of children’s social workers?
• Probe for views about what could be done by employing organisations, but also by the government, and the social work profession itself.
11. Any other issues • Are there any other matters that you think are important about the recruitment and
retention of children’s social workers? Thank you very much for taking part, the information you have provided us with will be used to help understand the factors affecting the recruitment and retention of children’s social workers. Findings from the study will help to guide and influence developments in national policy to address this issue.
180
C Summary and wrap-up – 3-5 mins
We would like to send you a £20 voucher to say thank you for taking part. Would you prefer to receive an Amazon E-Voucher or a ‘Love 2 Shop Voucher’.
• Check what voucher type they would like. • Ask for email / postal address so we can deliver it to them • Explain that the processing of incentives is done through the IFF accounts
team and it can take a few weeks for their vouchers to arrive. Note that the e-voucher will arrive sooner than the posted vouchers.
Amazon E Voucher (note this comes more quickly)
Email Address:
Love 2 Shop or Amazon Voucher Postal address:
Thank you very much for taking the time to speak with me today. Would you be willing for us to call you back if we need to clarify any information?
Yes
No
As mentioned above, the information you have provided us with will be used to inform the research which is tracking information about the recruitment and retention of children’s social workers over a 5 year period. Are you willing to be contacted again in 12 months’ time to be invited to participate in the next wave of the survey – this should only take 10 minutes? (Check contact details – email and phone number). REASSURE IF NECESSARY: We still want to include people even if they have changed job or moved out of social work altogether.
Yes
No
IF CONSENT TO RECONTACT And could I just check, is the number that I called you on today the best number to
reach you?
Yes
No – write in number

181
And what is the best email address to reach you on?
Write in email address:
No- refused to answer
IF NEEDED: You also have a right to lodge a complaint with the Information Commissioners Office (ICO) and you can do so by calling 0303 123 1113.
Finally, I would just like to confirm that this interview has been carried out under IFF instructions and within the rules of the MRS Code of Conduct. Thank you very much for your help today.
THANK RESPONDENT AND CLOSE INTERVIEW

182
Appendix 4: References Baginsky M (2013), Retaining Experienced Social Workers: Challenges facing local authorities in England, King’s College London https://www.kcl.ac.uk/scwru/pubs/2013/reports/baginsky13retaining.pdf
Blewett J, et al (2013), Evaluation of the Early Professional Development Pilot Programme, University of Bristol, University of Salford & King's College London for the Department for Education
https://assets.publishing.service.gov.uk/government/uploads/system/uploads/attachment_data/file/219647/DFE-RR267.pdf
Carpenter J et al (2012), Newly Qualified Social Worker Programme: Final Evaluation Report, University of Bristol, University of Salford & King's College London for the Department for Education
https://www.kcl.ac.uk/scwru/pubs/2012/reports/carpenteretal2012nqswfinal.pdf
Collins S (2016), The Commitment of Social Workers in the UK: Committed to the Profession, the Organisation and Service Users? Practice. 1-21.
Department for Education (2014, updated 2018), Post-qualifying standard: knowledge and skills statement for child and family practitioners
https://assets.publishing.service.gov.uk/government/uploads/system/uploads/attachment_data/file/708704/Post-qualifying_standard-KSS_for_child_and_family_practitioners.pdf
Department for Education (2018), Experimental statistics: Children and family social work workforce in England, year ending 30 September 2017 https://assets.publishing.service.gov.uk/government/uploads/system/uploads/attachment_data/file/681546/SFR09-2018_Main_Text.pdf
Department for Education (2019), Experimental statistics: Children and family social work workforce in England, year ending 30 September 2018 https://assets.publishing.service.gov.uk/government/uploads/system/uploads/attachment_data/file/782154/Children_s_social_work_workforce_2018_text.pdf
Maxwell N, J Scourfield et al (2016), Independent Evaluation of the Frontline Pilot, Cardiff University for the Department of Education
https://assets.publishing.service.gov.uk/government/uploads/system/uploads/attachment_data/file/560885/Evaluation_of_Frontline_pilot.pdf
McLaughlin H, S Shardlow et al (2010), Strengthening employer engagement in the planning, development and delivery of social work education, Skills for Care
183
Mor Barak M, J Lissly and A Nevin (2001), Antecedents to Retention and Turnover among Child Welfare, Social Work, and Other Human Service Employees: What Can We Learn from Past Research? A Review and Metanalysis, Social Service Review Vol.75, No.4, 2001, p. 625-661
Research in Practice (2015), Strategic Briefing: social work recruitment and retention
https://www.rip.org.uk/resources/publications/strategic-briefings/social-work-recruitment-and-retention-strategic-briefing-open-access-download-2015/
Smith R et al (2018), Evaluation of Step Up to Social Work, Cohorts 1 and 2: 3-years and 5-years on, University of Durham and University of Bristol for the Department for Education
https://assets.publishing.service.gov.uk/government/uploads/system/uploads/attachment_data/file/707085/Step_Up_to_Social_Work_evaluation-3_and_5_years_on.pdf
Social Work Reform Board (2010), Building a safe and confident future: one year on, Overarching professional standards for social workers in England
https://assets.publishing.service.gov.uk/government/uploads/system/uploads/attachment_data/file/180792/DFE-00602-2010-2.pdf
Webb C and J Carpenter (2012), What Can Be Done to Promote the Retention of Social Workers? A systematic review of interventions. British Journal of Social Work, Vol. 42, No. 7, 2012, p. 1235-1255

184
© Department for Education 2019
Reference: DFE-RR934
ISBN: 978-1-83870-046-1
The views expressed in this report are the authors’ and do not necessarily reflect those of the Department for Education.
For any enquiries regarding this publication, contact us at: [email protected] or www.education.gov.uk/contactus
This document is available for download at www.gov.uk/government/publications