Embed Size (px)
Citation preview

Longitudinal Teacher Education and Workforce Study (LTEWS)
Final Report November 2013
MAIN REPORT

ISBN 978-1-74361-913-1 [PDF]
ISBN 978-1-74361-914-8 [DOCX]
© Commonwealth of Australia 2014
With the exception of the Commonwealth Coat of Arms, the department’s logo, any material protected by a trade
mark and where otherwise noted all material presented in this document is provided under a Creative Commons
Attribution-NonCommercial-ShareAlike 3.0 Australia (http://creativecommons.org/licenses/by-nc-sa/3.0/au/)
licence.
The details of the relevant licence conditions are available on the Creative Commons website (accessible using the
links provided) as is the full legal code for the CC BY-NC-SA 3.0 AU licence
(http://creativecommons.org/licenses/by-nc-sa/3.0/au/legalcode).
The material must be attributed as the Longitudinal Teacher Education & Workforce Study developed by Deakin
University under contract with the Commonwealth of Australia as represented by the Department of Education.
The material builds on and incorporates the following pre-existing copyright material: datasets and relevant
findings from the Studying the Effectiveness of Teacher Education in which copyright is owned by Deakin University
and was developed with support under the Australian Research Council's Linkage Projects funding scheme (project
number LP110100003).
As far as practicable, all other material for which the copyright is owned by a third party will be clearly labelled.
The department has made all reasonable efforts to ensure that this other material has been reproduced in this
document with the full consent of the copyright owners.
Copyright requests and enquiries concerning further authorisation should be addressed to:
The Copyright Officer, Department of Education, Location code C10MT1 GPO Box 9880 Canberra ACT 2601 or
emailed to [email protected].
The terms of use for the Commonwealth Coat of Arms are available from the It's an Honour website.
Where a copyright owner, other than the Commonwealth, is identified with respect to this material, please contact
that third party copyright owner directly to seek permission.
Longitudinal Teacher Education and Workforce Study (LTEWS) Final Report
3
Research team:
Diane Mayer (Victoria University)
Brenton Doecke (Deakin University)
Pauline Ho (Research Fellow, Deakin University)
Jodie Kline (Deakin University)
Alex Kostogriz (Deakin University)
Julianne Moss (Deakin University)
Suzanne North (Research Fellow, University of Melbourne)
Bernadette Walker-Gibbs (Deakin University)
Supported by Phillipa Hodder (Research Assistant, Deakin University)
Studying the Effectiveness of Teacher Education (SETE) project
The Longitudinal Teacher Education and Workforce Study (LTEWS) was funded by the former Department of
Education, Employment and Workplace Relations (DEEWR). This report also includes findings generated as part of
the Studying the Effectiveness of Teacher Education (SETE) project that is focused on early career teachers in
Queensland and Victoria. The SETE research is supported by the Australian Research Council (Project LP110100003)
and the Victorian Department of Education and Early Childhood Development (DEECD), the Queensland
Department of Education, Training and Employment (QDETE), the Victorian Institute of Teaching (VIT), and the
Queensland College of Teachers (QCT). The SETE research team is Diane Mayer (Victoria University), Brenton
Doecke (Deakin University), Mary Dixon (Deakin University), Alex Kostogriz (Deakin University), Andrea Allard
(Deakin University), Simone White (Monash University), Bernadette Walker-Gibbs (Deakin University), Leonie
Rowan (Griffith University), Claire Wyatt-Smith (Griffith University), Richard Bates (Deakin University), Jodie Kline
(Deakin University), and Phillipa Hodder (Deakin University).

Longitudinal Teacher Education and Workforce Study (LTEWS) Final Report
4
Acknowledgements
The authors acknowledge the support of:
All state teacher regulatory authorities;
All state departments of education; and,
Catholic and independent employers.
We thank the teacher educators, graduate teachers and principals who participated for their time, generosity and
patience.
We acknowledge the ongoing input of the members of the Sub-Group of the Australian Education, Early Childhood
Development and Youth Affairs Senior Officials Committee (AEEYSOC) Teaching Workforce Dataset Working
Group: Jim Tangas (Victoria); Elsa Lat and Dianne Wasson (New South Wales); Gary Frances (Queensland); Paul
Hunt and Deepthi Wijesekera (Australian Government Department of Education, formerly Department of
Education, Employment and Workplace Relations, DEEWR).
This study was funded by the Australian Government former Department of Education, Employment and
Workplace Relations.
The content of this report does not reflect the views of the former Department of Education, Employment and
Workplace Relations or any other institutions, individuals or systems that provided data.

Longitudinal Teacher Education and Workforce Study (LTEWS) Final Report
5
Table of Contents
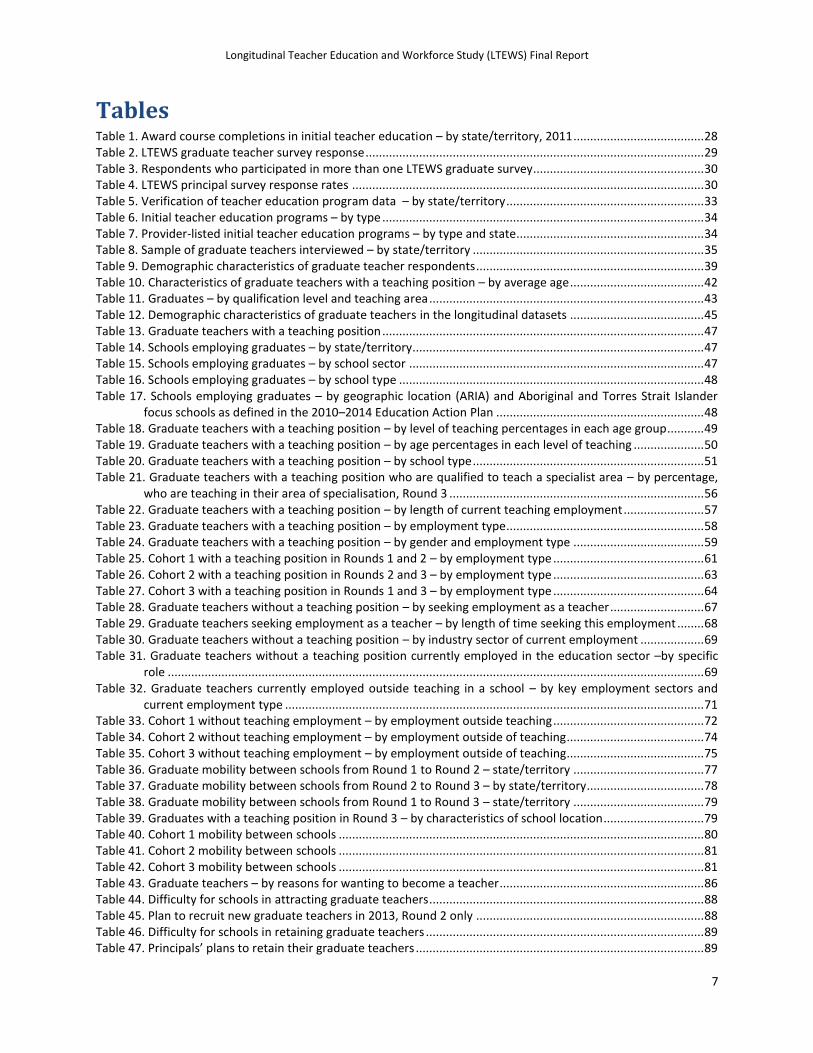
Tables ........................................................................................................................................................ 7
Figures..................................................................................................................................................... 10
Executive Summary ............................................................................................................................ 11
1. Introduction .................................................................................................................................. 19
1.1 Purpose of the Study .................................................................................................................................. 21
1.2 Structure of the Main Report ..................................................................................................................... 22
2. Methodology ................................................................................................................................. 24
2.1 Research Focus ........................................................................................................................................... 24
2.2 Research Design ......................................................................................................................................... 24
2.2.1 Graduate Teacher Surveys and Principal Surveys .................................................................................. 26
2.2.2 Mapping of Initial Teacher Education Programs in Australia, 2011....................................................... 31
2.2.3 Telephone Interviews with Graduate Teachers ..................................................................................... 35
3. Career Progression ..................................................................................................................... 38
3.1 Profile of Graduate Teacher Respondents and their Schools .................................................................... 39
3.1.1 Demographic and professional characteristics of graduate teacher respondents ................................ 39
3.1.2 Characteristics of the schools in which graduate teacher respondents were employed ...................... 46
3.2 Utilisation of New Graduate Teachers ....................................................................................................... 52
3.2.1 Distribution of graduate teachers across teaching areas ...................................................................... 53
3.2.2 Utilisation of Graduates in Teaching Employment ................................................................................ 57
3.2.3 Graduates who did not enter teaching .................................................................................................. 67
3.3 Teacher Mobility ........................................................................................................................................ 76
3.4 Attraction, Retention and Attrition ............................................................................................................ 84
3.4.1 Attraction to teaching ............................................................................................................................ 86
3.4.2 Retention in teaching ............................................................................................................................. 89
3.4.3 Leaving teaching in the early years ........................................................................................................ 95
3.5 Factors influencing Position and Location Changes ................................................................................. 101
3.6 Long-term career intentions of graduate teachers and factors influencing these intentions ................. 105
4. Teacher Education Relevance and Effectiveness .......................................................... 110
4.1 Mapping of Initial Teacher Education Programs in Australia, 2011 ......................................................... 112
4.2 Teacher Education Programs and Graduates’ Decisions to Teach ........................................................... 115

Longitudinal Teacher Education and Workforce Study (LTEWS) Final Report
6
4.2.1 Teacher education programs and graduates’ decisions about teaching employment ........................ 117
4.2.2 Structures, approaches and content considered by graduates and principals as being effective in
preparing teachers for initial employment ....................................................................................................... 123
4.2.3 Influence of teacher education programs on career retention or advancement ................................ 135
4.3 Content and relevance of teacher education programs for subsequent classroom teaching ................. 139
4.4 Entry into Teacher Education ................................................................................................................... 175
4.5 The Practicum .......................................................................................................................................... 180
4.5.1 The nature of the practicum and graduates’ decisions about whether or not to seek teaching
employment. ..................................................................................................................................................... 182
4.5.2 Structures and approaches in practicum considered by graduates and principals as being effective in
preparing teachers for initial employment. ...................................................................................................... 184
4.5.3 The ways in which the practicum appears to influence or support graduates’ career retention or
advancement .................................................................................................................................................... 191
4.5.4 The extent to which the practicum is adequate for subsequent classroom teaching ......................... 192
4.6 Discipline Areas Studied and then Taught in Schools .............................................................................. 203
4.6.1 The relationship between the discipline area studied and the extent to which graduates enter, and
remain in, teaching. .......................................................................................................................................... 204
4.6.2 The extent to which graduates who enter teaching teach the subject disciplines they studied in
teacher education programs............................................................................................................................. 209
4.6.3 The extent to which the discipline areas studied in teacher education programs were adequate in
content and relevance for subsequent classroom teaching ............................................................................. 211
4.7 Preparation to Teach Culturally, Linguistically and Socio-Economically Diverse learners, ICT, and
Numeracy and Literacy.......................................................................................................................................... 214
4.7.1 The extent to which preparation in these areas appears associated with graduates who seek and
obtain teaching employment and the school in which they work .................................................................... 215
5. Conclusion .................................................................................................................................. 227
6. References .................................................................................................................................. 235
Longitudinal Teacher Education and Workforce Study (LTEWS) Final Report
7
Tables Table 1. Award course completions in initial teacher education – by state/territory, 2011 ....................................... 28 Table 2. LTEWS graduate teacher survey response ..................................................................................................... 29 Table 3. Respondents who participated in more than one LTEWS graduate survey................................................... 30 Table 4. LTEWS principal survey response rates ......................................................................................................... 30 Table 5. Verification of teacher education program data – by state/territory ........................................................... 33 Table 6. Initial teacher education programs – by type ................................................................................................ 34 Table 7. Provider-listed initial teacher education programs – by type and state ........................................................ 34 Table 8. Sample of graduate teachers interviewed – by state/territory ..................................................................... 35 Table 9. Demographic characteristics of graduate teacher respondents .................................................................... 39 Table 10. Characteristics of graduate teachers with a teaching position – by average age ........................................ 42 Table 11. Graduates – by qualification level and teaching area .................................................................................. 43 Table 12. Demographic characteristics of graduate teachers in the longitudinal datasets ........................................ 45 Table 13. Graduate teachers with a teaching position ................................................................................................ 47 Table 14. Schools employing graduates – by state/territory ....................................................................................... 47 Table 15. Schools employing graduates – by school sector ........................................................................................ 47 Table 16. Schools employing graduates – by school type ........................................................................................... 48 Table 17. Schools employing graduates – by geographic location (ARIA) and Aboriginal and Torres Strait Islander
focus schools as defined in the 2010–2014 Education Action Plan .............................................................. 48 Table 18. Graduate teachers with a teaching position – by level of teaching percentages in each age group ........... 49 Table 19. Graduate teachers with a teaching position – by age percentages in each level of teaching ..................... 50 Table 20. Graduate teachers with a teaching position – by school type ..................................................................... 51 Table 21. Graduate teachers with a teaching position who are qualified to teach a specialist area – by percentage,
who are teaching in their area of specialisation, Round 3 ............................................................................ 56 Table 22. Graduate teachers with a teaching position – by length of current teaching employment ........................ 57 Table 23. Graduate teachers with a teaching position – by employment type ........................................................... 58 Table 24. Graduate teachers with a teaching position – by gender and employment type ....................................... 59 Table 25. Cohort 1 with a teaching position in Rounds 1 and 2 – by employment type ............................................. 61 Table 26. Cohort 2 with a teaching position in Rounds 2 and 3 – by employment type ............................................. 63 Table 27. Cohort 3 with a teaching position in Rounds 1 and 3 – by employment type ............................................. 64 Table 28. Graduate teachers without a teaching position – by seeking employment as a teacher ............................ 67 Table 29. Graduate teachers seeking employment as a teacher – by length of time seeking this employment ........ 68 Table 30. Graduate teachers without a teaching position – by industry sector of current employment ................... 69 Table 31. Graduate teachers without a teaching position currently employed in the education sector –by specific
role ................................................................................................................................................................ 69 Table 32. Graduate teachers currently employed outside teaching in a school – by key employment sectors and
current employment type ............................................................................................................................. 71 Table 33. Cohort 1 without teaching employment – by employment outside teaching ............................................. 72 Table 34. Cohort 2 without teaching employment – by employment outside of teaching ......................................... 74 Table 35. Cohort 3 without teaching employment – by employment outside of teaching ......................................... 75 Table 36. Graduate mobility between schools from Round 1 to Round 2 – state/territory ....................................... 77 Table 37. Graduate mobility between schools from Round 2 to Round 3 – by state/territory ................................... 78 Table 38. Graduate mobility between schools from Round 1 to Round 3 – state/territory ....................................... 79 Table 39. Graduates with a teaching position in Round 3 – by characteristics of school location .............................. 79 Table 40. Cohort 1 mobility between schools ............................................................................................................. 80 Table 41. Cohort 2 mobility between schools ............................................................................................................. 81 Table 42. Cohort 3 mobility between schools ............................................................................................................. 81 Table 43. Graduate teachers – by reasons for wanting to become a teacher ............................................................. 86 Table 44. Difficulty for schools in attracting graduate teachers .................................................................................. 88 Table 45. Plan to recruit new graduate teachers in 2013, Round 2 only .................................................................... 88 Table 46. Difficulty for schools in retaining graduate teachers ................................................................................... 89 Table 47. Principals’ plans to retain their graduate teachers ...................................................................................... 89

Longitudinal Teacher Education and Workforce Study (LTEWS) Final Report
8
Table 48. Retention and attrition patterns .................................................................................................................. 90 Table 49. Retention and attrition patterns – by school state/territory ....................................................................... 90 Table 50. Retention and attrition patterns – by school geographic location .............................................................. 91 Table 51. Retention and attrition patterns – by designated Aboriginal and Torres Strait Islander focus school ........ 92 Table 52. Retention and attrition patterns – by school type ....................................................................................... 93 Table 53. Graduate teachers with a teaching position – by level of agreement with the effectiveness of types of
support received in schools ........................................................................................................................... 98 Table 54. Graduate teachers’ plans for three years’ time ......................................................................................... 106 Table 55. Graduate teachers’ plans for three years’ time – by program area........................................................... 107 Table 56. Graduate teachers’ perceptions of the distinguishing features of their teacher education programs ..... 123 Table 57. Graduate teacher perceptions of teacher education program distinguishing features – by program type
..................................................................................................................................................................... 124 Table 58. Graduate teacher perceptions of teacher education program distinguishing features – by type of delivery
..................................................................................................................................................................... 125 Table 59. Distinguishing features of teacher education programs – by graduate teachers and institutions ............ 125 Table 60. Importance of university-based units for the knowledge gained and help in preparing for current teaching
..................................................................................................................................................................... 126 Table 61. Importance of university-based units for the knowledge gained and help in preparing for current teaching
..................................................................................................................................................................... 127 Table 62. Comparison of mean for university-based units statements – by program type ...................................... 128 Table 63. Comparison of mean, for agreement with statements on university-based units – by campus location . 129 Table 64. Comparison of mean, for agreement with statements on university-based units – by mode of study .... 129 Table 65. Comparison between groups, of mean for agreement with statements on university-based units – by
program type ............................................................................................................................................... 130 Table 66. Comparison of mean, for agreement with statements on university-based units – by program area ..... 131 Table 67. Comparison of mean, for agreement with statements on university-based units – by program area ..... 131 Table 68. Principals’ views of key challenges faced by newly employed graduate teachers .................................... 132 Table 69. Principals’ views of key attributes that contribute to a difficult transition into teaching ......................... 133 Table 70. Graduates' level of agreement that their teacher education programs prepared them in the professional
standards – by retention and attrition as a teacher in a school .................................................................. 136 Table 71. Graduates' level of agreement that teacher education programs prepared them in the professional
standards – by leadership position as a teacher in a school ....................................................................... 137 Table 72. Graduate teachers – by level of agreement with the statement ‘I would recommend my teacher
education program to others’ ..................................................................................................................... 142 Table 73. Graduate teachers – by preparation in key areas of teaching ................................................................... 145 Table 74. Comparison of mean for preparation in the professional standards – by gender ..................................... 148 Table 75. Comparison of mean for preparation in the professional standards, by program type ............................ 149 Table 76. Comparison between groups of mean for preparation in the professional standards – by program type
..................................................................................................................................................................... 150 Table 77. Comparison of mean for preparation in the professional standards – by program area .......................... 151 Table 78. Comparison between groups of mean for preparation in the professional standards – by program area
..................................................................................................................................................................... 152 Table 79. Graduate teachers – by effectiveness in the professional standards ........................................................ 155 Table 80. Comparison of mean for effectiveness in the professional standards – by gender................................... 157 Table 81. Comparison of mean for effectiveness in the professional standards – by program type ........................ 158 Table 82. Comparison between groups of mean for effectiveness in the professional standards – by program type
..................................................................................................................................................................... 159 Table 83. Comparison of mean for effectiveness in the professional standards – by program area ........................ 160 Table 84. Comparison between groups of mean for effectiveness in the professional standards – by program area
..................................................................................................................................................................... 161 Table 85. Comparison of teacher and principal perceptions on effectiveness in 'Know students and how they learn'
..................................................................................................................................................................... 164

Longitudinal Teacher Education and Workforce Study (LTEWS) Final Report
9
Table 86. Comparison of teacher and principal perceptions on effectiveness in 'Know the content and how to teach it' .................................................................................................................................................................. 166
Table 87. Comparison of teacher and principal perceptions on effectiveness in 'Plan for and implement effective teaching and learning' ................................................................................................................................. 167
Table 88. Comparison of teacher and principal perceptions on effectiveness in 'Create and maintain supportive and safe learning environments' ........................................................................................................................ 169
Table 89. Comparison of teacher and principal perceptions on effectiveness in 'Assess, provide feedback and report on student learning' .................................................................................................................................... 170
Table 90. Comparison of teacher and principal perceptions on effectiveness in 'Engage in professional learning' . 172 Table 91. Comparison of teacher and principal perceptions on effectiveness in 'Engage professionally with
colleagues, parents/carers and the community' ......................................................................................... 173 Table 92. Graduate teachers by highest qualifications in fields other than education ............................................. 178 Table 93. Graduate teachers by age .......................................................................................................................... 179 Table 94. Graduate teachers – by the structure of the practicum in their teacher education program ................... 182 Table 95. Graduates’ practicum structures – by employment as a teacher and seeking work as a teacher ............ 183 Table 96. Graduate teachers with a teaching position – by their view of importance of skills gained in practicum 184 Table 97. Graduate teachers with a teaching position – by their view of relevance of practicum to current teaching
..................................................................................................................................................................... 184 Table 98. Graduate teachers with a teaching position – by their view of the importance of skills gained in
practicum, by practicum component .......................................................................................................... 185 Table 99. Graduate teachers with a teaching position – by their view of relevance of practicum to current teaching,
by practicum component ............................................................................................................................ 186 Table 100. Graduate teachers’ practicum components, by program type ................................................................ 187 Table 101. Graduate teachers – by length of internship as part of practicum component in teacher education
program ....................................................................................................................................................... 189 Table 102. Graduate teachers' length of internship – by type of supervision provided during internship ............... 189 Table 103. Graduates' participation in practicum components types – by retention and attrition, and by leadership
position as a teacher in a school ................................................................................................................. 191 Table 104. Teacher regulatory authority requirements for minimum days for supervised practicum by state/
territory (early 2012) ................................................................................................................................... 192 Table 105 Graduate teachers with a teaching position – by their view of relevance of university-based units to
current teaching, Round 2 survey ............................................................................................................... 196 Table 106. Graduate teachers with a teaching position – by practicum component and perception of success in
influencing student learning........................................................................................................................ 196 Table 107. Graduate teachers with a teaching position – by main area of teaching ................................................ 204 Table 108. Graduate teachers currently teaching whose main area of teaching includes secondary – by discipline
area in which they have qualifications to teach .......................................................................................... 204 Table 109. Graduate teachers' main area of teacher education program – by employment as a teacher in a school,
Cohorts 1 and 2 ........................................................................................................................................... 206 Table 110. Graduate teachers' main area of teacher education program – by employment as a teacher in a school,
Cohorts 1 and 2 ........................................................................................................................................... 206 Table 111. Secondary graduate teachers currently teaching who participated in more than one LTEWS Graduate
Teacher Survey – by whether or not teaching in their specialist areas ...................................................... 207 Table 112. Secondary graduate teachers with a teaching position who have a specialist qualification – by currently
teaching in a specialist area ........................................................................................................................ 209 Table 113. Secondary graduate teachers with a teaching position and their principals – by level of agreement that
their teaching in a specialist area is effective ............................................................................................. 211 Table 114. Comparison of mean for preparation and effectiveness in specialist area expertise.............................. 212 Table 115. Comparison of mean for preparation and effectiveness in specialist area expertise – by gender .......... 212 Table 116. Graduate teachers – by level of agreement that teacher education programs prepared them in key
areas of teaching ......................................................................................................................................... 215 Table 117. Graduate teachers – by level of agreement that they are effective in key areas of teaching ................. 216

Longitudinal Teacher Education and Workforce Study (LTEWS) Final Report
10
Table 118. Graduates' level of agreement that teacher education programs prepared them in key areas – by school geographic location ..................................................................................................................................... 218
Table 119. Graduates' level of agreement that teacher education programs prepared them in key areas – by school Aboriginal and Torres Strait Islander focus ................................................................................................. 219
Figures Figure 1. LTEWS data collection process ..................................................................................................................... 25 Figure 2. Career progression of interview respondents who participated in all three rounds ................................... 36 Figure 3. Graduate teaching area – by qualification level ........................................................................................... 44 Figure 4. Graduate teachers with a teaching position who have a specialist qualification – by currently teaching in
their specialist area ....................................................................................................................................... 54 Figure 5. Graduate teachers with a teaching position who are qualified to teach in a specialist area – by their area
of specialisation, Rounds 1 and 2 .................................................................................................................. 55 Figure 6. Graduate teachers' employment in schools ................................................................................................. 57 Figure 7. Cohort 1 – by employment as a teacher ....................................................................................................... 60 Figure 8. Cohort 2 – by employment as a teacher ....................................................................................................... 62 Figure 9. Cohort 3 – by employment as a teacher ....................................................................................................... 64 Figure 10. Principals’ willingness to employ first-year graduate teachers ................................................................. 66 Figure 11. Graduate teachers without a teaching position – by current employment status .................................... 68 Figure 12. Graduate teachers currently employed outside teaching in a school – by current employment type ...... 70 Figure 13. Cohort 1 without teaching employment – by seeking teaching employment ........................................... 72 Figure 14. Cohort 2 without teaching employment – by seeking teaching employment ........................................... 73 Figure 15. Cohort 3 without teaching employment – by seeking teaching employment ........................................... 75 Figure 16. Difficulty in attracting graduate teachers – by school location .................................................................. 87 Figure 17. School location – by difficulty in retaining graduate teachers ................................................................... 94 Figure 18. Support available to first year teachers according to school principals ................................................... 100 Figure 19. Graduate teachers’ plans for three years’ time – by program type ......................................................... 106 Figure 20. Graduate teachers plans for three years’ time – by currently employed as a teacher in a school .......... 109 Figure 21. Graduates with teaching positions – by teacher education program type .............................................. 117 Figure 22. Graduates without teaching positions who are seeking teaching employment – by teacher education
program type ............................................................................................................................................... 118 Figure 23. Graduates without teaching positions who have employment outside teaching – by teacher education
program type ............................................................................................................................................... 119 Figure 24. Graduates with teaching positions – by main area of teacher education program ................................. 120 Figure 25. Graduates without teaching positions seeking teaching employment – by main area of teacher
education program ...................................................................................................................................... 120 Figure 26. Graduates without teaching positions who have employment outside teaching – by main area of teacher
education program ...................................................................................................................................... 121 Figure 27. Graduate teachers – by the mean of their preparation in the professional standards ............................ 147 Figure 28. Graduate teachers – by the mean of their effectiveness in the professional standards .......................... 156 Figure 29. Graduate teachers with academic or trade qualifications in an area other than teaching ...................... 177 Figure 30. Graduate teachers' main area of program – by previous qualifications .................................................. 177 Figure 31. Graduate teachers with a teaching position – by their view of the importance of skills gained during
practicum .................................................................................................................................................... 194 Figure 32. Graduate teachers with a teaching position – by their view of the relevance of practicum to current
teaching context .......................................................................................................................................... 195 Figure 33. Secondary graduate teachers with a teaching position who have a specialist qualification – by currently
teaching in their specialist area ................................................................................................................... 209 Figure 34. Principals’ views of the effectiveness of individual graduate teachers in key areas ................................ 217

Longitudinal Teacher Education and Workforce Study (LTEWS) Final Report
11
Executive Summary
The Longitudinal Teacher Education Workforce Study (LTEWS) investigated the career progression of graduate
teachers from teacher education into teaching employment in all states and territories across Australia in 2012 and
the first half of 2013, and tracked their perceptions, over time, of the relevance and effectiveness of their teacher
education programs. Specifically, it investigated:
The career progression of the 2011 teacher education graduates from teacher education into, and
possible exit from, teaching employment, including their utilisation into teaching, their retention and
attrition in teaching in their early years, and their geographic and schools sector mobility; and,
The views of teacher education graduates over time on the relevance and effectiveness of their teacher
education for their teaching employment, including the relationship between their views of their teacher
education and their early career teaching career.
LTEWS was conducted concurrently with the Studying the Effectiveness of Teacher Education (SETE) project, which
is a three-year project investigating these issues in Queensland and Victoria. SETE is funded by the Australian
Research Council, the Victorian Department of Education and Early Childhood Development (DEECD), the
Queensland Department of Education, Training and Employment (QDETE), the Victorian Institute of Teaching (VIT),
and the Queensland College of Teachers (QCT). LTEWS focused on data collection in states and territories other
than Queensland and Victoria. The findings from the SETE study were incorporated with the LTEWS findings to
provide a national data set.
First, initial teacher education programs across Australia were mapped between late 2011 and early 2012,
providing a point-in-time review of the initial teacher education programs relevant for the 2011 graduate teacher
cohort being tracked. Programs were mapped in relation to: length, structure and delivery; professional
experience; content and approaches; integration of theory and practice; and measures of entry into programs (see
Appendix 1 for the full report of the mapping and section 4.1 of this report for a summary of the findings). The
major purpose of the mapping was cross-tabulation in the analysis of graduates’ preparedness to teach and their
career decisions. However, a snapshot of teacher education in Australia in 2011/ 2012 includes the following:
Of the 551 initial teacher education programs offered across Australia (across 103 campuses), 397
were bachelor’s degrees (72 per cent), 96 were graduate diplomas/postgraduate diplomas (17 per cent)
and 58 were masters degrees (11 per cent).
The programs ranged in length from 1-5 years. A majority of undergraduate teacher education programs
were offered over four-years or part-time equivalent (63 per cent). Postgraduate programs were
generally offered over 1-2 years, with masters programs commonly two years of study (or equivalent)
and graduate diplomas one year. Graduate entry bachelor degrees were 1.5 or 2 years duration and
postgraduate diplomas were sometimes offered as an early exit qualification from a masters degree.
Based on 497 responses, 75 per cent of programs were offered in full-time mode with part time options,
while 14 per cent were offered in external/distance modes.
Based on 457 programs, over 50 per cent (n=248) said they offered practicum days in excess of teacher
regulatory authority minimum requirements. This finding must be treated with caution given the variation
in professional experience nomenclature across Australia.

Longitudinal Teacher Education and Workforce Study (LTEWS) Final Report
12
Over 43 per cent of the programs included internships as part of the professional experience. Internships
were more likely to be available to pre-service teachers enrolled in bachelor’s degrees than in graduate
diploma or masters programs. Internships were usually 6-10 weeks in duration and usually followed
completion of the minimum number of practicum days required for registration. However, because of the
different ways in which the term ‘internship’ was used, definitive conclusions about internships across
programs was difficult.
Many teacher education programs included study in the preparation to teach culturally, linguistically and
socio-economically diverse learners. Some programs had stand-alone units, while others integrated these
aspects across their programs.
Preparation to teach literacy and numeracy is a key requirement for teacher education program
accreditation to ensure that pre-service teachers are competent to meet the literacy demands of the
curriculum areas they teach. There is also recognition that graduate teachers need to possess a high level
of personal literacy and numeracy.
The ways in which teacher education programs helped pre-service teachers make theory-practice links
varied in structure and approach. Some institutions incorporated professional placement within
curriculum and educational studies units, while other institutions focused on key teaching and learning
aspects (e.g. classroom management) during a specific professional experience period.
The Australian Tertiary Admission Rank (ATAR) and results of pre-requisite Year 12 subjects were usually
used as the basis for selection of school leavers into undergraduate programs.
Providers reported valuing pre-service teachers who possessed personal values and attitudes appropriate
to the discipline and/or profession as well as high levels of intellectual curiosity and critical thinking. In
addition, they reported valuing pre-service teachers who demonstrated a commitment to ethical and
sustainable practices, a commitment to the profession and effective communication including the use of
ICTs.
The study utilised a mixed-method approach using quantitative and qualitative data collection methods including
three rounds of Graduate Teacher Surveys and Principal Surveys and interviews with graduate teachers. The
Graduate Teacher Survey data were analysed in two ways: firstly as three separate snapshots over the 18 months
that LTEWS was funded (March 2012, October 2012, March 2013); and, secondly from a longitudinal perspective
on graduate teachers who were followed across this time period. The findings are also informed by the interview
data collected between May 2012 and May 2013 after each survey round.
Responses to the Graduate Teacher Surveys were low. For the three rounds, response rates ranged between 8.3
per cent and 16.7 per cent when compared to national initial teacher education award course completion data.
Across the rounds, between 87 and 91 per cent of the returned surveys were completed and able to be used in the
analysis. In the absence of comprehensive data about the research population, an indication of sample
representativeness is provided by comparing the distribution of the LTEWS cohorts to existing collections including
Department of Industry, Innovation, Science, Research and Tertiary Education higher education statistics (2011),
data collected for the Staff in Australia’s Schools survey 2010 (McKenzie, Rowley, Weldon, & Murphy, 2011) and
Australian Bureau of Statistics Census (2011a) and Australian Bureau of Statistics, Schools Australia (2011b). The
results report response frequencies alongside valid percentages to enable the reader to consider margins of error
when interpreting the data. Concerns about data quality are few in number and are highlighted in the relevant
sections to ensure that these findings are read with caution. Specifically, on occasions where participant
demographics, such as school location, were used as a filter for analyses, consideration must be given to standard

Longitudinal Teacher Education and Workforce Study (LTEWS) Final Report
13
error. In almost all instances in which there were small numbers of respondents for sub-groups, the proportions
were consistent with what would be expected for the population.
The average age of the 2011 graduate teacher respondents early in their first year after graduation was 32 years,
with 53 per cent under 30 years of age and 81 per cent female. Eighty-six per cent came from English-speaking
backgrounds, 1 per cent identified as Aboriginal or Torres Strait Islander, and 42 per cent identified as the first in
their immediate family to gain a tertiary qualification. Fifty-two per cent had graduated from a graduate entry
teacher education qualification (including 12 per cent from masters programs), while 46 per cent had graduated
with a four-year undergraduate bachelor’s degree. The majority were qualified to teach secondary school (44 per
cent) and primary school (37 per cent). More than three-quarters had completed their teacher preparation in
Victoria (29 per cent), Queensland (24 per cent) and New South Wales (23 per cent).
Key Findings
Key findings relate to the two main areas of investigation in the project:
Teacher education relevance and quality; and,
Employment and career progression.
Teacher education relevance and quality
Teacher graduates – Views of their teacher education programs
1. When asked about features of their teacher preparation programs that set them apart from other programs,
more than half of the graduates noted reflective practice (64 per cent), quality teaching (53 per cent), and
literacy (51 per cent) as distinguishing features of their program. These three features were the same for all
three program types – bachelor, graduate diploma and masters. Less than a third noted social relationships,
catering for cultural and linguistically diverse learners, school linkages, team teaching and discipline expertise.
Teacher education providers gave similar rankings.
2. Over 75 per cent of new graduates who had gained employment as a teacher would recommend their teacher
education program to someone else, while two-thirds of new graduates who had not been successful in
gaining employment as a teacher would recommend their teacher education program. Graduate teachers with
a teaching position were more positive about their initial teacher education than those without a teaching
position.
3. More than 83 per cent of graduates undertook some of their practicum in one or more weekly blocks. Both
graduates and principals valued extended practicums including internships, citing that the extended length of
practice allowed deeper connections to schools and classrooms. Graduate teachers’ and principals’ responses
highlighted the value of the teacher education program including a combination of 1 to 2 days per week and
block placements of 5 weeks duration, and then internships in the final part of the program.
4. Graduates expressed the need for stronger linkages between content, theory and application in schools,
supported by strong school-university partnerships. Interview comments indicated preference for more

Longitudinal Teacher Education and Workforce Study (LTEWS) Final Report
14
quality practicum experiences in different school settings, including professional learning conversations with
supervisors and mentors from universities and schools.
Teacher graduates – Impact of teacher education on their current teaching
5. Nearly all graduates with a teaching position agreed that the skills they developed during the practicum were
important and that the practicum prepared them for their current teaching context, irrespective of the ways in
which it was structured – days per week or blocks.
6. The type of practicum that graduates experienced in their programs did not appear to be related to the
perceptions of graduates who were teaching about their effectiveness as a teacher.
7. New graduates with a teaching position agreed that the knowledge gained from the university-based
component of their teacher education program was important (75-79 per cent) and helped prepare them for
their teaching context (65-61 per cent).
7.1. At the end of the first year after graduation, there was a significant difference in this respect between
graduates with masters and graduate diploma degrees, with masters students more likely to agree that
the knowledge gained through university-based units was important and helped prepare them for their
current teaching context.
8. The Australian Professional Standards for Teachers in which more than 75 per cent of graduate teachers felt
well prepared by their teacher education programs included 'Engage in professional learning' (89 per cent
agreement in Round 1), 'Know students and how they learn' (78 per cent in Round 2) and 'Plan for and
implement effective teaching and learning' (76 per cent in Round 2).
8.1. Regardless of teacher education program, graduates felt least prepared to ‘Engage professionally with
colleagues, parents/carers and the community’ and to ‘Assess, provide feedback and report on student
learning’. Overall, less than half of the graduate teachers considered they were well prepared to ‘Engage
professionally with colleagues, parents/carers and the community’. This was corroborated by the
principals who highlighted engagement with parents, families and communities as one of the key
challenges for beginning teachers
8.2. Graduates who had completed a graduate diploma felt less prepared to 'Know students and how they
learn' and 'Know the content and how to teach it', while graduates with a masters degree felt better
prepared to 'Know the content and how to teach it' and ‘Assess, provide feedback and report on student
learning’.
9. More than 80 per cent of graduate teachers felt effective in all of the Australian Professional Standards for
Teachers. They rated themselves highly effective in the areas of:
‘Know students and how they learn’
‘Know the content and how to teach it’
‘Plan for and implement effective teaching and learning’
‘Create and maintain supportive and safe learning environments’
10. More graduates considered that they were more effective in teaching in relation to the Australian Professional
Standards for Teachers than they had been prepared in these areas. The key areas with the largest difference

Longitudinal Teacher Education and Workforce Study (LTEWS) Final Report
15
between perceptions of being prepared and perceptions of being effective were 'Engage professionally with
colleagues, parents/carers and the community' in Rounds 2 and 3, and 'Know the content and how to teach it'
in Round 3.
11. With respect to the other three teaching areas other than the Australian Professional Standards that were
investigated, only about half of the graduate teachers felt well prepared to ‘Teach culturally, linguistically and
socio-economically diverse learners’, with slightly more feeling well prepared in the ‘Use of ICT’ and ‘Literacy
and Numeracy’. Preparedness in these areas was rated lower than for the Australian Professional Standards
for Teachers. It is noteworthy, however, that in surveys and interviews graduates recorded experiencing
significant professional learning in ‘Teaching culturally, linguistically and socio-economically diverse learners’
during their first year of employment.
12. As with responses regarding the professional standards, graduates considered that they were more effective
in teaching than their sense of preparedness in relation to the three other specified areas of ‘Teaching
culturally, linguistically and socio-economically diverse learners’, ‘Use of ICT’ and ‘Literacy and numeracy’.
More than 70 per cent of the graduates considered that they were effective in these specified areas.
Views of their current school principals
13. Principals generally endorsed the assessments of teacher graduates about their effectiveness in relation to the
Australian Professional Standards for Teachers, but principals had more positive perceptions of the
effectiveness of graduates than the graduates themselves to ‘Plan for and implement effective teaching and
learning’.
14. Amongst the key challenges faced by newly employed graduate teachers, principals identified classroom
management, pedagogy and catering for diverse learners as the most significant challenges.
15. Principals identified poor teaching skills and classroom management as the most common cause of a difficult
transition into teaching. However, they noted lack of school support and induction, lack of
interpersonal/communication skills, and lack of adequate teacher preparation as also contributing to this
transition.
16. Principals reported that the most common form of school support provided to new graduate teachers was
ongoing professional learning opportunities. Graduates considered this type of support was the most effective
to them as an early career teacher, followed by an informal mentor arrangement. However, it is also worth
noting that while more than 97 per cent of principals identified induction programs as available in their
schools at all three survey points, 20-26 per cent of graduate teachers identified this as not available at the
same points in time.
Entry into teacher education:
17. Forty-two per cent of graduate respondents identified as the first in their family to gain a tertiary qualification.
18. Based on age analysis, 70-78 per cent of graduates did not enter their teaching education programs directly
from secondary school. A majority of graduates had prior academic or trade qualifications before entering
their teacher education program. About 60 per cent of those with prior qualifications held bachelor degrees

Longitudinal Teacher Education and Workforce Study (LTEWS) Final Report
16
and 11-12 per cent held postgraduate qualifications. More secondary graduates had prior qualifications than
those in primary or early childhood.
19. The Australian Tertiary Assessment Rank (ATAR) as a measure of entry is relevant for a relatively small
percentage of those entering teacher education – school leavers commencing undergraduate programs. The
initial teacher education mapping component of this study shows that teacher education providers use
additional measures for program entry including prior qualifications, interviews, portfolios, auditions,
character references, residential location, social economic status (SES) and evidence of prior learning (see
Appendix 1).
Employment and career progression
20. Graduates wanted a teaching career for altruistic reasons. Approximately 90 per cent of the graduate teachers
joined teaching ‘wanting to make a difference’ and more than 70 per cent indicated that they ‘Always wanted
to teach/work with children’. About 70 per cent also highlighted that they wanted to work in their areas of
specialisation or interest. Very few saw teaching as a ‘backup plan’ or entered teacher education just because
their ATAR score was sufficient.
21. A majority of graduates moved into teacher employment after graduation. The percentage of the population
early in the first year after graduation was 74 per cent, increasing to 84 per cent early in the second year.
22. Of those graduates who were not teaching at the end of the survey period:
o nearly all had other employment. Of these, 40 per cent had a non-teaching position elsewhere in the
education sector; and
o nearly two thirds were still seeking a teaching position and only 11 per cent had no intention of
seeking such a position sometime in the future
23. Of those graduates with a specialist teaching qualification, more than three-quarters reported that they were
teaching in at least one of their area of specialisation.
23.1. High proportions of special needs, mathematics, English, technology, science, and languages
other than English (LOTE) teachers were teaching in their area of specialisation.
23.2. Graduate teachers with specialist qualifications in society and the environment, the arts and
health and physical education were least likely to be teaching in their specialist areas and
therefore more likely to be teaching out-of-field.
24. In total, nearly two-thirds of graduates commenced teaching in a full time position. Fewer than 20 per cent of
graduates had commenced teaching on a permanent basis, with just over 20 per cent commencing on a casual
basis. Over 55 per cent of graduates were on contract, either full or part-time and 46 per cent of the contract
positions were reported as full-time employment.
24.1. There was some improvement towards more stable employment over the year after graduation
with an increase in permanent employment to more than one third early in the second year, as
well as a reduction in contract and casual employment. The proportion in a full-time position
increased to nearly three quarters (34 per cent permanent, 38 per cent contract).

Longitudinal Teacher Education and Workforce Study (LTEWS) Final Report
17
24.2. Of those who were in part-time contract or casual employment in their first year, approximately
half of them remained employed in this capacity in their second year of employment.
Approximately 30 per cent of graduates were in part-time contract or casual employment by
their second year of employment.
24.3. Teacher interviews indicated that:
24.3.1. Casual or relief employment was a factor hindering career progression and professional learning
and development.
24.3.2. Those with a full-time position reported qualitatively that greater classroom experience
supported them to be more effective in the classroom.
25. Attrition of graduates from teaching (i.e. leaving/ not continuing in a teaching position) was 7 per cent over
the data collection period.
25.1. Attrition was higher than average in schools in outer regional and very remote areas but lower
than average for Aboriginal and Torres Strait Islander focus schools.
25.2. In terms of schooling level, the highest attrition rate was in secondary schools
26. Many new graduates stayed to teach in the state or territory in which they completed their teacher
preparation program.
26.1. About a third were teaching in schools in areas where they had lived prior to their teacher
preparation, and about two thirds were teaching in schools located in areas similar in socio-
economic and cultural diversity to those in which they lived prior to their teacher preparation.
26.2. A majority (almost 60 per cent) stayed teaching in their initial school over the survey period. A
fifth changed school, with a preference for more stable employment being the main reason for
doing so. Other reasons evidenced from the free text survey data included lack of support in their
initial school and family or personal reasons.
27. Three-quarters of principals agreed that they liked to employ graduate teachers, often citing their desirable
personal attributes such as enthusiasm, energy, passion for teaching and willingness to learn. In survey free
text responses, principals indicated that employing graduates was their professional responsibility to help
build the next generation of teachers.
28. According to principals, schools were attractive to new graduates when they offered better location and
accessibility, reputation for performance or use of technologies, newer facilities, and partnership
arrangements with universities.
29. More than 82 per cent principals planned to keep some or all of their graduate teachers. Less than 11 per cent
stated that they would not wish to continue to employ them.
30. Most new graduates who were teaching remained committed to their career over the next three years
(whether teaching or in a school leadership position) and to remaining in the education sector. The percentage

Longitudinal Teacher Education and Workforce Study (LTEWS) Final Report
18
who saw themselves as a teacher in a school in three years’ time decreased from 71 per cent to 64 per cent
during the data collection period. This is partly accounted for by the number of these teachers who intended
to seek school leadership positions (an increase from 10 to 14 per cent). Very few (7 per cent) planned to
leave the education sector altogether during that time.
30.1. Slightly fewer graduates with masters or graduate diploma qualifications saw themselves
teaching in three years’ time and a higher percentage with masters degrees saw themselves in an
education policy or research position in the future.
30.2. Secondary teacher graduates saw themselves as less likely to be teaching in three years’ time and
more likely to be in leadership positions, when compared to early childhood or primary teachers.
30.3. The greatest influence on plans for the future was whether or not graduates had a teaching
position during the time of the survey. Graduates who had a teaching position were more likely
to see themselves teaching in three years’ time than graduates without a teaching position. This
was evident for all three rounds.
31. Employment outside teaching rose significantly in the first year after graduation. In particular, the data show
that graduates with masters degrees taking employment outside teaching almost doubled over this period
(from 32 to 61 per cent).
Thus, the Longitudinal Teacher Education Workforce Study (LTEWS) provides a comprehensive picture of graduate
teachers’ and principals’ perceptions on the relevance and quality of teacher education, and also graduates’
employment as new teachers and their career progression during the first year and a half after graduation.
Considerations for improving teacher education can be drawn in relation to: selection into teacher education;
length and level of the qualification; content, foci and features of effective programs; and, effective practicum,
internships, and partnerships. Consistent with the LTEWS brief to also investigate beginning teaching and career
progression, the findings highlight a continuum of learning to teach involving pre-service teacher education,
induction into the profession and then ongoing professional learning and development. This underpins the
importance of teacher education providers, regulatory authorities and employers working together in relation to
supply and demand issues as well as in determining specific knowledge and skills for highly effective beginning
teaching that provides a foundation for ongoing learning and professional growth. Further longitudinal large-scale
mixed-methods research building on LTEWS methodologies and findings and incorporating the Productivity
Commission (2012) recommendations will contribute in a valuable and ongoing way to our collective knowledge
base on effective teacher education and transition into the profession.

Longitudinal Teacher Education and Workforce Study (LTEWS) Final Report
19
1. Introduction
Teacher education quality has become a hallmark of education reforms in many countries around the world
(Schleicher, 2011). The Global Education Reform Movement (Sahlberg, 2011) recognizes a key role of teachers in
improving outcomes for children and young people in the increasingly competitive and globalized world. The
reforms seek to create world-class education systems in which the quality of student learning would essentially
rest on the quality of teachers. Recognizing the relationship between teaching quality and learning excellence,
teacher preparation and its effectiveness have received an unprecedented attention both from policy-makers and
educational researchers in the last two decades (Darling-Hammond & Bransford, 2005). In particular, policy-
makers have concentrated on policy settings in order to improve the preparation of graduate teachers, as well as
increasing the productivity of the existing teaching workforce and its participation in educational reforms
(Schleicher, 2011). Educational researchers, in their turn, have focused on how teachers learn and develop and on
how effectively education programs can enable teachers to acquire the professional knowledge, skills and
dispositions that allow them to succeed.
As a result of the cooperation between policy-makers and educational researchers, numerous international reports
on teacher education and effective teaching practices have been published (Organization for Economic
Cooperation & Development (OECD), 2005, 2009). Other reports and reviews have covered various aspects of
teacher preparation programs and their effects on the quality of the teaching workforce (D. Boyd, Grossman,
Lankford, Loeb, & Wyckoff, 2006; Cochran-Smith & Zeichner, 2005; Darling-Hammond et al., 2005; Grossman, 2005;
Wilson, Floden, & Ferrini-Mundy, 2001). This international research has provided some answers to the pressing
questions about initial teacher education, examining relationships between teacher attributes and student
outcomes (D. Boyd, Lankford, Loeb, Rockoff, & Wyckoff, 2008; Darling-Hammond, 2009; Rivkin & Hanushek, 2005).
This type of inquiry has also revealed that it is not possible to investigate issues about the value and effectiveness
of teacher preparation without conceptualising it within a ‘learning to teach’ continuum and the prospect of
ongoing professional growth. For example, the longitudinal study by Brouwer and Korthagen (2005) demonstrated
that variables relating to school context had a larger impact on the formation of new teachers than the program
effects. In the UK, the Becoming a Teacher (BaT) study (Hobson et al., 2009), a six-year longitudinal research
project (2003-2009), similarly found the crucial importance of the school context with respect to the graduates’
capacity to engage in ongoing professional learning.
In this regard, international research into teacher education has demonstrated that there is no clear consensus on
how best to prepare graduate teachers for work. It appears that the determinants of teacher quality should be
perceived relationally. That is, the effectiveness of beginning teachers should be linked to their employment
conditions and teacher preparation should be connected to other determinants of teaching quality such as
improved recruitment and incentive structures, making teaching a more attractive profession, better in-service
teacher development and career progression (Schleicher, 2011). From this perspective, the quality of teaching is
considered as the relationship between teacher education and teacher productivity or as a nexus between the
teacher experiences of professional learning and the conditions of their work in schools.
Reflecting international debates about the utility of teacher education, the quality of initial teacher preparation in
Australia is a matter of ongoing concern. There have been more than 100 government inquiries of various types
into teacher education since 1979 (e.g. Caldwell & Sutton, 2010; Education and Training Committee, 2005; House
of Representatives Standing Committee on Education and Vocational Training, 2007; Productivity Commission,
2012; Ramsey, 2000). More than 400 teacher education programs are currently offered across Australia,

Longitudinal Teacher Education and Workforce Study (LTEWS) Final Report
20
graduating about 17,000 teachers each year. Eighty-one per cent of all the programs are offered in public
universities. Recently, some private institutions as well as some state funded institutions of further education have
been accredited to offer teacher preparation – often in early childhood education. Teachers are prepared in
multiple study pathways including: (i) four-year undergraduate Bachelor of Education degrees, (ii) four-year double
degrees comprising a degree in the subject discipline area and a degree in education, and (iii) one-year Graduate
Diploma in Education or two-year Master of Teaching degrees after an initial three-year bachelor’s degree in a
discipline other than education. From 2013, all graduate teacher education programs must be two years in length
in order to be accredited (Australian Institute of Teaching and School Leadership, 2011a). Most pre-service
teachers are ‘Commonwealth supported’ under the Higher Education Contribution Scheme (HECS).
Initial teacher education programs aim to prepare teachers with the knowledge and skills to begin teaching in
today’s rapidly changing contexts. The Organisation for Economic Co-operation and Development Report (OECD),
Preparing Teachers and Developing Leaders, highlights what it takes to be teacher:
… the kind of education needed today requires teachers to be high-level knowledge workers
who constantly advance their own professional knowledge as well as that of their profession.
Teachers need to be agents of innovation not least because innovation is critically important for
generating new sources of growth through improved efficiency and productivity. This is also true
in the education sector, where innovation applied to both curricula and teaching methods can
help to improve learning outcomes and prepare students for the rapidly changing demands of
the 21st-century labour market. (Schleicher 2012, p.36)
In the pursuit of a high quality teaching workforce, teacher education has been the subject of changing state and
federal policy reforms. The Australian Government’s Smarter Schools – Improving Teacher Quality National
Partnership (TQNP) program provided $550 million over five years to drive a broad range of agendas designed to
improve the quality of teaching and teacher education, including:
attracting the best graduates to teaching through additional pathways into teaching;
improving the quality and consistency of teacher training in partnership with universities;
developing the Australian Professional Standards for Teachers to promote excellence in the profession,
including requirements for teachers to have knowledge and understanding of the learning needs of
Indigenous students;
national consistency in the registration of teachers to support improved mobility in the teaching
workforce;
developing and enhancing the skills and knowledge of teachers and school leaders through improved
performance management and professional learning;
increasing retention through improved in-school support and rewarding quality teachers and school
leaders in rural/remote and hard-to-staff schools; and,
improving the quality and availability of teacher workforce data.
The TQNP reform agenda has so far resulted in the introduction of alternative or employment based pathways into
teaching such as Teach for Australia and Teach Next, and the establishment School Centres for Teaching Excellence
(SCTE). In addition, the Australian Institute for Teaching and School Leadership (AITSL) has been established as a
national agency with responsibility for developing and implementing Australian Professional Standards for
Teachers (Australian Institute of Teaching and School Leadership, 2011c) and principals (Australian Institute of
Teaching and School Leadership, 2011b), and for regulating national accreditation of teacher education programs
and teacher registration (Australian Institute of Teaching and School Leadership, 2011a).
Longitudinal Teacher Education and Workforce Study (LTEWS) Final Report
21
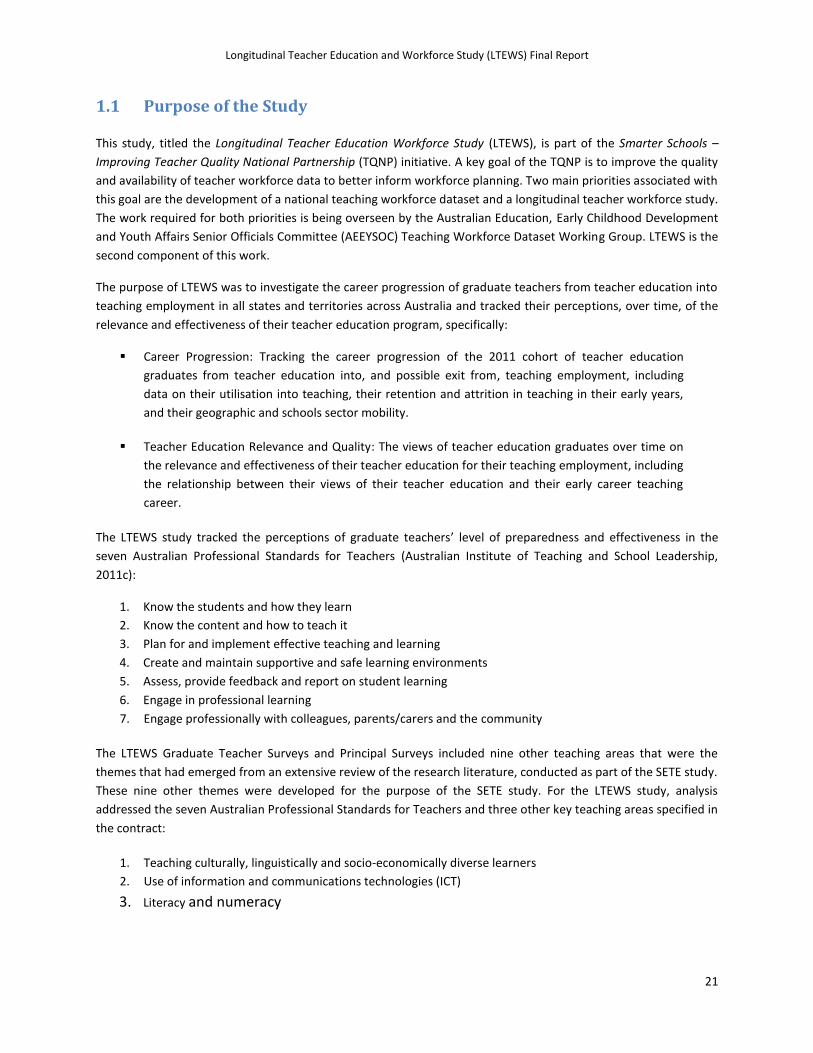
1.1 Purpose of the Study
This study, titled the Longitudinal Teacher Education Workforce Study (LTEWS), is part of the Smarter Schools –
Improving Teacher Quality National Partnership (TQNP) initiative. A key goal of the TQNP is to improve the quality
and availability of teacher workforce data to better inform workforce planning. Two main priorities associated with
this goal are the development of a national teaching workforce dataset and a longitudinal teacher workforce study.
The work required for both priorities is being overseen by the Australian Education, Early Childhood Development
and Youth Affairs Senior Officials Committee (AEEYSOC) Teaching Workforce Dataset Working Group. LTEWS is the
second component of this work.
The purpose of LTEWS was to investigate the career progression of graduate teachers from teacher education into
teaching employment in all states and territories across Australia and tracked their perceptions, over time, of the
relevance and effectiveness of their teacher education program, specifically:
Career Progression: Tracking the career progression of the 2011 cohort of teacher education
graduates from teacher education into, and possible exit from, teaching employment, including
data on their utilisation into teaching, their retention and attrition in teaching in their early years,
and their geographic and schools sector mobility.
Teacher Education Relevance and Quality: The views of teacher education graduates over time on
the relevance and effectiveness of their teacher education for their teaching employment, including
the relationship between their views of their teacher education and their early career teaching
career.
The LTEWS study tracked the perceptions of graduate teachers’ level of preparedness and effectiveness in the
seven Australian Professional Standards for Teachers (Australian Institute of Teaching and School Leadership,
2011c):
1. Know the students and how they learn
2. Know the content and how to teach it
3. Plan for and implement effective teaching and learning
4. Create and maintain supportive and safe learning environments
5. Assess, provide feedback and report on student learning
6. Engage in professional learning
7. Engage professionally with colleagues, parents/carers and the community
The LTEWS Graduate Teacher Surveys and Principal Surveys included nine other teaching areas that were the
themes that had emerged from an extensive review of the research literature, conducted as part of the SETE study.
These nine other themes were developed for the purpose of the SETE study. For the LTEWS study, analysis
addressed the seven Australian Professional Standards for Teachers and three other key teaching areas specified in
the contract:
1. Teaching culturally, linguistically and socio-economically diverse learners
2. Use of information and communications technologies (ICT)
3. Literacy and numeracy
Longitudinal Teacher Education and Workforce Study (LTEWS) Final Report
22
The structure of the surveys recognises the central role of standards in defining what teachers are expected to
know and be able to do upon graduation. The perceptions of graduate teachers and principals have provided a
comprehensive picture of the effectiveness of teacher preparation programs. The longitudinal aspect of the
surveys has offered a perspective on the process of becoming a professional, as teachers transition from the in-
service education to work. From the point of view of transition, teacher preparedness becomes tantamount to
their employability and/or suitability for work in particular contexts. Graduate teacher effectiveness, from the
longitudinal perspective, can be perceived as their progressive orientation towards quality teaching – a form of
practice that is based on professional knowledge and skills, and constructed from a set of attributes, such as traits,
behaviours, abilities or dispositions viewed as relevant to their work in diverse schools.
1.2 Structure of the Main Report
Chapter 2, Methodology reports the research focus of this study and the mixed method design, process, data
collection and analysis of the graduate teacher and principal surveys, the mapping of teacher education programs
and the graduate teacher interviews. The mapping of Initial Teacher Education Programs provides a point-in-time
review of the initial teacher education programs across Australia as relevant for the 2011 graduate cohort of this
study.
Chapter 3 presents findings related to the early career progression of graduate teachers who completed their
teacher education programs in 2011. Career progression in this study refers to the entry into teacher education
and possible exit from, teaching employment, including data on the utilisation of graduate teachers, their
retention and attrition in the early years of teaching, and their geographic and schools sector mobility.
Incorporated into this chapter of the report are survey data on early career progression, including employment,
mobility and retention, with complementary qualitative data from the free text responses and the telephone
follow-up interviews. Three rounds of surveys provide data to explore teacher early career pathways and
progression. The data is analysed in two ways: firstly as three separate snapshots over the period March 2012 to
March 2013; and, secondly from a longitudinal perspective on graduate teachers who were followed across this
time period. The findings are also informed by the interview data collected between May 2012 and May 2013 after
each survey round.
Chapter 4 reports findings on the relevance and effectiveness of teacher education. It situates itself within the
context of ever-changing demands relating to the knowledge and skills of teachers that signals the need to
continually review teacher education programs in order to show evidence that programs and procedures are
effective and that they stay relevant to current and future needs. The chapter examines the nature of teacher
education programs and the influence of the program structures and approaches on graduates’ career retention
and advancement in the teaching profession. It begins by discussing the impact of teacher education programs on
graduates’ decisions whether or not to seek teaching employment. This analysis is followed by the investigation of
program structures, approaches and content considered by graduates and principals as being effective in preparing
teachers for initial employment. These findings are cross-examined with the findings of the initial teacher
education mapping in order to develop a sense of how the views of the three groups – graduate teachers,
principals, teacher educators – correspond with respect to the purpose of initial teacher education. The chapter
proceeds with the detailed discussion of the influence of the teacher education programs on graduates’ career
retention and advancement. This is done through the examination of the type and measures of entry into teacher
education programs and their influence on the graduate career pathway, the relevance and effectiveness of the
practicum component, disciplines studied in teacher education programs and taught in schools, and preparation to
teach culturally, linguistically and socially diverse learners, ICT and numeracy and literacy.

Longitudinal Teacher Education and Workforce Study (LTEWS) Final Report
23
Chapter 5 provides a summary of the findings discussed in the main report and draws implications for policy and
further research. It discusses the broad relevance of findings for teacher education reforms in Australia.
This main report is supported by an Appendices document which includes the Mapping of Initial Teacher Education
Programs in Australia in 2011 report, the Graduate Teacher Survey instruments (Rounds 1, 2 and 3), the Principal
Survey instruments (Rounds 1, 2 and 3), the teacher interview protocols (Rounds 1, 2 and 3), as well as standard
error – margin of error information and information on the analysis of the data including factor analyses on the
attraction to teaching scale and the preparation scale.

Longitudinal Teacher Education and Workforce Study (LTEWS) Final Report
24
2. Methodology
LTEWS built on the existing SETE research framework to track 2011 teacher education graduates through a series
of three surveys and follow-up telephone interviews over an eighteen-month period (early 2012 to mid-2013),
generating data relating to employment of newly-graduated teachers, career trajectories and aspirations, and the
impact of initial teacher education on their preparation to teach across key areas. A mapping of initial teacher
education programs was also conducted and completed to provide a point-in-time overview of initial teacher
education in Australia as relevant for the 2011 graduates.
2.1 Research Focus
The two main research foci of LTEWS were:
i. The career progression of teacher education graduates from teacher education into, and possible
exit from, teaching employment, including data on their utilisation into teaching, their retention
and attrition in teaching in their early years, and their geographic and schools sector mobility.
ii. The views of teacher education graduates over time on the relevance and effectiveness of their
teacher education for their teaching employment, including the relationship between their views of
their teacher education and their early career teaching career.
These dimensions overlap:
i. Career progression encompasses the retention or attrition of early career teachers, as well as their
geographic and school sector mobility within the profession. The data generated in this study
provide a complex picture of the various ways in which graduate teachers negotiate the career
pathways available to them within the education sector.
ii. Relevance and effectiveness of teacher education is both an international as well as a national
concern. LTEWS undertakes a national study of all initial teacher education programs, and cross-
reference this information with graduate teachers’ opinions on their preparation for teaching. This
data provides the groundwork for an analysis of the relevance and effectiveness of the teacher
education programs currently on offer in Australia.’
The study is significant to the national and international policy and practice contexts of education. The overlap of
career progression into teaching and the relevance and effectiveness of teacher education is found in recent policy
attention aimed at improving teaching and teaching workforces (e.g. Caldwell & Sutton, 2010; Darling-Hammond,
2013; Organisation for Economic Co-operation and Development (OECD), 2013).
2.2 Research Design
Methodologically, LTEWS featured the interplay between large‐scale quantitative data collection methods and
small-scale qualitative interviews. Mixed methods research is typically used to broaden understanding by
incorporating both qualitative and quantitative research, ‘or to use one approach to better understand, explain, or
build on the results from the other approach’ (Creswell, 2009, p.204). By utilising this mixed-methods approach, a
deeper understanding was constructed of early career teachers’ movements into, through, and possibly out of the
teaching workforce, and how this experience is linked to their pre-service teacher education programs.

Longitudinal Teacher Education and Workforce Study (LTEWS) Final Report
25
The main target population was new teacher education graduates from higher education institutions in all states
and territories in Australia in 2011. The secondary target population was the school principals in those schools
where the graduate teachers were employed. The project followed the graduate teachers at three time-points
from time of graduation and into their second year of teaching. There were three rounds of surveys of the
graduate teachers, three rounds of surveys of their school principals, and three rounds of teacher interviews with a
small sample of graduate teachers who responded to the teacher surveys.
The study employed an iterative strategy with Round 1 survey instruments and telephone interviews informing
Round 2 survey instruments, and so on. Each of the quantitative and qualitative components of the study
produced stand-alone findings, but the quantitative survey data and its analysis formed the primary data for the
study, with the interviews and the mapping informing and/or expanding on these findings.
The data collection process is shown in Figure 1 and specified further below.
Figure 1. LTEWS data collection process
Round 1
Graduate Teachers o March 2012: First survey with 2011 teacher education graduates o May 2012: First series of follow-up telephone interviews with selected respondents
Principals o May 2012: First survey of principals of 2011 teacher education graduates who responded to the
March 2012 survey
Round 2
Graduate Teachers o October 2012: Second survey with graduate teachers o December 2012: Second series of follow-up telephone interviews with selected respondents
Principals o November 2012: Second survey of principals of graduate teachers who responded to the October
2012 survey
Round 3
Graduate Teachers o March 2013: Third survey with graduate teachers

Longitudinal Teacher Education and Workforce Study (LTEWS) Final Report
26
o May 2013: Third series of follow-up telephone interviews with selected respondents Principals
o May 2013: Third survey of principals of graduate teachers who responded to the March 2013 survey
A national mapping of initial teacher education programs across all tertiary institutions in Australia was also
conducted. The findings of the LTEWS mapping was also used in the analysis of the teacher and principal survey
responses and telephone interviews with graduate teachers and referred to in various sections of the findings in
this report. Key data from this mapping were used to cross-tabulate with survey data. These data included length
of the teacher education program, the number of practicum days in each program, the distinguishing features of
programs (features of their teacher education program that set them apart from other programs), and whether
preparation in key areas1 of teaching was undertaken as part of stand-alone or embedded units in the teacher
education program.
The LTEWS study is the first national data set on the career progression of Australian graduate teachers from initial
teacher education to be compiled. As noted in the conclusion to this report LTEWS is only a beginning response to
these issues.
The multiple components of the study can be seen in the project timeline at Appendix 12. Even though aiming to
be longitudinal, the project contract meant that the graduates were only followed for a little over one year after
graduation. Full details of the data sources, survey instruments and explanations of the data sources, reliability
and validity of these data are detailed in the appendices to the main report. These detailed appendices provide the
lens to the data quality generated over the course of the study.
Statistics computed on the LTEWS survey responses provide accurate accounts of the respondents to which they
refer. But they can only provide estimates of what the summary statistics would be if data could be gathered from
the whole population. These estimates can never be perfectly precise, and the degree of imprecision they contain
is captured by a statistic known as the standard error.
Appendix 11, provides the standard error – margin of error information and reliability of estimates. As noted the
standard errors shown in Table 1: Standard error calculations, to one standard deviation are calculated for seven
different proportions – from 50 down to five per cent.
The standard errors calculated show these proportions for varying total responses in the survey, from ten to 2,760.
The standard error is not identical from one measure to another. It is known, however, that the variation from
measure to measure, in percentages, is typically quite small.
The greatest contributor to standard errors is the sample size. Small sample sizes result in high standard errors
and wide confidence intervals. Readers of the LTEWS report must consider sample size when interpreting the data.
This is particularly important when looking at data using demographic characteristics (i.e. teachers, schools, ITE
programs) as a filter.
2.2.1 Graduate Teacher Surveys and Principal Surveys
The graduate teacher survey was designed to collect graduate teachers’ perception of their preparation for
teaching and their early career experiences over time. The target population for the Graduate Teacher Survey was
1 Discipline knowledge, teaching culturally, linguistically and socio-economically diverse learners, ICT, numeracy, literacy,
assessment, pedagogy, curriculum, classroom management
Longitudinal Teacher Education and Workforce Study (LTEWS) Final Report
27
all teachers who had graduated from an initial teacher education program in 2011, and included those who had
registered with a state/territory teacher regulatory authority and those who had chosen not to. In order to reach
both groups of graduates it was necessary to utilise two different approaches. Registered teachers were contacted
through the teacher regulatory authorities in each jurisdiction to invite them to participate in the survey. In order
to capture participants who had not registered with a teacher regulatory authority, higher education institutions
with teacher education programs were approached to inform potential participants of the study through alumni
networks.
All teacher regulatory authorities agreed to send emails to 2011 graduate teachers inviting them to participate in
the survey. For Rounds 2 and 3 graduate teacher surveys, higher education institutions with teacher education
programs were approached to publicise the graduate teacher survey through their alumni networks. This was to
capture those graduates who did not register with any state/territory registration authorities. The Study of the
Effectiveness of Teacher Education (SETE) project already had Victorian and Queensland teacher regulatory
authorities working closely with the researchers, so the LTEWS project needed to approach the remaining six
teacher regulatory authorities across Australia.
The principal survey was designed to collect principals’ perceptions on the preparedness and effectiveness of their
graduate teachers, the types of induction and support offered to them in schools, and the challenges they
perceived that the new teachers faced. The target population for the Principal Survey was principals of schools
who employed 2011 graduate teachers who had responded to the teacher survey. Thus, the total number of
principals asked to participate in the Principal Survey was dependent on the number of responses to the graduate
teacher survey.
Survey development
The graduate teacher and principal surveys had already been developed for the SETE study. They were modified
slightly for LTEWS and then implemented in all jurisdictions around Australia. Subsequent surveys were developed
in response to data gathered from earlier rounds.
National and international survey instruments informed question construction in the surveys. These included:
Australian Council for Educational Research Staff in Australia's Schools teacher questionnaire 2007 and
2010 (McKenzie, Kos, Walker, Hong, & Owen, 2008; McKenzie et al., 2011);
Australian Education Union new educators survey 2008 (Australian Education Union, 2009)
Victorian Institute of Teaching Future Teachers Project (Survey instrument) (Ingvarson, Beavis, &
Kleinhenz, 2004);
Australia Government, Department of Education, Science and Training (DEST) survey of final year teacher
education students: 2006
Australian Graduate Survey
(http://www.graduatecareers.com.au/research/surveys/australiangraduatesurvey/
Teaching Australia – Study of the effectiveness of teacher education: 2008-2010 (Louden, Heldsinger,
House, Humphry, & Darryl Fitzgerald, 2010); and,
Teacher Pathways Project (Survey instruments) (D. J. Boyd et al., 2006).

Longitudinal Teacher Education and Workforce Study (LTEWS) Final Report
28
Drawing on the surveys listed above and informed by relevant research literature, survey items and free text
questions about effectiveness and preparedness were framed around the over-arching themes of curriculum,
pedagogy, assessment, behaviour management, engagement with school stakeholders and local community,
professional ethics, ongoing professional learning, relationships with students, and catering for diverse learners.
The survey of the school principals collected descriptive data on the school, its students and community, and data
on the responsibilities of the early career teacher. Likert-scale questions were asked of principals’ perceptions of
beginning teacher performance across the themes identified above. The survey data from principals was merged
with that of their graduate teachers to complete analyses using school characteristics and teacher performances as
variables in the research.
Each subsequent teacher and principal survey had the advantage of being informed by the data from the
immediately preceding surveys, and from the telephone interviews. These data were used to refine survey
questions and to develop new ones that enabled the exploration of beginning teacher experiences as their time in
the workforce progressed. Although there was some variation in the questions asked in each survey, a number of
key questions were constant to enable analysis of trends longitudinally.
See Appendices 2–4 for the Graduate Teacher Survey questions in Rounds 1 to 3 and Appendices 5–7 for the
Principal Survey questions in Rounds 1 to 3.
The study sample
The main target population was teachers who graduated in 2011 from higher education institutions in all states
and territories in Australia. The secondary target population was the school principals in those schools where the
graduate teachers were employed.
The Department of Industry, Innovation, Science, Research and Tertiary Education (DIIRSTE) award course
completion figures for 2011 show that 28,069 students completed a program in the field of education in that year.
This figure, however, includes all program levels, from higher doctorate to diploma. Of these 28,069 graduates,
16,533 initial teacher education program completions are recorded (DIISRTE, Award Course Completions 2011,
Table 19)2.
Table 1. Award course completions in initial teacher education – by state/territory, 2011
State/Provider N
New South Wales 5,486
Victoria 3,602
Queensland 2,542
Western Australia 1,666
South Australia 1,116
Tasmania 225
Northern Territory 398
2
http://www.innovation.gov.au/HigherEducation/HigherEducationStatistics/StatisticsPublications/Pages/default.aspx. Accessed June 2012.

Longitudinal Teacher Education and Workforce Study (LTEWS) Final Report
29
Australian Capital Territory 277
Multi-state 1,221
Total Australia 16,533
Permission to conduct research in schools was sought and given from education departments in each jurisdiction.
Permission to conduct research in schools in Catholic dioceses was obtained from all Catholic education offices
except two. Another Catholic education office gave permission under the provision that the report would not
contain any analysis of data across school sectors.
Responses from teacher surveys were not weighted. There was insufficient publicly available data on the
characteristics of the population to enable weighting to be calculated.
Response rates
Response rates were calculated on the state or territory of respondents’ teacher education program. It was
necessary to calculate the response rate this way as the survey was open to graduates who had registered as a
teacher with a state/territory registration authority, and also those who had not registered. The majority of
responses were from graduates who had teacher registration. The response rates per jurisdiction, and overall is
shown in Table 2 below.
Table 2. LTEWS graduate teacher survey response
Round 1 Round 2 Round 3
State/Territory 2011
graduates/state No.
responding Response
rate No.
responding Response
rate No.
responding Response
rate
NSW 5,486 306 5.6 461 8.4 409 7.5
VIC1 3,602 384 10.7 649 18.0 626 17.4
QLD1 2,542 317 12.5 420 16.5 436 17.2
SA 1,116 46 4.1 67 4.0 94 5.6
WA 1,666 149 8.9 187 16.8 113 10.1
TAS 225 30 13.3 30 13.3 43 19.1
NT 398 28 7.0 49 12.3 112 28.1
ACT 277 11 4.0 69 24.9 55 19.9
Multi-state 1,221 63 5.2 131 10.7 111 9.1
Other2 41 702 249
TOTAL 16,533 1,375 8.3 2,765 16.7 2248 13.6 NOTE: 1. The number of responses to the three surveys was dependent on the number of invitations to participate in the
survey, sent by teacher regulatory authorities in each jurisdiction, to 2011 graduates only. The accuracy of the
response rate is dependent on the accuracy of their 2011 graduate lists.
2. ‘Other’ includes respondents who completed a teacher education program outside Australia or did not indicate an
institution.
The longitudinal analysis involved three groups of respondents to the LTEWS surveys. The first group consists of
those who responded to Rounds 1 and 2 of the graduate teacher surveys. Throughout the report, this group is
referred to as Cohort 1. The second group consists of those who responded to Rounds 2 and 3 graduate teacher
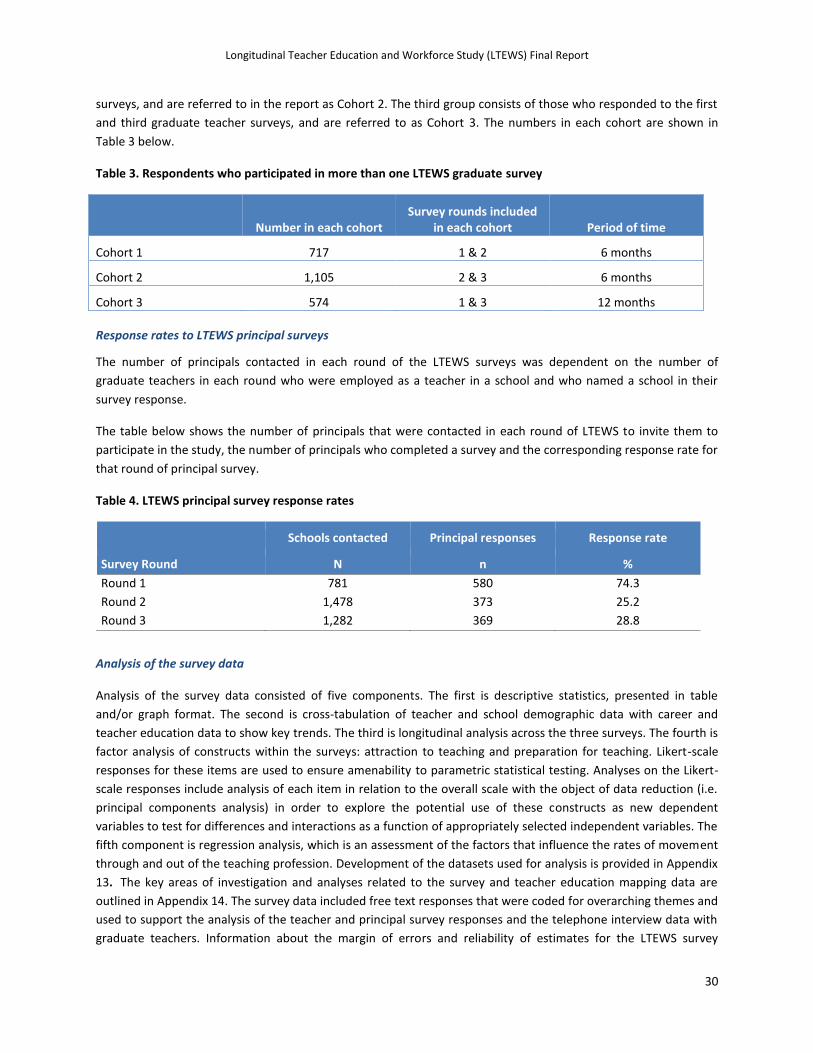
Longitudinal Teacher Education and Workforce Study (LTEWS) Final Report
30
surveys, and are referred to in the report as Cohort 2. The third group consists of those who responded to the first
and third graduate teacher surveys, and are referred to as Cohort 3. The numbers in each cohort are shown in
Table 3 below.
Table 3. Respondents who participated in more than one LTEWS graduate survey
Number in each cohort Survey rounds included
in each cohort Period of time
Cohort 1 717 1 & 2 6 months
Cohort 2 1,105 2 & 3 6 months
Cohort 3 574 1 & 3 12 months
Response rates to LTEWS principal surveys
The number of principals contacted in each round of the LTEWS surveys was dependent on the number of
graduate teachers in each round who were employed as a teacher in a school and who named a school in their
survey response.
The table below shows the number of principals that were contacted in each round of LTEWS to invite them to
participate in the study, the number of principals who completed a survey and the corresponding response rate for
that round of principal survey.
Table 4. LTEWS principal survey response rates
Schools contacted Principal responses Response rate
Survey Round N n %
Round 1 781 580 74.3
Round 2 1,478 373 25.2
Round 3 1,282 369 28.8
Analysis of the survey data
Analysis of the survey data consisted of five components. The first is descriptive statistics, presented in table
and/or graph format. The second is cross-tabulation of teacher and school demographic data with career and
teacher education data to show key trends. The third is longitudinal analysis across the three surveys. The fourth is
factor analysis of constructs within the surveys: attraction to teaching and preparation for teaching. Likert-scale
responses for these items are used to ensure amenability to parametric statistical testing. Analyses on the Likert-
scale responses include analysis of each item in relation to the overall scale with the object of data reduction (i.e.
principal components analysis) in order to explore the potential use of these constructs as new dependent
variables to test for differences and interactions as a function of appropriately selected independent variables. The
fifth component is regression analysis, which is an assessment of the factors that influence the rates of movement
through and out of the teaching profession. Development of the datasets used for analysis is provided in Appendix
13. The key areas of investigation and analyses related to the survey and teacher education mapping data are
outlined in Appendix 14. The survey data included free text responses that were coded for overarching themes and
used to support the analysis of the teacher and principal survey responses and the telephone interview data with
graduate teachers. Information about the margin of errors and reliability of estimates for the LTEWS survey
Longitudinal Teacher Education and Workforce Study (LTEWS) Final Report
31
responses are at Appendix 11. The greatest contributor to standard error is the sample size. It is particularly
important to consider sample size when interpreting data using demographic characteristics as a filter.
Survey data limitations
Response rates to the Graduate Teacher Surveys ranged between 8.3 per cent and 16.7 per cent as a proportion of
the relevant national initial teacher education award course completion data (Department of Industry, Innovation,
Science, Research and Tertiary Education, 2011) while the proportion of graduates who participated across all
three survey rounds was less. Across the rounds, between 87 and 91 per cent of the returned surveys were
completed and were able to be used in the analysis.
The distribution of survey respondents (e.g. based on demographic characteristics) compares well with data from
other existing collections which include teacher graduates. An indication of sample representativeness is provided
by comparing the distribution of the LTEWS cohorts to existing collections including higher education statistics
from the former Department of Industry, Innovation, Science, Research and Tertiary Education (2011), the Staff in
Australia’s Schools (SiAS) survey 2010 (McKenzie, Rowley, Weldon, & Murphy, 2011) and Australian Bureau of
Statistics Census (2011a) and Australian Bureau of Statistics, Schools Australia (2011b). Further, standard errors,
which provide a measure of how accurately survey responses represent the whole population, have been provided
to assist the interpretation of individual survey estimates.
The survey results report response frequencies alongside valid percentages to enable the reader to consider
margins of error when interpreting the data. Concerns about data quality are few in number and are highlighted in
the relevant sections to ensure that these findings are read with caution. Specifically, where participant
demographics such as school location were used as a filter for analyses, consideration must be given to standard
error (see Appendix 11).
Box 1 on p.38 provides a summary profile of the graduate teacher respondent cohort. However, particular aspects
of the data in relation to the respondent group which should be considered when interpreting the analysis of
findings. Teacher graduate response varies across states and territories. NSW and SA response is under-
represented while Victoria and Queensland response is over–represented (see Table 9) reflecting the inclusion of
findings from the Study of the Effectiveness of Teacher Education (SETE) in Victoria and Queensland.
2.2.2 Mapping of Initial Teacher Education Programs in Australia, 2011
One component of the LTEWS project was a point-in-time review of initial teacher education programs in Australia
between late 2011 and early 2012. These are the programs of most relevance for the graduating teacher cohort
being tracked for LTEWS. The data was collected first by desktop analysis of the undergraduate and postgraduate
teacher education programs accredited by the relevant teacher regulatory authority. Data was then verified with
the providers, and telephone interviews were conducted with personnel from each provider. A total of 551
programs from 47 providers across Australia that enable graduate teachers to apply for teacher registration in
the relevant state or territory, were mapped (See Appendix 1: Attachment C for list of providers).
The mapping collected data on:
i. Teacher education structures
length, structure, content and delivery of institution or campus programs length, structure and diversity of teaching practice incorporated into teacher preparation
programs

Longitudinal Teacher Education and Workforce Study (LTEWS) Final Report
32
practicum and linkages with schools
ii. Teacher education approaches
the focus on disciplined-based expertise the focus on developing discipline-based expertise preparation to teach culturally, linguistically, socio-economically diverse learners; ICT; and literacy and numeracy the development of pedagogical and assessment expertise
iii. Measures of entry into the teacher preparation programs
In addition to providing a point-in-time overview of initial teacher education across Australia, the main purpose of
the LTEWS mapping data was in the analysis of the Graduate Teacher and Principal Survey responses and follow-up
telephone interviews with graduate teachers. A separate and final report for the Mapping of Initial Teacher
Education Programs in Australia in 2011 is available in Appendix 1, but for completeness in this report, a brief
overview of this component of the project is included here.
Design of the mapping of initial teacher education programs
The teacher education graduates followed for the LTEWS study graduated from accredited teacher preparation
programs at the end of 2011. Therefore, the initial teacher education mapping examined initial teacher education
programs listed on Australian teacher education provider websites between October 2011 and March 2012,
these being the programs most relevant for the target population.
The mapping was conducted in phases. During the first phase, publicly available online information was accessed
to examine undergraduate and postgraduate teacher education programs across Australia that were recognised as
accredited teacher preparation programs by the relevant teacher regulatory authority. For this desktop mapping,
information was accessed from the websites of the teacher regulatory authorities, the tertiary admissions centres,
and the teacher education providers.
The second phase involved verification of the program data collected as part of the desktop research in the first
phase. Each teacher educator provider was sent the collated information about their programs and asked to verify
it. In addition, telephone interviews were conducted with teacher education personnel from each provider
between March and July 2012. The questions asked in these telephone interviews are provided in Appendix 1:
Attachment A. Participation in the verification process was by invitation and voluntary. Even though multiple
requests were sent, not all providers responded in full during this verification process.
The following characteristics and dimensions of the initial teacher education programs were sourced and collated
during the desktop mapping and sent to each teacher education provider for verification.
Provider and campus Program title Duration (FTE years) Availability of accelerated mode
Availability of intensives Scope Enrolment options (part-time, full-time, off-campus) Fee type Entry requirements
o Undergraduate/graduate entry o Australian Tertiary Admissions Rank (Y/N)

Longitudinal Teacher Education and Workforce Study (LTEWS) Final Report
33
o IELTS requirement (Y/N) o Additional requirements and program pre-requisites
Professional experience o Overview of professional experience program o Number of observation days o Number of days of supervised practicum in schools o Number of days in community o Organisation of practicum (1 to 2 days a week, blocks, internships) o Practicum offered in first year (Y/N/NA)
Subject specialisations offered Intake cycles Program overview Additional comments
The third and last phase of the initial teacher education mapping between August 2012 - January 2013 involved
cross-checking, consolidation and further verification as needed, and then final analysis and reporting. It must be
noted however that initial teacher education programs are continually being reviewed and updated by providers
as part of their continuous program improvement processes and in response to changing accreditation
requirements. Moreover, new programs are introduced and others discontinued. Thus, the teacher education
picture across Australia is ever-changing, making the task of providing an accurate point-in-time snapshot
somewhat challenging.
Data Collection
Desktop mapping was done for 47 providers of initial teacher education across Australia. Representatives in 44 of
those institutions agreed to review and verify their program data and 45 took part in telephone interviews. More
than one interview was conducted with some providers with multiple campuses when the programs were quite
different on each campus. Table 5 provides an overview.
Table 5. Verification of teacher education program data – by state/territory
*Australian Catholic University has campuses in VIC, NSW, QLD and ACT and is only counted once for the total. The matrix was verified for all campuses but only the VIC campus was counted. The interview was conducted with the ACU (VIC) campus. # The University of Notre Dame has campuses in WA and NSW but is only counted once in the total. The matrix was
State/ Territory Teacher education
providers
Interviews conducted Verified matrixes
received
Tasmania 1 1 1
South Australia 4 4 4
Northern Territory 1 0 1
Victoria* 11 11 11
Western Australia # 5 5 5
New South Wales *# 16 14 14
Australian Capital Territory*
2 1 1
Queensland* 10 9 7
Total 47 45 44

Longitudinal Teacher Education and Workforce Study (LTEWS) Final Report
34
verified for the WA campus. The interview was conducted with the WA campus. Southern Cross University has campuses in NSW and QLD but is also counted once, with matrix verified by and interview conducted with the NSW campus. The UNSW College of Fine Arts and the University of Sydney Conservatorium of Music are not considered separate providers.
Profile of initial teacher education 2011
The following tables show accredited initial teacher education programs by program type as listed by teacher
regulatory authorities and teacher education providers. At the time of this mapping, there were 551 initial
teacher education programs offered by 47 providers across 103 campuses. The list of teacher education
providers can be found in Appendix 1.
As Table 6 shows, the majority of programs were offered at the bachelor’s degree level, followed by graduate
diploma and masters. Though the teacher regulatory authorities list only 443 accredited programs, these were
delivered in flexible ways and, at the provider level, the various delivery options were commonly listed as
separate programs.
Table 6. Initial teacher education programs – by type
Teacher Regulatory Authorities – listed programs
(n=443)
Provider-listed Programs (n=551)
Bachelor Degree 306 (69%) 397 (72%)
Graduate Diploma/ Postgraduate Diploma
80 (18%) 96 (17%)
Masters Degree 57 (13%) 58 (11%)
Table 7 below shows the programs by type and state. The two states that graduate the largest number of teachers,
New South Wales and Victoria, are also the ones with the largest number of masters degree initial teacher
education programs.
Table 7. Provider-listed initial teacher education programs – by type and state
State/Territory Bachelor Degree
Graduate Diploma/
Postgraduate Diploma
Masters Degree
Total
Tasmania 10 - 6 16
South Australia 31 2 8 41
Northern Territory 31 2 - 33
Victoria 66 30 13 109
Western Australia 40 14 5 59
New South Wales 98 16 18 132
Australian Capital Territory 19 3 2 24
Queensland 103 29 5 137
TOTAL 397* 96 58 551
*Including double degrees and embedded programs that incorporate Diplomas

Longitudinal Teacher Education and Workforce Study (LTEWS) Final Report
35
2.2.3 Telephone Interviews with Graduate Teachers
Follow-up teacher interviews were conducted after each survey round with a sample of graduate teachers. The
aim of the interviews was to track a group of graduate teachers to develop a rich and detailed understanding of
their early teaching experiences at and across three time-points from the time of their graduation into their
second year of teaching.
The graduate teachers from Round 1 were interviewed for the second and third time in January and May 2013
respectively, to learn whether they were still teaching and, if so, their experiences and progress in schools. These
interviews were about an hour long and were conducted by telephone. A major purpose of the interview findings
was to provide an evidence base for triangulation with the graduate teacher survey findings. This data source
triangulation ensures accuracy and alternative explanations to confirm the validity of the methodological process
(Stake, 1995).
The teacher interviews examined:
the graduate teachers’ perceptions about their readiness to teach in classrooms;
the school environment;
the extent to which attributes and features of teacher education prepared them for teaching; and
the graduate teachers’ early career progression in the teaching profession.
The interview protocols for the three rounds are provided in Appendices 8–10: Teacher Interviews Protocol
Rounds 1 to 3. The survey and interviews findings built on each other to inform the design of subsequent interview
questionnaires. The questions ranged from questions about an individual participant’s role and experience in their
school setting, to questions about their level of preparedness, and the successes and challenges they faced at the
particular point-in-time.
Sampling procedure
Strategic and convenience sampling procedures were employed to select the interview participants. Sampling
procedures involved a selection criterion based on their teacher registration jurisdictions, program type, campus
location (e.g. off-campus, metropolitan, outer-metropolitan and regional) and employment type (full-time/part-
time, relief/permanent contracts). Only teachers who had indicated their interest, in the survey rounds, to
participate in a follow-up interview were contacted. Although the initial plan was to interview 20 graduate
teachers per jurisdiction, the call-up response rate of willing participants meant that this was not achievable
within the specified time-frame of the interview round. There was also a lower response call-up rate for some
jurisdictions when compared to the others. In view of these challenges, 13 new participants were selected and
contacted from the graduate teacher survey Round 2. Twenty-two narratives were also incorporated from the
SETE project for a national representation of all states and territories.
Table 8. Sample of graduate teachers interviewed – by state/territory
State/ Territory No. of participants in
Round 1
No. of participants in
Round 2
No. of participants in
Round 3
ACT 1 3 2
NSW 17 9 12

Longitudinal Teacher Education and Workforce Study (LTEWS) Final Report
36
NT 1 4 2
SA 2 6 3
TAS 7 5 7
WA 16 9 9
VIC - - 10
QLD - - 12
Total 44 36 57
As shown in Table 8, 44 interviews with graduate teachers were conducted in Round 1 (July 2012), 36 in Round 2
including 13 new participants (January 2013), and 57 in Round 3 (May 2013). At each point, the research team
followed up with the same group of graduate teachers to gain a picture of various aspects of their early career
experiences including their career progression, mobility, perceptions of their preparedness for teaching and how
they were coping in school and classroom contexts.
Figure 2. Career progression of interview respondents who participated in all three rounds

Longitudinal Teacher Education and Workforce Study (LTEWS) Final Report
37
Overall, 33 teachers participated in all three rounds of the interviews over the period from March 2012 to March
2013 (See Figure 2). Of the original sample of 44 graduate teachers from the first round, only 22 graduate teachers
participated in the follow-up interview in Round 2. The remaining 22 did not respond to the email invitations and
phone calls. Some of the graduate teachers had left the teaching profession by the second and third interviews
because they were not able to find a teaching position. A few of them decided to obtain teaching employment
overseas. The following figure illustrates the employment profile of the graduate teachers across all three rounds.
Analysis of graduate teacher Interview data
The interview data were audio-taped, transcribed and later analysed using narrative analytic techniques and
analysed in the following ways.
Within-case analysis
Within-case analysis seeks to evoke the contextual richness of the individual cases (Ayres, Kavanaugh, & Knafl,
2003). Each case was treated as a whole account to explore how graduate teachers make sense of their early
career experiences at each time-point as well as the sequential unfolding of their experiences over time. A case
narrative for each teacher-participant was written after the three rounds of interviews, guided by an organising
structure to draw key aspects of the graduate teachers’ overall early career experiences. An organising structure
was developed based on the questionnaire design and emerging themes from the three rounds of Interviews. The
themes of the organising structure include:
1. mobility and backgrounds of schools they teach in;
2. career orientations, progression and employability;
3. level of preparedness: pedagogy, curriculum and practice;
4. sense of efficacy in relation to teaching practice and student learning and
5. retrospective perception of quality and relevance of teacher education.
Cross-case analysis
The goal of cross-case analysis is not only to maintain the particularity of each case but to develop themes that
represent multiple accounts (Ayres et al., 2003). At this stage, the analytical framework employed an iterative
process of discussions to develop meta-narratives across the cases. The main objective of the cross-case analysis
was to build linkages across the cases. This allowed the team to draw insights into the similarities between, and
variations of, the narratives, and to build a multi-level and information-rich data set.

Longitudinal Teacher Education and Workforce Study (LTEWS) Final Report
38
3. Career Progression
This chapter presents findings relating to the early career progression of graduate teachers who completed their
teacher education programs in 2011. Career progression in this project refers to the entry into teacher education
and possible exit from, teaching employment, including data on graduates’ utilisation into teaching, their retention
and attrition in teaching in their early years, and their geographic and schools sector mobility.
The LTEWS has collected comprehensive information about Australian graduate teachers’ career progression and
workforce data not captured elsewhere. The challenge of obtaining accurate and comprehensive data on the
current teaching workforce for purposes of planning and forecasting is not new. The main challenge lies in the lack
of a consistent and coherent effort to map teacher demographic profiles on a national level for workforce
planning. The Australian Government report Australia’s Teachers: Australia’s Future (Committee for the Review of
Teaching and Teacher Education, 2003) concluded that ‘more comprehensive statistics relating to teachers,
teacher workforce trends generally and specific fields of teaching and teacher education need to be consistently,
reliably and regularly collected on a national and collaborative basis’ (p.95).
There have been a number of attempts to generate data for this purpose. Since its inception in 2006, the national
online survey Staff in Australia’s Schools (SiAS) has provided a comprehensive overview of the national teacher
workforce in Australia3. Commissioned by the Australian Government and conducted by the Australian Council for
Educational Research (ACER), this biennial survey investigates the main characteristics of the demographic profile
of both qualified and ‘out-of-field’ teachers in Australia to inform issues relating to career pathways, professional
learning and school staffing issues. In addition, the Beyond Graduation Survey investigates the experiences
including employment trajectories of graduates from Australian higher education institutions, re-surveying
respondents to the Australian Graduate Survey three years post award completion4.
Incorporated into this section of the report are survey data on early career progression, including employment,
mobility and retention, with complementary qualitative data from the free text responses and the telephone
follow-up interviews. Three rounds of surveys of 2011 graduates teachers and their principals provide data to
explore their early career pathways and progression. The data is analysed in two ways: firstly as three separate
snapshots over the period March 2012 to March 2013; and, secondly from a longitudinal perspective on graduate
teachers who were followed across this time period. The findings are also informed by the interview data collected
between May 2012 and May 2013 after each survey round.
To evidence who were the 2011 cohort; their entry into teacher education and possible exit from, teaching
employment; data on their utilisation into teaching, their retention and attrition in teaching in their early years,
and their geographic and schools sector mobility, the data is represented by five categories: Demography;
Utilisation; Teacher mobility; Attraction retention and attrition; and Career pathways and progression. Each
section is preceded by a summary of the main findings relevant to the category.
3 See http://www.acer.edu.au/sias
4 See http://www.graduatecareers.com.au/research/surveys/beyondgraduationsurvey/

Longitudinal Teacher Education and Workforce Study (LTEWS) Final Report
39
3.1 Profile of Graduate Teacher Respondents and their Schools
Box 1 provides a summary of the profile of the 2011 graduate teachers who responded to the Graduate Teacher
Surveys.
BOX 1. Summary profile of the graduate teacher respondent cohort
The average age of the 2011 graduate teacher respondents early in their first year after graduation was 32 years, with 53 per cent under 30 years of age and 81 per cent female. Eighty-six per cent came from English-speaking backgrounds, 1 per cent identified as Aboriginal or Torres Strait Islander, and 42 per cent identified as the first in their immediate family to gain a tertiary qualification.
Fifty-two per cent of graduate teacher respondents had graduated from a graduate entry teacher education qualification (including 12 per cent from masters programs), while 46 per cent had graduated with a four-year undergraduate bachelor’s degree. The majority were qualified to teach secondary school (44 per cent) and primary school (37 per cent). More than three-quarters had completed their teacher preparation in Victoria (29 per cent), Queensland (24 per cent) and New South Wales (23 per cent).
The proportion of graduate teacher respondents in teaching employment grew from 74 per cent to 84 per cent during the first-year-and-a-quarter after graduation. The largest percentage of employed graduates was in Victoria (29 per cent), followed by New South Wales (25 per cent) and Queensland (23 per cent). Most were employed in the government sector (about 70 per cent). Forty-six per cent were teaching in primary schools, while 48 per cent were teaching in secondary schools. Across the period of data collection, the percentage of graduate teacher respondents employed in schools located in major cities remained fairly constant (approximately 60 per cent), as did those in inner regional areas (between 20 to 23 per cent).
The following sections provide the statistical detail informing the summary in Box 1 above.
3.1.1 Demographic and professional characteristics of graduate teacher respondents
The Graduate Teacher Surveys asked respondents about their age, sex, Australian Aboriginal and/or Torres Strait
Islander status, location of the initial teacher education institution, and language background. Table 9 reports the
characteristics of the 2011 graduate teachers who responded to each of the three survey rounds. Rounds 2 and 3
of the Graduate Teacher Survey also asked if they were the first in their family to gain a tertiary qualification.
Where appropriate and possible, the results of the analysis in this section has been compared to the teaching
population in Australia.
Table 9. Demographic characteristics of graduate teacher respondents
Teacher characteristics
Round 1 Round 2 Round 3
n % N % N %
Age groups
20-24 404 29.4 814 29.4 480 21.4
25-29 317 23.1 779 28.2 709 31.5
30-34 154 11.2 322 11.6 288 12.8
35-39 127 9.2 232 8.4 199 8.9
40-44 158 11.5 264 9.5 234 10.4
45-49 119 8.7 182 6.6 180 8.0

Longitudinal Teacher Education and Workforce Study (LTEWS) Final Report
40
50+ 75 5.5 151 5.5 146 6.5
Not stated 21 1.5 21 0.8 12 0.5
Sex
Male 265 19.4 594 21.5 504 22.4
Female 1,102 80.6 2,171 78.5 1,744 77.6 Aust Aboriginal, Torres Strait Islander
No 1357 98.8 2,233 98.9 1,789 98.7
Yes 17 1.2 25 1.1 23 1.3
Location of initial teacher education institution
2
NSW 306 22.7 461 22.0 409 20.3
VIC 384 28.5 649 30.9 626 31.0
QLD 317 23.6 420 20.2 436 21.6
SA 46 3.4 67 3.2 94 4.7
WA 149 11.1 187 8.9 113 5.6
TAS 30 2.2 30 1.4 43 2.1
NT 28 2.1 49 2.3 112 5.6
ACT 11 0.8 69 3.3 55 2.7
Multiple states 63 4.7 131 6.2 111 5.5
Overseas 12 0.9 36 1.7 18 0.9
First in family
Yes n/a 1,157 41.9 911 40.7
No n/a 1,603 58.1 1,325 59.3
Language background
English speaking 1,173 85.9 2,111 93.5 1,665 91.1
Northern European 7 0.5 13 0.6 16 0.9
Southern European 4 0.3 4 0.2 4 0.2
Eastern European 0 0.0 1 0.0 9 0.5
Middle Eastern 1 0.1 7 0.3 7 0.4
Central Asian 13 1.0 24 1.1 26 1.4
South Asian 22 1.6 31 1.4 37 2.0
Eastern Asian 20 1.5 29 1.3 30 1.6
Other 125 9.2 37 1.6 34 1.9
TOTAL1 1,375 100.0 2,765 100.0 2,248 100.0
NOTES 1.Total is for age groups and may vary for other variables. Percentage is calculated on valid responses.
2. In Round 1, SETE data contributed 774 graduate teachers out of the 1,375, which is 56.3% of the total responses. Of
these, 457 were from Victoria and 317 from Queensland. In Round2, SETE data contributed 1,652 graduate teachers
out of the 2,765, which is 59.7% of the total responses. Of these, 1,071 were from Victoria and 581 from Queensland.
In Round 3, SETE data contributed 1,280 graduate teachers out of the 2,248, which is 56.9% of the total responses. Of
these 1,280 from SETE, 779 were from Victoria and 501 were from Queensland. These figures do not match exactly to
those of Vic and Qld in the table above because these the responses from these two states were calculated from
registration as a teacher in these two states rather than place of preparation.
The SiAS 2010 report (McKenzie et al., 2011) showed that across the whole teaching profession in Australia, there
are a high proportion of female teachers (81 per cent of primary teachers, 57 per cent of secondary teachers). In

Longitudinal Teacher Education and Workforce Study (LTEWS) Final Report
41
Victoria, women make up about 70 per cent of the teaching workforce (State of Victoria (Department of Education
and Early Childhood Development), 2012). The LTEWS results support these findings, with females making up 84 to
87 per cent of primary teachers across the three survey rounds and 68 to 71 per cent of secondary teachers. The
proportion of females in secondary teaching is higher than that found by SiAS but SiAS looks at the whole teaching
population, whereas LTEWS tracked new teachers only. Teaching has long attracted substantial numbers of
women, and the number of men teaching in primary schools in particular has declined (Richardson & Watt, 2006).
Australian Aboriginal and/or Torres Strait Islander teachers in the LTEWS cohort make up a little over one per cent
in all three rounds. This is about the same as the proportion in the SiAS 2010 sample (McKenzie et al., 2011) and
less than the proportion of people who identify as Australian Aboriginal and/or Torres Strait Islander in the
Australian population, which is 2.5 per cent (Australian Bureau of Statistics, 2011a). According to the Australian
Institute for Teaching and School Leadership report (2013), initial teacher education programs have a slightly
higher proportion of Indigenous students (2 per cent) when compared with the percentage across all fields of
higher education (1 per cent), but that the representation of Indigenous students in initial teacher education does
not yet match the proportion of Indigenous school students (4.9 per cent). Again, the LTEWS cohort is low in
representation by comparison.
The data for Victoria and Queensland came from the SETE study. SETE’s high survey response rates meant that the
national data show an over-representation from these two states for the location of the teachers’ initial teacher
education institution, across all three rounds. According to the 2011 Award Course Completions data published by
DIISRTE, initial teacher education figures show Victoria and Queensland having 22 and 15 per cent, respectively, of
total teacher graduates. In LTEWS, NSW is under-represented in all rounds compared to the DIISRTE data (DIISRTE
shows NSW had 33 per cent of teacher education completions in 2011). The percentage of completions for all
other states and territories, as shown in the 2011 Award Course Completions, is indicated below:
SA – 6.8 per cent
WA – 10.1 per cent
Tasmania – 1.4 per cent
Northern Territory – 2.4 per cent
ACT – 1.7 per cent
South Australian graduates were under-represented in LTEWS rounds. Western Australian graduates were well
represented in Round 1 (11 per cent), but under-represented in the following two rounds. Tasmanian, Northern
Territory and ACT graduates were proportionately represented across the three rounds with one exception. In
Round 3, there were more than double the responses from Northern Territory graduates than there had been in
previous rounds (5.6 per cent of all responses). Respondents who nominated ‘overseas’ initial teacher education
institutions could be those with teaching qualifications from other countries which gave them teacher registration
in Australia or could be those who completed initial teacher education in another country and then had to
complete some more study in Australia in order to be eligible for teacher registration.
Respondents were asked if they were the first in their immediate family to get a tertiary qualification. Forty-two
per cent stated that they were in Round 2, and 41 per cent in Round 3. The Australian Institute for Teaching and
School Leadership (2013) reported that compared with all fields of higher education, a greater proportion of
students commencing initial teacher education programs come from a lower socio-economic status and/or from
regional areas. These are arguably those more likely to come from backgrounds with family members not well
represented in terms of higher degree qualifications, but certainly those that would contribute to a diverse
teaching workforce reflective of the student body. Certainly the report highlights that ‘The diversity of entrants to

Longitudinal Teacher Education and Workforce Study (LTEWS) Final Report
42
initial teacher education programs is a feature of the initial teacher education landscape, providing schools with
qualified teachers from a range of backgrounds and histories’ (p.8).
In the LTEWS study, 86 per cent of graduate teachers came from an English-speaking background in Round 1,
which is slightly higher than for the general Australian population (Australian Bureau of Statistics, 2011a). LTEWS
Rounds 2 and 3 had 94 and 91 per cent, respectively, of English-speaking background graduate teachers. This was a
close match to SiAS 2010, which had 92 per cent of graduates from an English-speaking background. The Australian
Institute for Teaching and School Leadership initial teacher education data report (2013) reports that the
proportion of pre-service teachers with language backgrounds other than English (1 per cent) is smaller than the
proportion for tertiary education programs generally (4 per cent).
The age group with the highest percentage of respondents in LTEWS Rounds 1 and 2 was the 20 to 24 year olds
(both with 29 per cent). For Round 3, it was the 25 to 29 year olds (32 per cent). The average age for each round of
the Graduate Teacher Survey is as follows:
Round 1 – 32.1 years
Round 2 – 31.5 years
Round 3 – 32.6 years
The average age of graduate respondents who are employed as teachers is shown in the Table 10 below,
disaggregated by the key characteristics of gender, level of teaching, and geographic location of the school.
Table 10. Characteristics of graduate teachers with a teaching position – by average age
Teacher characteristics
Round 1 Round 2 Round 3
Sex
Male 32.8 32.6 33.1
Female 30.6 30.8 31.7
Level of teaching
Early Childhood 30.1 34.7 34.1
Primary 30.8 31.3 32.2
Secondary 31.2 30.8 31.7
The average age for males is approximately two years older than females across all three rounds of the LTEWS
survey. Round 1 showed that secondary teachers have the oldest average age, at 31. In Rounds 2 and 3, the
average age of graduate teachers in early childhood is two to three years older than for those at the primary and
secondary levels.
The professional characteristics of the graduate teachers in the three rounds of surveys are shown in Table 11
below. It shows the qualification level of the graduates and the area of teaching in which their teacher education
took place.

Longitudinal Teacher Education and Workforce Study (LTEWS) Final Report
43
Table 11. Graduates – by qualification level and teaching area
Professional characteristics
Round 1 Round 2 Round 3
N % n % n %
Qualification level
Masters 168 12.2 359 13.0 299 13.3
Bachelor 626 45.5 1,266 45.8 944 42.0 Grad Dip
547 39.8 949 34.3 767 34.1
Other 5 0.4 12 0.4 7 0.3
Not stated 29 2.1 179 6.5 231 10.3
Teaching area
Early Childhood (EC) 53 3.9 100 3.9 61 3.0
EC/Primary 84 6.2 155 6.0 136 6.8
Primary 496 36.9 972 37.8 729 36.4
Primary/Secondary 110 8.2 242 9.4 177 8.8
Secondary 587 43.6 1,105 42.9 875 43.7
Other 15 1.1 n/a - 26 1.3
TOTAL1 1,375 100.0 2,765 100.0 2,248 100.0
NOTES 1.Total is for qualification level and may vary for other variables. Percentage is calculated on valid responses.
For all three rounds, the most common qualification level was a bachelor’s degree (42 to 46 per cent of
respondents over the three rounds), followed by a graduate diploma (34 to 40 per cent over the three rounds).
Masters made up the smallest proportion of graduate qualifications, with 12 to 13 per cent.
The teaching area with the largest proportion of respondents over all three rounds was secondary teaching (43 to
44 per cent), then primary (36 to 38 per cent). The smallest proportion of respondents undertook their teacher
education in the early childhood area (3 to 4 per cent).
The three figures below show graphically graduates’ teaching area by the qualification level they gained in this
area. The teaching areas, as in the table above, are constructed to capture information on those teaching at the
intersection of two teaching areas, such as middle school (primary/secondary) as well as the distinct areas of
primary and secondary teaching.
The teaching area with the largest proportion of graduates gaining a bachelor’s degree is early childhood/primary.
Along with this group, the early childhood, primary and primary/secondary areas all had a bachelor’s degree as
their main qualification level. The majority of graduates in the secondary area had a graduate or postgraduate
diploma qualification across all three rounds.

Longitudinal Teacher Education and Workforce Study (LTEWS) Final Report
44
Figure 3. Graduate teaching area – by qualification level
0% 20% 40% 60% 80% 100%
EC
EC/Prim
Prim
Prim/Sec
Sec
Ro
un
d 1
Masters degree
Bachelor degree (includingdouble degrees)
Graduate or postgraduatediploma
Other
0% 20% 40% 60% 80% 100%
EC
EC/Prim
Prim
Prim/Sec
Sec
Ro
un
d 2
Masters degree
Bachelor degree (includingdouble degrees)
Graduate or postgraduatediploma
Other
0% 20% 40% 60% 80% 100%
EC
EC/Prim
Prim
Prim/Sec
Sec
Ro
un
d 3
Masters degree
Bachelor degree (includingdouble degrees)
Graduate or postgraduatediploma
Other

Longitudinal Teacher Education and Workforce Study (LTEWS) Final Report
45
Longitudinal datasets of graduate teacher characteristics
As outlined in Chapter 2, the LTEWS Graduate Teacher Surveys were administered at three points in time – March
2012, October 2012, and March 2013. Having three discrete points in time when data was collected allowed for
longitudinal analysis of the data collected from graduate teachers who participated in more that one survey.
Data from respondents who participated in more than one survey round was used to construct three longitudinal
datasets:
The first dataset shows changes for respondents from Round 1 to Round 2 (from early 2012 to late 2012).
This is a six-month longitudinal view of these graduates in their first year, and is named Cohort 1 in Table
12.
The second dataset shows changes for respondents from Round 2 to Round 3 (from late 2012 to early
2013). This is a six-month longitudinal view of these graduates from the end of their first year of teaching
into their second year of teaching, and the dataset is named Cohort 2 in the table.
The third dataset shows changes for respondents from Round 1 to Round 3 (from early 2012 to early
2013). This is a 12-month longitudinal view of these graduates from their first year of teaching to their
second year and is named Cohort 3 in the table below.
Table 12 below shows the demographic characteristics of each of these cohorts, including age group, gender,
Australian Aboriginal and/or Torres Strait Islander status, location of initial teacher education institution, whether
the respondent is the first in their immediate family to gain a tertiary qualification, and their language background.
Table 12. Demographic characteristics of graduate teachers in the longitudinal datasets
Teacher characteristics
Cohort 1 Cohort 2 Cohort 3
n % N % n %
Age groups
20-24 172 24.0 236 21.4 101 17.6
25-29 151 21.1 321 29.0 154 26.8
30-34 89 12.4 142 12.9 70 12.2
35-39 68 9.5 88 8.0 56 9.8
40-44 96 13.4 138 12.5 78 13.6
45-49 78 10.9 108 9.8 67 11.7
50+ 62 8.6 70 6.3 47 8.2
Not stated 1 0.1 2 0.2 1 0.2
Sex
Male 144 20.1 241 21.8 118 20.6
Female 573 79.9 864 78.2 456 79.4 Aust Aboriginal, Torres Strait Islander
No 707 98.6 913 99.3 566 99.0
Yes 8 1.1 6 0.7 6 1.0
Location of initial teacher education institution
NSW 149 21.1 227 21.8 117 20.7
VIC 219 31.5 319 30.7 160 28.4
QLD 168 23.8 231 22.2 142 25.2

Longitudinal Teacher Education and Workforce Study (LTEWS) Final Report
46
SA 23 3.3 36 3.5 21 3.7
WA 71 10.0 71 6.8 55 9.8
TAS 18 2.5 16 1.5 16 2.8
NT 16 2.3 31 3.0 17 3.0
ACT 5 0.7 37 3.6 7 1.2
Multiple states 34 4.8 62 6.0 27 4.8
Overseas 4 0.6 10 1.0 2 0.4
First in family
Yes 306 42.7 434 39.4 233 40.6
No 410 57.3 668 60.6 337 59.1
Language background
English speaking 673 94.1 850 92.4 525 91.8
Northern European 5 0.7 7 0.8 5 0.9
Southern European 2 0.3 1 0.1 1 0.2
Eastern European 0 0.0 3 0.3 1 0.2
Middle Eastern 1 0.1 1 0.1 2 0.3
Central Asian 6 0.8 12 1.3 5 0.9
South Asian 3 0.4 9 1.0 6 1.0
Eastern Asian 9 1.3 10 1.1 4 0.7
Other 16 2.2 27 2.9 23 4.0
TOTAL1 717 100.0 1,105 100.0 574 100.0
NOTES 1.Total is for age groups and may vary for other variables. Percentage is calculated on valid responses.
The characteristics of the three groups are similar to each other, and also do not vary significantly from the
characteristics of graduates at the three discrete points in time. There was a higher proportion of those aged 40
and over who responded to multiple surveys, so their proportion in the three longitudinal datasets varies from 27
to 34 per cent, compared to 22 to 26 per cent in the three discrete datasets. There was also a smaller proportion
of those aged 20 to 24 responding to multiple surveys (18 to 24 per cent) than to the discrete surveys (21 to 29 per
cent).
Gender, Australian Aboriginal and/or Torres Strait Islander status, language background and first in family to gain
tertiary qualification characteristics do not differ significantly from the discrete datasets. There was a small, but
not significant, difference in the location of graduates’ initial teacher education institution in the 12-month dataset
compared to the Round 3 discrete dataset. The proportion of responses from WA was slightly higher (10 per cent
compared to 6 per cent), and the proportion of responses from NT was slightly lower (3 per cent compared to 6
per cent).
3.1.2 Characteristics of the schools in which graduate teacher respondents were employed
Table 13 below shows the number and percentage of graduate respondents who were teaching at the time of the
three LTEWS Graduate Teacher Surveys. The proportion of those with a teaching position in schools grew from 74
per cent in Round 1 to 83.9 per cent in Round 3.

Longitudinal Teacher Education and Workforce Study (LTEWS) Final Report
47
Table 13. Graduate teachers with a teaching position
Round 1 Round 2 Round 3 n % n % n % Teaching 980 74.0 2,217 84.7 1,830 83.9 Not teaching 344 26.0 401 15.3 350 16.1
TOTAL 1,324 100.0 2,618 100.0 2,180 100.0
The following tables show information on the schools in which these graduate teachers were employed. Table 14
shows the jurisdiction in which the graduate teachers were employed as teachers.
Table 14. Schools employing graduates – by state/territory
Round 1 Round 2 Round 3
n % n % n %
NSW 239 24.4 407 18.4 333 18.2
VIC 282 28.8 862 38.9 629 34.4
QLD 221 22.6 456 20.6 396 21.6
SA 39 4.0 72 3.2 76 4.2
WA 105 10.7 163 7.4 89 4.9
TAS 15 1.5 29 1.3 33 1.8
NT 22 2.2 69 3.1 151 8.3
ACT 9 0.9 107 4.8 79 4.3
In a school outside Australia 17 1.7 40 1.8 44 2.4
Not stated 31 3.2 12 0.5 1 0.1
TOTAL 980 100.0 2,217 100.0 1,831 100.0
Note: Australian Bureau of Statistics figures for percentage of schools across Australia by state/territory for 2011 are as
follows: NSW 32.8 per cent; VIC 23.7 per cent; QLD 18.1 per cent; SA 8.0 per cent; WA 11.4 per cent; TAS 2.7 per cent;
NT 2.0 per cent; ACT 1.4 per cent (Australian Bureau of Statistics, 2011b).
The largest percentage of employed graduate teachers in each of the three surveys is from Victoria (Round 1, 28.8
per cent; Round 2, 38.9 per cent; Round 3, 34.4. per cent). As noted earlier, the graduate teachers from this
jurisdiction and from Queensland are part of the Australia Research Council funded SETE study. The SETE study
was able to gather more responses to the survey, perhaps due to greater promotion of the project as a result of
close links with the jurisdictional bodies who were partners in the project.
Table 15 shows the school sector in which graduate teachers are employed.
Table 15. Schools employing graduates – by school sector
Round 1 Round 2 Round 3
N % n % n %
Government 683 71.4 1,503 68.0 1,247 68.2
Catholic 120 12.6 300 13.6 212 11.6
Independent 140 14.6 304 13.8 276 15.1
Other 13 1.4 102 4.6 94 5.1
TOTAL 956 100 2,209 100.0 1,829 100.0
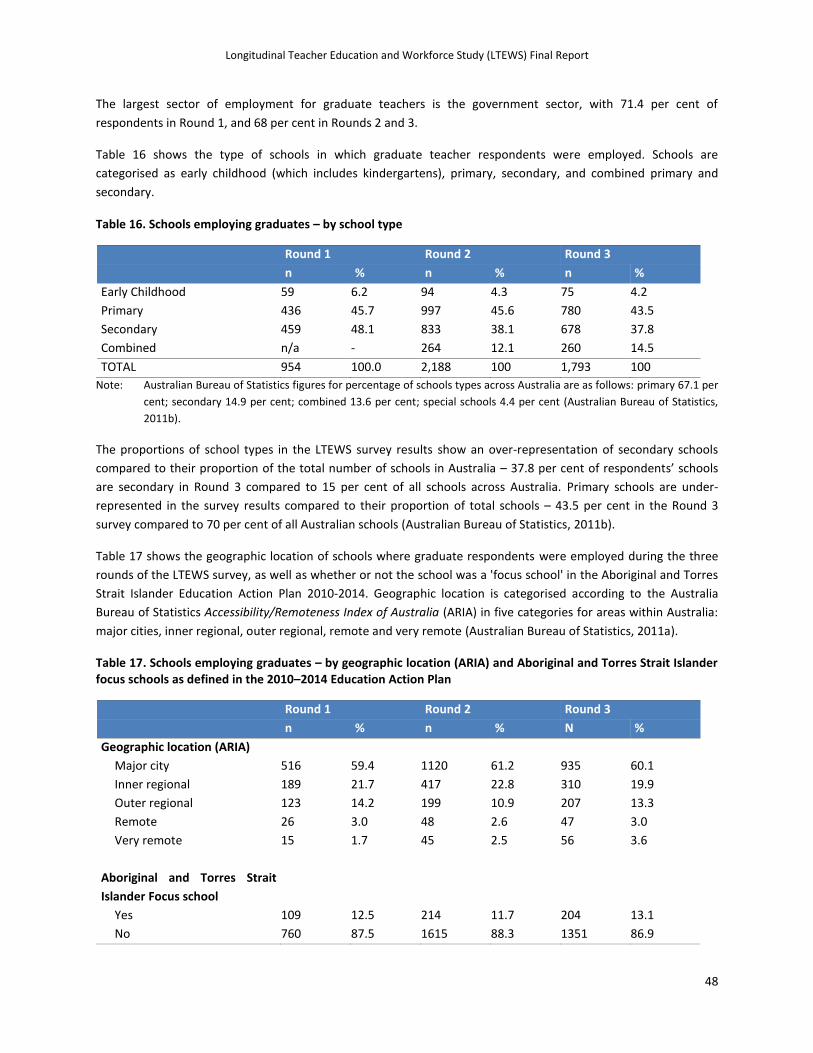
Longitudinal Teacher Education and Workforce Study (LTEWS) Final Report
48
The largest sector of employment for graduate teachers is the government sector, with 71.4 per cent of
respondents in Round 1, and 68 per cent in Rounds 2 and 3.
Table 16 shows the type of schools in which graduate teacher respondents were employed. Schools are
categorised as early childhood (which includes kindergartens), primary, secondary, and combined primary and
secondary.
Table 16. Schools employing graduates – by school type
Round 1 Round 2 Round 3
n % n % n %
Early Childhood 59 6.2 94 4.3 75 4.2
Primary 436 45.7 997 45.6 780 43.5
Secondary 459 48.1 833 38.1 678 37.8
Combined n/a - 264 12.1 260 14.5
TOTAL 954 100.0 2,188 100 1,793 100
Note: Australian Bureau of Statistics figures for percentage of schools types across Australia are as follows: primary 67.1 per
cent; secondary 14.9 per cent; combined 13.6 per cent; special schools 4.4 per cent (Australian Bureau of Statistics,
2011b).
The proportions of school types in the LTEWS survey results show an over-representation of secondary schools
compared to their proportion of the total number of schools in Australia – 37.8 per cent of respondents’ schools
are secondary in Round 3 compared to 15 per cent of all schools across Australia. Primary schools are under-
represented in the survey results compared to their proportion of total schools – 43.5 per cent in the Round 3
survey compared to 70 per cent of all Australian schools (Australian Bureau of Statistics, 2011b).
Table 17 shows the geographic location of schools where graduate respondents were employed during the three
rounds of the LTEWS survey, as well as whether or not the school was a 'focus school' in the Aboriginal and Torres
Strait Islander Education Action Plan 2010-2014. Geographic location is categorised according to the Australia
Bureau of Statistics Accessibility/Remoteness Index of Australia (ARIA) in five categories for areas within Australia:
major cities, inner regional, outer regional, remote and very remote (Australian Bureau of Statistics, 2011a).
Table 17. Schools employing graduates – by geographic location (ARIA) and Aboriginal and Torres Strait Islander focus schools as defined in the 2010–2014 Education Action Plan
Round 1 Round 2 Round 3
n % n % N %
Geographic location (ARIA)
Major city 516 59.4 1120 61.2 935 60.1
Inner regional 189 21.7 417 22.8 310 19.9
Outer regional 123 14.2 199 10.9 207 13.3
Remote 26 3.0 48 2.6 47 3.0
Very remote 15 1.7 45 2.5 56 3.6
Aboriginal and Torres Strait
Islander Focus school
Yes 109 12.5 214 11.7 204 13.1
No 760 87.5 1615 88.3 1351 86.9

Longitudinal Teacher Education and Workforce Study (LTEWS) Final Report
49
TOTAL 869 100 1,829 100 1,555 100
Across the three Graduate Teacher Survey rounds, the proportion of graduate respondents employed in schools
located in major cities remained fairly constant (approximately 60 per cent), as did those in inner regional areas
(between 20 to 23 per cent). The biggest change was the increase of graduate respondents in schools in very
remote areas (which grew from 1.7 per cent in Round 1 to 3.6 per cent in Round 3). This can be accounted for by
the increase in the number of responses from graduates located in the Northern Territory in Round 3.
Staff in Australia's Schools 2010 data for graduate teachers (McKenzie et al., 2011) does not show geographic
location of schools by Australia Bureau of Statistics ARIA classification. It has three categories: metropolitan,
provincial and remote. The percentages of LTEWS graduates in these three categories are as follows:
Metropolitan – 72.6 per cent
Provincial – 24.4 per cent
Remote – 3.0 per cent
In comparison to this SiAS 2010 data, there are more employed graduates in the LTEWS data who are venturing
further away from highly populated areas.
Graduate teacher respondents in schools with an Aboriginal and Torres Strait islander focus were between 12 and
13 per cent of all respondents in each of the three LTEWS surveys. The Australian Government Department of
Education (formerly Department of Education Employment and Workplace Relations-DEEWR) does not have
publicly available data on the proportion of Australian schools that have an Aboriginal and Torres Strait Islander
focus, and so it is not possible to report here whether the LTEWS figures are in proportion.
Table 18 shows the level of teaching for employed graduate teachers, according to age groups across Rounds 2 and
3 (October 2012 and March 2013). Across the two rounds, the largest percentage of graduates were teaching at
the primary level, irrespective of age. The age groups with the highest percentage who were teaching at the early
childhood level were the 40–44 and 45–49 year-old group. The age group with the highest percentage employed at
the secondary level is the 25–29 year-old group (40 per cent in Round 2, and 41 per cent in Round 3). The age
group with the highest percentage employed at the primary level is the 40–44 year-old group in both rounds (50
per cent in Round 2 and 49 per cent in Round 3).
Table 18. Graduate teachers with a teaching position – by level of teaching percentages in each age group
20-24 25-29 30-34 35-39 40-44 45-49 50+ Total
% % % % % % % % N
Round 2
EC 3.0 3.9 2.4 4.8 8.1 8.2 5.9 4.3 94
Primary 46.3 42.9 48.6 45.5 50.7 46.9 41.6 45.8 995
Secondary 39.0 40.2 37.5 37.4 32.1 33.3 38.6 38.0 825
Comb K-12 11.6 13.1 11.5 12.3 9.1 11.6 13.9 11.9 259
TOTAL 2,173
Round 3
EC 2.0 4.7 4.0 3.0 6.6 7.4 4.4 4.2 75
Primary 47.5 39.7 41.0 41.5 48.9 45.9 45.1 43.5 777
Secondary 37.3 41.1 35.2 37.2 35.2 31.9 39.6 37.7 674

Longitudinal Teacher Education and Workforce Study (LTEWS) Final Report
50
Comb K-12 13.2 14.5 19.8 18.3 9.3 14.8 11.0 14.6 260
TOTAL 1,786
The percentages show that for every age group, a similar proportion of graduate teacher respondents was
teaching in primary and secondary, but those teaching early childhood are a little older. One explanation of this
could be that this group of people are already early childhood practitioners with sub-bachelor qualifications and
are updating their qualifications to a bachelor’s level in line with national reforms aiming for higher qualification
requirements for early childhood professionals.
Table 19 below shows the teaching level for graduates with a teaching position by the proportion of age groups in
each, across Rounds 2 and 3.
Table 19. Graduate teachers with a teaching position – by age percentages in each level of teaching
Early Childhood Primary Secondary
Combined K-12 Total
% % % % % n
Round 2
20-24 21.3 30.6 31.0 29.3 30.2 656
25-29 25.5 26.7 30.2 31.3 28.5 620
30-34 6.4 12.4 11.5 11.2 11.6 253
35-39 9.6 8.5 8.5 8.9 8.6 187
40-44 18.1 10.7 8.1 7.3 9.6 209
45-49 12.8 6.9 5.9 6.6 6.8 147
50+ 6.4 4.2 4.7 5.4 4.6 101
TOTAL 2,173
Round 3
20-24 10.7 25.0 22.6 20.8 22.8 408
25-29 36.0 29.6 35.3 32.3 32.4 579
30-34 12.0 12.0 11.9 17.3 12.7 227
35-39 6.7 8.8 9.1 11.5 9.2 164
40-44 16.0 11.5 9.5 6.5 10.2 182
45-49 13.3 8.0 6.4 7.7 7.6 135
50+ 5.3 5.3 5.3 3.8 5.1 91
TOTAL 1,786
At the early childhood level, the largest proportion of graduate teachers was aged under 30 (47 per cent in Rounds
2 and 3), although this level, along with primary, also has a high proportion of graduate teachers in older age
groups (both have 19 per cent of new graduate teaching employment in the 40–49 year-old bracket). At the
primary, secondary and combined levels, the majority of graduate teaching employment is in the under-30 age
group. This is similar to results from the SiAS 2010 report (McKenzie et al., 2011), although SiAS results showed a
higher proportion of employment for graduates under 30 than did LTEWS (SiAS: 69 per cent for primary; LTEWS: 57
and 55 per cent over the two rounds. SiAS: 63 per cent for secondary; LTEWS: 61 and 56 per cent over the two
rounds).

Longitudinal Teacher Education and Workforce Study (LTEWS) Final Report
51
The LTEWS project had more graduate teachers aged over 40 at the primary level than did SiAS. For LTEWS, this
was 22 and 25 per cent over the two rounds, and for SiAS it was 13 per cent. LTEWS and SiAS showed a similar
proportion aged over 40 at the secondary level. For LTEWS, this was 19 and 21 per cent over the two rounds, and
for SiAS it was 17 per cent. For LTEWS, at all three levels, there is a higher proportion aged 25–29 than there is 20–
24: 30 per cent of graduates employed at the primary level are aged 25–29 compared to 25 per cent aged 20–24;
and, 35 per cent of graduates employed at the secondary level are aged 25–29 compared to 23 per cent aged 20–
24.
Table 20 below shows the distribution of employment for the 2011 graduate teachers by school type. Teachers
were asked if their school was primary, secondary or combined, or if they were employed in an early childhood
setting in Rounds 2 and 3 (October 2012 and March 2013 respectively).
Table 20. Graduate teachers with a teaching position – by school type
Round 2
Round 3
n %
n
%
Early Childhood 86 3.9 75 4.2
Primary 992 45.2 780 43.5
Secondary 818 37.3 678 37.8
Combined K-12 298 13.6 260 14.5
TOTAL 2,194 100.0 1,793 100.0
Graduate teacher respondents show similar proportions of employment across the four school types for both
rounds. Just over a third of graduates were employed in a secondary school, and approximately 45 per cent were
employed in a primary school.

Longitudinal Teacher Education and Workforce Study (LTEWS) Final Report
52
3.2 Utilisation of New Graduate Teachers
Teaching is one of the single largest professions in Australia. The Productivity Commission reports that there are
about 16,000 domestic graduate teachers completing initial teacher preparation course each year. At the same
time, total number of students in Australia is forecasted to increase by around 26 per cent (or about 900,000) over
the next decade, with the highest rates of growth expected to be in Queensland (45 per cent) and Western
Australia (40 per cent) (Productivity Commission, 2012).
These present competing demands on teacher workforce, schools and the broader labour market. Current and
relevant survey work and teacher workforce data is crucial for identifying key issues that need to be addressed to
improve the utilisation of the teaching workforce. The data presented in this section particularly investigates the
distribution of graduate teachers across teaching areas and their intentions whether or not to seek teaching
employment from the point of their graduation from teacher education program to early in the second year post-
graduation. This is examined for graduate teachers who have teaching employment and those who did not enter
teaching.
Box 2 lists the main findings discussed in more detail in this Section 3.2: 3.2.1 Distribution of graduate teachers
across teaching areas; 3.2.2 Utilisation of graduates in teaching employment; and 3.2.3 Graduates who did not
enter teaching.
Box 2. Main Findings: Utilisation of new graduate teachers
Distribution of graduate teachers across teaching areas
Of the graduate teachers with a specialist teaching qualification, a large percentage was teaching in at least one of their specialist areas (77 per cent during early in the first year after graduation; 86 per cent early in the second year).
High proportions of special needs, mathematics, English, technology, science, and languages other than English (LOTE) teachers were teaching in their area of specialisation.
Graduate teachers with specialist qualifications in society and the environment, the arts and health and physical education were least likely to be teaching in their specialist areas and therefore more likely to be teaching out of field.
Utilisation of graduates in teaching employment
A majority of graduate teachers moved into teacher employment after graduation (increasing from 74 per cent early in their first year after graduation to 84 per cent early in the second year). Almost 60 per cent were on a contract while just under a quarter were employed casually.
Only 18 to 20 per cent of the graduate teachers had full-time permanent employment in their first year of teaching. This, however, increased to 34 per cent early in the second year.
Nearly two thirds commenced teaching in a full time position, either permanently (18 per cent) or on contract (46 per cent).
There was a higher proportion of males in full-time permanent teaching positions during the first year and a half after graduation than females (7 per cent higher in Rounds 1 and 3 and 5 per cent in Round 2). Female graduate teachers were more likely to be in casual and part-time contract position.
(continued on the next page)

Longitudinal Teacher Education and Workforce Study (LTEWS) Final Report
53
Box 2. (continued)
Approximately 30 per cent of graduates who were in part-time contract or casual employment in their first year remained employed in this capacity in their second year post graduation.
In interviews, graduate teachers cited casual or relief employment as a factor hindering their career progression and professional learning and development. Having inadequate access to induction programs and professional development resources and networks, and the lack of classroom opportunities to put their skills and knowledge into practice contexts, were cited as obstacles for professional development.
Three-quarters of principals agreed that they liked to employ graduate teachers, often citing their desirable personal attributes such as enthusiasm, energy, passion for teaching and willingness to learn. In survey free text responses, principals indicated that employing graduates was their professional responsibility to help build the next generation of teachers.
Graduates who did not enter teaching
Of those graduate teachers who were not in teaching positions and who taken up other employment, more than 40 per cent were working in education-related industries such as tutoring, working in the tertiary sector, in early childhood settings or as teachers’ aides and in outside school hours care at the beginning of their first year post graduation. A similar proportion was working in education-related industries at the beginning of their second year.
Teaching seemed to remain a desirable career, with the findings showing how graduates who had registered with their Teacher Registration Authorities and had not secured teaching positions persisted in seeking a teaching position over the three rounds. By their second year after graduation, more than 60 per cent of graduate teachers without a teaching position were still seeking teaching employment.
3.2.1 Distribution of graduate teachers across teaching areas
Of the graduate teacher respondents who were teaching, the percentage with a specialist qualification (such as,
for example, in health and physical education, mathematics, science, the arts, LOTE) is as follows:
Round 1 – 58 per cent
Round 2 – 56 per cent
Round 3 – 52 per cent
Figure 4 shows the percentage of graduate teachers with a teaching position who had a specialist qualification and
were teaching in their specialist area. There is a slight increase in the percentage of graduates teaching in their
specialist area from Round 1 to Round 3. Approximately 78 per cent were teaching in their specialist area in Round
1, 79 per cent in Round 2, and 86 per cent in Round 3.

Longitudinal Teacher Education and Workforce Study (LTEWS) Final Report
54
Figure 4. Graduate teachers with a teaching position who have a specialist qualification – by currently teaching in their specialist area
(Round 1 n=545; Round 2 n=931; Round 3=933)
Figure 5 illustrates the distribution of employed graduate teachers across their teaching areas. In Rounds 1 and 2
of the LTEWS Graduate Teacher Survey, respondents were asked to name the areas in which they had completed
specialist qualifications in their teacher education program. These results include all those who stated that they
were teaching and have qualifications in a specialist area, regardless of their main area or level of teaching (i.e.
early childhood, primary, secondary).
77.4 79.3 85.8
0
10
20
30
40
50
60
70
80
90
100
Round 1 Round 2 Round 3
Pe
rce
nt
Teaching in at least one of your specialist areas

Longitudinal Teacher Education and Workforce Study (LTEWS) Final Report
55
Figure 5. Graduate teachers with a teaching position who are qualified to teach in a specialist area – by their area of specialisation, Rounds 1 and 2
The figure shows that the highest proportion of graduate teachers with a qualification in a specialist area is in
society and the environment in Round 1 (37.2 per cent) and the arts in Round 2 (16.3 per cent). Other specialist
areas with high percentages of graduates in Round 1 include science (29.2 per cent), English (25.3 per cent) and
the arts (24.6 per cent). In Round 2, areas with a high percentage of trained specialists include English, (16.2 per
cent), health and physical education (15.6 per cent) and science (15.4 per cent). In the priority areas of
mathematics, LOTE and technology, the percentage of graduates with formal qualifications were as follows:
Mathematics – 9.7 per cent in Round 1; 5.7 per cent in Round 2
LOTE – 7 per cent in Round 1; 5.6 per cent in Round 2
Technology – 12.7 per cent in Round 1; 5.9 per cent in Round 2
In Round 3 (the beginning of the second year post-graduation), respondents were asked to state the specialisation
area in which they were qualified to teach and if they were currently teaching in their specialist area. Table 21
shows the number of graduate teachers who were qualified to teach in a specialist area and the proportion of
them who were currently teaching in their area of specialisation. These results include all those who stated their
area of teaching and had qualifications in a specialist area, regardless of their main area or level of teaching (i.e.
early childhood, primary, secondary).
4.2
4.8
20.4
12.7
7.0
24.6
29.2
37.2
9.7
25.3
4.5
3.5
15.6
5.9
5.6
16.3
15.4
11.4
5.7
16.2
0 5 10 15 20 25 30 35 40
Other
Special needs
Health & PE
Technology
LOTE
The Arts
Science
Soc & Env
Mathematics
English
Percent
Spe
cial
ist
are
as
Round 2
Round 1
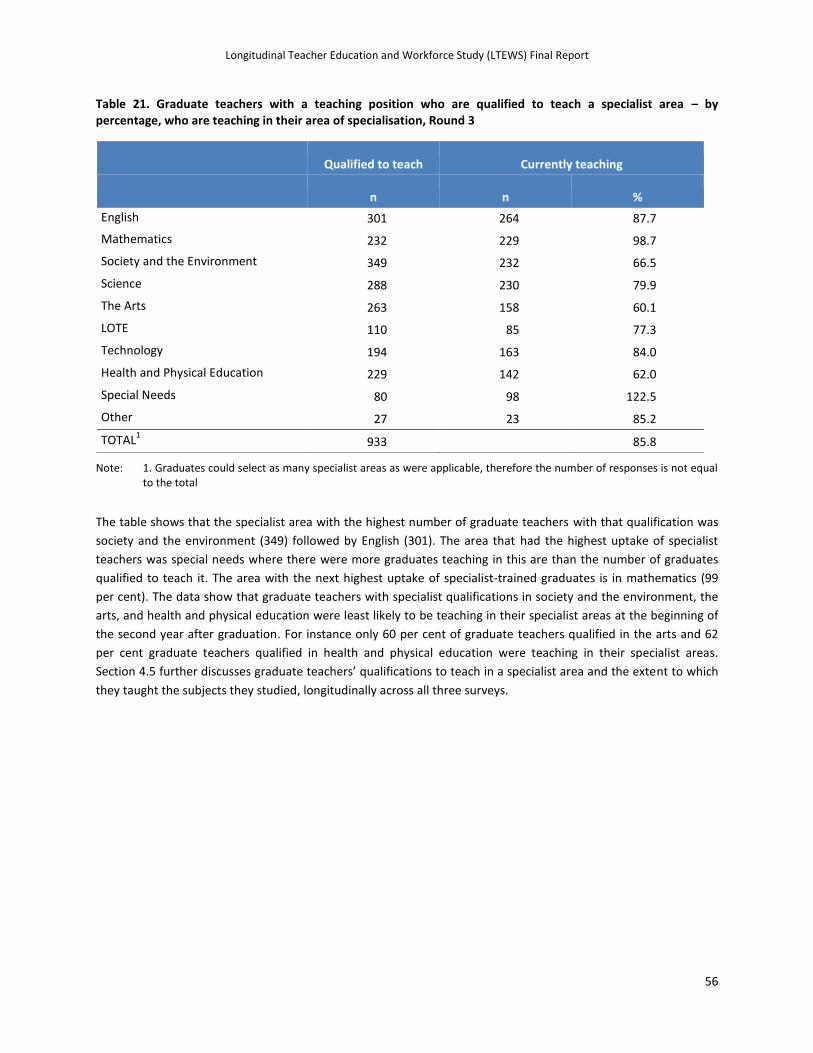
Longitudinal Teacher Education and Workforce Study (LTEWS) Final Report
56
Table 21. Graduate teachers with a teaching position who are qualified to teach a specialist area – by percentage, who are teaching in their area of specialisation, Round 3
Qualified to teach Currently teaching
n n %
English 301 264 87.7
Mathematics 232 229 98.7
Society and the Environment 349 232 66.5
Science 288 230 79.9
The Arts 263 158 60.1
LOTE 110 85 77.3
Technology 194 163 84.0
Health and Physical Education 229 142 62.0
Special Needs 80 98 122.5
Other 27 23 85.2
TOTAL1 933 85.8
Note: 1. Graduates could select as many specialist areas as were applicable, therefore the number of responses is not equal to the total
The table shows that the specialist area with the highest number of graduate teachers with that qualification was
society and the environment (349) followed by English (301). The area that had the highest uptake of specialist
teachers was special needs where there were more graduates teaching in this are than the number of graduates
qualified to teach it. The area with the next highest uptake of specialist-trained graduates is in mathematics (99
per cent). The data show that graduate teachers with specialist qualifications in society and the environment, the
arts, and health and physical education were least likely to be teaching in their specialist areas at the beginning of
the second year after graduation. For instance only 60 per cent of graduate teachers qualified in the arts and 62
per cent graduate teachers qualified in health and physical education were teaching in their specialist areas.
Section 4.5 further discusses graduate teachers’ qualifications to teach in a specialist area and the extent to which
they taught the subjects they studied, longitudinally across all three surveys.

Longitudinal Teacher Education and Workforce Study (LTEWS) Final Report
57
3.2.2 Utilisation of Graduates in Teaching Employment
In this section, analysis is provided for discrete points linked to each survey round and for longitudinal analyses of
the employment levels of graduate teachers and changes of employment type. The views of principals in relation
to attracting and retaining graduate teachers are also examined.
A. Employment in schools: Discrete Points in Time
Figure 6 shows the percentage of graduate teachers in the LTEWS sample employed as a teacher in a school across
all three rounds of the Graduate Teacher Survey (Round 1: March 2012, Round 2: October 2012, and Round 3:
March 2013). A majority of graduate teachers moved into teacher employment over the year after graduation. In
Round 2, 85 per cent of respondents are working as teachers in schools, compared to 74 per cent in Round 1. The
percentage of graduate teachers employed as a teacher remained consistent for the next two rounds with about
84 per cent of respondents working as teachers in schools in Round 3.
Figure 6. Graduate teachers' employment in schools
Length of teaching employment
Table 22 shows the length of time graduate teachers had been in their current teaching position at the time of
each of the three survey rounds.
Table 22. Graduate teachers with a teaching position – by length of current teaching employment
Round 1 Round 2 Round 3
Length of employment n % n % N %
Under 1 month 34 3.7 61 2.9 63 3.5
1–3 months 367 39.8 314 14.8 461 25.7
4–6 months 331 35.9 294 13.9 102 5.7
74.0 84.7 83.9
0%
10%
20%
30%
40%
50%
60%
70%
80%
90%
100%
Round 1 Round 2 Round 3
Teacher employment
No
Yes

Longitudinal Teacher Education and Workforce Study (LTEWS) Final Report
58
7–12 month 150 16.3 1,257 59.3 210 11.7
13–18 months 39 4.2 98 4.6 724 40.3
19–24 months - 95 4.5 83 4.6
Over 2 years - - 154 8.6
TOTAL 921 100.0 2,119 100.0 1,797 100.0
In Round 1, the largest proportion of the 2011 graduates had been employed in their current teaching position for
1 to 3 months (40 per cent). In Round 2, the majority of respondents had been in their current teaching position
from between 7 to 12 months (59 per cent). In Round 3 (March 2013) the data shows two distinct groups of
employed graduate teachers: one group who have been in their current position for 1–3 months (26 per cent), and
another who have been in their current position for 13 to 18 months (40 per cent). The timing of the three LTEWS
Graduate Teacher Surveys, and the results in the above Table, shows that a large proportion of graduates gained
their employment at the beginning of the school year. Those teaching for some time before they had actually
graduated are likely to be those registered with permission to teach.
Employment type
Table 23 shows graduate teachers who are in a teaching position by their employment type in the three rounds of
surveys.
Table 23. Graduate teachers with a teaching position – by employment type
Round 1 Round 2 Round 3
n n n % n %
Full time – Permanent 168 17.5 441 20.1 613 34.1
Part time – Permanent 30 3.1 57 2.6 59 3.3
Casual 209 21.7 512 23.3 299 16.6
Full time – Contract 441 45.8 945 43.1 679 37.8
Part time – Contract 114 11.9 239 10.9 147 8.2
TOTAL 962 100.0 2,194 100.0 1,797 100.0
In Rounds 1 and 2, nearly half of graduate teachers (46 and 43 per cent, respectively) were employed on a full-time
contract basis. The next largest employment type in the first two rounds is casual employment (22 and 23 per cent,
respectively), followed by full-time permanent employment (18 and 20 per cent). In Round 3, the proportion of
graduates in each employment type had changed. There were 34 per cent of graduates with full-time permanent
positions (an increase of 14 percentage points from Round 2), and there were 17 per cent of graduates in casual
positions (a decrease of 6 percentage points from Round 2).
By the beginning of the second year after graduation, almost 72 per cent were in full-time employment, either
permanently or on contract. This is lower than for the whole teaching profession in the SiAS 2010 data (McKenzie
et al., 2011) which suggests that full-time employment is the most common type of employment for both primary
(77 per cent) and secondary teachers (82 per cent). In Scotland, the General Teaching Council for Scotland (GTCS)
Probation Teachers Survey October 2009–2010 (Donaldson, 2010) showed that only 16.1 per cent of those who
responded had full-time permanent positions. A further 19.5 per cent had full-time temporary contracts. According
to the Australian Institute for Teaching and School Leadership Initial Teacher Education Data Report (2013), 14 per
cent of 2011 primary teaching graduates were not working, 55 per cent were working full-time and 31 per cent

Longitudinal Teacher Education and Workforce Study (LTEWS) Final Report
59
part-time. For 2011 secondary teaching graduates, 16 per cent were not working, 56 per cent were working full-
time and 28 per cent part-time.
Table 24 illustrates the cross-tabulation of graduate teachers with a current teaching position by gender and
employment type.
Table 24. Graduate teachers with a teaching position – by gender and employment type
Employment type Males Females
n % n %
Round 1
Full-time permanent 43 22.8 125 16.2
Part-time permanent 6 3.2 24 3.1
Casual 31 16.4 178 23.0
Full-time contract 98 51.9 343 44.4
Part-time contract 11 5.8 103 13.3
TOTAL 189 100.0 773 100.0
Round 2
Full-time permanent 116 24.3 325 18.9
Part-time permanent 13 2.7 44 2.6
Casual 95 19.9 417 24.3
Full-time contract 217 45.4 728 42.4
Part-time contract 37 7.7 202 11.8
TOTAL 478 100.0 1,716 100.0
Round 3
Full-time permanent 157 39.5 456 32.6
Part-time permanent 14 3.5 45 3.2
Casual 51 12.8 248 17.7
Full-time contract 149 37.5 530 37.9
Part-time contract 26 6.5 121 8.6
TOTAL 397 100.0 1,400 100.0
In all three rounds, there is a higher proportion of males in full-time permanent positions than females (7 per cent
higher in Rounds 1 and 3, 5 per cent in Round 2). There is also a higher proportion of males in full-time contract
positions than females in the first two Rounds (8 and 3 per cent more, respectively), but this changes for Round 3
where both 38 per cent of males and females are in full-time contract positions. There is a higher proportion of
females than males in casual positions across all three Rounds (7 per cent higher in Round 1, 4 per cent higher in
Rounds 2 and 3) and a higher proportion of females than males in part-time contract positions (7 per cent more in
Round 1, 4 per cent more in Round 2, and 2 per cent in Round 3).

Longitudinal Teacher Education and Workforce Study (LTEWS) Final Report
60
B. Employment in schools: Longitudinal analysis
As indicated in Section 3.1.1, data from respondents who participated in more than one survey round were used to
construct three longitudinal datasets; respondents were named as Cohort 1, 2 and 3.
Cohort 1 (able to be followed from March 2012 – October 2012. N=679)
Cohort 2 (able to be followed from October 2012 – March 2013. N=1,050)
Cohort 3 (able to be followed from March 2012 – March 2013. N=544)
This section examines the employment levels of graduate teachers over time and the changes in employment
types for these respondents.
Cohort 1 (Round 1 to Round 2): Employment in schools
Figure 7 shows the 679 graduates whose teacher employment status can be followed from Round 1 to Round 2,
known as Cohort 1. It shows the changes in teaching employment status for these 679 respondents over the six-
month period from March to October 2012.
Figure 7. Cohort 1 – by employment as a teacher
In Round 1, 73 per cent of Cohort 1 is teaching at the time of data collection. In Round 2, the percentage of Cohort
1 in teaching employment rose to 87 per cent. Two per cent of Cohort 1, who had been teaching in March 2012,
was no longer teaching in October 2012, but 16 per cent of Cohort 1 without teaching positions in March had
found employment by October.
An overview of employment type for those in Cohort 1 who had teaching employment is represented in Table 25.
This table illustrates the employment type of the 71 per cent with teaching employment over the first two rounds
of surveys (See Figure 7 above).

Longitudinal Teacher Education and Workforce Study (LTEWS) Final Report
61
Table 25. Cohort 1 with a teaching position in Rounds 1 and 2 – by employment type
Employment type in Round 2
Full-time permanent
Part-time permanent
Casual
Full-time contract
Part-time contract
Total
Employment type in Round 1
Row percentages (percentage based on Round 1 activity)
Full-time permanent 88.9 2.2 1.1 7.8 0.0 100.0
Part-time permanent 5.9 47.1 17.6 11.8 17.6 100.0
Casual 0.0 2.3 59.1 21.6 17.0 100.0
Full-time contract 10.0 0.0 2.7 82.6 4.6 100.0
Part-time contract 5.4 1.8 3.6 17.9 71.4 100.0
TOTAL 22.6 2.8 13.6 46.6 14.5 100.0
Column percentages (percentage based on Round 2 activity)
Full-time permanent 75.5 15.4 1.6 3.2 0.0 19.1
Part-time permanent 0.9 61.5 4.7 0.9 4.4 3.6
Casual 0.0 15.4 81.3 8.7 22.1 18.7
Full-time contract 20.8 0.0 9.4 82.6 14.7 46.6
Part-time contract 2.8 7.7 3.1 4.6 58.8 11.9
TOTAL 100.0 100.0 100.0 100.0 100.0 100.0
The first panel presents row percentages, which are the percentages relative to Cohort 1's employment type in
Round 1. That is, taking the first percentage of employed Cohort 1 graduates with full-time permanent teaching
positions in Round 1, 89 per cent were still employed in a full-time permanent capacity six months later, in Round
2. A further 8 per cent had moved to a full-time contract position.
Similarly, of those in a full-time contract position in Round 1, 83 per cent were still employed in this capacity in
Round 2. Ten per cent of this group had moved to a full-time permanent position.
This was not the case for those with part-time permanent or casual positions in Round 1. By Round 2, 47 per cent
of those in Cohort 1 employed in a part-time permanent position had made no change. Eighteen per cent of them
were employed casually and 18 per cent on a part-time contract. For those employed in a casual position in Round
1, 59 per cent were still employed in this capacity in Round 2. Twenty-two per cent had moved to a full-time
contract and 17 per cent had moved to a part-time contract.
The second panel presents the figures as column percentages, that is, the percentages expressed in terms of
Cohort 1's employment in Round 2. Therefore, while 22.6 per cent of employed Cohort 1 were in a full-time
permanent teaching position in Round 2 (as shown in the Totals row in the first panel), 75.5 per cent had been in a
full-time permanent position in Round 1. A further 20.8 per cent of those in a full-time position in Round 2 had
been in a full-time contract position in Round 1.

Longitudinal Teacher Education and Workforce Study (LTEWS) Final Report
62
Just over 46 per cent of Cohort 1 was in full-time contract teaching positions in Round 2. Of this group, 82.6 per
cent had been in full-time contract positions in Round 1, 8.7 per cent had been employed as casual teachers, and
4.6 per cent had been in a part-time contract.
Less than three per cent of this cohort of graduates was employed in a permanent part-time role in Round 2. Just
over 61 per cent had also been in part-time permanent employment in Round 1, just over 15 per cent had been in
full-time permanent employment and the same percentage had been employed casually.
Cohort 2 (Round 2 to Round 3): Employment in schools
Figure 8 shows the 1,050 graduates whose teacher employment status can be followed from Round 2 to Round 3,
known as Cohort 2. It shows the changes in teaching employment status for these 1,050 respondents over the six-
month period from October 2012 to March 2013.
Figure 8. Cohort 2 – by employment as a teacher
In Round 2, 85 per cent of Cohort 2 was teaching. In Round 3, the percentage of Cohort 2 in teaching employment
remained steady, at 84 per cent. Seven per cent of Cohort 2 who had been teaching in October 2012 were no
longer teaching in March 2013, and six per cent without teaching in October had found employment by the
following March.
Cohort 2's employment type is represented in Table 26. This table illustrates the employment type of the 78 per
cent with teaching employment in Rounds 2 and 3.

Longitudinal Teacher Education and Workforce Study (LTEWS) Final Report
63
Table 26. Cohort 2 with a teaching position in Rounds 2 and 3 – by employment type
Employment type in Round 3
Full-time permanent
Part-time permanent
Casual
Full-time contract
Part-time contract
Total
Employment type in Round 2
Row percentages (percentage based on Round 2 activity)
Full-time permanent 97.8 0.0 0.0 1.6 0.5 100.0
Part-time permanent 15.8 68.4 5.3 10.5 0.0 100.0
Casual 4.0 2.0 54.7 26.7 12.7 100.0
Full-time contract 20.5 1.1 5.5 67.6 5.3 100.0
Part-time contract 9.7 7.5 14.0 30.1 38.7 100.0
TOTAL 33.9 3.3 14.3 39.2 9.3 100.0
Column percentages (percentage based on Round 3 activity)
Full-time permanent 66.4 0.0 0.0 0.9 1.3 23.0
Part-time permanent 1.1 48.1 0.9 0.6 0.0 2.3
Casual 2.2 11.1 70.7 12.6 25.3 18.5
Full-time contract 27.0 14.8 17.2 77.0 25.3 44.6
Part-time contract 3.3 25.9 11.2 8.8 48.0 11.5
TOTAL 100.0 100.0 100.0 100.0 100.0 100.0
The first panel presents row percentages, which are the percentages relative to Cohort 2's employment type in
Round 2. The first percentage shows that of those in Cohort 2 with full-time permanent teaching positions in
Round 2, 97.8 per cent were still employed in a full-time permanent capacity six months later, in Round 3. Just
under two per cent had moved to a full-time contract position.
Of those in a full-time contract position in Round 2, 67.6 per cent were still employed in this capacity in Round 3.
Just over 20 per cent of this group had moved to a full-time permanent position.
In the case of those with a casual position in Round 2, 54.7 per cent had made no change by Round 3, but 26.7 of
this group were in a full-time contract position and 12.7 per cent in a part-time contract role. For those employed
in a part-time permanent position in Round 2, 68.4 per cent were still employed in this capacity in Round 3. Just
under 16 per cent had moved to a full-time permanent position and just under 11 per cent into full-time contracts.
The second panel presents the figures as column percentages, that is, the percentages expressed in terms of
Cohort 2's employment in Round 3. Therefore, while 33.9 per cent of employed Cohort 2 was in a full-time
permanent teaching position in Round 3 (as shown in the Totals row in the first panel), 66.4 per cent of this group
had been in a full-time permanent position in Round 2. A further 27 per cent of those in a full-time position in
Round 3 had been in a full-time contract position in Round 2.

Longitudinal Teacher Education and Workforce Study (LTEWS) Final Report
64
Just under 40 per cent of employed Cohort 2 graduates were in full-time contract teaching positions in Round 3. Of
this group, 77 per cent had been in full-time contract positions in Round 2, 12.6 per cent had been employed as
casual teachers, and 8.8 per cent had been on a part-time contract.
Just over three per cent of employed Cohort 2 graduates were employed in a part-time permanent role in Round 3.
Just over 48 per cent had also been in part-time permanent employment in Round 2, 25.9 per cent had been in
part-time contract employment and 14.8 per cent had been in a full-time contract role.
Cohort 3 (Round 1 to Round 3): Employment in schools
Cohort 3 refers to the 544 graduates whose teacher employment status can be followed from Round 1 to Round 3.
Figure 9 shows the changes in teaching employment status for these 544 respondents over the 12-month period
from March 2012 to March 2013.
Figure 9. Cohort 3 – by employment as a teacher
In Round 1, 72 per cent of Cohort 3 was teaching. In Round 3, the percentage of Cohort 3 in teaching employment
had risen to 82 per cent. Six per cent of Cohort 3 who had been teaching in March 2012 was no longer teaching in
March 2013, but 16 per cent without teaching in early 2012 had found employment by early 2013.
Cohort 3's employment type is represented in Table 27. This table illustrates the 66 per cent employed as teachers
in Rounds 1 and 3, as shown in Figure 9 above.
Table 27. Cohort 3 with a teaching position in Rounds 1 and 3 – by employment type
Employment type in Round 3 Full-time
permanent Part-time
permanent
Casual Full-time contract
Part-time contract
Total
Employment type in Round 1

Longitudinal Teacher Education and Workforce Study (LTEWS) Final Report
65
Row percentages (percentage based on Round 1 activity)
Full-time permanent 90.0 0.0 2.9 5.7 1.4 100.0
Part-time permanent 18.2 54.5 0.0 18.2 9.1 100.0
Casual 7.7 4.6 44.6 30.8 12.3 100.0
Full-time contract 24.8 0.6 6.1 65.5 3.0 100.0
Part-time contract 12.8 7.7 5.1 23.1 51.3 100.0
TOTAL 33.1 3.7 12.3 40.9 10.0 100.0
Column percentages (percentage based on Round 3 activity)
Full-time permanent 54.3 0.0 4.7 2.8 2.9 20.0
Part-time permanent 1.7 46.2 0.0 1.4 2.9 3.1
Casual 4.3 23.1 67.4 14.0 22.9 18.6
Full-time contract 35.3 7.7 23.3 75.5 14.3 47.1
Part-time contract 4.3 23.1 4.7 6.3 57.1 11.1
TOTAL 100.0 100.0 100.0 100.0 100.0 100.0
The first panel presents row percentages, which are the percentages relative to Cohort 3's employment type in
Round 1. The first percentage shows that of those in Cohort 3 with full-time permanent teaching positions in
Round 1, 90 per cent were still employed in a full-time permanent capacity 12 months later, in Round 3. Just under
six per cent had moved to a full-time contract position and 2.9 per cent to a casual position.
Of those in a full-time contract position in Round 1, 65.5 per cent were still employed in this capacity in Round 3.
Just under 25 per cent of this group had moved to a full-time permanent position. In the case of those with a
casual position in Round 1, 44.6 per cent had made no change by Round 3, but 30.8 of this group were in a full-
time contract position and 12.3 per cent in a part-time contract role. For those employed in a part-time permanent
position in Round 1, 54.5 per cent were still employed in this capacity in Round 3. Just over 18 per cent had moved
to a full-time permanent position and the same percentage to a full-time contract position.
The second panel presents the figures as column percentages, that is, the percentages expressed in terms of
Cohort 3's employment in Round 3. Therefore, while 33.1 per cent of employed Cohort 3 graduates were in a full-
time permanent teaching position in Round 3 (as shown in the Totals row in the first panel), 54.3 per cent of this
group had been in a full-time permanent position in Round 1. A further 35.3 per cent of those in a full-time
position in Round 3 had been in a full-time contract position in Round 1.
Just over 40 per cent of employed Cohort 3 graduates were in full-time contract teaching positions in Round 3. Of
this group, 75.5 per cent had been in full-time contract positions in Round 1, 14 per cent had been employed as
casual teachers, and 6.3 per cent had been on a part-time contract.
Ten per cent of employed Cohort 3 graduates were employed in a part-time contract role in Round 3. Just over 57
per cent had also been in part-time contract employment in Round 1, 22.9 per cent had been in casual
employment and 14.3 per cent had been in a full-time contract role.
Principals’ views on employing graduates
Principals were asked in their surveys if they liked to employ graduate teachers. Their responses are shown in
Figure 10 below. In all three rounds of principal surveys, about 75 per cent of principals agreed or strongly agreed

Longitudinal Teacher Education and Workforce Study (LTEWS) Final Report
66
that they liked to employ graduate teachers. Between 18 and 20 per cent neither agreed nor disagreed, and
between five and seven per cent strongly disagreed.
Figure 10. Principals’ willingness to employ first-year graduate teachers
In many of the free text responses, principals and school leaders wrote about feeling a professional responsibility
to employ graduate teachers to provide the next generation of teachers opportunities to build their knowledge
and practices, e.g. ‘I am passionate about this profession and see it as my responsibility to assist new teachers to
grow and value add to this profession’. However, many also highlighted the need to ensure they had a balanced
staffing profile in their schools, and thus decisions about who to employ often meant ‘the best person for the job’,
and this might include consideration of experience, cultural diversity and age.
While it was noted that some graduates have ‘poor interview and (job) application skills’, graduates are regularly
seen by these principals and school leaders as enthusiastic, energetic, passionate, open to new ideas, willing to
learn, and bringing fresh ideas particularly in ICT and e-learning, as well as recent knowledge of current trends in
pedagogy. They are also seen as bringing ‘a reasonably clean slate’ able to be ‘moulded’ or ‘shaped’ to the needs
of the school, and with no need to ‘unlearn’ a suite of irrelevant habits and assumptions. While some principals
and school leaders said graduates are attractive because they are less expensive to employ, others highlighted the
financial and time burden of induction and mentoring, professional development and time release. The decision to
employ a graduate was made easier if they had seen them in the classroom and interacting with colleagues in the
school context during a final practicum or internship.
Some principals and school leaders in remote schools highlighted the fact that due to their remoteness the only
applicants for their positions are graduates, often lure by the offer of a permanent position. However, the
difficulties of these postings are also stressed, e.g. ‘In our small community it can sometimes be a difficult posting
for some teachers who have never left home before. It can be isolating if they do not engage in the community’.
Moreover, the work that the remote schools invest in the development of these new teachers often had short-
2.5 3.4 2.9 2.3 3.4 1.6
17.5 19.5
18.8
49.3 42.3 44
28.4 31.5 32.6
0%
10%
20%
30%
40%
50%
60%
70%
80%
90%
100%
Round 1 Round 2 Round 3
Strongly Agree
Agree
Neither Agree nor Disagree
Disagree
Strongly Disagree

Longitudinal Teacher Education and Workforce Study (LTEWS) Final Report
67
term benefits: ‘First year teachers are always sent out because experienced teachers are not prepared to travel
out. It takes two years for them to grow to a strong standard and [then] they transfer out. The school has to start
again with a graduate who has little teaching experience and understanding of curriculum’.
3.2.3 Graduates who did not enter teaching
This section presents data on graduates who do not enter teaching; firstly, at discrete points in time – Round 1
(March 2012), Round 2 (October 2012) and Round 3 (March 2013) – and then a longitudinal analysis of changes
over time.
Graduates without teaching employment: Discrete Points in Time
Table 28 shows the number and percentage of graduate respondents without a teaching position seeking
employment as a teacher. There were 371 graduate teachers who did not have teaching employment in Round 1.
Of these, 84 per cent were seeking a teaching position. There were 402 graduate teachers who were not employed
as a teacher in a school in Round 2, and of these, 68 per cent were seeking a teaching position. Six months later, in
Round 3, of the 352 graduate respondents without a teaching position, 62 per cent were still seeking teaching
employment.
From Round 1 to Round 2 (March to October, 2012) there were 16 per cent less unemployed graduates seeking a
teaching position. From Round 2 to Round 3 (October 2012 to March 2013) there was 4 per cent less unemployed
graduates seeking to be a teacher in a school.
Table 28. Graduate teachers without a teaching position – by seeking employment as a teacher
Round 1 Round 2 Round 3
N % N % n %
Yes 310 83.6 275 68.4 217 61.6
No 61 16.4 127 31.6 135 38.4
TOTAL 371 100.0 402 100.0 352 100.0
Graduates without teaching employment: Length of time seeking teaching work
Table 29 shows those respondents who answered 'Yes' in the table above – graduate teachers without a teaching
position and seeking employment as a teacher in a school. The table shows the length of time that these graduates
had been seeking work.
In Round 1, the highest percentage of unemployed graduates had been seeking a teaching position for between 4–
6 months (38 per cent). The Round 2 respondents had the highest percentage seeking teaching from between 1–3
months (52 per cent), then for more than 6 months (40 per cent). In Round 3, the majority of unemployed
graduates had been seeking a teaching position for more than 6 months (54 per cent), with the majority of this
group (93 out of 117, or 79 per cent) looking for more than 12 months.

Longitudinal Teacher Education and Workforce Study (LTEWS) Final Report
68
Table 29. Graduate teachers seeking employment as a teacher – by length of time seeking this employment
Round 1 Round 2 Round 3
n % n %
1-3 months 112 36.1 141 51.6 56 25.8
4-6 months 118 38.1 22 8.1 44 20.3
More than 6 months 80 25.8 110 40.3 117 54.0
[7-12 months]1 [24]
2 [11.1]
[More than 12 months] [93]2 [42.9]
TOTAL 310 100.0 273 100.0 217 100.0
Note: 1. Bracketed categories and numbers apply to Round 3 only
2. Of the number looking for work for more than 6 months (117), 79 per cent of this group had been seeking teaching
employment for more than 12 months and 21 per cent for 7-12 months.
Figure 11 shows graduates without a teaching position and the employment status of these graduates in jobs other
than school teaching. A majority of these graduates in all three rounds did have a job outside teaching, rising from
53 per cent in Round 1 to 63 per cent in Round 2, and then to 91 per cent in Round 3.
Figure 11. Graduate teachers without a teaching position – by current employment status
Graduate teachers working outside teaching – by industry sector
Table 30 shows the industry sector where the graduates without a teaching position were working at the time of
the three surveys. The largest percentage were working in the broader education sector. This is consistent in all
three rounds (43 per cent in Round 1, 34 per cent in Round 2, and 41 per cent in Round 3). Other sectors where a
high percentage of graduate teachers gained employment included Retail Trade (18 per cent in Round 1, 14 per
cent in Round 2, and 10 per cent in Round 3), and Health and Community Services (11 per cent in Round 1, 12 per
cent in Round 2, and 14 per cent in Round 3).
52.6 63.4
91.2
47.4 36.6
8.8
0%
10%
20%
30%
40%
50%
60%
70%
80%
90%
100%
Round 1 Round 2 Round 3
Employment status
Not employed
Employed
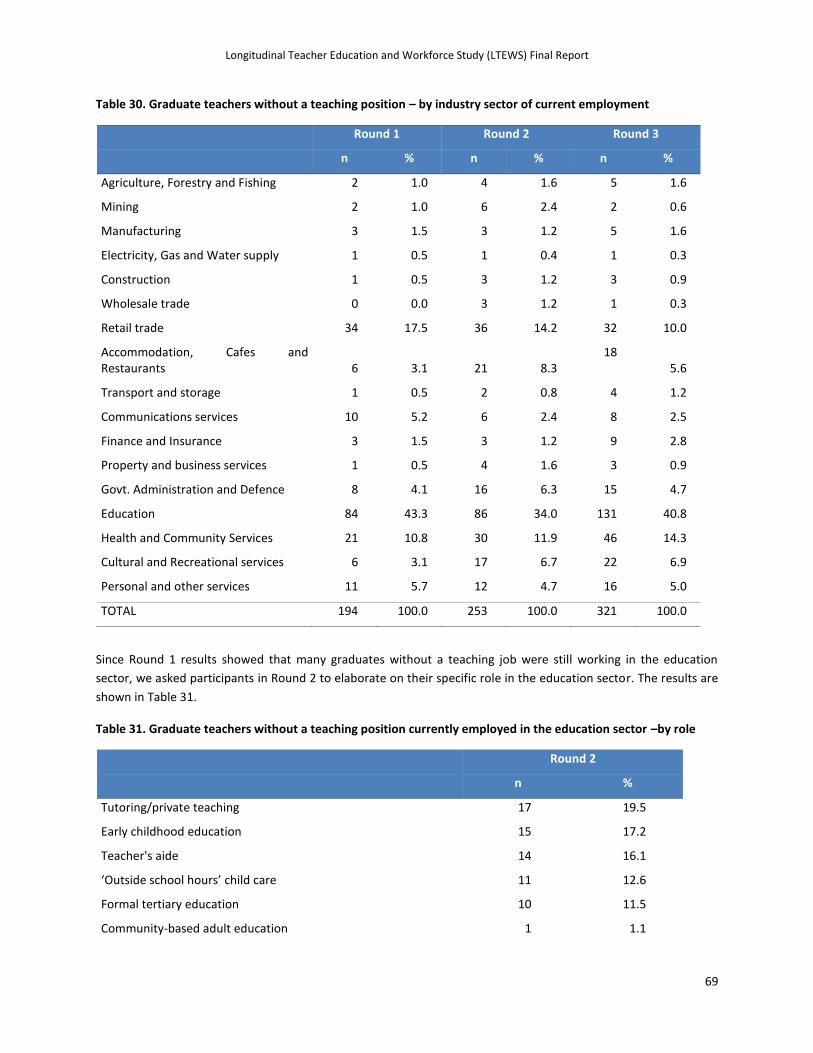
Longitudinal Teacher Education and Workforce Study (LTEWS) Final Report
69
Table 30. Graduate teachers without a teaching position – by industry sector of current employment
Round 1 Round 2 Round 3
n % n % n %
Agriculture, Forestry and Fishing 2 1.0 4 1.6 5 1.6
Mining 2 1.0 6 2.4 2 0.6
Manufacturing 3 1.5 3 1.2 5 1.6
Electricity, Gas and Water supply 1 0.5 1 0.4 1 0.3
Construction 1 0.5 3 1.2 3 0.9
Wholesale trade 0 0.0 3 1.2 1 0.3
Retail trade 34 17.5 36 14.2 32 10.0
Accommodation, Cafes and Restaurants 6 3.1 21 8.3
18 5.6
Transport and storage 1 0.5 2 0.8 4 1.2
Communications services 10 5.2 6 2.4 8 2.5
Finance and Insurance 3 1.5 3 1.2 9 2.8
Property and business services 1 0.5 4 1.6 3 0.9
Govt. Administration and Defence 8 4.1 16 6.3 15 4.7
Education 84 43.3 86 34.0 131 40.8
Health and Community Services 21 10.8 30 11.9 46 14.3
Cultural and Recreational services 6 3.1 17 6.7 22 6.9
Personal and other services 11 5.7 12 4.7 16 5.0
TOTAL 194 100.0 253 100.0 321 100.0
Since Round 1 results showed that many graduates without a teaching job were still working in the education
sector, we asked participants in Round 2 to elaborate on their specific role in the education sector. The results are
shown in Table 31.
Table 31. Graduate teachers without a teaching position currently employed in the education sector –by role
Round 2
n %
Tutoring/private teaching 17 19.5
Early childhood education 15 17.2
Teacher's aide 14 16.1
‘Outside school hours’ child care 11 12.6
Formal tertiary education 10 11.5
Community-based adult education 1 1.1

Longitudinal Teacher Education and Workforce Study (LTEWS) Final Report
70
Education administration 9 10.3
Public service 3 3.4
Education Department – Head office 1 1.1
Education Department – Regional office 1 1.1
Other 5 5.7
TOTAL 87 100.0
The highest percentage of graduates were employed as tutors, almost 20 per cent. The next most common role
was working in early childhood education (17 per cent), followed by being a teacher's aide (16 per cent), and
working in ‘outside school hours’ child care centres (13 per cent).
Graduate teachers currently working outside teaching – by employment type
Figure 12 shows the percentages for employment type for those graduates with employment outside of teaching
in a school. From March 2012 to March 2013 (Round 1 to 3) the percentage of graduate respondents with full-time
work outside of teaching rose from 27 per cent to 41 per cent. The percentage of graduates with casual work
outside of teaching fell from 47 per cent to 39 per cent.
Figure 12. Graduate teachers currently employed outside teaching in a school – by current employment type
Table 32 shows the type of employment for those employed in the three sectors with the highest percentage of
graduate teacher employment outside of teaching
26.8 40.8
26.3
20.6
46.9 38.6
0%
10%
20%
30%
40%
50%
60%
70%
80%
90%
100%
Round 1 Round 3
Employment type
Casual
Part-time
Full-time

Longitudinal Teacher Education and Workforce Study (LTEWS) Final Report
71
Table 32. Graduate teachers currently employed outside teaching in a school – by key employment sectors and current employment type
Round 1 Round 3 Employment type % %
Full-time
Retail trade 17.6 9.4
Education 22.6 65.6
Health and Community services 23.8 26.1
Part-time
Retail trade 32.4 25.0
Education 20.2 8.4
Health and Community services 38.1 26.1
Casual
Retail trade 50.0 65.6
Education 57.1 26.0
Health and Community services 38.1 47.8
In Round 1, the three industry sectors showed similar patterns for the percentage in full-time employment (from
18-24 per cent). Part-time employment was lower for those in the education sector (20 per cent) than for those in
Retail (32 per cent) and Health (38 per cent). Casual employment was highest for those in the education sector (57
per cent) and lowest for those in Health (38 per cent).
In Round 3, there was a clear difference in employment type for those in the education sector from the other two
sectors. The majority of graduates without a teaching position, employed in another capacity in the education
sector, had full-time work (66 per cent). In the Retail Trade sector, two-thirds of graduates were employed on a
casual basis. In Health and Community Services, nearly half were employed on a casual basis (48 per cent) and the
other half equally divided between full-time and part-time employment (26 per cent each).
Graduates without teaching employment: Longitudinal analysis
The numbers in each cohort who were not employed as a teacher in a school are as follows:
Cohort 1 (able to be followed from March 2012 – October 2012. N=74)
Cohort 2 (able to be followed from October 2012 – March 2013. N=92)
Cohort 3 (able to be followed from March 2012 – March 2013. N=67)
Cohort 1 (Round 1 to Round 2): Graduates without teaching employment, seeking teaching employment
Figure 13 shows the changes in the percentages of the 74 unemployed graduate teachers seeking teaching
employment in Rounds 1 or 2 (Cohort 1).

Longitudinal Teacher Education and Workforce Study (LTEWS) Final Report
72
Of Cohort 1 who had not secured a teaching position over the two rounds of surveys, there was a slight decrease in
the percentage who were seeking teaching employment – from 70 per cent in Round 1 to 68 per cent in Round 2.
Of Cohort 1 not seeking teaching employment, in Round 1 this was 30 per cent, and in Round 2 it had risen slightly
to 32 per cent. For the majority of this cohort, their inclination or disinclination to secure a teaching position had
not changed over the period of the two surveys.
Figure 13. Cohort 1 without teaching employment – by seeking teaching employment
Table 33 shows the change in outside of teaching employment status for Cohort 1 – graduate teachers who did not
have a teaching position over the two rounds of the survey.
Table 33. Cohort 1 without teaching employment – by employment outside teaching
Employed outside of teaching in Round 2 Yes No Total
Employed outside of teaching in Round 1
Row percentages (percentage based on Round 1 activity)
Yes 89.7 10.3 100.0
No 37.1 62.9 100.0
TOTAL 64.9 35.1 100.0
Column percentages (percentage based on Round 2 activity)
Yes 72.9 15.4 52.7
No 27.1 84.6 47.3
TOTAL 100.0 100.0 100.0

Longitudinal Teacher Education and Workforce Study (LTEWS) Final Report
73
The first panel presents row percentages, which are the percentages relative to Cohort 1's employment outside of
teaching in Round 1. The table shows that of those with a job outside teaching in Round 1, 89.7 per cent still had a
job outside of teaching in Round 2. The first panel also shows that of those who were unemployed in Round 1, 62.9
per cent were still unemployed in Round 2.
The second panel presents the figures as column percentages, that is, the percentages expressed in terms of
Cohort 1's employment outside teaching in Round 2. The table shows that of those with a job outside teaching in
Round 2, 72.9 per cent had a job outside of teaching earlier in the year, in Round 1. The second panel also shows
that of those who were unemployed in Round 2, 84.6 per cent were unemployed in Round 1.
Cohort 2 (Round 2 to Round 3): Graduates without teaching employment, seeking teaching employment
The following table shows the changes in the percentages of the 92 graduates (Cohort 2) seeking teaching
employment. This group of graduates were not employed in Rounds 2 or 3.
Figure 14. Cohort 2 without teaching employment – by seeking teaching employment
For Cohort 2, there was a fall in the percentage of graduates who were seeking teaching employment – from 67
per cent in Round 2 to 61 per cent in Round 3. In Round 2, 33 per cent of Cohort 2 were not seeking employment
but this had risen to 39 per cent by Round 3. For the majority of this cohort, their inclination or disinclination to
secure a teaching position did not change over the period of six months in Round 2.
Table 34 shows the change in employment status for Cohort 2 who did not have a teaching position over the two
rounds of the survey, Rounds 2 and 3.
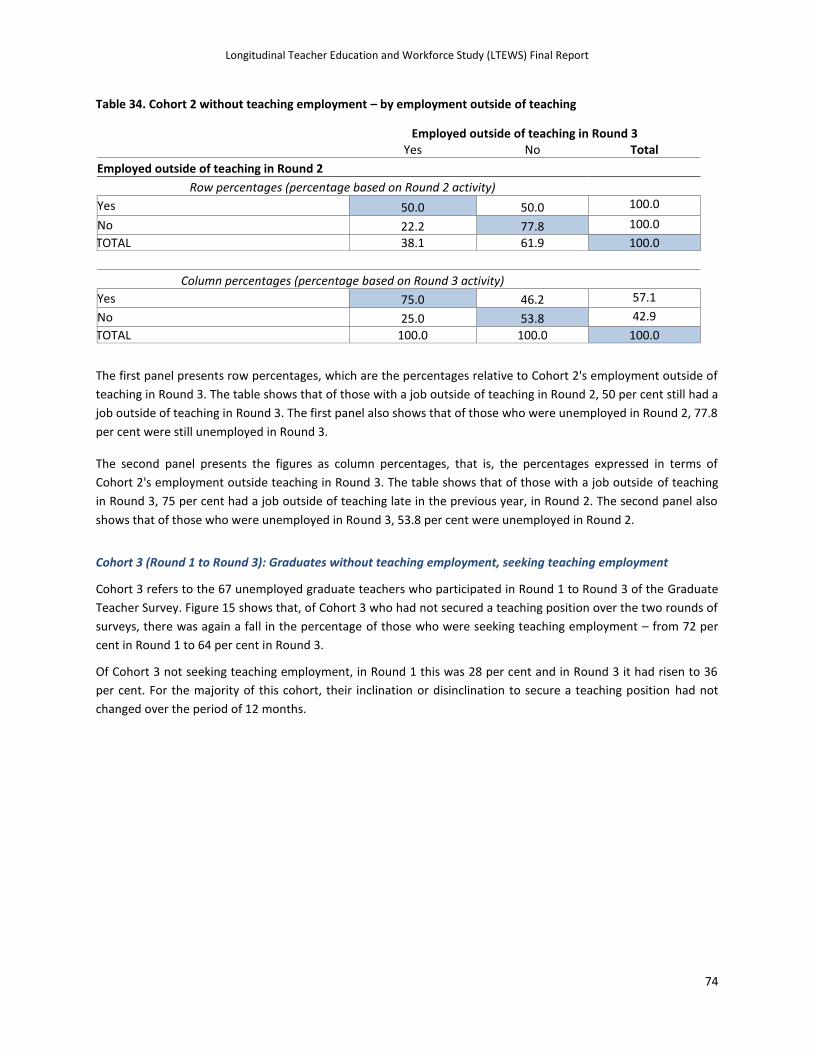
Longitudinal Teacher Education and Workforce Study (LTEWS) Final Report
74
Table 34. Cohort 2 without teaching employment – by employment outside of teaching
Employed outside of teaching in Round 3 Yes No Total
Employed outside of teaching in Round 2
Row percentages (percentage based on Round 2 activity)
Yes 50.0 50.0 100.0
No 22.2 77.8 100.0
TOTAL 38.1 61.9 100.0
Column percentages (percentage based on Round 3 activity)
Yes 75.0 46.2 57.1
No 25.0 53.8 42.9
TOTAL 100.0 100.0 100.0
The first panel presents row percentages, which are the percentages relative to Cohort 2's employment outside of
teaching in Round 3. The table shows that of those with a job outside of teaching in Round 2, 50 per cent still had a
job outside of teaching in Round 3. The first panel also shows that of those who were unemployed in Round 2, 77.8
per cent were still unemployed in Round 3.
The second panel presents the figures as column percentages, that is, the percentages expressed in terms of
Cohort 2's employment outside teaching in Round 3. The table shows that of those with a job outside of teaching
in Round 3, 75 per cent had a job outside of teaching late in the previous year, in Round 2. The second panel also
shows that of those who were unemployed in Round 3, 53.8 per cent were unemployed in Round 2.
Cohort 3 (Round 1 to Round 3): Graduates without teaching employment, seeking teaching employment
Cohort 3 refers to the 67 unemployed graduate teachers who participated in Round 1 to Round 3 of the Graduate
Teacher Survey. Figure 15 shows that, of Cohort 3 who had not secured a teaching position over the two rounds of
surveys, there was again a fall in the percentage of those who were seeking teaching employment – from 72 per
cent in Round 1 to 64 per cent in Round 3.
Of Cohort 3 not seeking teaching employment, in Round 1 this was 28 per cent and in Round 3 it had risen to 36
per cent. For the majority of this cohort, their inclination or disinclination to secure a teaching position had not
changed over the period of 12 months.

Longitudinal Teacher Education and Workforce Study (LTEWS) Final Report
75
Figure 15. Cohort 3 without teaching employment – by seeking teaching employment
Table 35 shows the change in employment status for Cohort 3 who did not have a teaching position over the two
rounds of the survey.
Table 35. Cohort 3 without teaching employment – by employment outside of teaching
Employed outside of teaching in Round 3 Yes No Total
Employed outside of teaching in Round 1
Row percentages (percentage based on Round 1 activity)
Yes 57.8 42.2 100.0
No 28.0 72.0 100.0
TOTAL 42.1 57.9 100.0
Column percentages (percentage based on Round 2 activity)
Yes 65.0 34.5 47.4
No 35.0 65.5 52.6
TOTAL 100.0 100.0 100.0
The first panel presents row percentages, which are the percentages relative to Cohort 1's employment outside of
teaching in Round 1. The table shows that of those with a job outside teaching in Round 1, 57.8 per cent still had a
job outside of teaching in Round 3. The first panel also shows that of those who were unemployed in Round 1, 72
per cent were still unemployed in Round 3. This is a higher percentage than for the other two cohorts, and it
measures a 12-month period, whereas the other two cohort datasets are measured over six month periods. The
second panel presents the figures as column percentages, that is, the percentages expressed in terms of Cohort 3's
employment outside of teaching in Round 3. The table shows that of those with a job outside teaching in Round 3,
65 per cent had a job outside of teaching in the previous year, in Round 1. The second panel also shows that of
those who were unemployed in Round 3, 65.5 per cent were unemployed in Round 1.

Longitudinal Teacher Education and Workforce Study (LTEWS) Final Report
76
3.3 Teacher Mobility
This section addresses the issue of teacher mobility, first, by briefly defining this phenomenon and then by looking
at the types and causes of early career teacher movement revealed by this study. Teacher mobility has received
more comprehensive attention only recently in a broader attempt to understand and manage teacher turnover.
Previous large-scale studies into the teaching workforce have captured some key mobility patterns relevant to this
study. For example, McKenzie et al. (2011) explored career paths in teaching and reported that 40 per cent of
primary teachers and 36 per cent of secondary teachers surveyed in 2010 spent less than two years at their first
school (as compared to 42 per cent and 40 per cent in 2007 respectively). On average, movers spent about 3 years
in their first school, with only 5 per cent spending more than 10 years at their first school. They also looked at the
patterns of teacher mobility across school sectors, states and in/outside metropolitan cities. In comparison to
2007, movement between sectors appears to have slowed in 2010, with 81 per cent of primary teachers and 67
per cent of secondary teachers working in the same sector as their first school (71 per cent of primary and 60 per
cent of secondary in 2007).
Similarly, there was some decrease in moving away from government schools from 20 per cent in 2007 to 13 per
cent in primary in 2010 and from 28 per cent to 22 per cent in secondary. The data showed that about 80 per cent
of teachers who had moved schools were teaching in the same state or territory as their first school. Compared to
2007, a higher percentage of primary teachers began teaching in a school outside of a capital city (61 per cent in
2010, 55 per cent in 2007).
Mobility and attrition, according to Imazeki (2005), are the biggest challenges that many education systems face.
Ingersoll (2004) estimated that both types of teacher turnover have approximately the same percentage in the
USA. It has been recognised that teacher turnover has both significant financial and education implications and, in
particular, the attrition of beginning teachers (Darling-Hammond, 2003; Imazeki, 2005). Early attrition and mobility
have an impact on education quality in certain schools (e.g. disadvantaged, rural and remote), as well as affecting
school staffing more broadly. In both cases teachers need to be replaced. However, mobility has a more direct
impact on schools than on systems, and hence is a less problematic issue for governments.
From the point of view of school administration, teachers who move to another school, system or place pose
various retention and turnover issues. From the perspective of state or federal governments, movers are not
leaving the profession and thus do not contribute to overall teacher shortages. Therefore, if movers are not
considered and examined along with leavers, total teacher turnover appears far less problematic than it is for
those viewing this issue from a school management perspective (R. Ingersoll, 2004).
In relation to early career teachers, (Cochran-Smith, 2004, p.846) argue that stayers and leavers are not a
homogenous group: ‘rather there are multiple variations of practice-coupled-with-career decisions, some of which
are desirable and some are not.’ Some attrition is desirable, for example if beginning teachers perceive
themselves, or are perceived by others, as not well-suited to teaching, but some attrition is not (e.g. the attrition
of highly-qualified graduates).
Some attrition is temporary (e.g. teachers leaving to complete a post-graduate degree, raise a family, or take a
long period of leave before returning to teach), and some is inevitable (e.g. teachers retiring). Teacher mobility,
however, is related more to workplace issues such as student discipline problems, lack of support and mentoring
arrangements, poor working conditions, conflicts with administration, lack of participatory opportunities in school
decision-making and governance (Cochran-Smith, 2004; Darling-Hammond, 2003; R. Ingersoll, 2004).

Longitudinal Teacher Education and Workforce Study (LTEWS) Final Report
77
LTEWS and the analysis discussed in this section explores the mobility of graduates across only one year and so
drawing similar generalisations about the patterns of mobility is not feasible.
Box 3 lists the main findings for Section 3.3.
Box 3. Main Findings: Teacher mobility
Most graduate teachers stayed to teach in the state/territories in which they completed their teacher preparation. For example, most of the graduates of teacher education programs in New South Wales, Victoria, Queensland and South Australia were employed in those states, and at the end of the data collection period, about 85 per cent of graduates in these four states had been teaching there for more than one year.
Thirty-two per cent of graduates taught in schools in areas where they lived prior to entering the university program and 68 per cent taught in schools that were located in other suburbs or areas.
Two-thirds reported teaching in schools located in areas with a similar population size, socio-economic size, socio-economic and cultural diversity profile as that in which they lived prior to their teacher preparation.
Of those who were employed as a teacher early in their first year after graduation, 57 per cent of them remained employed in the same school 12-months later, early in their second year. Twenty per cent of these graduate teachers moved to another school usually to secure full-time, often more permanent employment. Other reasons included lack of support in their initial school and family/personal reasons.
How mobile are graduates in their early teaching career?
Table 36 shows the movement of graduates from Round 1 to Round 2, across states and territories. The total
number of graduates who had teaching positions at both points-in-time, and who could be tracked across the two
survey rounds (a six-month period) numbered 458.
Table 36. Graduate mobility between schools from Round 1 to Round 2 – state/territory
Round 2
NSW VIC QLD SA WA TAS NT ACT
Outside
Aus Total
Round 1
NSW 96.9 0.0 2.0 0.0 0.0 0.0 0.0 0.0 1.0 100.0
VIC 0.0 100.0 0.0 0.0 0.0 0.0 0.0 0.0 0.0 100.0
QLD 0.0 0.0 98.0 0.0 0.0 0.0 1.0 0.0 1.0 100.0
SA 0.0 0.0 0.0 100.0 0.0 0.0 0.0 0.0 0.0 100.0
WA 0.0 0.0 0.0 0.0 100.0 0.0 0.0 0.0 0.0 100.0
TAS 0.0 0.0 0.0 0.0 0.0 100.0 0.0 0.0 0.0 100.0
NT 0.0 0.0 0.0 0.0 0.0 0.0 100.0 0.0 0.0 100.0
ACT 0.0 0.0 0.0 0.0 0.0 0.0 0.0 100.0 0.0 100.0
O/Aust. 14.3 0.0 0.0 0.0 0.0 0.0 0.0 0.0 85.7 100.0
Note: n=458

Longitudinal Teacher Education and Workforce Study (LTEWS) Final Report
78
The table shows that for those graduates with teaching positions in Round 1 in Victoria, SA, WA, Tasmania, the
Northern Territory and the ACT, all of them were still in that same state or territory in Round 2. There was a small
percentage of change from Round 1 to Round 2 for NSW, with two per cent going to Queensland and one per cent
obtaining an overseas teaching position. For Round 1 graduates from Queensland, 98 per cent were still in
Queensland in Round 2, one per cent moved to a school in the Northern Territory and one per cent overseas. As
the numbers represented in each cell in the table above are very small, the small percentage of graduates who
have moved actually totals less than ten, so these state/territory changes should be treated with caution. Overall,
the data shows that nearly all graduates did not move state/territory between the beginning and the end of their
first year in teaching.
Table 37 shows the movement of graduates from time two (Round 2) to time three (Round 3) across states and
territories. The total number of graduates who had teaching positions at both points in time and who could be
tracked across the two survey rounds (a six month period) numbered 819.
Table 37. Graduate mobility between schools from Round 2 to Round 3 – by state/territory
Round 3
NSW VIC QLD SA WA TAS NT ACT
Outside Aust.
Total
Round 2
NSW 96.7 0.7 0.0 0.0 0.0 0.0 0.7 0.7 1.3 100.0
VIC 0.0 99.3 0.0 0.0 0.0 0.0 0.0 0.0 0.7 100.0
QLD 0.0 0.5 98.9 0.0 0.0 0.5 0.0 0.0 0.0 100.0
SA 0.0 0.0 0.0 94.1 0.0 0.0 2.9 0.0 2.9 100.0
WA 0.0 0.0 0.0 0.0 100.0 0.0 0.0 0.0 0.0 100.0
TAS 0.0 0.0 0.0 0.0 0.0 100.0 0.0 0.0 0.0 100.0
NT 0.0 0.0 0.0 0.0 3.1 0.0 93.8 3.1 0.0 100.0
ACT 0.0 0.0 0.0 0.0 0.0 0.0 0.0 97.6 2.4 100.0
O/Aust. 0.0 0.0 6.7 0.0 0.0 0.0 0.0 0.0 93.3 100.0
Note: n=819
The table shows that for those graduates with teaching positions in Round 2 in WA and Tasmania, there was no
movement between states in Round 3. There was less than a four per cent change from Round 2 to Round 3 for
graduate teachers in NSW, Victoria, Queensland and ACT. Of the graduates teaching in South Australian in Round
2, 2.9 per cent were in the Northern Territory in Round 3 and 2.9 per cent had a teaching position overseas. Of the
graduates teaching in the Northern Territory in Round 2, 3.1 per cent were teaching in WA in Round 3 and 3.1 per
cent in the ACT. Graduates who were teaching overseas in Round 2 showed the greatest mobility, with 6.7 per cent
changing their location from Round 2 to Round 3 – all these graduates were in Queensland in Round 3. Overall, the
data shows that nearly all graduates did not move state/territory between the end of their first year and the
beginning of their second year in teaching.
Table 38 below shows the movement of graduates from Round 1 to Round 3, across states and territories. The
total number of graduates who had teaching positions at both points in time and who could be tracked across the
two survey rounds (a 12-month period) numbered 354.

Longitudinal Teacher Education and Workforce Study (LTEWS) Final Report
79
Table 38. Graduate mobility between schools from Round 1 to Round 3 – state/territory
Round 3
NSW VIC QLD SA WA TAS NT ACT
Outside Aust.
Total
Round 1
NSW 94.8 0.0 2.6 0.0 0.0 0.0 0.0 0.0 2.6 100.0
VIC 0.0 100.0 0.0 0.0 0.0 0.0 0.0 0.0 0.0 100.0
QLD 0.0 1.1 97.9 0.0 0.0 0.0 1.1 0.0 0.0 100.0
SA 0.0 0.0 0.0 100.0 0.0 0.0 0.0 0.0 0.0 100.0
WA 0.0 0.0 0.0 0.0 100.0 0.0 0.0 0.0 0.0 100.0
TAS 0.0 0.0 0.0 0.0 0.0 100.0 0.0 0.0 0.0 100.0
NT 0.0 0.0 0.0 0.0 7.1 0.0 92.9 0.0 0.0 100.0
ACT 0.0 0.0 0.0 0.0 0.0 0.0 0.0 100.0 0.0 100.0
O/Aus 0.0 0.0 0.0 0.0 0.0 0.0 0.0 0.0 100.0 100.0
Note: n=354
The table shows that for those graduates with teaching positions in Round 1 in Victoria, SA, WA, Tasmania and the
ACT there was no movement between states in Round 3. The number of graduates who did change schools across
states and territories in the 12-month period was less than 10, so overall nearly all graduates remained in the same
state/territory from the beginning of their first year of teaching to the beginning of their second year.
Discrete point-in-time of graduate teachers with a teaching position – by characteristics of school location:
Round 3 (March 2013)
In Round 3, graduate respondents with a teaching position were asked for some information about the area in
which their school was located. They were asked if they were teaching in a school where they had lived prior to
enrolling in their teacher education program. They were also asked if they had lived in an area similar to where
their current school was located in terms of: population size, socio-economic make-up, and cultural diversity.
Graduate responses are shown in Table 39.
Table 39. Graduates with a teaching position in Round 3 – by characteristics of school location
Yes No Total Lived in: n % n %
The suburb/town where your school is located 578 32.2 1,219 67.8 1,797 100.0 Similar population size 1,161 64.6 636 35.4 1,797 100.0 Similar socio-economic make-up 1,120 62.3 677 37.7 1,797 100.0 Similar cultural diversity 1,118 62.2 679 37.8 1,797 100.0
The data show that 32 per cent of graduates taught in schools in the area where they had lived prior to entering
their teacher education program. Sixty-eight per cent taught in schools that were located in other suburbs or
areas. This pattern reflects their geographic preferences as graduate teachers and the availability of jobs.
Graduates decided to move to other geographic areas or schools for a wide range of reasons. These reasons are
discussed in more details the following sections (See Section 3.5). When looking at graduates' schools with similar
location characteristics to where graduates had lived prior to their teacher education program, two-thirds of

Longitudinal Teacher Education and Workforce Study (LTEWS) Final Report
80
graduates stated that they were in areas with similar population size, socio-economic make-up, or cultural
diversity.
Longitudinal analysis of teacher mobility
The following tables show information from graduates who responded to more than one Graduate Teacher Survey.
As outlined in Chapter 2, these respondents formed three cohorts for the purpose of data analysis and are grouped
as follows:
Cohort 1 (able to be followed from March 2012 – October 2012)
Cohort 2 (able to be followed from October 2012 – March 2013)
Cohort 3 (able to be followed from March 2012 – March 2013)
Cohort 1 (Round 1 to Round 2): Mobility between schools
Table 40 shows all Cohort 1 respondents who indicated whether or not they were currently teaching in the Round
1 survey. As can be seen from the totals at the bottom, there were 499 respondents who were teaching and 186
respondents without a teaching position in Round 1. The data are based on teaching status and the name of the
school given by respondents in each round. The rows in the table show where Cohort 1 respondents were in
Round 2, in terms of teaching employment and movement between schools.
Table 40. Cohort 1 mobility between schools
Employment in Round 1 Teaching Not teaching All
n % n % n %
Employment in Round 2 Same school 377 75.6 377 55.0 Different school 65 13.0 65 9.5 Newly employed 68 36.6 68 9.9 No longer employed 15 3.0 15 2.2 Not teaching 72 38.7 72 10.5 Insufficient information 42 7.2 46 24.7 88 12.8
TOTAL 499 100.0 186 100.0 685 100.0
It can be seen that of those who were employed as a teacher in Round 1, 75.6 per cent were still in the same
school six months later. Thirteen per cent had moved to a different school over this period and 3 per cent were no
longer teaching (and therefore did not have a school).
For those who were not employed as a teacher in Round 1, 36.6 per cent had gained teaching employment by
Round 2 and 38.7 per cent were still not employed as a teacher. Just under a quarter of Cohort 1 who were not
employed in Round 1 had named schools that were not able to be matched to the school data provided by the
former Department of Education Employment and Workplace Relations-DEEWR.
Cohort 2 (Round 2 to Round 3): Mobility between schools
Table 41 below shows Cohort 2 respondents who indicated whether they were currently teaching in the Round 2
survey. As can be seen from the totals, there were 894 respondents who were teaching and 156 respondents
without a teaching position in Round 2. The rows in the table show where Cohort 2 respondents were in Round 3,
in terms of teaching employment and movement between schools.

Longitudinal Teacher Education and Workforce Study (LTEWS) Final Report
81
Table 41. Cohort 2 mobility between schools
Employment in Round 2 Teaching Not teaching All
n % n % n %
Employment in Round 3 Same school 496 55.5 496 47.2 Different school 164 18.3 164 15.6 Newly employed 46 29.5 46 4.4 No longer employed 50 5.6 50 4.8 Not teaching 92 59.0 92 8.8 Insufficient information 184 20.6 18 11.5 202 19.2
TOTAL 894 100.0 156 100.0 1,050 100.0
Of those who were employed as a teacher in Round 2, 55.5 per cent were still in the same school six months later.
For Cohort 2, these six months ran from the end of the school year in 2012 to early in the school year in 2013.
Because of this, it is to be expected that the movement between schools for Cohort 2 will be higher than for
Cohort 1, and it is: 18. 3 per cent had changed schools compared to 13.0 per cent of Cohort 1. Just under 6 per
cent were no longer teaching and there was insufficient information for just over 20 per cent of Cohort 2 who were
teaching in Round 2. For those who were not employed as a teacher in Round 2, 29.5 per cent had gained teaching
employment by Round 3 and 59.0 per cent were still not employed as a teacher.
For all of Cohort 2 who could be tracked in terms of school employment and/or school name, at the time of Round
3, 47.2 per cent were still in the same school as they had been in Round 2, 15.6 per cent had moved to a different
school, 4.4 per cent had gained employment as a teacher, 4.8 per cent had left teaching and 8.8 per cent were not
teaching in Round 2 or Round 3.
Cohort 3 (Round 1 to Round 3): Mobility between schools
Table 42 shows all Cohort 3 respondents who indicated whether or not they were currently teaching in the Round
1 survey. As can be seen from the totals, there were 392 respondents who were teaching and 152 respondents
without a teaching position in Round 1. The rows in the table show where Cohort 3 respondents were in Round 3,
in terms of teaching employment and movement between schools.
Table 42. Cohort 3 mobility between schools
Employment in Round 1 Teaching Not teaching All
n % n % n %
Employment in Round 3 Same school 224 57.1 224 41.2 Different school 78 19.9 78 14.3 Newly employed 60 11.0 No longer employed 29 7.4 60 39.5 29 5.3 Not teaching 64 42.1 64 11.8 Insufficient information 61 15.6 28 18.4 153 16.4
TOTAL 392 100.0 152 100.0 608 100.0
Of those who were employed as a teacher in Round 1, 57.1 per cent were still in the same school 12-months later.
Just under 20 per cent had moved to a different school over this period and 7.4 per cent were no longer teaching
Longitudinal Teacher Education and Workforce Study (LTEWS) Final Report
82
(and therefore did not have a school). For those who were not employed as a teacher in Round 1, 39.5 per cent
had gained teaching employment by Round 3 and 42.1 per cent were still not employed as a teacher.
For all of Cohort 3 who could be tracked in terms of school employment and/or school name, at the time of Round
3, 41.2 per cent were still in the same school as they had been in Round 1, 14.3 per cent had moved to a different
school, 11.0 per cent had gained employment as a teacher over the 12 month period, 5.3 per cent had left
teaching and 11.85 per cent were not teaching in Round 1 or Round 3.
In more general terms, the analysis of the qualitative data demonstrates that the main reason for teacher mobility
revealed in this study, was better employment opportunities. Most of the movers were employed on short-term
contracts or in casual relief positions and moved to different schools, systems or geographic areas as soon as they
secured full-time positions. Based on the interviews data, 40 per cent of the respondents (N=33) who participated
in all three interview rounds remained on short-term contracts or casual relief positions by the third round of
interviews, conducted within 12-months over two calendar years.
The data also show that a majority of early career teachers remained on short-term contracts, and this will
continue to be the major cause of mobility and teacher turnover in the future. This pattern of beginning teacher
mobility is reflective of the marketplace and system changes that have reduced demand for teachers in certain
geographic areas and prompted different recruitment patterns. The following graduate teacher’s reflection echoed
that of several others who have made, or are considering, the option to move interstate or overseas for better
teaching prospects.
All my efforts to find permanent employment as a secondary school teacher in my field have failed. I have been either unemployed or a casual teacher for over a year and a half and it is very frustrating. I am now seeking work with NGOs and considering moving overseas so that I can work as a teacher.
Graduate teacher, casual relief teaching, metropolitan area
From the interviews and survey free text responses, both graduate teachers and principals attribute the difficulty
in finding employment to the perceived overproduction of teachers and the lack of full-time jobs (‘there are too
many graduates for primary teachers, and not enough jobs’). Contributing factors in this regard are retirement
delays, an ‘out of service’ pool of teachers, public sector cutbacks (e.g. freezing salaries), affordability of private
education, etc. As some studies of teacher employability show, the supply of new teachers is closely affected by
the economic cycle. However, it does not reflect the cycle directly but rather lags behind it, contributing to some
increase in teacher casualization or unemployment when the economy starts to perform better. The interview and
free text responses illustrate four types of mobility (See Box 4).
Respondents to the survey indicated that many were employed as replacement teachers filling short-term
vacancies. The age-profile of the teaching profession, and consequently both retirement levels and maternity
leave, either temporary or semi-permanent, affect the demand for replacement teachers. Another reason is the
uneven level of economic activity in urban and rural locations that creates an over-supply of teachers in some
geographical areas and an undersupply in others. The interplay of such factors was mentioned by participants in
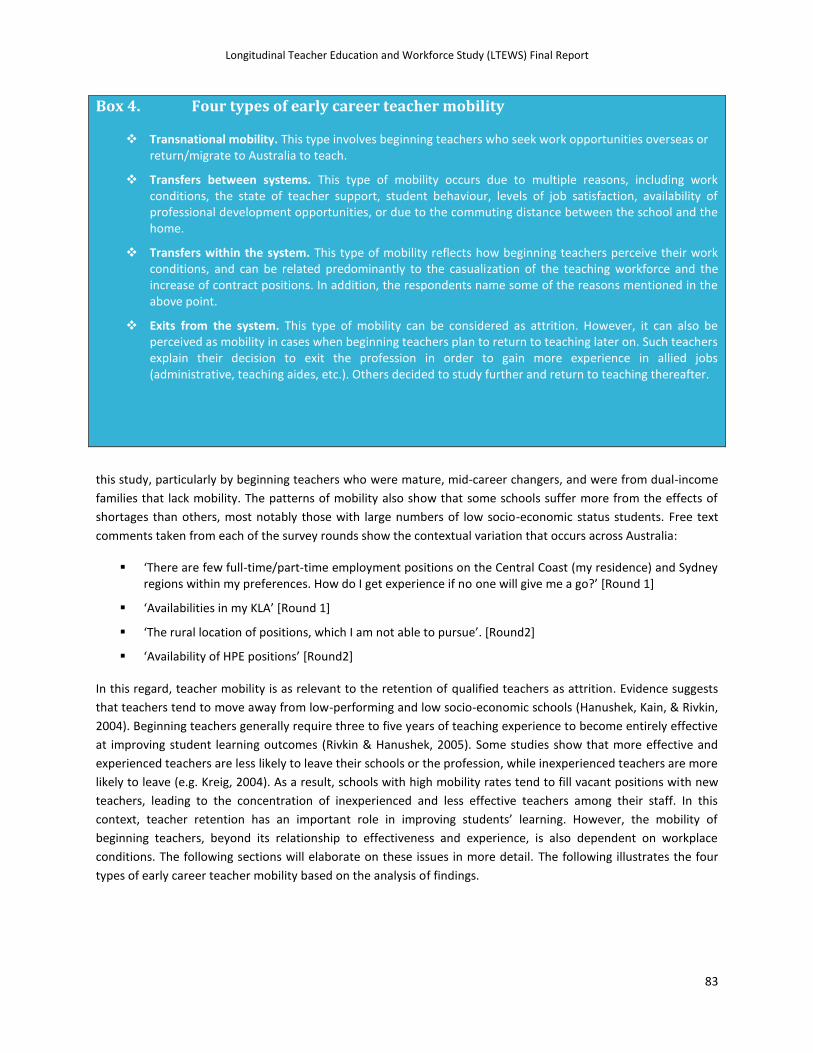
Longitudinal Teacher Education and Workforce Study (LTEWS) Final Report
83
Box 4. Four types of early career teacher mobility
Transnational mobility. This type involves beginning teachers who seek work opportunities overseas or return/migrate to Australia to teach.
Transfers between systems. This type of mobility occurs due to multiple reasons, including work conditions, the state of teacher support, student behaviour, levels of job satisfaction, availability of professional development opportunities, or due to the commuting distance between the school and the home.
Transfers within the system. This type of mobility reflects how beginning teachers perceive their work conditions, and can be related predominantly to the casualization of the teaching workforce and the increase of contract positions. In addition, the respondents name some of the reasons mentioned in the above point.
Exits from the system. This type of mobility can be considered as attrition. However, it can also be perceived as mobility in cases when beginning teachers plan to return to teaching later on. Such teachers explain their decision to exit the profession in order to gain more experience in allied jobs (administrative, teaching aides, etc.). Others decided to study further and return to teaching thereafter.
this study, particularly by beginning teachers who were mature, mid-career changers, and were from dual-income
families that lack mobility. The patterns of mobility also show that some schools suffer more from the effects of
shortages than others, most notably those with large numbers of low socio-economic status students. Free text
comments taken from each of the survey rounds show the contextual variation that occurs across Australia:
‘There are few full-time/part-time employment positions on the Central Coast (my residence) and Sydney regions within my preferences. How do I get experience if no one will give me a go?’ [Round 1]
‘Availabilities in my KLA’ [Round 1]
‘The rural location of positions, which I am not able to pursue’. [Round2]
‘Availability of HPE positions’ [Round2]
In this regard, teacher mobility is as relevant to the retention of qualified teachers as attrition. Evidence suggests
that teachers tend to move away from low-performing and low socio-economic schools (Hanushek, Kain, & Rivkin,
2004). Beginning teachers generally require three to five years of teaching experience to become entirely effective
at improving student learning outcomes (Rivkin & Hanushek, 2005). Some studies show that more effective and
experienced teachers are less likely to leave their schools or the profession, while inexperienced teachers are more
likely to leave (e.g. Kreig, 2004). As a result, schools with high mobility rates tend to fill vacant positions with new
teachers, leading to the concentration of inexperienced and less effective teachers among their staff. In this
context, teacher retention has an important role in improving students’ learning. However, the mobility of
beginning teachers, beyond its relationship to effectiveness and experience, is also dependent on workplace
conditions. The following sections will elaborate on these issues in more detail. The following illustrates the four
types of early career teacher mobility based on the analysis of findings.

Longitudinal Teacher Education and Workforce Study (LTEWS) Final Report
84
3.4 Attraction, Retention and Attrition
I think that one of the things that attracted me to teaching was that I feel that it’s an undervalued thing. To be a really excellent teacher is one of the most skilled jobs and so I really was attracted to teaching, because I saw it as that ultimate challenge and I still want to do that, and I try and – even though I get frustrated with this sort of relief stage, I try and focus on the positives that come from it – being in a range of classrooms and a range of schools and things like that – and try and not get too frustrated with the negative side of it. I do have a very strong sense that if I was to do teaching, that it would be a big commitment, and that I wouldn’t want to do just a good enough job, that I’d want to experience – work towards being an excellent teacher.
Graduate teacher, trained in speech pathology, casual relief teaching in a primary school
This section discusses attraction to teaching, and retention and attrition in the early years of teaching. Section
3.4.1 examines graduate teachers’ attraction to join the teaching profession. Section 3.4.2 discusses the retention
and attrition patterns of teachers, followed by Section 3.4.3 on the reasons why graduate teachers leave teaching
in their early years. In this study, attrition is defined as not continuing in a teaching position.
Teaching remains a ‘revolving door’ (R. M. Ingersoll, 2001) with high mobility and exit numbers for its newest and
most vulnerable entrants. Ingersoll & Perda (2010) reported that in the US between 40 to 50 per cent of those
entering teaching leave within 5 years. In 2007, the attrition of Australian early career teachers was reported to be
as high as 25 per cent (House of Representatives Standing Committee on Education and Vocational Training, 2007).
The attraction to a career in teaching has altered little over time. Those who teach and those who are attracted to
teaching report that they aspire to the intellectual fulfilment and contribution to society provided by employment
in a helping profession. Intrinsic and personal values such as being a positive role model, enjoying children and
young people, wanting to make a difference and a strong commitment to social justice principles are common
reasons stated for wanting, or continuing, to be a member of the teaching profession (see for example, Richardson
& Watt, 2006).
Ashiedu and Scott-Ladd (2012) reported on a survey of teachers carried out in 2002 by Australia’s Ministerial
Council on Education Employment Training and Youth Affairs found that approximately 31 per cent of the
respondents enjoyed working with children, 22 per cent had a desire to teach, and 11.5 per cent were attracted
through a recruitment campaign or the positive impact of a role model. A further 8.6 per cent were attracted to
the employment conditions and 8.3 per cent had a desire to make a difference or were attracted because of the
value of education and care for students.
Box 5 lists the main findings for Section 3.4.

Longitudinal Teacher Education and Workforce Study (LTEWS) Final Report
85
Box 5. Main Findings: Attraction, retention and attrition
Graduates wanted a teaching career for altruistic reasons. Approximately 90 per cent of the graduate teachers joined teaching ‘wanting to make a difference’ and more than 70 per cent indicated that they ‘Always wanted to teach/work with children’. About 70 per cent also highlighted that they wanted to work in their areas of specialisation or interest. Very few saw teaching as a ‘backup plan’ or entered teacher education just because their ATAR score was sufficient.
Overall, attrition of graduates from teaching (i.e. leaving/ not continuing in a teaching position) was 7 per cent over the data collection period.
The retention rate was 75 per cent, with almost 100 per cent retention in the Northern Territory. Those teachers had also completed their teacher education program in the Northern Territory. The ACT and Tasmania had the highest attrition rates.
In terms of geographical areas, the highest attrition rate occurred in schools in outer regional areas, followed by very remote schools. Attrition was lower than average in Aboriginal and Torres Strait Islander Focus schools. In addition, even though the actual numbers were very small, it is worth noting that by comparison with schools in major cities as well as inner and outer regional areas, schools in remote and very remote areas showed a higher retention rate over the 12-month period.
Overall, the highest attrition rate over the 12 months was in secondary schools. According to principals, schools were attractive to new graduates when they offered better location and
accessibility, reputation for performance or use of technologies, newer facilities, and partnership arrangements with universities.
Principals in metropolitan schools reported the least difficulty retaining graduates, while those in remote locations had the most difficulty retaining them with the exception of Northern Territory.
More than 82 per cent principals planned to keep some or all of their graduate teachers. Less than 11 per cent stated that they would not wish to continue to employ them.
Principals reported that the most common form of school support provided to new graduate teachers was ongoing professional learning opportunities. Graduates considered this type of support was the most effective to them as an early career teacher, followed by an informal mentor arrangement. However, it is also worth noting that while more than 97 per cent of principals identified induction programs as available in their schools at all three survey points, 20-26 per cent of graduate teachers identified this as not available at the same points in time.

Longitudinal Teacher Education and Workforce Study (LTEWS) Final Report
86
3.4.1 Attraction to teaching
The table below shows attraction to teaching for graduate respondents in the three Graduate Teacher Surveys.
Respondents were asked to indicate their level of agreement with twelve statements about what attracted them
to teaching. Their responses were recorded on a five-point Likert scale, ranging from: strongly agree, agree, neither
agree nor disagree, to disagree and strongly disagree. Table 43 positive responses (agree and strongly agree) and
negative responses (disagree and strongly disagree) have been grouped, and those who neither agreed nor
disagreed have been omitted. This shows, in a clear way, the differences of agreement to statements in the list.
Table 43. Graduate teachers – by reasons for wanting to become a teacher
Round 1 Round 2 Round 3
A/SA D/SD A/SA D/SD A/SA D/SD
Always wanted to teach/work with children 73.1 11.0 71.3 12.0 70.1 12.0 Advice of careers advisors/ teachers/ parents 35.5 33.9 38.3 31.2 37.7 33.4 ATAR
5 in the range for the teacher
education program 12.7 57.7 12.8 56.7 11.3 58.3 Location of the campus was convenient 44.0 35.6 42.6 36.8 40.9 37.6
Wanted to make a difference 90.2 2.7 90.2 2.5 89.2 2.5 Wanted to work in an area of specialisation or interest 75.3 7.0 74.8 6.5 76.4 5.9 Qualification is broadly accepted here and overseas 63.6 12.5 63.9 13.5 62.2 13.5
Availability of school holidays 50.7 22.8 50.7 23.7 50.2 24.4
Attractive pay and conditions 32.0 37.9 29.0 41.4 28.2 43.4
Strong employment opportunities 43.0 32.2 48.5 27.8 46.4 30.5 Parent/family member is a teacher 25.3 55.5 27.5 53.6 27.1 54.6
Teaching was a back-up plan 14.7 64.8 15.5 66.7 14.6 67.9 Note: A - agree; SA - strongly agree; D - disagree; SD - strongly disagree
The item in the table above with the highest percentage of graduate teachers who stated they strongly agreed or
agreed with is 'Wanted to make a difference' (approximately 90 per cent across all three rounds). The next two
items on which graduate teachers strongly agreed or agreed were 'Wanted to work in an area of specialisation'
(approximately 75 per cent) and 'Always wanted to teach children’ (approximately 71 per cent). The item in the
table with the highest percentage of graduate teachers who stated they strongly disagreed or disagreed with was
'Teaching was a back-up plan' (approximately 66 per cent), followed by 'ATAR in the rank for the teacher education
program' (approximately 57 per cent). Interestingly, there was little difference in responses across the three survey
rounds – noting that whilst there was a portion of respondents who did participate in more than one round, there
were 62.5 per cent of respondents, over the three surveys, who only participated once. The findings support the
previous research discussed above.
5 Australian Tertiary Admission Rank

Longitudinal Teacher Education and Workforce Study (LTEWS) Final Report
87
Principals’ views on attracting graduates
The three rounds of Principal Surveys gathered information on the difficulty in attracting graduate teachers by
school location. Figure 16 shows that overall, principals in 16 to 20 per cent of schools in the three survey rounds
had difficulty attracting graduate teachers, but this was very different when schools where grouped by location.
Figure 16. Difficulty in attracting graduate teachers – by school location
Metropolitan schools had the least difficulty attracting graduates, with only 6 to 11 per cent of schools in these
locations experiencing difficulty. Schools in regional locations had between 14 to 26 per cent of their principals
stating difficulty in attracting graduate teachers. In remote locations, about 40 per cent of principals in Rounds 1
and 3 stated that their schools had difficulty attracting graduates. In Round 2, this was only 14 per cent – but this is
due to the small number of schools in this location in Round 2, which numbered only 12.
In free text responses, principals or school leaders were asked if they had difficulties attracting graduates to their
schools. While some noted that their state or territory system meant they had little say over who was appointed to
their schools (e.g. ‘we take who we are given’) or various policies meant that some teachers had precedence for
employment (e.g. the transfer point system), many indicated that they had a high number of applicants for
positions including experienced teachers and new graduates. They believed that their schools were attractive to
graduates because of the location and accessibility (transport etc.), their partnership arrangements with
universities, their reputation for high performance and/or the latest technologies, their newness, and their size
(e.g. a small school). In some cases, incentives made the school more attractive, but it was noted that not
everyone who was attracted by incentives was a quality candidate.
While many principals reported receiving 50–100 applications for positions at their schools, many reported
difficulties in attracting graduates with the areas of mathematics, physics, English, LOTE, accounting, manual arts
and psychology being specifically noted as hard to staff. Difficulties often related to location and the perceived
10.5
27.3
16.7
34.8
40.0
20.0
6.1
18.6
25.9
37.2
14.3 15.6
7.3
25.3
14.3
33.3
36.4
17.0
0
5
10
15
20
25
30
35
40
45
50
Metropolitan Outer metro Regional Rural Remote Total
Pe
rce
nt
Round 1
Round 2
Round 3

Longitudinal Teacher Education and Workforce Study (LTEWS) Final Report
88
‘toughness’ of the school (as measured by ICSEA scores and other SES measures, or simply through word-of
mouth).
Principals expressed concern that many graduates do not want to leave the major capital cities or coastal regions
where they have grown up and/or completed their teacher preparation program, and that if they did, it was often
only for a short time, therefore creating a constant churn in rural, remote, and even some regional areas. Being
away from family, the lack of social aspects that a significant number of young people want to be involved in (the
‘Metro’ mindset), the high cost of living and lack of availability of accommodation (this was particularly noted in
areas with a mining presence), were also noted.
Strategies that principals employed to gain high quality graduates included advertising early (‘Advertising early
gains better applicants.’ ‘The cream of the crop is super; the averages can be hard work’). Others actively sought
out targeted graduates drawing on their prior knowledge of them (‘seen them during a practicum or internship’),
or recommendations from colleagues.
Table 44 below shows the principal or school leader responses as to whether or not their school had difficulty
attracting teachers.
Table 44. Difficulty for schools in attracting graduate teachers
Round 1 Round 2 Round 3
Difficulty attracting graduate
teachers n % n % n %
Yes 25 20.0 48 15.7 62 16.8
No 100 80.0 257 84.3 307 83.2
TOTAL 125 100.0 305 100 369 100
Up to a fifth of principals over the three rounds of surveys stated they had difficulty attracting graduate teachers,
but as the principal response numbers were fairly small, generalisations should not be drawn.
The table below shows principals’ plans to recruit new graduate teachers in 2013. This question was only asked of
principals in the survey round at the end of 2012.
Table 45. Plan to recruit new graduate teachers in 2013, Round 2 only
Round 2
N %
Yes 177 52.8
No 104 31.0
Unsure 54 16.1
TOTAL 335 100.0
Over half of the principals (52.8 per cent) planned to recruit new graduate teachers in 2013. Thirty-one per cent
had no plans to recruit new graduate teachers, and 16.1 per cent were unsure. This supports the earlier discussion
in relation to principals liking to employ graduates.

Longitudinal Teacher Education and Workforce Study (LTEWS) Final Report
89
3.4.2 Retention in teaching
Table 46 below shows the principal or school leader responses as to whether or not their school had difficulty
retaining teachers.
Table 46. Difficulty for schools in retaining graduate teachers
Round 1 Round 2 Round 3
Difficulty retaining
graduate teachers n % n % n %
Yes 110 25.1 69 20.8 94 25.5
No 328 74.9 262 79.2 275 74.5
TOTAL 438 100 331 100 369 100
From a fifth to a quarter of principals responding to the surveys stated that they had difficulty in retaining their
graduate teachers.
The principals were also asked about their plans to retain their graduate teachers; see Table 47.
Table 47. Principals’ plans to retain graduate teachers
Round 2 Round 3
n %
Yes, all of them 157 46.4 283 76.7
Yes, some of them 121 35.8 55 14.9
No 38 11.2 3 0.8
Unsure 17 5.0 14 3.8
Not applicable (no graduate teachers) 5 1.5 14 3.8
TOTAL 338 100 369 100
Nearly half of the principals in the October 2012 survey stated that they planned to retain their graduate teachers
in 2013 (46.4 per cent), and 35.8 per cent stated they planned to keep some of them. The percentages are very
different for Round 3, which took place in April 2013, when principals would have had in place the majority of their
staff for the rest of the school year. Just under 80 per cent stated they planned to keep on all their graduate
teachers, and nearly 15 per cent said they would keep on some of them. In terms of numbers, there were only
three principals in this survey round who were not planning on retaining their current graduate staff.
Longitudinal analysis: Retention and attrition patterns
The LTEWS data show retention patterns by looking at the teaching status of respondents in Round 3 and tracking
back to their teaching status in previous rounds (provided respondents had participated in more than one survey
round). It is possible to follow retention over a six-month and a 12-month period. The data from the following two
cohorts in the study were analysed in order to show this:
Cohort 2 (able to be followed from October 2012 – March 2013. N=1,050)
Cohort 3 (able to be followed from March 2012 – March 2013. N=544)

Longitudinal Teacher Education and Workforce Study (LTEWS) Final Report
90
There were only 958 and 479 of these respondents in Cohort 2 and 3 respectively who have completed enough
questions to examine their teaching status (i.e. whether they were retained, joined or left). Cohort 2 shows
patterns over a six-month period, from the end of respondents' first year of teaching to the beginning of their
second year. Cohort 3 shows patterns over a 12-month period, from the beginning of respondents' first year of
teaching to the beginning of their second year.
The table below shows retention and attrition numbers and percentages for these two periods of six and 12-
months, as well as data on respondents who gained a teaching position during this time. In the data, retention is
defined as having a position as a teacher in a school at both data points in the surveys, i.e., for the (i) six month
period, at October 2012 and March 2013; and for the (ii) 12 month period, at March 2012 and March 2013.
Attrition is defined as having a teaching position at the first data point but not teaching at the second data point.
Joined is defined as not having a teaching position at the first data point but having a teaching position at the
second data point.
In the six-month period from October 2012 to March 2013 there was an 85.5 per cent retention rate for those
respondents who participated in the Graduate Teacher Surveys that took place at these times. Just under eight per
cent had left teaching, and 6.7 per cent of respondents with a teaching position in March 2013 did not have
teaching employment in October 2012.
In the 12-month period from March 2012 to March 2013 74.7 of respondents were teaching at both times. Just
over seven per cent who were teaching in March 2012 were no longer teaching in March 2013, and 18.2 per cent
of those with a teaching position in March 2013 did not have a teaching position a year earlier.
Table 48. Retention and attrition patterns
6 months 12 months Teaching status n % n %
Retained 819 85.5 358 74.7 Joined 64 6.7 87 18.2 Attrition 75 7.8 34 7.1
TOTAL 958 100.0 479 100.0
Retention and attrition patterns across teaching areas
The next four tables show retention and attrition patterns over the six and 12-month periods across different
teaching areas. The first table shows changes in these patterns across states and territories.
Table 49. Retention and attrition patterns – by school state/territory
NSW VIC QLD SA WA TAS NT ACT Total Teaching status % % % % % % % % %
Cohort 2 Retained 79.9 89.3 84.6 88.9 78.8 91.7 100.0 80.8 85.5 Joined 12.5 3.8 5.1 5.6 12.1 0.0 0.0 9.6 6.6 Attrition 7.6 6.8 10.3 5.6 9.1 8.3 0.0 9.6 7.8
TOTAL 100.0 100.0 100.0 100.0 100.0 100.0 100.0 100.0 100.0
Cohort 3
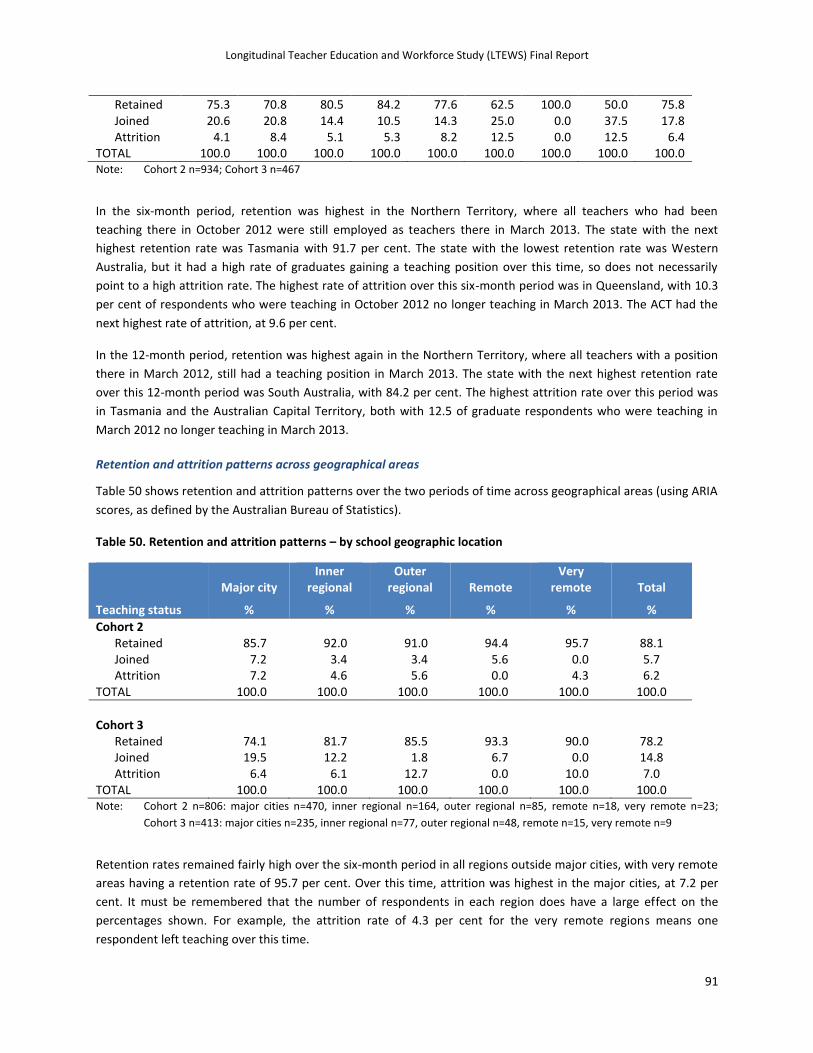
Longitudinal Teacher Education and Workforce Study (LTEWS) Final Report
91
Retained 75.3 70.8 80.5 84.2 77.6 62.5 100.0 50.0 75.8 Joined 20.6 20.8 14.4 10.5 14.3 25.0 0.0 37.5 17.8 Attrition 4.1 8.4 5.1 5.3 8.2 12.5 0.0 12.5 6.4
TOTAL 100.0 100.0 100.0 100.0 100.0 100.0 100.0 100.0 100.0 Note: Cohort 2 n=934; Cohort 3 n=467
In the six-month period, retention was highest in the Northern Territory, where all teachers who had been
teaching there in October 2012 were still employed as teachers there in March 2013. The state with the next
highest retention rate was Tasmania with 91.7 per cent. The state with the lowest retention rate was Western
Australia, but it had a high rate of graduates gaining a teaching position over this time, so does not necessarily
point to a high attrition rate. The highest rate of attrition over this six-month period was in Queensland, with 10.3
per cent of respondents who were teaching in October 2012 no longer teaching in March 2013. The ACT had the
next highest rate of attrition, at 9.6 per cent.
In the 12-month period, retention was highest again in the Northern Territory, where all teachers with a position
there in March 2012, still had a teaching position in March 2013. The state with the next highest retention rate
over this 12-month period was South Australia, with 84.2 per cent. The highest attrition rate over this period was
in Tasmania and the Australian Capital Territory, both with 12.5 of graduate respondents who were teaching in
March 2012 no longer teaching in March 2013.
Retention and attrition patterns across geographical areas
Table 50 shows retention and attrition patterns over the two periods of time across geographical areas (using ARIA
scores, as defined by the Australian Bureau of Statistics).
Table 50. Retention and attrition patterns – by school geographic location
Major city
Inner regional
Outer regional Remote
Very remote Total
Teaching status % % % % % %
Cohort 2 Retained 85.7 92.0 91.0 94.4 95.7 88.1 Joined 7.2 3.4 3.4 5.6 0.0 5.7 Attrition 7.2 4.6 5.6 0.0 4.3 6.2
TOTAL 100.0 100.0 100.0 100.0 100.0 100.0
Cohort 3
Retained 74.1 81.7 85.5 93.3 90.0 78.2 Joined 19.5 12.2 1.8 6.7 0.0 14.8 Attrition 6.4 6.1 12.7 0.0 10.0 7.0
TOTAL 100.0 100.0 100.0 100.0 100.0 100.0 Note: Cohort 2 n=806: major cities n=470, inner regional n=164, outer regional n=85, remote n=18, very remote n=23;
Cohort 3 n=413: major cities n=235, inner regional n=77, outer regional n=48, remote n=15, very remote n=9
Retention rates remained fairly high over the six-month period in all regions outside major cities, with very remote
areas having a retention rate of 95.7 per cent. Over this time, attrition was highest in the major cities, at 7.2 per
cent. It must be remembered that the number of respondents in each region does have a large effect on the
percentages shown. For example, the attrition rate of 4.3 per cent for the very remote regions means one
respondent left teaching over this time.
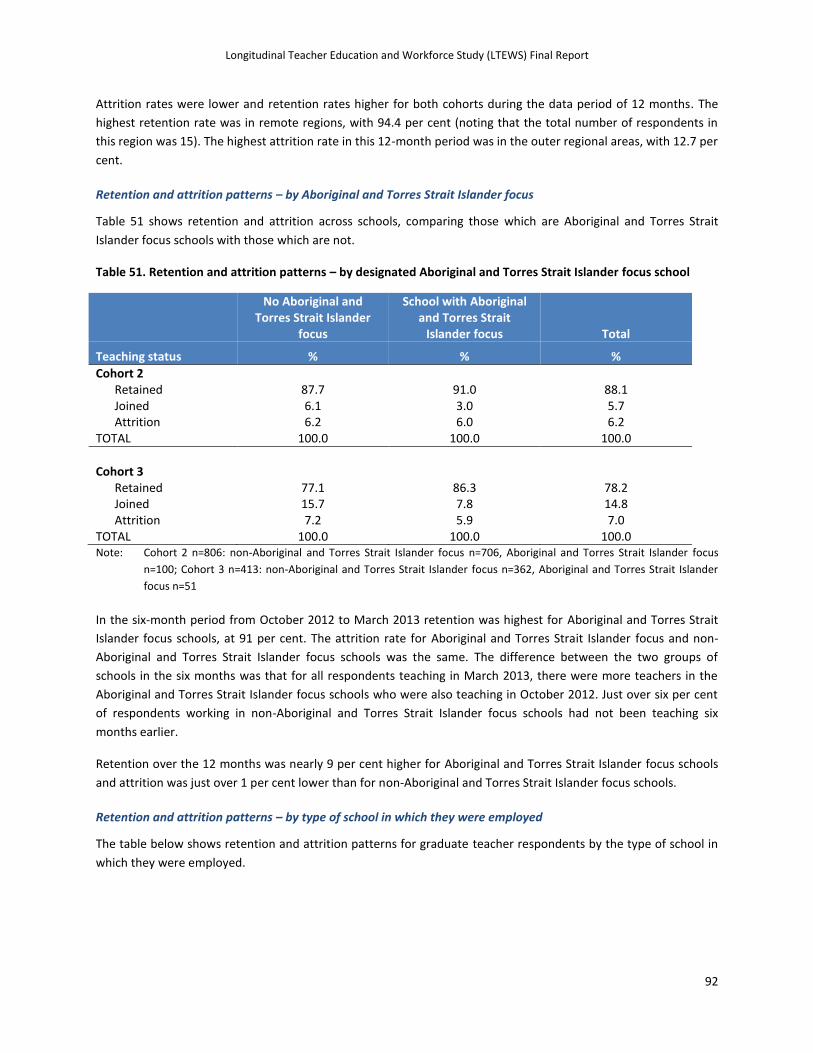
Longitudinal Teacher Education and Workforce Study (LTEWS) Final Report
92
Attrition rates were lower and retention rates higher for both cohorts during the data period of 12 months. The
highest retention rate was in remote regions, with 94.4 per cent (noting that the total number of respondents in
this region was 15). The highest attrition rate in this 12-month period was in the outer regional areas, with 12.7 per
cent.
Retention and attrition patterns – by Aboriginal and Torres Strait Islander focus
Table 51 shows retention and attrition across schools, comparing those which are Aboriginal and Torres Strait
Islander focus schools with those which are not.
Table 51. Retention and attrition patterns – by designated Aboriginal and Torres Strait Islander focus school
No Aboriginal and Torres Strait Islander
focus
School with Aboriginal and Torres Strait
Islander focus Total
Teaching status % % %
Cohort 2 Retained 87.7 91.0 88.1 Joined 6.1 3.0 5.7 Attrition 6.2 6.0 6.2
TOTAL 100.0 100.0 100.0
Cohort 3
Retained 77.1 86.3 78.2 Joined 15.7 7.8 14.8 Attrition 7.2 5.9 7.0
TOTAL 100.0 100.0 100.0 Note: Cohort 2 n=806: non-Aboriginal and Torres Strait Islander focus n=706, Aboriginal and Torres Strait Islander focus
n=100; Cohort 3 n=413: non-Aboriginal and Torres Strait Islander focus n=362, Aboriginal and Torres Strait Islander
focus n=51
In the six-month period from October 2012 to March 2013 retention was highest for Aboriginal and Torres Strait
Islander focus schools, at 91 per cent. The attrition rate for Aboriginal and Torres Strait Islander focus and non-
Aboriginal and Torres Strait Islander focus schools was the same. The difference between the two groups of
schools in the six months was that for all respondents teaching in March 2013, there were more teachers in the
Aboriginal and Torres Strait Islander focus schools who were also teaching in October 2012. Just over six per cent
of respondents working in non-Aboriginal and Torres Strait Islander focus schools had not been teaching six
months earlier.
Retention over the 12 months was nearly 9 per cent higher for Aboriginal and Torres Strait Islander focus schools
and attrition was just over 1 per cent lower than for non-Aboriginal and Torres Strait Islander focus schools.
Retention and attrition patterns – by type of school in which they were employed
The table below shows retention and attrition patterns for graduate teacher respondents by the type of school in
which they were employed.

Longitudinal Teacher Education and Workforce Study (LTEWS) Final Report
93
Table 52. Retention and attrition patterns – by school type
Early Childhood Primary Secondary Combined Total
Teaching status % % % % %
Cohort 2 Retained 76.7 87.7 85.0 85.3 85.8 Joined 14.0 5.2 7.2 5.1 6.3 Attrition 9.3 7.2 7.8 9.6 7.8
TOTAL 100.0 100.0 100.0 100.0 100.0
Cohort 3
Retained 34.8 79.0 74.6 77.9 75.1 Joined 52.2 16.8 14.8 19.1 18.1 Attrition 13.0 4.2 10.7 2.9 6.8
TOTAL 100.0 100.0 100.0 100.0 100.0 Note: Cohort 2 n=945: Early Childhood n=43, primary n=405, secondary n=361, combined n=136; Cohort 3 n=474: Early
Childhood n=23, primary n=214, secondary n=169, combined n=68
For Cohort 2, who had participated in Rounds 2 and 3 of the LTEWS Graduate Teacher Surveys, the retention rate
for all school types was close to the average (85.8 per cent) except for those teaching in early childhood – of all
those employed as an early childhood teacher in March 2013, 76.7 per cent had also been teaching in October,
2012 and 14 per cent were new to teaching. Respondents from combined schools had the highest attrition rate,
with 9.6 per cent.
The 12-month period from March 2012 to March 2013 showed a lower retention rate for respondents in early
childhood, but it should be noted that there were only 23 respondents in this group so percentages should be
treated with caution. The highest attrition rate over the 12 months was from respondents in secondary schools,
with 10.7 per cent.
The data from this cohort would indicate that once in a position, attrition is relatively low. Cohort 3 showed a high
number of teacher joining the early childhood sector, but with the highest rate of attrition over the period. These
data are a short point-in-time analysis of teacher attrition.
Principals’ views on retaining graduates
The three rounds of Principal Surveys also gathered information retaining graduate teachers by school location.
Figure 17 shows that principals in 21 to 26 per cent of schools in the three survey rounds had difficulty retaining
graduate teachers. Similarly to attracting graduates, this was very different when schools where grouped by
location.
Metropolitan schools had the least difficulty retaining graduates, with between 15 to 19 per cent of schools in
these locations experiencing difficulty. Schools in regional locations had between 29 to 32 per cent of their
principals stating difficulty in retaining graduate teachers. In remote locations, this figure rose to between 39 to 50
per cent of principals stating their schools had difficulty retaining graduates.

Longitudinal Teacher Education and Workforce Study (LTEWS) Final Report
94
Figure 17. School location – by difficulty in retaining graduate teachers
Principals and school leaders reported that many graduates stay employed at their school for approximately 5
years, an appropriate retention record according to them. It was reported that graduates stay and consolidate
their teaching and learning practices, and only move for promotion or to gain further experience as part of their
career goals. Principals believed that new teachers are motivated to stay because of the professional and
collegiate working environments in their schools, and the provision of systematic mentoring and support
programs. In small schools, it was thought that new teachers stayed to gain experiences of responsibility, and
leadership opportunities earlier than their colleagues in larger schools.
However, because of various policies relating to contract positions, many new teachers move schools because the
principals cannot offer permanent on-going positions, and in some states the transfer system ensures that new
teachers move on quite quickly (e.g. the ‘country service’ requirement). Some move because they are ‘poached’ by
nearby (often private) schools and others have to move because the school has ‘too many older staff who will not
retire and make way for graduates’. It is also thought that many new teachers move on to teach at a perceived
better school and/or to ‘go home’. Personal and family circumstances impact on these decisions including things
like the high cost of living and unavailability of suitable housing, in addition to ‘stages of life’ decisions, like wanting
to travel.
In some areas, isolation and distance make it restrictive for professional development, and so new teachers look
for other opportunities. In terms of graduate teachers in their schools, principals and school leaders reported that
they would be able to retain many of them into their second year of teaching. They noted wanting to retain them if
they were a ‘good fit’ with the school, and capable in their work. This was made easier in schools with increasing
enrolments.
The main reason principals were not able to retain the graduates in their schools was because they were on
contract, and permanent staff were returning from leave. Some were moving to do what they saw as compulsory
‘country service’ and also for a range of personal reasons. Some were not able to be retained because of falling
enrolments and funding pressures, and a mismatch between the curriculum area demands in the school.
16.6
24.7
31.7 33.8
39.0
25.2
14.5
21.3
31.3
23.9
43.8
20.4 18.6
24.1
28.6
45.2
50.0
26.0
0
10
20
30
40
50
60
Metropolitan Outer metro Regional Rural Remote Total
Round 1
Round 2
Round 3

Longitudinal Teacher Education and Workforce Study (LTEWS) Final Report
95
3.4.3 Leaving teaching in the early years
The early years of teaching form a transition stage to a more secure employment status. In Australia this year is
colloquially known as being employed as a ‘first-year-out’ teacher. Following the completion of a recognised
university teacher education program, graduate teachers, whether they are working full or part-time or casual, will
provisionally register as teachers and occupy ‘the ritual bridge’ (Britzman, 1986) ‘that beginning teachers have to
cross to enter the teacher's world’ (Ballantyne, Thompson, & Taylor, 1998, p.51). Early experiences in the teaching
workforce are a critical period. It is during this time that attitudes and behaviours with respect to the profession
are formed and continue to shape the subsequent years of teaching (Bartell, 2004).
In this study, transition into the workplace as an early career teacher includes a wide range of ‘first’ appointments
and experiences:
A full-time permanent ongoing position
A full-time one-year contract position
A short-term contract position – ranging from a part-time contract – from a few weeks, to one to two
terms, or a fractional appointment for a school year
Relief or casual teaching – irregular teaching patterns
Teaching in Higher Education or an allied education field
The free text responses in the Graduate Teacher Surveys provide a data source for understanding more about the
reasons why early career teachers choose to leave the teaching profession including an analysis of obstacles to
securing a teaching position, reasons for not seeking employment as a teacher as well as induction and support for
graduate teachers in schools.
Reasons for not seeking employment or difficulties in securing employment over Rounds 2 and 3 are grouped as
follows:
Personal
family commitments, caring for young children and family leave;
undertaking further study, such as a M.Ed. or PhD;
travel;
gaining further experiences in a school by working as a teacher aide;
unable to obtain a Visa;
unexpected ongoing illness;
moved states or overseas;
need to satisfy IELTS test;
personal belief – ‘teaching is not for me’ and personal preference to teach in non-government or
catholic school rather than the public sector.
Career/professional backtrack
salary is greater than teaching;
job security and career progression is greater than teaching;
part-time work is not an option due to personal and family commitments;
work in allied educational field, e.g. Higher Education, Gallery Education Officer, Not-for-profit
foundation;

Longitudinal Teacher Education and Workforce Study (LTEWS) Final Report
96
consultancy;
artist in schools;
senior administrative position in a school;
Director of Child Care Centre, Outside School Hours Care, Private Tuition;
age (>55); and
low pay compared to other professions.
Quality of induction and support
teaching is too stressful – little induction and support;
workplace harassment occurs and is not addressed;
provisional registration system is a barrier;
challenges in understanding how ‘systems’ work and
support to new graduates – limited induction and mentoring.
Employment conditions
lack of teaching jobs/opportunities;
few permanent positions;
vacant positions in the field of teaching not available and
casual teaching is not satisfying or financially viable.
In the free text responses, graduates with casual appointments expressed a range of anxieties associated with
trying to secure a teaching position and of being able to secure only casual work; for example:
‘Have applied and been turned down or had no response for 26 jobs. Lack of experience is the usual excuse.’
‘Being a graduate teacher, schools don't give opportunities.’
‘I have a family and part-time work is too insecure and unreliable. Have registered with casual direct but I do not receive any calls. The criteria for a new scheme teachers is too broad making it difficult to meet the criteria in applications.’
‘Lack of permanent positions and too many casual teachers working in this area.’
‘Lack of teaching positions in my local area – too much competition from more experienced teachers.’
‘Inability to secure employment in the metropolitan area – I have two children aged 11 and 12 years – 1 in high school and the other in primary school. I am unwilling to disrupt their education to move to a remote location to secure employment.’
Despite the high percentage of graduates in casual positions, many still wanted to remain in teaching as the
following comments show:
‘Although I would love to stay in teaching, if I am unable to gain employment in teaching I will be forced
to find an alternative income as I cannot rely on wages from relief teaching.’
‘All I want is to work as a teacher.’
‘I would like to have a reasonably paid job but because of my age and the subject I teach, I feel there is a
lack of opportunity. Funding to the arts has been cut which affects me directly. I would still like to work for
another 8 years or more. I have started privately in adult education and enjoy it. I would like a mix. I have
a lot of expertise in my area to offer.’

Longitudinal Teacher Education and Workforce Study (LTEWS) Final Report
97
Box 6 illustrates a case example of the implications of contract and casual relief employment on job prospects and
career progression.
Box 6. ‘So that’s what they were going on about all that time’
Kay has a Bachelor of Education (early childhood/primary) from a university in Western Australia. She graduated in 2011 and has started her employment, first, as casual relief teacher, and then later in 2012 she received a short contract position in a primary school to cover a teacher who went on maternity leave. The school is situated in a low socioeconomic area of Perth. According to Kay, the school has developed quality programs in response to the student population and has great facilities. However, in her view it is not responsive to the challenges that new teachers encounter. Kay started her contract employment in Term 3 and she has not received any support from the school administration as a new teacher.
They expect me to know a lot of things about how the school works … they don’t really pass the messages on to me.
Overall, Kay feels that she is prepared well for teaching. She feels that her university program provided a good variety of professional learning opportunities and strategies that have proved useful for teaching. She identifies the foci on learning strategies, reflective practice, collegiality and professional relations, responsiveness to students’ needs, assessment and evaluation, literacy and numeracy and classroom management as being particularly helpful. However, she also feels that she was not adequately prepared for teaching in culturally and linguistically diverse classrooms and for engaging with the larger community. She thinks that it would have been beneficial if there had been more practice-based learning and professional experience opportunities in her pre-service teacher education program:
I feel like during university you need a lot more time in the classroom because nothing really makes sense while you’re at university, then when you eventually do get into the classroom it’s like, ‘oh so that’s what they were going on about all that time’ – you can’t connect the two because you need to have more time in the classroom for it to make sense.
Kay’s employment prospects are uncertain. The contract position ran out in 2012 and she has applied for positions elsewhere. However, she is afraid that in all likelihood this will be a casual relief position again. She is frustrated with this situation and employment prospects. She laments:
This is the thing I hate about the education system at the moment, is that you never know if you’re going to have work or not, and the whole idea of having contracts and being out of contracts and not being in a permanent position, it’s all just sad … I think that’s where everyone is heading, contract work. But I just don’t like the instability – I want to know where I am and what I’m doing and am I going to be able to pay my mortgage.
Graduate teacher, Western Australia, early childhood/primary, casual relief

Longitudinal Teacher Education and Workforce Study (LTEWS) Final Report
98
The data from this study indicate that for early career teachers there are significant differences in the patterns of
employment and these experiences are paralleled by a host of issues associated with securing a ‘first’ position. It
seems clear that graduating from a teaching degree and gaining an initial full-time ongoing position, with the
likelihood of a permanent position to follow, no longer constitutes the norm for Australian teacher education
graduates. The current situation in Australia contrasts sharply with the experiences of the Australian ‘baby
boomer’ generation who trained in the 1970s. This generation of teachers were often bonded to an education
authority and completed their qualification in a period of expansion in education, and whether bonded or not,
readily found employment.
Induction and support for new teachers
From the survey data, it is not possible to report on exactly why graduates leave teaching in their early teaching
careers as there were too few respondents in the surveys who had left teaching. It is possible to show what
graduate respondents thought about the effectiveness of support they had in schools, and this may have some
bearing on why graduates leave teaching. Table 53 shows the nine items in the survey that asked graduate
teachers about the types of support they received in school. In each of these areas the graduate teachers were
asked to indicate on the scale provided how much they agreed or disagreed that the types of support are/were
effective for them as early career teachers. Responses were recorded on a five-point Likert scale, from: strongly
agree, agree, neither agree nor disagree, disagree to strongly disagree. There was also a response option to record
if this type of support was not available.
Table 53. Graduate teachers with a teaching position – by level of agreement with the effectiveness of types of support received in schools
Not
available Strongly disagree Disagree
Neither agree nor disagree Agree
Strongly agree Total
Round 3 Induction program 20.0 2.9 8.6 16.5 32.5 19.6 100.0 Formal mentor 24.0 3.9 8.7 13.6 23.0 26.7 100.0 Informal mentor 14.2 1.6 4.1 10.5 33.9 35.6 100.0 Ongoing network 18.4 2.6 7.8 15.7 33.0 22.4 100.0 Guidance on planning 13.4 2.3 7.1 13.0 37.8 26.3 100.0 Ongoing PD 9.0 2.0 5.2 10.5 35.9 37.3 100.0 Informative websites 16.8 3.2 10.5 24.4 30.0 15.1 100.0 Pay and conditions info. 11.8 4.4 11.3 27.0 33.3 12.2 100.0 Regular debriefing 15.4 3.4 8.1 15.8 32.1 25.2 100.0
Round 2 Induction program 26.2 3.0 7.6 14.9 30.0 18.3 100.0 Formal mentor 26.4 3.8 8.3 13.8 21.0 26.8 100.0 Informal mentor 16.6 2.0 3.5 12.1 33.4 32.4 100.0 Ongoing network 19.2 2.9 7.6 16.1 30.9 23.3 100.0 Guidance on planning 14.5 1.9 6.4 13.9 37.7 25.6 100.0 Ongoing PD 8.9 1.8 4.4 11.6 37.1 36.1 100.0 Informative websites 17.7 2.8 10.1 21.9 31.6 15.9 100.0 Pay and conditions info. 13.0 3.8 11.2 26.4 32.6 12.9 100.0 Regular debriefing 16.9 2.5 8.4 16.9 32.2 23.2 100.0

Longitudinal Teacher Education and Workforce Study (LTEWS) Final Report
99
Round 1 Induction program 26.4 2.5 7.9 14.0 28.7 20.4 100.0 Formal mentor 29.1 2.6 7.4 10.7 23.6 26.6 100.0 Informal mentor 17.2 1.2 4.7 12.1 30.9 34.0 100.0 Ongoing network 20.5 2.7 5.3 14.0 31.1 26.3 100.0 Guidance on planning 16.1 2.5 6.7 12.7 36.2 25.8 100.0 Ongoing PD 10.4 1.4 3.6 13.3 35.7 35.7 100.0 Informative websites 19.0 3.2 10.2 18.5 32.9 16.2 100.0 Pay and conditions info. 14.0 4.9 12.6 22.6 32.8 13.0 100.0 Regular debriefing 18.2 3.5 6.7 12.9 34.7 24.0 100.0 Note: Round 3 n=1,671; Round 2 n=2,028; Round 1 n=920
The data show that the item that was least available to graduate teachers was 'Formal mentor arrangement’ (29
per cent of graduate teachers stated this was not available in Round 1, 26 per cent in Round 2 and 24 per cent in
Round 3). The form of support that graduates stated was most available to them was ‘Ongoing professional
development opportunities’ (73 per cent stated this was available in Round 1 and Round 2 and 71 per cent in
Round 3).
The item that graduate teachers stated was most effective in terms of support in their new role as a teacher was
'Ongoing professional development opportunities' (71 per cent either agreed or strongly agreed in Round 1, 73 per
cent in Rounds 2 and 3) followed by 'Informal mentor arrangement' (65 per cent in Round 1, 66 per cent in Round
2 and 70 per cent in Round 3). The item that was least effective in all three survey rounds was ‘Information on pay
and conditions’ (18 per cent either strongly disagreed or disagreed in Round 1, 15 per cent in Round 2 and 16 per
cent in Round 3).
Principals’ responses on support available to first-year teachers
Principals of graduate respondents to the LTEWS surveys were also asked whether these nine support items were
available in their schools. Figure 18 below shows what support principals stated was available for their early career
teachers.
Of the nine items relating to support listed in the Principal Survey, principals stated that 'Ongoing professional
development opportunities' was the item most widely available across schools (99.5 per cent of principals said this
was available at their school in Round 1, 99.7 per cent in Round 2 and 100 per cent in Round 3). Least available was
a 'List of informative websites' (62 per cent of principals indicated this was available in their schools in Round 1, 61
per cent in Round 2 and 58 per cent in Round 3) and an 'Ongoing network with other beginning teachers' (69 per
cent of principals had this available to their graduate teachers in Round 1, 65 per cent in Round 2 and 64 per cent
in Round 3).
The support item that the highest percentage of principals stated was available to graduates was also the item that
graduates stated was the most effective to them as an early career teacher. However, it is also worth noting that
while more than 97 per cent of principals identified induction programs as available in their schools at all three
survey points, 20-26 per cent of graduate teachers identified this as not available at the same points in time.
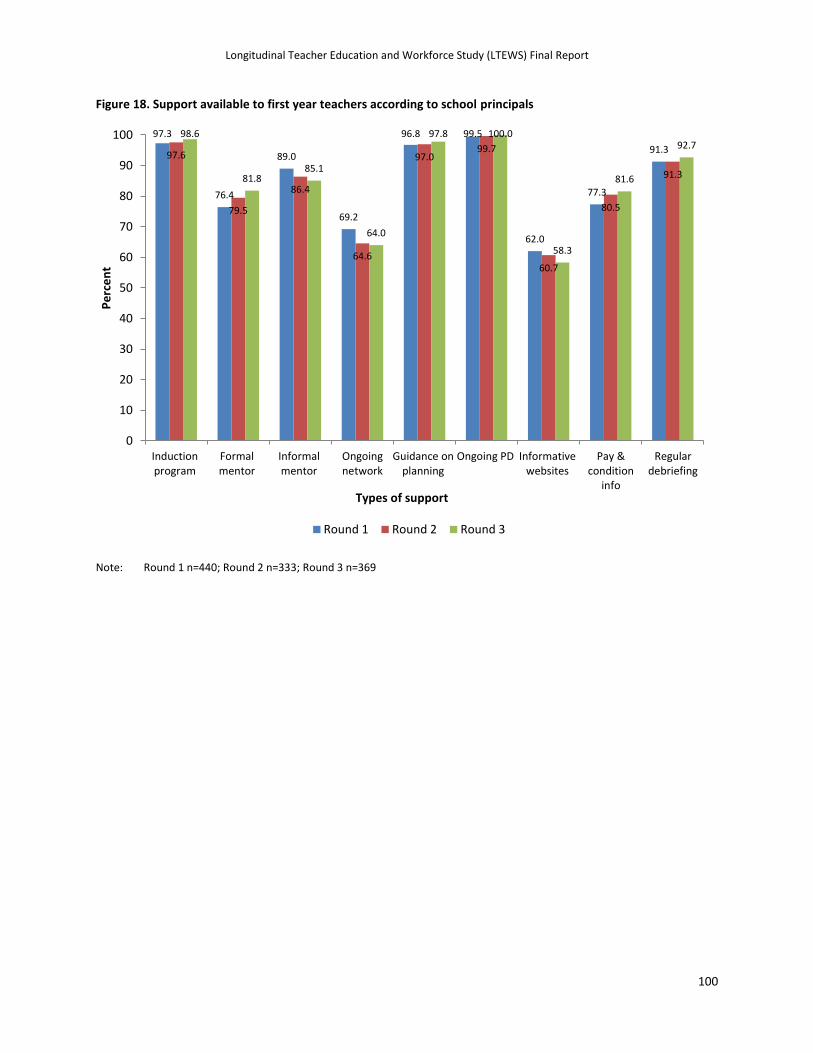
Longitudinal Teacher Education and Workforce Study (LTEWS) Final Report
100
Figure 18. Support available to first year teachers according to school principals
Note: Round 1 n=440; Round 2 n=333; Round 3 n=369
97.3
76.4
89.0
69.2
96.8 99.5
62.0
77.3
91.3 97.6
79.5
86.4
64.6
97.0 99.7
60.7
80.5
91.3
98.6
81.8 85.1
64.0
97.8 100.0
58.3
81.6
92.7
0
10
20
30
40
50
60
70
80
90
100
Inductionprogram
Formalmentor
Informalmentor
Ongoingnetwork
Guidance onplanning
Ongoing PD Informativewebsites
Pay &condition
info
Regulardebriefing
Pe
rce
nt
Types of support
Round 1 Round 2 Round 3

Longitudinal Teacher Education and Workforce Study (LTEWS) Final Report
101
3.5 Factors influencing Position and Location Changes
The characteristics of schools and changes in employment that were investigated include:
1. Working in a school in an outer regional, remote or very remote area;
2. Working in a school that has been classified as an Aboriginal and/or Torres Strait Islander (ATSI) focus
school;
3. Staying in a teaching role for a period of time;
4. Leaving a teaching role after having been teaching; and,
5. Changing schools.
Identifying the main factors that account for differences in position and changes in location requires specifying the
statistical relationship between these changes and graduate characteristics as some form of a regression equation.
Logistic regression procedures were used to identify factors that influence these changes. The aim of the
regression was to estimate the factors influencing all five outcomes listed above with the following characteristics
in the graduate respondents, after controlling for other influences. The graduate characteristics that were included
in the analyses were:
Gender
Age
State/territory where registered to teach
Teacher education program type
Domestic or international student
Study mode
Attraction, attrition and retention of teaching
o Job characteristics is the reason for attraction
o Environment is the reason for attraction
o Altruism is the reason for attraction
The variables that asked about attraction to teaching are included in the three components in the following way:
1. Job characteristics:
Attractive pay and conditions
Availability of school holidays
Strong employment opportunities
Qualification is broadly accepted here and overseas
2. Environmental attraction:
ATAR in the range for the teacher education program
Advice of careers advisors/teachers/parents
Parent/ family member is a teacher
Location of the campus was convenient
3. Altruistic attraction:
Wanted to make a difference
Always wanted to teach/work with children

Longitudinal Teacher Education and Workforce Study (LTEWS) Final Report
102
Teaching was not a back-up plan
Wanted to work in an area of specialisation or interest
These components were identified using principal components analysis. For details refer to Appendix 15.
Results of regression calculations are represented in Appendix 17. Each table addresses one of the five school
characteristics or changes in employment listed above, and shows the likelihood of graduate characteristics that
have an influence on these outcomes, and whether this is a positive or negative influence.
Each graduate characteristic listed above has one factor that is controlled in the regression model. This group of
factors constitutes the control group. The control group for all five regression calculations in each of the three
rounds of surveys consists of the following characteristics:
Female
Aged under 30
Victorian teacher registration
Bachelor’s degree
Domestic student during their teacher education program
Full-time study
Each of the three attraction variables was divided into four groups:
those who scored in the top 25 per cent on an attraction characteristic (top quartile)
those who scored in the second 25 per cent on this attraction characteristic
those who scored in the third 25 per cent on this attraction characteristic
those who scored in the bottom 25 per cent on this attraction characteristic
The quartile used as the control in the regression model for all three attraction variables was those who scored in
the top 25 per cent on this variable (i.e. the top quartile).
Appendix 17 shows the regression calculation for graduate characteristics that influence:
teaching in a school in a geographic location outside major populated areas; and,
teaching in a school that is listed as having an Aboriginal and Torres Strait Islander focus.
The factor that had the most influence on graduates working in schools in outer regional, remote or very remote
areas was the state or territory in which they were registered to teach. The factor that had the most influence on
graduates working in schools listed as having an Aboriginal and Torres Strait Islander focus was the state or
territory in which they were registered to teach.
Appendix 17 also shows three regressions looking at teacher position changes in schools. For these regression
calculations, the data was analysed longitudinally. The three groups of graduate respondents investigated were
those who participated in more than one round of the Graduate Teacher Surveys, and they are grouped in the
following way:
Cohort 1 (able to be followed from March 2012 – October 2012)
Cohort 2 (able to be followed from October 2012 – March 2013)
Cohort 3 (able to be followed from March 2012 – March 2013)
Longitudinal Teacher Education and Workforce Study (LTEWS) Final Report
103
Regression calculation for graduate characteristics that influence staying in a teaching role for the periods listed
against the cohorts above are included in Appendix 17. This calculation was completed for each of the three
cohorts identified in the Graduate Teacher Surveys. The factors that had the most influence on graduates staying
in teaching over the 12 months were being an international student (this had a negative affect) and being
registered to teach in the Northern Territory (this had a positive affect).
Appendix 17 also shows the regression calculation for graduate characteristics that influenced leaving a teaching
role for the six-month period from October 2012 to March 2013. This calculation was completed for each of the
three cohorts identified in the Graduate Teacher Surveys, but as those who had left teaching only numbered 15 for
Cohort 1 and 34 for Cohort 3, the numbers in these cohorts were too limited for the analysis to make sense so only
Cohort 2 is shown. The factor that had the most influence on graduates leaving teaching over the six months was
being an international student (this had a positive effect, meaning increasing leaving).
Regression calculation for graduate characteristics that influenced changing schools over the periods are shown in
Appendix 17 listed against the cohorts (6 months and 12 months). This calculation was completed for each of the
three cohorts identified in the Graduate Teacher Surveys. The factors that had the most influence on teachers
changing schools over the 12 months were being in SA, ACT and Tasmania (this had a positive affect), and if the
study mode for the education program was a combination of full-time and part-time this had a negative effect on
changing schools.
Free Text Responses in the Graduate Teacher Surveys: Reasons for changes
The free text data from Round 2 and 3 surveys were analysed for reasons for changes and categorized as follows.
Change to Employment: The main reason for moving or changing schools or location is due to contracts finishing
or not being renewed. Contracts ranged from as little as 6–8 weeks to one year. Frustration about inability to find
consistent or ongoing work was highlighted. Reasons for non-renewal of contracts included permanent staff
returning from maternity or long service leave, school closures, staffing adjustments due to a decline in student
numbers, or subject areas no longer being offered at particular schools. Other reasons for changing employment
were linked to obtaining more permanent employment, including longer-term contracts. There was some
indication that there was a lack of opportunity in the area in which the graduate was employed, as well the
difficulty of juggling work and family commitments. The uncertainty of employment and the impact this had on the
graduates can be seen in the following statement.
It's just that it is frustrating when you cannot get employment after graduation. Especially when you are from a different background where you have an upbringing that makes you feel useless when you are in a situation like this.
Graduate teacher, teaching in a regional school, Casual relief
The biggest difference between Round 2 and Round 3 data was the increase of graduates moving due to finding
more permanent work. Permanent work included ongoing, longer contracts, or more secure contract work.
Family/personal reasons: These reasons included family illness, starting a family, or pregnancy upon completing a
teaching degree, though this typically involved a desire to recommence casual/relief work as soon as possible.

Longitudinal Teacher Education and Workforce Study (LTEWS) Final Report
104
Intra/interstate or international move: There were many responses relating to moving either intra/interstate or
overseas. The reasons for the move intra/interstate were mainly personal, including missing family and/or the
desire to remain with a partner who had relocated for employment. Other reasons given were to look for
better/increased opportunities for permanent work. In terms of international moves, the main two reasons given
were wanting to experience schools/teaching overseas, as well as being offered opportunities for work. Moves to
Australia were due to marriage, then migrating.
Levels of support: A major reason for choosing to leave or move was negative experiences either at school or with
staff and management. Lack of support in terms of leadership, mentoring, behaviour management or
communication/issues with the principals were considered significant by the graduates. Bullying by students
and/or staff, as well as high work-load and stress were given as contributing factors.
Other: Other significant reasons for moving or changing positions were: choosing to undertake further study,
location, and level of access to resources and professional development, not enough work, unhappy as a teacher,
changing career paths, starting own business, or being transferred as part of the requirements in their state.
The reasons why teachers change position and/or leave the teaching profession are complex and defy simple
analysis. According to Ashiedu and Scott-Ladd (2012), reasons range from personal, e.g. conflicting demands and
perceived lack of support, to specific issues relating to the working environment, such as school size and
geographical location. Ingersoll, Merrill and May (2012, pp.32-33) researching beginning mathematics and science
teachers, recently reported:
Contrary to widely held beliefs, we found that the type of college, degree, and preparation route had little
bearing on teachers' likelihood of leaving teaching after one year;
The attrition rates of beginning mathematics and science teachers who held an education degree, such as
in mathematics education or science education, did not differ from those of teachers with a non-
education degree;
Those who entered teaching through a traditional program were only slightly less likely to leave than
those who entered through an alternative route;
Pedagogy was strongly related to teacher attrition. Beginning teachers who had taken some courses in
teaching methods and strategies, learning theory or child psychology, or materials selection were
significantly less likely to depart. The amount of practice teaching they had undertaken, their
opportunities to observe other teachers, and the amount of feedback they had received on their teaching
were also significantly related to whether new teachers remained in teaching.
Ingersoll is reporting from the US context where there has been recent interest in the expansion of differentiation
and alternative entry to teacher education. Whilst the above findings relate specifically to mathematics and
science teachers, in LTEWS, after one year it appears that if graduates can secure a position in the first year or
early in the second year of teaching, they want to remain in teaching. Participants in this study in their free text
responses and in the telephone interviews make reference to their pathway into teaching or their pedagogical
skills. The free text comments drew in the organisational conditions of the workplace as key factors.

Longitudinal Teacher Education and Workforce Study (LTEWS) Final Report
105
3.6 Long-term career intentions of graduate teachers and factors
influencing these intentions
This section discusses the long-term career intentions of the graduate teacher respondents and the factors
influencing these intentions. Box 7 lists the main findings of this section.
Box 7. Main Findings: Long-term career intentions
Most respondents of the survey indicated their intention to remain in the profession in the next three years. However, the percentage who saw themselves as a teacher in a school in three years’ time decreased from 71 per cent to 64 per cent during the 12 months. This is partly accounted for by the number of these teachers intending to seek school leadership positions (an increase from 10 to 14 per cent). Over 7 per cent of the respondents saw themselves working outside of teaching/ education altogether.
Fewer graduate teachers with masters or graduate diploma qualifications saw themselves teaching in three years’ time than for the group as a whole (e.g. Round 1: 66 and 68 per cent compared to 71 per cent for all graduates).
A higher percentage of graduates with masters degrees saw themselves in an education policy or research position in three years.
Secondary teacher graduates saw themselves as less likely to be teaching in three years’ time and more likely to be in leadership positions, when compared to early childhood or primary teachers.
The greatest influence on plans for the future in relation to teaching was whether or not graduates had a teaching position during the time of the survey. Graduates who had a teaching position were more likely to see themselves teaching in three years’ time than graduates without a teaching position. This was evident for all three rounds.
Free text responses in the surveys as well as the follow-up telephone interviews suggest that employment status (for example, contracts finishing, moving to take more permanent work), as well as personal and family reasons along with the levels of support in the schools for beginning teachers (or lack thereof) all had some influence on graduates’ decisions to move or change teaching positions.
Graduate teachers’ plans for three years’ time
Table 54 shows where graduate teachers see themselves in three years’ time. Over the three rounds of surveys,
the percentage of respondents who saw themselves as a teacher in a school has decreased from 71 to 64 per cent.
Those who saw themselves in a leadership position in a school has increased from 10 to 14 per cent, and those
who saw themselves working outside of teaching altogether increased slightly, from three to six per cent.

Longitudinal Teacher Education and Workforce Study (LTEWS) Final Report
106
Table 54. Graduate teachers’ plans for three years’ time
Round 1 Round 2 Round 3 n N n % n %
Working as a teacher in a school 891 71.0 1,675 69.4 1,277 63.6 Working as a teacher in an alternative setting; i.e. adult education 67 5.3 111 4.6 109 5.4 In a leadership position in a school 128 10.2 281 11.6 282 14.0 In an education project, policy or research position 38 3.0 74 3.1 73 3.6 Working outside of teaching/education altogether 43 3.4 97 4.0 114 5.7 Other 88 7.0 175 7.3 153 7.6
TOTAL 1,255 100.0 2,413 100.0 2,008 100.0
When these data are analysed in relation to program type and area of teacher education program, the results
indicate some statistically significant differences between groups, as shown in the Figure and Table below. ‘
Figure 19. Graduate teachers’ plans for three years’ time – by program type
Note: For all three rounds, p<0.01
Across the three rounds of surveys there were less graduate teachers with a masters or graduate diploma who saw
themselves teaching in a school in three years’ time than for the group as a whole (e.g. Round 1: 66 and 68 per
cent compared to 71 per cent for all graduates, as shown in the Table above). Conversely, there were more
66.0
75.9 68.0 65.1
73.3 66.7 64.5
69.4
57.8
3.8
5.1
5.8 4.1
3.9
5.6 2.9
4.2
7.5
15.1
8.5
10.1 11.1
11.4
11.9 16.1
11.9
15.0
6.3 2.5
2.3 6.7
2.1 3.3 5.0 2.6
4.4
1.9 3.0
4.5 5.4 3.1
4.1 5.0 4.6 6.8
6.9 5.0 9.3 7.6 6.1 8.4 6.5 7.3 8.4
0%
10%
20%
30%
40%
50%
60%
70%
80%
90%
100%
Mas
ters
Bac
he
lor
Gra
d d
ip
Mas
ters
Bac
he
lor
Gra
d d
ip
Mas
ters
Bac
he
lor
Gra
d d
ip
Round 1 Round 2 Round 3
Other
Working outside ofteaching/educationaltogether
In an educationproject, policy orresearch position
In a leadershipposition in a school
Working as ateacher in analternative setting
Working as ateacher in a school

Longitudinal Teacher Education and Workforce Study (LTEWS) Final Report
107
graduate teachers with a masters qualification who saw themselves in a leadership position in a school (e.g. Round
1: 15.1 compared to 10.2 per cent).
In Round 3, there was a larger percentage of those with a graduate diploma who saw themselves teaching in an
alternative setting (7.5 per cent compared to 5.4 per cent for the group altogether). Graduate teachers with a
masters had a higher percentage than the group as a whole, and saw themselves in an education policy or research
position in three years’ time (e.g. Round 1: 6.3 per cent compared to 3 per cent; Round 2: 6.7 per cent compared
to 3.1 per cent).
Table 55 shows the percentages across plans for three years’ time by the program area of the graduates’ teacher
education program.
Table 55. Graduate teachers’ plans for three years’ time – by program area
Round 1 Round 2 Round 3
Early childhood Working as a teacher in a school 84.0 69.0 71.9
Working as a teacher in an alternative setting 8.0 2.3 6.3
In a leadership position in a school 0.0 4.6 6.3
In an education project, policy or research position 0.0 5.7 3.1
Working outside of teaching/education altogether 4.0 4.6 1.6
Other 4.0 13.8 10.9
Primary Working as a teacher in a school 78.0 76.7 72.2
Working as a teacher in an alternative setting 4.2 3.8 3.3
In a leadership position in a school 6.7 8.2 11.0
In an education project, policy or research position 2.7 2.6 3.2
Working outside of teaching/education altogether 1.6 3.2 4.8
Other 6.9 5.6 5.5 Secondary
Working as a teacher in a school 65.4 62.4 55.5
Working as a teacher in an alternative setting 6.2 5.5 7.3
In a leadership position in a school 12.7 15.9 17.6
In an education project, policy or research position 2.9 3.5 3.9
Working outside of teaching/education altogether 4.5 4.7 6.7
Other 8.3 8.1 9.0 Note: For all three rounds, p<0.01
In Round 1, more early childhood graduates had plans to be working as a teacher in a school (84 per cent
compared to 71 per cent for all graduates at this Round 1 point in time). Whilst 10 per cent of all graduates in
Round 1 saw themselves in a leadership position in a school, no early childhood respondents saw themselves in
this role at this time. A lower percentage of secondary graduates saw themselves working as a teacher in a school

Longitudinal Teacher Education and Workforce Study (LTEWS) Final Report
108
(65.4 per cent compared to 71 per cent for all graduates at this point in time) but a higher percentage saw
themselves in a leadership role (12.7 per cent compared to 10 per cent for all).
In Round 2, early childhood graduates were less likely to say they saw themselves in a leadership position (4.6 per
cent compared to 11.6 per cent for all graduates). Primary graduates were more likely to see themselves working
as a teacher (76.7 per cent compared to 69.4 per cent for all graduates). Secondary graduates were more likely to
see themselves in a leadership role (15.9 per cent compared to 11.6 per cent).
In Round 3, both early childhood and primary graduates were more likely to see themselves in a teaching role in a
school in three years’ time (71.9 and 72.2 per cent, respectively, compared to 63.6 per cent for all graduates). Early
childhood graduates were less likely to see themselves in a leadership position (6.3 per cent compared to 14 per
cent), and more likely to indicate an 'other' alternative (10.9 per cent compared to 7.6 per cent). Secondary
graduates were less likely to see themselves in a teaching role in a school (55.5 per cent compared to 63.6 per
cent), and more likely to see themselves in a leadership position (17.6 per cent compared to 14 per cent).
Factors influencing plans for the future
The graduate characteristic that had the greatest influence on plans for the future in relation to teaching was
whether or not graduates had a teaching position at the time of the survey rounds. Figure 20 below shows
graduates' plans for three years’ time by their current employment as a teacher in a school.
In Round 1, graduates without a teaching position were less likely to see themselves teaching in a school in three
years’ time (65.2 compared to 71 per cent for all graduates), more likely to see themselves teaching in an
alternative setting (10.2 per cent compared to 5.3 per cent for), less likely to see themselves in a leadership
position (3.2 per cent compared to 10.2 per cent for all graduates) and more likely to see themselves working
outside of teaching altogether (8.3 per cent compared to 3.4 per cent of all graduates). In Round 2, the pattern was
similar to Round 1.
Graduates without a teaching position were less likely to see themselves teaching in a school in three years’ time
(58.3 compared to 69.4 per cent for all graduates), more likely to see themselves teaching in an alternative setting
(8.5 per cent compared to 4.6 per cent for), less likely to see themselves in a leadership position (1.8 per cent
compared to 11.6 per cent for all graduates) and more likely to see themselves working outside of teaching
altogether (13.3 per cent compared to 7.4 per cent of all graduates).

Longitudinal Teacher Education and Workforce Study (LTEWS) Final Report
109
Figure 20. Graduate teachers plans for three years’ time – by currently employed as a teacher in a school
Note: For all three rounds, p<0.01
In Round 3, which, for the majority of graduates in the surveys, was early in their second year after graduating, the
differences between those without a teaching position and all graduate respondents is even more marked. Forty-
five per cent saw themselves working as a teacher in a school in three years’ time (this is 63.6 per cent for all
graduates), 11. 5 per cent saw themselves teaching in an alternative setting (compared to 5.4 per cent), 2 per cent
in a leadership position in a school (14 per cent for all graduates) and 17.9 per cent working outside of teaching
altogether (this is 5.7 per cent of graduates altogether).
73.2
65.2 71.6
58.3
67.5
45.0
3.5
10.2 3.8
8.5
4.2
11.5
12.8
3.2
13.6
1.8
16.6
2.0
3.0
3.2
2.7
5.0
3.2
5.8
1.5
8.5
2.2
13.1
3.1
17.9
6.0 9.6
6.1 13.3
5.5
17.9
0%
10%
20%
30%
40%
50%
60%
70%
80%
90%
100%
Yes No Yes No Yes No
Round 1 Round 2 Round 3
Employed as a teacher in a school
Other
Working outsideofteaching/education altogether
In an educationproject, policy orresearchposition
In a leadershipposition in aschool
Working as ateacher in analternativesetting
Working as ateacher in aschool

Longitudinal Teacher Education and Workforce Study (LTEWS) Final Report
110
4. Teacher Education Relevance and Effectiveness
As the 2007 McKinsey Report (Barber & Mourshed, 2007) highlighted, the quality of an education system cannot
exceed the quality of its teachers. In the pursuit of a high quality teaching workforce in Australia, teacher
education has been the subject of changing state and federal policy reforms informed by more than 100 inquiries
of various types into teacher education since 1979 (e.g. Australian Institute for Teaching and School Leadership,
2013; Caldwell & Sutton, 2010; Committee for the Review of Teaching and Teacher Education, 2003; Education and
Training Committee, 2005; House of Representatives Standing Committee on Education and Vocational Training,
2007; Productivity Commission, 2012; Ramsey, 2000). Indeed, as Linda Darling-Hammond (2000) concluded in her
review of 50 states in the USA, teacher preparation and development is critical to improving teacher quality.
Entry into the profession and ongoing registration of those in the profession has traditionally been the
responsibility of the states and territories and the eight teacher registration authorities – the Queensland College
of Teachers, the New South Wales Institute of Teachers, the Victorian Institute of Teaching, the Teachers
Registration Board Tasmania, the Teachers Registration Board of South Australia, the Western Australian College of
Teaching and the Northern Territory Teachers Registration Board and the recently established Australian Capital
Territory Teacher Quality Institute. They aim to ensure quality teacher education programs and this quality
beginning teachers entering the workforce. Recently, new processes for accrediting initial teacher education
programs (Australian Institute for Teaching and School Leadership, 2011b) were endorsed. Program accreditation
will continue to be undertaken by the relevant state and territory authorities, however they will now do this using
the new national graduate teacher standards and program standards, and using the endorsed national
accreditation processes.
A significant feature of the current landscape is the Australian Professional Standards for Teachers (Australian
Institute of Teaching and School Leadership, 2011c). These comprise seven standards that describe what teachers
should know and be able to do at four professional stages of a teaching career – Graduate, Proficient, Highly
Accomplished and Lead. They are grouped into three domains of teaching – Professional Knowledge, Professional
Practice and Professional Engagement.
Domains of teaching Standards
Professional Knowledge 1. Know students and how they learn
2. Know the content and how to teach it
Professional Practice 3. Plan for and implement effective teaching and learning
4. Create and maintain supportive and safe learning environments
5. Assess, provide feedback and report on student learning
Professional Engagement 6. Engage in professional learning
7. Engage professionally with colleagues, parents/carers and the community
The new program standards and new professional standards have begun to be used by state and territory teacher
regulatory authorities in accrediting teacher education programs from 2013 onwards. This means that, although
these new professional standards for teachers provide a relevant frame of reference for judging the capacity of the
2011 graduating cohort, they did not determine the nature and scope of their teacher education programs. Their
teacher education programs would have been developed and accredited before the new standards were
developed and enacted. That said, the categories associated with the new Australian Professional Standards for
Teachers did inform the surveys, as requested by the management group for LTEWS.

Longitudinal Teacher Education and Workforce Study (LTEWS) Final Report
111
The seven Australian Professional Standards for Teachers were added to the Graduate Teacher Survey and
Principal Survey which already included questions related to curriculum, pedagogy, assessment, classroom
management, teaching culturally, linguistically and socio-economically diverse learners, professional ethics,
collegiality, engagement in ongoing professional learning, and engagement with parents and local community.
These were the themes that had emerged from an extensive review of the research literature conducted as part of
the SETE study. For the LTEWS study, the analysis focussed on the seven Australian Professional Standards and
three other specified areas: (i) Teaching culturally, linguistically and socio-economically diverse learners, (ii) Use of
ICT and (iii) Literacy and numeracy.
Chapter 4 first includes a summary of the main findings from the mapping of initial teacher education component
of LTEWS which was undertaken to understand the programs the 2011 graduate cohort would have completed.
The full report is available in Appendix 1. The second section examines teacher education programs and graduates’
decisions about teaching employment. Aspects of deciding entry into teacher preparation are then discussed. The
final sections of this chapter discuss the findings in relation to teacher education practicums, the subjects studied
and also preparation to teach i) culturally, linguistically and socio-economically diverse learners, ii) ICT, and iii)
numeracy and literacy.

Longitudinal Teacher Education and Workforce Study (LTEWS) Final Report
112
4.1 Mapping of Initial Teacher Education Programs in Australia, 2011
The Mapping of Initial Teacher Education in Australia 2011 component of LTEWS was designed to provide a
snapshot of initial teacher education programs across Australia as they were relevant for the cohort of 2011
graduate teachers being tracked. The background, methodology and design of the mapping process are described
in Section 2.2.2.
The mapping provided a point in time (October 2011 to March 2012) overview of the key dimensions and
characteristics of 551 initial teacher education programs offered by 47 providers across Australia. The data was
collected by desktop analysis of undergraduate and postgraduate teacher education programs recognised as
accredited teacher preparation programs by the relevant state or territory teacher regulatory authority. Data was
the verified with the providers and telephone interviews with personnel from each provider. The mapping data
was used in the analysis of the teacher and principal survey responses and follow-up interviews with graduate
teachers. The complete report is provided in Appendix 1. The summary of findings are also included here in this
section of the main report for completeness.
Length, structure, and delivery
Of the 551 initial teacher education programs offered across Australia ( across 103 campuses), 397
were bachelor’s degrees (72 per cent), 96 were graduate diplomas/postgraduate diplomas (17 per cent)
and 58 were masters degrees (11 per cent).
The programs ranged in length from 1-5 years. A majority of undergraduate teacher education programs
were offered over four-years or part-time equivalent (63 per cent). Postgraduate programs were
generally offered over 1-2 years, with masters programs commonly two years of study (or equivalent)
and graduate diplomas one year. Graduate entry bachelor degrees were 1.5 or 2 years duration and
postgraduate diplomas were sometimes offered as an early exit qualification from a masters degree.
81 per cent of programs were offered by universities and 19 per cent were offered by private colleges or
TAFEs. Of the 38 universities offering teacher education programs, one was private (University of Notre
Dame) and the other 37 were public universities.
401 programs identified the year levels that the programs prepared graduates to teach. From this data, a majority offered preparation for primary teaching (n=302) and early childhood/primary teaching (n=66).
Based on 497 responses, 75 per cent of programs were offered in full-time mode with part time options,
while 14 per cent were offered in external/distance modes.
A majority of providers identified ‘social justice’ as a key distinguishing feature of their programs, followed
by ‘discipline/method knowledge’ and ‘forging community and school-university partnerships’.
Professional Experience
Professional experiences included supervised practicum, classroom observations and internships.
All accredited teacher education programs meet teacher regulatory authority requirements for supervised
practicum, usually 80 days in schools for 4-year undergraduate programs and 45-60 days for 1-2 year
programs. Note that the mapping was conducted prior to national requirements (Australian Institute of
Teaching and School Leadership, 2011). Therefore, there were some variations across states and
territories.

Longitudinal Teacher Education and Workforce Study (LTEWS) Final Report
113
Based on 457 programs, over 50 per cent (n=248) said they offered practicum days in excess of teacher
regulatory authority minimum requirements. This finding must be treated with caution given the variation
in professional experience nomenclature across Australia.
In 462 programs, at least some of the supervised practicums were conducted in block periods of
placement in schools.
Observation days were usually incorporated in the early stages of the professional experience program.
All programs incorporated early opportunities for observations in the classrooms.
Some programs included experience in community settings in addition to the supervised practicum days.
82 per cent of programs offered practicum in the first year (Note: 1-year programs are included in this
data). Often, double degrees did not have practicum in the first year.
Over 43 per cent of the programs included internships as part of the professional experience. Internships
were more likely to be available to pre-service teachers enrolled in bachelor’s degrees than in graduate
diploma or masters programs. Internships were usually 6-10 weeks in duration and usually followed
completion of the minimum number of practicum days required for registration. However, because of the
different ways in which the term ‘internship’ was used, definitive conclusions about internships across
programs was difficult.
Content and Approaches
Most teacher education providers required pre-service teachers in 4-year undergraduate programs to
undertake at least two years of study in their discipline/ content area/s. Entrants into 1- or 2-year
graduate programs were expected to have completed discipline studies in their previous undergraduate
degree programs.
In most teacher education programs, discipline-based content subjects were taught by the relevant
discipline-based faculties or schools in the institution.
Primary teaching preparation programs usually required pre-service teachers to study discipline-based
units in conjunction with curriculum or methods units for the key learning areas.
Many teacher education programs included study in the preparation to teach culturally, linguistically and
socio-economically diverse learners. Some programs had stand-alone units, while others integrated these
aspects across their programs.
Preparation to teach ICT was usually embedded across the teacher education programs rather than
through stand-alone units.
Preparation to teach literacy and numeracy is a key requirement for teacher education program
accreditation to ensure that pre-service teachers are competent to meet the literacy demands of the
curriculum areas they teach. There is also recognition that graduate teachers need to possess a high level
of personal literacy and numeracy.
There is a focus on the consideration of the relevance of family and community literacy practices in some
states which requires graduate teachers to incorporate their understanding of student literacy needs in
the context of their subject and the broader school and community settings.

Longitudinal Teacher Education and Workforce Study (LTEWS) Final Report
114
Primary teaching preparation programs focussed on the teaching of reading, with a range of models,
including instruction on how to teach phonemic awareness, phonics, fluency, vocabulary knowledge and
text comprehension, and writing (including grammar and spelling), speaking and listening.
Secondary teaching preparation programs often focused on literacy teaching within and across all subject
areas so as to prepare teachers to continue the literacy development of students throughout secondary
schooling in all curriculum areas.
Theory and practice integration, and partnerships with schools
The ways in which teacher education programs helped pre-service teachers make theory-practice links
varied in structure and approach. Some institutions incorporated professional placement within
curriculum and educational studies units, while other institutions focused on key teaching and learning
aspects (e.g. classroom management) during a specific professional experience period.
All teacher education providers who were interviewed highlighted the importance of partnerships with
schools.
Community involvement and internship programs were seen as distinguishing features of some teacher
education programs. Some institutions integrated action research and learning partnerships with
community agencies.
Entry into teacher education
Selection for entry into teacher education programs varied from state to state. Generally, entry into
teacher education required candidates to meet minimum tertiary entrance requirements for that
state/territory, the entry pre-requisites for the course, and to be selected in competition with other
eligible applicants.
The Australian Tertiary Admission Rank (ATAR) and results of pre-requisite Year 12 subjects were usually
used as the basis for selection of school leavers into undergraduate programs.
Institutions also used a range of other selection processes, including interviews, portfolios, auditions,
character references, residential location, socio-economic status and evidence of prior learning.
Some institutions offered bridging programs specifically designed to provide school leavers with lower
ATARs with a pathway into teaching.
Entry into postgraduate and graduate entry programs was determined based on a combination of
previously completed university studies, academic results and pre-requisites specific to the sector and
state teacher registration requirements.
Providers reported valuing pre-service teachers who possessed personal values and attitudes appropriate
to the discipline and/or profession as well as high levels of intellectual curiosity and critical thinking. In
addition, they reported valuing pre-service teachers who demonstrated a commitment to ethical and
sustainable practices, a commitment to the profession and effective communication including the use of
ICTs.

Longitudinal Teacher Education and Workforce Study (LTEWS) Final Report
115
4.2 Teacher Education Programs and Graduates’ Decisions to Teach
This section discusses the nature of teacher education programs and the influence of the program structures and
approaches on graduates’ career advancement in the teaching profession.
Box 8 lists the main findings of Section 4.2.
Box 8. Main Findings: Teacher education programs and graduates’ decisions to teach
Teacher education programs and graduates’ decisions about teaching employment
The percentage of graduates employed as teachers increased during the first year after graduation and then stabilized across all three teacher education program types – bachelor, masters and graduate diploma. Those respondents with a bachelor degree showed a slightly higher (but not significant) percentage of employment towards the end of the first year than did graduates with a masters degree or graduate diploma
Employment outside teaching rose significantly in the first year after graduation. In particular, the data show that graduates with masters degrees taking employment outside teaching almost doubled over this period (from 32 to 61 per cent). This may be related to the demographic characteristics of early career teachers with graduate teacher education degrees. They tend to be more mature, often career changers, and likely therefore to have personal commitments which require them to have stable employment and limit their capacity to relocate for a teaching position. The analysis of free text responses shows that such graduates often plan to return to teaching.
In free text responses, graduates not teaching identified factors in deciding not to seek teaching employment as job availability, further education and family circumstances. Other factors included relative salaries in teaching and other careers, other labour market opportunities, and varying relative non-pecuniary conditions of work.
Effective structures, approaches and content for preparation for employment
Irrespective of program type, more than half of the graduates identified reflective practice (64 per cent), quality teaching (53 per cent) and literacy (51 per cent) as key distinguishing features of their teacher education programs (i.e. features that set them apart from other programs). Social relationships, teaching culturally, linguistically and socio-economically diverse learners, school linkages, team teaching and discipline expertise were identified by less than a third of graduates. Teacher education providers identified a similar order of distinguishing features of their programs.
More than three-quarters of graduates with a teaching position agreed that the knowledge gained from the university-based component of their teacher education program was important. However, they were more likely to agree that the knowledge gained was important (for example, 79 per cent at the end of the first year) than to agree that the teacher education units helped prepare them for their current teaching context (65 per cent).
(continued on the next page)

Longitudinal Teacher Education and Workforce Study (LTEWS) Final Report
116
Box 8. (continued)
At the end of the first year after graduation, there was a significant difference between graduates with masters and graduate diploma degrees, with graduate diploma respondents less likely to agree that the knowledge gained through university-based units was important and prepared them for their current teaching context.
There was no link between the campus location of the teacher education program and agreement that knowledge gained through university-based units was important and helped prepare them for their current teaching context. But respondents who completed their program in a part time basis as well as those with an early childhood education degree, were more likely to agree.
Principals identified classroom management, pedagogy and catering for diverse learners as key challenges faced by newly employed graduate teachers.
Principals identified poor teaching skills and classroom management as well as lack of school support and induction, lack of interpersonal/communication skills, and inadequate teacher preparation as contributing to a difficult transition for graduates into teaching.
Influence of the teacher education programs on graduates’ career retention and advancement
Generally, graduates who disagreed that their education program prepared them in the professional standards 'Know students and how they learn' and 'Plan for and implement effective teaching and learning' had a higher retention rate than those who agreed their program prepared them in this area (95 per cent compared to 92 per cent).
Graduates who agreed that their teacher education program prepared them in the standard ‘Know the content and how to teach’ had a higher retention rate than those who disagreed they were prepared in this area (92 per cent compared to 89 per cent).
Graduates who disagreed that their education program prepared them to 'Know students and how they learn' had a higher percentage with leadership positions than those who agreed (31 per cent compared to 14 per cent). 19 per cent of those who disagreed they were prepared to 'Know the content and how to teach it' were in leadership positions and 12 per cent of those who agreed were in a leadership position. The only area where those in agreement with being prepared had a higher percentage in leadership positions than those who disagreed they were prepared was in 'Plan for and implement effective teaching and learning'.
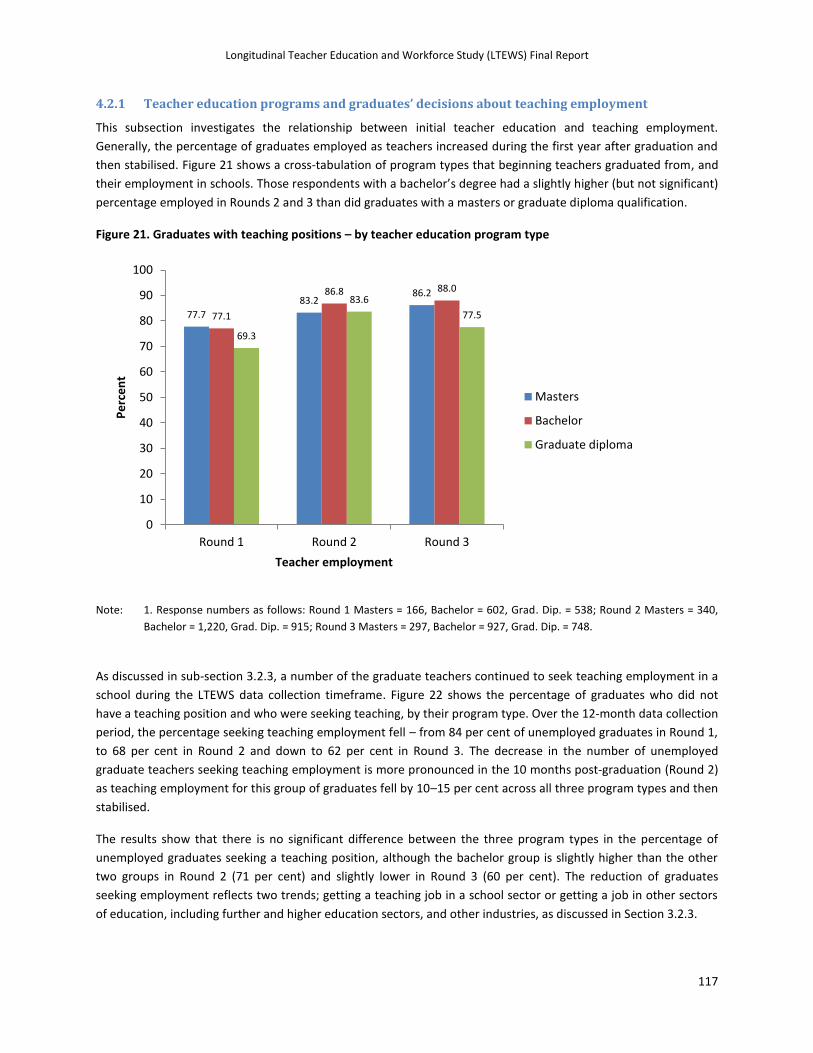
Longitudinal Teacher Education and Workforce Study (LTEWS) Final Report
117
4.2.1 Teacher education programs and graduates’ decisions about teaching employment
This subsection investigates the relationship between initial teacher education and teaching employment.
Generally, the percentage of graduates employed as teachers increased during the first year after graduation and
then stabilised. Figure 21 shows a cross-tabulation of program types that beginning teachers graduated from, and
their employment in schools. Those respondents with a bachelor’s degree had a slightly higher (but not significant)
percentage employed in Rounds 2 and 3 than did graduates with a masters or graduate diploma qualification.
Figure 21. Graduates with teaching positions – by teacher education program type
Note: 1. Response numbers as follows: Round 1 Masters = 166, Bachelor = 602, Grad. Dip. = 538; Round 2 Masters = 340,
Bachelor = 1,220, Grad. Dip. = 915; Round 3 Masters = 297, Bachelor = 927, Grad. Dip. = 748.
As discussed in sub-section 3.2.3, a number of the graduate teachers continued to seek teaching employment in a
school during the LTEWS data collection timeframe. Figure 22 shows the percentage of graduates who did not
have a teaching position and who were seeking teaching, by their program type. Over the 12-month data collection
period, the percentage seeking teaching employment fell – from 84 per cent of unemployed graduates in Round 1,
to 68 per cent in Round 2 and down to 62 per cent in Round 3. The decrease in the number of unemployed
graduate teachers seeking teaching employment is more pronounced in the 10 months post-graduation (Round 2)
as teaching employment for this group of graduates fell by 10–15 per cent across all three program types and then
stabilised.
The results show that there is no significant difference between the three program types in the percentage of
unemployed graduates seeking a teaching position, although the bachelor group is slightly higher than the other
two groups in Round 2 (71 per cent) and slightly lower in Round 3 (60 per cent). The reduction of graduates
seeking employment reflects two trends; getting a teaching job in a school sector or getting a job in other sectors
of education, including further and higher education sectors, and other industries, as discussed in Section 3.2.3.
77.7
83.2 86.2
77.1
86.8 88.0
69.3
83.6
77.5
0
10
20
30
40
50
60
70
80
90
100
Round 1 Round 2 Round 3
Pe
rce
nt
Teacher employment
Masters
Bachelor
Graduate diploma
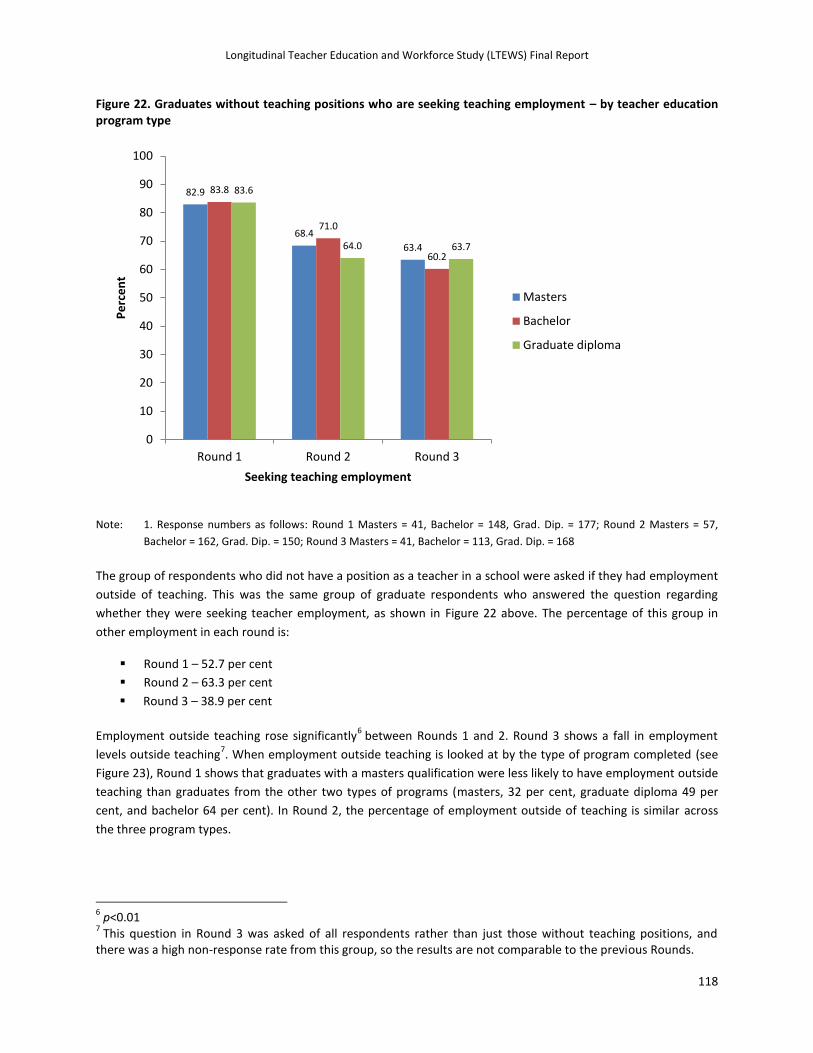
Longitudinal Teacher Education and Workforce Study (LTEWS) Final Report
118
Figure 22. Graduates without teaching positions who are seeking teaching employment – by teacher education program type
Note: 1. Response numbers as follows: Round 1 Masters = 41, Bachelor = 148, Grad. Dip. = 177; Round 2 Masters = 57,
Bachelor = 162, Grad. Dip. = 150; Round 3 Masters = 41, Bachelor = 113, Grad. Dip. = 168
The group of respondents who did not have a position as a teacher in a school were asked if they had employment
outside of teaching. This was the same group of graduate respondents who answered the question regarding
whether they were seeking teacher employment, as shown in Figure 22 above. The percentage of this group in
other employment in each round is:
Round 1 – 52.7 per cent
Round 2 – 63.3 per cent
Round 3 – 38.9 per cent
Employment outside teaching rose significantly6 between Rounds 1 and 2. Round 3 shows a fall in employment
levels outside teaching7. When employment outside teaching is looked at by the type of program completed (see
Figure 23), Round 1 shows that graduates with a masters qualification were less likely to have employment outside
teaching than graduates from the other two types of programs (masters, 32 per cent, graduate diploma 49 per
cent, and bachelor 64 per cent). In Round 2, the percentage of employment outside of teaching is similar across
the three program types.
6 p<0.01
7 This question in Round 3 was asked of all respondents rather than just those without teaching positions, and
there was a high non-response rate from this group, so the results are not comparable to the previous Rounds.
82.9
68.4
63.4
83.8
71.0
60.2
83.6
64.0 63.7
0
10
20
30
40
50
60
70
80
90
100
Round 1 Round 2 Round 3
Pe
rce
nt
Seeking teaching employment
Masters
Bachelor
Graduate diploma

Longitudinal Teacher Education and Workforce Study (LTEWS) Final Report
119
Figure 23. Graduates without teaching positions who have employment outside teaching – by teacher education program type
Note: 1. Response numbers as follows: Round 1 Masters = 41, Bachelor = 148, Grad. Dip. = 177; Round 2 Masters = 57,
Bachelor = 161, Grad. Dip. = 148; Round 3 Masters = 129, Bachelor = 391, Grad. Dip. = 442.
2. Round 3 is not comparable with previous rounds as the response rate to this question was low (54 per cent).
Graduates’ main area of their teacher education program was then cross-tabulated with having a teaching position
in a school, and is shown in Figure 24 below. The figure shows that those respondents in the area of early
childhood had a slightly higher (but not significant) percentage employed in teaching in Rounds 2 and 3 than did
graduates from other program areas.
This pattern of teacher employment demonstrates the dynamics of opportunities available to graduate teachers.
The highest take up of opportunities for employment relative to the cohort size and over the 3 Rounds, seemed to
occur in the early childhood sector. It appears that in all other sectors some increase in take up of job
opportunities occurred between Round 1 and Round 2 and then flattened by Round 3.
31.7
61.4
42.3
63.5 68.3
35.6
48.6
58.1
40.2
0
10
20
30
40
50
60
70
80
90
100
Round 1 Round 2 Round 3
Pe
rce
nt
Employment outside teaching
Masters
Bachelor
Graduate diploma

Longitudinal Teacher Education and Workforce Study (LTEWS) Final Report
120
Figure 24. Graduates with teaching positions – by main area of teacher education program
Note: 1. Response numbers as follows: Round 1 Early Childhood = 51, EC/Prim = 83, Primary = 479, Prim/Sec = 109,
Secondary = 575; Round 2 Early Childhood = 97, EC/Prim = 152, Primary = 925, Prim/Sec = 238, Secondary = 1,074;
Round 3 Early Childhood = 67, EC/Prim = 130, Primary = 743, Prim/Sec = 184, Secondary = 884.
Figure 25. Graduates without teaching positions seeking teaching employment – by main area of teacher education program
Note: 1. Response numbers as follows: Round 1 Early Childhood = 14, EC/Prim = 23, Primary = 140, Prim/Sec = 32,
Secondary = 155; Round 2 Early Childhood = 12, EC/Prim = 28, Primary = 121, Prim/Sec = 29, Secondary = 181; Round
3 Early Childhood = 5, EC/Prim = 21, Primary = 108, Prim/Sec = 27, Secondary = 165.
74.5
87.6 92.5
74.7 81.6 83.8
74.3
86.9 85.7
73.4
87.8 85.3 73.6
83.2 81.3
0
10
20
30
40
50
60
70
80
90
100
Round 1 Round 2 Round 3
Pe
rce
nt
Teacher employment
Early childhood
EC/Primary
Primary
Prim/Sec
Secondary
64.3
50.0
80.0 87.0
64.3
52.4
88.6
74.4
60.2
78.1 75.9
66.7
82.6
64.1 63.6
0
10
20
30
40
50
60
70
80
90
100
Round 1 Round 2 Round 3
Pe
rce
nt
Seeking teaching employment
Early childhood
EC/Primary
Primary
Prim/Sec
Secondary

Longitudinal Teacher Education and Workforce Study (LTEWS) Final Report
121
Figure 25 shows the group of graduates who were seeking a teaching position in a school, disaggregated by the
main area of their teacher education program.
In Rounds 1 and 2, there was a lower percentage of unemployed graduates with qualifications in early childhood
than in the other four areas, seeking a teaching position, but in Round 3, the early childhood respondents had a
higher percentage seeking teaching work. The percentage of early childhood/primary and primary area graduates
seeking work consistently decreased across the three rounds, whereas secondary graduate percentages decreased
from Round 1 to Round 2 then remained the same for Round 3. The group of respondents who did not have a
position as a teacher in a school was asked if they had employment outside of teaching. This is the same group of
graduate respondents who answered the question regarding whether they were seeking teacher employment, as
shown in the Figure above.8
When employment outside of teaching is looked at by the main area of program completed, Round 1 shows that
graduates from early childhood and middle school programs were more likely to have employment outside a
school than graduates from the other three types of programs (early childhood, 64 per cent and
primary/secondary 66 per cent, with early childhood/primary 52 per cent, primary 54 per cent, and secondary 47
per cent). In Round 2, the percentages show a different employment pattern across the area of teaching: early
childhood/primary have the highest level of employment outside teaching, with 79 per cent, then primary (69 per
cent), primary/secondary (61 per cent), secondary (58 per cent), and early childhood (50 per cent).
Figure 26. Graduates without teaching positions who have employment outside teaching – by main area of teacher education program
8 Again, in Round 3 the question on employment outside of teaching was asked of all respondents rather than just
those without teaching positions and there was a high non-response rate from this group, so the results are not comparable to the previous rounds
64.3
50.0
0.0
52.2
78.6
37.5
53.6
69.2
41.8
65.6 60.7
46.2
47.1
58.3
38.3
0
10
20
30
40
50
60
70
80
90
100
Round 1 Round 2 Round 3
Pe
rce
nt
Employment outside teaching
Early childhood
EC/Primary
Primary
Prim/Sec
Secondary

Longitudinal Teacher Education and Workforce Study (LTEWS) Final Report
122
Note: 1. Response numbers as follows: Round 1 Early Childhood = 14, EC/Prim = 23, Primary = 140, Prim/Sec = 32,
Secondary = 155; Round 2 Early Childhood = 12, EC/Prim = 28, Primary = 121, Prim/Sec = 29, Secondary = 181; Round
3 Early Childhood = 2, EC/Prim = 8, Primary = 55, Prim/Sec = 13, Secondary = 94.
2. Round 3 is not comparable with previous rounds as the response rate to this question was low (54 per cent).
The data show the changing opportunities for employment in terms of both the teaching profession and other
occupations. In such circumstances, graduate teachers considered a wider range of occupational as well as non-
occupational factors. The analysis of survey free text responses showed that the main factors in deciding not to
seek teaching employment were job availability, further education and family circumstances. Other factors
included relative salaries in teaching and other careers, other labour market opportunities, and varying relative
non-pecuniary conditions of work.
Previous research on the topic of graduating teachers’ decision-making has identified several factors that can act
as enticements into teaching. Higher salaries received by teacher have consistently been identified as increasing
the likelihood of seeking teaching employment, or reducing the likelihood of teachers exiting the profession. The
estimated impact of salaries on the supply of labour is frequently large, with the exception of a study by Frijters,
Shields & Wheatley Price (2004) which found a lower impact. Other frequently observed results include that
pecuniary effects are larger for men than for women. In addition, results generally show that teachers with higher-
level qualifications, or living in areas with higher average non-teaching salaries, are more likely to leave their
teaching jobs. A limited number of studies have also considered the quality of teachers, with the general finding
being that higher salaries paid to teachers raises teaching quality, e.g. as measured by the teachers’ impact on
learning outcomes or test scores (Hanushek, Kain, & Rivkin, 1999; Stinebrickner, 2001).
It should be noted, however, that non-pecuniary factors such as workload, job stress and the public perception of
the profession, as well as individual preferences, are also likely to play an important role in the decision to enter
teaching. For example, the study conducted by Smithers and Robinson (2003) found that potential teachers
perceived such conditions adversely. Salhberg (2011) argues that teaching in Finland is one of the most respected
professions. As a result, school teaching is the most sought-after career. Although the status of teachers can be
attributed to the cultural characteristics of society, the examination of high-performing jurisdictions suggests that
trust and respect can be, in large measure, the result of the implementation of specific policies and practices.
In LTEWS, the patterns of seeking employment by main areas of teacher education do not show a relationship
between the area of teacher education program and a decision whether or not to seek teaching employment. The
fluctuation of data seems to reflect the state of the labour market. In considering whether or not to teach,
graduates take into account pecuniary and non-pecuniary factors, including workload, job stress, public perception
of the profession, further studies, family circumstances, as well as individual preferences.
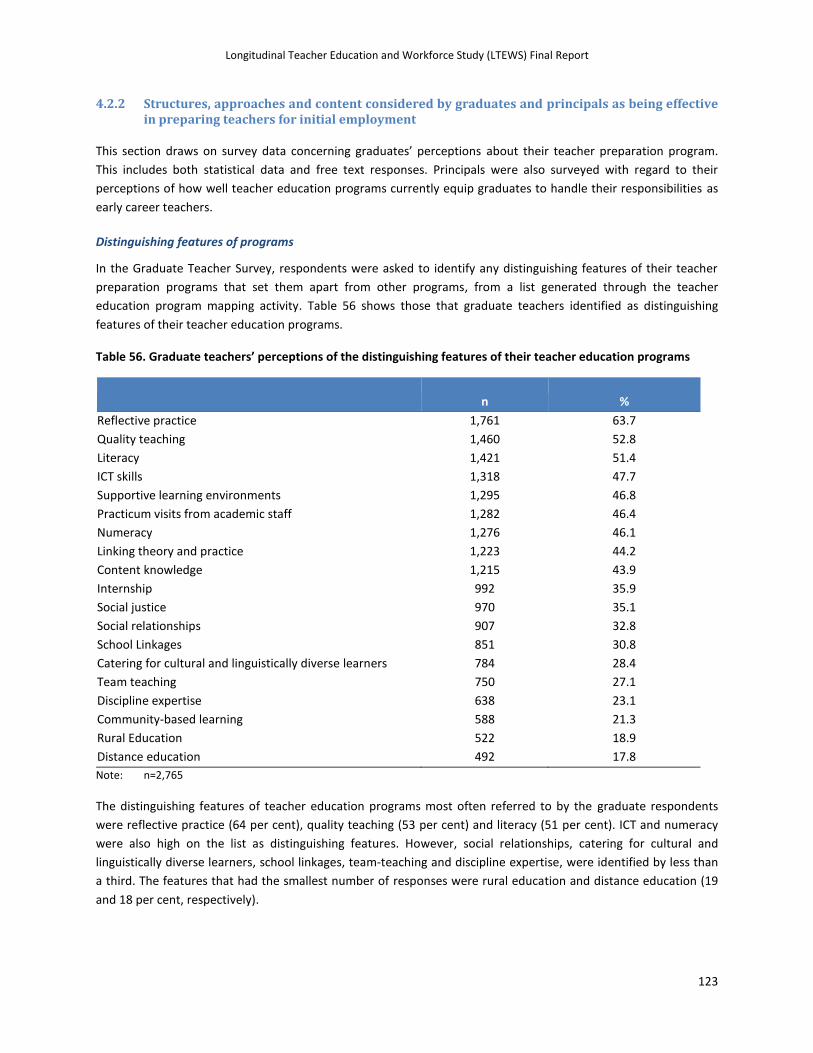
Longitudinal Teacher Education and Workforce Study (LTEWS) Final Report
123
4.2.2 Structures, approaches and content considered by graduates and principals as being effective in preparing teachers for initial employment
This section draws on survey data concerning graduates’ perceptions about their teacher preparation program.
This includes both statistical data and free text responses. Principals were also surveyed with regard to their
perceptions of how well teacher education programs currently equip graduates to handle their responsibilities as
early career teachers.
Distinguishing features of programs
In the Graduate Teacher Survey, respondents were asked to identify any distinguishing features of their teacher
preparation programs that set them apart from other programs, from a list generated through the teacher
education program mapping activity. Table 56 shows those that graduate teachers identified as distinguishing
features of their teacher education programs.
Table 56. Graduate teachers’ perceptions of the distinguishing features of their teacher education programs
n %
Reflective practice 1,761 63.7
Quality teaching 1,460 52.8
Literacy 1,421 51.4
ICT skills 1,318 47.7
Supportive learning environments 1,295 46.8
Practicum visits from academic staff 1,282 46.4
Numeracy 1,276 46.1
Linking theory and practice 1,223 44.2
Content knowledge 1,215 43.9
Internship 992 35.9
Social justice 970 35.1
Social relationships 907 32.8
School Linkages 851 30.8
Catering for cultural and linguistically diverse learners 784 28.4
Team teaching 750 27.1
Discipline expertise 638 23.1
Community-based learning 588 21.3
Rural Education 522 18.9
Distance education 492 17.8
Note: n=2,765
The distinguishing features of teacher education programs most often referred to by the graduate respondents
were reflective practice (64 per cent), quality teaching (53 per cent) and literacy (51 per cent). ICT and numeracy
were also high on the list as distinguishing features. However, social relationships, catering for cultural and
linguistically diverse learners, school linkages, team-teaching and discipline expertise, were identified by less than
a third. The features that had the smallest number of responses were rural education and distance education (19
and 18 per cent, respectively).

Longitudinal Teacher Education and Workforce Study (LTEWS) Final Report
124
When graduates' perceptions of distinguishing features were cross-tabulated with program type, the following
results occurred. The distinguishing features are listed in Table 57 below in the order of their ranking according to
those from a Bachelor of Education program.
Table 57. Graduate teacher perceptions of teacher education program distinguishing features – by program type
Masters Bachelor Grad. Dip.
n % n % n %
Reflective practice 259 72.1 872 68.8 622 65.5
Quality teaching 207 57.7 773 61.0 475 50.1
Literacy 189 52.6 770 60.8 457 48.2
Numeracy 159 44.3 707 55.8 405 42.7
Supportive learning 154 42.9 690 54.5 443 46.7
ICT skills 173 48.2 689 54.4 451 47.5
Practicum visits from academic staff 175 48.7 677 53.4 424 44.7
Content knowledge 161 44.8 674 53.2 375 39.5
Linking theory and practice 173 48.2 632 49.9 411 43.3
Internship 122 34.0 629 49.6 237 25.0
Social justice 143 39.8 546 43.1 278 29.3
Social relationships 111 30.9 497 39.2 293 30.9
School linkages 126 35.1 437 34.5 284 29.9
Team teaching 98 27.3 422 33.3 226 23.8
Catering for cultural and linguistically
diverse learners 118 32.9 409 32.3 254 26.8
Community learning 75 20.9 374 29.5 135 14.2
Discipline expertise 99 27.6 320 25.3 213 22.4
Rural education 58 16.2 314 24.6 147 15.5
Distance education 49 13.6 259 20.4 182 19.2
Note: Masters n=359, Bachelor n=1,267, Grad. Dip. n=949
The top three distinguishing features, referred to by respondents, were the same for all three program types.
Across the three program types, reflective practice was perceived as a distinguishing feature by 72 per cent of
those with a masters teacher education qualification, 69 per cent of those with a bachelor’s degree and 66 per
cent of those with a graduate or postgraduate diploma. Numeracy was higher up the list for those with a
bachelor’s degree, with 56 per cent indicating this as a distinguishing feature compared to 44 per cent of those
from a masters program and 43 per cent of those from a graduate program. The distinguishing features referred to
least by respondents were rural education and distance education for those from a masters and bachelor program.
For graduate diploma respondents, community learning and rural education were the two least referred to
features.
Information on how some of the above features were incorporated into teacher education programs was gathered
from the teacher education institutions as part of the initial teacher education mapping component of the project.
Key personnel in the institutions were asked to nominate whether some of the above features were addressed in
their teacher education programs as stand-alone units, embedded in the overall program, or in a combination of

Longitudinal Teacher Education and Workforce Study (LTEWS) Final Report
125
both ways. The programs in which graduate teacher respondents were enrolled were cross-tabulated with this
information and are shown in Table 58 below.
Table 58. Graduate teacher perceptions of teacher education program distinguishing features – by type of delivery
Standalone Embedded Combination NA
n % n % n % n %
Discipline knowledge 946 78.7 63 5.2 193 16.1 - 0.0
Teaching culturally, linguistically and
socio-economically diverse learners 372 30.6 320 26.3 453 37.3 71 5.8
ICT 219 17.2 370 29.1 534 41.9 150 11.8
Numeracy 200 13.9 535 37.1 330 22.9 354 24.5
Literacy 197 13.5 461 31.7 419 28.8 354 24.3
Assessment knowledge 355 26.1 467 34.3 467 34.3 71 5.2
Pedagogical knowledge 303 22.3 490 36.0 496 36.5 71 5.2
Curriculum knowledge 177 13.0 484 35.6 628 46.2 71 5.2
Classroom management skills 327 26.0 381 30.3 479 38.1 71 5.6
Note: n=2,765
As expected, the key feature with the highest percentage being delivered as a stand-alone unit is discipline
knowledge (79 per cent). Distinguishing features that are more commonly embedded than others include
numeracy (37 per cent) and pedagogical knowledge (36 per cent). Features that are more commonly addressed in
teacher education programs in a combination of stand-alone and embedded units are curriculum knowledge (46
per cent) and ICT (42 per cent).
Table 59 shows the institutional view of distinguishing features of teacher education programs compared to the
graduate respondents' views of distinguishing features. The institutional information was collected for the
mapping component of the project.
Table 59. Distinguishing features of teacher education programs – by graduate teachers and institutions
Graduates' views Institutional views
n % n %
Social justice 500 27.2 28 63.6
Discipline/method knowledge 409 22.2 18 40.9
Community partnerships 448 24.4 18 40.9
School-university partnerships 293 15.9 15 34.1
Developing reflective practitioners 273 14.8 14 31.8
Quality teaching/quality programs 234 12.7 13 29.5
Ongoing professional learning 291 15.8 13 29.5
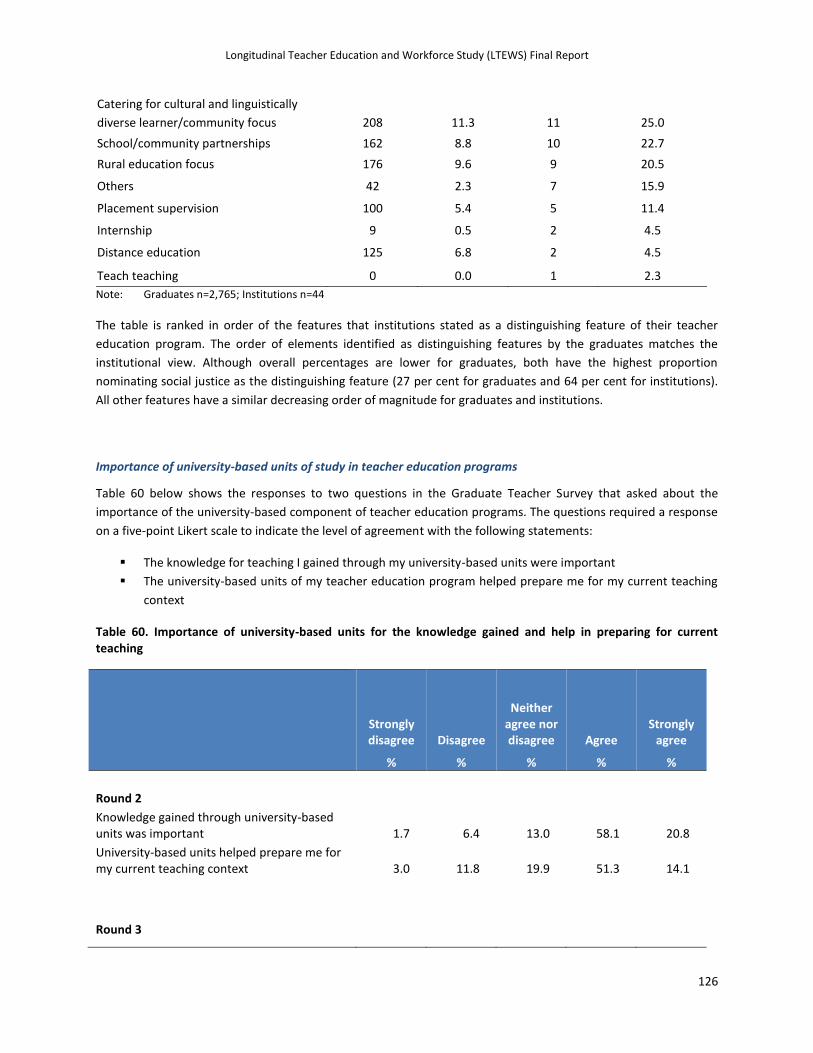
Longitudinal Teacher Education and Workforce Study (LTEWS) Final Report
126
Catering for cultural and linguistically
diverse learner/community focus 208 11.3 11 25.0
School/community partnerships 162 8.8 10 22.7
Rural education focus 176 9.6 9 20.5
Others 42 2.3 7 15.9
Placement supervision 100 5.4 5 11.4
Internship 9 0.5 2 4.5
Distance education 125 6.8 2 4.5
Teach teaching 0 0.0 1 2.3
Note: Graduates n=2,765; Institutions n=44
The table is ranked in order of the features that institutions stated as a distinguishing feature of their teacher
education program. The order of elements identified as distinguishing features by the graduates matches the
institutional view. Although overall percentages are lower for graduates, both have the highest proportion
nominating social justice as the distinguishing feature (27 per cent for graduates and 64 per cent for institutions).
All other features have a similar decreasing order of magnitude for graduates and institutions.
Importance of university-based units of study in teacher education programs
Table 60 below shows the responses to two questions in the Graduate Teacher Survey that asked about the
importance of the university-based component of teacher education programs. The questions required a response
on a five-point Likert scale to indicate the level of agreement with the following statements:
The knowledge for teaching I gained through my university-based units were important
The university-based units of my teacher education program helped prepare me for my current teaching
context
Table 60. Importance of university-based units for the knowledge gained and help in preparing for current teaching
Strongly disagree Disagree
Neither agree nor disagree Agree
Strongly agree
% % % % %
Round 2
Knowledge gained through university-based units was important 1.7 6.4 13.0 58.1 20.8
University-based units helped prepare me for my current teaching context 3.0 11.8 19.9 51.3 14.1
Round 3

Longitudinal Teacher Education and Workforce Study (LTEWS) Final Report
127
Knowledge gained through university-based units was important 2.1 8.5 14.1 56.7 18.5
University-based units helped prepare me for my current teaching context 4.4 14.2 20.6 48.1 12.7
The data show that in both surveys, respondents were more likely to agree that the knowledge gained was
important (78.9 per cent in Round 2 and 75.2 per cent in Round 3) than to agree that the units helped prepare
them for their current teaching (65.4 per cent in Round 2 and 60.8 per cent in Round 3).
The level of disagreement with both statements rose slightly from Round 2 to Round 3; disagreement that the
knowledge gained was important rose from 8 per cent in Round 2 to almost 11 per cent in Round 3; disagreement
that the units helped prepare them for their current teaching rose from 15 per cent in Round 2 to almost 19 per
cent in Round 3.
Responses to the statement 'University-based units helped prepare me for my current teaching context' were then
cross-tabulated with the distinguishing features of teacher education programs. This analysis was conducted to
look for possible relationships between distinguishing features of programs and graduates’ level of agreement that
university-based content helped prepare them for their current teaching.
In Table 61 below, an agreement level higher than 65.4 per cent (combining 51.3 'agree' + 14.1 'strongly agree' as
shown for statement 2 in Round 2 in the table above) indicates there may be a positive relationship between that
particular distinguishing feature and agreement that university-based units prepared graduates for their teaching.
Table 61. Importance of university-based units for the knowledge gained and help in preparing for current teaching
University-based units helped prepare
me for my current teaching context
Strongly
disagree Disagree
Neither
agree nor
disagree Agree
Strongly
agree
% % % % %
School linkages 2.6 7.9 16.6 54.4 18.5
Community-based learning 1.9 8.5 15.8 55.7 18.1
Reflective practice 2.4 8.9 17.8 55.4 15.5
Social justice 2.2 9.3 15.8 55.3 17.3
Discipline expertise 1.9 7.0 15.5 54.2 21.4
Internship 2.1 10.7 20.3 53.2 13.7
Quality teaching 1.8 7.8 16.3 55.8 18.2
Distance education 3.3 7.3 14.6 57.0 17.8
Team teaching 1.7 7.3 15.6 57.2 18.3
Practicum visits from academic staff 2.3 9.4 18.5 53.2 16.6
Rural education 1.4 10.9 16.4 51.4 19.8
CALD learners 2.3 8.8 13.9 52.9 22.1
Linking theory and practice 1.9 6.1 15.3 56.7 20.0
ICT skills 2.0 8.4 16.4 55.7 17.6
Literacy 2.3 8.5 17.0 56.2 16.0
Numeracy 1.9 9.1 16.7 55.8 16.6
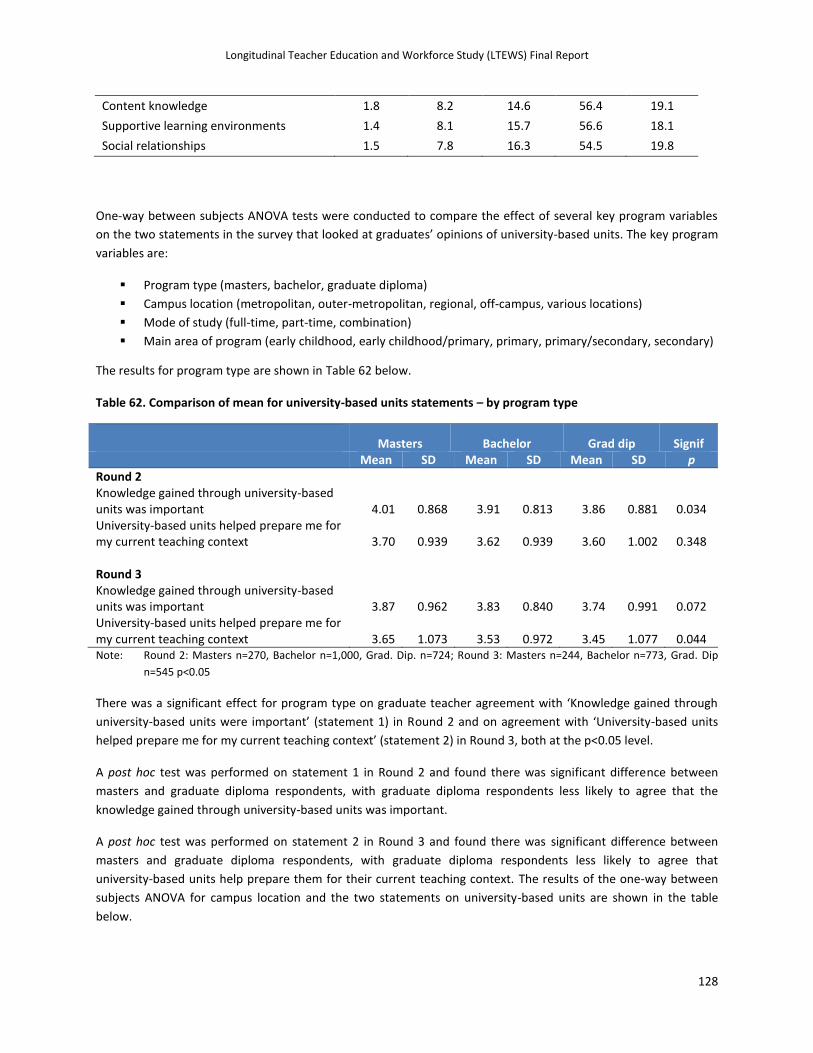
Longitudinal Teacher Education and Workforce Study (LTEWS) Final Report
128
Content knowledge 1.8 8.2 14.6 56.4 19.1
Supportive learning environments 1.4 8.1 15.7 56.6 18.1
Social relationships 1.5 7.8 16.3 54.5 19.8
One-way between subjects ANOVA tests were conducted to compare the effect of several key program variables
on the two statements in the survey that looked at graduates’ opinions of university-based units. The key program
variables are:
Program type (masters, bachelor, graduate diploma)
Campus location (metropolitan, outer-metropolitan, regional, off-campus, various locations)
Mode of study (full-time, part-time, combination)
Main area of program (early childhood, early childhood/primary, primary, primary/secondary, secondary)
The results for program type are shown in Table 62 below.
Table 62. Comparison of mean for university-based units statements – by program type
Masters Bachelor Grad dip Signif
Mean SD Mean SD Mean SD p
Round 2 Knowledge gained through university-based units was important 4.01 0.868 3.91 0.813 3.86 0.881 0.034 University-based units helped prepare me for my current teaching context 3.70 0.939 3.62 0.939 3.60 1.002 0.348 Round 3 Knowledge gained through university-based units was important 3.87 0.962 3.83 0.840 3.74 0.991 0.072 University-based units helped prepare me for my current teaching context 3.65 1.073 3.53 0.972 3.45 1.077 0.044 Note: Round 2: Masters n=270, Bachelor n=1,000, Grad. Dip. n=724; Round 3: Masters n=244, Bachelor n=773, Grad. Dip
n=545 p<0.05
There was a significant effect for program type on graduate teacher agreement with ‘Knowledge gained through
university-based units were important’ (statement 1) in Round 2 and on agreement with ‘University-based units
helped prepare me for my current teaching context’ (statement 2) in Round 3, both at the p<0.05 level.
A post hoc test was performed on statement 1 in Round 2 and found there was significant difference between
masters and graduate diploma respondents, with graduate diploma respondents less likely to agree that the
knowledge gained through university-based units was important.
A post hoc test was performed on statement 2 in Round 3 and found there was significant difference between
masters and graduate diploma respondents, with graduate diploma respondents less likely to agree that
university-based units help prepare them for their current teaching context. The results of the one-way between
subjects ANOVA for campus location and the two statements on university-based units are shown in the table
below.

Longitudinal Teacher Education and Workforce Study (LTEWS) Final Report
129
The results of the one-way ANOVA for campus location and the two statements on university-based units are
shown in Table 63 below. The results for both rounds show no significant differences in agreement with the two
statements for respondents by their campus location.
Table 63. Comparison of mean, for agreement with statements on university-based units – by campus location
Metro Outer metro Regional Off-campus Various Signif
Mean SD Mean SD Mean SD Mean SD Mean SD p
Round 2 Knowledge gained through university-based units was important 3.90 0.886 3.89 0.794 3.90 0.845 4.00 0.807 3.86 0.912 0.603 University-based units helped prepare me for my current teaching context 3.64 0.973 3.59 0.922 3.54 0.987 3.69 0.987 3.71 0.860 0.407 Round 3 Knowledge gained through university-based units was important 3.78 0.958 3.77 0.88 3.84 0.790 3.79 0.979 4.09 0.879 0.377 University-based units helped prepare me for my current teaching context 3.49 1.033 3.55 1.026 3.55 0.962 3.46 1.120 3.64 1.194 0.798
Note: Round 2: Metro n=888, Outer metro n=133, Regional n=335, Off-campus n=213, Various n=35; Round 3: Metro n=707,
Outer metro n=128, Regional n=255, Off-campus n=180, Various n=33 p<0.05
The results of the one-way ANOVA for mode of study and the two statements on university-based units are shown
in Table 64 below. There was a significant effect for mode of study on graduate teacher agreement with statement
1 in Rounds 2 and 3 and on agreement with statement 2 in Round 2, both at the p<0.05 level.
Table 64. Comparison of mean, for agreement with statements on university-based units – by mode of study
Full-time Part-time Combination Signif
Mean SD Mean SD Mean SD p
Round 2 Knowledge gained through university-based units was important 3.90 0.900 4.10 0.800 3.90 0.900 0.001 University-based units helped prepare me for my current teaching context 3.60 0.972 3.80 0.943 3.60 0.980 0.031 Round 3 Knowledge gained through university-based units was important 3.80 0.900 4.00 0.800 3.90 0.800 0.008 University-based units helped prepare me for my current teaching context 3.50 1.000 3.70 1.000 3.60 1.000 0.056 Note: Round 2: Full-time n=1,269, Part-time n=180, Combination n=154; Round 3: Full-time n=1,041, Part-time n=139,
Combination n=123; p<0.05
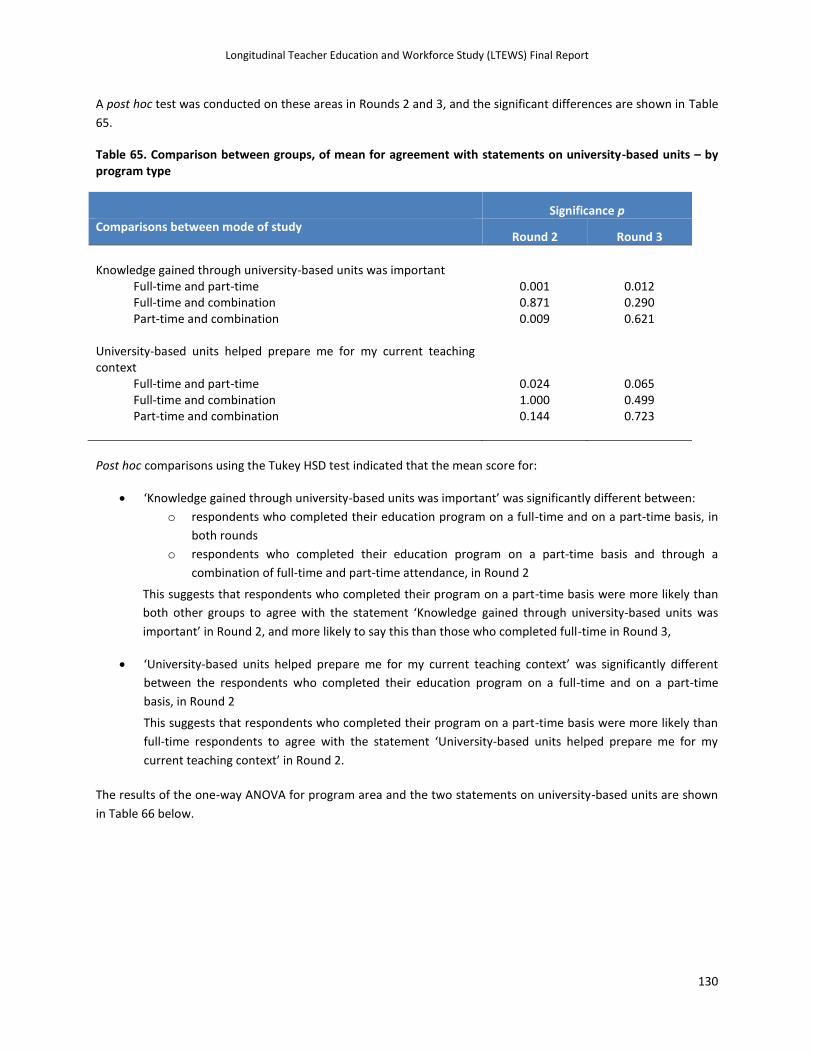
Longitudinal Teacher Education and Workforce Study (LTEWS) Final Report
130
A post hoc test was conducted on these areas in Rounds 2 and 3, and the significant differences are shown in Table
65.
Table 65. Comparison between groups, of mean for agreement with statements on university-based units – by program type
Significance p
Comparisons between mode of study Round 2 Round 3
Knowledge gained through university-based units was important
Full-time and part-time 0.001 0.012 Full-time and combination 0.871 0.290 Part-time and combination 0.009 0.621
University-based units helped prepare me for my current teaching context
Full-time and part-time 0.024 0.065 Full-time and combination 1.000 0.499 Part-time and combination 0.144 0.723
Post hoc comparisons using the Tukey HSD test indicated that the mean score for:
‘Knowledge gained through university-based units was important’ was significantly different between:
o respondents who completed their education program on a full-time and on a part-time basis, in
both rounds
o respondents who completed their education program on a part-time basis and through a
combination of full-time and part-time attendance, in Round 2
This suggests that respondents who completed their program on a part-time basis were more likely than
both other groups to agree with the statement ‘Knowledge gained through university-based units was
important’ in Round 2, and more likely to say this than those who completed full-time in Round 3,
‘University-based units helped prepare me for my current teaching context’ was significantly different
between the respondents who completed their education program on a full-time and on a part-time
basis, in Round 2
This suggests that respondents who completed their program on a part-time basis were more likely than
full-time respondents to agree with the statement ‘University-based units helped prepare me for my
current teaching context’ in Round 2.
The results of the one-way ANOVA for program area and the two statements on university-based units are shown
in Table 66 below.
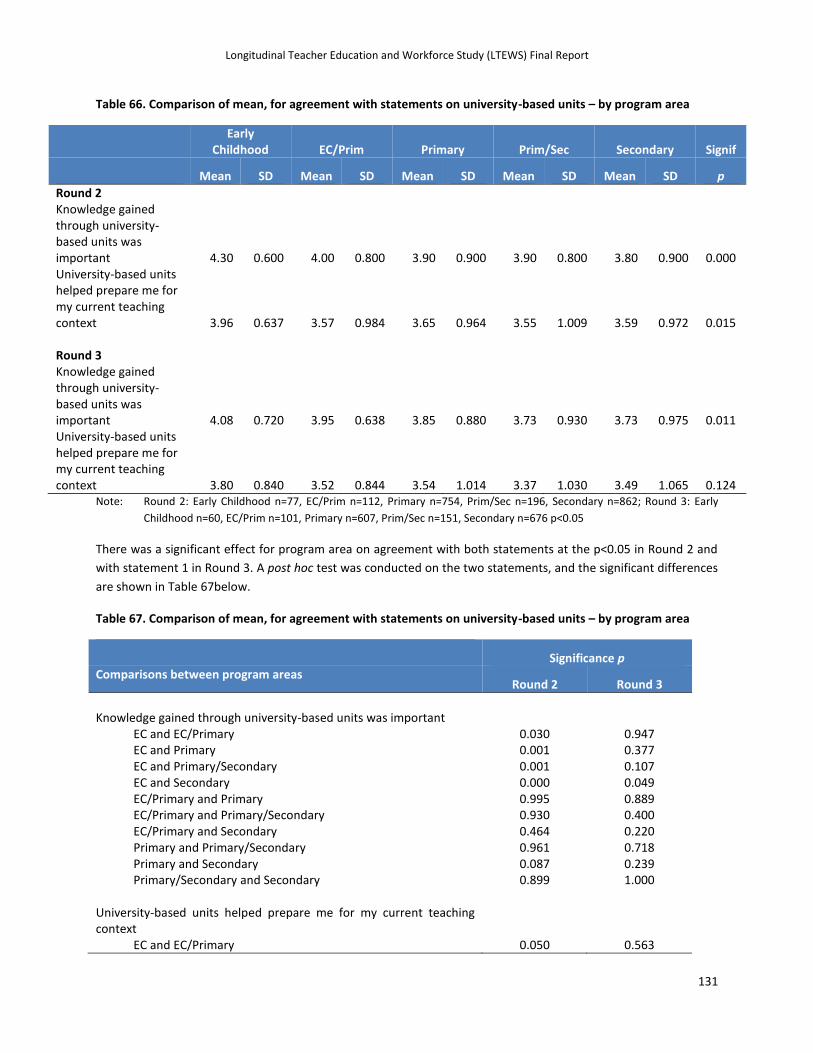
Longitudinal Teacher Education and Workforce Study (LTEWS) Final Report
131
Table 66. Comparison of mean, for agreement with statements on university-based units – by program area
Early
Childhood EC/Prim Primary Prim/Sec Secondary Signif
Mean SD Mean SD Mean SD Mean SD Mean SD p
Round 2 Knowledge gained through university-based units was important 4.30 0.600 4.00 0.800 3.90 0.900 3.90 0.800 3.80 0.900 0.000 University-based units helped prepare me for my current teaching context 3.96 0.637 3.57 0.984 3.65 0.964 3.55 1.009 3.59 0.972 0.015 Round 3 Knowledge gained through university-based units was important 4.08 0.720 3.95 0.638 3.85 0.880 3.73 0.930 3.73 0.975 0.011 University-based units helped prepare me for my current teaching context 3.80 0.840 3.52 0.844 3.54 1.014 3.37 1.030 3.49 1.065 0.124
Note: Round 2: Early Childhood n=77, EC/Prim n=112, Primary n=754, Prim/Sec n=196, Secondary n=862; Round 3: Early
Childhood n=60, EC/Prim n=101, Primary n=607, Prim/Sec n=151, Secondary n=676 p<0.05
There was a significant effect for program area on agreement with both statements at the p<0.05 in Round 2 and
with statement 1 in Round 3. A post hoc test was conducted on the two statements, and the significant differences
are shown in Table 67below.
Table 67. Comparison of mean, for agreement with statements on university-based units – by program area
Significance p
Comparisons between program areas Round 2 Round 3
Knowledge gained through university-based units was important
EC and EC/Primary 0.030 0.947 EC and Primary 0.001 0.377 EC and Primary/Secondary 0.001 0.107 EC and Secondary 0.000 0.049 EC/Primary and Primary 0.995 0.889 EC/Primary and Primary/Secondary 0.930 0.400 EC/Primary and Secondary 0.464 0.220 Primary and Primary/Secondary 0.961 0.718 Primary and Secondary 0.087 0.239 Primary/Secondary and Secondary 0.899 1.000
University-based units helped prepare me for my current teaching context
EC and EC/Primary 0.050 0.563

Longitudinal Teacher Education and Workforce Study (LTEWS) Final Report
132
EC and Primary 0.049 0.431 EC and Primary/Secondary 0.012 0.066 EC and Secondary 0.011 0.208 EC/Primary and Primary 0.941 1.000 EC/Primary and Prim/Secondary 0.999 0.850 EC/Primary and Secondary 1.000 0.999 Primary and Primary/Secondary 0.694 0.427 Primary and Secondary 0.783 0.927 Primary/Secondary and Secondary 0.976 0.798
Post hoc comparisons using the Tukey HSD test indicated that the mean score for:
‘Knowledge gained through university-based units was important’, was significantly different between:
o Early childhood graduates and respondents from all four areas in Round 2
o Early childhood and secondary graduates in Round 3
This suggests that respondents from the early childhood program area were more likely to agree that the
‘Knowledge gained through university-based units was important’ than were all other respondents in
Round 2, and more likely to say this than those whose program area was secondary in Round 3.
‘University-based units helped prepare me for my current teaching context’ was significantly different
between:
o Early childhood graduates and respondents from primary, primary/secondary and secondary
areas in Round 2
This suggests that respondents from the early childhood program area were more likely to agree than
those from primary, primary/secondary and secondary that ‘University-based units helped prepare me for
my current teaching context’.
Principals’ perspectives on challenges faced by graduate teachers and transition difficulties
Principals were asked to name two challenges they perceived graduate teachers faced when they began teaching.
Table 68 provides a summary of the key themes from principals’ responses, ordered by the number of references
given by principals to each.
Table 68. Principals’ views of key challenges faced by newly employed graduate teachers
Challenges
1 Classroom management
2 Pedagogy
3 Catering for diverse learners
4 Assessment and reporting
5 Behaviour management
6 Engagement with parents/families/communities
7 Workload
8 Curriculum
9 Qualities of being an effective teacher
10 Time management
11 Working and learning from other staff
12 Teaching

Longitudinal Teacher Education and Workforce Study (LTEWS) Final Report
133
13 Effectiveness of tertiary degree
14 Student engagement
15 Professional ethics/standards
16 Working and living in a rural or remote area
17 Access to support
18 Administration
19 Special education
The most common area of challenge referred to by principals was classroom management, followed by pedagogy
and catering for diverse learners. Comments from principals in relation to challenges associated with classroom
management include:
Establishing a relationship with students whilst at the same time learning the art of teaching
I am concerned that at times graduate teachers can be intimidated by the students and perhaps “want to
befriend” kids; early career teachers need to make sure they maintain clear expectations of acceptable
behaviour and that they are not afraid to be tough when needed
Comments from principals in relation to challenges associated with pedagogy include:
I have observed a lack of confidence in ability to work within pedagogically sound frameworks
Implementing pedagogical practices that might not fit the culture of the school
Having a comprehensive understanding of the pedagogy that will both engage and support the learner
Comments from principals in relation to challenges associated with catering for diverse learners include:
The complex needs that students from low socio-economic backgrounds and with learning needs bring to
the school settings now
Knowing how to build relationships with students while setting those high expectations and also knowing
what to be tough on when there are so many other personal issues for these students
Principals were also asked what, in their opinion, made graduates’ transition into teaching difficult. The following
table summarises principals’ responses, again ordered by the number of references to each.
Table 69. Principals’ views of key attributes that contribute to a difficult transition into teaching
Attributes
Teacher
Poor teaching skills/classroom management
Lack of interpersonal/communication skills (parents, teachers, students)
Wrong career choice or personal challenges
Do not listen to advice/not willing to improve
Did not seek support
Unable to adapt to the remoteness of school
Unrealistic expectations/lack of understanding of what teaching is about
Unable to connect to school culture

Longitudinal Teacher Education and Workforce Study (LTEWS) Final Report
134
No commitment/enthusiasm to teaching
Unable to work or obstructions to work with other teachers
Unprofessional
Workload pressures/time management
Do not know the curriculum
Lack of confidence
Overconfidence
Not preparing for class
School
Lack of support offered
Lack of induction
No or ineffective mentoring program
Not able to access professional learning opportunities
No performance feedback
Poor selection process
Students
Poor student behaviour
Other
Not prepared adequately by institutions
The most common response was poor teaching skills and classroom management. However, principals also noted
lack of school support and induction as well as lack of interpersonal/communication skills and inadequate teacher
preparation as contributing to a difficult transition into teaching. These attributes reflect partly on the quality of
the preparation provided by initial teacher education programs, but they also connect with issues of school culture
and school support.
Longitudinal Teacher Education and Workforce Study (LTEWS) Final Report
135
4.2.3 Influence of teacher education programs on career retention or advancement
This section presents findings on whether the nature of graduates’ teacher education programs had any impact on
whether they stayed in or left the teaching profession. The data was analysed in various ways to examine this.
First, distinguishing features of teacher education programs were cross-tabulated with variables on retention and
advancement in the longitudinal datasets. This cross-tabulation was further analysed by separating the results
according to school geographical area (i.e. major city, inner regional, out regional, remote and very remote), school
type (i.e. early childhood, primary, secondary and combined) and Aboriginal and Torres Strait Islander focus (i.e.
schools with and without an Aboriginal and Torres Strait Islander focus).
Second, graduates' preparation in the seven Australian Professional Standards for Teachers9 variables was cross-
tabulated with retention and advancement variables. However, the results were not reliable for reasons discussed
further below. As such, the findings are supplemented by analysis of the qualitative data. The interaction of these
two data sets is important as the longitudinal nature of this question cannot be addressed on the basis of the
qualitative data alone.
The nature of teacher education programs was analysed in terms of the distinguishing features of these programs:
Reflective practice
Quality teaching
Literacy
ICT skills
Supportive learning environments
Practicum visits from academic staff
Numeracy
Linking theory and practice
Content knowledge
Internship
Social justice
Social relationships
School Linkages
CALD learners
Team teaching
Discipline expertise
Community-based learning
Rural education
Distance education
These distinguishing features were cross-tabulated with variables on retention and advancement in the
longitudinal datasets – looking at Cohort 2 (which tracks changes over the 6-month period from October 2012 to
March 2013) and Cohort 3 (which tracks changes over the 12-month period from March 2012 to March 2013). No
relationship was found between the distinguishing features of programs and respondents' retention or
9 1) Know students and how they learn; 2) Know the content and how to teach it; 3) Plan for and implement effective teaching
and learning; 4) Create and maintain supportive and safe learning environments; 5) Assess, provide feedback and report on student learning; 6) Engage in professional learning; 7) Engage professionally with colleagues, parents/carers and the community

Longitudinal Teacher Education and Workforce Study (LTEWS) Final Report
136
advancement. The number of respondents in each cell in these calculations was too few, causing standard errors
to be too high for the results to be reliable.
In case there was a relationship between distinguishing features of education programs and
retention/advancement when the school was taken into account, the cross-tabulation of distinguishing features
with retention and advancement was further analysed by separating the results according to:
school geographical area (i.e. major city, inner regional, out regional, remote and very remote)
school type (i.e. early childhood, primary, secondary and combined)
Aboriginal and Torres Strait Islander focus (i.e. schools with and without an Aboriginal and Torres Strait
Islander focus)
The resulting number of respondents in each cell in the calculations for all three of these school characteristics was
too small. This increased the size of the standard error so that results were not reliable.
In order to further investigate the nature of teacher education programs and possible influence on graduates'
career retention and advancement, graduates' preparation in the Australian Professional Standards for Teachers
was substituted for the distinguishing features of programs. The same analysis was conducted, cross-tabulating the
professional standards variables with retention and advancement variables. Again, no relationship was found, and
standard errors in many cells were too large. The two tables below show some results of this cross-tabulated data.
The responses to preparation in the professional standards, which were recorded on a five-point Likert scale from
‘strongly disagree’ to ‘strongly agree’, were grouped into three groups, as follows:
strongly disagree and disagree were merged into one category named 'Disagree'
strongly agree and agree were merged into one category named 'Agree'
neither agree nor disagree remained a category on its own, and was not used for the purpose of this
analysis
The first table, Table 70, shows the percentage for graduates who 'Disagree' and 'Agree' that their teacher
education program prepared them in three of the Australian Professional Standards for Teachers variables, cross-
tabulated with retention and attrition (i.e. left teaching employment). The responses in the data below are from
those graduates who participated in the two Graduate Teacher Surveys over the six months from October 2012 to
March 2013 (Cohort 2).
Table 70. Graduates' level of agreement that their teacher education programs prepared them in the professional standards – by retention and attrition as a teacher in a school
Know students and how
they learn
Know the content and how
to teach it
Plan for and implement
effective teaching and
learning
Disagree Agree Disagree Agree Disagree Agree
% % % % % %
Cohort 2
Retained 95.3 91.7 89.3 92.3 94.5 91.9
Attrition 4.7 8.3 10.7 7.7 5.5 8.1
Total 100.0 100.0 100.0 100.0 100.0 100.0

Longitudinal Teacher Education and Workforce Study (LTEWS) Final Report
137
The results show that those who disagreed that their education program prepared them in 'Know students and
how they learn' had a higher retention rate than those who agreed their program prepared them in this area (95
per cent compared to 92 per cent). This was also the case for the key area 'Plan for and implement effective
teaching and learning', where there was a 95 per cent retention rate for those who disagreed they were prepared
in this area, and a 92 per cent retention rate for those who agreed they were prepared in this area. The only area
where those in agreement with being prepared had a higher retention rate than those who disagreed they were
prepared was in 'Know the content and how to teach it' (92 per cent retention for the 'agrees' and 89 per cent
retention for the 'disagrees').
The second table, Table 71, shows the percentages for graduates who 'Disagree' and 'Agree' that their teacher
education program prepared them in the three professional standards variables, cross-tabulated with having a
leadership position in a school. The responses in the data below are from those graduates who participated in the
two Graduate Teacher Surveys over the 12 months from March 2012 to March 2013 (Cohort 3).
Table 71. Graduates' level of agreement that teacher education programs prepared them in the professional standards – by leadership position as a teacher in a school
Know students and how
they learn
Know the content and how
to teach it
Plan for and implement
effective teaching and
learning
Disagree Agree Disagree Agree Disagree Agree
% % % % % %
Cohort 3
Leadership
position 30.8 13.9 19.2 12.3 11.5 15.6
No leadership
position 69.2 86.1 84.6 77.5 69.2 89.3
Total 100.0 100.0 100.0 100.0 100.0 100.0
The results show that those who disagreed that their education program prepared them in 'Know students and
how they learn' had a higher percentage with a leadership position in a school than those who agreed their
program prepared them in this area (31 per cent compared to 14 per cent). This was also the case for the key area
'Know the content and how to teach it', where 19 per cent of those who disagreed they were prepared in this area
were in a leadership position and 12 per cent of those who agreed they were prepared in this area were in a
leadership position.
The only key area in the standards where those in agreement with being prepared had a higher percentage in
leadership positions than those who disagreed they were prepared was in 'Plan for and implement effective
teaching and learning' (16 per cent in a leadership position for the 'agrees' and 11.5 per cent in a leadership
position for the 'disagrees').
In case relationships between these professional standards variables were dependent on the characteristics of
schools, the results of these cross-tabulations were analysed by the three separate school variables listed above.
The resulting number of respondents in each cell for each school variable analysis was again too small to ensure
reliable results.

Longitudinal Teacher Education and Workforce Study (LTEWS) Final Report
138
Interview data
The analyses of participant interviews demonstrate that most graduates see themselves as beginning professionals
who can impact students’ learning. They attribute their success in part to various features of their teacher
education programs. When asked about their future plans, these graduates responded that ‘they would stay in
their schools and in teaching’. In this regard, qualitative data provides an indirect measure of teacher education
program effectiveness in relation to retention and career progression. The areas of success identified by graduate
teachers in their responses were: assessment and reporting, behaviour management, knowing students and their
engagement, flexibility and adaptability, communication and relationships, collaboration, content knowledge,
creating a positive learning environment, curriculum development, lesson planning, effecting learning, ICT, literacy,
numeracy, student welfare and well-being. However, they identified behaviour management, catering for
diversity, communication with parents, taking leadership roles, subject specific pedagogy and second method,
team-teaching, and using assessment data as challenges.
Beginning teachers perceive their capabilities, workplace conditions and experiences differently from more
experienced teachers. Research demonstrates that the way beginning teachers perceive their general
preparedness is affected, partly, by the level they can engage students and make an impact on their learning,
rather than by their teacher education degrees. Although teachers’ academic degrees have been a traditional
indicator of the qualifications and quality of the teacher workforce, international research has not found that the
highest degree attained by teachers is a good predictor of gains in student achievement (Rivkin & Hanushek, 2005).
A rather consistent finding, however, is that teachers with better academic performance obtain better student
outcomes (Eide, Goldhaber, & Brewer, 2004; Murnane & Steele, 2007).
One graduate teacher’s comment provides a better understanding of how a mismatch in work conditions and
graduate teachers’ expectations can contribute to teacher retention (Box 9). Kirsty’s (not her real name) early
experiences in a challenging school, as a new teacher, were not only difficult but it was a ‘culture shock’ for her.
She cited both the lack of preparation in understanding school realities and the lack of school support and
resources in providing systemic, continued and ongoing professional learning to support her in dealing with the
magnitude of the realities that new teachers face in challenging teaching circumstances. This has profound
implications for induction and mentoring programs that can provide a valuable transition from university to school
settings.

Longitudinal Teacher Education and Workforce Study (LTEWS) Final Report
139
Box 9. ‘A bit of a shock’ Kirsty is on a full-time, permanent contract at a school in South Australia. Kirsty describes the community as having high unemployment and low income. The school has 1400 students from ‘birth to Year 12’. She has been there a year and teaches Year 10, 11 and 12 mathematics. She enjoys the work, but acknowledges the challenges. She has a large number of special needs students, especially students with Asperger’s Syndrome. One of Kirsty’s challenges is a lack of resources in the school. While there is a large Apple program, providing students with access to Apple computers, basic resources such as calculators for use in the mathematics classroom are lacking. Her teacher education program did not prepare her for the challenge of creating her own resources:
‘Universities I think assume you’re going to walk into a school, especially in South Australia that have got textbooks and stuff like that. So that was a bit of a shock really, to walk into a school that d idn’t have anything.’
Kirsty does not have any immediate career aspirations, but would like eventually to be a mathematics coordinator and a good mentor to new teachers. Overall, she feels that her teacher education course contributed to her resilience, and this helped her to meet the challenge of lack of resources. One of the ways it did this was by helping her see learning as an active, self-directed, ongoing process. She improved her research skills in the course and is now confident about using these where she needs to in her teaching, such as finding appropriate resources. A second way the course contributed to her resilience is that it suggested the need to build collegial networks and helped her to do this, though she feels that there could have been even greater emphasis and facilitation of network building in her teacher education program. Practicums were especially useful and particularly for developing reflective practice and for cultivating utilised management strategies. She does not remember either of these things being directly addressed in the non-practicum parts of the teacher education program. She feels more practicums would be useful. A unit on linguistic diversity and second language teaching was also of practical value. She has consciously utilised some of the tools (e.g., the use of an interpreter) and strategies (e.g., allowing students to discuss things in their own language as well as in English) that she gained from this unit. Kirsty also found concepts from educational psychology valuable, such as the zone of proximal development. These made her think about how to set up her classroom, and how to keep students engaged. However she does not feel that these links between theories and practice were made well by the program, partly because of the delay between this learning and classroom practice, and the lack of opportunity to trial and reflect on them. Kirsty feels that while she managed to develop a good knowledge of mathematics, she was not taught how to teach the subject. The teacher education program gave a small amount of attention to the mathematics curriculum and none to how to apply the curriculum in practice. Another weakness perceived by Kirsty is a lack of cohesion in the program as a whole. Some units were repetitive or re-hashed content already covered. Concepts such as Social Justice and Special Needs were covered frequently between units without reference to each other.
Graduate teacher from South Australia, full-time permanent
4.3 Content and relevance of teacher education programs for subsequent
classroom teaching
This section focuses on the content and relevance of teacher education programs for subsequent classroom
teaching. First, graduates’ overall satisfaction with their teacher education programs is discussed. Then,

Longitudinal Teacher Education and Workforce Study (LTEWS) Final Report
140
perceptions of graduate teachers’ level of preparedness and effectiveness in the Australian Professional Standards
for Teachers are tracked at three time points from the time of graduation to early in the second year: Round 1
(March 2013), Round 2 (October 2012), and Round 3 (March 2013). The analyses are augmented and exemplified
with data from the follow-up interviews with selected graduate teachers.
Box 10 lists the main findings for Section 4.3
Box 10. Main Findings: Content and relevance of teacher education programs for subsequent classroom teaching
For each survey round, approximately three-quarters of graduate teachers who held teaching positions
either agreed or strongly agreed that they would recommend their teacher education program to others (76 per cent in Round 1, 74 per cent in Round 2, and 79 per cent in Round 3). 65-67 per cent of new graduates not teaching would recommend their teacher education program to others.
Graduate teachers who had a teaching position felt more positive about their initial teacher education than those without a teaching position. For example, in Round 3, for those with a teaching position, 79 per cent either strongly agreed or agreed that they would recommend their teacher education program to others, but for those without a teaching position, the agreement group was 65 per cent.
The Australian Professional Standards for Teachers in which more than 75 per cent of graduate teachers felt well prepared by their teacher education programs included 'Engage in professional learning' (89 per cent agreement in Round 1), 'Know students and how they learn' (78 per cent in Round 2) and 'Plan for and implement effective teaching and learning' (76 per cent in Round 2).
Regardless of teacher education program, graduates felt least prepared to ‘Engage professionally with colleagues, parents/carers and the community’ (36 per cent disagreement that their teacher education prepared them in this area) and to ‘Assess, provide feedback and report on student learning’ (25 per cent disagreement).
Overall, less than half of the graduate teachers considered they were well prepared to ‘Engage professionally with colleagues, parents/carers and the community’. This was corroborated by the principals who highlighted engagement with parents, families and communities as one of the key challenges for beginning teachers
(continued on the next page)

Longitudinal Teacher Education and Workforce Study (LTEWS) Final Report
141
Box 10. (continued)
By the end of their first year of teaching, females seem more likely to feel better prepared (and more
effective) than males to ‘Know students and how they learn’, ‘Plan for and implement effective teaching and learning’, ‘Create and maintain supportive and safe learning environments’, ‘Engage in professional learning’ and ‘Engage professionally with colleagues, parents/carers and the community’.
Early in the second year after graduation, graduates who had completed a graduate diploma felt less prepared to 'Know students and how they learn' and 'Know the content and how to teach it', while graduates with a masters degree felt better prepared to 'Know the content and how to teach it' and ‘Assess, provide feedback and report on student learning’. In the first year, graduates with a bachelor’s degree reported feeling better prepared to 'Engage professionally with colleagues, parents/carers and the community'.
In the first year after graduation, early childhood graduates felt better prepared to ‘Create and maintain
supportive and safe learning environments’, 'Assess, provide feedback and report on student learning’, ‘Engage in professional learning’ and ‘Engage professionally with colleagues, parents/carers and the community’. Secondary graduates felt least well prepared in this last area and more effective in relation to the standard 'Know the content and how to teach it' but less effective to ‘Create and maintain supportive and safe learning environments’ and ‘Engage in professional learning’. Primary graduates felt less effective in 'Assessment and the provision of feedback and reporting on student learning'.
More than 80 per cent of graduate teachers felt effective in most standards. They rated themselves highly
effective in the areas of: o Know students and how they learn o Know the content and how to teach it o Plan for and implement effective teaching and learning o Create and maintain supportive and safe learning environments
Principals agreed with graduate teachers’ perceptions of their effectiveness in relation to all the standards
but principals had more positive perceptions of the effectiveness of graduates than the graduates themselves to ‘Plan for and implement effective teaching and learning’.
More graduates considered that they were more effective in teaching in relation to the Australian
Professional Standards for Teachers than they had been prepared in these areas. The key areas with the largest difference between perceptions of being prepared and perceptions of being effective were 'Engage professionally with colleagues, parents/carers and the community' in Rounds 2 and 3, and 'Know the content and how to teach it' in Round 3. This disconnect reflects graduate teachers’ feelings of growing efficacy in teaching over time but also highlights the importance of thinking about learning to teach as a continuum of professional learning, learning that occurs in varying degrees at different times in universities, in schools and in communities.

Longitudinal Teacher Education and Workforce Study (LTEWS) Final Report
142
Graduate teachers’ overall satisfaction with their teacher education program
Overall, a large proportion of graduate teachers felt positive about their teacher education programs and this was
consistent in all three rounds of the Graduate Teacher Surveys. Respondents were asked to indicate their level of
agreement on a five-point scale from ‘strongly disagree’ to ‘strongly agree’ to the question ‘I would recommend
my teacher education program to someone else wishing to qualify as a teacher’. When cross-tabulated with
teaching employment, about three quarters of graduate teachers who held teaching positions either agreed or
strongly agreed that they would recommend their teacher education program to others for all three rounds. Over
12 months (across 2 calendar years), there is no significant change in respondents’ perception of their teacher
education programs, increasing slightly to 79 per cent agreement for this group of teachers (See Table 72).
Table 72. Graduate teachers – by level of agreement with the statement ‘I would recommend my teacher education program to others’
Round 1 Round 2 Round 3
n % n % n %
Teaching
Strongly Disagree 41 4.2 67 3.2 51 3.1
Disagree 92 9.5 175 8.3 126 7.6
Neither Agree nor Disagree 104 10.7 316 14.9 165 10.0
Agree 459 47.4 1003 47.4 824 49.8
Strongly Agree 273 28.2 555 26.2 490 29.6
TOTAL 969 100.0 2,116 100.0 1,656 100.0
Not teaching
Strongly Disagree 21 6.1 22 5.9 19 5.9
Disagree 47 13.7 42 11.4 49 15.2
Neither Agree nor Disagree 45 13.2 61 16.5 45 13.9
Agree 153 44.7 155 41.9 155 48.0
Strongly Agree 76 22.2 90 24.3 55 17.0
TOTAL 342 100.0 370 100.0 323 100.0 Note: Round 1: p<0.05; Round 2 p<0.05; Round 3 p<0.01
Significantly, when compared with those who were not teaching, the results suggest that graduate teachers who
have a teaching position feel more positive about their initial teacher education than those without a teaching
position. This is evident especially in the case of the graduate teachers who had full-time permanent positions with
regular and intensive classroom experiences for the previous six months. For example, in Round 3, for those with a
teaching position, 79 per cent either strongly agreed or agreed that they would recommend their teacher
education program to others, but for those without a teaching position, this agreement group was 65 per cent. For
those with a teaching position, 11 per cent either strongly disagreed or disagreed about recommending their
program to others. In comparison, for those without a teaching position, the disagreement group was 21 per cent.
A chi-square statistic was calculated to examine whether there was a relationship between graduates’ having or
not having a teaching position and their level of satisfaction with their teacher education program. The test was
found to be statistically significant (p<.05 in all three rounds).

Longitudinal Teacher Education and Workforce Study (LTEWS) Final Report
143
This finding was also evident in analysis of the interviews and survey free text responses. First, responses showed
graduate teachers’ concern about the lack of jobs (‘There are very few teaching jobs available and we were not
made fully aware of that’, ‘Too many students, too few jobs’) and second, interview findings showed how graduate
teachers’ employment status influenced their perceptions about their preparation for teaching. While those who
were in permanent teaching positions were more positive about their opportunities to draw on the knowledge and
skills they gained in their teacher education programs, many holding casual and relief positions felt that they were
not able to apply that knowledge and those in positions. Box 11 illustrates an example of this situation.
Graduate teachers’ preparedness in key teaching areas – the Australian Professional Standards for Teachers
The Round 1 Graduate Teacher Survey includes a preparation scale featuring 46 items. The areas covered in the
preparation scale are based on the literature and previous research in the area of preparing teachers for teaching.
This work was prepared for the SETE study, upon which the LTEWS work is based. SETE found the literature
highlights ten key areas of preparedness for teaching, which are as follows:
Collegiality
Understanding, design and implementation of curriculum
Demonstrating an understanding of professional ethics
Engagement in ongoing professional learning
Assessment
Classroom management
Parent and community engagement
Catering for diverse learners
Pedagogy
Relationships with students
Principal components analysis (PCA) on this scale showed that the 46 items reduced to four sub-scales, or
components. The first component contained 22 items from the scale, and did not have a unifying descriptor, other
than ‘preparation’ in general. The other three components found through PCA were assessment, professional
learning and classroom management. Because there was not a clear, single description that encompassed all items
for the first component, the PCA for these 46 items is not useful and was not used in the data analysis. In order to
make it parsimonious to do analysis with these 46 items (such as cross-tabulating demographic information on the
teachers to gauge averages, variability and correlations), the Australian Professional Standards for Teachers were
substituted as the 'principal components' reducing the number of items down from 46 to seven for subsequent
surveys. It was possible to check the commonality of the items that were grouped under each standard by using a
measure of internal consistency (Cronbach's Alpha). See Appendix 16 for more information about refinement of
the preparation scale.
Thus section examines the perceptions of graduate teachers’ level of preparedness and effectiveness in the seven
key areas of teaching framed by the Australian Professional Standards for Teachers:
1. Know the students and how they learn
2. Know the content and how to teach it
3. Plan for and implement effective teaching and learning
4. Create and maintain supportive and safe learning environments

Longitudinal Teacher Education and Workforce Study (LTEWS) Final Report
144
Box 11. ‘I still feel quite uneasy with my identity’ Jenny has experienced considerable difficulty in obtaining teaching employment in Tasmania. She has been limited to doing casual relief work for over a year. She also works as a teacher’s aide in a permanent speech pathology job. Jenny takes a very positive stance towards learning and teaching and is encouraged by the level of support given to her at the school where she has done most of her work, a small primary school in Hobart with strong community links. Experience and time in the classroom in addition to school support have helped her to develop professionally. Jenny still feels that classroom management is a challenge, especially as a relief teacher. Not knowing the students and not knowing classroom routines, she feels she has to try to offer material that is meaningful and adaptable:
‘I think managing classroom behaviour is a bit different for relief teachers, not … knowing the students and not necessarily knowing as well how the teacher’s … classroom rules and values, and how those are implemented.’
She nonetheless feels more confident and feels that her knowledge in primary education is growing everyday:
‘I’ve got more of an understanding of what it is to be a teacher and trying to progress that for myself. Also I’m developing a much better awareness of the developmental trajectory, because I’m teaching across different classes all the time, I’ve got a much better idea of what it means to be a year one typical kind of student and class and what they might enjoy and engage with and do, whereas a lot of that for me previously was quite theoretical.’
She feels that the real challenge for her is to progress her career to become a fully-fledged teacher and to develop skills as a classroom teacher in an ‘ongoing way with the students’. She talks about the contrast between a full-fledged teacher identity versus a relief teacher identity:
‘I still feel really quite uneasy though with my identity as a teacher in that I really want to have an identity as – … I want to develop skills in being a classroom teacher that works in an ongoing way with the students.’
She feels uncertain about whether she is making a difference to student learning. She sees her success and efficacy in terms of how students relate to her and respond to her teaching. On the whole, Jenny feels that her teacher education program has given her a good foundation in terms of curriculum planning. However, she feels uncertain as to how this translates into the situations that she experiences as a relief teacher:
‘You don’t know the students and you can’t do formative assessment to guide your planning, so a lot of the things that I learnt in my pre-service training about planning for students aren’t relevant to me as yet, but they’d be obviously highly relevant if I had a regular class.’
Graduate teacher from Tasmania, Casual Relief
5. Assess, provide feedback and report on student learning
6. Engage in professional learning
7. Engage professionally with colleagues, parents/carers and the community

Longitudinal Teacher Education and Workforce Study (LTEWS) Final Report
145
Three other key areas of teaching were also examined but are discussed later in Section 4.6:
1. Teaching culturally, linguistically and socio-economically diverse learners
2. Use of information and communications technologies (ICT)
3. Literacy and numeracy
The survey included questions to examine two constructs i) preparedness and ii) effectiveness, in the key areas of
teaching based on a five-point Likert scale (1=‘strongly disagree’; 5=’strongly agree’).
The table below shows the results of graduates' level of agreement with their preparation in relation to the
professional standards in all three rounds. The questions were only asked of those respondents who were teaching.
Table 73. Graduate teachers – by preparation in the professional standards
Strongly disagree Disagree
Neither agree nor disagree Agree
Strongly agree
Preparation for: % % % % %
Round 1
Know students and how they learn 1.4 4.6 21.8 57.8 14.4
Know the content and how to teach it 1.2 6.2 28.3 54.7 9.6 Plan for and implement effective teaching and learning 1.0 3.9 21.4 60.9 12.9 Create and maintain supportive and safe learning environments 1.3 9.1 27.6 50.7 11.3 Assess, provide feedback and report on student learning 1.9 5.1 21.8 58.4 12.7
Engage in professional learning 0.6 2.0 8.4 49.6 39.3 Engage professionally with colleagues, parents/carers and the community 1.1 8.2 32.5 48.7 9.5
Round 2
Know students and how they learn 1.0 6.2 15.0 63.5 14.2
Know the content and how to teach it 2.8 14.9 20.5 48.0 13.8 Plan for and implement effective teaching and learning 1.3 8.3 14.5 60.3 15.6 Create and maintain supportive and safe learning environments 1.4 7.4 16.8 55.3 19.1 Assess, provide feedback and report on student learning 5.6 18.8 21.1 43.3 11.1
Engage in professional learning 3.0 9.8 20.2 48.4 18.6 Engage professionally with colleagues, parents/carers and the community 9.6 26.0 27.6 30.2 6.6
Round 3
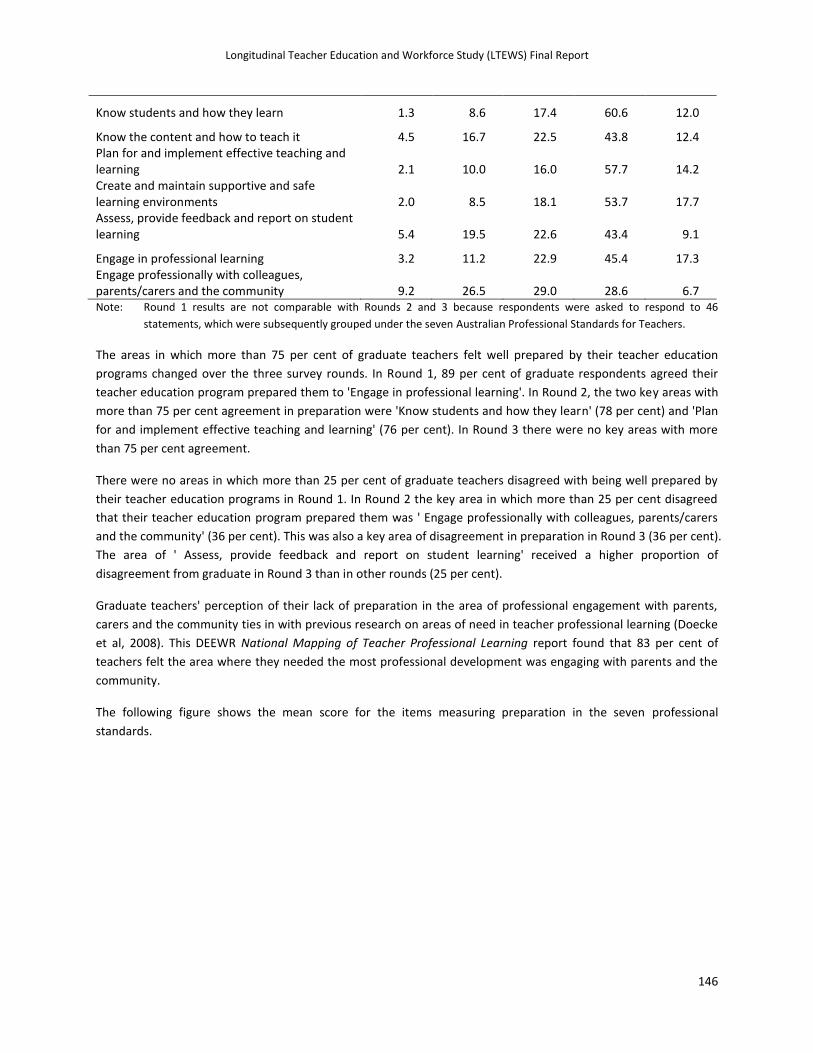
Longitudinal Teacher Education and Workforce Study (LTEWS) Final Report
146
Know students and how they learn 1.3 8.6 17.4 60.6 12.0
Know the content and how to teach it 4.5 16.7 22.5 43.8 12.4 Plan for and implement effective teaching and learning 2.1 10.0 16.0 57.7 14.2 Create and maintain supportive and safe learning environments 2.0 8.5 18.1 53.7 17.7 Assess, provide feedback and report on student learning 5.4 19.5 22.6 43.4 9.1
Engage in professional learning 3.2 11.2 22.9 45.4 17.3 Engage professionally with colleagues, parents/carers and the community 9.2 26.5 29.0 28.6 6.7 Note: Round 1 results are not comparable with Rounds 2 and 3 because respondents were asked to respond to 46
statements, which were subsequently grouped under the seven Australian Professional Standards for Teachers.
The areas in which more than 75 per cent of graduate teachers felt well prepared by their teacher education
programs changed over the three survey rounds. In Round 1, 89 per cent of graduate respondents agreed their
teacher education program prepared them to 'Engage in professional learning'. In Round 2, the two key areas with
more than 75 per cent agreement in preparation were 'Know students and how they learn' (78 per cent) and 'Plan
for and implement effective teaching and learning' (76 per cent). In Round 3 there were no key areas with more
than 75 per cent agreement.
There were no areas in which more than 25 per cent of graduate teachers disagreed with being well prepared by
their teacher education programs in Round 1. In Round 2 the key area in which more than 25 per cent disagreed
that their teacher education program prepared them was ' Engage professionally with colleagues, parents/carers
and the community' (36 per cent). This was also a key area of disagreement in preparation in Round 3 (36 per cent).
The area of ' Assess, provide feedback and report on student learning' received a higher proportion of
disagreement from graduate in Round 3 than in other rounds (25 per cent).
Graduate teachers' perception of their lack of preparation in the area of professional engagement with parents,
carers and the community ties in with previous research on areas of need in teacher professional learning (Doecke
et al, 2008). This DEEWR National Mapping of Teacher Professional Learning report found that 83 per cent of
teachers felt the area where they needed the most professional development was engaging with parents and the
community.
The following figure shows the mean score for the items measuring preparation in the seven professional
standards.

Longitudinal Teacher Education and Workforce Study (LTEWS) Final Report
147
Figure 27. Graduate teachers – by the mean of their preparation in the professional standards
Note: Round 1 n=935; Round 2 n=2,099; Round 3 n=1,727
The professional standards that showed the highest mean score for preparation were: Round 1
Professional learning
Plan for and implement effective teaching and learning Rounds 2 and 3
Know students and how they learn
Creation and maintenance of supportive and safe learning environments The professional standards that showed the lowest mean score for preparation were:
Round 1
Engage professionally with colleagues, parents/carers and the community
Creation and maintenance of supportive and safe learning environments Rounds 2 and 3
Engage professionally with colleagues, parents/carers and the community
Assess, provide feedback and report on student learning
Graduate teachers’ preparedness in the professional standards – by gender
An independent-samples t-test was conducted to compare the means in the seven professional standards by
gender. The results are shown in Table 74.
3.79 3.65
3.81 3.62
3.75
4.25
3.57
3.83 3.55
3.80 3.83
3.35 3.70
2.98
3.74
3.43
3.72 3.76
3.31
3.62
2.97
0.0
0.5
1.0
1.5
2.0
2.5
3.0
3.5
4.0
4.5
Know howstudents learn
Know thecontent
Planning andimplementation
Creation of safelearning
environments
Assessment andfeedback on
student learning
Professionallearning
Engagement withparents/carers
Me
an s
core
Australian Professional Standards for Teachers
Round 1 Round 2 Round 3

Longitudinal Teacher Education and Workforce Study (LTEWS) Final Report
148
Table 74. Comparison of mean for preparation in the professional standards – by gender
Males Females Significance
Preparation for: Mean SD Mean SD p
Round 2 Know students and how they learn 3.74 0.769 3.86 0.782 0.003 Know the content and how to teach it 3.42 1.032 3.59 0.982 0.001 Plan for and implement effective teaching and learning 3.71 0.884 3.83 0.830 0.007 Create and maintain supportive and safe learning environments 3.71 0.927 3.87 0.849 0.001 Assess, provide feedback and report on student learning 3.31 1.099 3.37 1.074 0.322 Engage in professional learning 3.59 1.023 3.73 0.964 0.008 Engage professionally with colleagues, parents/carers and the community 2.78 1.101 3.04 1.094 0.000 Round 3 Know students and how they learn 3.63 0.845 3.77 0.820 0.004 Know the content and how to teach it 3.35 1.122 3.45 1.026 0.093 Plan for and implement effective teaching and learning 3.63 0.902 3.75 0.902 0.024 Create and maintain supportive and safe learning environments 3.62 0.962 3.81 0.889 0.001 Assess, provide feedback and report on student learning 3.28 1.047 3.32 1.056 0.448 Engage in professional learning 3.51 1.068 3.66 0.978 0.016 Engage professionally with colleagues, parents/carers and the community 2.81 1.095 3.02 1.084 0.001 Note: Round 2: males n= 464; females n= 1,637; Round 3: males n= 381; females n= 1,346 p<0.05
There was a significant difference in the scores for males and females in six of the key areas in Round 2:
‘Know students and how they learn’
‘Know the content and how to teach it’
‘Plan for and implement effective teaching and learning’
‘Create and maintain supportive and safe learning environments’
‘Engage in professional learning’
‘Engage professionally with colleagues, parents/carers and the community’
These results suggest that gender has an effect on feeling prepared in the professional standards areas. Round 3
showed significant differences in the scores for males and females for all the six standards listed above except for
'Know the content and how to teach it'. By the end of their first year of teaching, females seemed more likely to
feel better prepared in five of the seven professional standards than males.
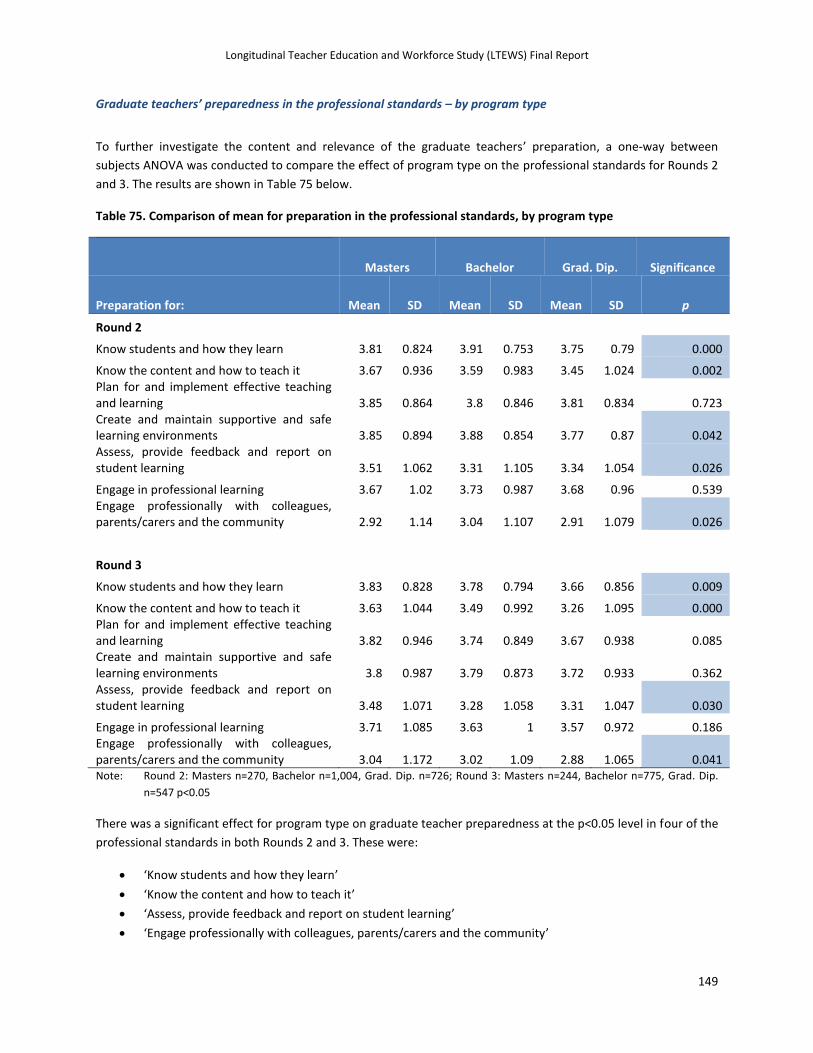
Longitudinal Teacher Education and Workforce Study (LTEWS) Final Report
149
Graduate teachers’ preparedness in the professional standards – by program type
To further investigate the content and relevance of the graduate teachers’ preparation, a one-way between
subjects ANOVA was conducted to compare the effect of program type on the professional standards for Rounds 2
and 3. The results are shown in Table 75 below.
Table 75. Comparison of mean for preparation in the professional standards, by program type
Masters Bachelor Grad. Dip. Significance
Preparation for: Mean SD Mean SD Mean SD p
Round 2
Know students and how they learn 3.81 0.824 3.91 0.753 3.75 0.79 0.000
Know the content and how to teach it 3.67 0.936 3.59 0.983 3.45 1.024 0.002 Plan for and implement effective teaching and learning 3.85 0.864 3.8 0.846 3.81 0.834 0.723 Create and maintain supportive and safe learning environments 3.85 0.894 3.88 0.854 3.77 0.87 0.042 Assess, provide feedback and report on student learning 3.51 1.062 3.31 1.105 3.34 1.054 0.026
Engage in professional learning 3.67 1.02 3.73 0.987 3.68 0.96 0.539 Engage professionally with colleagues, parents/carers and the community 2.92 1.14 3.04 1.107 2.91 1.079 0.026
Round 3
Know students and how they learn 3.83 0.828 3.78 0.794 3.66 0.856 0.009
Know the content and how to teach it 3.63 1.044 3.49 0.992 3.26 1.095 0.000 Plan for and implement effective teaching and learning 3.82 0.946 3.74 0.849 3.67 0.938 0.085 Create and maintain supportive and safe learning environments 3.8 0.987 3.79 0.873 3.72 0.933 0.362 Assess, provide feedback and report on student learning 3.48 1.071 3.28 1.058 3.31 1.047 0.030
Engage in professional learning 3.71 1.085 3.63 1 3.57 0.972 0.186 Engage professionally with colleagues, parents/carers and the community 3.04 1.172 3.02 1.09 2.88 1.065 0.041 Note: Round 2: Masters n=270, Bachelor n=1,004, Grad. Dip. n=726; Round 3: Masters n=244, Bachelor n=775, Grad. Dip.
n=547 p<0.05
There was a significant effect for program type on graduate teacher preparedness at the p<0.05 level in four of the
professional standards in both Rounds 2 and 3. These were:
‘Know students and how they learn’
‘Know the content and how to teach it’
‘Assess, provide feedback and report on student learning’
‘Engage professionally with colleagues, parents/carers and the community’

Longitudinal Teacher Education and Workforce Study (LTEWS) Final Report
150
A post hoc test was conducted on these standards in Rounds 2 and 3, and the significant differences are shown in
Table 76.
Table 76. Comparison between groups of mean for preparation in the professional standards – by program type
Significance p Comparisons between program areas
Round 2 Round 3
Know students and how they learn
Masters and Bachelor 0.205 0.727
Masters and Graduate/Postgraduate Diploma 0.524 0.026
Bachelor and Graduate/Postgraduate Diploma 0.000 0.027
Know the content and how to teach it
Masters and Bachelor 0.487 0.160
Masters and Graduate/Postgraduate Diploma 0.006 0.000
Bachelor and Graduate/Postgrad Diploma 0.011 0.000
Assess, provide feedback and report on student learning
Masters and Bachelor 0.020 0.025
Masters and Graduate/Postgraduate Diploma 0.071 0.073
Bachelor and Graduate/Postgraduate Diploma 0.838 0.913
Engage professionally with colleagues, parents/carers and the community
Masters and Bachelor 0.236 0.946
Masters and Graduate/Postgraduate Diploma 0.981 0.122
Bachelor and Graduate/Postgrad Diploma 0.029 0.058
In summary, post hoc comparisons using the Tukey HSD test indicated that the mean score for:
‘Know students and how they learn’ was significantly different between the bachelor and graduate
diploma programs in both rounds;
‘Know the content and how to teach it’ was significantly different between the masters and the graduate
diploma programs and the bachelor and graduate diploma programs in both rounds;
‘Assess, provide feedback and report on student learning’ was significantly different between the masters
and bachelor programs in both rounds;
‘Engage professionally with colleagues, parents/carers and the community’ was significantly different
between the bachelor and graduate diploma programs in Round 2.

Longitudinal Teacher Education and Workforce Study (LTEWS) Final Report
151
For Round 2, taken together, these results suggest that graduates who completed a graduate diploma felt less
prepared than those from the other two program types in three areas:
Know students and how they learn
Know the content and how to teach it
Create and maintain supportive and safe learning environments
Those graduates who completed a masters qualification felt better prepared than those from the other two
program types in the area of Assess, provide feedback and report on student learning’. Those graduates who
completed a bachelor’s degree felt better prepared than those from the other two program types in the area of
'Engage professionally with colleagues, parents/carers and the community'.
Round 3 results show that graduates who completed a graduate or postgraduate diploma feel less prepared than
those with a bachelor’s degree in 'Know students and how they learn' and 'Know the content and how to teach it'.
It also shows that graduates who completed a masters teacher education program felt better prepared than those
from the other two program types in 'Know the content and how to teach it' and ‘Assess, provide feedback and
report on student learning’.
Graduate teachers’ preparedness in the professional standards – by program area
A one-way between subjects ANOVA was conducted to compare the effect of program area on preparation in the
seven professional standards. The results are shown in Table 77.
Table 77. Comparison of mean for preparation in the professional standards – by program area
Early
Childhood EC/Prim Primary Prim/Sec Secondary Significance
Preparation in NPST Mean SD Mean SD Mean SD Mean SD Mean SD p
Round 2 Know students 4.09 0.653 4.01 0.622 3.87 0.785 3.88 0.725 3.76 0.802 0.000 Know the content 3.77 0.902 3.54 0.929 3.57 0.968 3.48 1.038 3.53 1.023 0.250 Plan and implement 4.06 0.713 3.73 0.91 3.78 0.859 3.88 0.753 3.81 0.849 0.033 Create and maintain 4.13 0.656 3.91 0.844 3.84 0.894 3.88 0.858 3.78 0.856 0.009 Assess, report 3.65 0.929 3.38 1.032 3.27 1.098 3.25 1.118 3.41 1.071 0.008 Professional learning 4.14 0.683 3.67 0.962 3.71 1.000 3.76 0.925 3.65 0.996 0.001 Engage with parents 3.78 0.805 3.26 1.002 3.03 1.124 3.05 1.101 2.81 1.078 0.000 Round 3 Know students 3.97 0.758 3.83 0.658 3.79 0.798 3.77 0.767 3.66 0.869 0.008 Know the content 3.42 0.944 3.35 0.967 3.47 0.963 3.36 1.086 3.42 1.122 0.497 Plan and implement 3.75 0.876 3.74 0.727 3.72 0.899 3.72 0.925 3.72 0.927 0.990 Create and maintain 3.98 0.792 3.83 0.785 3.79 0.894 3.82 0.817 3.70 0.958 0.163 Assess, report 3.38 0.846 3.29 0.946 3.29 1.040 3.34 1.119 3.32 1.092 0.655 Professional learning 4.00 0.689 3.56 0.813 3.7 0.954 3.60 1.014 3.55 1.067 0.004 Engage with parents 3.58 0.720 3.24 1.005 3.04 1.082 3.07 1.118 2.78 1.111 0.000
Note: Round 2: Early Childhood n=77, EC/Prim n=112, Primary n=756, Prim/Sec n=197, Secondary n=866; Round 3: Early
Childhood n=60, EC/Prim n=103, Primary n=608, Prim/Sec n=151, Secondary n=677 p<0.05
There was a significant effect for program area on graduate teacher preparedness at the p<0.05 level in six of the
seven professional standards in Round 2:

Longitudinal Teacher Education and Workforce Study (LTEWS) Final Report
152
Know students and how they learn
Plan for and implement effective teaching and learning
Create and maintain supportive and safe learning environments
Assess, provide feedback and report on student learning
Engage in professional learning
Engage professionally with colleagues, parents/carers and the community
In Round 3, significant effects for program area could be seen in only three key professional standards:
Know students and how they learn
Engage in professional learning
Engage professionally with colleagues, parents/carers and the community
A post hoc test was conducted on all these areas, and the significant differences are shown in Table 78.
Table 78. Comparison between groups of mean for preparation in the professional standards – by program area
Significance p
Comparisons between program areas Round 2 Round 3
Know students and how they learn
EC and EC/Primary 0.953 0.921 EC and Primary 0.109 0.610 EC and Primary/Secondary 0.245 0.642 EC and Secondary 0.003 0.058 EC/Primary and Primary 0.363 0.996 EC/Primary and Prim/Secondary 0.610 0.993 EC/Primary and Secondary 0.013 0.315 Primary and Primary/Secondary 1.000 1.000 Primary and Secondary 0.053 0.041 Primary/Sec and Secondary 0.318 0.603
Plan for and implement effective teaching and learning
EC and EC/Primary 0.059 1.000 EC and Primary 0.034 1.000 EC and Primary/Secondary 0.466 1.000 EC and Secondary 0.083 1.000 EC/Primary and Primary 0.985 1.000 EC/Primary and Primary/Secondary 0.586 1.000 EC/Primary and Secondary 0.886 1.000 Primary and Primary/Secondary 0.557 1.000 Primary and Secondary 0.926 1.000 Primary/Secondary and Secondary 0.848 1.000
Create and maintain supportive and safe learning environments
EC and EC/Primary 0.425 0.893 EC and Primary 0.040 0.605 EC and Primary/Secondary 0.210 0.851 EC and Secondary 0.007 0.203 EC/Primary and Primary 0.928 1.000

Longitudinal Teacher Education and Workforce Study (LTEWS) Final Report
153
EC/Primary and Primary/Secondary 0.999 0.809 EC/Primary and Secondary 0.579 0.999 Primary and Primary/Secondary 0.971 0.999 Primary and Secondary 0.674 0.571 Primary/Secondary and Secondary 0.581 0.711
Assess, provide feedback and report on student learning
EC and EC/Primary 0.423 0.995 EC and Primary 0.030 0.985 EC and Primary/Sec 0.046 1.000 EC and Secondary 0.316 0.998 EC/Primary and Primary 0.887 1.000 EC/Primary and Primary/Sec 0.860 0.999 EC/Primary and Secondary 0.999 1.000 Primary and Primary/Sec 0.998 0.995 Primary and Secondary 0.103 0.992 Primary/Sec and Secondary 0.352 1.000
Engage in professional learning
EC and EC/Primary 0.010 0.076 EC and Primary 0.002 0.224 EC and Primary/Secondary 0.031 0.095 EC and Secondary 0.000 0.009 EC/Primary and Primary 0.997 0.796 EC/Primary and Primary/Secondary 0.933 1.000 EC/Primary and Secondary 0.999 1.000 Primary and Primary/Secondary 0.952 0.896 Primary and Secondary 0.766 0.064 Primary/Secondary and Secondary 0.582 0.988
Engage professionally with colleagues, parents/carers and the community
EC and EC/Primary 0.011 0.381 EC and Primary 0.000 0.003 EC and Primary/Secondary 0.000 0.022 EC and Secondary 0.000 0.000 EC/Primary and Primary 0.208 0.473 EC/Primary and Prim/Secondary 0.484 0.799 EC/Primary and Secondary 0.000 0.001 Primary and Primary/Sec 0.998 1.000 Primary and Secondary 0.001 0.000 Primary/Secondary and Secondary 0.046 0.038
In summary, post hoc comparisons using the Tukey HSD test indicated that the mean score for:
‘Know students and how they learn’ was significantly different between:
o Early childhood and secondary graduates in Round 2
o Primary and secondary graduates in Round 3
suggesting that secondary graduates felt less well prepared in this area.
‘Plan for and implement effective teaching and learning’ it was significantly different between:

Longitudinal Teacher Education and Workforce Study (LTEWS) Final Report
154
o Early childhood and primary in Round 2
‘Create and maintain supportive and safe learning environments’ was significantly different between:
o Early childhood and primary graduates in Round 2
o Early childhood and secondary graduates in Round 2
suggesting that early childhood graduates felt better prepared in this area in their first year of teaching.
‘Assess, provide feedback and report on student learning’ was significantly different between:
o Early childhood and primary graduates in Round 2
o Early childhood and primary/secondary graduates in Round 2
suggesting that early childhood graduates felt better prepared in this area in their first year of teaching.
‘Engage in professional learning’ was significantly different between:
o Early childhood and all other four areas in Round 2
o Early childhood and secondary graduates in Round 3
suggesting that early childhood graduates felt better prepared in this area in their first year but that by
the second year of teaching, most differences in views on program preparation for teaching between
graduate areas had diminished.
‘Engage professionally with colleagues, parents/carers and the community’ was significantly different
between:
o Early childhood and all other four areas in Round 2
o Early childhood and primary, primary/secondary and secondary in Round 3
o Secondary and carly childhood/primary, primary, and primary/secondary and in Round 3
suggesting that early childhood graduates felt better prepared than others, and secondary graduates felt
least well prepared in this area.
Graduate teachers’ effectiveness in key teaching areas – the Australian Professional Standards for Teachers
This section examines the graduate teachers’ perceptions of their effectiveness in key areas of teaching. In Rounds
2 and 3, respondents were asked to indicate on a five-point Likert scale their level of agreement on their
effectiveness on the seven statements on the Professional Standards. Table 79 shows the results. These questions
were only asked of those respondents who were currently teaching.

Longitudinal Teacher Education and Workforce Study (LTEWS) Final Report
155
Table 79. Graduate teachers – by effectiveness in the professional standards
Strongly disagree Disagree
Neither agree nor disagree Agree
Strongly agree
Effective in: % % % % %
Round 2 Know students and how they learn 0.0 0.9 7.3 65.0 26.8 Know the content and how to teach it 0.1 1.8 10.2 63.1 24.8 Plan for and implement effective teaching and learning 0.1 1.5 8.9 66.2 23.2 Create and maintain supportive and safe learning environments 0.1 0.9 7.6 57.5 33.9 Assess, provide feedback and report on student learning 0.3 4.5 16.5 59.4 19.4 Engage in professional learning 0.3 1.8 10.9 52.5 34.6 Engage professionally with colleagues, parents/carers and the community 0.3 3.1 16.0 57.4 23.1 Round 3 Know students and how they learn 0.1 0.6 6.4 65.1 27.9 Know the content and how to teach it 0.1 1.4 8.3 63.9 26.3 Plan for and implement effective teaching and learning 0.1 1.3 7.4 66.3 25.0 Create and maintain supportive and safe learning environments 0.1 0.8 6.8 57.8 34.6 Assess, provide feedback and report on student learning 0.3 2.8 13.3 62.5 21.0 Engage in professional learning 0.2 2.2 9.8 54.1 33.7 Engage professionally with colleagues, parents/carers and the community 0.3 2.8 14.7 55.1 27.0
The following Figure shows the mean score for the items measuring effectiveness in the seven key areas.

Longitudinal Teacher Education and Workforce Study (LTEWS) Final Report
156
Figure 28. Graduate teachers – by the mean of their effectiveness in the professional standards
Note: Round 2 n=2,099; Round 3 n=1,727
Generally, graduate teachers perceived themselves as effective in both rounds, with more than 80 per cent of
graduate teachers agreeing they were effective in most teaching areas. The graduate teachers rated themselves as
highly effective (>90 per cent) in the areas of:
‘Know students and how they learn’ in both rounds
‘Know the content and how to teach’ it in Round 3
‘Plan for and implement effective teaching and learning’ in Round 3
‘Create and maintain supportive and safe learning environments’ in both rounds
This is with the exception for 'Assess, provide feedback and report on student learning' in Round 2 (with 78.8 per
cent). The area with the highest proportion who disagreed they were effective was 'Assess, provide feedback and
report on student learning' but this was still only 4.8 per cent in Round 2 and 3.1 per cent in Round 3 compared to
the other areas.
Overall, agreement on effectiveness remained fairly constant from Round 2 to Round 3. The area that showed the
highest mean score for effectiveness was 'Create and maintain supportive and safe learning environments' in
Round 3. The areas that showed the lowest mean score for effectiveness was 'Assess, provide feedback and report
on student learning' in Round 2.
Interestingly, the survey results revealed that graduate teachers felt more effective in the seven areas of teaching
than in feeling they were prepared. The key areas with the largest difference between perceptions of being
prepared and perceptions of being effective were 'Engage professionally with colleagues, parents/carers and the
community' in Rounds 2 and 3, and 'Know the content and how to teach it' in Round 3.
4.2 4.1 4.1 4.2 3.9
4.2 4.0
4.2 4.2 4.2 4.3 4.0
4.2 4.1
0.0
0.5
1.0
1.5
2.0
2.5
3.0
3.5
4.0
4.5
Know howstudents learn
Know the content Planning andimplementation
Creation of safelearning
environments
Assessment andfeedback on
student learning
Professionallearning
Engagement withparents/carers
Me
an s
core
Australian Professional Standards for Teachers
Round 2 Round 3

Longitudinal Teacher Education and Workforce Study (LTEWS) Final Report
157
This disconnect reflects graduate teachers’ feelings of growing efficacy in teaching over time but also highlights the
importance of thinking about learning to teach as a continuum of professional learning, learning that occurs in
varying degrees at different times in universities, in schools and in communities. In the interviews, graduate
teachers spoke about the importance of the professional learning setting of the school and also the need for
teacher education to make explicit linkages between theory and practice.
Graduate teachers’ effectiveness - by gender
An independent-samples t-test was conducted to compare the means for effectiveness in the seven key areas of
teaching, by gender. The results are shown in the Table 80.
Table 80. Comparison of mean for effectiveness in the professional standards – by gender
Males Females Significance
Effective in: Mean SD Mean SD p
Round 2 Know students and how they learn 4.09 0.568 4.20 0.595 0.001 Know the content and how to teach it 4.07 0.681 4.12 0.637 0.126 Plan for and implement effective teaching and learning 4.04 0.651 4.13 0.608 0.005 Create and maintain supportive and safe learning environments 4.12 0.659 4.28 0.618 0.000 Assess, provide feedback and report on student learning 3.89 0.748 3.94 0.748 0.190 Engage in professional learning 4.10 0.717 4.22 0.719 0.001 Engage professionally with colleagues, parents/carers and the community 3.81 0.747 4.05 0.725 0.000 Round 3 Know students and how they learn 4.12 0.621 4.22 0.560 0.002 Know the content and how to teach it 4.14 0.670 4.15 0.614 0.834 Plan for and implement effective teaching and learning 4.05 0.651 4.18 0.580 0.000 Create and maintain supportive and safe learning environments 4.13 0.693 4.30 0.595 0.000 Assess, provide feedback and report on student learning 3.97 0.712 4.02 0.693 0.152 Engage in professional learning 4.09 0.775 4.22 0.688 0.001 Engage professionally with colleagues, parents/carers and the community 3.90 0.803 4.10 0.726 0.000 Note: Round 2: males n= 465; females n= 1,634; Round 3: males n= 381; females n= 1,346 p<0.05
There was a significant difference in the scores for males and females in five of the seven key areas in Rounds 2
and 3:
‘Know students and how they learn’
‘Plan for and implement effective teaching and learning’
‘Create and maintain supportive and safe learning environments’
‘Engage in professional learning’
‘Engage professionally with colleagues, parents/carers and the community’

Longitudinal Teacher Education and Workforce Study (LTEWS) Final Report
158
Graduate teachers’ effectiveness – by program type
A one-way between subjects ANOVA was conducted to compare the effect of program area on effectiveness in the
seven key areas of teaching. The results are shown in the Table 81.
Table 81. Comparison of mean for effectiveness in the professional standards – by program type
Masters Bachelor Grad. Dip. Significance
Effective in: Mean SD Mean SD Mean SD p
Round 2 Know students and how they learn 4.23 0.569 4.23 0.581 4.10 0.601 0.000 Know the content and how to teach it 4.18 0.640 4.13 0.614 4.05 0.682 0.004 Plan for and implement effective teaching and learning 4.13 0.586 4.14 0.613 4.05 0.634 0.008 Create and maintain supportive and safe learning environments 4.30 0.588 4.30 0.614 4.15 0.662 0.000 Assess, provide feedback and report on student learning 3.97 0.773 3.96 0.740 3.87 0.750 0.047 Engage in professional learning 4.14 0.787 4.25 0.702 4.14 0.710 0.003 Engage professionally with colleagues, parents/carers and the community 3.99 0.706 4.07 0.698 3.91 0.782 0.000 Round 3 Know students and how they learn 4.24 0.569 4.23 0.591 4.14 0.561 0.005 Know the content and how to teach it 4.20 0.610 4.14 0.600 4.13 0.680 0.378 Plan for and implement effective teaching and learning 4.16 0.644 4.18 0.583 4.11 0.607 0.123 Create and maintain supportive and safe learning environments 4.30 0.593 4.28 0.634 4.21 0.618 0.062 Assess, provide feedback and report on student learning 4.02 0.796 4.04 0.674 3.98 0.686 0.263 Engage in professional learning 4.20 0.731 4.20 0.726 4.17 0.690 0.738 Engage professionally with colleagues, parents/carers and the community 4.05 0.771 4.08 0.731 4.01 0.782 0.262 Note: Round 2: Masters n=270, Bachelor n=1,004, Grad. Dip. n=726; Round 3: Masters n=244, Bachelor n=775, Grad. Dip.
n=547 p<0.05
There was a significant effect for program area on graduate teacher effectiveness at the p<0.05 level in all seven
key areas in Round 2. Interestingly, by Round 3 only the area of 'Know students and how they learn' showed
significant difference across the teacher program areas. A post hoc test was conducted on all seven areas, and the
significant differences are shown in Table 82.

Longitudinal Teacher Education and Workforce Study (LTEWS) Final Report
159
Table 82. Comparison between groups of mean for effectiveness in key areas of teaching – by program type
Significance p
Comparisons between program types Round 2 Round 3
Know students and how they learn Masters and Bachelor 1.000 0.979 Masters and Grad/Postgrad Diploma 0.006 0.044 Bachelor and Grad/Postgrad Diploma 0.000 0.007
Know the content and how to teach it
Masters and Bachelor 0.479 0.430 Masters and Grad/Postgrad Diploma 0.010 0.373 Bachelor and Grad/Postgrad Diploma 0.024 0.974
Plan for and implement effective teaching and learning
Masters and Bachelor 0.971 0.910 Masters and Grad/Postgrad Diploma 0.153 0.525 Bachelor and Grad/Postgrad Diploma 0.007 0.104
Create and maintain supportive and safe learning environments Masters and Bachelor 0.986 0.880 Masters and Grad/Postgrad Diploma 0.002 0.127 Bachelor and Grad/Postgrad Diploma 0.000 0.102
Assess, provide feedback and report on student learning
Masters and Bachelor 0.981 0.890 Masters and Grad/Postgrad Diploma 0.187 0.736 Bachelor and Grad/Postgrad Diploma 0.056 0.231
Engage in professional learning
Masters and Bachelor 0.071 0.995 Masters and Grad/Postgrad Diploma 1.000 0.819 Bachelor and Grad/Postgrad Diploma 0.005 0.760
Engage professionally with colleagues, parents/carers and the community
Masters and Bachelor 0.234 0.880 Masters and Grad/Postgrad Diploma 0.323 0.747 Bachelor and Grad/Postgrad Diploma 0.000 0.230
In summary, post hoc comparisons using the Tukey HSD test indicated that the mean score for:
‘Know students and how they learn’ was significantly different between the graduate/postgraduate
programs and the bachelor and masters programs in both rounds;
‘Know the content and how to teach’ was significantly different between the graduate/postgraduate
programs and the bachelor and masters programs in Round 2;
‘Assess, provide feedback and report on student learning’ did not show significant differences between
program types
‘Engage in professional learning’ also did not show significant differences between program types

Longitudinal Teacher Education and Workforce Study (LTEWS) Final Report
160
‘Engage professionally with colleagues, parents/carers and the community’ was significantly different
between the graduate/postgraduate programs and the bachelor programs in Round 2.
Taken together, these results suggest that in the first year of teaching graduates who complete a Graduate or
Postgraduate Diploma feel less prepared than those from the other two courses in three areas:
Know students and how they learn
Know the content and how to teach it
Literacy and numeracy
Those graduates who complete Masters feel better prepared than those from the other two courses in the area of
‘Assess, provide feedback and report on student learning’.
Graduate teachers’ effectiveness - by program area
A one-way between subjects ANOVA was conducted to compare the effect of program area on effectiveness in the
seven key areas of teaching. The results are shown in the Table 83.
Table 83. Comparison of mean for effectiveness in the professional standards – by program area
Early Childhood Early Childhood
/Primary Primary Primary/
Secondary Secondary Significance
Effective in NPST Mean SD Mean SD Mean SD Mean SD Mean SD p
Round 2
Know students 4.27 0.504 4.28 0.488 4.19 0.613 4.21 0.627 4.14 0.583 0.064
Know the content 4.25 0.517 4.04 0.614 4.06 0.658 4.10 0.636 4.14 0.653 0.023
Plan and implement 4.25 0.491 4.15 0.557 4.10 0.633 4.13 0.646 4.09 0.619 0.224
Create and maintain 4.39 0.517 4.40 0.607 4.27 0.622 4.28 0.623 4.18 0.647 0.000
Assess, report 4.10 0.552 4.01 0.717 3.85 0.760 3.98 0.795 3.96 0.742 0.003
Professional learning 4.44 0.734 4.29 0.677 4.21 0.719 4.27 0.726 4.13 0.714 0.000
Engage with parents 4.35 0.556 4.22 0.596 4.04 0.724 4.08 0.728 3.88 0.751 0.000
Round 3
Know students 4.28 0.585 4.31 0.524 4.20 0.586 4.28 0.626 4.15 0.554 0.000
Know the content 4.15 0.732 4.09 0.544 4.10 0.608 4.11 0.602 4.20 0.649 0.006
Plan and implement 4.17 0.587 4.17 0.494 4.14 0.633 4.19 0.608 4.13 0.578 0.115
Create and maintain 4.33 0.572 4.32 0.614 4.30 0.630 4.30 0.620 4.19 0.616 0.002
Assess, report 4.12 0.691 3.99 0.693 3.98 0.702 4.07 0.763 4.01 0.681 0.162
Professional learning 4.33 0.681 4.19 0.715 4.20 0.692 4.24 0.718 4.16 0.727 0.107
Engage with parents 4.28 0.555 4.25 0.696 4.10 0.737 4.18 0.713 3.92 0.784 0.000 Note: Round 2: Early Childhood n=77, EC/Prim n=112, Primary n=756, Prim/Sec n=197, Secondary n=866; Round 3: Early
Childhood n=60, EC/Prim n=103, Primary n=608, Prim/Sec n=151, Secondary n=677 p<0.05

Longitudinal Teacher Education and Workforce Study (LTEWS) Final Report
161
There was a significant effect for program area on graduate teacher preparedness at the p<0.05 level in five of the
seven key areas in Round 2. These were:
‘Know the content and how to teach it’
‘Create and maintain supportive and safe learning environments’
‘Assess, provide feedback and report on student learning’
‘Engage in professional learning’
‘Engage professionally with colleagues, parents/carers and the community’
In Round 3, there was a significant effect for program type in the following four areas:
‘Know students and how they learn’
‘Know the content and how to teach it’
‘Create and maintain supportive and safe learning environments’
‘Engage professionally with colleagues, parents/carers and the community’
A post hoc test was conducted on all key areas, and the significant differences are shown in Table 84.
Table 84. Comparison between groups of mean for effectiveness in the professional standards – by program area
Significance p
Comparisons between program areas Round 2 Round 3
Know students and how they learn
EC and EC/Primary 1.000 1.000 EC and Primary 0.730 0.910 EC and Prim/Secondary 0.945 1.000 EC and Secondary 0.350 0.492 EC/Prim and Primary 0.543 0.498 EC/Prim and Primary/Secondary 0.894 0.999 EC/Prim and Secondary 0.162 0.077 Primary and Prim/Secondary 0.976 0.629 Primary and Secondary 0.611 0.493 Prim/Sec and Secondary 0.563 0.084
Know the content and how to teach it
EC and EC/Prim 0.178 0.990 EC and Primary 0.124 0.988 EC and Prim/Secondary 0.416 0.997 EC and Secondary 0.671 0.994 EC/Primary and Primary 0.993 1.000 EC/Primary and Primary/Secondary 0.932 1.000 EC/Primary and Secondary 0.451 0.568 Primary and Primary/Secondary 0.969 1.000 Primary and Secondary 0.088 0.046 Primary/Sec and Secondary 0.882 0.596
Plan for and implement effective teaching and learning
EC and EC/Primary 0.839 1.000

Longitudinal Teacher Education and Workforce Study (LTEWS) Final Report
162
EC and Primary 0.262 1.000 EC and Primary/Secondary 0.602 1.000 EC and Secondary 0.196 0.998 EC/Primary and Primary 0.912 0.997 EC/Primary and Primary/Secondary 0.997 1.000 EC/Primary and Secondary 0.842 0.986 Primary and Primary/Secondary 0.977 0.953 Primary and Secondary 0.997 0.999 Primary/Secondary and Secondary 0.930 0.882
Create and maintain supportive and safe learning environments
EC and EC/Primary 1.000 1.000 EC and Primary 0.525 0.998 EC and Primary/Secondary 0.724 0.999 EC and Secondary 0.041 0.524 EC/Primary and Primary 0.251 0.999 EC/Primary and Prim/Secondary 0.510 1.000 EC/Primary and Secondary 0.004 0.352 Primary and Primary/Secondary 0.999 1.000 Primary and Secondary 0.026 0.028 Primary/Sec and Secondary 0.221 0.385
Assess, provide feedback and report on student learning
EC and EC/Primary 0.912 0.876 EC and Primary 0.037 0.711 EC and Primary/Secondary 0.729 0.997 EC and Secondary 0.473 0.888 EC/Primary and Primary 0.222 1.000 EC/Primary and Primary/Secondary 0.997 0.958 EC/Primary and Secondary 0.962 0.999 Primary and Primary/Secondary 0.194 0.769 Primary and Secondary 0.031 0.960 Primary/Secondary and Secondary 0.996 0.964
Engage in professional learning
EC and EC/Primary 0.582 0.834 EC and Primary 0.059 0.729 EC and Primary/Secondary 0.410 0.952 EC and Secondary 0.002 0.436 EC/Primary and Primary 0.854 1.000 EC/Primary and Primary/Secondary 1.000 0.997 EC/Primary and Secondary 0.172 0.996 Primary and Primary/Secondary 0.823 0.990 Primary and Secondary 0.104 0.894 Primary/Secondary and Secondary 0.067 0.796
Engage professionally with colleagues, parents/carers and the community
EC and EC/Primary 0.758 1.000 EC and Primary 0.004 0.467 EC and Primary/Secondary 0.039 0.942 EC and Secondary 0.000 0.004 EC/Primary and Primary 0.103 0.406

Longitudinal Teacher Education and Workforce Study (LTEWS) Final Report
163
EC/Primary and Prim/Secondary 0.424 0.972 EC/Primary and Secondary 0.000 0.000 Primary and Primary/Secondary 0.981 0.867 Primary and Secondary 0.000 0.000 Primary/Secondary and Secondary 0.007 0.001
In summary, post hoc comparisons using the Tukey HSD test indicated that the mean score for:
‘Know students and how they learn’ did not show significant differences between program areas
‘Know the content and how to teach it’ was significantly different between:
o Primary and secondary program areas in Round 3
This suggests that secondary graduates felt more effective in their subject disciplines than do
primary graduates by their second year of teaching.
‘Plan for and implement effective teaching and learning’ did not show significant differences between
program areas
Create and maintain supportive and safe learning environments’ was significantly different between:
o the secondary program area and early childhood, early childhood/primary and primary program
areas in Round 2
o Secondary and primary program areas in Round 3
This suggests that secondary graduates felt less effective in this key area than do those from other program areas.
‘Assess, provide feedback and report on student learning’ was significantly different between:
o Primary and early childhood program areas in Round 2
o Primary and secondary program areas in Round 2
This suggests that in their first year of teaching, graduates from the primary area felt less effective than those from
early childhood and secondary areas in this national standard measurement.
‘Engage in professional learning ‘was significantly different between:
o Early childhood and secondary in Round 2
This suggests that those from a secondary program area felt less effective in their engagement with professional
learning in their first year out than did those from an early childhood area.
‘Engage professionally with colleagues, parents/carers and the community’ was significantly different
between:
o Early childhood program areas and primary and primary/secondary program areas in Round 2
o Secondary and all other program areas in Rounds 2 and 3
This suggests that in the first year of teaching, those from an early childhood program area felt more effective in
this area than did graduates from other program areas. The results also suggest that those from a secondary
program area felt less effective in the area of engaging with colleagues, parents and the community than did those
from other program areas; and this continues into the second year of teaching.

Longitudinal Teacher Education and Workforce Study (LTEWS) Final Report
164
Comparing graduate teachers’ and principals’ perceptions on effectiveness in the professional standards
The following Tables show what the graduate teachers thought of their effectiveness in terms of the Australian
Professional Standards for Teachers compared to what their principals thought of the teachers' effectiveness in
these seven areas. The percentages in the Tables are for teachers participating in the LTEWS Graduate Teacher
Survey Rounds 2 and 3 and the principals of their schools who responded to the LTEWS Principal Survey in these
rounds.
1. Effectiveness in the area of 'Know students and how they learn'
The first table shows what graduates and principals said about the graduates’ effectiveness in the area of 'Know
students and how they learn'.
Table 85. Comparison of teacher and principal perceptions on effectiveness in 'Know students and how they learn'
Principals
Strongly
disagree Disagree
Neither
agree nor
disagree Agree
Strongly
agree Total
Graduates
Round 2
Row percentages
Strongly disagree -
Disagree 0.0 0.0 0.0 100.0 0.0 100.0
Neither agree nor disagree 5.0 15.0 0.0 60.0 20.0 100.0
Agree 0.0 3.9 3.9 60.0 32.3 100.0
Strongly agree 1.7 3.3 8.3 46.7 40.0 100.0
TOTAL 0.8 4.7 4.7 56.8 33.1 100.0
Column percentages
Strongly disagree 0.0 0.0 0.0 0.0 0.0 0.0
Disagree 0.0 0.0 0.0 0.7 0.0 0.4
Neither agree nor disagree 50.0 27.3 0.0 9.0 5.1 8.5
Agree 0.0 54.5 54.5 69.4 64.1 65.7
Strongly agree 50.0 18.2 45.5 20.9 30.8 25.4
TOTAL 100.0 100.0 100.0 100.0 100.0 100.0
Round 3
Row percentages
Strongly disagree -
Disagree 0.0 0.0 0.0 100.0 0.0 100.0
Neither agree nor disagree 0.0 12.5 12.5 62.5 12.5 100.0
Agree 0.0 2.1 7.7 64.3 25.9 100.0
Strongly agree 2.9 1.4 4.3 53.6 37.7 100.0

Longitudinal Teacher Education and Workforce Study (LTEWS) Final Report
165
TOTAL 0.9 2.3 6.8 61.1 29.0 100.0
Column percentages
Strongly disagree 0.0 0.0 0.0 0.0 0.0 0.0
Disagree 0.0 0.0 0.0 0.7 0.0 0.5
Neither agree nor disagree 0.0 20.0 6.7 3.7 1.6 3.6
Agree 0.0 60.0 73.3 68.1 57.8 64.7
Strongly agree 100.0 20.0 20.0 27.4 40.6 31.2
TOTAL 100.0 100.0 100.0 100.0 100.0 100.0
Note: Round 2 n=236: Teachers: disagree n=1, neither n=20, agree n=155, strongly agree n=60; Principals strongly disagree
n=2, disagree n=11, neither n=11, agree n=134, strongly agree n=78; Round 3 n=221: Teachers: disagree n=1, neither
n=8, agree n=143, strongly agree n=69; Principals strongly disagree n=2, disagree n=5, neither n=15, agree n=135,
strongly agree n=64
The first panel in each round presents row percentages, which are the percentages relative to teachers’ level of
agreement on their effectiveness in the first National Standard, 'Know students and how they learn'. Taking the
row ‘Agree’ in Round 2, it can be seen that of the graduates who agreed they were effective in this area, 3.9 per
cent of them had principals who disagreed they were effective in this area, and 60 per cent of principals agreed
graduates were effective in this area. Similarly, of the teachers who strongly agree they were effective in this area,
1.7 per cent of their principals strongly disagreed they were effective, 3.3 per cent disagreed, 8.3 per cent neither
agreed nor disagreed, 46.7 per cent agreed and 40 per cent strongly agreed that these graduates were effective in
this key area. In both rounds of the survey, there was only one graduate teacher with a corresponding principal
comment who disagreed he/she was effective in this area.
The second panel presents the figures as column percentages, that is, the percentages expressed in terms of
principals’ views on the effectiveness of their graduate teachers. Looking at the agreement column in Round 2 it
can be seen that 69.4 per cent of principals also had their graduates agreeing they were effective. Of the principals
who disagreed their graduates were effective in this are in Round 2 (n=11), no graduates disagreed, 27.3 per cent
neither agreed nor disagreed, 54.5 per cent agreed and 18.2 per cent strongly agreed they were effective.
Just over 61 per cent of principals agreed teachers were effective in this area in Round 3 (as shown in the Totals
row in the first Round 3 panel). Of the principals who agreed teachers were effective in this area in Round 3, 68.1
per cent had graduates who also agreed they were effective and 27.4 per cent of graduates who strongly agreed
they were effective in this area.
Overall in Round 2, column totals show that 91.1 per cent of graduates agree or strongly agree they are effective in
this area, and row totals show that 89.9 per cent of principals agree or strongly agree that graduates are effective
in this area, showing a strong consensus between graduates and principals.
Overall in Round 3, column totals show that 95.0 per cent of graduates agree or strongly agree they are effective in
this area, and row totals show that 90.1 per cent of principals agree or strongly agree that graduates are effective
in this area, showing a reasonably strong consensus between graduates and principals. There was a larger
percentage of principals than graduates who neither agreed nor disagreed in Round 3 (6.8 per cent compared to
3.6 per cent). This may be due to the timing of the survey for Round 3, which was at the beginning of the year,
when principals would not be as familiar with their graduates’ strengths as they would be at the end of the year,
when Round 2 took place.

Longitudinal Teacher Education and Workforce Study (LTEWS) Final Report
166
2. Effectiveness in the area of 'Know the content and how to teach it'
Table 86 shows what graduates and principals said about the graduates’ effectiveness in the area of 'Know the
content and how to teach it'.
Table 86. Comparison of teacher and principal perceptions on effectiveness in 'Know the content and how to teach it'
Principals
Strongly
disagree Disagree
Neither
agree nor
disagree Agree
Strongly
agree Total
Graduates
Round 2
Row percentages
Strongly disagree -
Disagree 0.0 0.0 0.0 100.0 0.0 100.0
Neither agree nor disagree 5.0 15.0 0.0 60.0 20.0 100.0
Agree 0.0 3.9 3.9 60.0 32.3 100.0
Strongly agree 1.7 3.3 8.3 46.7 40.0 100.0
TOTAL 0.8 4.7 4.7 56.8 33.1 100.0
Column percentages
Strongly disagree 0.0 0.0 0.0 0.0 0.0 0.0
Disagree 33.3 14.3 0.0 3.3 3.5 3.8
Neither agree nor disagree 0.0 28.6 17.6 12.2 4.7 10.2
Agree 33.3 42.9 52.9 61.8 57.0 58.5
Strongly agree 33.3 14.3 29.4 22.8 34.9 27.5
TOTAL 100.0 100.0 100.0 100.0 100.0 100.0
Round 3
Row percentages
Strongly disagree -
Disagree 0.0 0.0 25.0 75.0 0.0 100.0
Neither agree nor disagree 0.0 6.3 6.3 68.8 18.8 100.0
Agree 0.7 1.4 7.1 58.6 32.1 100.0
Strongly agree 0.0 3.3 8.2 55.7 32.8 100.0
TOTAL 0.5 2.3 7.7 58.8 30.8 100.0
Column percentages
Strongly disagree 0.0 0.0 0.0 0.0 0.0 0.0
Disagree 0.0 0.0 5.9 2.3 0.0 1.8
Neither agree nor disagree 0.0 20.0 5.9 8.5 4.4 7.2
Agree 100.0 40.0 58.8 63.1 66.2 63.3

Longitudinal Teacher Education and Workforce Study (LTEWS) Final Report
167
Strongly agree 0.0 40.0 29.4 26.2 29.4 27.6
TOTAL 100.0 100.0 100.0 100.0 100.0 100.0
Note: Round 2 n=236: Teachers: disagree n=9, neither n=24, agree n=138, strongly agree n=65; Principals strongly disagree
n=3, disagree n=7, neither n=17, agree n=123, strongly agree n=86; Round 3 n=221: Teachers: disagree n=4, neither
n=16, agree n=140, strongly agree n=61; Principals strongly disagree n=1, disagree n=5, neither n=17, agree n=130,
strongly agree n=68
The blue highlighted cells show the percentages for when graduates and their principals had the same level of
agreement about graduates’ effectiveness in the area 'Know the content and how to teach it'. Of the graduates
who agreed they were effective in this area in Round 2, 60 per cent of their principals also agreed. Of principals
who agreed their graduates were effective in this area in Round 2, 61.8 per cent of the graduates also agreed.
Overall in Round 2, column totals show that 86 per cent of graduates agree or strongly agree they were effective in
this area, and row totals show that 89.9 per cent of principals agree or strongly agree that graduates were
effective in this area, showing that graduates are slightly tougher on themselves than are their principals.
Overall in Round 3, column totals show that 90.9 per cent of graduates agree or strongly agree they are effective in
this area, and row totals show that 89.6 per cent of principals agree or strongly agree that graduates are effective
in this area, showing a strong consensus between graduates and principals.
3. Effectiveness in the area of 'Plan for and implement effective teaching and learning'
Table 87 shows what graduates and principals said about the graduates’ effectiveness in the area of 'Plan for and
implement effective teaching and learning'.
Table 87. Comparison of teacher and principal perceptions on effectiveness in 'Plan for and implement effective teaching and learning'
Principals
Strongly
disagree Disagree
Neither
agree nor
disagree Agree
Strongly
agree Total
Graduates
Round 2
Row percentages
Strongly disagree -
Disagree 0.0 0.0 14.3 71.4 14.3 100.0
Neither agree nor disagree 0.0 17.4 8.7 69.6 4.3 100.0
Agree 1.9 3.2 4.5 53.9 36.4 100.0
Strongly agree 0.0 5.8 1.9 44.2 48.1 100.0
TOTAL 1.3 5.1 4.7 53.8 35.2 100.0
Column percentages
Strongly disagree 0.0 0.0 0.0 0.0 0.0 0.0
Disagree 0.0 0.0 9.1 3.9 1.2 3.0
Neither agree nor disagree 0.0 33.3 18.2 12.6 1.2 9.7

Longitudinal Teacher Education and Workforce Study (LTEWS) Final Report
168
Agree 100.0 41.7 63.6 65.4 67.5 65.3
Strongly agree 0.0 25.0 9.1 18.1 30.1 22.0
TOTAL 100.0 100.0 100.0 100.0 100.0 100.0
Round 3
Row percentages
Strongly disagree -
Disagree 0.0 0.0 0.0 100.0 0.0 100.0
Neither agree nor disagree 0.0 11.1 11.1 72.2 5.6 100.0
Agree 0.7 1.4 4.9 57.7 35.2 100.0
Strongly agree 0.0 0.0 5.2 51.7 43.1 100.0
TOTAL 0.5 1.8 5.4 57.9 34.4 100.0
Column percentages
Strongly disagree 0.0 0.0 0.0 0.0 0.0 0.0
Disagree 0.0 0.0 0.0 2.3 0.0 1.4
Neither agree nor disagree 0.0 50.0 16.7 10.2 1.3 8.1
Agree 100.0 50.0 58.3 64.1 65.8 64.3
Strongly agree 0.0 0.0 25.0 23.4 32.9 26.2
TOTAL 100.0 100.0 100.0 100.0 100.0 100.0
Note: Round 2 n=236: Teachers: disagree n=7, neither n=23, agree n=154, strongly agree n=52; Principals strongly disagree
n=3, disagree n=12, neither n=11, agree n=127, strongly agree n=83; Round 3 n=221: Teachers: disagree n=3, neither
n=18, agree n=142, strongly agree n=58; Principals strongly disagree n=1, disagree n=4, neither n=12, agree n=128,
strongly agree n=76
The blue highlighted cells in Round 2 show that of the graduates who strongly agreed they were effective in the
area of 'Plan for and implement effective teaching and learning', 48.1 per cent of their principals also strongly
agreed. Of principals who strongly agreed their graduates were effective in this area in Round 2, 30.1 per cent of
the graduates also strongly agreed, showing graduates’ perceptions of their own effectiveness was not as positive
as the perceptions their principals had of them.
Overall in Round 2, column totals show that 87.3 per cent of graduates agree or strongly agree they were effective
in this area, and row totals show that 89 per cent of principals agree or strongly agree that graduates were
effective in this area, showing a strong consensus between graduates and principals.
Overall in Round 3, column totals show that 90.5 per cent of graduates agree or strongly agree they were effective
in this area, and row totals show that 92.3 per cent of principals agree or strongly agree that graduates were
effective in this area, again showing a strong consensus between graduates and principals, with principals having a
slightly more positive opinion than did graduates. These percentages also show a positive trend in effectiveness
from Round 2 to Round 3, with graduate and principal perceptions of effectiveness increasing by 3 per cent. This
needs to be treated with caution though, as the two rounds of surveys did not contain all the same respondents.
4. Effectiveness in the area of 'Create and maintain supportive and safe learning environments'
Table 88 shows what graduates and principals said about the graduates’ effectiveness in the area of 'Create and
maintain supportive and safe learning environments'.

Longitudinal Teacher Education and Workforce Study (LTEWS) Final Report
169
Table 88. Comparison of teacher and principal perceptions on effectiveness in 'Create and maintain supportive and safe learning environments'
Principals
Strongly
disagree Disagree
Neither
agree nor
disagree Agree
Strongly
agree Total
Graduates
Round 2
Row percentages
Strongly disagree -
Disagree 0.0 0.0 33.3 66.7 0.0 100.0
Neither agree nor disagree 0.0 8.7 8.7 47.8 34.8 100.0
Agree 2.3 1.5 11.4 47.0 37.9 100.0
Strongly agree 2.6 1.3 6.4 43.6 46.2 100.0
TOTAL 2.1 2.1 9.7 46.2 39.8 100.0
Column percentages
Strongly disagree 0.0 0.0 0.0 0.0 0.0 0.0
Disagree 0.0 0.0 4.3 1.8 0.0 1.3
Neither agree nor disagree 0.0 40.0 8.7 10.1 8.5 9.7
Agree 60.0 40.0 65.2 56.9 53.2 55.9
Strongly agree 40.0 20.0 21.7 31.2 38.3 33.1
TOTAL 100.0 100.0 100.0 100.0 100.0 100.0
Round 3
Row percentages
Strongly disagree -
Disagree 0.0 0.0 50.0 50.0 0.0 100.0
Neither agree nor disagree 0.0 9.1 18.2 63.6 9.1 100.0
Agree 0.7 2.2 8.8 49.3 39.0 100.0
Strongly agree 0.0 0.0 4.2 51.4 44.4 100.0
TOTAL 0.5 1.8 8.1 50.7 38.9 100.0
Column percentages
Strongly disagree 0.0 0.0 0.0 0.0 0.0 0.0
Disagree 0.0 0.0 5.6 0.9 0.0 0.9
Neither agree nor disagree 0.0 25.0 11.1 6.3 1.2 5.0
Agree 100.0 75.0 66.7 59.8 61.6 61.5
Strongly agree 0.0 0.0 16.7 33.0 37.2 32.6
TOTAL 100.0 100.0 100.0 100.0 100.0 100.0
Note: Round 2 n=236: Teachers: disagree n=3, neither n=23, agree n=132, strongly agree n=78; Principals strongly disagree
n=5, disagree n=5, neither n=23, agree n=109, strongly agree n=94; Round 3 n=221: Teachers: disagree n=2, neither
n=11, agree n=136, strongly agree n=72; Principals strongly disagree n=1, disagree n=4, neither n=18, agree n=112,
strongly agree n=86

Longitudinal Teacher Education and Workforce Study (LTEWS) Final Report
170
The blue highlighted cells in Round 3 show that of the graduates who strongly agreed they were effective in the
area of 'Create and maintain supportive and safe learning environments', 44.4 per cent of their principals also
strongly agreed. Of principals who strongly agreed their graduates were effective in this area in Round 3, only 37.2
per cent of the graduates also strongly agreed, showing again that graduates perceptions of their own
effectiveness was not as positive as the perceptions their principals have of them.
Overall in Round 2, column totals show that 89 per cent of graduates agree or strongly agreed they were effective
in this area, and row totals show that 86 per cent of principals agree or strongly agree that graduates were
effective in this area, showing a strong consensus between graduates and principals.
Overall in Round 3, column totals show that 94.1 per cent of graduates agreed or strongly agree they were
effective in this area, and row totals show that 89.6 per cent of principals agree or strongly agreed that graduates
were effective in this area, showing a reasonably strong consensus between graduates and principals, but not as
strong as in Round 2.
5. Effectiveness in the area of 'Assess, provide feedback and report on student learning'
Table 89 shows what graduates and principals said about the graduates’ effectiveness in the area of 'Assess,
provide feedback and report on student learning'.
Table 89. Comparison of teacher and principal perceptions on effectiveness in 'Assess, provide feedback and report on student learning'
Principals
Strongly
disagree Disagree
Neither
agree nor
disagree Agree
Strongly
agree Total
Graduates
Round 2
Row percentages
Strongly disagree -
Disagree 0.0 8.3 16.7 50.0 25.0 100.0
Neither agree nor disagree 0.0 7.7 12.8 51.3 28.2 100.0
Agree 0.7 5.9 10.3 57.4 25.7 100.0
Strongly agree 2.0 6.1 8.2 49.0 34.7 100.0
TOTAL 0.8 6.4 10.6 54.2 28.0 100.0
Column percentages
Strongly disagree 0.0 0.0 0.0 0.0 0.0 0.0
Disagree 0.0 6.7 8.0 4.7 4.5 5.1
Neither agree nor disagree 0.0 20.0 20.0 15.6 16.7 16.5
Agree 50.0 53.3 56.0 60.9 53.0 57.6
Strongly agree 50.0 20.0 16.0 18.8 25.8 20.8
TOTAL 100.0 100.0 100.0 100.0 100.0 100.0
Round 3
Row percentages
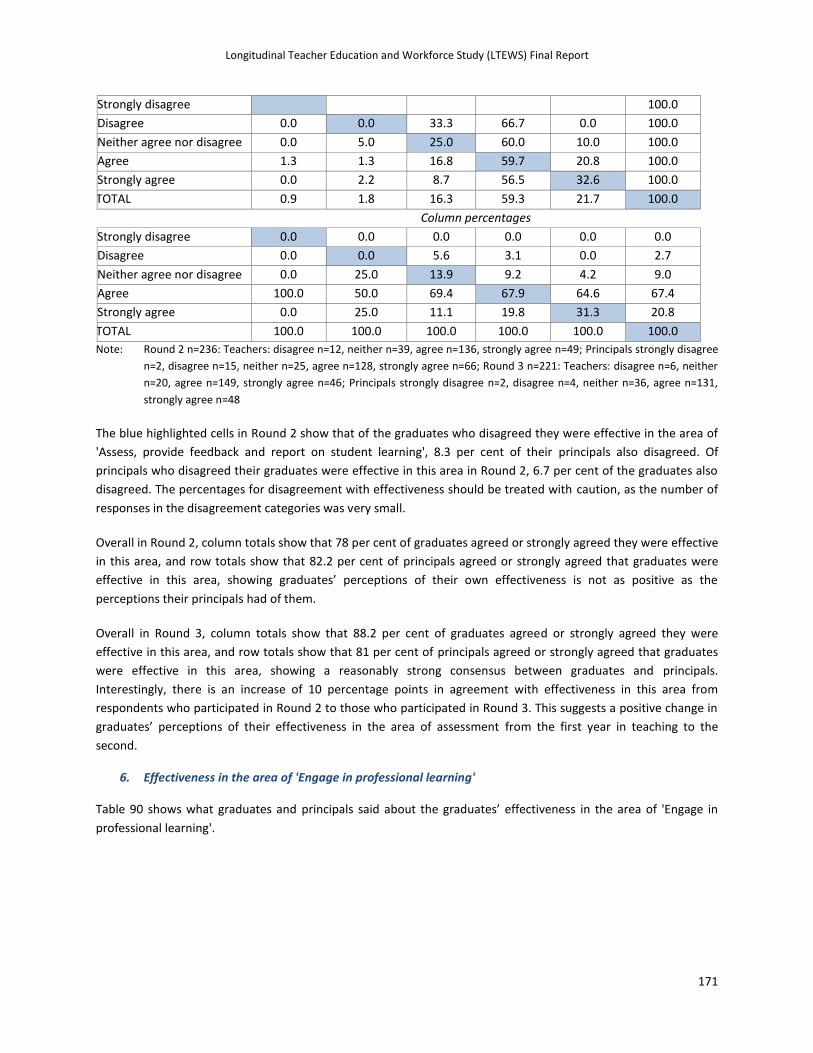
Longitudinal Teacher Education and Workforce Study (LTEWS) Final Report
171
Strongly disagree 100.0
Disagree 0.0 0.0 33.3 66.7 0.0 100.0
Neither agree nor disagree 0.0 5.0 25.0 60.0 10.0 100.0
Agree 1.3 1.3 16.8 59.7 20.8 100.0
Strongly agree 0.0 2.2 8.7 56.5 32.6 100.0
TOTAL 0.9 1.8 16.3 59.3 21.7 100.0
Column percentages
Strongly disagree 0.0 0.0 0.0 0.0 0.0 0.0
Disagree 0.0 0.0 5.6 3.1 0.0 2.7
Neither agree nor disagree 0.0 25.0 13.9 9.2 4.2 9.0
Agree 100.0 50.0 69.4 67.9 64.6 67.4
Strongly agree 0.0 25.0 11.1 19.8 31.3 20.8
TOTAL 100.0 100.0 100.0 100.0 100.0 100.0
Note: Round 2 n=236: Teachers: disagree n=12, neither n=39, agree n=136, strongly agree n=49; Principals strongly disagree
n=2, disagree n=15, neither n=25, agree n=128, strongly agree n=66; Round 3 n=221: Teachers: disagree n=6, neither
n=20, agree n=149, strongly agree n=46; Principals strongly disagree n=2, disagree n=4, neither n=36, agree n=131,
strongly agree n=48
The blue highlighted cells in Round 2 show that of the graduates who disagreed they were effective in the area of
'Assess, provide feedback and report on student learning', 8.3 per cent of their principals also disagreed. Of
principals who disagreed their graduates were effective in this area in Round 2, 6.7 per cent of the graduates also
disagreed. The percentages for disagreement with effectiveness should be treated with caution, as the number of
responses in the disagreement categories was very small.
Overall in Round 2, column totals show that 78 per cent of graduates agreed or strongly agreed they were effective
in this area, and row totals show that 82.2 per cent of principals agreed or strongly agreed that graduates were
effective in this area, showing graduates’ perceptions of their own effectiveness is not as positive as the
perceptions their principals had of them.
Overall in Round 3, column totals show that 88.2 per cent of graduates agreed or strongly agreed they were
effective in this area, and row totals show that 81 per cent of principals agreed or strongly agreed that graduates
were effective in this area, showing a reasonably strong consensus between graduates and principals.
Interestingly, there is an increase of 10 percentage points in agreement with effectiveness in this area from
respondents who participated in Round 2 to those who participated in Round 3. This suggests a positive change in
graduates’ perceptions of their effectiveness in the area of assessment from the first year in teaching to the
second.
6. Effectiveness in the area of 'Engage in professional learning'
Table 90 shows what graduates and principals said about the graduates’ effectiveness in the area of 'Engage in
professional learning'.

Longitudinal Teacher Education and Workforce Study (LTEWS) Final Report
172
Table 90. Comparison of teacher and principal perceptions on effectiveness in 'Engage in professional learning'
Principals
Strongly
disagree Disagree
Neither
agree nor
disagree Agree
Strongly
agree Total
Graduates
Round 2
Row percentages
Strongly disagree -
Disagree 0.0 0.0 12.5 25.0 62.5 100.0
Neither agree nor disagree 0.0 4.8 14.3 28.6 52.4 100.0
Agree 0.0 2.5 7.5 38.3 51.7 100.0
Strongly agree 0.0 2.3 4.6 41.4 51.7 100.0
TOTAL 0.0 2.5 7.2 38.1 52.1 100.0
Column percentages
Strongly disagree 0.0 0.0 0.0 0.0 0.0
Disagree 0.0 5.9 2.2 4.1 3.4
Neither agree nor disagree 16.7 17.6 6.7 8.9 8.9
Agree 50.0 52.9 51.1 50.4 50.8
Strongly agree 33.3 23.5 40.0 36.6 36.9
TOTAL - 100.0 100.0 100.0 100.0 100.0
Round 3
Row percentages
Strongly disagree -
Disagree 0.0 0.0 0.0 33.3 66.7 100.0
Neither agree nor disagree 0.0 0.0 21.4 42.9 35.7 100.0
Agree 0.7 0.7 3.7 47.8 47.1 100.0
Strongly agree 0.0 0.0 2.9 39.7 57.4 100.0
TOTAL 0.5 0.5 4.5 44.8 49.8 100.0
Column percentages
Strongly disagree 0.0 0.0 0.0 0.0 0.0 0.0
Disagree 0.0 0.0 0.0 1.0 1.8 1.4
Neither agree nor disagree 0.0 0.0 30.0 6.1 4.5 6.3
Agree 100.0 100.0 50.0 65.7 58.2 61.5
Strongly agree 0.0 0.0 20.0 27.3 35.5 30.8
TOTAL 100.0 100.0 100.0 100.0 100.0 100.0
Note: Round 2 n=236: Teachers: disagree n=8, neither n=21, agree n=121, strongly agree n=87; Principals strongly disagree
n=0, disagree n=6, neither n=17, agree n=90, strongly agree n=123; Round 3 n=221: Teachers: disagree n=3, neither
n=14, agree n=136, strongly agree n=68; Principals strongly disagree n=1, disagree n=1, neither n=10, agree n=99,
strongly agree n=110
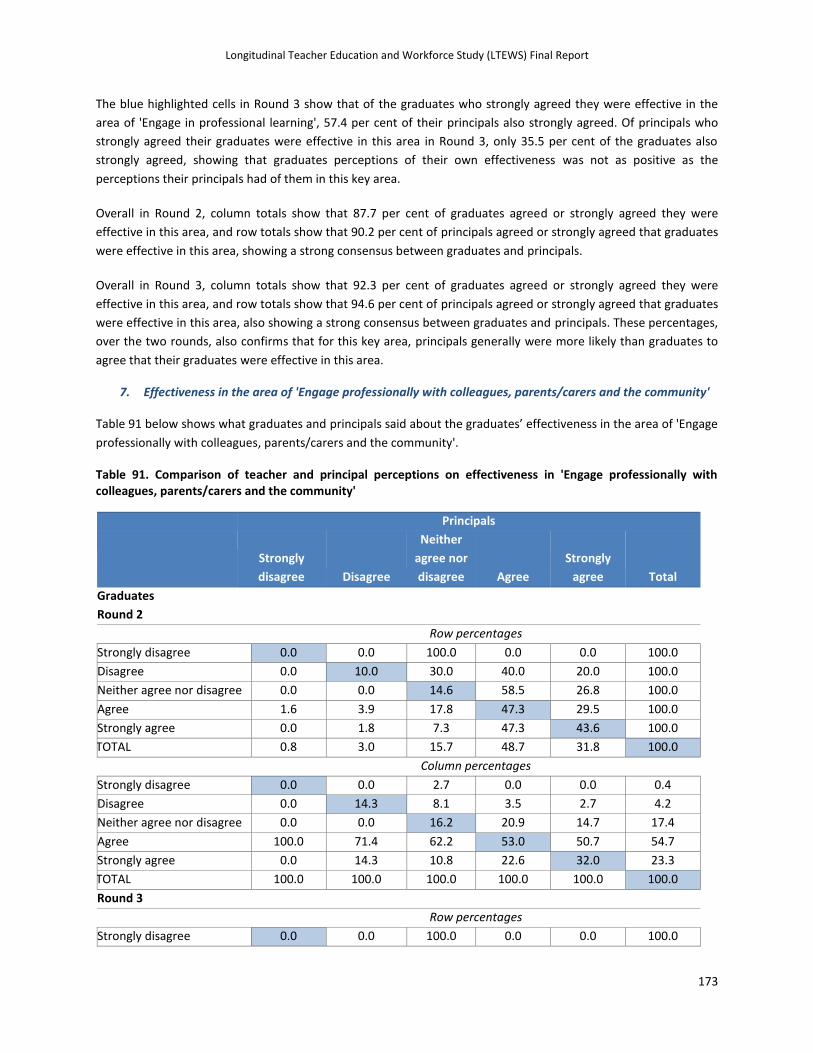
Longitudinal Teacher Education and Workforce Study (LTEWS) Final Report
173
The blue highlighted cells in Round 3 show that of the graduates who strongly agreed they were effective in the
area of 'Engage in professional learning', 57.4 per cent of their principals also strongly agreed. Of principals who
strongly agreed their graduates were effective in this area in Round 3, only 35.5 per cent of the graduates also
strongly agreed, showing that graduates perceptions of their own effectiveness was not as positive as the
perceptions their principals had of them in this key area.
Overall in Round 2, column totals show that 87.7 per cent of graduates agreed or strongly agreed they were
effective in this area, and row totals show that 90.2 per cent of principals agreed or strongly agreed that graduates
were effective in this area, showing a strong consensus between graduates and principals.
Overall in Round 3, column totals show that 92.3 per cent of graduates agreed or strongly agreed they were
effective in this area, and row totals show that 94.6 per cent of principals agreed or strongly agreed that graduates
were effective in this area, also showing a strong consensus between graduates and principals. These percentages,
over the two rounds, also confirms that for this key area, principals generally were more likely than graduates to
agree that their graduates were effective in this area.
7. Effectiveness in the area of 'Engage professionally with colleagues, parents/carers and the community'
Table 91 below shows what graduates and principals said about the graduates’ effectiveness in the area of 'Engage
professionally with colleagues, parents/carers and the community'.
Table 91. Comparison of teacher and principal perceptions on effectiveness in 'Engage professionally with colleagues, parents/carers and the community'
Principals
Strongly
disagree Disagree
Neither
agree nor
disagree Agree
Strongly
agree Total
Graduates
Round 2
Row percentages
Strongly disagree 0.0 0.0 100.0 0.0 0.0 100.0
Disagree 0.0 10.0 30.0 40.0 20.0 100.0
Neither agree nor disagree 0.0 0.0 14.6 58.5 26.8 100.0
Agree 1.6 3.9 17.8 47.3 29.5 100.0
Strongly agree 0.0 1.8 7.3 47.3 43.6 100.0
TOTAL 0.8 3.0 15.7 48.7 31.8 100.0
Column percentages
Strongly disagree 0.0 0.0 2.7 0.0 0.0 0.4
Disagree 0.0 14.3 8.1 3.5 2.7 4.2
Neither agree nor disagree 0.0 0.0 16.2 20.9 14.7 17.4
Agree 100.0 71.4 62.2 53.0 50.7 54.7
Strongly agree 0.0 14.3 10.8 22.6 32.0 23.3
TOTAL 100.0 100.0 100.0 100.0 100.0 100.0
Round 3
Row percentages
Strongly disagree 0.0 0.0 100.0 0.0 0.0 100.0

Longitudinal Teacher Education and Workforce Study (LTEWS) Final Report
174
Disagree 0.0 0.0 50.0 50.0 0.0 100.0
Neither agree nor disagree 0.0 0.0 31.0 44.8 24.1 100.0
Agree 0.8 3.1 13.0 49.6 33.6 100.0
Strongly agree 1.8 1.8 7.1 58.9 30.4 100.0
TOTAL 0.9 2.3 14.9 51.1 30.8 100.0
Column percentages
Strongly disagree 0.0 0.0 3.0 0.0 0.0 0.5
Disagree 0.0 0.0 6.1 1.8 0.0 1.8
Neither agree nor disagree 0.0 0.0 27.3 11.5 10.3 13.1
Agree 50.0 80.0 51.5 57.5 64.7 59.3
Strongly agree 50.0 20.0 12.1 29.2 25.0 25.3
TOTAL 100.0 100.0 100.0 100.0 100.0 100.0
Note: Round 2 n=236: Teachers: strongly disagree n=1, disagree n=10, neither n=41, agree n=129, strongly agree n=55;
Principals strongly disagree n=2, disagree n=7, neither n=37, agree n=115, strongly agree n=75; Round 3 n=221:
Teachers: strongly disagree n=1, disagree n=4, neither n=29, agree n=131, strongly agree n=56; Principals strongly
disagree n=2, disagree n=5, neither n=33, agree n=113, strongly agree n=68
Overall in Round 2, column totals show that 78 per cent of graduates agreed or strongly agreed they were effective
in the area of 'Engage professionally with colleagues, parents/carers and the community', and row totals show that
80.5 per cent of principals agreed or strongly agreed that graduates were effective in this area, showing a strong
consensus between graduates and principals. This area also had a considerable percentage of graduates and
principals who had no opinion of graduates’ effectiveness in this area (17.4 per cent and 15.7 per cent,
respectively).
Overall in Round 3, column totals show that 84.6 per cent of graduates agreed or strongly agreed they were
effective in this area, and row totals show that 81.9 per cent of principals agreed or strongly agreed that graduates
were effective in this area, showing a reasonably strong consensus between graduates and principals. It also
suggests that by the beginning of their second year of teaching, more graduates were in agreement on their
effectiveness in this area than at the end of their first year (84.6 per cent compared to 78 per cent), whilst principal
opinions remained fairly static. There was a slightly larger percentage of principals than graduates who neither
agreed nor disagreed in Round 3 (14.9 per cent compared to 13.1 per cent).

Longitudinal Teacher Education and Workforce Study (LTEWS) Final Report
175
4.4 Entry into Teacher Education
Across Australia, entry into teacher education is managed by state and territory-based tertiary admissions centres,
with variations in practices across jurisdictions. Generally, entry into teacher education programs requires
candidates to meet minimum tertiary entrance requirements for the state/territory, satisfy the entry pre-
requisites for the specific program, and to be selected in competition with other eligible applicants.
Ingvarson, Beavis and Kleinhenz’s (2004) mapping of selection processes found that teacher education providers
used tertiary entrance scores as the main pre-requisite of admission for undergraduate degrees, and that smaller
providers appeared to use a greater range of selection procedures. However, in 2011 the Australian Tertiary
Admission Rank (ATAR) was the determining factor for entry into ITE programs for only 40 per cent of domestic
undergraduate students, and 27 per cent of all students ― 72 per cent of all ITE undergraduate program
candidates are granted entry based on measures other than ATAR (Australian Institute For Teaching and School
Leadership, 2013; Department of Industry, Innovation, Science, Research and Tertiary Education, 2012a). The
Australian Institute for Teaching and School Leadership calculated that of the successful applicants for whom entry
was based on ATAR, 28 per cent were scores of 80 and above and the majority were between 61 and 80
(Australian Institute of Teaching and School Leadership, 2011c). In addition, it should be noted that scholars like
Teese and Polesel (2003) have problematised the use of ATAR as the primary measure for university entry finding
ATAR to be highly correlated with socio-economic status and more reliable as a predictor of socio-economic status
than of academic capability. Alongside this research, Gale and Mills (2013), citing national and international
literature (see Dobozy, 2008; Tranter, Murdoch, & Saville, 2007; Win & Miller, 2005), report that students from low
socio-economic status backgrounds enrolled in university programs perform similarly to students from high socio-
economic status backgrounds.
In the mapping component of this project, LTEWS found that for undergraduate degree programs, institutions
often listed ATAR and results of pre-requisite Year 12 subjects (typically general mathematics or mathematical
methods and English) as the primary criterion for school leaver entry. It also showed that they take into account
previous education, qualifications and work experience of mature-age and career change applicants in order to
determine entry into teacher education programs. For entry into postgraduate/graduate teacher education
programs, applicants generally require a 3-year bachelor’s degree in any discipline other than teaching. For
secondary teaching, that degree must include successful study in disciplines that enable students to qualify for two
single teaching method subjects or one double method. Methods usually require a background of study for at least
two years. In the main, postgraduate teacher education programs assume discipline knowledge expertise prior to
entering the program and this is the basis of entry requirements and teacher registration requirements.
Other measures less frequently considered for entry into teacher education programs are interviews, portfolios,
auditions, character references, residential location, socio-economic status and evidence of prior learning.
Portfolios and auditions are most common in the programs with specialisations in Music and Fine Arts. Some
examples are included in the mapping report (See Appendix 1). For example, pre-requisites for admission to
Queensland University of Technology’s Graduate Diploma in Education (Senior Years)/Bachelor of Fine Arts (Dance,
Drama or Visual Arts) include successful audition for the dance major, and a successful portfolio and interview for
the visual arts major.
Moreover, the mapping activity also revealed that factors such as residential address and socio-economic status
are typically used in alternative entry schemes with an equity agenda. For example, the University of Ballarat offers
the Regional Education Entry Program (REEP). Students who apply through REEP are assessed on their
demonstrated motivation to succeed and their contributions to their school and community, not just their ATAR.

Longitudinal Teacher Education and Workforce Study (LTEWS) Final Report
176
This program specifically seeks to increase the participation rates in higher education of students from rural and
regional areas. Some institutions also offer bridging programs specifically designed to provide a pathway into
teaching for school leavers with lower ATARs. For example, Victoria University operates the Portfolio Partnership
Program (PPP), a partnership between the University and a selection of over 120 Victorian schools. Like REEP, the
program assesses applications based on ATAR and a combination of goals, achievements and community
involvement.
Box 12 lists the main findings of Section 4.4.
Box 12. Main Findings: Entry into teacher education programs
ATAR as a measure of entry is only relevant for a relatively small percentage of those entering teacher education – school leavers commencing undergraduate programs. Analysis of the respondents’ age shows that between 70 to 78 per cent of LTEWS respondents over the three survey rounds did not enter their teacher education programs immediately after completing their secondary education.
A majority of graduates had prior academic or trade qualifications before entering their teacher education program. About 60 per cent of those with prior qualifications held bachelor degrees and 11-12 per cent held postgraduate qualifications. More secondary graduates had prior qualifications than those in primary or early childhood.
The mapping of initial teacher education component of this study shows that teacher education providers use additional measures for program entry including prior qualifications, interviews, portfolios, auditions, character references, residential location, SES and evidence of prior learning.
As the entry characteristics including ATAR cut-offs for initial teacher education programs change from year to
year, in LTEWS it was not possible to show meaningful connections between the entry characteristics for the 2011
graduate cohort and career paths.
In LTEWS, the data show that many respondents had came to teaching with prior qualifications, as shown in the
figure below. In Round 1, 69 per cent of respondents indicated they had academic or trade qualifications prior to
undertaking their teacher education program. In Rounds 2, this group consisted of 54 per cent of all respondents
and in Round 3, 64 per cent.

Longitudinal Teacher Education and Workforce Study (LTEWS) Final Report
177
Figure 29. Graduate teachers with academic or trade qualifications in an area other than teaching
Note: Round 1 n=1,375; Round 2 n=2,765; Round 3 n=2,248
Figure 30 shows the percentage of respondents with prior qualifications, by the main area of their initial teacher
education program. In all three survey rounds, the graduate teachers in the early childhood/primary area had the
lowest percentage with prior qualifications but in Rounds 1 and 2 prior qualifications were held by over 54 per cent
of them. The graduate teachers with the highest proportion having prior qualifications are those whose main area
of study was secondary teaching.
Figure 30. Graduate teachers' main area of program – by previous qualifications
68.8
53.8 63.7
31.2
46.2 36.3
0%
10%
20%
30%
40%
50%
60%
70%
80%
90%
100%
Round 1 Round 2 Round 3Other academic or trade qualfications
No
Yes
62.7
54.8
63.4
68.8
81.6
37.3
45.2
36.6
31.2
18.4
0% 20% 40% 60% 80% 100%
Early childhood
EC/Prim
Primary
Prim/Sec
Secondary
Percent
Pro
gram
are
a
Round 1
Otheracademic ortradequalificationsNo otherqualfications

Longitudinal Teacher Education and Workforce Study (LTEWS) Final Report
178
Table 92 below shows the breakdown of these prior qualifications. Across the three rounds of surveys, 59 to 60 per
cent of graduate teachers with prior qualifications had a bachelor’s degree, 13 to 14 per cent had a certificate and
11 to 12 per cent had a qualification at the postgraduate level.
Table 92. Graduate teachers by highest qualifications in fields other than education
Round 1 Round 2 Round 3
n n n % n %
Postgraduate degree level 120 12.7 171 11.5 177 12.8
Grad Diploma/Certificate level 71 7.5 105 7.1 120 8.7
Bachelor degree level 549 58.1 886 59.6 827 59.6
Advanced Diploma or Diploma level 70 7.4 121 8.1 78 5.6
Certificate level 135 14.3 204 13.7 185 13.3
TOTAL 945 100.0 1,487 100.0 1,387 100.0
As well as qualifications, approximately half of all graduate respondents in all three surveys stated they also had
prior trade or industry experience before coming to teaching.
65.0
54.0
63.0
59.7
79.2
35.0
46.0
37.0
40.3
20.8
0% 20% 40% 60% 80% 100%
Early childhood
EC/Prim
Primary
Prim/Sec
Secondary
Percent
Pro
gram
are
a
Round 2
Otheracademic ortradequalifications
No otherqualfications
58.8
42.7
61.4
64.0
72.0
41.2
57.3
38.6
36.0
28.0
0% 20% 40% 60% 80% 100%
Early childhood
EC/Prim
Primary
Prim/Sec
Secondary
Percent
Pro
gram
are
a
Round 3
Otheracademic ortradequalifications
No otherqualfications

Longitudinal Teacher Education and Workforce Study (LTEWS) Final Report
179
The data in the Tables and Figures above indicate that a large proportion of graduates in LTEWS did not enter
teaching education programs straight from school. The table below looks at the age groups in which graduate
respondents belonged at the time of answering the surveys.
Table 93. Graduate teachers by age
Round 1 Round 2 Round 3
n n n % n %
20-24 403 29.8 811 29.6 480 21.5
25-29 317 23.4 779 28.4 709 31.7
30-34 155 11.4 322 11.7 288 12.9
35-39 127 9.4 232 8.5 199 8.9
40-44 158 11.7 265 9.7 234 10.5
45-49 119 8.8 182 6.6 180 8.1
50+ 75 5.5 151 5.5 146 6.5
TOTAL 1,354 100.0 2,742 100.0 2,236 100.0
If graduates were entering teacher education directly from secondary school, the data would show that the
majority of respondents were in the 20-24 year old age group. This is not the case. Graduates in this age group
were 30 per cent of respondents in Rounds 1 and 2 and 22 per cent in Round 3. This indicates that between 70 to
78 per cent of respondents over the three survey rounds did not enter their teacher education programs
immediately after completing their secondary education.
Longitudinal Teacher Education and Workforce Study (LTEWS) Final Report
180
4.5 The Practicum
This section examines the relevance and effectiveness of the practicum component of teacher education programs
by drawing on analysis of the Graduate Teacher Surveys and the Principal Surveys, and supported by interview
data and the activity which mapped teacher education programs across Australia as they were for the cohort being
tracked (see Appendix 1). It discusses the nature of practicum and its impact on graduates’ decisions whether or
not to seek teaching employment, the structures and approaches considered effective for early career teaching,
the ways in which practicum processes influence or support graduates’ career retention and advancement, and the
extent to which it is adequate for subsequent classroom teaching.
Professional experience in schools is a requirement of all teacher education programs in Australia and although
terms used to describe components of professional experience vary from state to state, ‘professional experience’
generally refers to a range of experiences including internships, observations, supervised teaching practice or
practicum as well as community placements. In this report, we use the term ‘practicum’ to define the days in
schools where pre-service teachers are supervised (i.e. the number of supervised days required for teacher
registration purposes).
The Australian Government provides funding to Higher Education Institutions for practicum supervision. These
Institutions then contract directly with individual schools for the provision of supervision of pre-service teachers.
Until 2011, an Industrial Award, the Australian Higher Education Practice Teaching Supervision Award 1990,
provided guidelines for the eligibility of teachers for practicum supervision as well as the rates for payment for
supervising in all Australian States and Territories. Teacher regulatory authorities in each state and territory have
required a minimum number of supervised practicum days for accreditation of teacher education programs. This is
now framed by the new national program standards for accreditation of teacher education programs that detail
consistent requirements for all states and territories. However, at the time of accreditation of the programs that
the LTEWS cohort would have completed, there was much variety in what was required in each state and territory.
As noted earlier in this report, the past decades have seen many government inquiries on teacher education,
including comments on the practicum. Australia’s Teachers: Australia’s Future (Committee for the Review of
Teaching and Teacher Education, 2003) highlighted considerable variation in the professional experiences in
teacher education programs and also financial and structural constraints. Ingvarson, Beavis and Kleinhenz’s (2004)
study underlined placement shortages and other structural processes that seemed to hinder pre-service teachers’
opportunities for school-based professional experiences. Other studies have stressed the need for increased
professional engagement between universities and schools in the professionalisation of the teaching profession
(e.g Caldwell & Sutton, 2010; White, Bloomfield, & Le Cornu, 2010). Research has also shown that effective time
spent in the classrooms during initial teacher preparation impacts on teachers’ decisions to stay on the job longer
(D. Boyd, Lankford, Loeb, Rockoff, & Wyckoff, 2007; U.S. Department of Education. National Center for Education
Statistics, 2000). However, more needs to be known about the particularities of practicum approaches and delivery
that can effectively support early career teachers to integrate their knowledge in skilful ways (White et al., 2010).
Box 13 lists the main findings for Section 4.5.

Longitudinal Teacher Education and Workforce Study (LTEWS) Final Report
181
Box 13. Main Findings: The Practicum
Nearly all graduates with a teaching position agreed that the skills they developed during the practicum were important and that this prepared them for their current teaching context, irrespective of the ways in which the practicum was structured – days per week or blocks.
Regardless of the practicum type, virtually all graduates who were teaching considered that they were
successful in influencing student learning
Approximately a third of graduates either strongly agreed or agreed that their university-based units were relevant for their current teaching contexts. However, as compared to their practicum experiences, graduates felt that their university-based units were less helpful in preparing them for their current teaching contexts.
More than 83 per cent of graduates undertook some of their practicum in one or more weekly blocks.
Graduate teachers’ and principals’ responses highlight the value of the teacher education program
including a combination of 1 to 2 days per week and block placements of 5 weeks duration, and then internships in the final part of the program.
Graduate teachers and principals highlighted the value of an internship in the final part of the program to
provide a sustained time transitioning into teaching employment. In free text responses, some principals highlighted the value of internships in helping them ascertain a graduating teacher’s suitability for employment.
Many graduate teachers stressed the need for greater theory and practice linkages to apply what they
have learnt into real world contexts.
Graduates who participated in the telephone interviews highlighted the importance of strong school partnerships for sustained and on-going professional learning in real-world settings in order to improve their effectiveness. Interviews with provider representatives revealed that difficulties associated with costs and the difficulties in finding partner schools to work with.
Graduate teachers’ interview responses highlighted inconsistencies in the quality and provision of
university and teacher supervision during their practicum experiences. They also highlighted the value of professional learning conversations as they learn to teach and refine their practice.
Graduates highlighted the value of completing a variety of teaching experiences in diverse settings in
order to understand classroom complexities that come with different social and cultural spaces.
In the interviews, graduates highlighted preferences for:
o More practicum time
o A range of practicum experiences in different types of school settings
o More contact from their university supervisors during practicum, and strong partnership and mentoring structures from both the university and teachers in schools.

Longitudinal Teacher Education and Workforce Study (LTEWS) Final Report
182
4.5.1 The nature of the practicum and graduates’ decisions about whether or not to seek teaching employment.
In the surveys, graduate teachers were asked about the ways in which their teacher education practicum was
structured. Respondents to the surveys were asked if the practicum component of their teacher education
program included:
1-2 days a week in schools over an extended period of time
Five days a week over one or more weeks (Block)
An internship
The responses, as shown in the table below, indicate that the most common type of practicum is a block, where
pre-service teachers are in a school for five days a week for a number of weeks.
Table 94. Graduate teachers – by the structure of the practicum in their teacher education program
The structure of the practicum in your
program ...
Round 1 Round 2 Round 3
n % n % n %
1-2 days a week over an extended period 337 24.5 513 24.9 557 29.4
5 days a week over 1 or more weeks (Block) 1,246 90.6 1,882 91.2 1,583 83.4
Internship 360 26.2 576 27.9 670 35.4
Note: 1. Round 1 n=1,375; Round 2 n=2,063; Round 3 n=1,895
2. Graduates could indicate that they took part in more than one form of practicum component, and
therefore the responses do not add to 100 per cent.
To formulate an answer to the question: ‘Does nature of teacher practice incorporated into teacher preparation
programs appear to influence graduates in deciding whether or not to seek teaching employment?’ – two
questions from the datasets were analysed in relation to the structure of the practicum in order to examine the
employment patterns for graduates who undertook different practicum structures:
Are you currently employed as a teacher?
Are you currently seeking work as a teacher?
The first question was asked of all graduates in each survey round. When cross-tabulated with the practicum
structures, the results suggest that graduates who participated in an internship had a higher percentage in
teaching employment in Round 1 than did those whose practicum was composed of 1 to 2 days a week or a block
of time. This result must be regarded with caution, as it was not repeated across the subsequent rounds,
suggesting the high possibility of extraneous variables such as the institution where these internships were
organised, institutional and/or program relationships with schools, and the states or territory in which these
programs were located.

Longitudinal Teacher Education and Workforce Study (LTEWS) Final Report
183
The second question was asked of those who did not have a teaching position in a school. When cross-tabulated
with the practicum structures, the results show there is no relationship between practicum structures and the
likelihood of unemployed graduates seeking work as a teacher.
Table 95. Graduates’ practicum structures – by employment as a teacher and seeking work as a teacher
The structure of the practicum in the teacher
education program ...
Round 1 Round 2 Round 3
n % n % N %
Currently employed as a teacher
1-2 days a week over an extended period 256 76.2 430 87.0 469 85.4
5 days a week over 1 or more weeks 914 73.7 1,545 84.3 1,297 83.1
Internship 290 80.6* 460 82.1 563 85.0
Total 1,324 74.0 2,618 84.7 1,866 83.6
Currently seeking work as a teacher
1-2 days a week over an extended period 68 81.0 42 65.6 52 65.0
5 days a week over 1 or more weeks 293 84.0 200 69.4 171 64.8
Internship 61 81.3 69 69.0 63 63.6
Total 371 83.6 402 68.4 309 63.1
Note: 1. Graduates could indicate that they took part in more than one form of practicum component therefore
the number of responses is not equal to the total.
2. *Round 1, those with an internship who are currently teaching is statistically significant (p<0.005).
Overall, these data show that the likelihood of graduates having a teaching position in a school, or the likelihood of
seeking or not seeking teaching employment for graduates who are not employed as teachers, have no
relationship to the structure of the practicum incorporated in their teacher education program.

Longitudinal Teacher Education and Workforce Study (LTEWS) Final Report
184
4.5.2 Structures and approaches in practicum considered by graduates and principals as being effective in preparing teachers for initial employment.
There were two questions in the Graduate Teacher Survey that asked about the practicum component of
graduates’ teacher education programs. The questions required a response on a five-point Likert scale to indicate
the level of agreement with the following statements:
The skills I gained during the professional experience/practicum components of my teacher education
program were important
The professional experience/practicum components of my teacher education program helped prepare me
for my current teaching context
Table 96 shows the importance of the practicum for gaining skills, according to graduate teachers across the three
rounds of the LTEWS Graduate Teacher Survey. As the results show, between 96 to 98 per cent of graduate
teachers either strongly agreed or agreed that the skills they gained during practicum were important over all
three rounds.
Table 96. Graduate teachers with a teaching position – by their view of importance of skills gained in practicum
Round 1 Round 2 Round 3
n % n % n %
Strongly Disagree 5 0.5 8 0.4 4 0.2
Disagree 5 0.5 17 0.8 17 1.0
Neither Agree nor Disagree 11 1.2 37 1.8 54 3.2
Agree 223 23.9 637 30.4 525 30.6
Strongly Agree 688 73.8 1395 66.6 1113 65.0
Total 932 100.0 2,094 100.0 1713 100.0
A question was asked of graduate teachers currently teaching about the relevance of their practicum experience
for their current teaching context. The results are shown in the table below.
Table 97. Graduate teachers with a teaching position – by their view of relevance of practicum to current teaching
Round 1 Round 2 Round 3
n % n % n %
Strongly Disagree 11 1.2 20 1.0 16 0.9
Disagree 33 3.5 54 2.6 69 4.0
Neither Agree nor Disagree 28 3.0 114 5.4 113 6.6
Agree 269 28.9 774 37.0 675 39.2
Strongly Agree 591 63.4 1130 54.0 848 49.3
Total 932 100.0 2092 100.0 1721 100.0
Ninety-two per cent of graduate teachers either strongly agreed or agreed that their practicum prepared them for
their current teaching context in Round 1, and by Round 3 the level of agreement was still considerably high at
88.5 per cent.

Longitudinal Teacher Education and Workforce Study (LTEWS) Final Report
185
In the interviews and survey free text responses, graduate teachers highlighted the important role the practicum
played in their overall program experience, for example:
that’s [practicum] definitely, probably, the biggest thing throughout university. I got a lot out of those practicums…definitely after each lesson talking to teachers about what worked, what didn’t, what I could do next time to improve and things … and then those conversations going on in your head after every lesson.
Graduate teacher, full-time contract, metropolitan, primary school
Many of them indicated that they preferred longer and sustained practicum time in the classrooms, for example:
In the Graduate Teacher Survey, respondents were asked about their level of agreement with the statement, ‘The
skills I gained during the professional experience/practicum components of my teacher education program were
important’. The analysis cross-tabulated responses with the types of practicum components in which graduates
participated. Table 98 below shows teaching graduates’ level of agreement with the statement. Results shown
here are only an indication of how views differ across the three practicum components because graduates were
able to select as many practicum components as were relevant to them in the surveys.
Experience during practicum in classrooms is intangible. If I could change the course, I would extend the graduate diploma from 1 year to 18 months, increasing school time and reducing on campus time. I imagined the cost of this would be greater, however, the value of hands on experience would produce far more effective graduate teachers.
Graduate teacher, full-time permanent, primary school
Table 98. Graduate teachers with a teaching position – by their view of the importance of skills gained in practicum, by practicum component
Skills gained during practicum
were important
Strongly
disagree Disagree
Neither
agree nor
disagree Agree
Strongly
agree
% % % % %
Round 1
1-2 days a week 0.8 0.0 0.8 28.6 69.8
Block 0.5 0.6 1.0 23.1 74.9
Internship 0.0 0.7 0.7 22.3 76.2
Round 2
1-2 days a week 0.0 0.2 0.7 31.6 67.5
Block 0.5 0.8 1.7 30.1 67.0
Internship 0.0 0.2 1.2 25.4 73.2
Round 3

Longitudinal Teacher Education and Workforce Study (LTEWS) Final Report
186
1-2 days a week 0.7 0.9 0.7 33.9 63.8
Block 0.2 0.7 2.6 29.8 66.6
Internship 0.4 1.0 2.9 30.0 65.8
There are no significant differences across the three practicum components in terms of the agreement with the
statement that practicum skills were important. Between 96 to 99 per cent of respondents either agreed or
strongly agreed in all three rounds, regardless of the practicum component in which they took part.
Table 99 below shows the graduates’ level of agreement with the statement The professional
experience/practicum components of my teacher education program helped prepare me for my current teaching
context, cross-tabulating responses with practicum components in which graduates participated. Again, results
shown here are only an indication of how views differ across the three practicum components because graduates
were able to select multiple options in the surveys as were relevant to them
Table 99. Graduate teachers with a teaching position – by their view of relevance of practicum to current teaching, by practicum component
Practicum helped prepare for
current teaching context
Strongly
disagree Disagree
Neither
agree nor
disagree Agree
Strongly
agree
% % % % %
Round 1
1-2 days a week 2.4 4.9 3.3 29.0 60.4
Block 0.9 3.3 2.9 29.0 63.8
Internship 0.7 5.5 3.3 27.5 63.0
Round 2
1-2 days a week 0.5 2.2 5.6 39.3 52.4
Block 1.2 2.5 5.1 36.7 54.4
Internship 0.7 2.1 4.8 33.9 58.4
Round 3
1-2 days a week 1.1 2.7 5.7 43.6 46.8
Block 0.7 3.3 6.1 40.1 49.7
Internship 0.8 4.2 6.3 37.1 51.6
There are no significant differences across the three practicum components in terms of the agreement with the
statement that practicum was relevant to their current teaching context. Between 89 to 93 per cent of
respondents agreed or strongly agreed in all three rounds, regardless of the practicum component in which they
took part. Interestingly the total percentage of disagreement, whilst small across all three rounds, tended to
decrease more over time than did the level of agreement. So the slight decrease in agreement levels over time did
not correspond with an increase in disagreement levels, but rather an increase in those who neither agreed nor
disagreed.

Longitudinal Teacher Education and Workforce Study (LTEWS) Final Report
187
As noted in Section 4.4.1, for most graduates, a block of time – five days a week over one or more weeks – was a
more common form of practicum than an internship or practicum of 1 to 2 days a week over a period of time.
Table 100 below shows the type of practicum undertaken by the respondents by their program type.
Table 100. Graduate teachers’ practicum components, by program type
Masters Bachelor
Grad/postgrad
Diploma
N % n % n %
Round 1
1-2 days a week 63 37.5 177 28.3 94 17.2
Block 157 93.5 578 92.3 509 93.1
Internship 33 19.6 240 38.3 87 15.9
Round 2
1-2 days a week 121 33.7 255 20.1 135 14.2
Block 257 71.6 897 70.8 713 75.1
Internship 61 17.0 396 31.3 115 12.1
Round 3
1-2 days a week 114 43.5 285 33.4 147 20.9
Block 205 78.2 726 85.0 607 86.3
Internship 79 30.2 399 46.7 175 24.9
Note: Round 1: Masters n=168, Bachelor n= 626, Grad dip n=547; Round 2: Masters n=359, Bachelor n= 1,267, Grad dip
n=949; Round 3: Masters n=299, Bachelor n= 944, Grad dip n=767
In all three rounds, responses show the majority of those in all three program levels undertook a block practicum.
Masters graduates have the highest percentage of practicum experience involving 1 to 2 days per week (from 33.7
to 43.5 per cent of them have completed practicum in this form), and bachelor’s graduates have the highest
percentage of those who complete an internship (from 31.1 per cent in Round 2 to 46.7 per cent in Round 3).
Some states have extended practicums that are referred to as internships, so the figure for internships is not
completely reliable.
Internships have been introduced into many teacher education programs to facilitate pre-service teachers’
transition into beginning teaching. Internships are often a block of 6 to 10 weeks in schools and the intern usually
takes full responsibility for planning, developing, teaching, assessing and reporting for a class or classes over a
sustained period of time, sometimes a whole term. During this period, the intern is immersed in the school as a
beginning teacher, including the classroom and across-school experiences expected of a beginning teacher. Unlike
a pre-service teacher completing a supervised practicum, an intern does not require direct supervision in the
classroom at all times, although ‘general’ supervision is usually provided by the supervising teacher as a mentor.
Internships are usually covered by signed formal agreements with relevant parties. But, the term ‘internship’ can
mean different things in different states and territories and even across teacher education programs within a state
or territory. However, it is generally recognised that an internship is a ‘near independent teaching’ experience
towards the end of a teacher education program after the pre-service teacher has successfully completed the

Longitudinal Teacher Education and Workforce Study (LTEWS) Final Report
188
majority of the program coursework as well as the required number of supervised practicum days (e.g. Victorian
Institute of Teaching10
).
In the ‘Mapping of Initial Teacher Education Programs in Australia in 2011’ report, over 43 per cent of the teacher
education programs included internships as part of their professional experiences (See Appendix 1). Some some
providers refer to an extended period in schools as an internship. For example, at The University of New South
Wales (UNSW) College of Fine Arts, all pre-service teachers of the Bachelor of Design/Bachelor of Art Education
program undertake 12 weeks of Professional Experience Internships in New South Wales high schools. During the
Professional Experience Internship, pre-service students teach full-time and participate in the administrative and
professional obligations of the school such as staff meetings and community consultations, as well as sports and
other co-curricular activities. However, the internship at the UNSW College of Fine Arts is supervised by co-
operating teachers and student teachers’ progress is jointly assessed by the co-operating teachers and faculty of
the School of Art Education.
Overall, graduate teachers’ and principals’ responses highlighted the value of longer practicums, in particular,
extended placements in schools such as internships to provide a transition into teaching employment. Some
principals also highlighted internships in helping them ascertain a graduating teacher’s suitability for employment.
Some principals’ free text responses on their suggestions for changes to teacher education are as follows:
‘Extended internships – short placements do not allow adequate exposure to the ongoing nature of
teaching.’
‘Gaining experience teaching in a variety of contexts, experiencing the whole process from planning-
teaching-assessing-reporting. Internships are very valuable for the beginning teacher to understand fully
what is expected of them when they begin their career.’
‘Internship for 10 weeks is fabulous.’
‘In school placements with quality teachers Internships for extended periods.’
‘Internships and Applied Curriculum Project immerse students in the life of the school.’
‘Practicums and internships are vital for the students to practice the skills they need to develop in the
classroom. The theory of teaching and subject-specific information is important but refining the
Mechanics of Teaching is paramount for them being successful.’
‘School based supervised practicum and internships in multiple phases integrated with tertiary
coursework.’
‘Extended internships – short placements do not allow adequate exposure to the ongoing nature of
teaching.’
Internships were seen as beneficial when structured as a final part of the program in combination with a range of
practicum (1 to 2 days per week and block placements of 5 weeks duration) throughout the course. The survey
results show that internships are generally more prevalent in the undergraduate degrees, with over 31 to 47 per
cent of bachelor’s graduates completing an internship as compared to graduate teachers from other programs.
This finding is further verified in the mapping data. The length and duration of the bachelor program allows for
greater flexibility and time required for such sustained and extended practicum.
10
http://www.vit.vic.edu.au/finditfast/Teacher-education-programs/Pages/Interns.aspx
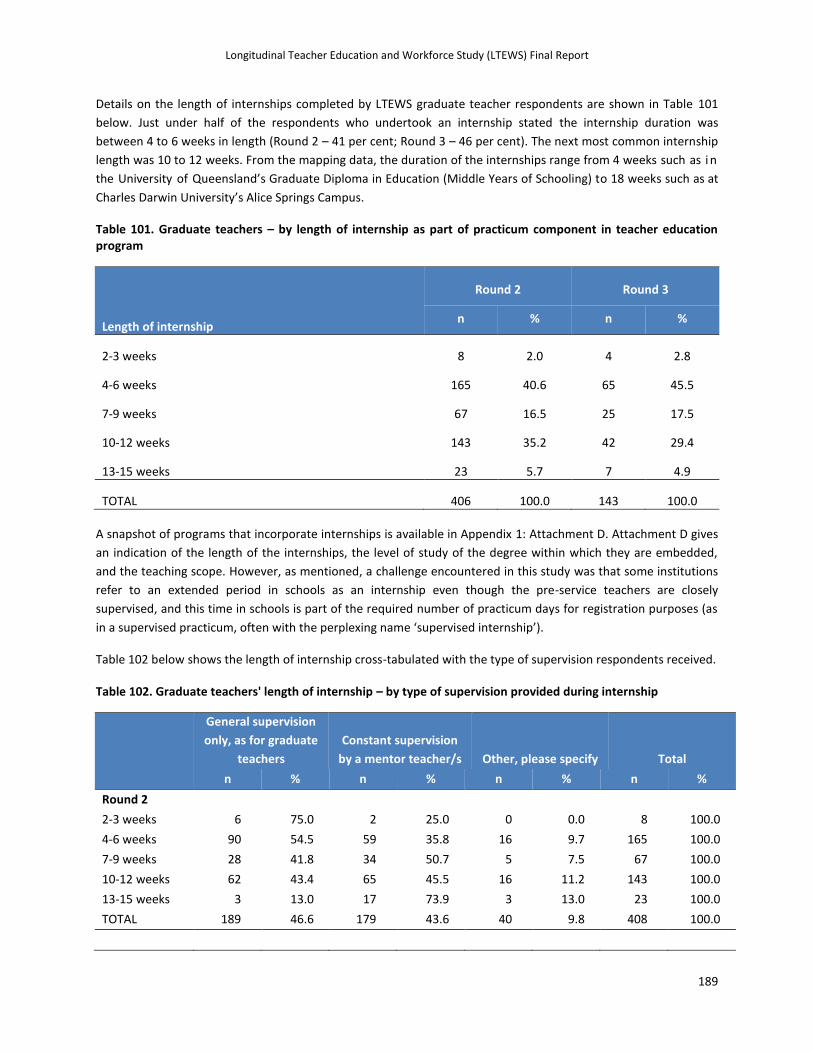
Longitudinal Teacher Education and Workforce Study (LTEWS) Final Report
189
Details on the length of internships completed by LTEWS graduate teacher respondents are shown in Table 101
below. Just under half of the respondents who undertook an internship stated the internship duration was
between 4 to 6 weeks in length (Round 2 – 41 per cent; Round 3 – 46 per cent). The next most common internship
length was 10 to 12 weeks. From the mapping data, the duration of the internships range from 4 weeks such as i n
the University of Queensland’s Graduate Diploma in Education (Middle Years of Schooling) to 18 weeks such as at
Charles Darwin University’s Alice Springs Campus.
Table 101. Graduate teachers – by length of internship as part of practicum component in teacher education program
Length of internship
Round 2 Round 3
n % n %
2-3 weeks 8 2.0 4 2.8
4-6 weeks 165 40.6 65 45.5
7-9 weeks 67 16.5 25 17.5
10-12 weeks 143 35.2 42 29.4
13-15 weeks 23 5.7 7 4.9
TOTAL 406 100.0 143 100.0
A snapshot of programs that incorporate internships is available in Appendix 1: Attachment D. Attachment D gives
an indication of the length of the internships, the level of study of the degree within which they are embedded,
and the teaching scope. However, as mentioned, a challenge encountered in this study was that some institutions
refer to an extended period in schools as an internship even though the pre-service teachers are closely
supervised, and this time in schools is part of the required number of practicum days for registration purposes (as
in a supervised practicum, often with the perplexing name ‘supervised internship’).
Table 102 below shows the length of internship cross-tabulated with the type of supervision respondents received.
Table 102. Graduate teachers' length of internship – by type of supervision provided during internship
General supervision
only, as for graduate
teachers
Constant supervision
by a mentor teacher/s Other, please specify Total
n % n % n % n %
Round 2
2-3 weeks 6 75.0 2 25.0 0 0.0 8 100.0
4-6 weeks 90 54.5 59 35.8 16 9.7 165 100.0
7-9 weeks 28 41.8 34 50.7 5 7.5 67 100.0
10-12 weeks 62 43.4 65 45.5 16 11.2 143 100.0
13-15 weeks 3 13.0 17 73.9 3 13.0 23 100.0
TOTAL 189 46.6 179 43.6 40 9.8 408 100.0

Longitudinal Teacher Education and Workforce Study (LTEWS) Final Report
190
Round 3
2-3 weeks 3 75.0 1 25.0 0 0.0 4 100.0
4-6 weeks 36 55.4 20 30.8 9 13.8 65 100.0
7-9 weeks 14 56.0 8 32.0 3 12.0 25 100.0
10-12 weeks 10 23.8 28 66.7 4 9.5 42 100.0
13-15 weeks 0 0.0 6 85.7 1 14.3. 7 100.0
TOTAL 63 44.1 63 44.1 17 11.9 143 100.0
In terms of supervision during internship, the survey data responses on the type of supervision provided during
internships illustrates that 46 per cent of respondents received general supervision only, while 44 per cent of them
had constant supervision by a mentor teacher/s. Data from both rounds show graduate teachers who indicated a
shorter internship tended to have more general supervision than respondents with a longer internship.

Longitudinal Teacher Education and Workforce Study (LTEWS) Final Report
191
4.5.3 The ways in which the practicum appears to influence or support graduates’ career retention or advancement
As noted, the nature of the practicum incorporated into teacher education programs was a construct that
consisted of three components:
1-2 days a week over an extended period of time
Five days a week over one or more weeks (Block)
Internship
These practicum components were cross-tabulated with variables on retention and advancement in the
longitudinal datasets – looking at Cohorts 2 and 3, which track changes over the six-month period from October
2012 to March 2013, and the 12-month period from March 2012 to March 2013.
No relationship was found between the practicum components and respondents' retention or advancement. The
number of respondents in each cell in these calculations was too few, causing such an increase in the size of the
standard error that results are not reliable. The table below shows that the results of this cross-tabulated data
demonstrates the small number of responses per cell, and that there was no relationship between practicum
components and retention or advancement. The responses to the practicum components were recorded as 'Yes'
(participated in this practicum component) and 'No' (did not participate in this practicum component).
The table shows the number of responses and the percentage for graduates who did and did not participate in the
three practicum components, cross-tabulated firstly with retention and attrition (i.e. leaving teaching) and then
cross-tabulated with whether or not graduates held a leadership position in a school. The responses in the data
below are those graduates who participated in the two Graduate Teacher Surveys over the 12 months from March
2012 to March 2013 (Cohort 3).
Table 103. Graduates' participation in practicum components types – by retention and attrition, and by leadership position as a teacher in a school
1-2 days a week Block Internship
Yes No Yes No Yes No
n % n % n % n % n % n %
Cohort 3
Retained 91 92.9 267 90.8 335 91.3 23 92.0 110 92.4 248 90.8
Attrition 7 7.1 27 9.2 32 8.7 2 8.0 9 7.6 25 9.2
Total 98 100.0 294 100.0 367 100.0 25 100.0 119 100.0 273 100.0
Leadership 18 15.1 41 12.1 55 13.1 4 13.1 14 11.6 45 13.4
No
leadership 101 84.9 297 87.9 365 86.9 33 86.9 107 88.4 291 86.6
Total 119 100.0 338 100.0 420 100.0 37 100.0 121 100.0 336 100.0
Attrition numbers were small across cross-tabulations with all practicum components. There was also no
relationship between whether or not respondents participated in a practicum component and whether or not they
were retained in teaching. For example, 91.3 per cent of those who participated in a block practicum were
retained as a teacher and 92.0 per cent of those who did not participate in a block practicum were retained.

Longitudinal Teacher Education and Workforce Study (LTEWS) Final Report
192
The results of these cross-tabulations were not analysed by the three separate school variables because the
resulting number of respondents in each cell for each school variable analysis was too small to ensure reliable
results.
4.5.4 The extent to which the practicum is adequate for subsequent classroom teaching
Teacher regulatory authorities in each state and territory require a minimum number of supervised practicum days
in order for teacher education programs to be accredited. The legislated minimum number of supervised
practicum days by state and territory is provided in Table 104 (as available on teacher regulatory authority
websites early 2012, during the time of the teacher education mapping component of this study).
Table 104. Teacher regulatory authority requirements for minimum days for supervised practicum by state/ territory (early 2012)
The minimum practicum requirement ranges from 80 days for a four-year undergraduate program to 45 to 55 for a
1-year graduate program and from 45 to 70 for an 18-month to 2-year graduate program. Although all teacher
education programs have to meet the minimum requirement in the relevant state or territory in order to be
accredited, the mapping component of this study (See Appendix 1) showed that many providers exceeded the
required minimum number of practicum days. This was often informed and guided by the providers’ philosophical
goals and program outcomes. As noted above, when the teacher education mapping data was being collected for
this study, the minimum number of supervised practicum days varied within and between states and territories.
However, since then the Australian Institute for Teaching and School Leadership has provided national
requirements:
The professional experience component of each program must include no fewer than 80 days of
well-structured, supervised and assessed teaching practice in schools in undergraduate and
State/Territory 4-year undergraduate
programs
1-year graduate programs
2-year graduate programs
Australian Capital Territory
80 45 60
New South Wales 80 45 (50 for 18 month
programs)
60
Northern Territory
90 55 Not specified
Queensland
80 55 Not specified
South Australia
80 45 45
Tasmania
80 n/a 70
Victoria
80 45 60
Western Australia
80 45 60

Longitudinal Teacher Education and Workforce Study (LTEWS) Final Report
193
double-degree teacher education programs and no fewer than 60 days in graduate entry
programs. (Australian Institute of Teaching and School Leadership, 2011a, p.15)
While these recent requirements might mean more practicum for some providers, and although many graduate
teachers in this study expressed the need for more in-school experiences, what is more significant are the ways in
which they described how the practicum could be better structured and delivered to provide optimal professional
experiences that, in turn, support effective preparation for teaching. The quality and relevance of such experience
is crucial in addressing the realities of today’s increasingly complex and ever-changing school contexts (Le Cornu,
2010; Le Cornu & Ewing, 2008).
A different commitment is required to move from the notion of ‘personally owned professional knowledge’ (Le
Cornu & Ewing, 2008, p.1803), to a more shared learning process where pre-service teachers, supervisors, peers
and educators from schools engage in a reciprocal learning process to co-construct knowledge about teaching
(Edwards & Mutton, 2007; Le Cornu & Ewing, 2008). This involves a shift from thinking about practicum as a linear
relationship between supervisor and pre-service teacher to the notion of an integrated and participatory process
of teaching and learning.
The Figure below shows graduates’ views on the importance of their practicum for gaining skills. This question was
asked of graduates with a teaching position in a school. It was measured on a five-point Likert scale of agreement
from strongly disagree to strongly agree. In all three rounds, graduates almost all strongly agreed or agreed that
the skills they gained during practicum were important:
Round 1: 98 per cent
Round 2: 97 per cent
Round 3: 96 per cent
The percentage of teaching graduates who strongly disagreed or disagreed that the skills gained in practicum were
important was approximately one per cent across all three rounds of surveys.

Longitudinal Teacher Education and Workforce Study (LTEWS) Final Report
194
Figure 31. Graduate teachers with a teaching position – by their view of the importance of skills gained during practicum
Note: 1. Round 1 n=932; Round 2 n=2,094; Round 3 n=1,713.
The Graduate Teacher Survey also asked graduate teachers currently teaching about the relevance of their
practicum experience to their current teaching context. The results are shown in Figure below. The majority of
graduate teachers either strongly agreed or agreed that their practicum prepared them for their current teaching
context:
Round 1: 92 per cent
Round 2: 91 per cent
Round 3: 89 per cent
The percentage of teaching graduates who strongly disagreed or disagreed that the skills gained in practicum
helped prepare them for their current teaching context was approximately one per cent across all three rounds of
surveys.
0.5 0.5 1.2
23.9
73.8
0.4 0.8 1.8
30.4
66.6
0.2 1.0 3.2
30.6
65.0
0
10
20
30
40
50
60
70
80
StronglyDisagree
Disagree Neither Agreenor Disagree
Agree Strongly Agree
Pe
rce
nt
Skills gained during practicum were important
Round 1
Round 2
Round 3

Longitudinal Teacher Education and Workforce Study (LTEWS) Final Report
195
Figure 32. Graduate teachers with a teaching position – by their view of the relevance of practicum to current teaching context
Note: Round 1 n=932; Round 2 n=2,092; Round 3 n=1,721
These findings were echoed in the interviews, where graduate teachers talked about the teaching practicum as the
most enriching part of their teacher education program (‘It was the most valuable learning in the course’). They
described the value of the teaching practicum as ‘intangible’ and a valuable time to experience the realities of
classrooms (‘You get to experience real teachers out in schools rather than just the 'ideal' situation that is
represented in tutorials).
Round 2 of the Graduate Teacher Survey asked graduates currently teaching about the relevance of their
university-based study to their current teaching. See Table 105 below. Sixty-five per cent of graduates either
strongly agreed or agreed that their university-based units were relevant for their current teaching contexts. Only
about 14 per cent of the graduate teachers strongly agreed that their university-based units of their teacher
education program were relevant to their current teaching context. This has a much lower agreement level than
the ‘strongly agree’ relevance of the practicum to current teaching contexts as noted above. The data shows that
graduate teachers feel university-based units, though relevant, were less helpful in preparing them for their
current teaching contexts, than their practicum experiences.
1.2 3.5 3.0
28.9
63.4
1.0 2.6
5.4
37.0
54.0
0.9 4.0
6.6
39.2
49.3
0
10
20
30
40
50
60
70
StronglyDisagree
Disagree Neither Agreenor Disagree
Agree StronglyAgree
Pe
rce
nt
Practicum prepared me for current teaching context
Round 1
Round 2
Round 3

Longitudinal Teacher Education and Workforce Study (LTEWS) Final Report
196
Table 105. Graduate teachers with a teaching position – by their view of relevance of university-based units to current teaching, Round 2 survey
The university-based units of my teacher education program help
prepared me for my current teaching context N %
Strongly Disagree 61 2.9
Disagree 246 11.7
Neither Agree nor Disagree 418 20.0
Agree 1,074 51.3
Strongly Agree 296 14.1
TOTAL 2,095 100.0
In order to gauge 'adequate' classroom teaching, graduates were asked if they had been successful in influencing
student learning in their current teaching position. The response was measured on a five-point Likert scale from
strongly disagree to strongly agree. This was then cross-tabulated with the three different practicum components
to see if the graduates' experiences of these practicum components had any effect on their perceptions of success
in the classroom. The results are shown in the table below.
Table 106. Graduate teachers with a teaching position – by practicum component and perception of success in influencing student learning
In my current teaching position I have been successful in influencing student learning
Round 1 Round 2 Round 3 % % %
Practicum component: 1-2 days a week over an extended period
Strongly disagree 0.8 0.2 0.2
Disagree 1.6 0.5 0.5
Neither agree nor disagree 15.9 10.1 5.2
Agree 51.8 63.8 59.8
Strongly agree 29.8 25.4 34.3 Practicum component: 5 days a week over 1 or more weeks (Block)
Strongly disagree 0.2 0.1 0.1
Disagree 1.0 0.6 0.7
Neither agree nor disagree 17.5 11.6 5.9
Agree 50.6 63.9 58.8
Strongly agree 30.7 23.9 34.6
Practicum component: Internship
Strongly disagree 0.0 0.0 0.2
Disagree 1.1 0.5 0.6
Neither agree nor disagree 16.1 9.6 6.7

Longitudinal Teacher Education and Workforce Study (LTEWS) Final Report
197
Agree 48.7 67.9 56.2
Strongly agree 34.1 22.0 36.4
Note: 1-2 days a week: Round 1 n=245; Round 2 n=406; Round 3 n=440. Block: Round 1 n=871; Round 2
n=1,444; Round 3 n=1,227. Internship: Round 1 n=273; Round 2 n=427; Round 3 n=525
Each of the practicum components showed similar findings for graduates' perceptions of success in influencing
student learning. So regardless of the practicum component type, the majority of graduates strongly agreed or
agreed they had been successful in influencing student learning. Across all three survey rounds, in all three
practicum components, the percentage who strongly disagreed or disagreed was at or below one per cent, except
for one instance in Round 2 where it was two per cent. The only change across the three surveys rounds was the
'neutral' influence group, which decreased in size across the three surveys for all three practicum components.
Interviews and free text responses – graduate teachers and principals
The interviews with and free text responses from graduate teachers and principals provided a deeper
understanding of the extent to which practicum was relevant for subsequent classroom teaching. The following
aspects were raised:
Coherent framework for practicum processes
Diversity of practicum settings in schools and communities
Leveraging School Partnerships and Professional Communities
Coherent framework for practicum processes
Interview responses stressed the need for effective practicum processes that enable the application of skills into
practice. Graduate teachers and principals’ responses suggest a coherent framework for practicum programs,
structured with a combination of 1 to 2 days per week, block placements of 5 weeks duration, culminating in an
internship at the final part of the program.
This framework for practicum teaching and learning works more effectively with school-university partnerships
that can provide ‘shared communities of learners’ in the practicum experience:
‘More practical time – not necessarily in whole day blocks however. Going in to a class in small groups and
then reflecting on lessons would definitely be beneficial.’
‘More frequent placements with the "2 days a week" model and then "blocks". More help from lecturers
during this time with more visitation.’
‘Longer placement e.g. throughout the whole year of my post-graduate … would have been happy to work
in classroom for 1 to 2 days per week and then do some blocks. Think this learning for me would have
been more beneficial.’
‘Working closely with qualified mentor’ as well as observing and engaging with exemplary teachers who
can provide ‘constructive feedback and valuable knowledge.’
Graduate teachers described significant practicum delivery enhancement that would better support their
preparation for their current school contexts. Many felt that they would benefit from more practicum time (e.g. ‘I
honestly believe that more time needs to be spent in the classroom … more in class experience would allow for
better prepared and experienced teachers’). However, important issues relate to the quality of the practicum

Longitudinal Teacher Education and Workforce Study (LTEWS) Final Report
198
experience, more than the length of time in schools. Some universities provide pre-service teachers with the
opportunities to micro teach in class before actual school placements and receive feedback from peers and
university mentors on their teaching (Kazemi, Franke, & Lampert, 2009), while others do not. Other programs
adopt a strong focus on an ‘inquiry-oriented approach’ (Zeichner, 1983) where pre-service teachers, on return to the
universities, discuss and address classroom issues and challenges they faced or observed during school placements.
Other graduate teachers mentioned administrative difficulties relating to school placements (e.g. ‘I had to organise
my own and as most schools in my area were affiliated with another universities’). Some experienced difficulties in
securing quality school placements with experienced mentors in the same subject disciplines as theirs. Pre-service
teachers benefit from quality mentoring support in schools (See Box 14 below). This serves as a bridge between
the theoretical knowledge about teaching (Philosophy of Education, Psychology, Sociology of Education) and
practical knowledge of teaching (curriculum design and implementation, classroom management, teaching
methods, assessment and evaluation) (Le Cornu & Ewing, 2008; White et al., 2010).
Diversity of practicum settings in schools and communities
Teaching is a complex and multifaceted activity. In interviews, graduate teachers highlighted the value of
completing a variety of teaching experiences in diverse settings (e.g. ‘More time spent in a diverse range of
classrooms’, ‘better opportunities for diverse placements’).
The central tenet of this issue lies in the need to prepare graduate teachers to learn in a range of settings that
typify those in which teachers work. While the graduate teachers have an astute perception about what their
teacher preparation can provide, their responses indicate the need for practical application of skills and knowledge
in a range of settings, schools and communities, where they can draw on frames of reference or a developing
repertoire of ideas to handle a range of issues. This is often perceived to be more effective in undergraduate
degrees where the length and duration of t h e program allows for more flexibility and time for extending
learning.
I think the planning for lots of learners, a fair diversity across the - you know the breadth of the classroom. I think I quite believe in schools as a social community so that really came with me - that sociological side of it and a lot of the understanding that came on board there during my studies.
Graduate teacher, part-time permanent, primary school
The challenges of coping with ‘diversity in the classroom’ are well documented. Similarly, the principals
highlighted graduate teachers’ lack of preparedness in diverse settings (‘understanding of low SES communities’,
‘nature of rural students and catering to a broad range of learning needs within each class’ and ‘understanding of
the curriculum model’). One principal spoke about the ‘culture shock’ that graduate teachers have when teaching
in remote schools (‘not acknowledging the context and living away from family in remote locations’). Others spoke
of the lack of preparation in applying ‘differentiation’ and translating ‘various philosophies of teaching and
pedagogical approaches into practical teaching strategies’ that in turn have a bearing on student engagement and
classroom behaviour.

Longitudinal Teacher Education and Workforce Study (LTEWS) Final Report
199
Box 14. An effective teacher needs to build rapport
A Chinese Australian, Holly is teaching at a primary school in Sydney that caters for an ethnically diverse community, including children from China, Hong Kong, Taiwan, Thailand and Korea. She has been working as the ESL teacher at the school, looking after small groups of children in a support role that requires continual communication with their classroom teacher. She has been doing this for twelve months, while the ESL teacher has been on leave, and she has now secured another twelve-month position at the same school as a Kindergarten teacher, with a class of around 20 children. She came to the school with an appreciation of cultural diversity, but this has grown during the time that she has been teaching:
Yes, so I think cultural diversity is … a difficult thing but maybe something that you can … get as you grow and teach for a long period of time.
Holly has been able to engage in rich professional learning, focusing on the teaching of grammar (or explicit language instruction with children from backgrounds other than English). In doing this, she has been building on a ‘passion’ that she first discovered when she was at university. There one of her lecturers provided an inspiring model for her as a committed language teacher. She has since maintained contact with this person, who visits her school regularly. Holly also draws inspiration from another university lecturer with respect to the role of drama in facilitating language and literacy development. Holly would like to think that in the future she will become known as someone who is very knowledgeable about language and grammar. This specialisation is at the heart of her sense of professional identity.
She has engaged in sustained professional learning during the time that she has been at the school, both through work with her peers – she cites her collaboration with a more experienced colleague in developing a unit of work designed to enrich students’ language and literacy – and from her interactions with the children, where she has been very sensitive to issues of cultural difference. She also observes her colleagues teaching in their classrooms, partly because of her position as an ESL teacher in a support role, and she has learnt a lot from this, especially about the importance of establishing rapport with students and creating a classroom environment that supports their learning:
I do believe that a really good teacher, like an effective teacher needs to build rapport with their students first. To really get to know each of them and to develop a relationship with them and make them feel comfortable.
She continually emphasises the quality of the support that she has received from colleagues at her school. She feels that she has played a role in the learning her students have experienced this year, though she is diffident about this, acknowledging the part that others have played. As ESL teacher, Holly is conscious of the need to tread gently when offering advice to other teachers about how best to support their students who come from backgrounds other than English. She has developed a refined sense of the complexities of negotiating interpersonal relationships within institutional settings.
Holly has a sense of what she will need to learn in the coming year in her efforts to take charge of a whole class of kindergarten students. She clearly sees her ongoing professional learning as integral to her growth as a teacher and her capacity to contribute to her school community.
Graduate teacher, full-time contract, primary school

Longitudinal Teacher Education and Workforce Study (LTEWS) Final Report
200
Graduate teachers and principals’ responses infer that classroom management is not something that can be taught
and studied but needs to be put into action (‘it’s easy to talk about classroom management at university but when
you’re doing it, it’s not about thinking about it. It’s about implementing it and finding out really quickly what is …
what does work and what doesn’t’). Effective approaches to this include structuring experiences in these settings
with strong mentoring and supervision support.
Many wanted a range of quality practicum experiences in different types of school settings (e.g. ‘more
consideration or choice on what type of school chosen for practicum’). Many would have liked more support and
contact from their university supervisors (e.g. ‘More contact with university lecturers/mentors on school rounds
for advice and support’). They highlighted the importance of having strong mentoring support from both the
university and their colleagues in schools. Some talked about the financial impost whilst on teaching practicum,
especially in a final, often lengthier, practicum (e.g. ‘Some form of wage for teachers in final practical. 12 weeks
without pay is tough and a real deterrent to some people’).
Leveraging School Partnerships and Professional Communities
School partnerships are favoured by many graduate teachers as a way of developing sustained and on-going
professional learning, in real-world settings, to improve teacher effectiveness. One of the challenges in teacher
education is the nature of the links between both university and school experiences.
Studies on effective practicum programs highlight the strong university-school partnerships that help pre-service
teachers work reflexively to shape and improve their practical teaching skills (e.g. Darling-Hammond & Bransford,
2005; Elmore, 2002; Ramsey, 2000). The Effective and Sustainable University–School Partnerships Report (Kruger,
Davies, Eckersley, Newell, & Cherednichenko, 2009) concluded that effective partnerships between schools and
universities are achieved by ‘working together’ based on three conditions:
A focus on Trust between the pre-service teachers, peers, and educators bringing together expertise, and
to be committed in partnership with a shared recognition of each other’s roles and expectations.
Working in Mutuality with one another collaboratively towards a shared goal that benefits each
stakeholder – the pre-service teachers in developing teaching expertise, and the value added to schools,
universities and communities from this process of partnership.
Developing relationships based on Reciprocity where each stakeholder recognises and values the experiences, knowledge and expertise that others bring to this process.
Many graduate teachers highlighted the need for more collaboration and contact between universities and
schools.
‘The university needs to establish better partnerships with local and rural schools’
‘Stronger partnerships with schools, so that teacher training was also part of the ongoing life of a
school, part of every day, not just part of a disconnected university’
‘Partnerships should be established between the universities and the local schools to enable more
regular observation and other opportunities to participate in broad range of school life.’
‘Ongoing practical experience throughout the course, by way of school partnerships/ or mentoring.’

Longitudinal Teacher Education and Workforce Study (LTEWS) Final Report
201
‘More help making partnerships with schools so student teachers can be involved more often with
schools and not just in a single block.’
‘There needs to be a stronger relationship between the university and schools. Time in classrooms must
be increased, experiencing different learning areas, age groups, cultural groups and schools.’
From the mapping data, ‘community partnerships’ and ‘school-university partnerships’ were nominated by many
teacher education providers as key distinguishing features of their programs. The majority of teacher education
providers have developed partnerships models with schools or school clusters to increase school contact and to
improve the quality and effectiveness of professional experience. However, costs and the difficulties in finding
partner schools to work with are issues raised by many teacher education providers.
Interviews with the providers’ representatives revealed further insights into some of these school partnership
initiatives. Some use a cluster-school approach, placing students in schools located within a confined geographic
area. Others focus on providing opportunities for pre-service teachers to experience the work of teachers in a
range of diverse settings. This also includes practical experience in remote Australian Aboriginal and/or Torres
Strait Islander schools and communities, as well as in international contexts. Other institutions integrate action
research and learning partnerships with community agencies to prepare pre-service teachers for the wider
community issues. These innovative approaches strengthen theory and practice linkages, drawing the nexus
between theory, knowledge and practice. See Appendix 1: Section 4.4 for more case examples of school-
university partnerships from the mapping of initial teacher education programs.
Current research demonstrates that a central factor in the ability of graduate teachers to develop professional
learning and growth in their early years of their career is that their practicum programs manifest features of
professional learning communities (Cochran-Smith, 2003). Learning partnerships in professional conversations
are the focus of learning communities. The research reports that professional conversations in successful
partnerships are coherently planned, organised and supported in teaching practicum programs (Darling-
Hammond, 2006b; Le Cornu, 2010; McLaughlin & Black-Hawkins, 2007).
Overall, the survey and interview data show that graduate teachers value the practicum as an important part of
their teacher education experience and feel that it is relevant for their current teaching context. More than 96 per
cent of graduate teachers agree with the importance of their practicum for gaining skills for the classroom and the
practicum experiences were seen as more helpful in preparing them for their current teaching contexts as
compared to university-based units of their teacher education programs. Clearly, the practicum is a highly valued
part of the teacher education experience. The interviews and free text responses revealed deeper understanding
about the quality of the practicum experiences and the extent to which these processes can be further improved
to enhance graduates skills and knowledge for teaching.
As expressed by the graduate teachers, the quality of practicum experiences matters, and suggestions for
enhancement include building a coherent framework for practicum structures that provide a combination of 1 to 2
days per week, block placements of 5 weeks duration and an internship at the final part of the program, sustained
classroom experience in schools, and mentoring support. Graduate teachers responses also suggest the benefit of
preparing teachers to teach and learn in a diverse range of settings, fostering these opportunities through strong
school-university partnerships in ways that develop shared communities of learners in building sustained
professional learning. Effective practicum programs provide pre-service teachers with extensive time throughout
the program to ‘learn to practice in practice’ (Darling-Hammond, 2010). In this way, pre-service teachers are

Longitudinal Teacher Education and Workforce Study (LTEWS) Final Report
202
viewed as active learners of their practice, engaging in reflective conversations towards their teaching in the social
contexts they teach.

Longitudinal Teacher Education and Workforce Study (LTEWS) Final Report
203
4.6 Discipline Areas Studied and then Taught in Schools
Section 3.2 discussed the utilisation of graduate teachers across teaching areas. This section examines their
qualifications to teach in a specialist area and the extent to which teachers actually teach the subjects they
studied, longitudinally across all three survey rounds. It specifically focuses on secondary graduate teachers with a
teaching position, and who are teaching in their specialist discipline areas.
Darling-Hammond and Bransford (2005) highlighted the balance of discipline-based knowledge and pedagogy in
effecting successful teaching and learning in the classroom. The literature reminds us that a strong discipline-based
knowledge preparation is important but not sufficient for teaching. Effective teacher education programs usually
try to integrate curriculum studies, discipline-based knowledge and pedagogy in a dynamic relationship that
promotes practical inquiry and reflection (Darling-Hammond, 2006b; Department of Education (DfE), 2010;
Menter, Hulme, Elliot, & Lewin, 2010).
Box 15 lists the main findings for Section 4.6.
Box 15. Main Findings: Disciplines studied and then taught in schools
There was an increase in secondary graduate teachers teaching in their specialist area for most specialisations from their first year after graduation to their second year of teaching, except for science, technology, health and physical education and special needs. The largest increase was in society and the environment, from 13 to 16 per cent. This corroborates with earlier findings on all graduate teachers teaching in specialist area in Section 3.2.1.
In all rounds, there was no significant difference between program types in the mean scores for preparation or effectiveness in discipline-based expertise.
There was no significant difference between males and females in their effectiveness in teaching in the area of specialist expertise although females were significantly more likely to agree they were prepared in their discipline-based expertise than males in the Round 2 survey.
In each of the three Graduate Teacher Surveys, only those graduates who were currently teaching were asked if
they had qualifications to teach in a specialist area. To recall, the number and percentage of respondents who
were employed as a teacher in a school at the time of each survey is as follows:
Round 1: 980 respondents employed as a teacher – 74 per cent of all respondents
Round 2: 2,217 respondents employed as a teacher – 85 per cent of all respondents
Round 3: 1,830 respondents employed as a teacher – 84 per cent of all respondents
Table 107 below shows the number and percentage of respondents in each of the three surveys who indicated
they were employed as a teacher and their main area of teaching.

Longitudinal Teacher Education and Workforce Study (LTEWS) Final Report
204
Table 107. Graduate teachers with a teaching position – by main area of teaching
Round 1 Round 2 Round 3 N % n % n %
Early Childhood 38 3.9 85 3.8 62 3.4 EC/Primary 62 6.3 124 5.6 109 6.0 Primary 356 36.3 804 36.3 637 34.8 Prim/Secondary 80 8.2 209 9.4 157 8.6 Secondary 423 43.2 894 40.3 719 39.3 Other 10 1.0 - 0.0 13 0.7 Not stated 11 1.1 101 4.6 133 7.3
Total Secondary 503 51.4 1,103 49.7 876 47.9
TOTAL 980 100.0 2,217 100.0 1,830 100.0
The group of respondents of particular interest, when looking at specialist area qualifications, are secondary
teachers: 51.4 per cent of all respondents in Round 1, 49.7 per cent in Round 2 and 47.9 per cent in Round 3. The
data in following three sub-sections will report on these respondents only.
4.6.1 The relationship between the discipline area studied and the extent to which graduates enter, and remain in, teaching.
The following data report on respondents whose main area of teaching is secondary and who have employment as
a teacher in a school. The table below shows the dataset by the discipline areas in which they have qualifications
to teach.
Table 108. Graduate teachers currently teaching whose main area of teaching includes secondary – by discipline area in which they have qualifications to teach
Round 1 Round 2 Round 3
n % n % n %
English 122 24.3 193 17.5 189 21.6
Mathematics 49 9.7 92 8.3 128 14.6
Society and the
Environment 187 37.2 262 23.8 241 27.5
Science 154 30.6 257 23.3 180 20.5
The Arts 108 21.5 179 16.2 157 17.9
LOTE 33 6.6 60 5.4 69 7.9
Technology 65 12.9 107 9.7 96 11.0
Health & PE 85 16.9 151 13.7 106 12.1
Special needs 4 0.8 14 1.3 19 2.2
Other 11 2.2 22 2.0 4 0.5
Not stated 65 12.9 395 35.8 - 0.0
TOTAL 503 1,103 876
Note: Numbers do not add to the total, percentages do not total 100, as respondents were able to select two specialist
areas in Rounds 1 and 2, and up to 10 areas in Round 3. As Round 3 collected data on specialist areas in a different
format from Rounds 1 and 2, results should be treated with caution.
In Round 1, of the respondents who indicated they were secondary trained and had a teaching position, 37.2 per
cent of them had qualifications to teach in society and the environment. Science had the next largest percentage

Longitudinal Teacher Education and Workforce Study (LTEWS) Final Report
205
of these graduate respondents, with 30.6 per cent. The hard-to-staff area of mathematics had 9.7 per cent of
teaching secondary graduates with this qualification specialisation and LOTE had 6.6 per cent.
In Round 2 there was a large percentage of secondary trained teaching respondents who did not indicate their
area of specialisation (35.8 per cent). In Round 3, the largest percentage of these respondents had qualifications to
teach in society and the environment (27.5 per cent), followed by English (21.6 per cent). Mathematics had 14.6
per cent, LOTE 7.9 per cent and technology 11 per cent.
The following looks at the secondary trained graduate teacher respondents over time/ longitudinally. To recall, we
look at two groups of graduate teachers over time for analysis longitudinally:
Cohort 1: A group of 679 graduate teachers for whom we can follow their teacher employment status
from Round 1 to Round 2. Cohort 1 data show changes over the six-month period from March to October
2012.
Cohort 2: A group of 1,050 graduate teachers for whom we can follow from Round 2 to Round 3. These
graduate teachers are known as Cohort 2. Cohort 2 data show changes over the six-month period from
October 2012 to March, 2013.
Cohort 3: A group of 544 graduate teachers for whom we can follow their teacher employment status
from Round 1 to Round 3. Cohort 3 data show changes over the 12-month period from March 2012 to
March, 2013.
The table below shows that for secondary trained graduate respondents, employment as a teacher in a school rose
for Cohort 1 by 10.1 per cent for those with secondary training only and by 14.6 per cent for those with primary
and secondary training. Employment levels remained fairly similar for Cohort 2, which takes into account changes
from October 2012 to March 2013 – the end of their first year of teaching and the beginning of their second year.

Longitudinal Teacher Education and Workforce Study (LTEWS) Final Report
206
Table 109. Graduate teachers' main area of teacher education program – by employment as a teacher in a school, Cohorts 1 and 2
Cohort 1 Cohort 2 Round 1 Round 2 Change Round 2 Round 3 Change Program area % % % % % %
Teaching in a school Early Childhood 72.0 92.0 +20.0 93.8 93.8 0.0 EC/Primary 66.7 91.9 +25.2 76.4 85.5 +9.1 Primary 73.7 90.1 +16.4 87.8 86.5 -1.3 Primary/Secondary 65.7 80.3 +14.6 87.1 84.9 -2.2 Secondary 75.2 85.3 +10.1 83.3 81.2 -2.1 Other - - 100.0 100.0 0.0
TOTAL 73.2 87.2 +14.0 85.3 84.2 -1.1 Note: Cohort 1 n=679; Cohort 2 n=1,050
Table 110 below shows that for secondary trained graduate respondents, employment as a teacher in a school
rose by 5.9 per cent from the beginning of their first year to the beginning of their second year of teaching for
those with secondary training only, and by 8.1 per cent for those with primary and secondary training.
Table 110. Graduate teachers' main area of teacher education program – by employment as a teacher in a school, Cohorts 1 and 2
Cohort 3 Round 1 Round 3 Change Program area % % %
Teaching in a school Early Childhood 68.4 89.5 +21.1 EC/Primary 64.0 84.0 +20.0 Primary 73.6 86.9 +13.3 Primary/Secondary 73.5 81.6 +8.1 Secondary 71.1 77.0 +5.9 Other 50.0 100.0 +50.0
TOTAL 71.8 82.1 +10.0 Note: Cohort 3 n=544
Table 111 below shows secondary graduates who have a teaching position. It shows this group by their specialist
area qualifications, and the percentages who were teaching in their specialist area or teaching outside of their
specialist area.

Longitudinal Teacher Education and Workforce Study (LTEWS) Final Report
207
Table 111. Secondary graduate teachers currently teaching who participated in more than one LTEWS Graduate Teacher Survey – by whether or not teaching in their specialist areas
Cohort 1 Cohort 2 Cohort 3
Round 1 Round 2 Round 2 Round 3 Round 1 Round 3
% % % % % %
Teaching in specialist
area
English 14.3 11.6 10.1 14.5 14.4 14.8
Mathematics 7.9 7.5 4.6 10.0 5.3 11.2
Society and the
Environment 8.6 7.2 7.2 16.7 13.0 16.1
Science 14.6 12.5 9.7 14.5 14.4 13.2
The Arts 11.8 9.7 8.2 10.8 11.1 12.5
LOTE 4.3 3.4 3.2 4.9 2.9 3.3
Technology 6.1 5.0 4.4 6.5 6.7 6.2
Health & PE 5.7 5.6 4.8 6.2 5.8 5.3
Special needs 0.4 0.3 0.8 1.1 0.5 0.3
Other 1.4 1.6 1.3 0.2 1.4 0.0
Not stated 0.0 0.9 0.0 0.0 0.0 0.0
Teaching outside
specialist area
English 0.7 0.3 0.6 2.4 1.4 3.3
Mathematics 0.0 0.0 0.0 0.8 0.0 0.3
Society and the
Environment 2.1 1.9 1.1 3.0 2.9 4.6
Science 4.6 2.8 3.4 1.6 3.8 2.3
The Arts 1.8 1.6 1.3 1.8 2.4 2.0
LOTE 1.8 0.9 0.2 0.8 0.5 1.3
Technology 0.7 0.6 0.4 1.1 1.0 1.0
Health & PE 1.4 1.3 1.1 1.9 1.0 1.6
Special needs 0.0 0.0 0.0 0.5 0.0 0.3
Other 0.0 0.0 0.0 0.5 0.0 0.3
No specialist area 11.8 25.3 0.0 0.0 0.0 0.0
TOTAL 100.0 100.0 100.0 100.0
Note: Cohort 1: Round 1 n=280. Round 2 n=320; Cohort 2: Round 2 n=475, Round 3 n=467; Cohort 3: Round 1 n=208, Round
3 n=227
For Cohort 1, there was a large percentage of secondary trained teaching respondents who did not indicate their
area of specialisation in Round 2 (25.3 per cent), therefore all specialist areas show a decrease in the percentage of
respondents teaching in them. This may not actually have been the case had there been more respondents who
indicated their specialisation.

Longitudinal Teacher Education and Workforce Study (LTEWS) Final Report
208
For Cohort 2, there was an increase in the percentage of secondary graduates teaching in their specialist area for
all specialisations. The largest increase was in society and the environment, from 7.2 per cent of Cohort 2 at the
end of 2012, to 16.7 per cent at the beginning of 2013. There was also an increase of those with a specialisation in
English who were teaching outside their specialist area, from 0.6 per cent at the end of 2012, to 2.4 per cent in
2013.
For Cohort 3, there was an increase in the percentage of secondary graduates teaching in their specialist area for
most specialisations, except for science, technology, health & physical education and special needs. The largest
increase was again in society and the environment, from 13 to 16.1 per cent. As with Cohort 2, the largest increase
of those teaching outside their area of specialisation was English, from 1.4 per cent at the beginning of
respondents' first year of teaching, to 3.3 per cent at the beginning of their second year.
The low percentages of teaching secondary graduates who are specialists in mathematics and LOTE could be due
to the persistent shortages of qualified teachers in secondary schools subjects such as mathematics. The
Productivity Commission Report (2012) reports on the workforce subject-based shortage of teachers in
mathematics, science, technology, languages including English, and in the area of special needs. The Staff in
Australia’s Schools survey 2010 (McKenzie et al., 2011) estimated that there were up to 400 unfilled positions for
mathematics teachers in secondary schools, and that 8 per cent of schools had a vacancy for these positions. The
Australian Council of Deans of Science (Harris & Jensz, 2006) reported falling numbers of students undertaking
tertiary mathematics and the reduction of mathematics faculty staff in Australian universities.
From this data, it can be inferred that many of the secondary graduate teachers were teaching ‘out-of-field’ in
subjects such as mathematics, technology and LOTE. It must be noted, however, that these figures should be
interpreted with care given a proportion of respondents who did not complete this information. Despite recent
program initiatives to increase the supply of teachers in these areas (e.g., Career Change Program in Victoria and
the Step into Teaching Scholarships to support high achieving science and mathematics graduates to teach in state
high schools. and the Australian Government’s teaching scholarships program to attract highly qualified
mathematics and science graduates into school-based programs), this shortage remains a challenge as principals
rely on ‘out-of-field’ teachers to teach mathematics in their schools. Other reports have similarly reported on the
crisis of out-of-field teaching (Australian Association of Mathematics Teachers, 2006; Education and Training
Committee, 2006; Harris & Jensz, 2006; Vale, 2010).

Longitudinal Teacher Education and Workforce Study (LTEWS) Final Report
209
4.6.2 The extent to which graduates who enter teaching teach the subject disciplines they studied in teacher education programs
This section again focuses on secondary trained graduates with formal qualifications in a specialist area – this
includes middle school (primary/secondary) and secondary teachers. The Figure below shows secondary graduates
with a teaching position who have a qualification to teach in a specialist area, by the percentage who are teaching
in their specialist area. We can see that across the three surveys, between 82 to 86 per cent are teaching in their
area of specialisation.
Figure 33. Secondary graduate teachers with a teaching position who have a specialist qualification – by currently teaching in their specialist area
Note: Round 1 n = 441; Round 2 n=707; Round 3 n=676)
Table 112 below investigates this data further, and shows the number of these graduates who have qualifications
to teach in each of the specialist areas and the percentage who are teaching in these areas.
Table 112. Secondary graduate teachers with a teaching position who have a specialist qualification – by currently teaching in a specialist area
Round 1 Round 2 Round 3
Specialist area
No. with
qualifications
Teaching in
this area
%
No. with
qualifications
Teaching in
this area
%
No. with
qualifications
Teaching in
this area
%
English 123 89.5 198 92.2 189 95.8
Mathematics 49 100.0 93 98.0 128 117.2
Society and the
Environment 190 81.0 271 79.5
241 68.0
Science 156 79.8 264 74.8 180 90.0
The Arts 109 85.3 182 86.8 157 69.4
LOTE 36 77.8 63 92.5 69 91.3
Technology 65 87.9 110 90.2 96 103.1
Health & PE 85 79.6 152 84.9 106 76.4
Special Needs 4 100.0 14 100.0 19 273.7
84.5 85.7 82.1
15.5 14.3 17.9
0%
20%
40%
60%
80%
100%
Round 1 Round 2 Round 3
Teaching in specialist area
No
Yes

Longitudinal Teacher Education and Workforce Study (LTEWS) Final Report
210
Other 11 100.0 22 76.9 4 150.0
Not stated 3 - 1 - -
TOTAL 441 84.5 707 85.7 676 82.1
The specialist area with the largest number of respondents in Round 1 is society and the environment (190)
followed by science (156). The 'hard to staff' specialist areas show mathematics with 49, LOTE with 36, technology
with 65 and special needs with 4. It must be noted here that the majority of graduate respondents with
qualifications to teach in Special Needs are at the primary level, so this Figure of 4 does not include them. As the
percentages show, the specialist areas with the highest uptake includes mathematics and special needs (both 100
per cent).
Round 2 also had the largest number of secondary graduates with qualifications in society and the environment
(271) and science (264). The highest uptake of specialist trained graduates was again in mathematics and special
needs. In Round 3, society and the environment had the largest number (241) followed by English (189). The
uptake for mathematics, technology and special needs exceeded the number of graduates in these areas (117.2
per cent, 103.1 per cent and 273.7 per cent, respectively), which means there are graduate respondents who were
teaching in these areas without qualifications that match that specialist area.
From the data, it is clear that for ‘hard to staff’ subjects such as mathematics and special needs, graduate teachers
who are qualified in these areas teach in their specialist areas. At the same time, the findings, in all three rounds,
showed that these teaching areas have one of smallest number of secondary graduates with qualifications.

Longitudinal Teacher Education and Workforce Study (LTEWS) Final Report
211
4.6.3 The extent to which the discipline areas studied in teacher education programs were adequate in content and relevance for subsequent classroom teaching
Analysis of the survey data, along with the mapping and interview data, contribute to the discussion in this
section. Broad findings from the initial teacher education mapping frame the discussion:
All programs have to meet the standards of the appropriate regulatory authorities in order to be
accredited (See below for the states’ requirements on discipline studies).
Most teacher education providers require pre-service teachers to undertake at least two years in
disciplinary subject(s).
There is general emphasis on preparing pre-service teachers to acquire strong subject-based
knowledge, incorporating the discipline-based grounding in the initial part of the program.
For most teacher education providers, discipline-based subjects are conducted by other faculties in
the institution.
For primary teaching, most teacher education providers require pre-service teachers to undertake
key discipline-based units in conjunction with curriculum studies for all key learning areas in line with
the requirements of the teacher registration authorities.
In general, it is required that discipline studies should be of sufficient depth and (a) related teaching
methodology studies to cover the primary school curriculum or (b) at least one but preferably two subject
areas in the secondary school curriculum.
In Table 113, respondents were asked to indicate their level of agreement on whether their teaching in a specialist
area was effective, from strongly disagree to strongly agree on a five-point Likert scale. Approximately 80 per cent
of graduate teachers and principals agreed and strongly agreed that their teaching in a specialist area was effective,
in both Rounds 2 and 3.
Table 113. Secondary graduate teachers with a teaching position and their principals – by level of agreement that their teaching in a specialist area is effective
Round 2 Round 3 n % n %
Graduates
Strongly disagree 3 0.3 4 0.5
Disagree 43 4.0 20 2.4
Neither agree nor disagree 197 18.5 149 18.0
Agree 617 58.0 481 58.1
Strongly agree 203 19.1 174 21.0
Total 1,063 100.0 828 100.0
Principals
Strongly disagree 8 2.2 4 1.2
Disagree 27 7.5 13 3.8
Neither agree nor disagree 56 15.6 43 12.6
Agree 172 48.0 183 53.8

Longitudinal Teacher Education and Workforce Study (LTEWS) Final Report
212
Strongly agree 95 26.5 97 28.5
Total 358 100.0 340 100.0 Note: Principal responses are on individual teachers, and include teachers from all school levels (primary, secondary and
combined)
Table 114 compares the mean scores on the each of the statements across the three rounds of surveys. The
decrease in agreement on the preparation statement is shown clearly here in the mean scores.
Table 114. Comparison of mean for preparation and effectiveness in specialist area expertise
Round 1 Round 2 Round 3
Mean SD Mean SD Mean SD
Preparation for: Specialist area expertise 3.83 0.957 3.27 1.071 3.18 1.131 Effective in: 3.92 0.746 3.97 0.728 Specialist area expertise
An independent-samples t-test was conducted to compare the means in preparation for teaching and
effectiveness in teaching in a specialist area of expertise by gender. The results are shown in the table below.
There was a significant difference in the scores for male and female preparation in Round 2, with females
significantly more likely to agree they were prepared than males. Specifically, the results suggest that in Round 2,
female respondents felt their teacher education program better prepared them in specialist area expertise than
did male respondents. For the other two rounds there was no significant difference between the gender, nor was
there any significant difference between males and females in their effectiveness in teaching in the area of
specialist expertise.
Table 115. Comparison of mean for preparation and effectiveness in specialist area expertise – by gender
Round 1 Round 2 Round 3
Specialist area expertise Mean SD Mean SD Mean SD
Preparation Males 3.69 1.051 3.17 1.085 3.11 1.101 Females 3.88 0.914 3.31 1.063 3.21 1.143 Effectiveness Males 3.94 0.764 4.01 0.655 Females 3.91 0.739 3.95 0.756 Note: Round 1: Males n=134, Females n=348; Round 2: Males n=323, Females n=740; Round 3: Males n=246, Females
n=582 Preparation p value: Round 1 p=0.059; Round 2 p=0.042; Round 3 p=0.243 Effectiveness p value: Round 2
p=0.473; Round 3 p=0.223
A one-way between subjects ANOVA was conducted to compare the means in preparation for teaching and
effectiveness in teaching in specialist area of expertise by program type. The results are shown in the table below.
In all three surveys, there was no significant difference between program types in the mean scores for preparation
or effectiveness in specialist area expertise (See Appendix 11 for the margin of errors).

Longitudinal Teacher Education and Workforce Study (LTEWS) Final Report
213
The interview and survey free text responses showed that graduate teachers are increasingly aware of the
contextualised nature of their teaching as they progresses into their second year post-graduation, taking into
consideration the institutional framework of schools and communities in impacting on their teaching effectiveness.
In retrospect, responses from the free text question ‘What do you like to see changed in teacher education’ illustrated
the concern of strengthening the linkages between discipline-based expertise and curriculum strategies in order to
foster stronger practical application to impact on student learning:
‘More subjects that are actually related to teaching and the classroom.’
‘More focus on numeracy and literacy concepts and how to teach them specifically.’
‘A lot of the subjects weren't at all practical, and our most valuable lecturers were the ones who were or had
been teachers.’
‘Far too much emphasis is placed on the University Degree rather than the practical application of the
profession. Far greater 'on the job' training would be more beneficial than completing subjects of different
names but rehashing the same content.’
‘I felt that the practical components of my course provided me with excellent preparation. The university
based subjects I found did little to support me in my early years as a teacher and certainly not in the setting I
found myself in.’
‘More practical based subjects’
‘I would like to see University subjects selected to better represent the 'real' teaching world.’
The notion of the lack of coherence between discipline expertise and pedagogical knowledge was also echoed in
the principals’ responses:
‘Lack of confidence with content and specific subject area pedagogical knowledge’
‘A solid grounding in curriculum knowledge and a range of pedagogical practices which they can build
upon.’

Longitudinal Teacher Education and Workforce Study (LTEWS) Final Report
214
4.7 Preparation to Teach Culturally, Linguistically and Socio-Economically
Diverse learners, ICT, and Numeracy and Literacy
In addition to the general domains that comprise the Australian Professional Standards for Teachers, LTEWS
investigated whether graduates’ initial teacher education adequately equipped them to address the challenges
they faced in their first year of teaching in three specific areas, namely:
Teaching culturally, linguistically and socio-economically diverse learners
Use of ICT
Literacy and numeracy
Section 4.6 examines graduates’ perceptions of their preparation and effectiveness in these three areas and the
extent to which preparation in these areas influenced their decisions to seek teaching employment, and the school
in which they work.
Box 16 lists the main findings of Section 4.7.
Box 16. Main Findings: Preparation to teach culturally, linguistically and socio-economically diverse learners, ICT, and numeracy and literacy
Only about half of the graduate teachers felt well prepared in the three areas of ‘Teaching culturally, linguistically and socio-economically diverse learners’, ‘Use of ICT’, with slightly more feeling well prepared in ‘Numeracy and Literacy’. Preparedness in these areas was rated lower than for the seven areas of the Australian Professional Standards for Teachers. Graduates felt least prepared to ‘Teach culturally, linguistically and socio-economically diverse learners’. It is noteworthy, that in surveys and interviews they recorded experiencing significant professional learning in this area during their first year of employment.
Graduates considered that they were more effective in teaching than they had been prepared for in relation to the three areas of ‘Teaching culturally, linguistically and socio-economically diverse learners’, ‘Use of ICT’ and ‘Literacy and numeracy’. More than 70 per cent of the graduates considered that they were effective in these specified areas.
Principals’ level of agreement with being effective as a teacher in these areas was much higher than respondents' agreement that their teacher education programs prepared them in these areas.
There was no relationship between graduates feeling well prepared for ‘Teaching culturally, linguistically and socio-economically diverse learners’, ‘Using ICT’, and in ‘Numeracy and literacy’ and the type of school in which graduates were employed, the geographic location of their school or whether or not the school in which graduates were employed was an Aboriginal and Torres Strait Islander focus school.

Longitudinal Teacher Education and Workforce Study (LTEWS) Final Report
215
4.7.1 The extent to which preparation in these areas appears associated with graduates who seek and obtain teaching employment and the school in which they work
Graduates’ perceptions of their preparedness in key areas of teaching (teaching culturally, linguistically and
socio-economically diverse learners; ICT; and numeracy and literacy)
The surveys asked graduates to say how well they felt their teacher education program prepared them in these key
areas. Table 116 shows the results of graduates' level of agreement with the statements about preparation for
teaching in these areas. These questions were only asked of those respondents who were currently teaching.
Table 116. Graduate teachers – by level of agreement that teacher education programs prepared them in key areas of teaching
Strongly disagree Disagree
Neither agree nor disagree Agree
Strongly agree
Preparation for: % % % % %
Round 1 Teaching culturally, linguistically and socio-economically diverse learners 2.2 12.4 34.7 43.1 7.6 Use of ICT 6.6 15.4 16.4 43.2 18.4 Literacy and numeracy 2.8 9.5 24.4 47.2 16.1
Round 2 Teaching culturally, linguistically and socio-economically diverse learners 3.0 17.6 24.6 44.7 10.0 Use of ICT 4.9 16.1 21.8 44.5 12.7 Literacy and numeracy 2.5 11.0 21.9 50.9 13.7 Round 3 Teaching culturally, linguistically and socio-economically diverse learners 4.2 17.9 26.5 42.1 9.3 Use of ICT 6.3 18.2 22.4 40.6 12.6 Literacy and numeracy 3.9 13.0 19.7 51.4 12.0 Note: Round 1 n=935; Round 2 n=2,099; Round 3 n=1,727
All three areas had over 50 per cent of graduate teachers agreeing or strongly agreeing they felt well prepared by
their teacher education programs, but this level of agreement was much lower than for the seven areas of the
Australian Professional Standards for Teachers (See Section 4.3 Content and relevance of teacher education
programs for subsequent classroom teaching). Literacy and numeracy preparation had the highest level of
agreement of the three areas, with 63 per cent agreeing or strongly agreeing their programs prepared them in this
area in Rounds 1 and 3, and 64.6 per cent in Round 2. Preparation to teach culturally, linguistically and socio-
economically diverse learners had the lowest percentage of agreement of the three areas. In Round 1, this was
50.7 per cent, Round 2 .54.7 per cent and Round 3, 51.4 per cent.
The percentage of disagreement with preparation in the three areas rose over the three rounds of surveys. In
Round 1, 14.6 per cent disagreed or strongly disagreed that their teacher education program prepared them to
teach culturally, linguistically and socio-economically diverse learners. In Round 2 this had risen to 20.6 per cent
and in Round 3 it was 22.1 per cent. The area with the highest percentage of disagreement (i.e. disagreed or

Longitudinal Teacher Education and Workforce Study (LTEWS) Final Report
216
strongly disagreed) about teacher education program preparation was in the use of ICT, which in Round 3 was 24.5
per cent.
However, in addition to asking how well their teacher education programs had prepared them to handle these
three areas of teaching, graduates were asked how effective they felt they were within these areas, and this
produced a markedly different impression of how they were faring.
Graduates’ perceptions of their effectiveness in key areas of teaching (teaching culturally, linguistically and
socio-economically diverse learner, ICT, and numeracy and literacy)
Table 117 below shows the results of graduates' level of agreement with the statements about being effective as
teachers in these areas.
Table 117. Graduate teachers – by level of agreement that they are effective in key areas of teaching
Strongly disagree Disagree
Neither agree nor disagree Agree
Strongly agree
Effective in: % % % % %
Round 2 Teaching culturally, linguistically and socio-economically diverse learners 0.3 5.0 23.8 54.4 16.4 Use of ICT 0.2 3.7 16.6 52.4 27.2 Literacy and numeracy 0.3 1.8 14.4 63.3 20.2 Round 3 Teaching culturally, linguistically and socio-economically diverse learners 0.3 3.9 21.0 57.4 17.4 Use of ICT 0.2 3.6 12.9 54.8 28.5 Literacy and numeracy 0.1 1.9 13.3 63.9 20.8 Note: Round 2 n=2,099; Round 3 n=1,727
The level of agreement with being effective as a teacher in these areas is much higher than respondents'
agreement that their teacher education programs prepared them in these areas. This finding corroborates the
findings for the level of preparation and effectiveness of the seven National Standards in Section 4.2.4 where
graduate teachers rated their effectiveness higher than the preparedness in these key teaching areas.
Literacy and numeracy had the highest level of agreement (i.e. the percentage of those who agreed or strongly
agreed) that they were effective in this area: 83.5 per cent in Round 2 and 84.7 per cent in Round 3. There was a
very small percentage of respondents who disagreed (i.e. disagreed or strongly disagreed) they were effective in
these three areas, with teaching culturally, linguistically and socio-economically diverse learners having the highest
percentage of disagreement, which was 5.3 per cent in Round 2 and 4.2 per cent in Round 3.
Principals’ perceptions of graduates’ effectiveness in key areas of teaching (teaching culturally, linguistically and
socio-economically diverse learners; ICT; and numeracy and literacy)
With these results in mind, it is useful to note how principals perceived the effectiveness of graduates in these
three key areas. Figure 34 below shows their responses to questions about the effectiveness of their graduate
teachers in these areas.

Longitudinal Teacher Education and Workforce Study (LTEWS) Final Report
217
Figure 34. Principals’ views of the effectiveness of individual graduate teachers in key areas
Note: Round 2 n=358, Round 3 n=340
These responses show that principals saw the majority of graduate teachers as being effective in these three key
areas. The area with the greatest percentage of agreement (i.e. agree or strongly agree) on graduate teacher
effectiveness is 'Use of ICT', with 92 per cent in both Rounds 2 and 3.
The key area with the largest percentage of disagreement (i.e. disagree or strongly disagree) on graduate
effectiveness is 'Teaching culturally, linguistically and socio-economically diverse learners', with 7.8 per cent of
principals stating this in Round 2 and 6.8 per cent in Round 3. This is the area in which graduates also had a higher
percentage disagreeing they were teaching effectively.
Graduates’ perceptions of their preparedness – by school geographic location graduates’
The characteristics of the school in which they were working affected graduates’ perceptions, and the extent to
which their teacher education programs prepared them to meet the challenges of these three key areas, are
discussed here. The graduates’ responses to how well they felt their teacher education programs prepared them in
these three areas were recorded on a five-point Likert scale from strongly disagree to strongly agree, which were
then put into three groups, as follows:
strongly disagree and disagree were merged into one category named 'Disagree'
strongly agree and agree were merged into one category named 'Agree'
1.4 1.2 0.3 0.6 0.3 1.5
6.4 5.6
1.4 0.3 3.1
0.9
21.5 20.9
5.9 7.6 8.9
11.8
50.8 51.8
45.8
50.6
60.6 61.8
19.8 20.6
46.6
40.9
27.1 24.1
0
10
20
30
40
50
60
70
Round 2 Round 3 Round 2 Round 3 Round 2 Round 3
Teaching diverse learners Use of ICT Literacy & numeracy
Pe
rce
nt
Key areas of teacher effectiveness
Strongly Disagree Disagree Neither Agree nor Disagree Agree Strongly Agree

Longitudinal Teacher Education and Workforce Study (LTEWS) Final Report
218
neither agree nor disagree remained a category on its own, and was not used for the purpose of this
analysis
The 'Disagree' group and the 'Agree' group as to being prepared in the three areas, were cross-tabulated with the
following school data:
school geographical area (i.e. major city, inner regional, out regional, remote and very remote)
school type (i.e. early childhood, secondary and combined)
Aboriginal and Torres Strait Islander focus (i.e. schools with and without an Aboriginal and Torres Strait
Islander focus)
The two tables below show the results of these cross-tabulations. Table 118 shows the percentage for graduates
who 'Disagree' and 'Agree' that their teacher education program prepared them in teaching diverse learners, use
of ICT, and literacy and numeracy, cross-tabulated with school geographic location.
Table 118. Graduates' level of agreement that teacher education programs prepared them in key areas – by school geographic location
Teach diverse learners Use of ICT Literacy & numeracy
Disagree Agree Disagree Agree Disagree Agree
% % % % % %
Round 1
Major city 55.0 58.5 57.8 61.5 55.9 60.9
Inner regional 24.0 21.2 20.5 20.2 25.5 20.0
Outer regional 16.3 15.1 15.1 13.9 14.7 14.3
Remote 3.9 2.8 4.9 2.3 3.9 2.1
Very remote 0.8 2.4 1.6 2.1 0.0 2.6
Total 100.0 100.0 100.0 100.0 100.0 100.0
Round 2
Major city 60.0 63.0 63.5 60.3 64.5 60.7
Inner regional 22.2 21.3 23.3 22.9 22.3 22.8
Outer regional 11.9 9.7 9.4 10.7 8.0 11.0
Remote 3.8 3.0 2.1 3.5 2.4 2.6
Very remote 2.2 3.1 1.6 2.6 2.8 2.9
Total 100.0 100.0 100.0 100.0 100.0 100.0
Round 3
Major city 55.3 63.3 59.0 62.1 58.8 60.7
Inner regional 21.6 18.9 19.7 19.8 18.5 19.8
Outer regional 13.3 11.9 13.7 11.6 17.7 12.6
Remote 3.5 3.0 2.7 3.3 2.3 3.1
Very remote 6.3 2.8 4.9 3.1 2.7 3.8
Total 100.0 100.0 100.0 100.0 100.0 100.0
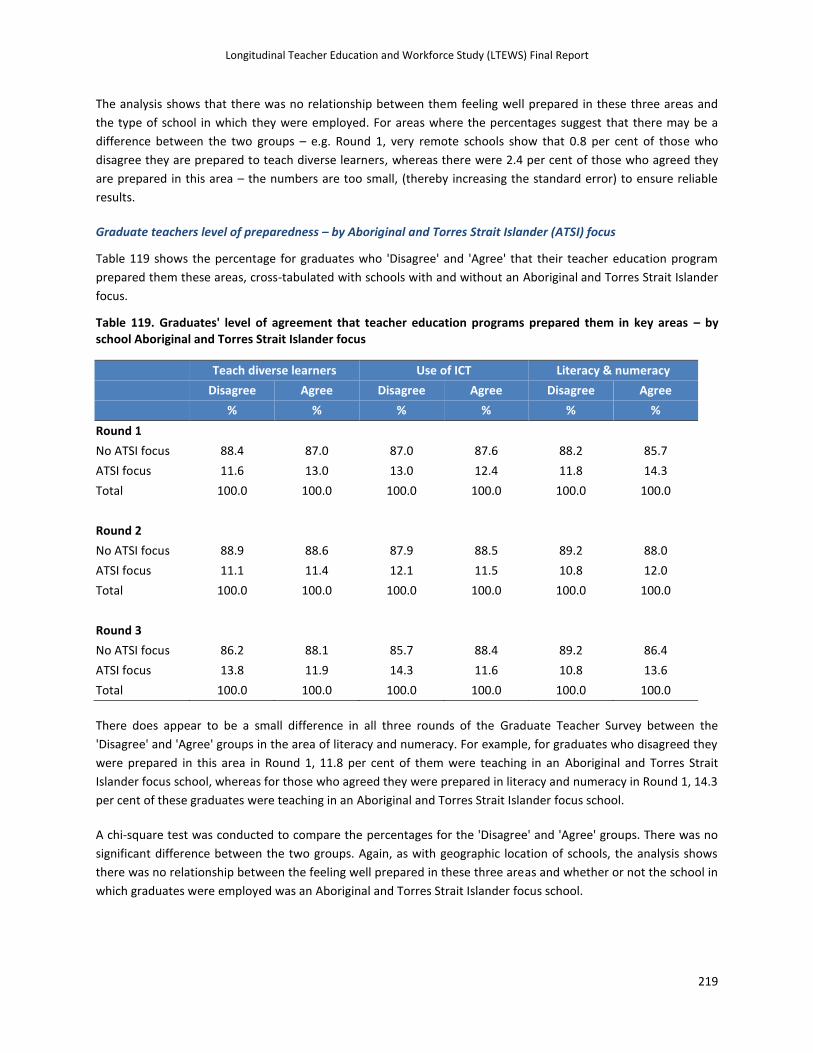
Longitudinal Teacher Education and Workforce Study (LTEWS) Final Report
219
The analysis shows that there was no relationship between them feeling well prepared in these three areas and
the type of school in which they were employed. For areas where the percentages suggest that there may be a
difference between the two groups – e.g. Round 1, very remote schools show that 0.8 per cent of those who
disagree they are prepared to teach diverse learners, whereas there were 2.4 per cent of those who agreed they
are prepared in this area – the numbers are too small, (thereby increasing the standard error) to ensure reliable
results.
Graduate teachers level of preparedness – by Aboriginal and Torres Strait Islander (ATSI) focus
Table 119 shows the percentage for graduates who 'Disagree' and 'Agree' that their teacher education program
prepared them these areas, cross-tabulated with schools with and without an Aboriginal and Torres Strait Islander
focus.
Table 119. Graduates' level of agreement that teacher education programs prepared them in key areas – by school Aboriginal and Torres Strait Islander focus
Teach diverse learners Use of ICT Literacy & numeracy
Disagree Agree Disagree Agree Disagree Agree
% % % % % %
Round 1
No ATSI focus 88.4 87.0 87.0 87.6 88.2 85.7
ATSI focus 11.6 13.0 13.0 12.4 11.8 14.3
Total 100.0 100.0 100.0 100.0 100.0 100.0
Round 2
No ATSI focus 88.9 88.6 87.9 88.5 89.2 88.0
ATSI focus 11.1 11.4 12.1 11.5 10.8 12.0
Total 100.0 100.0 100.0 100.0 100.0 100.0
Round 3
No ATSI focus 86.2 88.1 85.7 88.4 89.2 86.4
ATSI focus 13.8 11.9 14.3 11.6 10.8 13.6
Total 100.0 100.0 100.0 100.0 100.0 100.0
There does appear to be a small difference in all three rounds of the Graduate Teacher Survey between the
'Disagree' and 'Agree' groups in the area of literacy and numeracy. For example, for graduates who disagreed they
were prepared in this area in Round 1, 11.8 per cent of them were teaching in an Aboriginal and Torres Strait
Islander focus school, whereas for those who agreed they were prepared in literacy and numeracy in Round 1, 14.3
per cent of these graduates were teaching in an Aboriginal and Torres Strait Islander focus school.
A chi-square test was conducted to compare the percentages for the 'Disagree' and 'Agree' groups. There was no
significant difference between the two groups. Again, as with geographic location of schools, the analysis shows
there was no relationship between the feeling well prepared in these three areas and whether or not the school in
which graduates were employed was an Aboriginal and Torres Strait Islander focus school.

Longitudinal Teacher Education and Workforce Study (LTEWS) Final Report
220
What implications do these findings have for initial teacher education?
The responses from graduates and school principals as discussed in this section suggest that graduates face
particular challenges in teaching culturally, linguistically and socio-economically diverse learners and teaching
literacy and numeracy, in comparison with other areas that were specified in the survey. To arrive at a better
understanding of why respondents felt less well prepared by their teacher education programs in these areas, it is
useful to examine the free text responses elicited by the surveys, as well as the interviews that were conducted
with selected graduates in each state. Taken as a whole, the LTEWS data prompts critical reflection on how the
professional learning graduates experienced during their pre-service program provides a framework for the
ongoing professional learning they experience on entering teaching.
The importance of preparing early career teachers to address the issue of cultural, linguistic and socio-economic
diversity is emphasised in the Australian Professional Standards for Teachers (e.g. Standards 1.3, 2.4, 3.7, 7.3). In
free text comments and interviews, graduates use similar language to that which is used in the Standards to
describe the challenges they had been facing. This is not to assume that these early career teachers are consciously
drawing on these standards, simply to say that they are using a language that they hold in common with other
members of the profession that has been adopted by the Australian Institute for Teaching and School Leadership
and other regulatory authorities around Australia. The LTEWS ‘Mapping of Initial Teacher Education Programs in
Australia in 2011’ report (See Appendix 1) shows that teacher educators are very aware of the importance of
promoting the importance of diversity, ICT and literacy and numeracy (they are required to show that their
programs address these dimensions in order for them to be accredited) and so one can also read the graduates’
responses as evidence that they have appropriated the language of their teacher education programs in order to
give an account of their experiences as early career teachers.
It is clear from the surveys and interviews that these graduates have been inducted into a professional discourse
that enables them to talk about and reflect on their work. There is obviously a considerable difference between
the capacity to speak the language specific to education as a field of inquiry and the ability to teach effectively –
this is precisely what respondents are saying when they emphasise the importance of the practicum experience
within their initial teacher education programs. Yet such a professional discourse is nonetheless an indispensable
condition for entering the profession and grappling with the professional challenges that teaching poses.
Otherwise these early career teachers would simply not be able to identify problems and consider how they might
best be addressed. The question of how well initial teacher education can equip graduates to handle the
complexities of teachers’ work is about the dividing line between learning ‘about’ teaching and using that learning
in practice. It concerns the difference between acquiring a professional discourse and applying the language and
concepts of that discourse in order to actively engage in specific school settings.
With respect to the question of these early career teachers’ capacity to grapple with cultural, linguistic and socio-
economic diversity, both the survey free text responses (when they were invited to identify two key challenges
they were facing, using their own language) and the interviews show that they are using words like ‘diversity’ and
‘difference’ to identify complex issues that have emerged in the course of their work.
It should be noted, however, that the question of their capacity to handle diversity is implicit in other challenges
they name. One respondent, for example, specified ‘professional ethics and reporting on student welfare’ as a key
challenge, which conjures up a situation where this person might have encountered behaviour that was outside his
or her customary frame of reference or system of values. This comment might, in short, refer to a situation where
this teacher has been confronted by difference or diversity, prompting reflexive scrutiny of his or her values and
beliefs. The same might be said about free text responses referring to ‘assessment and catering for diverse
learners’, and ‘assessment for students with a disability’, not to mention other examples of challenges where

Longitudinal Teacher Education and Workforce Study (LTEWS) Final Report
221
respondents name curriculum and pedagogical issues that conceivably involve addressing the needs of students
from a diverse range of backgrounds.
Overall, the free text responses indicate a marked capacity on the part of respondents to reflect critically on the
meaning of what they are doing, drawing on the professional knowledge available to them (professional
knowledge that they have developed through their initial teacher education programs), rather than simply
worrying about problems (e.g. behaviour management) in a narrowly pragmatic way.
As discussed in Section 4.2.4, many survey respondents indicated that assessment and reporting was an issue for
them and this clearly impinges on the question of catering for cultural, linguistic and socio-economic diversity, or
at least it might do so. ‘Effective authentic assessment’; ‘expectation of passing students who really shouldn’t be’;
‘reporting and grading a multilevel classroom’; ‘reporting back to parents … knowing how to provide feedback on
students learning without sound too negative’ – these statements by respondents about key challenges that they
have been facing imply continuing attempts on their part to grapple with the values and expectations of students
and their parents within particular school communities.
One respondent makes an explicit connection between assessment and responding to cultural diversity by
reflecting on his or her experience in teaching in an Australian Aboriginal and/or Torres Strait Islander community
by saying: ‘As a remote, 100% Australian Aboriginal and/or Torres Strait Islander school, assessment in the past has
been largely formative. The only exception has been in the area of standardised literacy tests. In the area of
numeracy, in particular, students have made some significant progress this year, but this is not demonstrated by
summative test results’. The SETE interviews have produced similar instances of early career teachers expressing
concerns about standardised testing (i.e. NAPLAN) vis-à-vis the attitudes and values evinced by students at their
school. (This is not to say that their concerns are justified, merely to indicate that they are engaging in a
professional discourse that makes connections between assessment issues and issues of socio-cultural diversity.)
The question of graduates’ capacity to grapple with diversity can be usefully considered in relation to what
respondents had to say about ‘behaviour management’. This loomed large as a key challenge they were facing in
the Round 1 survey, and many respondents simply named this challenge without elaborating any further. Other
respondents, however, showed signs of conceptualising this challenge in terms of difference or diversity, and a
capacity to recognise and respond to the students in their classes. Here are some examples from the free text
responses in Round 1 survey where respondents were asked to name two key challenges they were experiencing
as early career teachers – many used the term ‘behaviour management’.
‘Behaviour management is still a struggle, but is slowly improving as I get to know my students’;
‘setting boundaries, expectations, dealing with disruptive and defiant behaviours…’
‘behaviour management – knowing the correct words to use and things to say and being clear about
expectations’
‘behaviour management, whilst catering to a diverse range of learning abilities’
‘class with range of issues from behaviour to low literacy and catering to each student’
‘classroom management (especially with long term disengaged students)’
‘classroom management has been a great challenge at a school where the majority of students have a low
socio- economic background and who place no value whatever on education…’

Longitudinal Teacher Education and Workforce Study (LTEWS) Final Report
222
As indicated above, not all the respondents who named ‘behaviour management’ as one of their ‘key challenges’
contextualised it in the way these last two respondents do, as requiring an understanding of the values and
expectations of students from a ‘low-socio economic background’. Such responses are nonetheless interesting in
the way they show early career teachers drawing on the intellectual resources available to them in order to name
and address challenges that they have encountered. One senses a disposition on the part of some respondents to
resist being judgmental, to try to interpret the behaviour of their students as symptomatic of larger issues or social
contexts – a disposition that (arguably) partly derives from their initial teacher education, and thus prompts
thought about what the ‘effectiveness’ of teacher education might really mean.
It does not seem reasonable to expect early career teachers to immediately show a capacity to handle all the
things named by the term, ‘behaviour management’ (experienced teachers who transfer schools face difficulties
establishing their authority in a new setting). What one might reasonably expect is a capacity on the part of early
career teachers to try to understand the behaviour of their students, and on this basis to develop strategies that
might enable them to create a more generative classroom environment.
It is noteworthy that classroom management dominated the challenges listed in the Round 1 survey, sometimes
reflecting the casual/relief teachers’ status of respondents, and in one or two instances the fact that they were
teaching out of field. There was, however, a marked decline in the number of respondents specifying behaviour
management or classroom management as a key challenge from Round 1 to Round 2 survey. This suggests that
these early career teachers were moving beyond ‘survival’ mode, vis-à-vis the classes they were teaching, and that
they were beginning to take stock of other dimensions of their school settings, beyond the classroom door. This is
not to say that they were no longer experiencing enormous pressures, but that they were beginning to put aspects
of their work into perspective and engage in significantly new professional learning as they moved beyond their
initial teacher education, assuming the professional responsibilities associated with their new roles. (In this respect,
it is worth remarking that casual/relief teachers who were interviewed showed a markedly diminished capacity to
build on their initial teacher education, remaining preoccupied with behaviour management issues without being
able to make strong connections to questions of pedagogy and curriculum. In some instances, interviewers even
sensed that the knowledge these graduates had acquired through their initial teacher education was being eroded
because they were not in a position to apply it.)
The challenge of addressing the needs of students from diverse backgrounds was also apparent in comments made
by respondents about important dimensions of schooling, such as ‘curriculum’ and ‘engagement’, including the
challenges associated with implementing the new Australian curriculum. Such comments showed respondents
thinking beyond the immediate contexts of their classrooms and locating their work within larger curriculum and
policy settings. One respondent, for example, listed ‘curriculum planning – sorting through and finding the best
formats to suit the diverse range of learners in our small school’.
Whilst this capacity to make connections with the whole school context (and in some case the larger policy context
of the Australian curriculum) is evident in Round 1 survey, this disposition appears to become more marked in the
second survey, where some of the comments take on a more ‘political’ character with respect to the constraints
under which respondents feel they are working, with one remarking that ‘restrictive curriculum requirements
make it difficult to cater for diversity and manage behaviour.’ Once again the way these early career teachers have
appropriated the language of their profession, and are attempting to give an account of their challenges in terms
of issues like ‘curriculum’ or ‘assessment’, as key dimensions to consider when addressing ‘diversity’, is noteworthy.
Many comments show respondents thinking relationally, rather than treating issues in isolation, recognising that

Longitudinal Teacher Education and Workforce Study (LTEWS) Final Report
223
the complex phenomena that they are encountering in their first year of teaching can only be understood when
they are placed within larger contexts.
It is unbelievable. My lowest student in year 7 does 12 take away 7, marking down 12 strips on a piece of paper and crossing out seven of them and counting what’s left over. That’s what my lowest student does and then my highest student is actually operating about where he should be and the gap between that is just enormous … it makes it very difficult … for anyone to teach. For me it’s especially difficult because I’m still working out how to get ideas across to students.
Graduate teacher, full-time contract, off-campus
This kind of shift from a focus on one’s immediate classroom context to a wider awareness of the institutional
setting of the school and the community it serves is a familiar one. For the purposes of this study, evidence of the
continuing professional learning of graduates raises questions about how, exactly, memories of their initial teacher
education figure within their emerging professional identities and their ongoing professional learning. The learning
that they experienced in the course of assuming their professional responsibilities within their new institutional
settings provides a new perspective in which to view their memories of their pre-service education (this becomes
more obvious in interviews with graduates than in the survey responses, when some provide very vivid accounts of
what it has felt like to step from initial teacher education into the unfamiliar context of a specific school
community).
The free text responses and interviews suggest that graduates at least recognise the challenge of meeting the
needs of students from socially and culturally diverse backgrounds. And, given the culturally and socially situated
nature of those needs, as frequently conveyed by those graduates who were interviewed, questions emerge about
the extent to which any teacher education program can reasonably be expected to anticipate all the challenges
that graduates face, beyond instilling in them a capacity to be responsive to their new situations and to learn from
them (i.e. a reflective disposition that graduates generally affirmed as being a positive characteristic of their
teacher education programs). The positive characteristic of ‘reflective practice’ as a strength of their teacher
education programs is discussed in Section 4.2.2 of the report.
This issue of the nature and scope of the professional learning that initial teacher education can reasonably
provide can be explored further through considering respondents’ comments on their preparedness to teach
literacy, one of the other areas in which they registered a lower level of agreement with the proposition that their
teacher education program had equipped them to meet the challenges of their first year. In the Round 1 survey,
there was some indication from a (very) small number of respondents that they felt they did not have adequate
skills to teach literacy (see details below). Other respondents, however, seemed less concerned about their
capabilities as literacy teachers. By naming ‘literacy’ as a challenge, they were instead registering the challenges
with which they were grappling, given the particular cohort of students they were teaching. These challenges
included (again drawing on free text responses): the wide range of abilities in a class, the challenges of teaching
ESL students, low literacy levels (with a couple mentioning Australian Aboriginal and/or Torres Strait Islander
students). This is congruent with the other insight that has been explored above, namely that by and large their
initial teacher education programs have equipped them to identify the issues or challenges with which are faced.
The task with which they are now presented involves accepting their professional responsibilities and applying the
knowledge and experience that they have acquired in their initial teacher education programs in order to address
those challenges and to learn from these new experiences. Some graduates cited the challenges of implementing a

Longitudinal Teacher Education and Workforce Study (LTEWS) Final Report
224
literacy program, involving organising their classes and establishing routines, as indicated in this comment from
Round 1 free text responses:
Developing a well working literacy rotation has taken some time and effort. Initially I found it difficult to run a really successful literacy class. Teaching times were disrupted by other students doing independent work. I now have what I consider a great system, with all students knowing what they are to be doing at each time slot. Teaching times with my small groups are running more smoothly due to less interruptions as each rotation group now has a leader, reader and thinker. This puts the responsibility of learning and organisation back onto the students. They have responded well to this system.
Graduate teacher, free text response
Far from naming a major challenge that derives from any lack on the part of his or her teaching education program,
this comment reflects a considerable amount of knowledge about how to organise a class for literacy, and so might
just as easily be read as a sign of success instead of a problem. (This is borne out when one reads the respondents’
comments with respect to the ‘successes’ they have experienced, many of which convey their satisfaction at
having been able to successfully grapple with a professional challenge.
Other comments that reflect a broadly similar attitude towards the challenge of organising classes for literacy
learning include (using the words of respondents): ‘the implementation of a new whole school approach within the
literacy program’, ‘developing effective literacy programs’, ‘knowing how to implement literacy and numeracy
programs which meet the needs of schools and parents as opposed to university-driven approaches to these areas’
– all comments that reflect a concern with literacy as a whole school responsibility.
The last remark, which juxtaposes teacher education, juxtaposing the challenge of implementing whole school
literacy and numeracy programs that meet the needs of school communities with so-called ‘university-driven’
approaches to literacy and numeracy, was matched by some other negative remarks about teacher education,
including the following:
‘Explicit knowledge of phonics and phonemic awareness when teaching Literacy (this was not taught
explicitly at University)’
‘I didn’t know enough about teaching literacy. No teacher should leave university not knowing how to
teach a child to read. I had no idea.’
But such comments did not proliferate, and the overriding impression generated by the surveys was that the
respondents were working successfully to implement literacy programs (where the emphasis falls on ‘programs’,
showing a consciousness of literacy as a whole school responsibility).
One respondent made a very positive comment about the way his or her initial teacher education program
addressed the challenges of literacy teaching.
As someone who has English as an additional language, literacy is something I generally always had to work harder with and put more effort in. Numeracy comes off naturally as I had always loved it but literacy presented a challenge. The literacy course we had in [my Initial Teacher Education Course] was amazing and it opened up so many strategies for teaching.
Graduate teacher, free text response

Longitudinal Teacher Education and Workforce Study (LTEWS) Final Report
225
This comment is mirrored by several comments made in Rounds 1 and 2 about the successes that respondents
have experienced. Many refer to literacy, especially with respect to students who have been experiencing literacy
difficulties, such as this comment from Round 1.
I have worked with a Literacy class that behaviourally was very difficult and struggled with many aspects in learning. For most students, I was able to improve their confidence in themselves, engage them in learning and see importance of Literacy. It certainly wasn't easy, but it was very rewarding!’
Graduate teacher, free text response
This kind of altruistic impulse is evident in many comments in both the surveys and the interviews, showing that
respondents were deriving significant rewards from their interactions with young people. There was also a sense
that some were continuing to engage in rich professional learning and that they were beginning to refine their
skills as literacy educators, as is suggested by this selection of comments about the successes they had experienced
(using the words of the respondents):
advancing students’ literacy, developing strong literacy programs, development of phonics
Remedial reading
VCAL Literacy – engaging students
Connecting students' learning to real life – organising activities and visits from
authors/illustrators/performers to enhance literacy development in the school community
developing an interest in literacy for students who are unable to read or write
improvement of student skills – students who have been challenged by literacy in the past have
demonstrated their understanding and improved on their analysis and evaluative skills in the arts
improving literacy through development of a love of reading
providing differentiated literacy tasks
The principals’ survey reflects a generally positive estimation of graduates’ effectiveness in the areas of catering
for diversity, ICT and teaching literacy and numeracy, although their free text responses showed a pronounced
emphasis on the need for early career teachers to cater for diversity as one of the key challenges they saw them as
facing. The principals also made connections between issues of classroom management and the need to
differentiate curriculum ‘so that all learners are catered for’ (as one respondent put it). Three respondents pointed
to an apparent lack of knowledge with respect to the teaching of literacy (‘teaching literacy without proper
training’).
However, such perceptions of the effectiveness (or otherwise) of initial teacher education programs with respect
to addressing diversity, ICT and teaching literacy and numeracy need to be placed alongside graduates’ accounts of
the professional learning they have experienced in these areas, as shown by the ‘successes’ they have had (in the
free text responses) and the stories they told in the interviews.
With respect to literacy and numeracy, graduates’ statements about their ‘successes’ (as recorded in the free text
responses) do more than provide a counterbalance to their comments about their lack of preparedness in this area.
Indeed, their perceived effectiveness in this respect, as recorded by both graduates and school principals is cause
for optimism that early career teachers have the capacity to develop a reflective practice that is increasingly

Longitudinal Teacher Education and Workforce Study (LTEWS) Final Report
226
responsive to the literacy and numeracy needs of their students, and the same might be said about ICT and
catering for the needs of students from socially diverse communities. The significant difference between the levels
of agreement with respect to their preparedness and their current effectiveness indicates that they have been
engaging in ongoing professional learning that has taken them beyond the learning they experienced in their pre-
service programs. They have, in short, joined the profession with a disposition to continue learning.
An interesting finding that prompts further thought about the effectiveness of teacher education is that graduates
rated their effectiveness in several key areas more highly than their sense of preparedness. The difference
between their apparent dissatisfaction with their preparation and their sense of effectiveness within their current
institutional setting is especially apparent in the areas of cultural linguistic diversity, literacy, numeracy and ICT.

Longitudinal Teacher Education and Workforce Study (LTEWS) Final Report
227
5. Conclusion
The Longitudinal Teacher Education Workforce Study (LTEWS) investigated the career progression of 2011
graduate teachers from teacher education into teaching employment in all states and territories across Australia
during 2012 and the first half of 2013. It also tracked their perceptions, over time, of the relevance and
effectiveness of their teacher education programs. LTEWS was conducted concurrently with the Studying the
Effectiveness of Teacher Education (SETE) project, which is a three-year project investigating these issues in
Queensland and Victoria funded by the ARC and industry partners. The findings from SETE were incorporated with
the LTEWS findings to provide the national data set discussed in this report.
LTEWS utilised a mixed-method approach using quantitative and qualitative data collection methods including
three rounds of Graduate Teacher Surveys and Principal Surveys as well as telephone interviews with graduate
teachers. The Graduate Teacher Survey data were analysed in two ways, firstly as three separate snapshots (March
2012, October 2012, March 2013) and also from a longitudinal perspective on graduate teachers who were
followed across this time period. The analysis was also informed by the interview data collected between May
2012 and May 2013 after each survey round.
The cohort of 2011 graduate teachers followed in LTEWS was diverse. The average age of respondents early in
their first year after graduation was 32 years, with 53 per cent under 30 years of age and 81 per cent female.
Eighty-six per cent came from English-speaking backgrounds, 1 per cent identified as Aboriginal or Torres Strait
Islander, and 42 per cent identified as the first in their immediate family to gain a tertiary qualification. Fifty-two
per cent had graduated from a graduate entry teacher education qualification (including 12 per cent from masters
programs), while 46 per cent had graduated with a four-year undergraduate bachelor’s degree. The majority were
qualified to teach secondary school (44 per cent) and primary school (37 per cent). More than three-quarters had
completed their teacher preparation in Victoria (29 per cent), Queensland (24 per cent) and New South Wales (23
per cent).
Overall, the findings support the already well established view that learning to teach is a continuum involving pre-
service teacher education, induction into the profession and then ongoing professional learning and development
(e.g. Ball & Cohen, 1999; Conway, Murphy, Rath, & Hall, 2009; Feiman-Nemser, 2001; Putnam & Borko, 2000). High
quality pre-service teacher education programs must prepare graduate teachers for highly effective beginning
teaching but also provide the foundation for further professional learning and growth. This view is reflected in the
four professional stages of a teaching career – Graduate, Proficient, Highly Accomplished and Lead – as outlined in
the Australian Professional Standards for Teachers (Australian Institute of Teaching and School Leadership, 2011c).
Further, this notion of ongoing learning to teach underpins the evolving work of the Australian Institute of
Teaching and School Leadership in relation to the Australian Teacher Performance and Development Framework
(Australian Institute for Teaching and School Leadership, 2012). Both the LTEWS surveys and the follow-up
interviews provide evidence to show that the majority of graduates understand the importance of their initial
teacher education in providing them with the necessary knowledge and skills to enter the profession as effective
beginning teachers, but they also acknowledged that their professional learning and growth continued during their
first years of teaching. It is therefore important that teacher educators work collaboratively with employers and
jurisdictions in helping to bridge pre-service teacher education and beginning teaching in order to assist smooth
transitions into the profession and ongoing professional learning.
Longitudinal Teacher Education and Workforce Study (LTEWS) Final Report
228
This concluding chapter of the report provides discussion of the findings in the areas of focus for the project: i) the
relevance and effectiveness of teacher education; and ii) the career progression of new teachers. It also considers
future research possibilities based on the conduct of and findings from LTEWS.
Pre-service Teacher Education
Over 75 per cent of the graduates who had gained teaching employment at the time of the surveys said they
would recommend their teacher education program to someone else, while two-thirds of the new graduates who
had not been successful in gaining employment as a teacher said they would recommend their teacher education
program. The data show that graduate teachers with a teaching position were more positive about their initial
teacher education than those without a teaching position.
Entry to and exit from teacher education
There is currently considerable public debate over who should enter the teaching profession, with a particular
focus on Australian Tertiary Admission Rank (ATAR) scores. While higher ATAR scores of entrants into teacher
education is certainly desirable, it must be noted that ATAR as a measure of entry is only relevant for a percentage
of those entering teacher education programs, that is, school leavers commencing undergraduate programs. For
example, the Australian Institute of Teaching and School Leadership (2013) found that 60 per cent of students who
entered undergraduate teacher education courses in 2011 did so based on entry requirements other than an ATAR.
In LTEWS, about three-quarters of graduates did not enter their teacher education program directly from
secondary school, and more than half had other qualifications before entering teacher education. The capacity of
mature age graduates to reflect critically on their professional practice became very apparent in the interviews,
showing the potential of such people to contribute to the profession.
As the ‘Mapping of Initial Teacher Education Programs in Australia in 2011’ report (See Appendix 1) shows, teacher
education providers use a variety of measures such as portfolios, written statements, previous qualifications, work
history, interviews and so on, to make decisions about admission into teacher education programs, thus
accommodating the variety of prior experiences that prospective teachers bring to teacher education.
It has been argued that student learning can be enhanced where the profile of the teaching workforce reflects in
some way the diversity of the school student population. Forty-two per cent of LTEWS graduate teacher
respondents identified as the first in their family to gain a tertiary qualification. Many current and recent policies
are aimed at career changers entering teaching. Thus, the importance of selection procedures that continue to
build a diverse teaching workforce is highlighted.
While it is important to examine more closely the value and effectiveness of various mechanisms used to select
teacher education applicants, it is also important to note that the new nationally-framed regulation system for
accreditation of teacher education includes an increased emphasis on outcomes and the need for graduates from
teacher education to be able to provide evidence that they have the requisite professional knowledge, practice
and engagement capabilities for beginning teaching as outlined in the Australian Professional Standards for
Graduates (Australian Institute of Teaching and School Leadership, 2011c). Attention to the outcomes of teacher
education (that is, to the graduates and their capabilities) is relevant when considering the quality of the teaching
profession, and positioning of it within a system for teacher evaluation across all professional stages of a teaching
career (see for example, Darling-Hammond, 2006a, 2013; Darling-Hammond, Newton, & Chung Wei, 2012; Darling-
Hammond, Newton, & Wei, 2010).

Longitudinal Teacher Education and Workforce Study (LTEWS) Final Report
229
Length and level of qualification
In LTEWS, one-year prepared teachers reported feeling less prepared for teaching by their teacher education
programs in knowing students and how they learn, knowing the content and how to teach it, and in literacy and
numeracy, when compared to other program types. Moreover, those with two-year graduate teacher education
qualifications planned to move into leadership positions early in their careers. Taken together, these findings
suggest support for the recent decision of the Standing Council on the new accreditation requirement for two-year
graduate entry programs. However, length of program by itself is not a guarantee of quality of either the program
or the graduating teachers. Moreover, other issues identified by the Productivity Commission (2012), such as the
impact on teacher supply, must be considered along with their recommendations that some evaluation of two-
year programs be undertaken to inform the implementation of this new program standard.
Content
Even though the Australian Professional Standards for Teachers (Australian Institute of Teaching and School
Leadership, 2011c) were not in place for the programs in which the LTEWS cohort studied, graduates generally felt
prepared and effective in relation to these standards. In particular, graduates reported feeling well prepared to
‘Know students and how they learn’, ‘Plan for and implementing effective teaching and learning’ and “Engage in
professional learning’. Graduates felt most effective in ‘Knowing students and how they learn’, ‘Knowing the
content and how to teach it’, ‘Planning for and implementing effective teaching and learning’ and ‘Creating and
maintaining supportive and safe learning environments’. The principals generally endorsed the assessments of
teacher graduates about their effectiveness in relation to the standards, but they had more positive perceptions of
the effectiveness of graduates than the graduates themselves to ‘Plan for and implement effective teaching and
learning’.
However, the following two standards are clearly of concern: ‘Engage professionally with colleagues,
parents/carers and the community’, and ‘Assess, provide feedback and report on student learning’. Graduates felt
least prepared and least effective in these areas. Principals also highlighted engagement with parents, families and
communities as one of the key challenges that they believed beginning teachers faced.
In relation to the other specified teaching areas in this study, graduates felt least prepared in the area of ‘Teaching
culturally, linguistically and socio-economically diverse learners’. Only slightly more felt prepared in the other two
specified areas ‘Use of ICT’ and ‘Literacy and numeracy’. Less than a third of the graduates and providers indicated
‘Teaching culturally, linguistically and socio-economically diverse learners’ as a distinguishing feature of their
teacher education programs. This seems to be an area requiring more attention in teacher education programs. It
is worth noting, however, that in surveys and interviews graduates recorded experiencing significant professional
learning in ‘Teaching culturally, linguistically and socio-economically diverse learners’ during their first year of
employment.
Principals identified beginning teachers’ main challenges as classroom management, pedagogy and catering for
diverse learners, with poor teaching skills and classroom management as the most common cause of a difficult
transition into teaching. However, they also noted lack of school support and induction, lack of
interpersonal/communication skills, and lack of adequate teacher preparation as important factors.
Thus, LTEWS findings provide much guidance for improving teacher preparation. It is noted however that LTEWS
graduate teacher respondents rated their effectiveness in many areas more highly than their sense of
preparedness. Moreover, survey and interview findings indicated that graduates recognised the frame of reference
Longitudinal Teacher Education and Workforce Study (LTEWS) Final Report
230
that their teacher education program provided for early career teaching. At the same time, they acknowledged the
ongoing professional learning and development in schools as they continually built upon their skills and knowledge
to effectively enact their roles and responsibilities in schools. This reflects a socialisation into the profession that is
well documented in the research literature (e.g. Cherubini, 2009; Feiman-Nemser, 2001; Zeichner & Gore, 1990)
and the importance of consolidating initial teacher preparation with adequate support, development and learning
provided to graduates in their initial teaching years.
In addition, we note the power of ‘learning to practice in practice’ (Darling-Hammond, 2010) which requires
actually being in a specific context for that practice – in fact, in a range of specific contexts over time. For example,
graduates talked about their developing competence in ‘Teaching culturally, linguistically and socio-economically
diverse learners’ during the first year and a half after graduation, as they worked in specific culturally, linguistically
and socio-economically diverse learning contexts. Thus, it is important for teacher education providers and
employers to work together to identify the abilities and capabilities relevant for each phase of a teaching career,
particularly those for beginning teaching.
This is not to suggest that some areas should not be focused on in teacher education. After all, graduates are fully
responsible for the learning of all students in their classes, in the same way as experienced teachers. Rather, the
findings support close examination and clear articulation of the developing knowledge and skills across the four
professional stages of a teaching career – Graduate, Proficient, Highly Accomplished and Lead – as outlined in the
Australian Professional Standards for Teachers. It is important that explicit attention be given in teacher education
accreditation (Australian Institute of Teaching and School Leadership, 2011a) to what graduate teachers need to
know and be able to do for effective beginning teaching, and that this is articulated with ongoing professional
learning opportunities designed to develop the knowledge and skills expected at progressive stages of a teaching
career. Teacher education content and processes, including the practicum, should ensure a solid foundation for
this growth and development as well as a smooth transition into teaching and effective beginning teaching.
However, LTEWS findings do support a view that teacher education programs must give specific attention to ways
in which graduate teachers are prepared to (i) engage professionally with colleagues, parents/carers and the
community, (ii) teach culturally, linguistically and socio-economically diverse learners, and (iii) assess, provide
feedback and report on student learning (particularly in programs preparing primary teachers).
Practicum and internships
There is general consensus in research and various reviews of teacher education that the practicum is a significant
and valued part of learning to teach. Graduates in this study were clearly of the view that the skills they gained
during their practicum were relevant and important for teaching. They felt that their practicum experiences were
more relevant in preparing them for their current teaching contexts than their university-based units, though they
also acknowledged the importance of university-based learning. Free text and interview responses indicated that
graduates and principals valued a practicum program involving a combination of a 1-2 days per week model, block
placements and culminating in an internship transiting into professional practice. Graduates and principals noted
the value of internships and extended periods of time in schools towards the end of a teacher education program
to support transition into full-time teaching.
Survey and interview responses identified the need for stronger linkages between content, theory and application
in their teacher education. Graduates saw the practicum as a vitally important context for applying the theories
and knowledge developed in university-based settings. This is particularly crucial in light of the need to increase
their capacities in the three identified main areas of concern: ‘Engaging professionally with colleagues,
parents/carers and the community’, ‘Teach culturally, linguistically and socio-economically diverse classrooms’,

Longitudinal Teacher Education and Workforce Study (LTEWS) Final Report
231
and ‘Assess, provide feedback and report on student learning’. Graduates’ responses indicated the value of quality
practical experiences in a range of diverse settings and strong school-university partnership programs to
strengthen practical knowledge and skills. The interview findings showed that graduates’ recognised the
importance of quality practicum experiences and placement supervision in fostering an increased awareness of
their roles and participation in schools, through observation of good practices and working closely with colleagues
and mentors.
As the Mapping report shows, there is considerable variation of practicum processes and structures across teacher
education providers and programs (See Appendix 1). This mapping showed teacher education program providers’
commitment towards school-university partnerships, with some developing partnerships with schools or school
clusters in remote or international communities to provide teacher education students with practical experiences
in a range of settings. However, the findings in this study showed that only about 30 per cent and 20 per cent of
graduates indicated ‘School linkages’ and ‘Community-based learning’ as distinguishing features of their teacher
education program respectively. The graduate teachers provided a similar picture of their teacher education
program. This is clearly an area needing further attention. Given the importance of the practicum and the fact that
learning to teach occurs in multiple places, strong partnerships between schools and universities must reflect a
common purpose with respect to the professional learning of teacher education students, including the
specification of differentiated but complementary roles and responsibilities of the partners. These partnerships
provide a basis for stronger linkages between content, theory and application in teacher education and thus
improve the quality of the practicum experience.
As with earlier studies, many teacher education providers contacted for the mapping activity highlighted financial
and structural constraints, such as the cost of providing practicum and placement shortages, that impact on the
provision for practicum experience within teacher education programs. We note that past reviews have made
repeated calls for greater investments in building school-university partnerships in teacher education programs to
bridge theory and practice (Caldwell & Sutton, 2010; House of Representatives Standing Committee on Education
and Vocational Training, 2007; Ramsey, 2000). This would appear to be an issue that still needs attention.
Beginning Teaching and Career Establishment
Graduates in this study wanted to teach for altruistic reasons (to make a difference, or to work with children) and
to work in a subject area or specialisation of interest. While a majority moved into teacher employment after
graduation, only a fifth commenced teaching on a permanent basis. Employers and principals seem to like the
flexibility this affords their workforce planning as well as the opportunity to ascertain the quality of a graduate
before taking them on full time.
However, for the LTEWS cohort, casual or relief employment seemed to hinder their professional learning and
career progression. Those with a full-time position and more classroom experience were able to avail themselves
of professional learning opportunities and felt that they were becoming increasingly effective. Many graduates
employed on short-term contracts, in relief positions, or casually, did not receive any support in their first year of
teaching. This was identified by them in interviews as a particular challenge to their ongoing professional learning
and transition into the profession.
Principals reported that the most common form of school support provided to new graduate teachers was ongoing
professional learning opportunities. Graduates considered this type of support was the most effective to them as
an early career teacher, followed by an informal mentor arrangement. However, while almost all principals

Longitudinal Teacher Education and Workforce Study (LTEWS) Final Report
232
identified induction programs as available in their schools, about a quarter of graduate teachers identified this as
not available in their schools.
The graduates who were tracked in this study were not very mobile. Many stayed to teach in the state or territory
in which they completed their teacher preparation program. Moreover, this was often in the area in which they
lived prior to their teacher preparation, or one that was very similar. Over the survey period a majority stayed
teaching in their initial school into their second year of teaching, with attrition being higher than average in schools
in outer regional and very remote areas.
More than three-quarters of the graduates were teaching in their area of specialisation, especially those teaching
mathematics, science, technology, special needs and LOTE. Graduate teachers with specialist qualifications in
society and the environment, the arts and health and physical education were least likely to be teaching in their
specialist areas.
Three-quarters of principals agreed that they liked to employ graduate teachers, although many did not have the
available vacancies. Graduates were attracted to their schools because of a better location and accessibility,
reputation for performance or use of technologies, size and newness, and partnership arrangement with
universities. Graduates considered that the most effective types of school support were ongoing professional
learning opportunities and informal mentor arrangements.
Most new graduates who were teaching saw themselves either teaching or in leadership positions in three years.
Very few planned to leave the education sector altogether during that time. Future plans were mediated by their
teaching employment status during the first 12-18 months of teaching. Nearly all graduates who were not teaching
had other employment, with many working in the education sector more broadly. Employment outside teaching
rose significantly in the first year after graduation. In particular, the data shows that graduates with masters
degrees taking employment outside teaching almost doubled over this period.
Further Research
Successive government inquiries into teacher education have recommended large-scale research projects
investigating the value of teacher education (e.g. Education and Training Committee, 2005). The recent
Productivity Commission (2012) recommended that the Australian Government support a study to:
follow graduate teachers for at least five years
track more than one cohort of graduate teachers to enable analysis of any future experimentation in pre-
service training, induction and professional development
include additional measures of teacher effectiveness
gather detailed information on the induction and mentoring arrangements that graduate teachers
undertake
collect information on what factors influence where graduate teachers seek initial employment, and why
early-career teachers leave their initial place of employment. (p.29)
A study such as the LTEWS can provide valuable data and analysis to inform these issues. Even though aiming to be
longitudinal, the funding timeframe meant that the graduates were only followed for a little over one year after
graduation. Moreover, the response rates, while adequate to make the various claims reflected in this report, were
such that in some instances deeper analysis of relationships and connections between variables was not possible.

Longitudinal Teacher Education and Workforce Study (LTEWS) Final Report
233
The only other large scale and longitudinal empirical investigation into the effectiveness of teacher education that
has been attempted in Australia (Louden et al., 2010), had to be abandoned due to very low response rates. Survey
fatigue is a very real issue and has, we believe, had an impact on the response rate, especially given that, for
LTEWS alone, graduates were invited to complete three surveys in 12 calendar months. At the same time,
regulatory authorities and employers were also surveying these graduates, attempting to answer similar questions
about teacher education and beginning teaching. One survey a year to which all stakeholders have input and
access may be a possibility to reduce the survey demands on early career teachers.
Another issue needing attention is accurately mapping the components and dimensions of teacher education. The
‘Mapping of Initial Teacher Education Programs in Australia in 2011’ report (See Appendix 1) noted the difficulty of
accessing and validating the dimensions of programs, brought about as much by the constant changes to programs
and the availability of information and personnel who might validate that information, as by a lack of consistency
and comparability in the terminology used to describe the features or dimensions of initial teacher education. The
Australian Institute for Teaching and School Leadership’s data report (2013) was compiled from publicly available
information, but LTEWS sought to examine the dimensions of programs in much more depth and link that
information to the data collected in the surveys and the telephone interviews with graduates. This kind of work is
needed to fully understand issues of effectiveness and preparation.
While LTEWS has provided evidence to further understand the value and effectiveness of teacher education in
Australia, there is scope for more work. It is generally agreed that impact on student learning is an important
outcome for teacher education, and there are a range of ways this can be measured. LTEWS has addressed these
questions of effectiveness and impact on student learning by drawing on perceptions – perceptions of the
graduate teachers about their effectiveness and influence on students’ learning as well as the perceptions of their
principals. In the US, value-added models have been used in some states to examine such questions. However
many researchers have challenged these approaches (see for example, Cochran-Smith et al., 2012; Darling-
Hammond & Youngs, 2002; Kennedy, Ahn, & Choi, 2008). Further work is needed to fully understand ‘effectiveness’
and ‘impact on student learning’ in the range of diverse contexts in which new teachers commence their teaching
career (see for example, D. J. Boyd, Grossman, Lankford, Loeb, & Wyckoff, 2009; Grossman et al., 2010), and to
incorporate the range of measures suggested by the Productivity Commission report (2012).
LTEWS has clearly shown that it is not possible to investigate issues about the value and effectiveness of teacher
preparation without conceptualising it within a ‘learning to teach’ continuum and the prospect of ongoing
professional growth. This is not a new realisation for researchers investigating the effectiveness of teacher
education. For example, in the Netherlands, Brouwer and Korthagen (2005) conducted a 4.5 year longitudinal
study with 357 pre-service teachers, 128 co-operating teachers, and 31 university supervisors from 24 graduate
teacher education programs using quantitative survey data, as well as in-depth qualitative data collected over a
period of 4.5 years. The study was designed to evaluate effects of a program intended to improve the integration
of theoretical and practical learning, but had the unanticipated consequence of demonstrating that variables
relating to school context had a larger impact on the formation of new teachers than the program effects they
were attempting to document. In the UK, the six-year longitudinal Becoming a Teacher (BaT) study (Hobson et al.,
2009) set out to explore beginner teachers’ experiences of initial teacher training (ITT), induction and
early professional development in England. They similarly found the crucial importance of the school context with
respect to the graduates’ capacity to engage in ongoing professional learning. Like these studies, LTEWS has shown
the value of a mixed-methods approach that draws together large-scale quantitative data collection methods and
small-scale qualitative interviews as part of a cohesive research design. By utilising this mixed-methods approach,
it became possible to arrive at a deeper understanding of early career teachers’ movements from graduation into
the teaching workforce, and how this experience might be linked to their pre-service teacher education programs.

Longitudinal Teacher Education and Workforce Study (LTEWS) Final Report
234
We suggest that further longitudinal large-scale mixed-methods research be undertaken, drawing on the
methodologies and data of this project, and recommendations of the Productivity Commission. This could be a
comprehensive national research program, following pre-service teachers from the beginning of their enrolment in
teacher education and then into the first three to five years of teaching incorporating a range of measures of
effectiveness of teacher education and its impact on student learning. Stakeholders, including employers,
regulatory authorities and teacher education providers, could reduce the survey burden placed on principals and
graduate teachers by implementing one survey per year nationally that everyone supports and draws from.
Longitudinal Teacher Education and Workforce Study (LTEWS) Final Report
235
6. References Ashiedu, J. A., & Scott-Ladd, B. D. (2012). Understanding teacher attraction and retention drivers: Addressing
teacher shortages. Australian Journal of Teacher Education, 37(11). http://dx.doi.org/10.14221/ajte.2012v37n11.1
Australian Association of Mathematics Teachers. (2006). Standards for Excellence in Teaching Mathematics in Australian Schools. Adelaide, SA: The Australian Association of Mathematics Teachers Inc.
Australian Bureau of Statistics. (2011a). Australian Census. Canberra: Australian Bureau of Statistics. Australian Bureau of Statistics. (2011b). Schools, Australia 2011 (Cat No. 4221.0).
http://www.abs.gov.au/AUSSTATS/[email protected]/mf/4221.0/ Australian Education Union. (2009). New Educators Survey 2008. Results and Report Retrieved from
http://www.aeufederal.org.au/Publications/2009/Nesurvey08res.pdf Australian Institute for Teaching and School Leadership. (2012). Australian Teacher Performance and Development
Framework. Carlton, Victoria: Education Services Australia. Australian Institute for Teaching and School Leadership. (2013). Initial Teacher Education: Data Report. Melbourne:
Education Services Australia. Australian Institute of Teaching and School Leadership. (2011a). Accreditation of initial teacher education programs
in Australia: Standards and Procedures. Carlton, Victoria: Ministerial Council for Education, Early Childhood Development and Youth Affairs (MCEECDYA).
Australian Institute of Teaching and School Leadership. (2011b). National Professional Standard for Principals. Carlton, Victoria: Ministerial Council for Education, Early Childhood Development and Youth Affairs (MCEECDYA).
Australian Institute of Teaching and School Leadership. (2011c). National Professional Standards for Teachers. Carlton, Victoria: Ministerial Council for Education, Early Childhood Development and Youth Affairs (MCEECDYA).
Ayres, L., Kavanaugh, K., & Knafl, K.A. (2003). Within-case and across-case approaches to qualitative data analysis. Qualitative Health Research, 13(6), 871-883.
Ball, D.L., & Cohen, D.K. (1999). Developing practice, developing practitioners: Toward a practice-based theory of professional education. In L. Sykes & L. Darling-Hammond (Eds.), Teaching as the learning profession: Handbook of policy and practice (pp. 3-32). San Francisco: Jossey-Bass.
Ballantyne, R., Thompson, R., & Taylor, P. (1998). Principals' conceptions of competent beginning teachers. Asia-Pacific Journal of Teacher Education, 26(1), 51-64.
Barber, M., & Mourshed, M. (2007). How the world’s best-performing school systems come out on top. McKinsey & Company. Retrieved from http://mckinseyonsociety.com/downloads/reports/Education/Worlds_School_Systems_Final.pdf
Bartell, C. (2004). Cultivating High-Quality Teaching through Induction and Mentoring. Thousand Oaks: Corwin Press.
Boyd, D., Grossman, P., Lankford, H., Loeb, S., & Wyckoff, J. (2006). How changes in entry requirements alter the teacher workforce and affect student achievement. Education Finance and Policy, 1(2), 176-216.
Boyd, D. J., Grossman, P., Lankford, H., Loeb, S., & Wyckoff, J. (2009). Teacher preparation and student achievement. Educational Evaluation and Policy Analysis, 31(4), 416-440.
Boyd, D., Lankford, H., Loeb, S., Rockoff, J., & Wyckoff, J. (2007). The narrowing gap in New York City teacher qualifications and its implications for student achievement in high-poverty schools (CALDER Working Paper 10) Retrieved from http://www.caldercenter.org/PDF/1001103_Narrowing_Gap.pdf
Boyd, D., Lankford, H., Loeb, S., Rockoff, J., & Wyckoff, J. (2008). The narrowing gap in New York City teacher qualifications and its implications for student achievement in high poverty schools. (Working Paper 14021). Cambridge, MA: National Bureau of Economic Research.
Boyd, D.J., Grossman, P., Lankford, H., Loeb, S., Michelli, N.M., & Wyckoff, J. (2006). Complex by design: Investigating pathways into teaching in New York city schools. Journal of Teacher Education, 57(2), 155-166.
Britzman, D. (1986). Cultural myths in the making of a teacher: Biography and social structure in teacher education. Harvard Educational Review, 56(4), 442-456.

Longitudinal Teacher Education and Workforce Study (LTEWS) Final Report
236
Brouwer, N., & Korthagen, F. (2005). Can teacher education make a difference? American Education Research Journal, 42(1), 153-224.
Caldwell, B., & Sutton, D. (2010). Review of teacher education and school induction. Brisbane: Department of Education and Training, Queensland Government.
Cherubini, L. (2009). Reconciling the tensions of new teachers' socialisation into school culture: A review of the research. Issues in Educational Research, 19(2), 83-99.
Cochran-Smith, M. (2003). Learning and unlearning: the education of teacher educators. Teaching and Teacher Education, 19, 5-28.
Cochran-Smith, M. (2004). Stayers, leavers, lovers, and dreamers: Insights about teacher retention. Journal of Teacher Education, 55(5), 387-392.
Cochran-Smith, M., McQuillan, P., Mitchell, K., Gahlsdorf Terrell, D., Barnatt, J., D'Souza, L., . . . Gleeson, AM. (2012). A longitudinal study of teaching practice and early career decisions: A cautionary tale. American Educational Research Journal, 49(5), 844-880.
Cochran-Smith, M., & Zeichner, K (Eds.). (2005). Studying Teacher Education: The Report of the AERA Panel on Research and Teacher Education. Mahwah, NJ: Lawrence Erlbaum Associates.
Committee for the Review of Teaching and Teacher Education. (2003). Australia's Teachers: Australia's Future. Advancing Innovation, Science, Technology and Mathematics. Canberra: Commonwealth of Australia.
Conway, P., Murphy, R., Rath, A., & Hall, K. (2009). Learning to teach and its implications for the continuum of teacher education: A nine-country cross-national study. Ireland: Teaching Council.
Creswell, J. W. (2009). Research Design: Qualitative, Quantitative and Mixed Method Approaches (3rd ed.). Thousand Oaks, CA: Sage.
Darling-Hammond, L. (2000). Teacher Quality and Student Achievement: A review of state policy evidence. Education Policy Analysis Archives, 8(1), Retrieved August 2005 from
http://epaa.asu.edu/epaa/v2008n2001.html. Darling-Hammond, L. (2003). Access to quality teaching: An analysis of inequality in California’s public schools.
Santa Clara Law Review, 43, 101-239. Darling-Hammond, L. (2006a). Assessing teacher education: The usefulness of multiple measures for assessing
teacher outcomes. Journal of Teacher Education, 57(2), 120-138. Darling-Hammond, L. (2006b). Powerful Teacher Education: Lessons from exemplary programs. San Francisco:
Jossey-Bass. Darling-Hammond, L. (2009). Educational opportunity and alternative certification: New evidence and new
questions. SCOPE Policy Brief No.1, Stanford Center for Opportunity Policy in Education. Darling-Hammond, L. (2010). Teacher education and the American future. Journal of Teacher Education, 61(1-2),
35-47. Darling-Hammond, L. (2013). Getting teacher evaluation right: What really matters for effectiveness and
improvement. New York: Teachers College Press. Darling-Hammond, L., Banks, J., Zumwalt, K., Gomez, L., Sherin, M., Griesdorn, J., & Finn, L. (2005). Educational
goals and purposes: Developing a curricular vision for teaching. In L. Darling-Hammond & J. Bransford (Eds.), Preparing Teachers for a Changing World: What teachers should learn and be able to do (pp. 169-200). San Francisco, CA: Jossey Bass.
Darling-Hammond, L., & Bransford, J. (Eds.). (2005). Preparing Teachers for a Changing World: What teachers should learn and be able to do. San Francisco, CA: Jossey-Bass.
Darling-Hammond, L., Newton, S., & Chung Wei, R. (2012). Developing and Assessing Beginning Teacher Effectiveness: The Potential of Performance Assessments. Stanford University, Palo Alto, CA: Stanford Center for Opportunity Policy in Education (SCOPE).
Darling-Hammond, L., Newton, X., & Wei, Ruth Chung. (2010). Evaluating teacher education outcomes: a study of the Stanford Teacher Education Programme. Journal of Education for Teaching, 36(4), 369-388.
Darling-Hammond, L., & Youngs, P. (2002). Defining "highly qualified teachers" : What does "scientifically-based research" actually tell us. Educational Researcher, 31(9), 13-25.
Department of Education (DfE). (2010). The Case for Change. London: DfE. Department of Industry, Innovation, Science, Research and Tertiary Education (DIIRSTE). (2011). Student 2010 Full
Year: Selected Higher Education Statistics. http://www.innovation.gov.au/highereducation/HigherEducationStatistics/StatisticsPublications/Pages/Staff.aspx

Longitudinal Teacher Education and Workforce Study (LTEWS) Final Report
237
Dobozy, E. (2008). Alternative pathway entry students show promising start in teacher education. Paper presented at the Australian Association for Research in Education Conference, Brisbane AU.
Donaldson, G. (2010). Teaching Scotland's Future: Report of a review of teacher education in Scotland. Edinburgh: Scottish Government.
Education and Training Committee. (2005). Step Up, Step In, Step Out: Report on the Inquiry into the Suitability of Pre-Service Teacher Training in Victoria, . Melbourne: Parliament of Victoria.
Education and Training Committee. (2006). Inquiry into the promotion of mathematics and science education. Melbourne: Parliament of Victoria.
Edwards, A., & Mutton, T. (2007). Looking forward: Rethinking professional learning through partnership arrangements in Initial Teacher Education. Oxford Review of Education, 33(4), 503-519.
Eide, E., Goldhaber, D., & Brewer, D. (2004). The teacher labour market and teacher quality. Oxford Review of Economic Policy, 20, 230-244.
Elmore, R. F. (2002). Bridging the gap between standards and achievement: The imperative for professional development in education. Washington, DC: Albert Shanker Institute.
Feiman-Nemser, S. (2001). From preparation to practice: Designing a continuum to strengthen and sustain teaching. Teachers College Record, 103(6), 1013-1055.
Finger, G., Jamieson-Proctor, R., Cavanagh, R., Albion, P., Grimbeek, P., Bond, T., . . . Lloyd, M. (2012). Teaching Teachers for the Future (TTF) Project: Summary of the key findings. Paper presented at the ACEC2012: ITs Time Conference, Perth Australia.
Frijters, P., Shields, M., & Wheatley Price, S. (2004). To teach or not to teach? Panel data evidence on the quitting decision IZA, Discussion Paper no. 1164. Bonn: Study of Labor (IZA)
Gale, T., & Mills, C. (2013). Creating spaces in higher education for marginalised Australians: Principles for socially inclusive pedagogies. Enhancing Learning in the Social Sciences, 5(2), 7-19.
Grossman, P. (2005). Research on pedagogical approaches in teacher education. In M. Cochran-Smith & K. Zeichner (Eds.), Studying teacher education: The report of the AERA panel on research and teacher education (pp. 425-476). Mahwah, NJ: Lawrence Erlbaum Associates.
Grossman, P., Loeb, S., Cohen, J., Hammerness, K., Wyckoff, J., Boyd, D., & Lankford, H. (2010). Measure for Measure: The Relationship between Measures of Instructional Practice in Middle School English Language Arts and Teachers’ Value-Added Scores Working Paper 45. Washington, D.C.: Center for Analysis of Longitudinal Data in Education Research (CALDER),.
Hanushek, E., Kain, J., & Rivkin, S. (1999). Do higher salaries buy better teachers? . National Bureau of Economic Research, Working Paper no. 7082. http://www.nber.org/papers/w7082.pdf
Hanushek, E., Kain, J., & Rivkin, S. (2004). Why Public Schools Lose Teachers. The Journal of Human Resources, 39(2), 326-354.
Harris, K.L., & Jensz, F. (2006). The Preparation of Mathematics Teachers in Australia: Meeting the demand for suitably qualified mathematics teachers in secondary schools. Report prepared for the Australian Council of Deans of Science Retrieved from http://www.acds.edu.au/docs/Prep_Math_Teach_Aust.pdf
Hobson, A.J., Malderez, A., Tracey, L., Homer, M.S., Ashby, P., Mitchell, N., . . . Tomlinson, P.D. (2009). Becoming a Teacher: Teachers' experiences of initial teacher training, Induction and early professional development (Final report). Nottingham: Department for Children, Schools and Families (DCSF).
House of Representatives Standing Committee on Education and Vocational Training. (2007). Top of the Class: Report on the inquiry into teacher education. Canberra: The Parliament of the Commonwealth of Australia.
Imazeki, J. (2005). Teacher salaries and teacher attrition. Economics of Education Review, 24(4), 431-449. Ingersoll, R. . (2004). Teacher shortages and educational inequality. Unpublished manuscript. Ingersoll, R., Merrill, L., & May, H. (2012). Retaining teachers: How preparation matters. Educational Leadership,
May 2012. Ingersoll, R., & Perda, D. (2010). How high is teacher turnover and is it a problem? Consortium for Policy Research
in Education. Philadelphia: University of Pennsylvania. Ingersoll, R.M. (2001). Teacher turnover and teacher shortages: An organizational analysis. American Educational
Research Journal, 38(3), 499–534.

Longitudinal Teacher Education and Workforce Study (LTEWS) Final Report
238
Ingvarson, L., Beavis, A., & Kleinhenz, E. (2004). Teacher Education Courses in Victoria: Perceptions of their effectiveness and factors affecting their impact. Victorian Institute of Teaching Future Teachers Project Retrieved from http://research.acer.edu.au/teacher_education/4
Kazemi, E., Franke, M. L., & Lampert, M. (2009). Developing pedagogies in teacher education to support novice teachers' ability to enact ambitious instruction. Paper presented at the Crossing divides (Proceedings of the 32nd annual conference of the Mathematics Education Research Group of Australasia), Palmerston North, NZ.
Kennedy, M.M., Ahn, S., & Choi, J. (2008). The value added by teacher education. In M. Cochran-Smith, S. Feiman-Nemser & J. McIntyre (Eds.), Handbook of research on teacher education: Enduring issues in changing contexts (3rd ed., pp. 1247–1272). Mahwah, NJ: Lawrence Erlbaum.
Kreig, J. (2004). Teacher quality and attrition. Economics of Education Review, 25(1), 13-27. Kruger, T., Davies, A., Eckersley, B., Newell, F., & Cherednichenko, B. (2009). Effective and sustainable university-
school partnerships: Beyond determined efforts by inspired individuals. Canberra: Teaching Australia. Le Cornu, R. (2010). Socially sustainable teacher education: Relationships matter. Paper presented at the Australian
Teacher Education Association Conference, Townsville, Qld. Le Cornu, R., & Ewing, R. (2008). Reconceptualising professional experiences in pre-service teacher
education/reconstructing the past to embrace the future. Teaching and Teacher Education, 24(7), 1799-1812.
Louden, W., Heldsinger, S., House, H., Humphry, S., & Darryl Fitzgerald, D. (2010). Learning from Teacher Education: The Impact of Teacher Education on Knowledge of Literacy and Mathematics Teaching. Study of Effective Teacher Education: Progress Report 2. Canberra: Australian Institute for Teaching and School Leadership (AITSL).
McKenzie, P., Kos, J., Walker, M., Hong, J., & Owen, S. (2008). Staff in Australia’s Schools 2007. Melbourne: Australian Council for Educational Research.
McKenzie, P., Rowley, G., Weldon, P. R., & Murphy, M. (2011). Staff in Australia’s Schools 2010. Melbourne: Australian Council for Educational Research.
McLaughlin, C., & Black-Hawkins, K. (2007). School-university partnerships for educational research - distinctions, dilemmas and challenges. The Curriculum Journal, 18(3), 327-341.
Menter, I., Hulme, M., Elliot, D., & Lewin, J. (2010). Literature Review on Teacher Education in the Twenty-First Century. Edinburgh, Scotland: Education Analytical Services, Schools Research, Scottish Government.
Murnane, R.J., & Steele, S.L. (2007). What is the problem? The challenge of providing effective teachers for all children. The Future of Children, 17(1), 15-43.
Organisation for Economic Co-operation and Development (OECD). (2013). Teacher and Learning International Survey TALIS 2013, Conceptual Framework. Paris: OECD.
Organization for Economic Cooperation & Development (OECD). (2005). Attracting, developing and retaining effective teachers. Final report – Teachers matter. Paris: OECD Publishing.
Organization for Economic Cooperation & Development (OECD). (2009). Creating Effective Teaching and Learning EnvironmentsL: First Results from TALIS (Teaching And Learning International Survey). Paris: OECD Publishing.
Productivity Commission. (2012). Schools Workforce, Research Report. Canberra. Putnam, R. T., & Borko, H. (2000). What do new views of knowledge and thinking have to say about research on
teacher learning? Educational Researcher, 29(1), 4-15. Ramsey, G. (2000). Quality matters: Revitalising teaching, critical times, critical choices. Report of the Review of
Teacher Education, New South Wales. Sydney: NSW Department of Education and Training. Richardson, P., & Watt, H. (2006). Who Chooses Teaching and Why? Profiling Characteristics and Motivations
across Three Australian Universities. Asia-Pacific Journal of Teacher Education, 34(1), 27-56. Rivkin, S., & Hanushek, E. (2005). Teachers, schools and academic achievement. Econometrica, 73(2), 417-458. Sahlberg, P. (2011). Finnish lessons: What can the world learn from educational change in Finland? New York, N.Y.:
Teachers College Press. Schleicher, A. (2011). Building a High-Quality Teaching Profession: Lessons from around the World. Paris: OECD
Publishing. Schleicher , A. (Ed.). (2012). Preparing Teachers and Developing School Leaders for the 21st Century: Lessons from
around the world. Paris: OECD Publishing.

Longitudinal Teacher Education and Workforce Study (LTEWS) Final Report
239
Smithers, A., & Robinson, P. (2003). Factors affecting teachers’ decisions to leave the profession. Department for Education and Skills, Research Report No. 430.
Stake, R. E. (1995). The Art of Case Study Research. Thousand Oaks, CA: Sage Publications. State of Victoria (Department of Education and Early Childhood Development). (2012). 2010 - 2011 Teacher Supply
and Demand Report. For the Victorian Teacher Supply and Demand Reference Group. Melbourne: Department of Education and Early Childhood Development.
Stinebrickner, T. (2001). A dynamic model of teacher labor supply. Journal of Labor Economics, 19(1), 196-230. Teese, R. V., & Polesel, J. (2003). Undemocratic Schooling: Equity and quality in mass secondary education in
Australia. Carlton, Vic: Melbourne University Publishing. Tranter, D., Murdoch, L., & Saville, D. (2007). ‘Bonus points are the only reason I’m at UniSA’: Equity outreach and
higher education success. Paper presented at the Ethics and Equity: Revaluing Social Responsibility in Education EOPHEA Conference. http://www.adcet.edu.au/StoredFile.aspx?id=2038&fn=eophea+2007.pdf
U.S. Department of Education. National Center for Education Statistics. (2000). Progress through the teacher pipeline: 1992-93 college graduates and elementary/secondary school teaching as of 1997 (NCES Report No. 2000-152) by Robin R. Henke, Xianglei Chen, and Sonya Geis. Project Officer: Paula Knepper. Washington, DC: U.S. Department of Education, National Center for Education Statistics.
Vale, C. (2010). Supporting ‘out-of-field’ teachers of secondary mathematics. Australian Mathematics Teacher, 66(1), 17-24.
White, S., Bloomfield, D., & Le Cornu, R. (2010). Professional experience in new times: issues and responses to a changing education landscape. Asia-Pacific Journal of Teacher Education, 38(3), 181-193.
Wilson, S. M., Floden, R. E., & Ferrini-Mundy, J. (2001). Teacher Preparation Research: Current knowledge, gaps and recommendations. A research report prepared for the US Department of Education (pp. 85). Washington, DC: Center for the Study of Teaching and Policy.
Win, R., & Miller, P. (2005). The effects of individual and school factors on university students’ academic performance. Australian Economic Review, 38(1), 1-18.
Zeichner, K., & Gore, J. (1990). Teacher socialization. In W. R. Houston (Ed.), Handbook of research on teacher education (pp. 329-348). New York: Macmillan.