Embed Size (px)
Citation preview
Looking for work? Or looking for workers?
Days and hours of work in London construction
in the eighteenth century.
JUDY STEPHENSON
U N I V E R S I T Y O F O X F O R D
Discussion Papers in
Economic and Social History
Number 162, February 2018
1
Looking for work? Or looking for workers?
Days and hours of work in London construction in the eighteenth century.
Judy Stephenson, Wadham College, University of Oxford.
Abstract:
This paper provides new information and data on how work and pay actually
operated for skilled and semi-skilled men on large London construction projects in
the early 1700s, and for the first time, offers detailed firm level evidence on the
number of days per year worked by men. Construction workers’ working days were
bounded by structural factors of both supply and demand, men worked a far lower
number of days than has been assumed until now. This has implications for our
understanding of the ‘industrious revolution’, and industrialisation.
Key words: England; industrial revolution; industrious revolution; labour input; living
standards; wages, building craftsmen.
JEL Codes: J3, J4, J6, N33, N63
I
Building craftsmen have been the universal stand in for the ‘average’ urban skilled
worker in real wage series and macroeconomic analysis for over a century. Despite
this we have had virtually no evidence-based wage or working hours material with
which to understand the relationship between their working time and pay. This paper
uses significant new primary source material to examine real evidence of actual days
worked from an important project in the first decade of the eighteenth century.
The amount of time English workers spent working in the long eighteenth century is
at the core of the two most important narratives about pre–industrial development;
living standards, (or income), and productivity, (or labour ‘industriousness’). In terms
of living standards, the vast majority of literature has viewed economic growth and
real wage growth as correlated to the extent of treating the real wage as a proxy for
2
economic growth.1 Until now, ‘average earnings’ have been calculated by multiplying
‘day wages’ from building contractor’s bills by an assumed or estimated number of
days worked per year to determine annual income.2 This is compared to the prices of
a basket of consumption goods in order to derive a real wage. Since the inception of
such calculations in the 1930s they have thrown up a paradox. During the period of
innovation and early industrialization of the eighteenth century in England, especially
in the latter half, the real wage declined dramatically. Nominal wages did not
increase, but prices of consumption goods did.3 The paradox has spawned a large
literature about how growth and industrialization came about, most of which has
explained away any fall in living standards through the eighteenth century by
asserting that income (real wages) rose or did not fall because workers worked more.
The latest estimates suggest the working year extend beyond 250 days before 1700.4
Traditionally, the idea that at the end of the eighteenth century the working classes
had been forced into harder labour by capitalism and factory discipline was at the core
of Thompson’s and Hobsbawm’s pessimistic view of industrialization that viewed the
irregularity of preindustrial work as tied up with the agency, rights and culture of the
artisan.5 In this view capital’s demands made labour work harder.6 Since the 1990s
‘industriousness’ has had a more positive spin, and has been thought to have started a
century earlier. Jan deVries’ ‘industrious revolution’, proposed that workers (men and
women) gave up leisure and homemaking days and hours to supply labour to the
‘market’ after 1650. The essence of the deVries thesis is that higher labour inputs,
rather than any increase in productivity, produced higher output, and that the
consumption needs of market-working-families created a demand for market goods
that was hitherto unprecedented. This demand for consumption goods created
industrialization.7
1 See Angeles, ‘Real wages and GDP’, pp.1-38 and table 3, and a full discussion in Broadberry et al,
‘British Economic Growth’, pp. 247-278 2 For this period a craftsman is assumed to have had 250 days work at 30d. giving an income of £31.25
and a labourer 250 days at 22-24d giving an income of £22.91-£25.00. For discussion of the rates see
Boulton ‘Wage Labour’, Schwarz ‘Standard of Living’, and Allen ‘Prices and Wages’. 3 Phelps Brown Hopkins, Seven centuries; Schwarz, ‘The standard of Living’, figure 1. 4 Humphries & Weisdorf, 2016 5 E. P. Thompson, 'Time, Work-Discipline, and Industrial Capitalism', pp.56-97. 6 Also see Clark, ‘Factory discipline’ 7 Jan De Vries, The Industrious Revolution
3
The ‘industrious revolution’ has been an influential and popular thesis but proving it
has always been difficult. Moreover, solving the declining wage paradox has been
made more complex by the fact that wage series assume that the income they depict is
representative of the average worker, there have never been any substantive examples
of working practice or data from the construction industry – where the wages have
traditionally been collected from - with the exception of Donald Woodward’s study
of building craftsmen and labourers in the northern towns. Woodward found more
seasonality and variation than is usually admitted and presented cases from the 1690s
where men worked far fewer than 200 days.8
In fact, there have only ever been two notable attempts to prove that industriousness
increased in the eighteenth century. The first, Voth’s groundbreaking use of the court
depositions of eighteenth century Londoners regarding the hours at which they went
to and left work, has been, until now the only empirical study of working hours at all
for London in the eighteenth century. Voth showed that the length of the working day
extended during the latter half of the eighteenth century, and that more Mondays were
also worked because the practice of ‘Saint’s Mondays’ declined.9 The second, Allen
and Weisdorf’s much cited 2011 paper, turned the problem of lack of hours’ or days’
evidence on its head.10 Assuming that the basket of goods constructed by Allen
(2001) is correct and robust they showed that London building workers must have
worked an increasing number of days throughout the eighteenth century to afford it.11
This empirical approach used the prices of a consumption basket to indicate the
average working year extended to as much as 270 days by the end of the eighteenth
century.
Implicit but core to the Allen and Weisdorf approach is that builder’s day wages, not
just the annual income they would have attained, are representative of average daily
income from any other occupation. In truth, there are two potential problems with this
assumption. Most early modern urban workers were not in receipt of day wages but
were paid by the piece (mostly for manufacturing), received commission and fees, or
8 Woodward Men at Work, pp. 127. 9 Voth, 'Time and Work in Eighteenth-Century London', pp. 29-58. 10 Allen and Weisdorf, 'Was There an Industrious Revolution before the Industrial Revolution? pp.
715-29. 11 Allen, ‘Prices and Wages in Southern England’; Allen, ‘The Great Divergence’, Table 1. ‘.
4
were retained for services. Records will never give us an indication of how many
hours they put in, nor effort.12 Secondly the number of days that builders did actually
work – which would have made up their actual income has always been entirely
assumed.
Further enquiry is complicated by the calculation of the working year in hours, with
the possibility alluded to by Voth that they may have been extended. However,
existing literature on construction hours has tended towards the view that hours of
work decreased rather than increased.13 Certainly, they did in the nineteenth century
as builders agitated for an eight or nine-hour day from the 1830s.14 Woodward found
most construction work in northern towns before 1750 was carried out between 6 a.m.
and 6 p.m., although there are some instances of twelve or thirteen hours worked, but
also, potentially shorter hours in winter. Tides and other units of pay were never
directly measured in hours.15 There is no record of any construction worker being
paid by the hour until 1860, and the introduction of hourly pay was associated with
increased hardship.16
Voth calculated that in the 1750s there were only 208 working days of 11 hours a day
on average, which rose in 1800, to 306 days a year of 11 hours in 1800. Much of the
difference Voth explained through the fact that Mondays (or 53 days of holy days)
were not worked by many in the mid eighteenth century, but were by 1800.17 Voth’s
evidence, sourced from London making it directly comparable, calculated 2,228 and
2,631 hours per year in 1750, rising to between 3,336 and 3,538 hours per year
between 1760 and 1800, all on the basis of an 11 hour working day.18 Voth’s
‘circumstantial’ evidence is not robust enough to say with certainty that organizations
extended work hours, and that evidence has never been offered. Moreover, there is no
evidence that hours were extended in construction, and if hours were extended there
then many types of worker were being paid less per hour in 1775 than they were in
12 Alchian and Demsetz, 1972, pp.777-795 13 See Gilboy, Wages in England, p.8 14 Postgate, pp.97, 135-6. 15 Woodward, Men at work, pp.122-127 16 Postgate, Builders History, pp.209-210 17 Voth, ‘Time and Work’, pp.35-36 18 Ibid. pp.30,46
5
1700, because nominal day rates, like those of the contractor’s bills, were
extraordinarily rigid. 19
In the last couple of years Humphries and Weisdorf have, for the first time, brought
the issue of annual contract wages to calculations of real wages.20 By calculating the
value of annual servants and contract workers board and benefits and comparing this
to the day wages of casual workers they show again, that casual workers would have
to have increased the number of days they worked to afford them. They conclude on
this basis that the working year must have been much longer much earlier than
supposed, estimating an average number of days worked of over 250 before 1700.21
However, due to lack of data they cannot draw any conclusions about working hours.
When Thompson posited an increase in working hours, he attributed it to work
discipline in factories, as capital and capitalism demanded more of labour. This was
represented as a loss for labour, who had previously enjoyed autonomy in deciding
working hours, and by association leisure, targeting a decent income before resting
again. The narrative of Saint’s Mondays held that holy-days were part of the
development of the consciousness of the working and artisan classes.
In the more recent scholarship there is no explicit corresponding theory or narrative
about the mechanism of how capital extracted the extra hours from labour in the late
seventeenth or eighteenth century. The implication of the ‘industriousness’ theory is
that labour made the decision to participate more fully in the market or supply more
labour.22 DeVries made associations with human capital theory.23 Voth made a
number of suggestions as to why this may have happened, including increased
nutrition, based on the Freudenberg and Cummins thesis that lack of food had given
earlier work “a pattern in which intense, seasonal activity with long hours of work
alternat[ed] with extensive periods of rest and recuperation.”24 Allen and Weisdorf
19 For instance, the day rate for the directly paid labourers at St Paul’s did not increase between 1675
and 1748. 20 Humphries and Weisdorf, 'The Wages of Women in England’, pp.405-47. 21 Humphries and Weisdorf, ‘Unreal Wages? 22 DeVries, Industrious Revolution, p.210-214. See Clark ‘Factory Discipline’ for an unconventional
discussion of this that predates the industriousness debate. 23 De Vries, The Industrious Revolution, p.200-250 24 Voth ‘Working hours during the industrial revolution’ p.5, Freudenberger &Cummins ‘Health,
Work, and Leisure’ p.9
6
and Humphries and Weisdorf assume implicitly that as prices rose and wages
stagnated labour abandoned its long-held leisure preference. A further implication, of
course, is that the demand for labour made extra work easy to come by.
Beyond the traditional story of supply and demand implicit in these models,
developments in labour economics in recent decades have discriminated between
those approaches which study structural, or technologically led causes of employment
or non-employment, and frictional pressures caused by the transaction costs of
employers and employees bargaining and hiring behavior.25 The latter have not been
explored in any depth by economic historians for the pre-industrial period, although
Michael Huberman landmark study of cotton spinning workers showed that that
internal labour markets and bargaining held up production in Lancashire in the early
nineteenth century.26 This paper will provide some new empirics from the
construction industry that fit neither the existing living standards narrative (the day
wages are lower) nor the industriousness (the days are fewer).
II
Building sites, and building workers are potentially problematic as representative
cases for studying working hours. As building is capital intensive, and external
conditions such as finance, weather, the cost of alternative accommodation etc. all
accumulate costs throughout the building period, most building sites work as
intensively as they can. Furthermore, building labour demand is stage dependent.
Bricklayers only lay after foundations have been dug. Joiners only fit architrave to
existing doorways. Plumbers cannot fit gutters until there are walls and roofs to fit
them to. Building work is generally thought to be seasonal. Subcontracting is the
predominant organizational form. As a result, although building accounts will record
a high number of hours operational, and perhaps a large number of men on site,
skilled workers are only likely to have a full year’s work in any specific skill if they
25 E.g. Burdett, A Theory of Employee Job Search and Quit rates, pp. 212–20., K Burdett and
Mortensen, ‘Labour Supply under Uncertainty’, for a fuller accessible description of these
developments see http://www.nobelprize.org/nobel_prizes/economic-
sciences/laureates/2010/pissarides-lecture.pdf , and Manning, Monopsony in Motion, ch.1. 26 Huberman, Escape the market.
7
work for a large firm that plans the logistics of ongoing consecutive jobs, or in other
skills if they are willing to be a jack-of-all-trades.27
Generally, building records show that sites in London were operational six days a
week, fifty-two weeks a year throughout the seventeenth and eighteenth centuries.28
There is no evidence of formal holy-days which precluded work on any church
building accounts other than Christmas and Easter. Sites were open to allow access
for as many trades as possible to work without getting in each other’s way. Supply
chains and ancillary and professional services, such as transport, surveyors, solicitors,
administrators and financial staff were all closely interlinked with the construction
industry.
The data described in this paper comes from an exceptionally skilled and important
source: two daybooks of William Kempster, who was mason contractor at St Paul’s
Cathedral 1700 – 1717, in all just under 300 pages, most of which contain weekly
records of men’s names, the number of days they had worked that week, and the pay
given to them for that week.29 The first book gives weekly records of men’s work and
pay from 12 October 1700 to the same week 1702. The second book commences in
March 1706 and covers the period until June 1709. Records are clearly marked St
Paul’s Cathedral, and tally with the Cathedral’s records of Kempster’s bills.30
Kempster was working at St Paul’s until 1717, so, it is probably that there were other
books, now missing. Although this evidence is, at best, fragmentary it is the only of
its kind currently available.
In all, it is possible to extract the records for five 52-week periods which form the
basis for the figures calculated and presented in this paper; two consecutive years
beginning in October 1700: and three consecutive from March 1706 to March 1709.
The payment records are as idiosyncratic as one would expect of a working journal of
27 Despite this, and acknowledging seasonality, when creating estimates of hours worked progressively
through the century, Voth used the example of the Burnton & Western canal building in 1801 to
illustrate the more industrious working year at the end of the period, although he didn’t have individual
observations so could only surmise from aggregated working records. Voth, ‘Time and work in
Eighteenth Century England’ pp. 47-49 28 See TNA Work 5/1-74, LMA CLA/ 004/7/ 29 The books are at The National Archives, C106/145. 30 See the Cathedral’s accounts at CLC 313/I/B/25473 no’s 34 – 46. The Wren Society transcribed
many of these, Vols. XIII, XV.
8
a busy mason contractor in the early eighteenth century. During this period,
Kempster’s team built the south West tower, erected the famous geometric staircase
there, fitted the stonework of the library, and also set and carved the columns on the
west front. Most of the carving work at St Paul’s was done by masons, and for those
of us interested in pay the presence of carvers in Kempster’s team complicates the
question of a representative ‘average’ day rates.
There were of course, also men in the team who were responsible for managing
others. Michael Growden, who worked for Kempster from 1706, (if not before) was
recorded on the Cathedral’s books as ‘master’ in masons lists in the years following
this, and Joshua Fletcher, who was foreman and involved in controversy at the
Cathedral in 1710 worked for Kempster for three years. There are two or more hands
which have written in the books, as one might expect if a foreman or apprentice were
assisting with record keeping. Generally, there is double page assigned per week,
with men’s days struck off on one side, and payment made on the other, but when
short of space both records were squeezed into one page. In some places two weeks
were listed top and bottom, and in a couple of instances four weeks of wage payments
were recorded on a double page. There are lots of corrections and crossings-out, and
there are mistakes. On a number of occasions only the number of days worked was
recorded, but no pay. On others the days struck off say that five days were worked but
payment made for six, and on another the opposite. Sometimes individual men are
clearly expected to have been working – their name appears in the middle of the list -
but no days or pay were recorded for them. At others, a payment for a number of days
was slipped into the bottom of a list with no prior records.
The maximum possible number of days worked in any week was usually six. In some
late December weeks men were paid for more than six days, but the books also
indicate that those excess days may have been worked in the week after Christmas. In
May 1706 one man, Joseph Smith, a very senior and experienced mason who had
worked at St Paul’s since the 1690s was paid for two weeks, but no explanation is
given. These are all small occurrences however, and generally, the books are
consistent, well organized, and well preserved considering the three centuries that has
passed since they were used.
9
There are some occasional small notes and memoranda which help in identifying men
and work. On May 12th 1708, “I promise to pay into Mr Will Kempster the sum of
five pounds upon demand witness my hand Tho Knagg”, which probably refers to the
repayment of a loan. Knagg worked in every year of the records, and was one of the
most hardworking men on site, so it might have been a safe bet to lend him money. In
April 2nd 1709 it says “this week is all accounted in a March bill”, and “Mr Richards
3 days this week putting up the steps in the staircases … strings, Matt Wain and Nic
Abraham 2 days each a fitting for him and labourers 6 days as on the church account.
Masons more a peacing the columns; Peter Abraham Richard Day, Will Stonhouse,
Mick Growden”. This indicates that Richard Richards (who had worked previously
for Kempster’s father at St Paul’s) may have been responsible for the staircase. His
day rate was 30d. On June 4th 1709 “John Tuckey began to set the fli[ght] of steps at
the west front May 26th 1709, ended the same August 24th 1709 it being
Bartholomew’s day”. Tuckey was an experienced master mason, he earned 30d. per
day putting him near the top of day rate pay. It is apparent that 30d. per day, which
Allen, or Schwarz takes as the average skilled man’s average day rate for that year
was not an average day rate at all, but the rate that the most skilled master masons
could command for innovative and important work.31 But, as we shall see the day rate
that a man received was not a clear predictor of his income from the site.
In all, the Kempster book records refer to and give some pay details for 179 men over
a decade (table 1). Kempster was also working at St Pauls’ throughout 1703-5,
probably with some of the men listed in the earlier and later books, but the book(s) are
not present. Some of the men are readily identifiable from other St Paul’s records or
mason company searches. Others, in fact the vast majority, can’t be traced elsewhere,
and as table 2 shows, about two thirds of the sample only worked for Kempster for a
short time, appearing in only one year’s records.
31 This point, and the difference between the charge out rates found in the existing wage series, and the
lower amounts men actually earned, are discussed in Stephenson, ‘‘Real’ Wages?’.
10
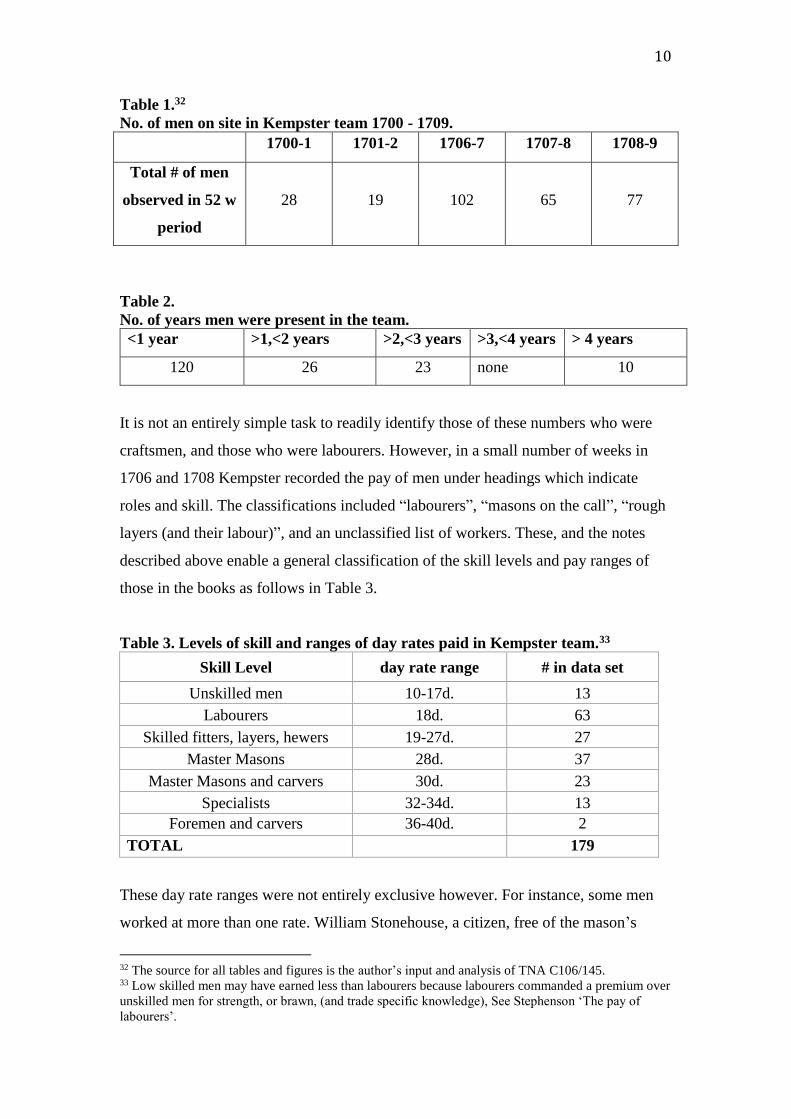
Table 1.32
No. of men on site in Kempster team 1700 - 1709.
1700-1 1701-2 1706-7 1707-8 1708-9
Total # of men
observed in 52 w
period
28 19 102 65 77
Table 2.
No. of years men were present in the team.
<1 year >1,<2 years >2,<3 years >3,<4 years > 4 years
120 26 23 none 10
It is not an entirely simple task to readily identify those of these numbers who were
craftsmen, and those who were labourers. However, in a small number of weeks in
1706 and 1708 Kempster recorded the pay of men under headings which indicate
roles and skill. The classifications included “labourers”, “masons on the call”, “rough
layers (and their labour)”, and an unclassified list of workers. These, and the notes
described above enable a general classification of the skill levels and pay ranges of
those in the books as follows in Table 3.
Table 3. Levels of skill and ranges of day rates paid in Kempster team.33
Skill Level day rate range # in data set
Unskilled men 10-17d. 13
Labourers 18d. 63
Skilled fitters, layers, hewers 19-27d. 27
Master Masons 28d. 37
Master Masons and carvers 30d. 23
Specialists 32-34d. 13
Foremen and carvers 36-40d. 2
TOTAL 179
These day rate ranges were not entirely exclusive however. For instance, some men
worked at more than one rate. William Stonehouse, a citizen, free of the mason’s
32 The source for all tables and figures is the author’s input and analysis of TNA C106/145. 33 Low skilled men may have earned less than labourers because labourers commanded a premium over
unskilled men for strength, or brawn, (and trade specific knowledge), See Stephenson ‘The pay of
labourers’.
11
company, who apprenticed one son to Kempster in 1710, and had his own
apprentices, worked for both 28d. and day and 20d. a day. He had trained under the
same master as Joshua Fletcher, one of the highest paid men. Both were known to
have been at St Paul’s in the 1690s. Fletcher, who was sufficiently important or
known, as a foreman, to be in personal correspondence with the Commissioners for
the rebuilding, was the son of a Westminster brewer and had been apprenticed in 1691
to Robert Bushnell (an established London mason family). He seems to have become
an established contractor in his own right. John Barker, the other most highly paid
man was trained by a carver and had been working with John Thompson, Kempster’s
predecessor on these contracts at St Paul’s in the 1690s. The 13 men paid over 30d. a
day included John Magnus who had been an apprentice of Thompson’s – in 1681, and
who had been working at St Paul’s in the 1690s also. Many names in those listed at
30d. a day are known to have worked for other famous masons, Richard Richards for
Christopher Kempster and Ephraim Beauchamp and Edward Strong; Will Ash and
Joseph Smith for Edward Strong. Men listed at 28d. a day are mostly also found in
apprenticeship and mason’s company records, some with their own apprentices, and
many of those working at 20, 24, and 26d. a day have the family names of freemen
masons. Two of the 28d.-a-day men - Kempster’s own son, and Richard Day were
apprenticed to Kempster around 1700 and were bound to him during his contracts at
St Paul’s. In earlier parts of the book some days are recorded for them but no pay.
From 1706 they were both paid 28d. per day each.
At the lower end of the scale, at 18d., are mostly labourers, but also some masons.
Will Showers is listed as a mason in a St Paul’s account in 1704, but he worked for
these years for Kempster at 18d. a day.34 Charles Thurland, also paid 18d a day, who
was related to Kempster, was listed as a labourer in the same account. It is possible
that a significant number of the men at 18d. a day may have been masons rather than
labourers. Sam Lightfood (Ledford) appears with Showers many times, and his father
was apprenticed a mason, but there is no way to be certain of these skill levels. Whilst
Kempster’s team was working, the cathedral commissioners hired and paid directly
large numbers of labourers to assist all trades and do general laboring across the site.
They were paid, predominantly, 18d. a day in winter, and 16d. in summer. Their
34 TNA C106/145; LMA CLC/B/I/313/003/25473, no 41.
12
numbers were tallied by the cathedral’s clear of works and their existence cannot be
discerned form Kempster’s books.
III
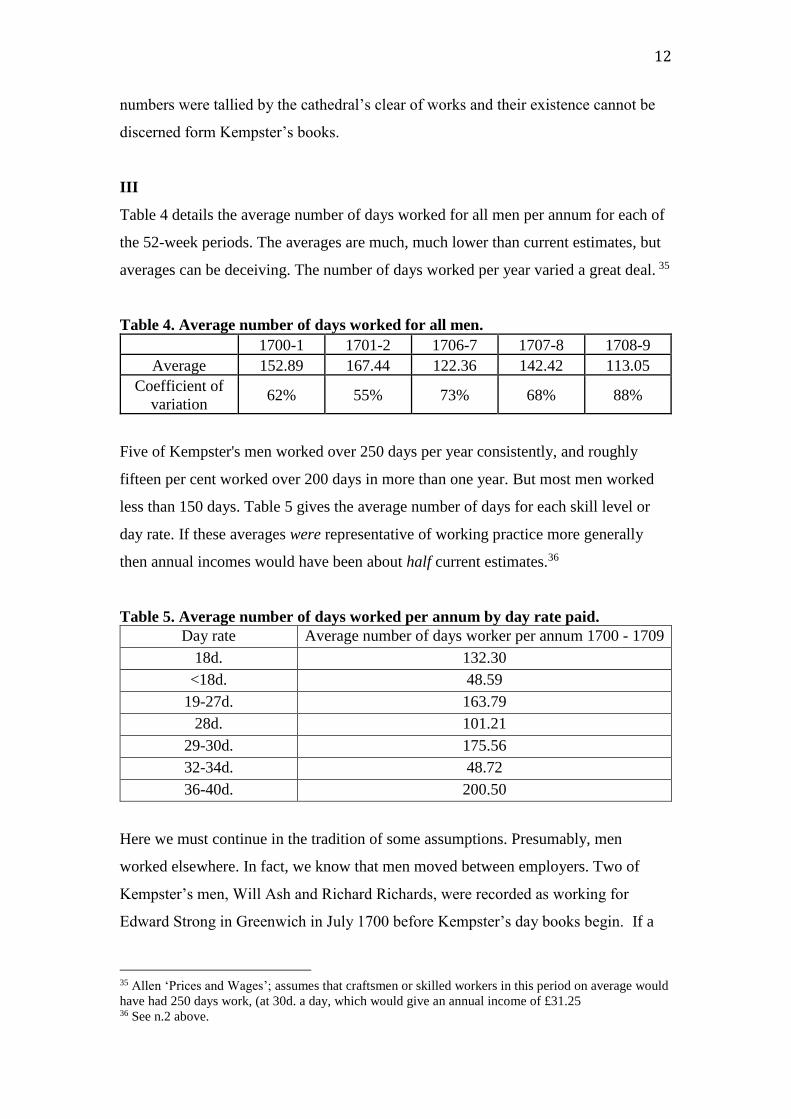
Table 4 details the average number of days worked for all men per annum for each of
the 52-week periods. The averages are much, much lower than current estimates, but
averages can be deceiving. The number of days worked per year varied a great deal. 35
Table 4. Average number of days worked for all men. 1700-1 1701-2 1706-7 1707-8 1708-9
Average 152.89 167.44 122.36 142.42 113.05
Coefficient of
variation 62% 55% 73% 68% 88%
Five of Kempster's men worked over 250 days per year consistently, and roughly
fifteen per cent worked over 200 days in more than one year. But most men worked
less than 150 days. Table 5 gives the average number of days for each skill level or
day rate. If these averages were representative of working practice more generally
then annual incomes would have been about half current estimates.36
Table 5. Average number of days worked per annum by day rate paid.
Day rate Average number of days worker per annum 1700 - 1709
18d. 132.30
<18d. 48.59
19-27d. 163.79
28d. 101.21
29-30d. 175.56
32-34d. 48.72
36-40d. 200.50
Here we must continue in the tradition of some assumptions. Presumably, men
worked elsewhere. In fact, we know that men moved between employers. Two of
Kempster’s men, Will Ash and Richard Richards, were recorded as working for
Edward Strong in Greenwich in July 1700 before Kempster’s day books begin. If a
35 Allen ‘Prices and Wages’; assumes that craftsmen or skilled workers in this period on average would
have had 250 days work, (at 30d. a day, which would give an annual income of £31.25 36 See n.2 above.
13
man worked a low number of days per week but was present on site the whole year it
might be possible that Kempster was their only source of employment, but it is not
plausible to say the same for someone who worked 150 days a year if he did so as a
full six-day week for half the year, then disappeared from the records. In order to
understand these unexpectedly low average figures, we need to understand how much
work there was available, and how it was distributed, before we can evaluate relative
industriousness.
All the evidence shows that the site at the Cathedral was open, and operative six days
a week all year, with workers on site 52 weeks of the year. The 53 saints or holy days
that Voth supposed were lost throughout the early eighteenth century are no way
discernable. In all years in Kempster’s books, (and other call books observed) there
were only 4 days worked in the week with December 25th in it, and two weeks usually
after Lady Day which had 5 working days in them. This was common practice on
other sites too. This indicates a maximum working year of 308-9 days.
Generally, the seasonal pattern for Kempster was a high number of days worked in
Michaelmas quarter, right up to Christmas, little work in January, a fully operational
team in February and March, and then a large number of men and amount of work
from Lady Day to Michaelmas. Kempster’s records show that his team was operative
at St Paul’s (his biggest contract, if not only one, at the time) for 47 weeks in 1700-1,
48 the following year, then in 1706-9 48, 49, and 48 weeks. The weeks that were not
worked were always in January. Seasonality in mason’s work is no surprise, but in
fact this rate of work is higher, and less seasonal than previous studies of the
construction industry have implied.37
The St Paul’s records show that this pattern was not restricted to masons. Bricklayers,
carpenters, labourers, plumbers and glaziers all submitted fewer bills for work done in
Candlemas or the quarter of the year after Christmas, and while day bills are not a
reliable guide to days worked, the call records for carpenters, which are full and
reliable for parts of the 1690s and 1700s, show a consistently a smaller number of
37 Woodward, 1981 pp. 60-66, Table 3.2 p. 69. p.137-8; Campbell, ‘The Finances of the Carpenter in
England 1660-1710: A Case Study on the Implications of the Change from Craft to Designer-Based
Construction’, p. 324, and p. 360, in diabatto
14
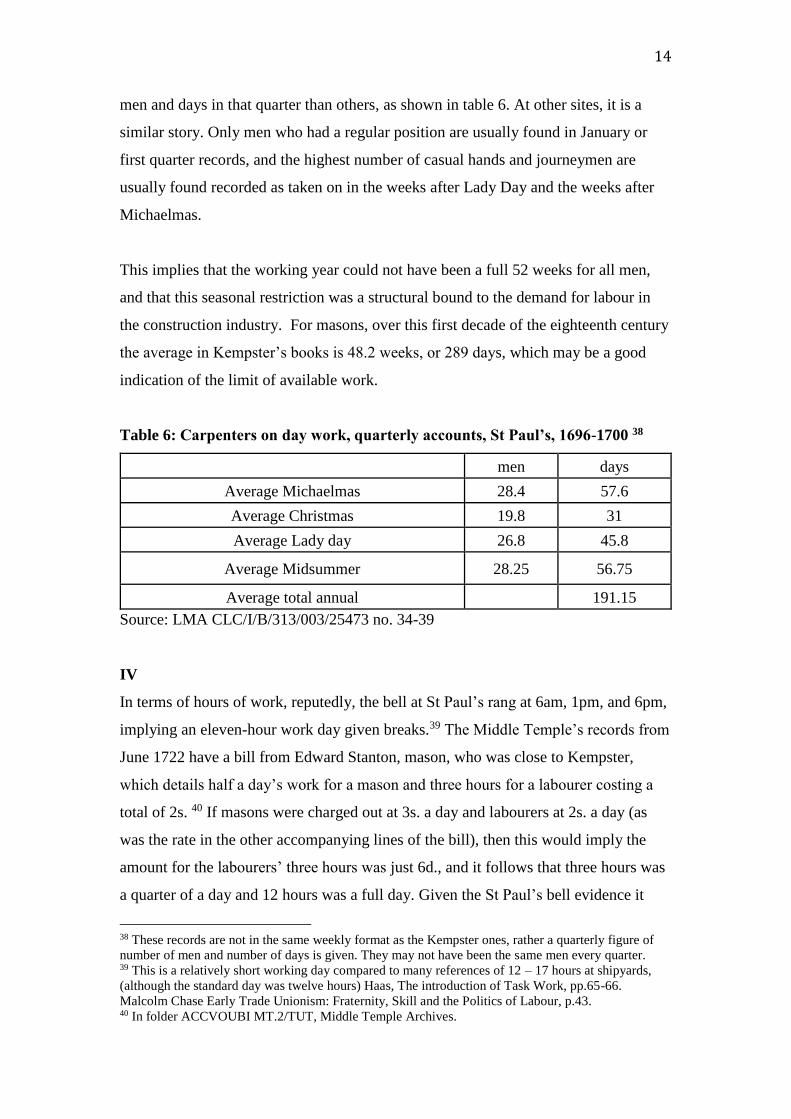
men and days in that quarter than others, as shown in table 6. At other sites, it is a
similar story. Only men who had a regular position are usually found in January or
first quarter records, and the highest number of casual hands and journeymen are
usually found recorded as taken on in the weeks after Lady Day and the weeks after
Michaelmas.
This implies that the working year could not have been a full 52 weeks for all men,
and that this seasonal restriction was a structural bound to the demand for labour in
the construction industry. For masons, over this first decade of the eighteenth century
the average in Kempster’s books is 48.2 weeks, or 289 days, which may be a good
indication of the limit of available work.
Table 6: Carpenters on day work, quarterly accounts, St Paul’s, 1696-1700 38
men days
Average Michaelmas 28.4 57.6
Average Christmas 19.8 31
Average Lady day 26.8 45.8
Average Midsummer 28.25 56.75
Average total annual 191.15
Source: LMA CLC/I/B/313/003/25473 no. 34-39
IV
In terms of hours of work, reputedly, the bell at St Paul’s rang at 6am, 1pm, and 6pm,
implying an eleven-hour work day given breaks.39 The Middle Temple’s records from
June 1722 have a bill from Edward Stanton, mason, who was close to Kempster,
which details half a day’s work for a mason and three hours for a labourer costing a
total of 2s. 40 If masons were charged out at 3s. a day and labourers at 2s. a day (as
was the rate in the other accompanying lines of the bill), then this would imply the
amount for the labourers’ three hours was just 6d., and it follows that three hours was
a quarter of a day and 12 hours was a full day. Given the St Paul’s bell evidence it
38 These records are not in the same weekly format as the Kempster ones, rather a quarterly figure of
number of men and number of days is given. They may not have been the same men every quarter. 39 This is a relatively short working day compared to many references of 12 – 17 hours at shipyards,
(although the standard day was twelve hours) Haas, The introduction of Task Work, pp.65-66.
Malcolm Chase Early Trade Unionism: Fraternity, Skill and the Politics of Labour, p.43. 40 In folder ACCVOUBI MT.2/TUT, Middle Temple Archives.
15
seems a plausible working assumption that of those 12 hours 11 were worked.
Therefore, if a man worked six days he would have put in around 66 hours of hard
physical labour, hauling stone and barrows around as well as fitting delicately
wrought irons and precision cut ashlars. This is a higher number of hours than
nineteenth century workers toiled, and frankly it would be hard to believe that anyone
could be productive for that amount of time at that level of physical and mental
output. Indeed, it was assumed in the past that most of the population lacked the
nutrition to do so.41
Half days were common, both in bills and account, and they are common in
Kempster’s records, but there does not seem to have been a capacity or allowance for
‘overtime’, as there was in the Royal Naval Dockyards. There is no evidence from
later records that the hours of work were extended.42 For those who worked by task,
the likelihood is that they followed the same work day, as most task work was carried
out on the same sites, although we have no way or evaluating or evidencing this. For
the vast majority, we should view a six day, 66-hour week as the upper bound on
work hours in construction. However, it is not the case that everyone worked all
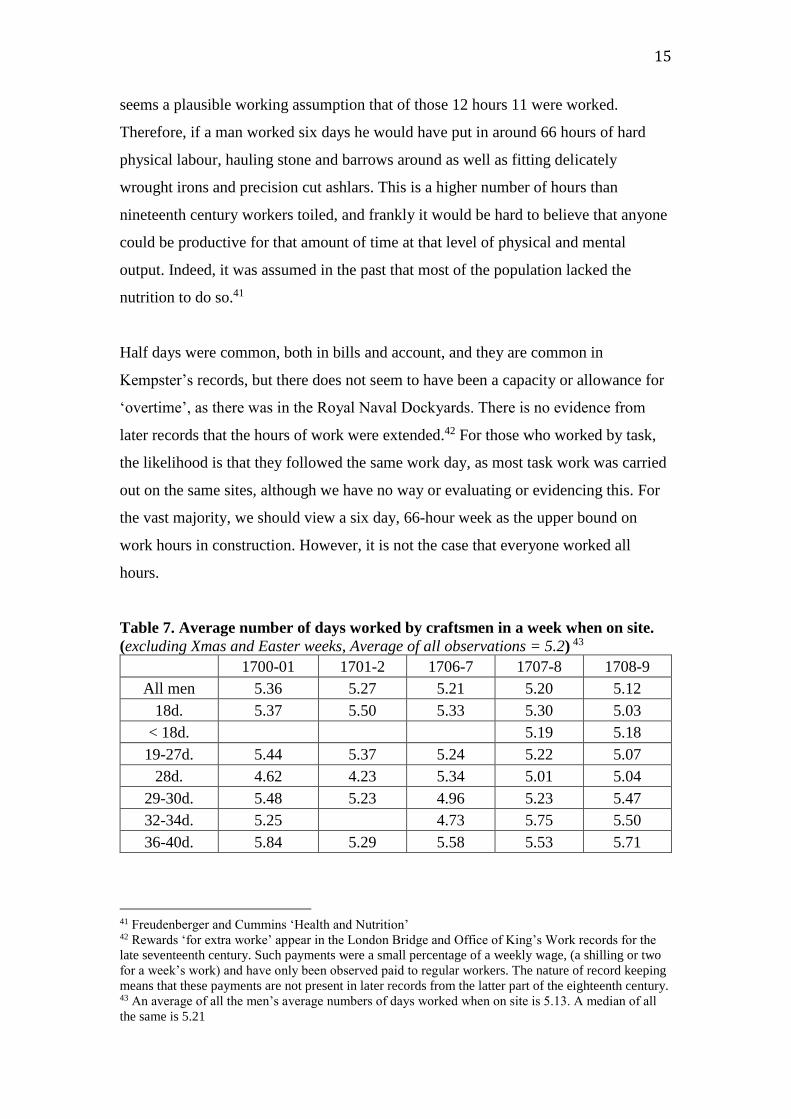
hours.
Table 7. Average number of days worked by craftsmen in a week when on site.
(excluding Xmas and Easter weeks, Average of all observations = 5.2) 43 1700-01 1701-2 1706-7 1707-8 1708-9
All men 5.36 5.27 5.21 5.20 5.12
18d. 5.37 5.50 5.33 5.30 5.03
< 18d. 5.19 5.18
19-27d. 5.44 5.37 5.24 5.22 5.07
28d. 4.62 4.23 5.34 5.01 5.04
29-30d. 5.48 5.23 4.96 5.23 5.47
32-34d. 5.25 4.73 5.75 5.50
36-40d. 5.84 5.29 5.58 5.53 5.71
41 Freudenberger and Cummins ‘Health and Nutrition’ 42 Rewards ‘for extra worke’ appear in the London Bridge and Office of King’s Work records for the
late seventeenth century. Such payments were a small percentage of a weekly wage, (a shilling or two
for a week’s work) and have only been observed paid to regular workers. The nature of record keeping
means that these payments are not present in later records from the latter part of the eighteenth century. 43 An average of all the men’s average numbers of days worked when on site is 5.13. A median of all
the same is 5.21
16
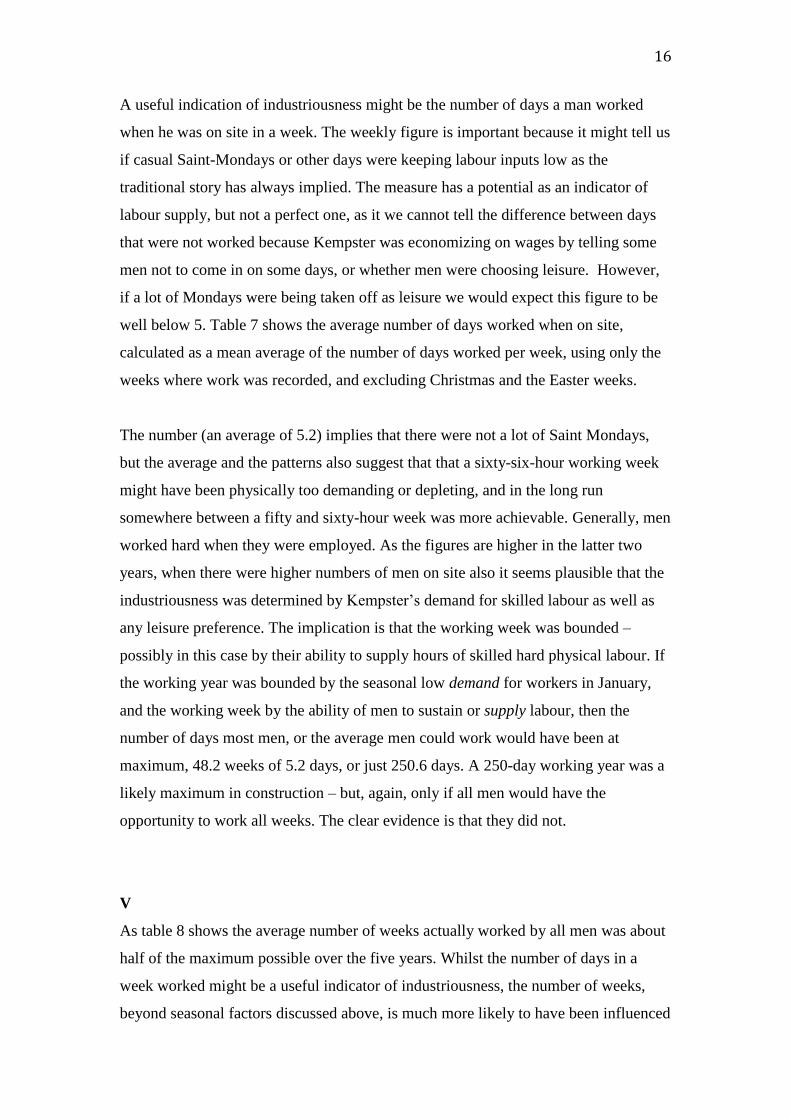
A useful indication of industriousness might be the number of days a man worked
when he was on site in a week. The weekly figure is important because it might tell us
if casual Saint-Mondays or other days were keeping labour inputs low as the
traditional story has always implied. The measure has a potential as an indicator of
labour supply, but not a perfect one, as it we cannot tell the difference between days
that were not worked because Kempster was economizing on wages by telling some
men not to come in on some days, or whether men were choosing leisure. However,
if a lot of Mondays were being taken off as leisure we would expect this figure to be
well below 5. Table 7 shows the average number of days worked when on site,
calculated as a mean average of the number of days worked per week, using only the
weeks where work was recorded, and excluding Christmas and the Easter weeks.
The number (an average of 5.2) implies that there were not a lot of Saint Mondays,
but the average and the patterns also suggest that that a sixty-six-hour working week
might have been physically too demanding or depleting, and in the long run
somewhere between a fifty and sixty-hour week was more achievable. Generally, men
worked hard when they were employed. As the figures are higher in the latter two
years, when there were higher numbers of men on site also it seems plausible that the
industriousness was determined by Kempster’s demand for skilled labour as well as
any leisure preference. The implication is that the working week was bounded –
possibly in this case by their ability to supply hours of skilled hard physical labour. If
the working year was bounded by the seasonal low demand for workers in January,
and the working week by the ability of men to sustain or supply labour, then the
number of days most men, or the average men could work would have been at
maximum, 48.2 weeks of 5.2 days, or just 250.6 days. A 250-day working year was a
likely maximum in construction – but, again, only if all men would have the
opportunity to work all weeks. The clear evidence is that they did not.
V
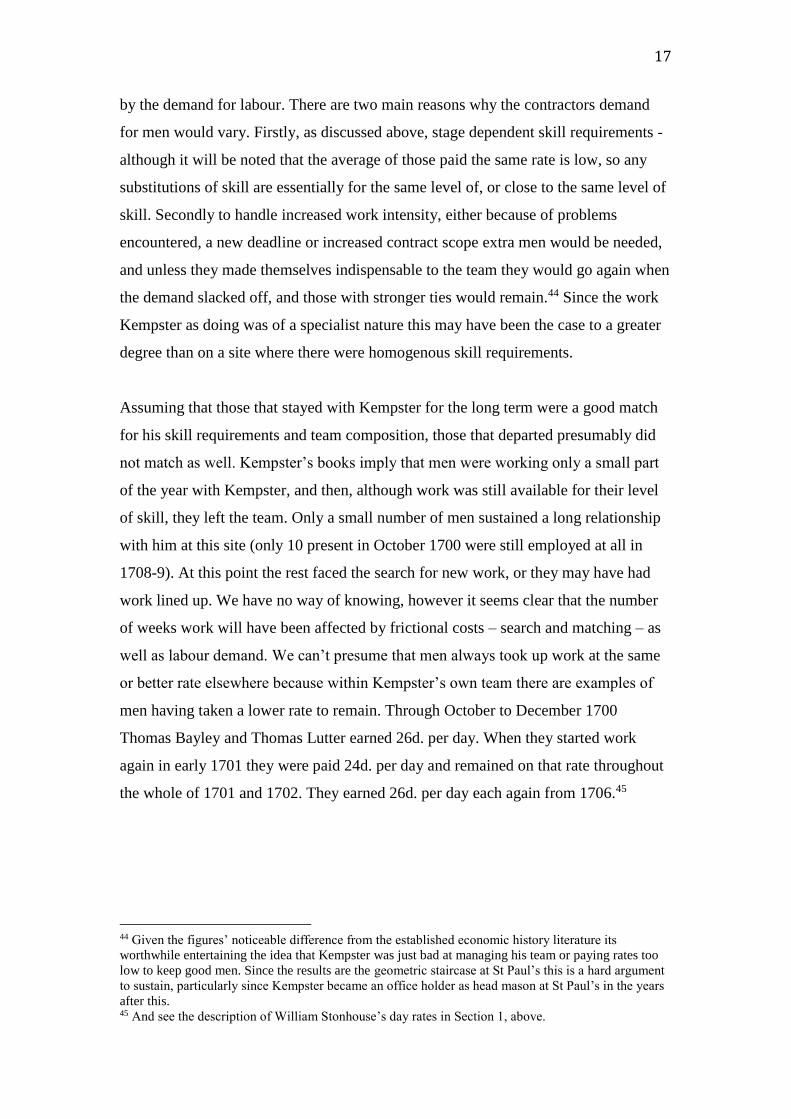
As table 8 shows the average number of weeks actually worked by all men was about
half of the maximum possible over the five years. Whilst the number of days in a
week worked might be a useful indicator of industriousness, the number of weeks,
beyond seasonal factors discussed above, is much more likely to have been influenced
17
by the demand for labour. There are two main reasons why the contractors demand
for men would vary. Firstly, as discussed above, stage dependent skill requirements -
although it will be noted that the average of those paid the same rate is low, so any
substitutions of skill are essentially for the same level of, or close to the same level of
skill. Secondly to handle increased work intensity, either because of problems
encountered, a new deadline or increased contract scope extra men would be needed,
and unless they made themselves indispensable to the team they would go again when
the demand slacked off, and those with stronger ties would remain.44 Since the work
Kempster as doing was of a specialist nature this may have been the case to a greater
degree than on a site where there were homogenous skill requirements.
Assuming that those that stayed with Kempster for the long term were a good match
for his skill requirements and team composition, those that departed presumably did
not match as well. Kempster’s books imply that men were working only a small part
of the year with Kempster, and then, although work was still available for their level
of skill, they left the team. Only a small number of men sustained a long relationship
with him at this site (only 10 present in October 1700 were still employed at all in
1708-9). At this point the rest faced the search for new work, or they may have had
work lined up. We have no way of knowing, however it seems clear that the number
of weeks work will have been affected by frictional costs – search and matching – as
well as labour demand. We can’t presume that men always took up work at the same
or better rate elsewhere because within Kempster’s own team there are examples of
men having taken a lower rate to remain. Through October to December 1700
Thomas Bayley and Thomas Lutter earned 26d. per day. When they started work
again in early 1701 they were paid 24d. per day and remained on that rate throughout
the whole of 1701 and 1702. They earned 26d. per day each again from 1706.45
44 Given the figures’ noticeable difference from the established economic history literature its
worthwhile entertaining the idea that Kempster was just bad at managing his team or paying rates too
low to keep good men. Since the results are the geometric staircase at St Paul’s this is a hard argument
to sustain, particularly since Kempster became an office holder as head mason at St Paul’s in the years
after this. 45 And see the description of William Stonhouse’s day rates in Section 1, above.
18
Table 8. Average number of weeks worked for all men in all years.
weeks worked 1700-1 1701-2 1706-7 1707-8 1708-9
All men 27.68 31.05 22.62 26.88 21.45
18d. 33.70 26.00 20.24 25.70 15.88
< 18d.
21.33 16.09
19-27d. 35.29 28.75 30.53 31.00 27.08
28d. 7.33 20.50 21.93 24.53 21.25
29-30d. 24.00 45.20 22.26 30.53 34.40
32-34d. 29.00
11.10 2.00 5.00
36-40d. 8.50 47.00 47.00 48.50 30.50
STD DEV All 16.92 17.05 16.30 18.19 18.16
STD DEV 18d. 14.94 16.84 16.20 19.22 15.07
STD DEV <18d.
13.14 15.88
STD DEV 19-27d. 12.57 18.37 15.94 19.35 19.40
STD DEV 28d. 3.21 27.58 11.40 16.04 19.81
STD DEV 29-30d. 17.98 2.49 18.04 20.80 17.00
STD DEV 32-34d. 20.66
9.98
STD DEV 36-40d. 2.31 2.31 26.58 0.71 23.33
% over 40 weeks 39.29 52.63 22.55 38.46 27.27
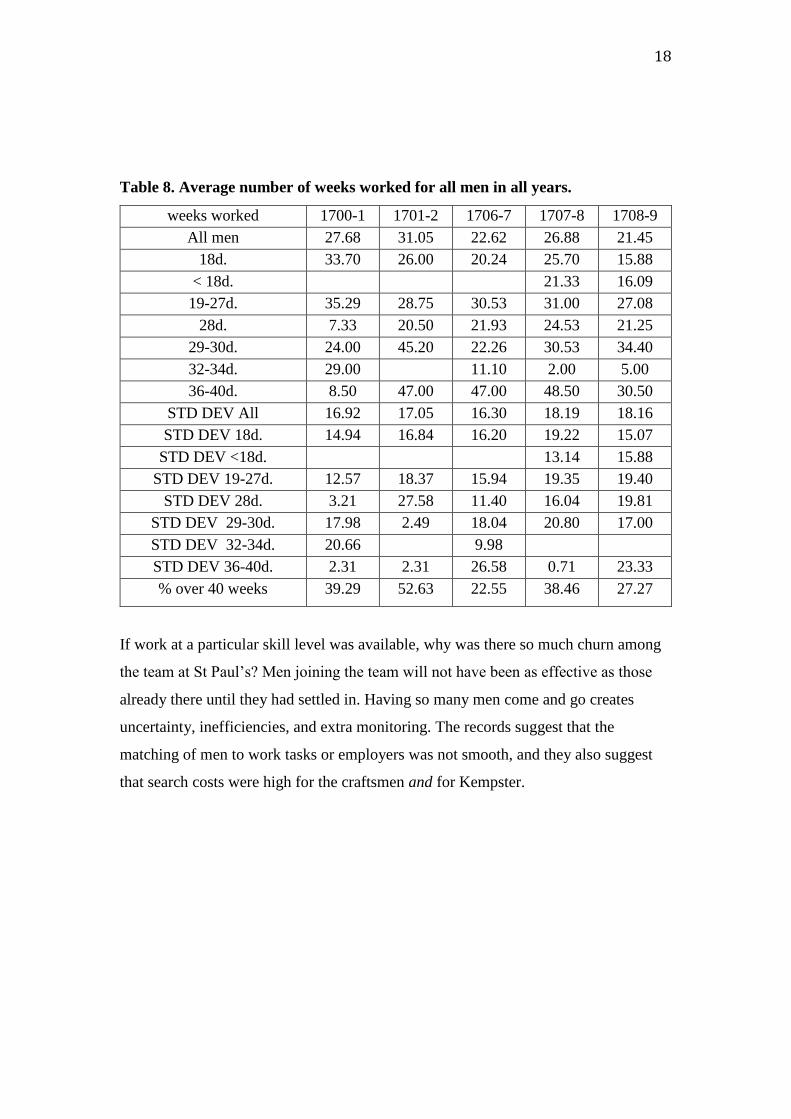
If work at a particular skill level was available, why was there so much churn among
the team at St Paul’s? Men joining the team will not have been as effective as those
already there until they had settled in. Having so many men come and go creates
uncertainty, inefficiencies, and extra monitoring. The records suggest that the
matching of men to work tasks or employers was not smooth, and they also suggest
that search costs were high for the craftsmen and for Kempster.
19
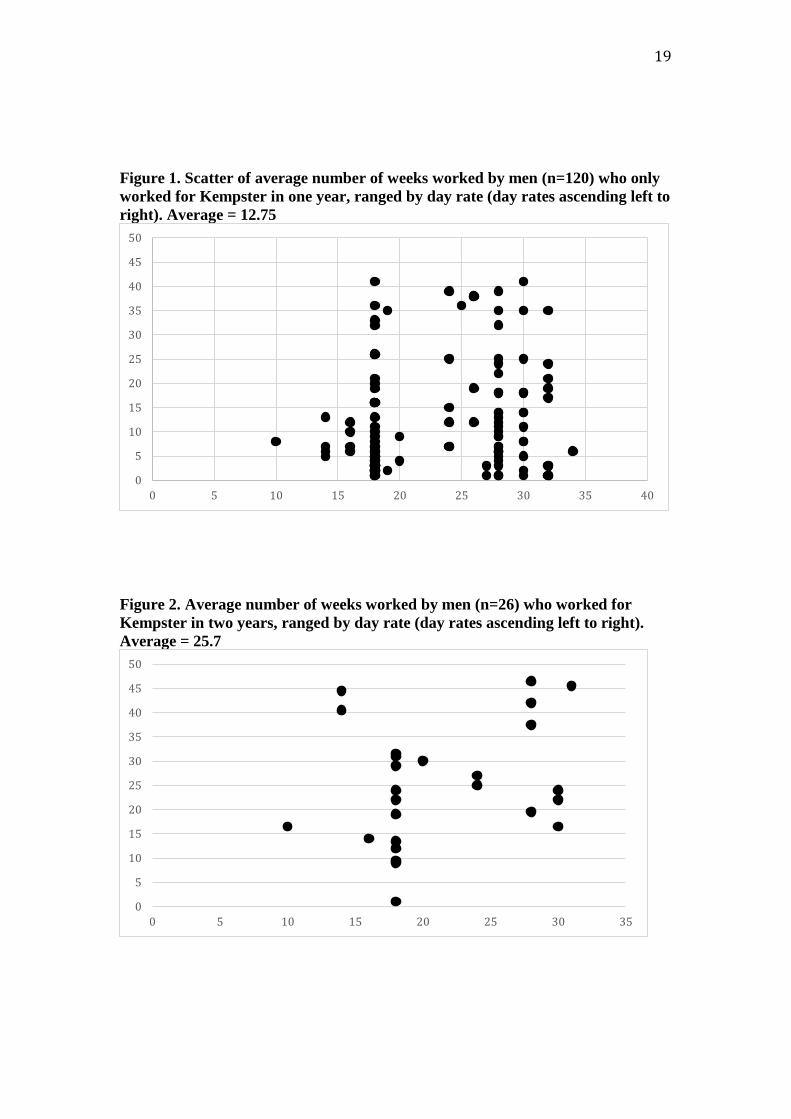
Figure 1. Scatter of average number of weeks worked by men (n=120) who only
worked for Kempster in one year, ranged by day rate (day rates ascending left to
right). Average = 12.75
Figure 2. Average number of weeks worked by men (n=26) who worked for
Kempster in two years, ranged by day rate (day rates ascending left to right).
Average = 25.7
0
5
10
15
20
25
30
35
40
45
50
0 5 10 15 20 25 30 35 40
0
5
10
15
20
25
30
35
40
45
50
0 5 10 15 20 25 30 35
20
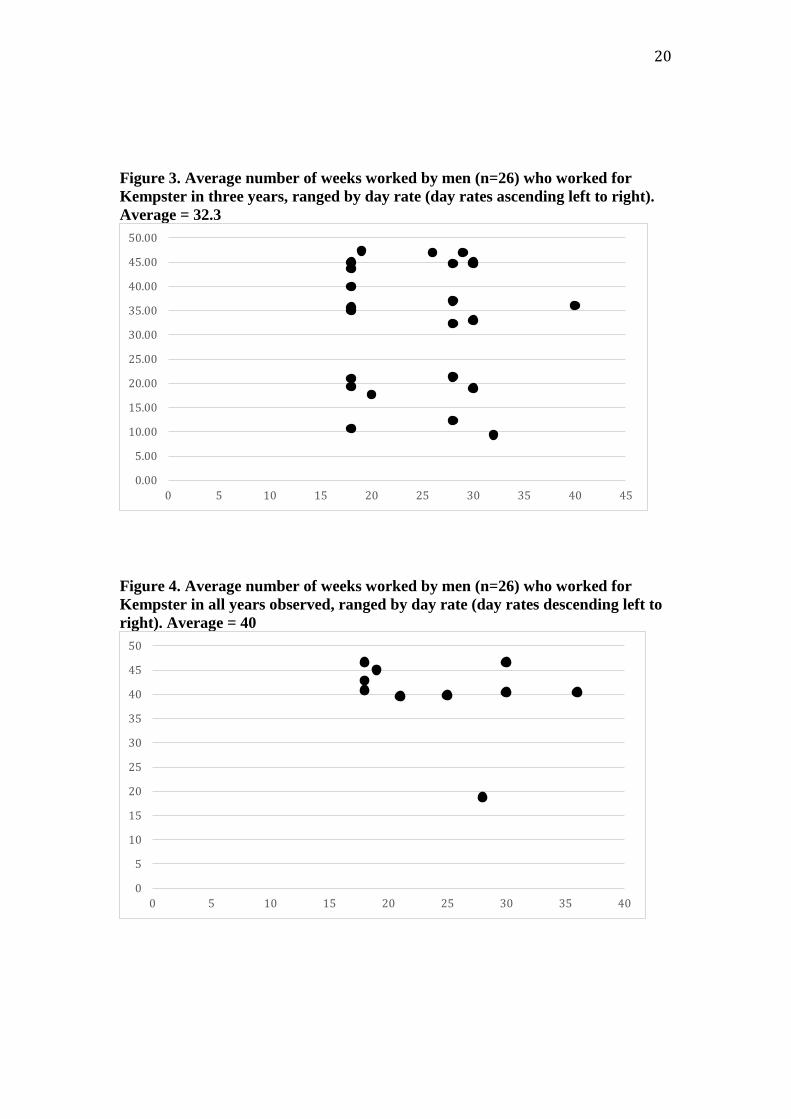
Figure 3. Average number of weeks worked by men (n=26) who worked for
Kempster in three years, ranged by day rate (day rates ascending left to right).
Average = 32.3
Figure 4. Average number of weeks worked by men (n=26) who worked for
Kempster in all years observed, ranged by day rate (day rates descending left to
right). Average = 40
0.00
5.00
10.00
15.00
20.00
25.00
30.00
35.00
40.00
45.00
50.00
0 5 10 15 20 25 30 35 40 45
0
5
10
15
20
25
30
35
40
45
50
0 5 10 15 20 25 30 35 40
21
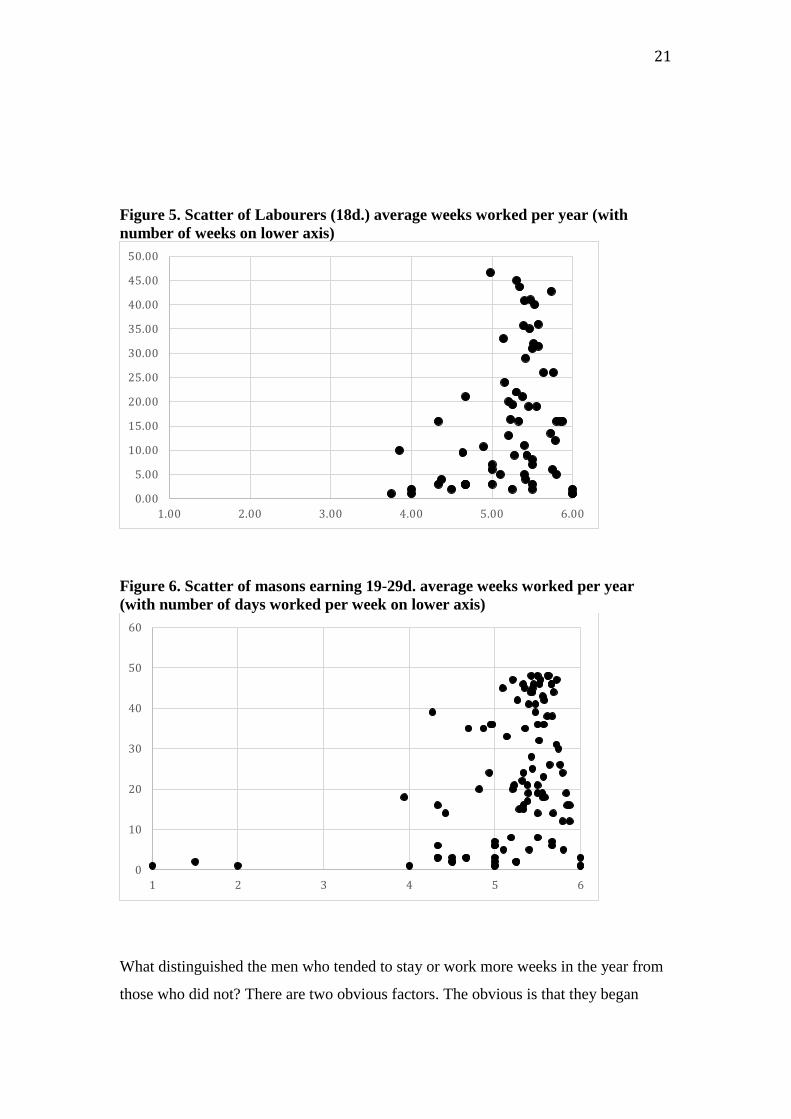
Figure 5. Scatter of Labourers (18d.) average weeks worked per year (with
number of weeks on lower axis)
Figure 6. Scatter of masons earning 19-29d. average weeks worked per year
(with number of days worked per week on lower axis)
What distinguished the men who tended to stay or work more weeks in the year from
those who did not? There are two obvious factors. The obvious is that they began
0.00
5.00
10.00
15.00
20.00
25.00
30.00
35.00
40.00
45.00
50.00
1.00 2.00 3.00 4.00 5.00 6.00
0
10
20
30
40
50
60
1 2 3 4 5 6
22
working for Kempster, or that they worked for him during October – or the start of the
busiest quarter. However, this dataset is heavily biased towards October, as the first
(and so the longest serving) entries are from October, and in 1706 the largest intake of
new workers were also in October. Further analysis will be carried out to control for
the specialist nature of the work and the men in this team before conclusions can be
drawn on this. The second factor that influenced the number of days they worked was
tenure.
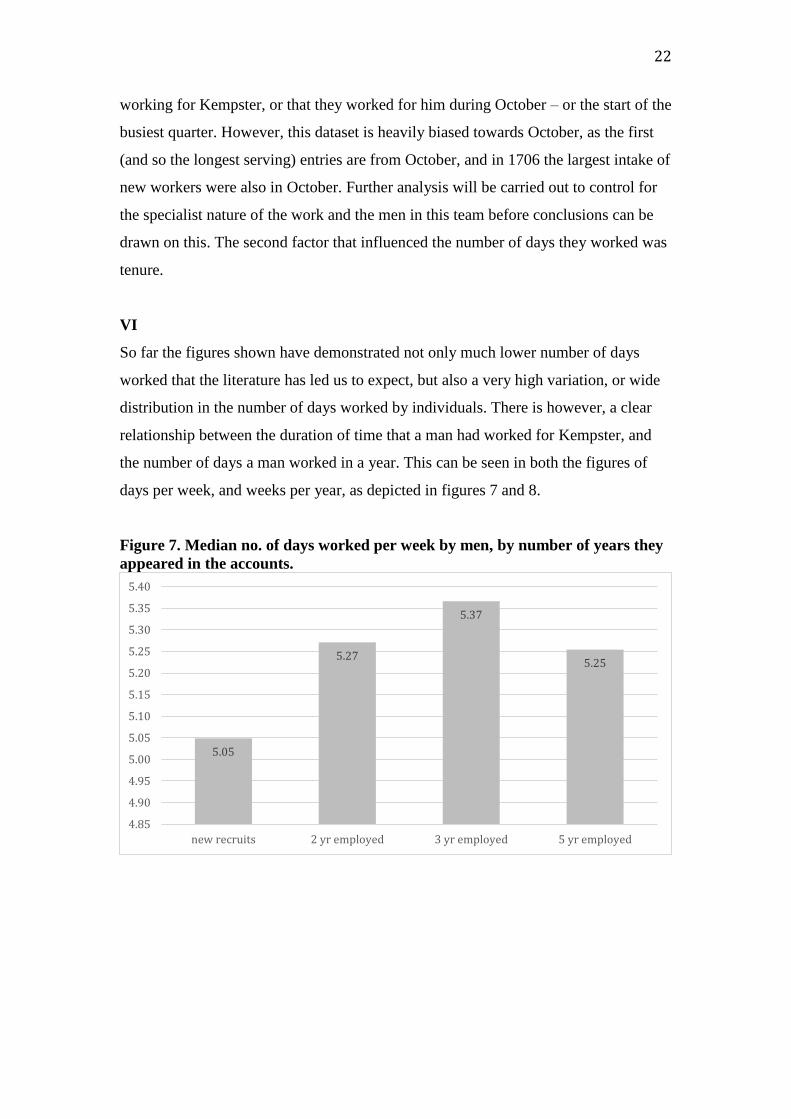
VI
So far the figures shown have demonstrated not only much lower number of days
worked that the literature has led us to expect, but also a very high variation, or wide
distribution in the number of days worked by individuals. There is however, a clear
relationship between the duration of time that a man had worked for Kempster, and
the number of days a man worked in a year. This can be seen in both the figures of
days per week, and weeks per year, as depicted in figures 7 and 8.
Figure 7. Median no. of days worked per week by men, by number of years they
appeared in the accounts.
5.05
5.27
5.37
5.25
4.85
4.90
4.95
5.00
5.05
5.10
5.15
5.20
5.25
5.30
5.35
5.40
new recruits 2 yr employed 3 yr employed 5 yr employed
23
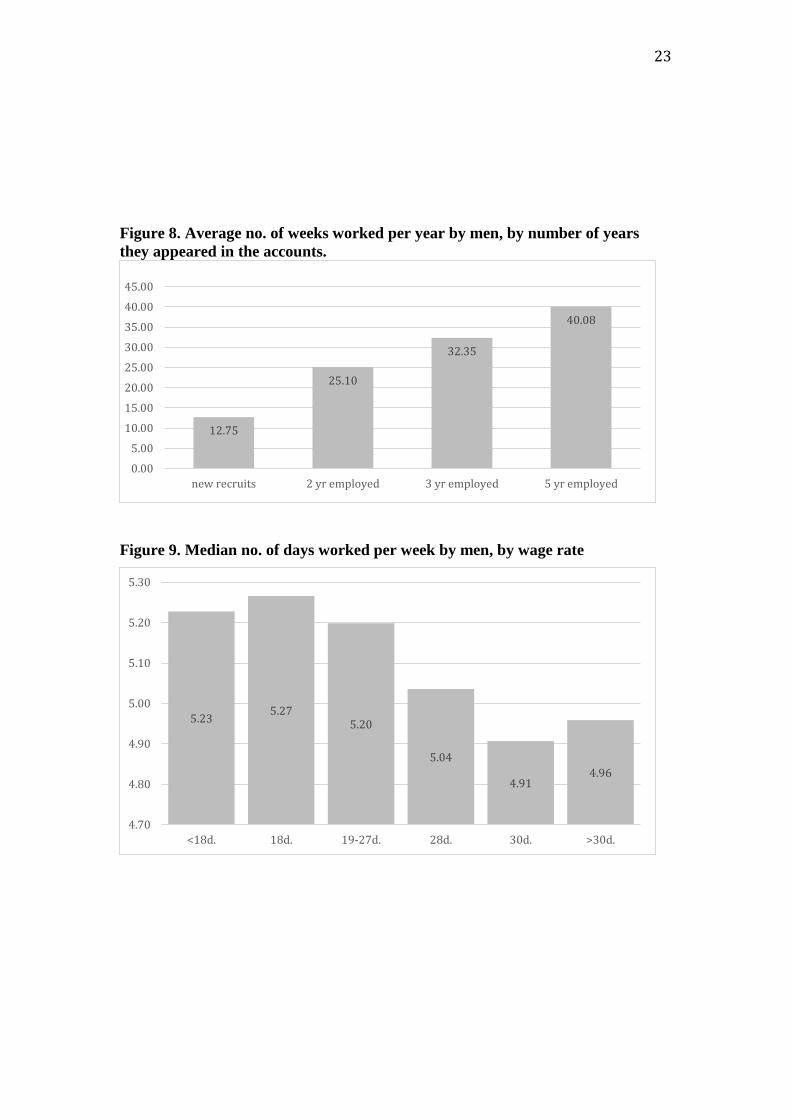
Figure 8. Average no. of weeks worked per year by men, by number of years
they appeared in the accounts.
Figure 9. Median no. of days worked per week by men, by wage rate
12.75
25.10
32.35
40.08
0.00
5.00
10.00
15.00
20.00
25.00
30.00
35.00
40.00
45.00
new recruits 2 yr employed 3 yr employed 5 yr employed
5.235.27
5.20
5.04
4.914.96
4.70
4.80
4.90
5.00
5.10
5.20
5.30
<18d. 18d. 19-27d. 28d. 30d. >30d.
24
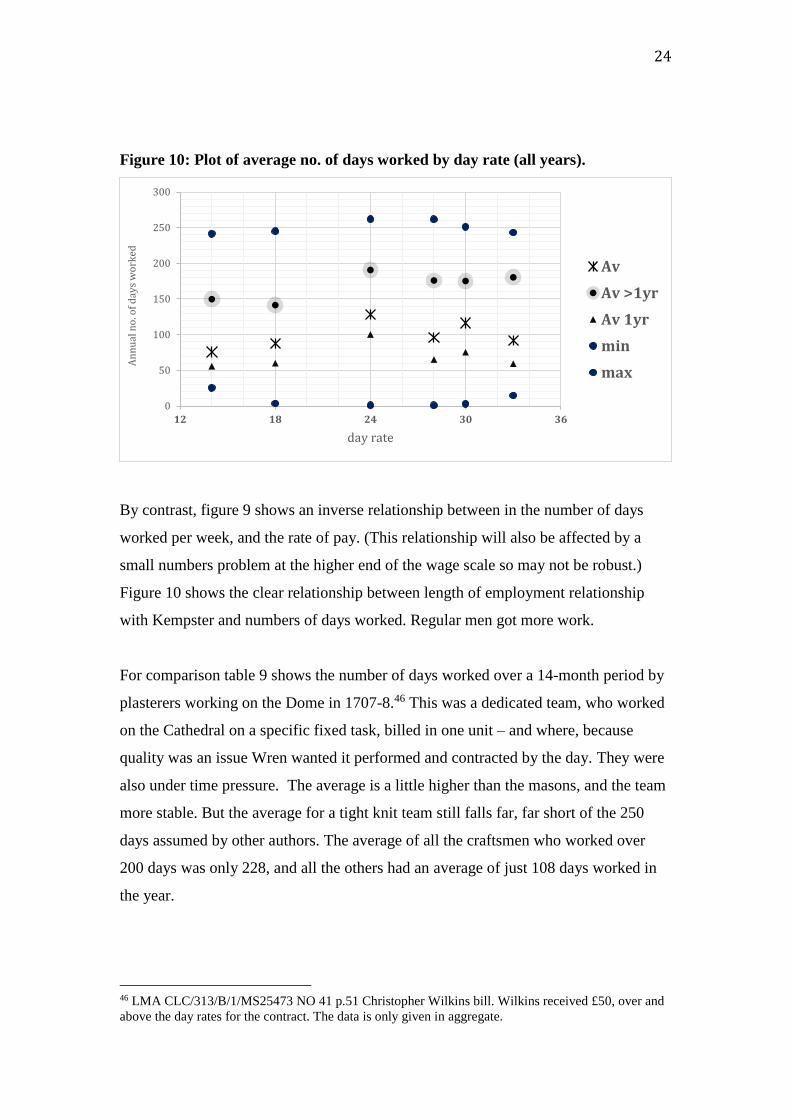
Figure 10: Plot of average no. of days worked by day rate (all years).
By contrast, figure 9 shows an inverse relationship between in the number of days
worked per week, and the rate of pay. (This relationship will also be affected by a
small numbers problem at the higher end of the wage scale so may not be robust.)
Figure 10 shows the clear relationship between length of employment relationship
with Kempster and numbers of days worked. Regular men got more work.
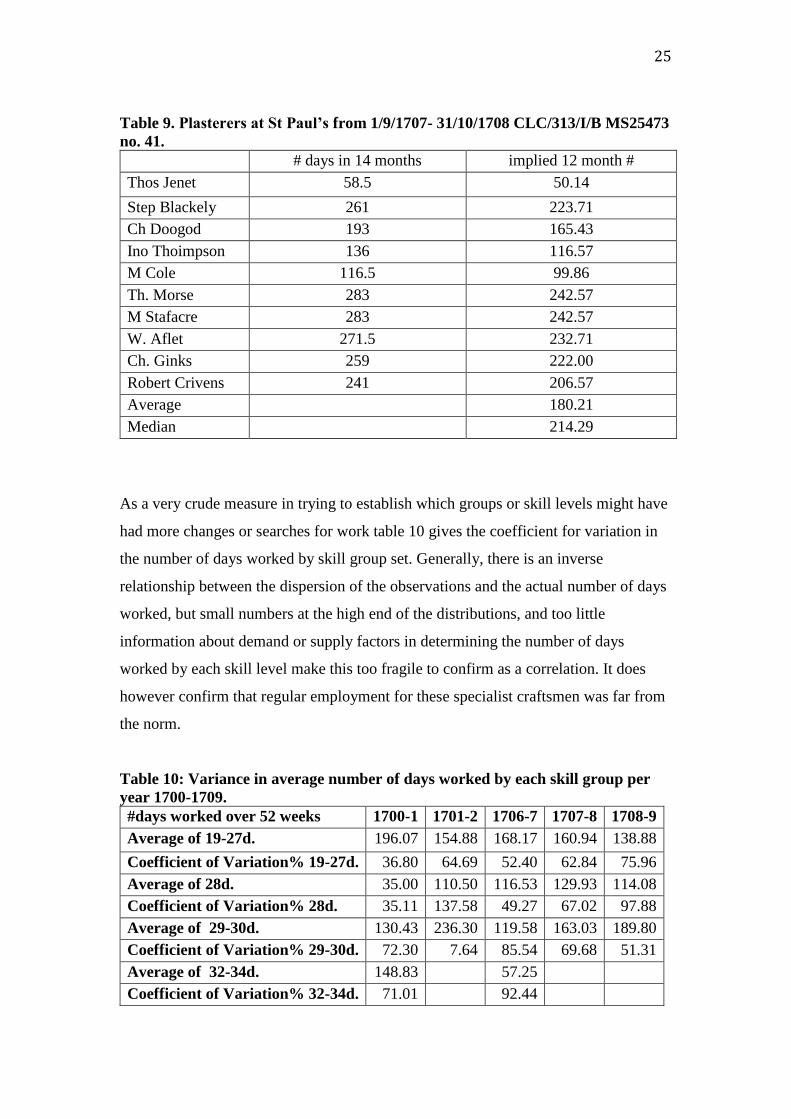
For comparison table 9 shows the number of days worked over a 14-month period by
plasterers working on the Dome in 1707-8.46 This was a dedicated team, who worked
on the Cathedral on a specific fixed task, billed in one unit – and where, because
quality was an issue Wren wanted it performed and contracted by the day. They were
also under time pressure. The average is a little higher than the masons, and the team
more stable. But the average for a tight knit team still falls far, far short of the 250
days assumed by other authors. The average of all the craftsmen who worked over
200 days was only 228, and all the others had an average of just 108 days worked in
the year.
46 LMA CLC/313/B/1/MS25473 NO 41 p.51 Christopher Wilkins bill. Wilkins received £50, over and
above the day rates for the contract. The data is only given in aggregate.
0
50
100
150
200
250
300
12 18 24 30 36
An
nu
al n
o. o
f d
ays
wo
rked
day rate
Av
Av >1yr
Av 1yr
min
max
25
Table 9. Plasterers at St Paul’s from 1/9/1707- 31/10/1708 CLC/313/I/B MS25473
no. 41.
# days in 14 months implied 12 month #
Thos Jenet 58.5 50.14
Step Blackely 261 223.71
Ch Doogod 193 165.43
Ino Thoimpson 136 116.57
M Cole 116.5 99.86
Th. Morse 283 242.57
M Stafacre 283 242.57
W. Aflet 271.5 232.71
Ch. Ginks 259 222.00
Robert Crivens 241 206.57
Average 180.21
Median 214.29
As a very crude measure in trying to establish which groups or skill levels might have
had more changes or searches for work table 10 gives the coefficient for variation in
the number of days worked by skill group set. Generally, there is an inverse
relationship between the dispersion of the observations and the actual number of days
worked, but small numbers at the high end of the distributions, and too little
information about demand or supply factors in determining the number of days
worked by each skill level make this too fragile to confirm as a correlation. It does
however confirm that regular employment for these specialist craftsmen was far from
the norm.
Table 10: Variance in average number of days worked by each skill group per
year 1700-1709.
#days worked over 52 weeks 1700-1 1701-2 1706-7 1707-8 1708-9
Average of 19-27d. 196.07 154.88 168.17 160.94 138.88
Coefficient of Variation% 19-27d. 36.80 64.69 52.40 62.84 75.96
Average of 28d. 35.00 110.50 116.53 129.93 114.08
Coefficient of Variation% 28d. 35.11 137.58 49.27 67.02 97.88
Average of 29-30d. 130.43 236.30 119.58 163.03 189.80
Coefficient of Variation% 29-30d. 72.30 7.64 85.54 69.68 51.31
Average of 32-34d. 148.83 57.25
Coefficient of Variation% 32-34d. 71.01 92.44
26
Without being able to estimate the costs of skill matching or job search for workers in
this market we cannot accurately construct an average income. There are, at present,
few facts or models with which to construct a likely estimate, other than try to
estimate the number of weeks it would have taken to find stable, or regular work.
Since St Paul’s was active as a site for so long (four decades) it may have distorted
these factors over the very long run. Other sites were usually active for much shorter
periods. Greenwich Hospital was completed within a decade 1696-1706, the Fleet
ditch was done under three years (1671-4), most City Churches were completed
within five years even if further works on spires and fitting out was recommenced
after a break. Most residential construction took less than a year.47 On maintenance
projects such as London Bridge most men were employed by the tide, or, as here, did
not work every week.48 Frictions of search and matching will have been greater on
other projects, unless consolidation in the industry and firm size led to better team
composition. There is no evidence that this was the case until the very end of the
eighteenth century. The organizational basis of the industry was unchanged until the
1820s. High job churn in construction is still typical today.49
Until we have better research on search and matching costs within all industries 180
days per year is a more robust and empirical estimate of the number of days
construction workers worked per annum. Eighteenth century urban building craftsmen
and labourers’ working year was bounded by structural demand factors of seasonality
and the building process, frictional costs of finding regular employment, and bounds
on their own ability to work at high physical intensity. The evidence from a unique
single firm source on a large and well-resourced site indicates that on average men
could only work 5.2 days per week in the long run, and if they did not have a regular
employment relationship they worked less than thirteen weeks in the year for an
employer. Employees who had worked with an employer in two years previously
47 McKellar, Birth of Modern London, Chap. 2, 6. 48 See LMA Bridge House Estates CLA/007/FIN/004 49 For modern differences in Construction industry labour market frictions see Davis, Faberman, and
Haltiwanger, ‘Recruiting Intensity during and after the Great Recession’, National and Industry
Evidence, pp.584-588. For the length of other projects see Wren Society, Volume X pp.52-54. TNA
ADM 67/2.
27
would have still only had 35 weeks work with him on average, equivalent to 182
days’ work per year
VII
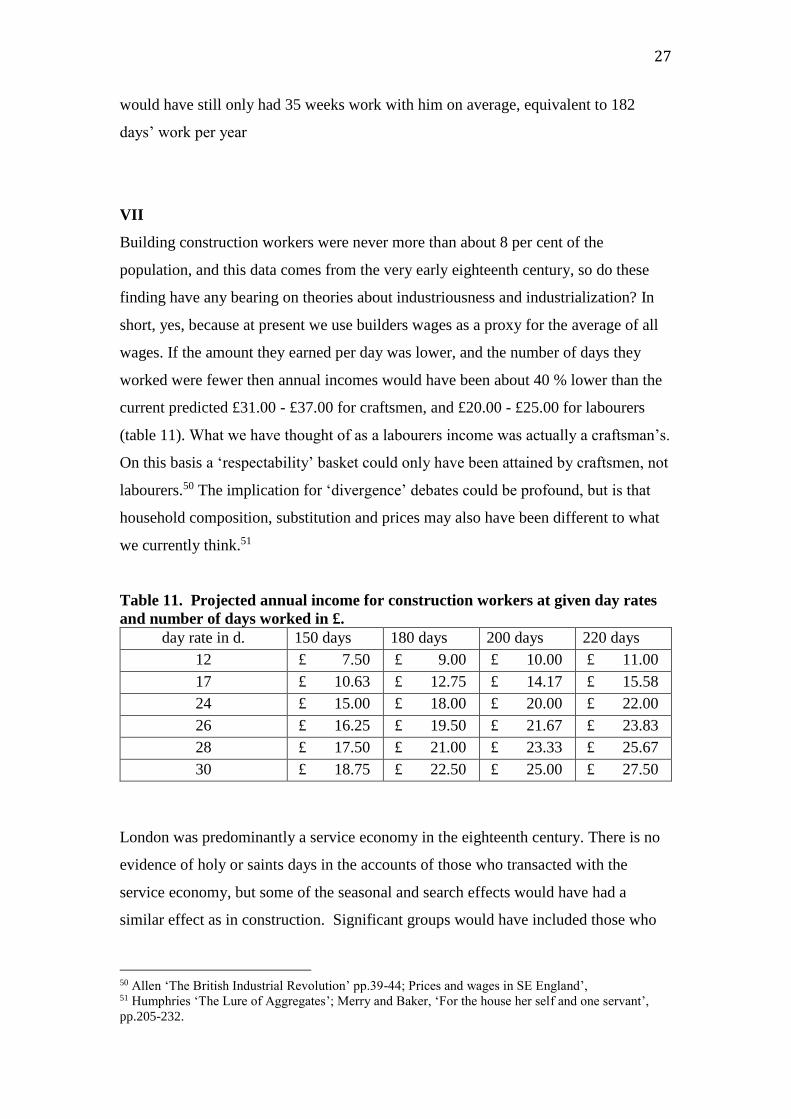
Building construction workers were never more than about 8 per cent of the
population, and this data comes from the very early eighteenth century, so do these
finding have any bearing on theories about industriousness and industrialization? In
short, yes, because at present we use builders wages as a proxy for the average of all
wages. If the amount they earned per day was lower, and the number of days they
worked were fewer then annual incomes would have been about 40 % lower than the
current predicted £31.00 - £37.00 for craftsmen, and £20.00 - £25.00 for labourers
(table 11). What we have thought of as a labourers income was actually a craftsman’s.
On this basis a ‘respectability’ basket could only have been attained by craftsmen, not
labourers.50 The implication for ‘divergence’ debates could be profound, but is that
household composition, substitution and prices may also have been different to what
we currently think.51
Table 11. Projected annual income for construction workers at given day rates
and number of days worked in £.
day rate in d. 150 days 180 days 200 days 220 days
12 £ 7.50 £ 9.00 £ 10.00 £ 11.00
17 £ 10.63 £ 12.75 £ 14.17 £ 15.58
24 £ 15.00 £ 18.00 £ 20.00 £ 22.00
26 £ 16.25 £ 19.50 £ 21.67 £ 23.83
28 £ 17.50 £ 21.00 £ 23.33 £ 25.67
30 £ 18.75 £ 22.50 £ 25.00 £ 27.50
London was predominantly a service economy in the eighteenth century. There is no
evidence of holy or saints days in the accounts of those who transacted with the
service economy, but some of the seasonal and search effects would have had a
similar effect as in construction. Significant groups would have included those who
50 Allen ‘The British Industrial Revolution’ pp.39-44; Prices and wages in SE England’, 51 Humphries ‘The Lure of Aggregates’; Merry and Baker, ‘For the house her self and one servant’,
pp.205-232.

28
worked on the river in transportation and distribution, retained service workers such
as porters, servants and domestic staff in large organizational institutions such as the
Temples and the Hospitals, and those privately retained by individuals. River workers
working year was as bounded as construction ones, with weather and supply of
transported goods constraining demand at Candlemas. Slower demand for goods
impacted demand for the service workers who sold, packaged, counted, or processed
them. Of course, how retailers and sales personnel experienced this seasonality needs
more research. Workers who were permanently employed or salaried were usually so
on wages significantly lower than day wage projections.
Calculating early modern income, or the ‘real wage’ on 250 days of pay distorts our
understanding of early modern labour markets, both the levels of income, and the
means and amount of employment. In order to continue believing in an ‘industrious
revolution’ in London we need to understand the mechanism by which casually hired
workers, or those who worked for commission or piece reduced their search costs or
worked longer hours. In construction it may well be that a process of consolidation in
the industry increased firm size and allowed more retained workers. We know that
this did not happen until the 1820s, however. For workers who were retained we need
evidence about how their working hours and days were extended, and if they were
paid any more. If retained workers were worked harder without increase in pay the
implications for theories of ‘industriousness’ and demand led development will be
significant.
References
Alchian, A., & Demsetz, H. (1972). Production, Information Costs, and Economic
Organization. The American Economic Review, 62(5), 777-795
Allen, R. (2009). The British industrial revolution in global perspective (New
approaches to economic and social history). Cambridge: Cambridge University Press.
Allen, R.C. Prices and wages in SE England;
https://www.nuffield.ox.ac.uk/people/sites/allen-research-pages/
Angeles, L. (2008). GDP per capita or real wages? Making sense of conflicting views
on pre-industrial Europe. Explorations in Economic History,45(2), 147-163.
29
Allen, R. (2001). The Great Divergence in European Wages and Prices from the
Middle Ages to the First World War. Explorations in Economic History,38(4), 411-
447.
Allen, R., & Weisdorf, J. (2011). Was there an 'industrious revolution' before the
industrial revolution? An empirical exercise for England, c. 1300—1830. The
Economic History Review, 64(3), 715-729.
Burdett, K. (1978). The Theory of Employee Job Search and Quit Rates. The
American Economic Review, 68(1), 212.
Broadberry, S. et al, British Economic Growth 1270- 1870, Cambridge: Cambridge
University Press 2015.
Boulton, J. (1996). Wage Labour in Seventeenth-Century London. The Economic
History Review, 49(2), 268-290.
Campbell, J. W. P., (2005), The Finances of the Carpenter in England 1660-1710: A
Case Study on the Implications of the Change from Craft to Designer-Based
Construction," in L’edilizia Prima Della Rivoluzione Industriale. Secc.Xiii-Xviii, ed.
S. Cavaciocchi (Prato: Instituto Internazionale di Storia Economica,), pp. 313-346.
Clark, G. (1994). Factory Discipline. The Journal of Economic History, 54(1), 128-
163.
Chase, M. (2000). Early trade unionism : Fraternity, skill and the politics of labour
(Studies in labour history (Ashgate :Aldershot)
Davis, S., Faberman, R., & Haltiwanger, J. (2012). Recruiting Intensity during and
after the Great Recession: National and Industry Evidence. American Economic
Review, 102(3), 584-588.
De Vries, J. (2008). The industrious revolution : Consumer behavior and the
household economy, 1650 to the present. Cambridge: Cambridge University Press.
Freudenberger, & Cummins. (1976). Health, work, and leisure before the industrial
revolution. Explorations in Economic History, 13(1), 1-12.
Gilboy, E. (1934). Wages in eighteenth century England (Harvard economic studies ;
v. 45). Cambridge, Mass: Harvard University Press.
Haas, J. (1969). The Introduction of Task Work into the Royal Dockyards, 1775.
Journal of British Studies, 8(2), 44-68.
Huberman, A.M. (1996). Escape from the market : Negotiating work in Lancashire.
Cambridge: Cambridge University Press.
Humphries, J. (2013). The lure of aggregates and the pitfalls of the patriarchal
perspective: A critique of the high wage economy interpretation of the British
industrial revolution. Economic History Review, 66(3), 693-714.
30
Humphries, J., & Weisdorf, J. (2015). The Wages of Women in England, 1260–1850.
75(2), 405-447.
Humphries, J. , and Weisdorf , J. Unreal wages? : Real income and economic growth
in England, 1260-1850, Oxford Working Papers in Economic and social History, no
147. Sept 2016.
Manning, A. (2003). Monopsony in motion : Imperfect competition in labor markets.
Princeton, N.J. ; Oxford: Princeton University Press.
McKellar, E. (1999). The birth of modern London : The development and design of
the city, 1660-1720 (Studies in design and material culture). Manchester: Manchester
University Press.
Merry, M., & Baker, P. (2009). 'For the house her self and one servant': Family and
Household in Late Seventeenth-century London. The London Journal, 34(3), 205-232.
Voth, H.J. (1998), 'Time and Work in Eighteenth-Century London', The Journal of
Economic History, 58/1 29-58.
Phelps Brown, E., & Hopkins, S. (1956). Seven Centuries of the Prices of
Consumables, compared with Builders' Wage-rates. Economica, 23, 296.
Postgate, R. (1923). The builders' history. London: Pub. for the National Federation
of Building Trade Operatives, by the Labour Publishing Company
Schwarz, L. (1985). The Standard of Living in the Long Run: London, 1700–1860.
Economic History Review, 38(1), 24-36.
Stephenson, J.Z. (2018). ‘Real’ wages? Contractors, workers, and pay in London
building trades, 1650–1800. Economic History Review, 71(1), 106-132.
Stephenson, J.Z. (2016). The Pay of Labourers and unskilled men on London building
sites 1660-1770
http://www.econsoc.hist.cam.ac.uk/docs/CWPESH%20number%2024%20June%2020
16.pdf
Thompson, E. (1967). Time, Work-Discipline, And Industrial Capitalism. Past and
Present, 38(1), 56-97.
The Wren Society Vols. XIII, XV.
Voth, H. (1998). Time and Work in Eighteenth-Century London. The Journal of
Economic History, 58(1), 29-58.
Woodward, D. (1995). Men at work : Labourers and building craftsmen in the towns
of Northern England, 1450-1750 (Cambridge studies in population, economy, and
society in past time ; 26). Cambridge: Cambridge University Press.

31
Archival resources:
The National Archives.
Work 5/1-74,
C106/145.
ADM 67/2
London Metropolitan Archive:
Bridge House Estates CLA/007/FIN/004
CLC 313/I/B/25473 no’s 34 – 46.
Middle Temple Archives:
ACCVOUBI MT.2/TUT
UNIVERSITY OF OXFORD DISCUSSION PAPERS IN ECONOMIC AND SOCIAL HISTORY
are edited by
Rui Esteves (Brasenose College, Oxford, OX1 4AJ) Marco Molteni (Pembroke College, Oxford, OX1 1DW)