Embed Size (px)
Citation preview
LOOKING TO AMERICA’S FUTURE: CHILDREN IN IMMIGRANT
FAMILIES
by
DONALD J. HERNANDEZ, Ph.D.Professor of Sociology and
Center for Social & Demographic AnalysisUniversity at Albany, SUNYEmail: [email protected]
Phone: (518) 442-4668
Family to Family National ConferenceAnnie E. Casey Foundation
Nashville, TNMay 5, 2006
Acknowledgements: Suzanne Macartney

● Immigration & New American Majority
● Family Strengths
● Major Challenges
● Housing, Language, and education
● Economic Consequences of Immigration
● New Child-Based Data for Local Areas
– OVERVIEW –

0.0
25.0
50.0
75.0
100.0
1980 1990 2000 2010 2020 2030 2040 2050 2060 2070 2080 2090 2100
American Indian (2000-2050 with NHOPI, Other)Asian/NHOPI (2000-2050 Asian alone, 2060-2100 includes American Indian)Black, Non-Hispanic Hispanic originWhite, Non-Hispanic
Figure 3. Percent of U.S. Children Ages 0-17 in Specified Race/Ethnic Groups, 1980-2100
Projections for 2000-2050 were released by the Census Bureau March 18, 2004. These projections take into account the much larger Hispanic population identified in Census 2000. Projections and estimates for other years are from an earlier series released by the Census Bureau January 13, 2000, and were based on the count of Hispanics in Census 1990.

61%50%
56%
84%72%70%
0%
25%
50%
75%
100%
2000 2030
Under 18 years 18 to 64 years 65 years and over
Slide 4. Estimates and Projected Percent of Non-Hispanic Whites by Age 2000 and 2030
Presented by Donald J. Hernandez. Data is from the Population Projections Program, Population Division, U.S. Census Bureau, Issued March 18, 2004.

Slide 5. Percent of Children in Immigrant Families: 1910, 1960, 1990 and 2000
28%
6%13%
20%
1910 1960 1990 2000
4/5 Citizen
s
Source: Calculated by Donald J. Hernandez from the U.S. Census Bureau, Census 2000, 5% Public Use Microdata (PUMS) files.
Source: Calculated by Donald J. Hernandez from the U.S. Bureau of the Census, Current Population Survey, 2000, public use microdata files.
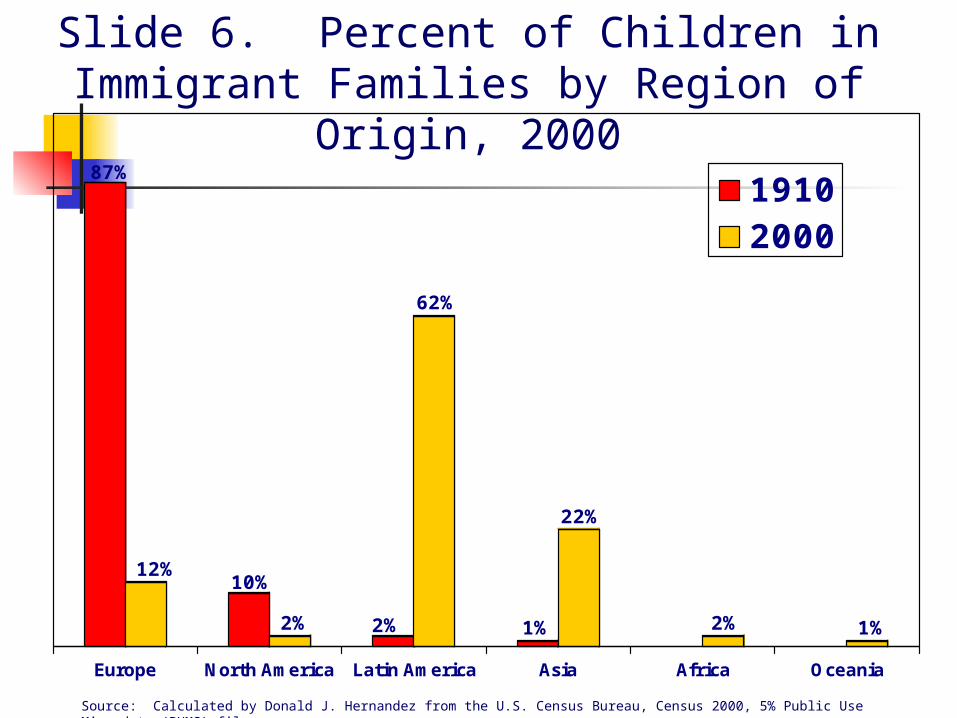
Slide 6. Percent of Children in Immigrant Families by Region of Origin, 2000
87%
12%10%
2% 2%
62%
1%
22%
2% 1%
Europe North America Latin America Asia Africa Oceania
19102000
Source: Calculated by Donald J. Hernandez from the U.S. Census Bureau, Census 2000, 5% Public Use Microdata (PUMS) files.

Slide 7. Percent of U.S. Children in Immigrant Families
Living with Two-Parents, 2000
Source: Calculated by Donald J. Hernandez from U.S. Bureau of the Census, Census 2000, 5pct Public Use Microdata (PUMS) files.
85%
79%
63%
69%
90%
75%
85%
85%
86%
93%
88%
91%
88%
76%
Mexico
Central American
Dominican Republic
Haiti
Hmong
Cambodia
Laos
Thailand
Vietnam
Pakistan/ Bangladesh
Afghanistan
Iraq
former USSR
Africa, Blacks
Two-ParentFamily
50% 100%
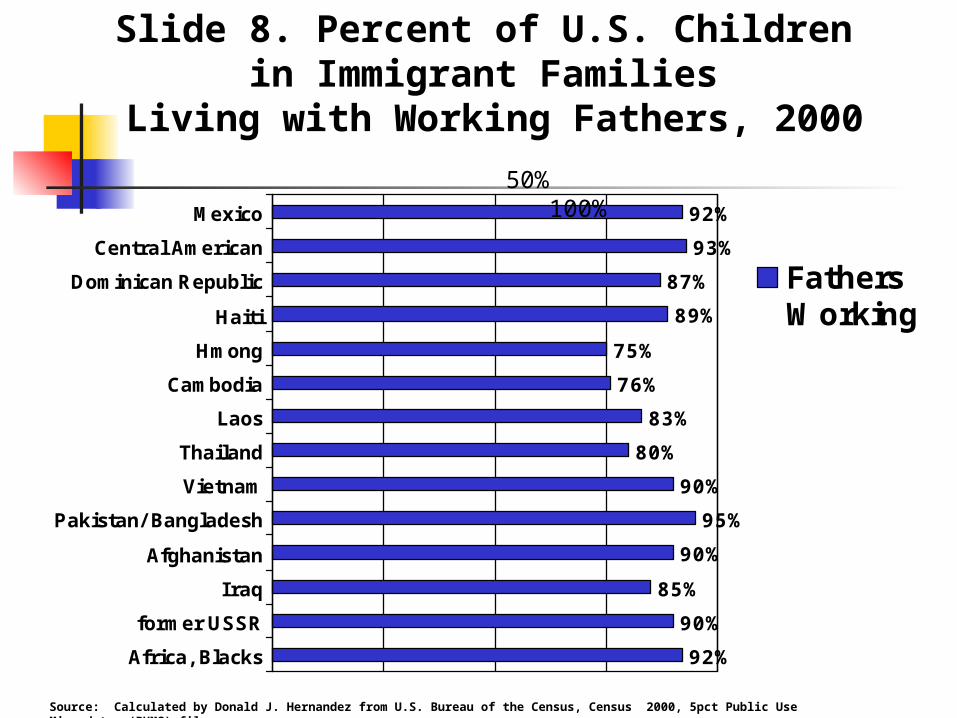
Slide 8. Percent of U.S. Children in Immigrant Families
Living with Working Fathers, 2000
Source: Calculated by Donald J. Hernandez from U.S. Bureau of the Census, Census 2000, 5pct Public Use Microdata (PUMS) files.
92%
93%
87%
89%
75%
76%
83%
80%
90%
95%
90%
85%
90%
92%
Mexico
Central American
Dominican Republic
Haiti
Hmong
Cambodia
Laos
Thailand
Vietnam
Pakistan/ Bangladesh
Afghanistan
Iraq
former USSR
Africa, Blacks
FathersWorking
50% 100%
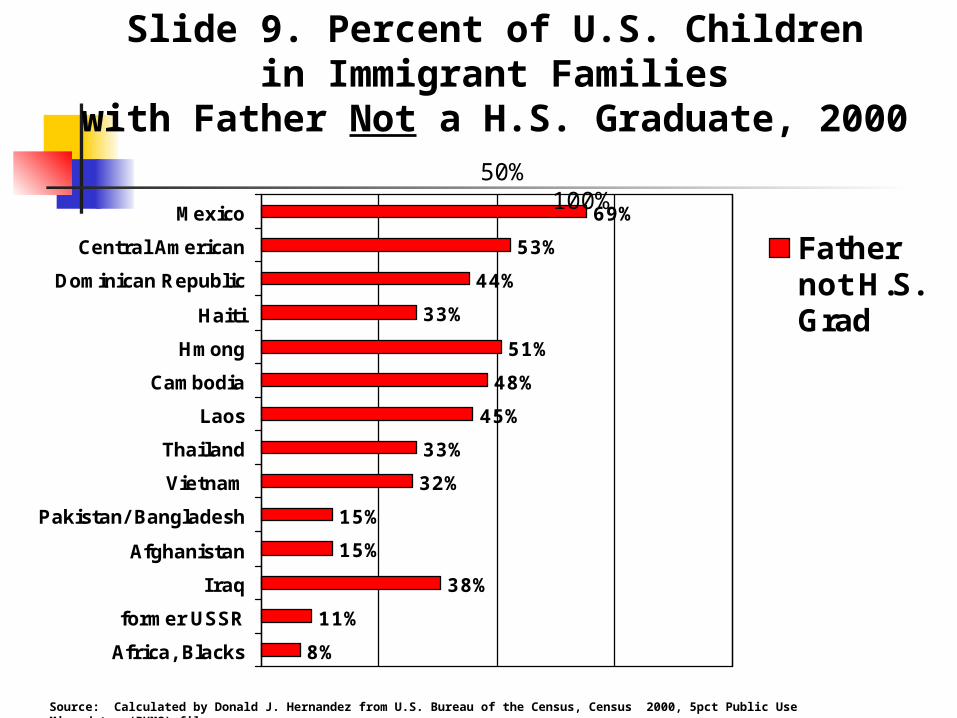
Slide 9. Percent of U.S. Children in Immigrant Families
with Father Not a H.S. Graduate, 2000
Source: Calculated by Donald J. Hernandez from U.S. Bureau of the Census, Census 2000, 5pct Public Use Microdata (PUMS) files.
69%
53%
44%
33%
51%
48%
45%
33%
32%
15%
15%
38%
11%
8%
Mexico
Central American
Dominican Republic
Haiti
Hmong
Cambodia
Laos
Thailand
Vietnam
Pakistan/ Bangladesh
Afghanistan
Iraq
former USSR
Africa, Blacks
Fathernot H.S.Grad
50% 100%
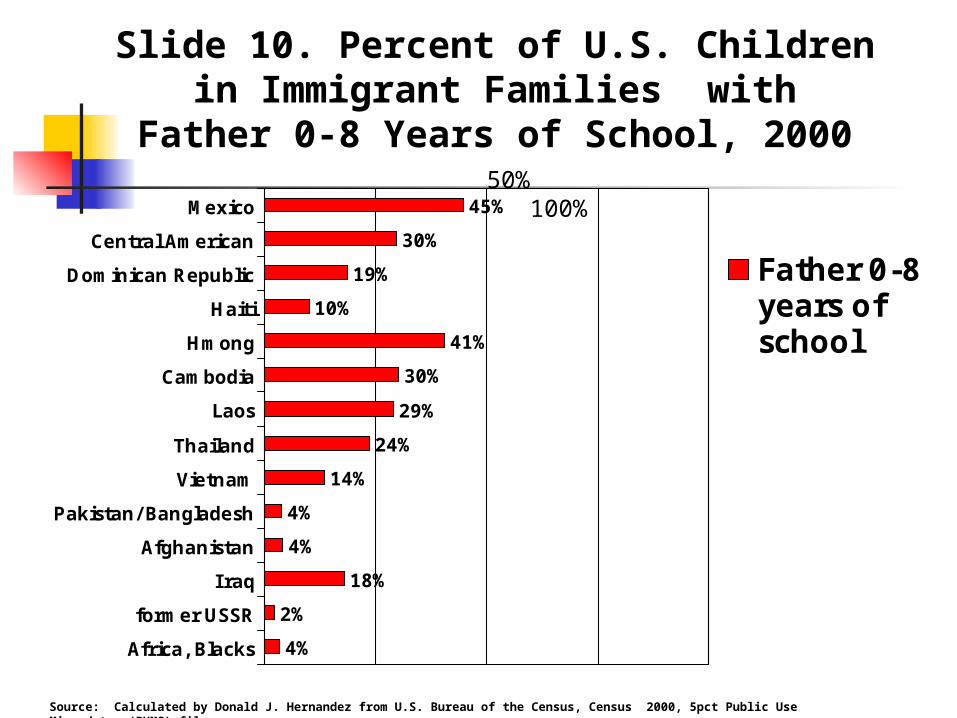
Slide 10. Percent of U.S. Children in Immigrant Families with
Father 0-8 Years of School, 2000
Source: Calculated by Donald J. Hernandez from U.S. Bureau of the Census, Census 2000, 5pct Public Use Microdata (PUMS) files.
45%
30%
19%
10%
41%
30%
29%
24%
14%
4%
4%
18%
2%
4%
Mexico
Central American
Dominican Republic
Haiti
Hmong
Cambodia
Laos
Thailand
Vietnam
Pakistan/ Bangladesh
Afghanistan
Iraq
former USSR
Africa, Blacks
Father 0-8years ofschool
50% 100%

Slide 11. Percent of U.S. Children in Immigrant Families
with Fathers Not Working Full-Time, 2000
Source: Calculated by Donald J. Hernandez from U.S. Bureau of the Census, Census 2000, 5pct Public Use Microdata (PUMS) files.
35%
31%
38%
32%
44%
42%
38%
37%
30%
30%
36%
34%
33%
32%
Mexico
Central American
Dominican Republic
Haiti
Hmong
Cambodia
Laos
Thailand
Vietnam
Pakistan/ Bangladesh
Afghanistan
Iraq
former USSR
Africa, Blacks
FatherNotWorkingFull-Time
50% 100%

Slide 12. Percent of U.S. Children in Immigrant Families
Living in Official Poverty, 2000
Source: Calculated by Donald J. Hernandez from U.S. Bureau of the Census, Census 2000, 5pct Public Use Microdata (PUMS) files.
30%
22%
32%
23%
40%
34%
28%
25%
19%
22%
29%
26%
20%
20%
Mexico
Central American
Dominican Republic
Haiti
Hmong
Cambodia
Laos
Thailand
Vietnam
Pakistan/ Bangladesh
Afghanistan
Iraq
former USSR
Africa, Blacks
Official Poverty
50% 100%

Slide 13. Percent of U.S. Children in Immigrant Families
Living in Basic Budget Poverty, 2000
Source: Calculated by Donald J. Hernandez from U.S. Bureau of the Census, Census 2000, 5pct Public Use Microdata (PUMS) files.
76%
66%
75%
68%
84%
66%
65%
56%
50%
57%
65%
55%
46%
54%
Mexico
Central American
Dominican Republic
Haiti
Hmong
Cambodia
Laos
Thailand
Vietnam
Pakistan/ Bangladesh
Afghanistan
Iraq
former USSR
Africa, Blacks
BasicBudgetPoverty
50% 100%
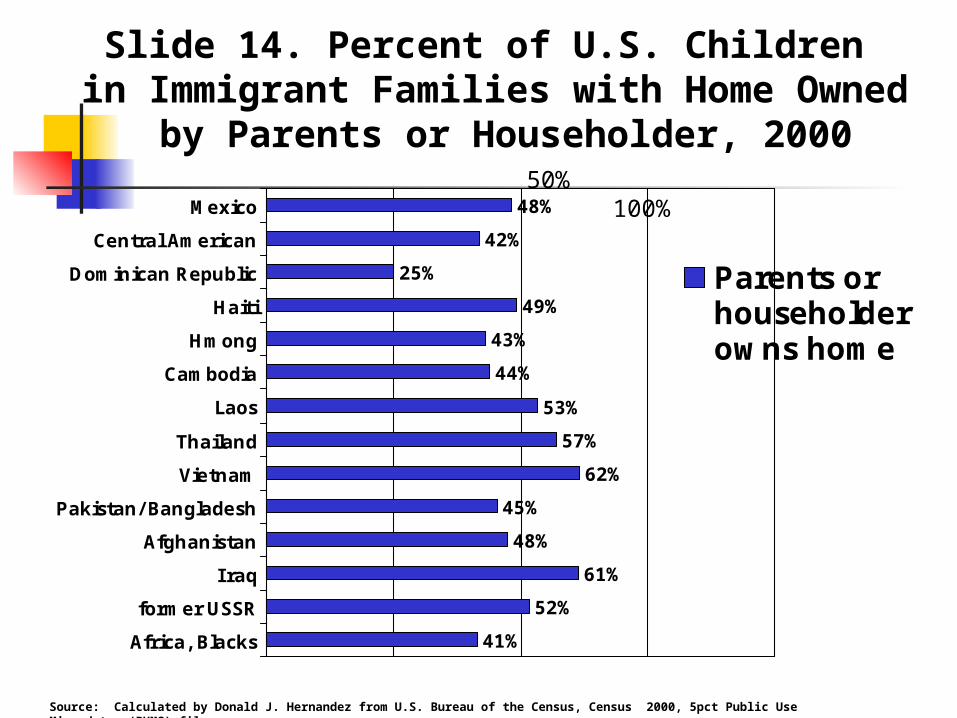
Slide 14. Percent of U.S. Children in Immigrant Families with Home Owned
by Parents or Householder, 2000
Source: Calculated by Donald J. Hernandez from U.S. Bureau of the Census, Census 2000, 5pct Public Use Microdata (PUMS) files.
48%
42%
25%
49%
43%
44%
53%
57%
62%
45%
48%
61%
52%
41%
Mexico
Central American
Dominican Republic
Haiti
Hmong
Cambodia
Laos
Thailand
Vietnam
Pakistan/ Bangladesh
Afghanistan
Iraq
former USSR
Africa, Blacks
Parents orhouseholderowns home
50% 100%
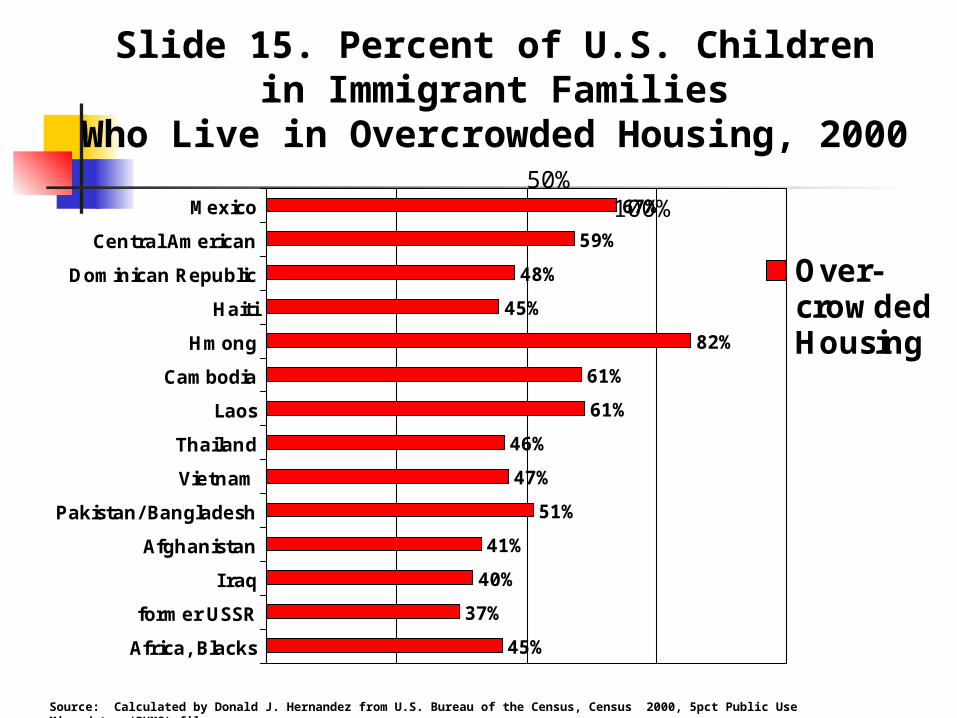
Slide 15. Percent of U.S. Children in Immigrant Families
Who Live in Overcrowded Housing, 2000
Source: Calculated by Donald J. Hernandez from U.S. Bureau of the Census, Census 2000, 5pct Public Use Microdata (PUMS) files.
67%
59%
48%
45%
82%
61%
61%
46%
47%
51%
41%
40%
37%
45%
Mexico
Central American
Dominican Republic
Haiti
Hmong
Cambodia
Laos
Thailand
Vietnam
Pakistan/ Bangladesh
Afghanistan
Iraq
former USSR
Africa, Blacks
Over-crowdedHousing
50% 100%
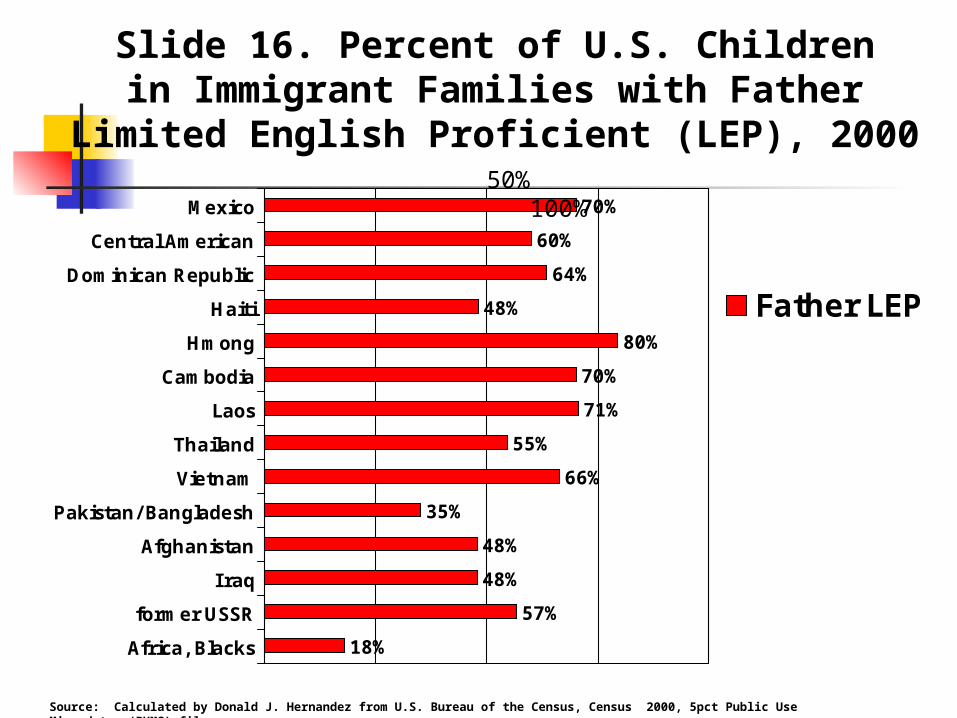
Slide 16. Percent of U.S. Children in Immigrant Families with Father
Limited English Proficient (LEP), 2000
Source: Calculated by Donald J. Hernandez from U.S. Bureau of the Census, Census 2000, 5pct Public Use Microdata (PUMS) files.
70%
60%
64%
48%
80%
70%
71%
55%
66%
35%
48%
48%
57%
18%
Mexico
Central American
Dominican Republic
Haiti
Hmong
Cambodia
Laos
Thailand
Vietnam
Pakistan/ Bangladesh
Afghanistan
Iraq
former USSR
Africa, Blacks
Father LEP
50% 100%
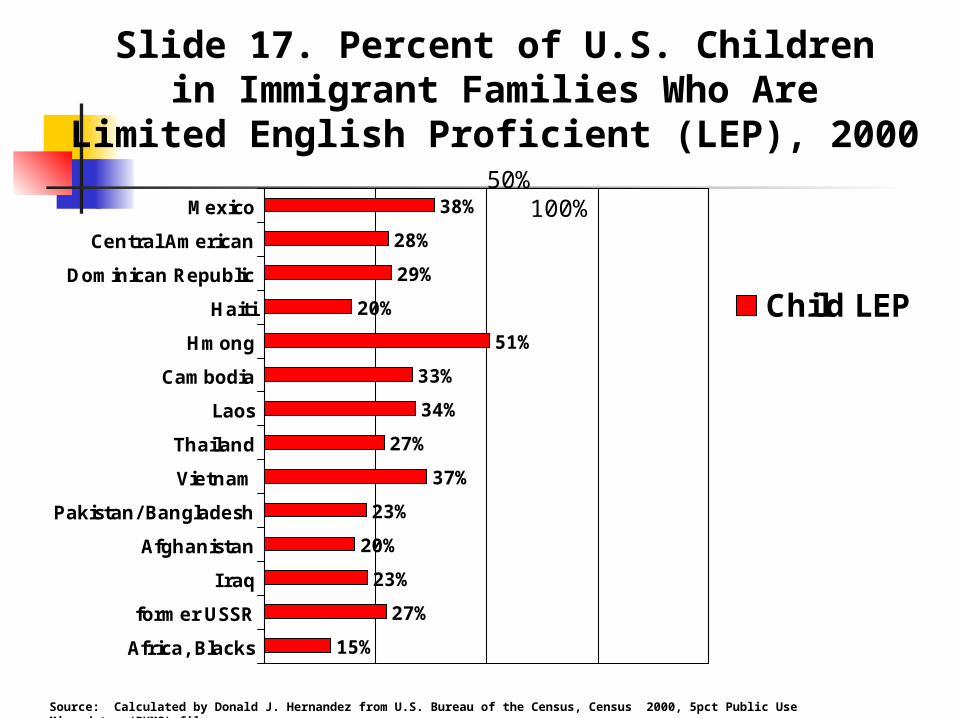
Slide 17. Percent of U.S. Children in Immigrant Families Who Are
Limited English Proficient (LEP), 2000
Source: Calculated by Donald J. Hernandez from U.S. Bureau of the Census, Census 2000, 5pct Public Use Microdata (PUMS) files.
38%
28%
29%
20%
51%
33%
34%
27%
37%
23%
20%
23%
27%
15%
Mexico
Central American
Dominican Republic
Haiti
Hmong
Cambodia
Laos
Thailand
Vietnam
Pakistan/ Bangladesh
Afghanistan
Iraq
former USSR
Africa, Blacks
Child LEP
50% 100%

Slide 18. Percent of U.S. Children in Immigrant Families Who Speak English
Very Well, and Speak Another Language at Home,
2000
Source: Calculated by Donald J. Hernandez from U.S. Bureau of the Census, Census 2000, 5pct Public Use Microdata (PUMS) files.
53%
56%
62%
52%
45%
49%
51%
42%
48%
61%
66%
53%
57%
28%
Mexico
Central American
Dominican Republic
Haiti
Hmong
Cambodia
Laos
Thailand
Vietnam
Pakistan/ Bangladesh
Afghanistan
Iraq
former USSR
Africa, Blacks
ChildPotentialBilingual
50% 100%
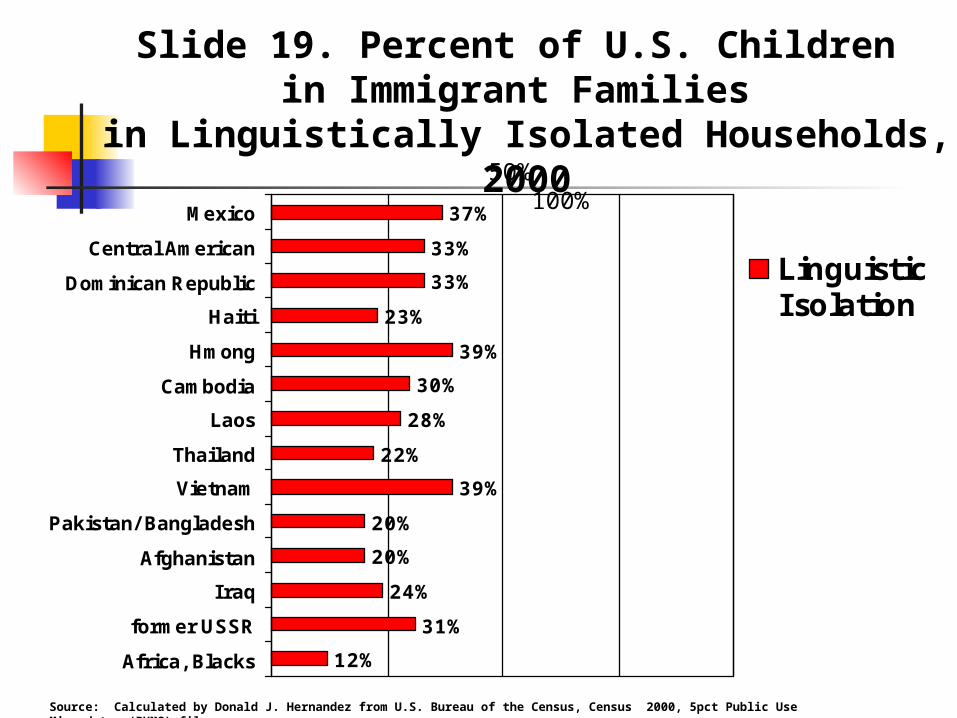
Slide 19. Percent of U.S. Children in Immigrant Families
in Linguistically Isolated Households, 2000
Source: Calculated by Donald J. Hernandez from U.S. Bureau of the Census, Census 2000, 5pct Public Use Microdata (PUMS) files.
37%
33%
33%
23%
39%
30%
28%
22%
39%
20%
20%
24%
31%
12%
Mexico
Central American
Dominican Republic
Haiti
Hmong
Cambodia
Laos
Thailand
Vietnam
Pakistan/ Bangladesh
Afghanistan
Iraq
former USSR
Africa, Blacks
LinguisticIsolation
50% 100%

Slide 20. Percent of U.S. Four-Year-Oldsin Immigrant Families
Enrolled in Pre-k/Nursery School, 2000
Source: Calculated by Donald J. Hernandez from U.S. Bureau of the Census, Census 2000, 5pct Public Use Microdata (PUMS) files.
35%
43%
52%
60%
25%
29%
35%
50%
47%
47%
35%
43%
53%
61%
Mexico
Central American
Dominican Republic
Haiti
Hmong
Cambodia
Laos
Thailand
Vietnam
Pakistan/ Bangladesh
Afghanistan
Iraq
former USSR
Africa, Blacks
Pre/NurserySchool
50% 100%

Slide 21. Demographic Overview for Children in Immigrant Families
immigrant resources:• Two-parent families with other adults in home • Strong work ethic• Potential bilingual skills for U.S. economy• Homeownership, commitment to community
immigrant challenges:• Low educational attainments• Much part-time, part-year work, high poverty• Overcrowded housing, low health insurance• Limited English proficiency• Low pre-k/nursery school enrollment
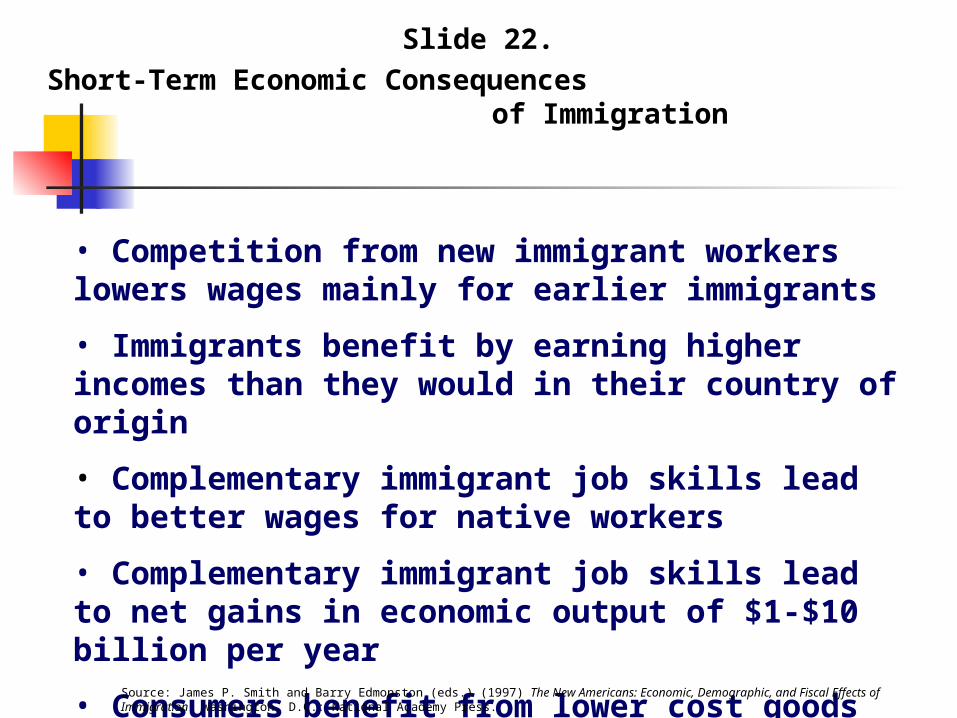
Slide 22. Short-Term Economic Consequences
of Immigration
• Competition from new immigrant workers lowers wages mainly for earlier immigrants
• Immigrants benefit by earning higher incomes than they would in their country of origin
• Complementary immigrant job skills lead to better wages for native workers
• Complementary immigrant job skills lead to net gains in economic output of $1-$10 billion per year
• Consumers benefit from lower cost goods and services produced by immigrants
Source: James P. Smith and Barry Edmonston (eds.) (1997) The New Americans: Economic, Demographic, and Fiscal Effects of Immigration. Washington, D.C.: National Academy Press.
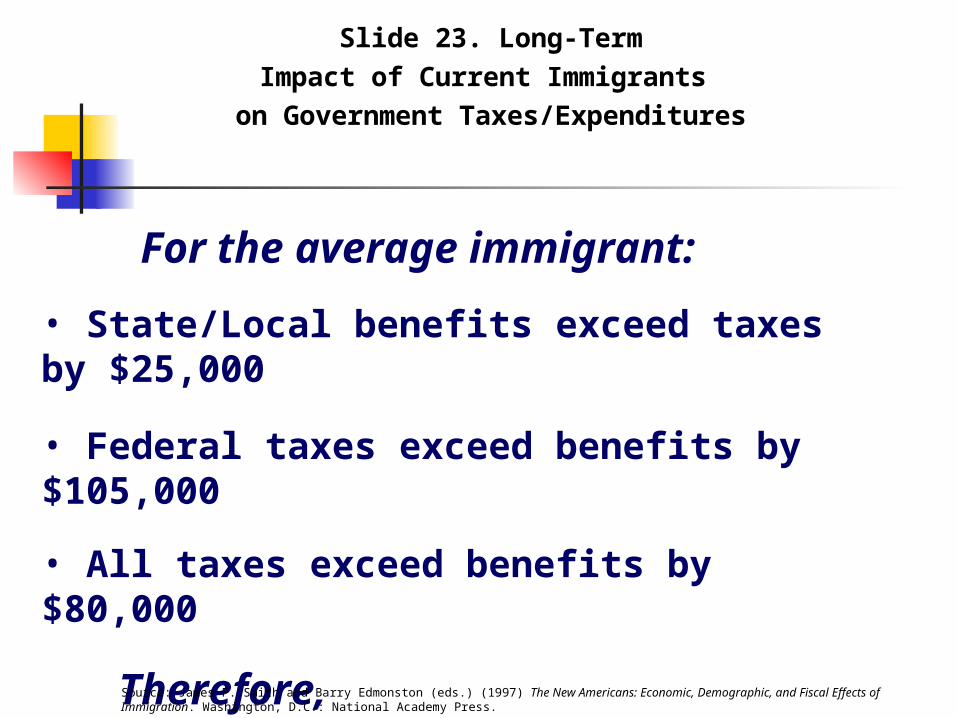
Slide 23. Long-TermImpact of Current Immigrants
on Government Taxes/Expenditures
For the average immigrant:
• State/Local benefits exceed taxes by $25,000
• Federal taxes exceed benefits by $105,000
• All taxes exceed benefits by $80,000
Therefore, the lifetime net contribution of the average immigrant to government treasuries is $80,000 Source: James P. Smith and Barry Edmonston (eds.) (1997) The New Americans: Economic, Demographic, and Fiscal Effects of
Immigration. Washington, D.C.: National Academy Press.

Slide 24. New Child Indicators for Public Policy, Advocacy, and Philanthropy
supported by
-- The William and Flora Hewlett Foundation
-- Annie E. Casey Foundation
-- W. T. Grant Foundation
-- Winthrop Rockefeller Foundation
-- Center for Law and Social Policy
-- National Task Force on Early Childhood Education for Hispanics

Slide 25. WE ARE PRODUCING 200 CHILD INDICATORS
FOR LOCAL AREAS
Topics include
Immigrant Generation, Country of Origin,
Language Proficiency, Citizenship, Race-Ethnicity
and
Family, Economic, Educational,
Housing, and Neighborhood Situations

LOOKING TO AMERICA’S FUTURE: CHILDREN IN IMMIGRANT
FAMILIES
by
DONALD J. HERNANDEZ, Ph.D.Professor of Sociology and
Center for Social & Demographic AnalysisUniversity at Albany, SUNYEmail: [email protected]
Phone: (518) 442-4668
Family to Family National ConferenceAnnie E. Casey Foundation
Nashville, TNMay 5, 2006
Acknowledgements: Suzanne Macartney