Embed Size (px)
Citation preview
LOS ANGELES COUNTY SHERIFF’S DEPARTMENT – DEPARTMENT CRIME STATISTICS 1960-2012
(Fiscal Years 1960-1990, Calendar Years 1991-2012)
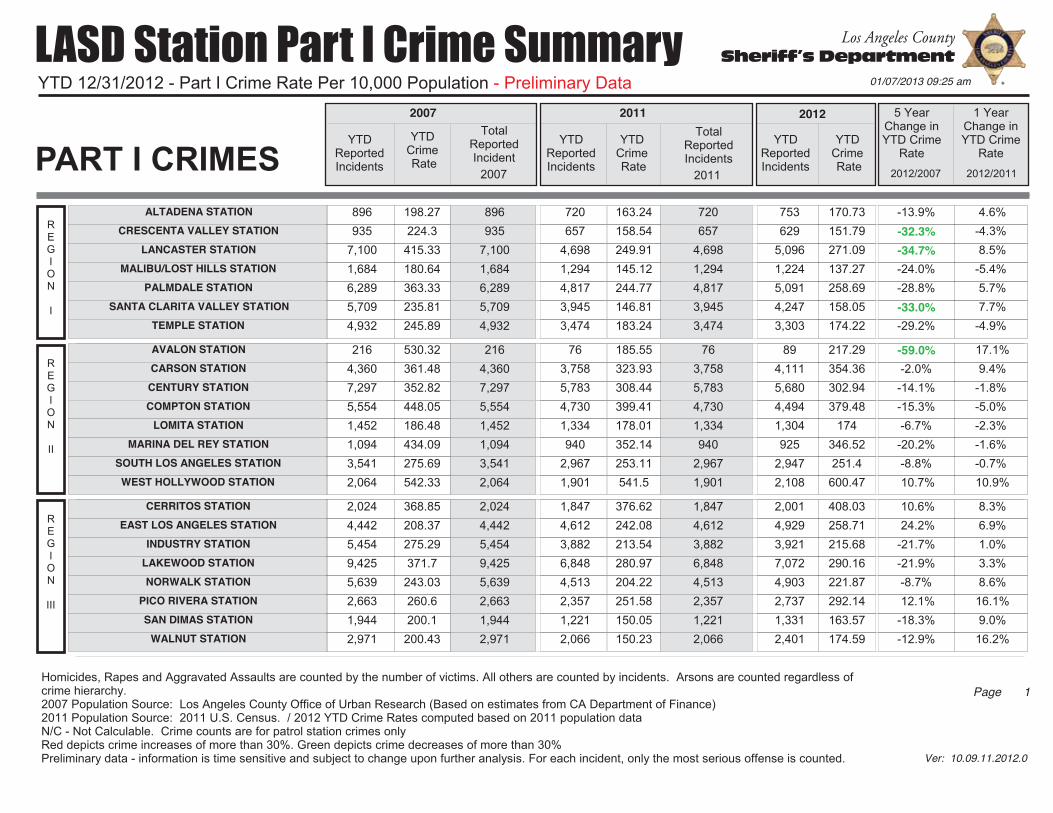
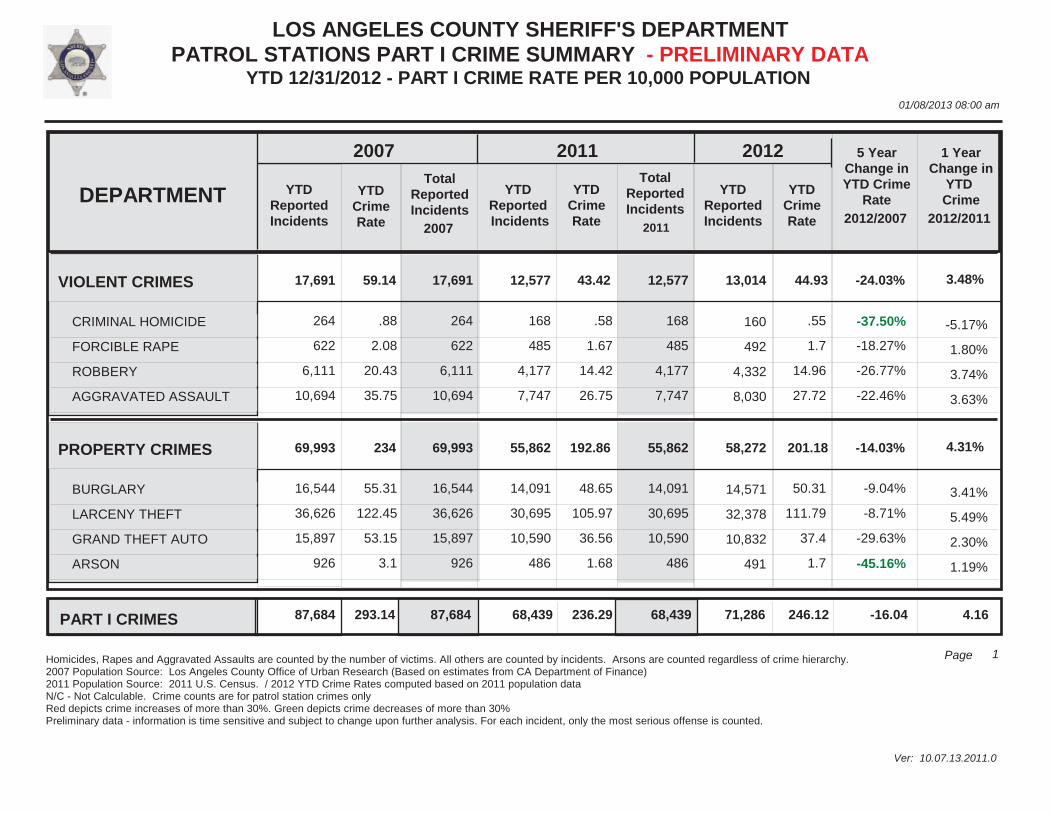
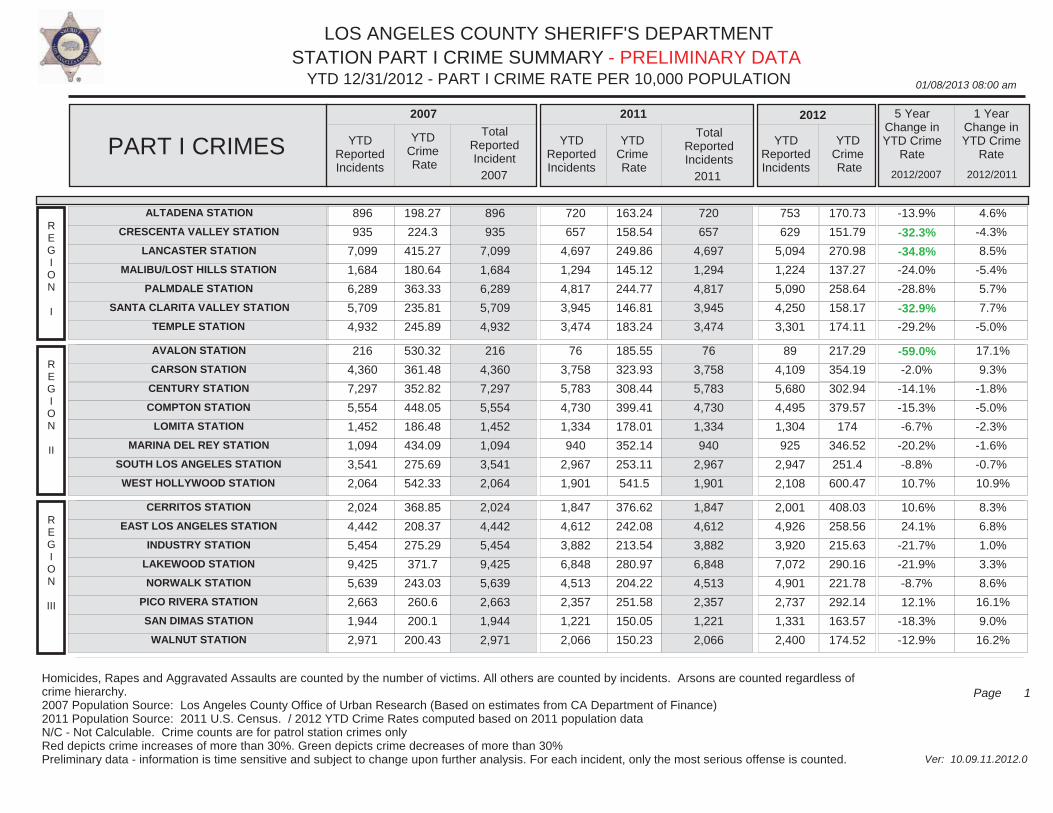
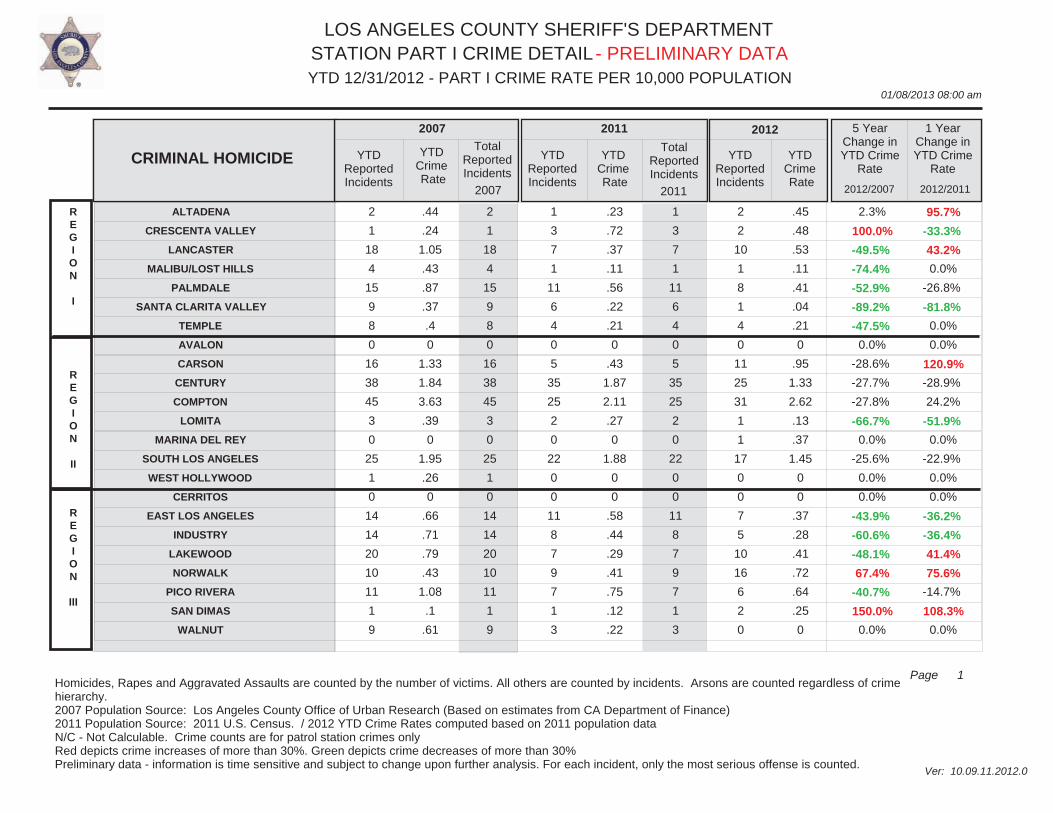
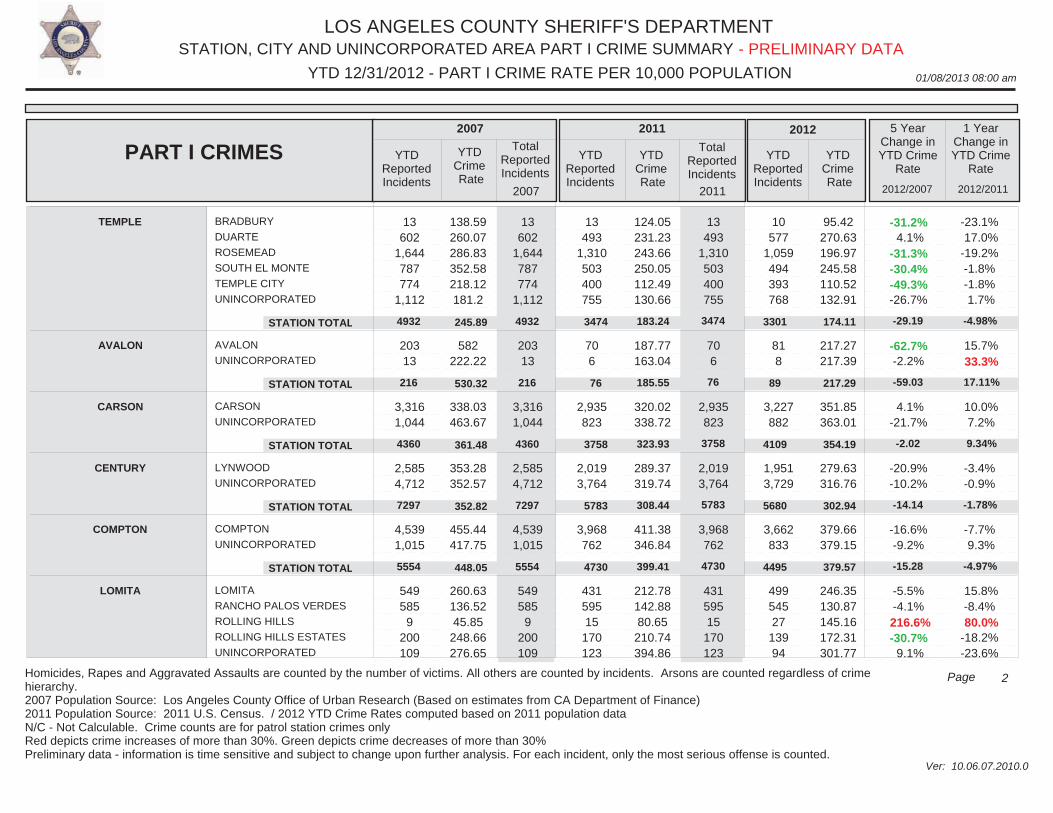
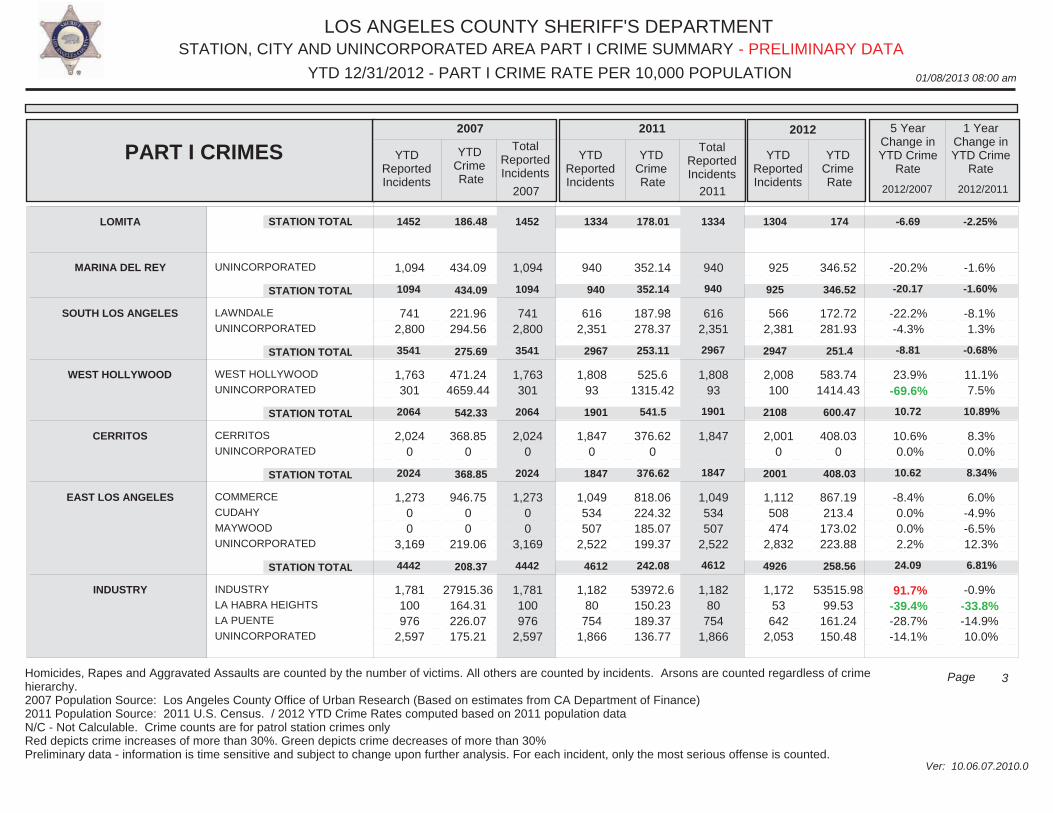
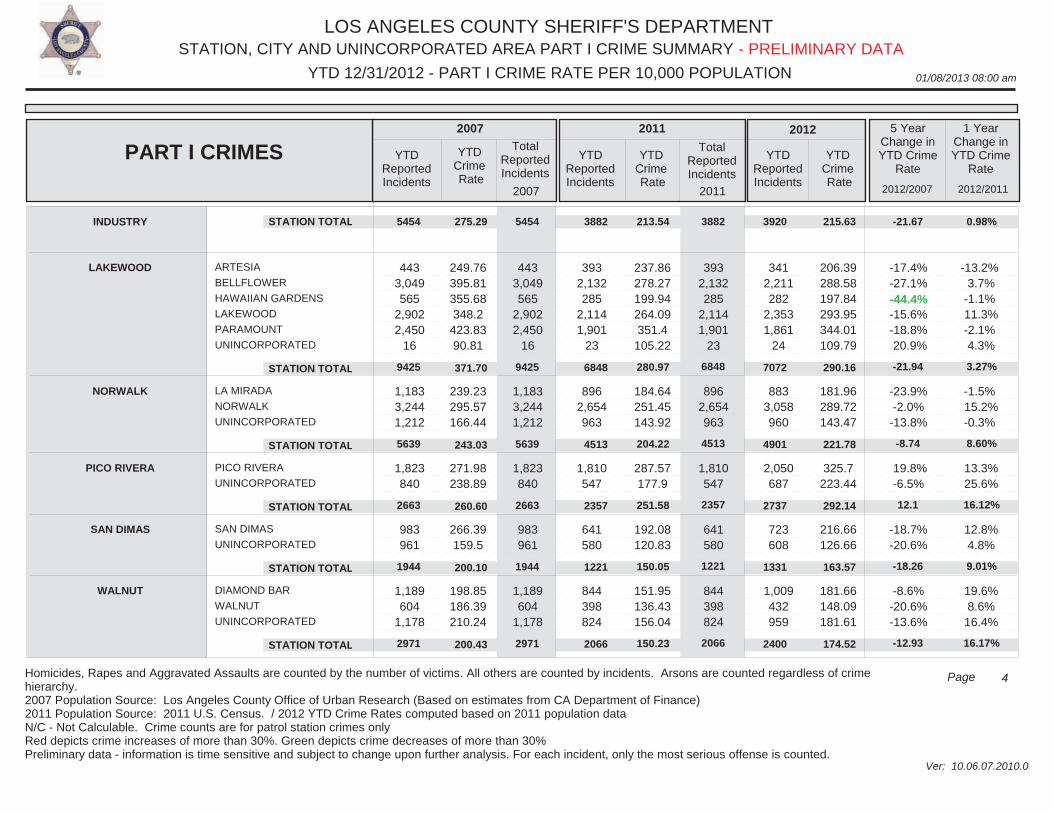
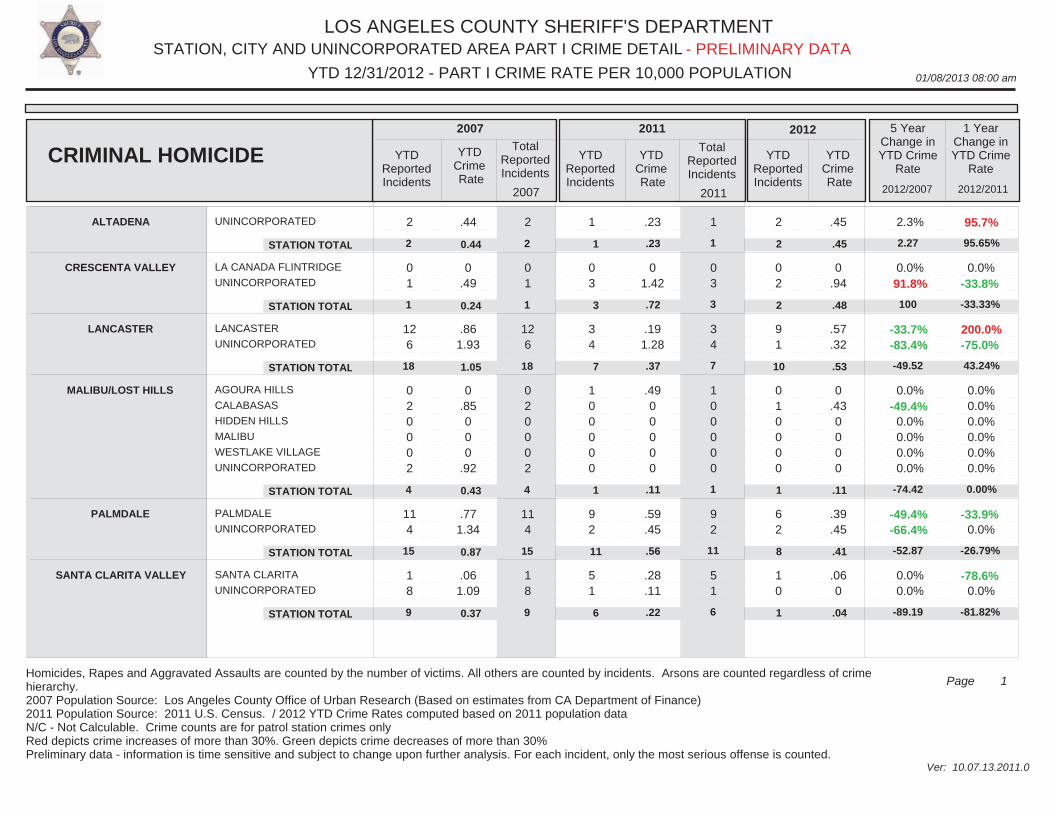
One hundred and nineteen pages of details showing preliminary reported crime statistics for the 42 contract cities and 130 unincorporated communities policed by the Los Angeles County Sheriff's Department can be found at www.lasd.org. Please visit the “Crime Prevention and Information” page or access them directly at http://file.lacounty.gov/lasd/cms1_148405.pdf. (To review the statistics, open the file, right click with your computer mouse and use the search engine.) The preliminary 2012 reported crime statistics are compared to 2011 and to five years ago (2007). Reported crimes for each sheriff's station and city include homicides, robberies, burglaries, and more. Preliminary reported crime data for 2012 shows that criminal homicides in sheriff’s patrol areas have decreased by 2.58 percent, compared to the same year-to-date period last year (170 homicides in 2011 compared to 166 in 2012). This follows a five-year continuous decrease, resulting in a 37.50 percent decrease in homicides in 2012 compared to five years ago, and the lowest number of homicides in sheriff’s patrol areas since 1970 (see more information on 1960-2012 homicides below). Allowing for population changes, 2012 had the lowest homicide rate since 1970. Most notable, were decreases in homicides in the Century (which includes the city of Lynwood and nearby unincorporated areas), Santa Clarita, Industry, East Los Angeles and South Los Angeles Station areas (formerly Lennox Station). Century Station homicides have reduced by 28.9 percent in one year, with 35 homicides in 2011 compared to 25 in 2012. Century Station’s 2012 homicides were 27.7 percent less than five years ago. Santa Clarita Station had 6 homicides during 2011, as compared to 1 homicide in 2012, for an 81.8 percent one-year decrease. Santa Clarita Station’s 2012 homicides were 89.2 percent less than five years ago. Industry Station had 8 homicides in 2011, as compared to 5 in 2012, for a 36.4 percent one-year decrease. Industry Station’s homicides were 60.6 percent less than five years ago. East Los Angeles Station had 11 homicides in 2011, as compared to 7
homicides in 2012, for a 36.2 percent one-year decrease. East Los Angeles Station’s homicides were 43.9 percent less than five years ago. South Los Angeles Station homicides have reduced by 22.9 percent in one-year, with 22 homicides in 2011 compared to 17 homicides in 2012. South Los Angeles Station’s 2012 homicides were 25.6 percent less than five years ago.
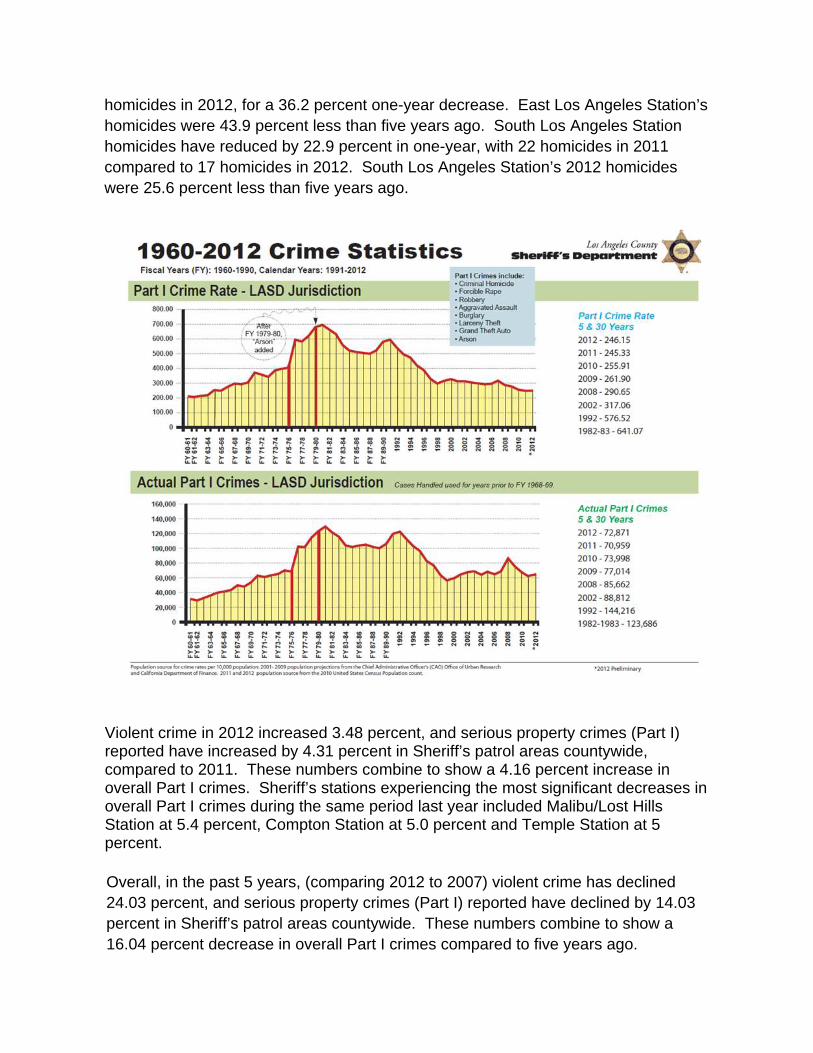
Violent crime in 2012 increased 3.48 percent, and serious property crimes (Part I) reported have increased by 4.31 percent in Sheriff’s patrol areas countywide, compared to 2011. These numbers combine to show a 4.16 percent increase in overall Part I crimes. Sheriff’s stations experiencing the most significant decreases in overall Part I crimes during the same period last year included Malibu/Lost Hills Station at 5.4 percent, Compton Station at 5.0 percent and Temple Station at 5 percent. Overall, in the past 5 years, (comparing 2012 to 2007) violent crime has declined 24.03 percent, and serious property crimes (Part I) reported have declined by 14.03 percent in Sheriff’s patrol areas countywide. These numbers combine to show a 16.04 percent decrease in overall Part I crimes compared to five years ago.
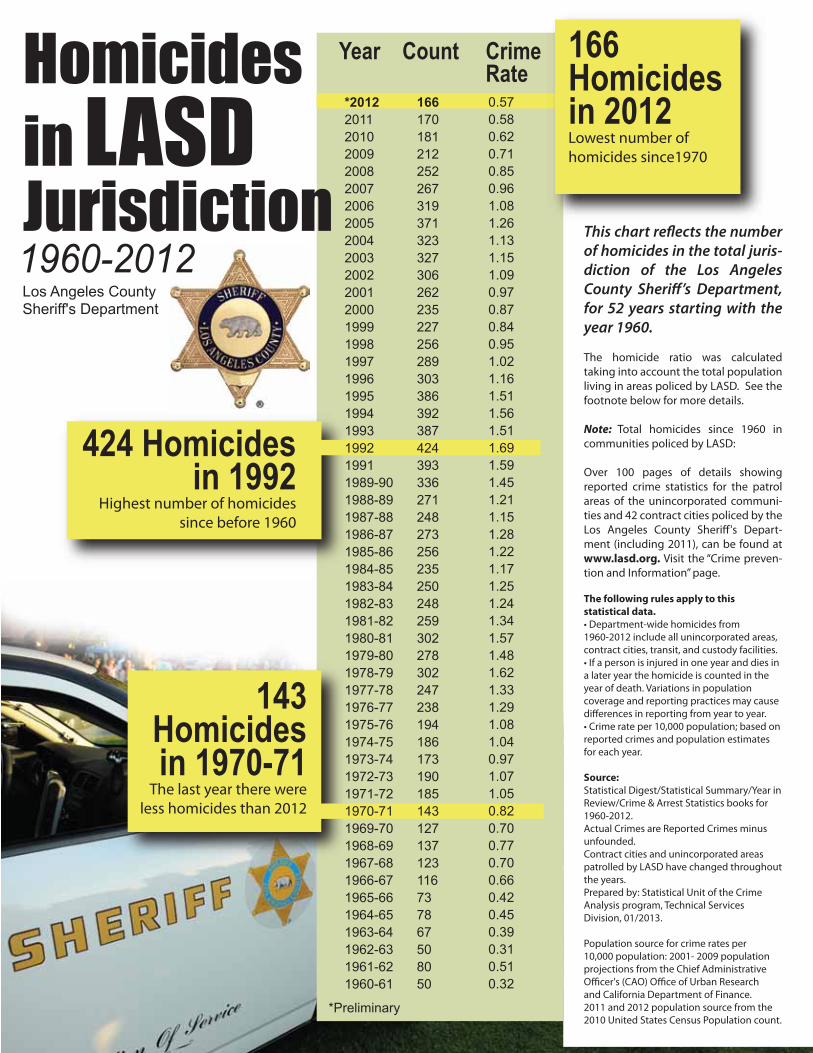
“Thanks to the trust of the public, community partnerships, and the brave and dedicated efforts of the sheriff’s deputies and professional staff of the Los Angeles County Sheriff’s Department, we have seen historic lows in crime,” said Sheriff Lee Baca. “Our strategy of Suppression, Prevention, Intervention, and Technology continue to make a positive impact on the lives of the people of this county; yet we know there is more to be done. We will continue to dedicate ourselves to the mission of public safety.” Homicide Statistics (1970-2012) Over 100 pages of details showing reported crime statistics for the patrol areas of the unincorporated communities and 42 contract cities policed by the Los Angeles County Sheriff's Department (including preliminary 2010), can be found at www.lasd.org. Visit the “Crime Prevention and Information” page or access them directly at http://file.lacounty.gov/lasd/cms1_148405.pdf. The below chart reflects the number of homicides in the total jurisdiction of the Los Angeles County Sheriff’s Department, for 42 years beginning with 1970. (Statistics for 2012 are preliminary.) The homicide ratio was calculated using the population increases for each year’s homicides. See the footnote at the bottom of the chart for more details. These numbers do not reflect the tragedies and descriptions of the circumstances of each homicide. Note: Total homicides since 1970 in communities policed by the LASD: 166 homicides in 2012 – the lowest number of homicides since 1970 424 homicides in 1992 – the highest number of homicides since 1960 143 homicides in 1970 – the last year there were less homicides than in 2012
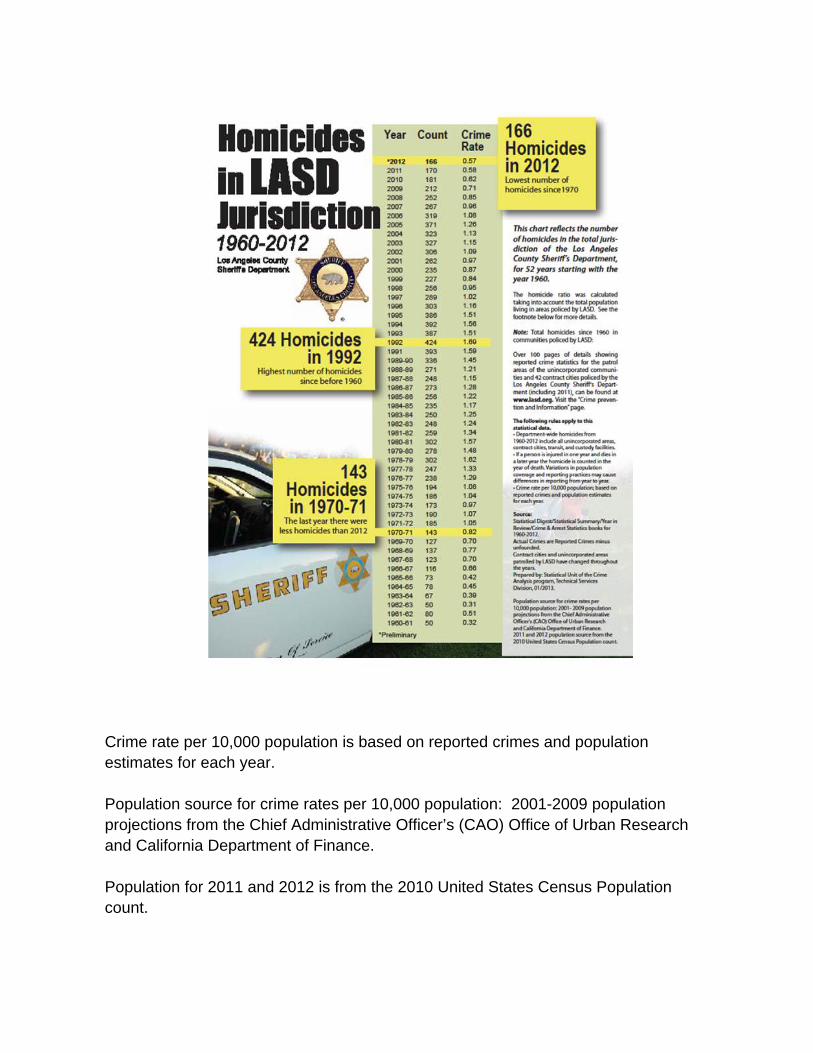
Crime rate per 10,000 population is based on reported crimes and population estimates for each year. Population source for crime rates per 10,000 population: 2001-2009 population projections from the Chief Administrative Officer’s (CAO) Office of Urban Research and California Department of Finance. Population for 2011 and 2012 is from the 2010 United States Census Population count.
Source: Statistical Digest/Statistical Summary/Year in Review/Crime & Arrest Statistics books for 2011. (2010 numbers are preliminary.) Actual Crimes are Reported Crimes minus Unfounded. Contract cities and unincorporated areas patrolled by LASD have changed throughout the years. Prepared by: Statistical Unit of the Crime Analysis Program, Technical Services Division, January 7, 2013 CAP #10-093-LS Partner to prevent or report crime by contacting your local sheriff’s station. Or, if you wish to remain anonymous, call “LA Crime Stoppers” by dialing 800-222-TIPS (8477), texting the letters TIPLA plus your tip to CRIMES (274637), or using the website http://lacrimestoppers.org. To receive more detailed, up-to-date information directly from LASD via e-mail, register for "Nixle" alerts at www.Nixle.com or more directly at https://local.nixle.com/register/ and register for "LASD-Headquarters Newsroom (SHB), Los Angeles County Sheriff" and your local LASD station area. Or, text your zip code to 888777 to receive text alerts only. Standard text messaging rates may apply, depending on your calling plan. To access the new Federal Bureau of Investigation (FBI) Online Tool that makes decades of crime statistics research easier, log on to the following links: UCR Data Tool; Crime Statistics; Uniform Crime Reporting Program; Crime in the United States, 2009. Click Here: http://sheriff.lacounty.gov/wps/portal/lasd/!ut/p/c5/04_SB8K8xLLM9MSSzPy8xBz9CP0os3gLAwgwcjfzdDPw9Hf3dAswNjcyCDLRDwfpwK3CyRwib4ADOBro-3nk56bqF2Rnpzk6KioCAMV4niQ!/dl3/d3/L2dJQSEvUUt3QS9ZQnZ3LzZfOTAwMEdPQlMyRzZNOTBJQ1Q2S1Y0UDFPMzA!/?WCM_GLOBAL_CONTEXT=/wps/wcm/connect/lasd+content/lasd+site/home/home+top+stories/fbi_crime_tool. SHB-4M-12 X X X January 9, 2012
143Homicidesin 1970-71
The last year there wereless homicides than 2012
424 Homicidesin 1992
Highest number of homicidessince before 1960
*20122011201020092008200720062005200420032002200120001999199819971996199519941993199219911989-901988-891987-881986-871985-861984-851983-841982-831981-821980-811979-801978-791977-781976-771975-761974-751973-741972-731971-721970-711969-701968-691967-681966-671965-661964-651963-641962-631961-621960-61
166170181212252267319371323327306262235227256289303386392387424393336271248273256235250248259302278302247238194186173190185143127137123116737867508050
Year Count CrimeRate
This chart re�ects the number of homicides in the total juris-diction of the Los Angeles County Sheri�’s Department, for 52 years starting with the year 1960.
The homicide ratio was calculated taking into account the total population living in areas policed by LASD. See the footnote below for more details.
Note: Total homicides since 1960 in communities policed by LASD:
Over 100 pages of details showing reported crime statistics for the patrol areas of the unincorporated communi-ties and 42 contract cities policed by the Los Angeles County Sheri�'s Depart-ment (including 2011), can be found at www.lasd.org. Visit the “Crime preven-tion and Information” page.
The following rules apply to this statistical data.• Department-wide homicides from 1960-2012 include all unincorporated areas, contract cities, transit, and custody facilities.• If a person is injured in one year and dies in a later year the homicide is counted in the year of death. Variations in population coverage and reporting practices may cause di�erences in reporting from year to year.• Crime rate per 10,000 population; based on reported crimes and population estimates for each year.
Source:Statistical Digest/Statistical Summary/Year in Review/Crime & Arrest Statistics books for 1960-2012.Actual Crimes are Reported Crimes minus unfounded.Contract cities and unincorporated areas patrolled by LASD have changed throughout the years.Prepared by: Statistical Unit of the Crime Analysis program, Technical Services Division, 01/2013.
Population source for crime rates per10,000 population: 2001- 2009 populationprojections from the Chief AdministrativeO�cer's (CAO) O�ce of Urban Researchand California Department of Finance.2011 and 2012 population source from the 2010 United States Census Population count.
166Homicidesin 2012Lowest number ofhomicides since1970
*Preliminary
0.570.580.620.710.850.961.081.261.131.151.090.970.870.840.951.021.161.511.561.511.691.591.451.211.151.281.221.171.251.241.341.571.481.621.331.291.081.040.971.071.050.820.700.770.700.660.420.450.390.310.510.32
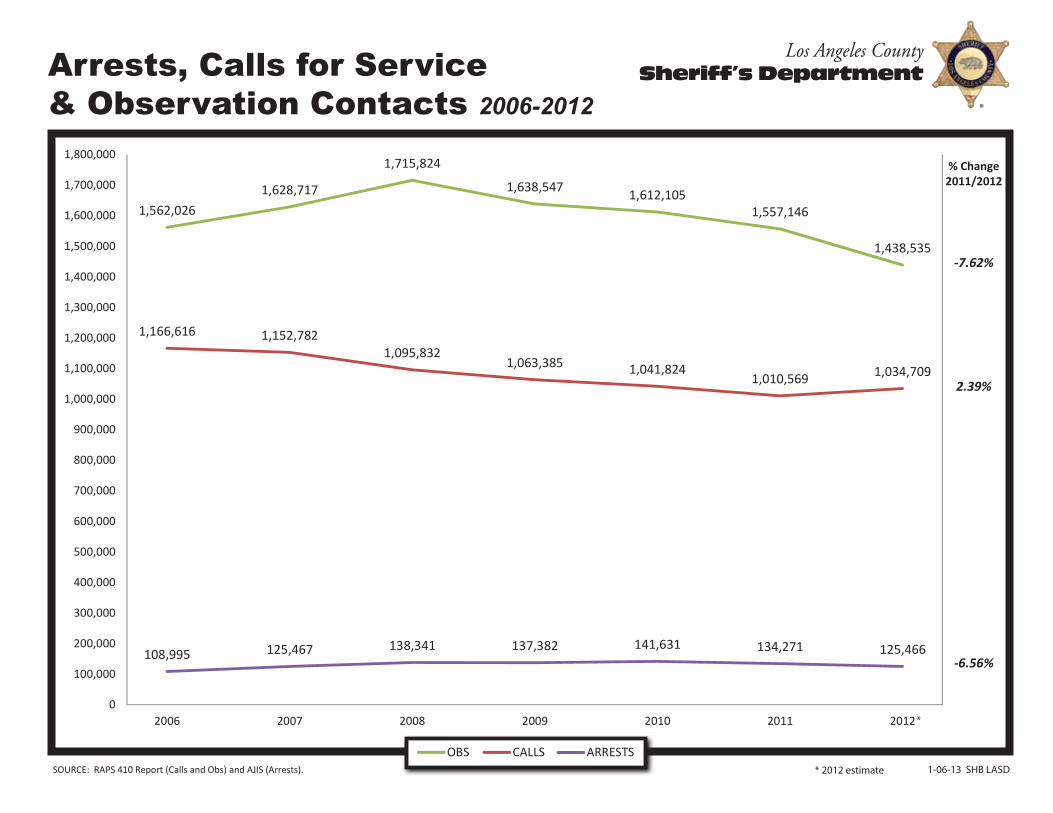
-7.62%
2.39%
-6.56%
% Change2011/2012
0
100,000
200,000
300,000
400,000
500,000
600,000
700,000
800,000
900,000
1,000,000
1,100,000
1,200,000
1,300,000
1,400,000
1,500,000
1,600,000
1,700,000
1,800,000
1,562,0261,628,717
1,715,824
1,638,547 1,612,1051,557,146
1,438,535
1,166,616 1,152,7821,095,832
1,063,385 1,041,8241,010,569 1,034,709
108,995 125,467 138,341 137,382 141,631 134,271 125,466
2006 2007 2008 2009 2010 2011 2012*
Arrests, Calls for Service& Observation Contacts 2006-2012
* 2012 estimate 1-06-13 SHB LASDSOURCE: RAPS 410 Report (Calls and Obs) and AJIS (Arrests).
OBS CALLS ARRESTS
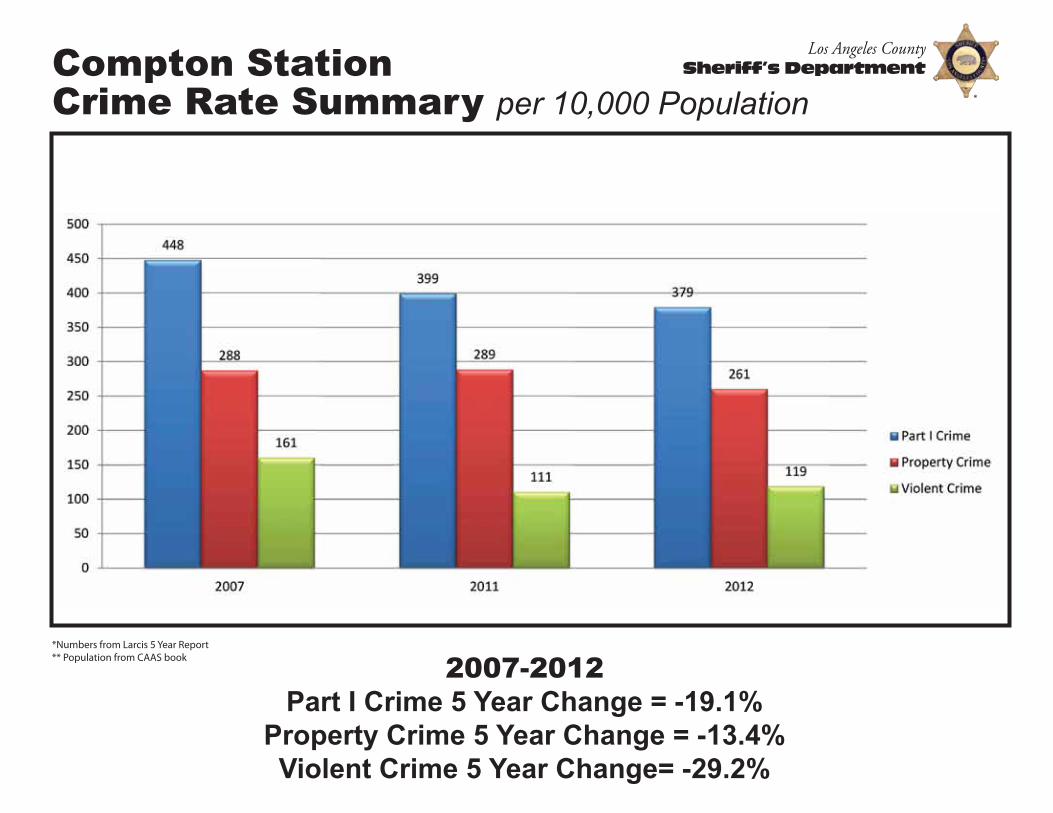
Compton StationCrime Rate Summary per 10,000 Population
*Numbers from Larcis 5 Year Report** Population from CAAS book 2007-2012
Part I Crime 5 Year Change = -19.1%Property Crime 5 Year Change = -13.4%Violent Crime 5 Year Change= -29.2%
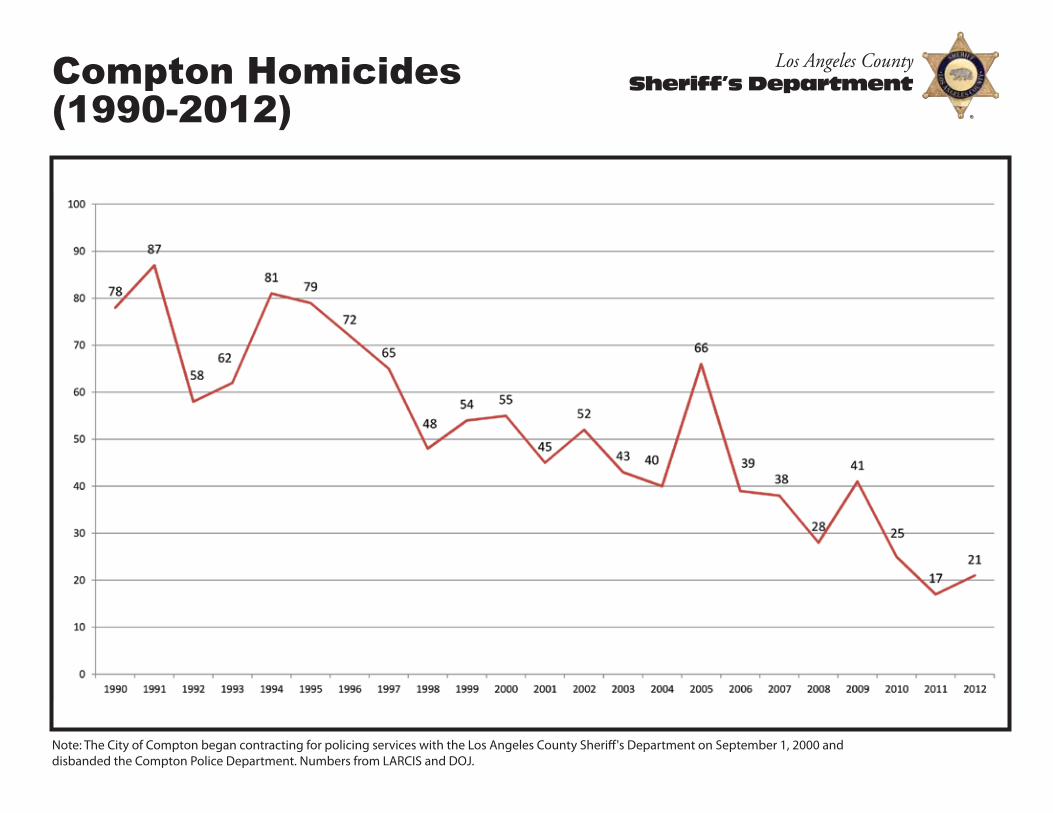
Compton Homicides(1990-2012)
Note: The City of Compton began contracting for policing services with the Los Angeles County Sheri�'s Department on September 1, 2000 anddisbanded the Compton Police Department. Numbers from LARCIS and DOJ.
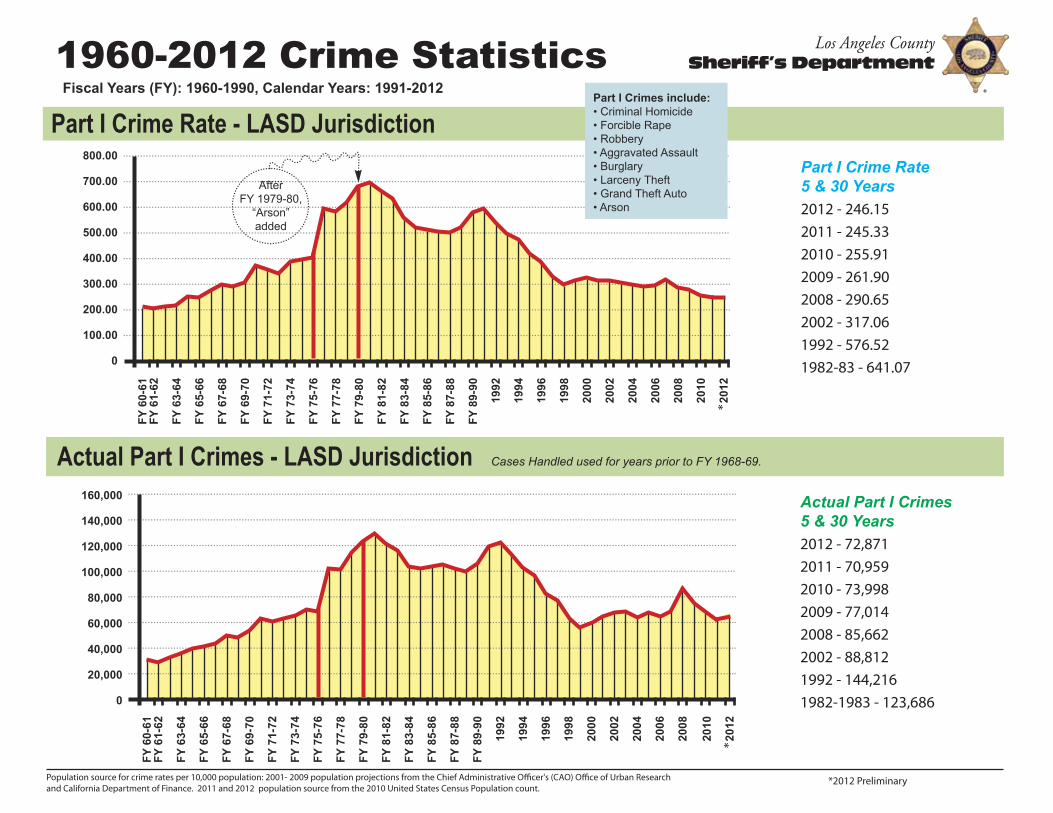
1960-2012 Crime StatisticsFiscal Years (FY): 1960-1990, Calendar Years: 1991-2012
Population source for crime rates per 10,000 population: 2001- 2009 population projections from the Chief Administrative O�cer's (CAO) O�ce of Urban Researchand California Department of Finance. 2011 and 2012 population source from the 2010 United States Census Population count.
*2012 Preliminary
Actual Part I Crimes - LASD Jurisdiction Cases Handled used for years prior to FY 1968-69.
Part I Crime Rate - LASD Jurisdiction
After FY 1979-80,
“Arson”added
800.00
700.00
600.00
500.00
400.00
300.00
200.00
100.00
0
FY 6
0-61
FY 6
1-62
FY 6
3-64
FY 6
5-66
FY 6
7-68
FY 6
9-70
FY 7
1-72
FY 7
3-74
FY 7
5-76
FY 7
7-78
FY 7
9-80
FY 8
1-82
FY 8
3-84
FY 8
5-86
FY 8
7-88
FY 8
9-90
1992
1994
1996
1998
2000
2002
2004
2006
2008
2010
2012
160,000
140,000
120,000
100,000
80,000
60,000
40,000
20,000
0
FY 6
0-61
FY 6
1-62
FY 6
3-64
FY 6
5-66
FY 6
7-68
FY 6
9-70
FY 7
1-72
FY 7
3-74
FY 7
5-76
FY 7
7-78
FY 7
9-80
FY 8
1-82
FY 8
3-84
FY 8
5-86
FY 8
7-88
FY 8
9-90
1992
1994
1996
1998
2000
2002
2004
2006
2008
2010
2012
Part I Crimes include:• Criminal Homicide• Forcible Rape• Robbery• Aggravated Assault• Burglary• Larceny Theft• Grand Theft Auto• Arson
Part I Crime Rate5 & 30 Years2012 - 246.152011 - 245.332010 - 255.912009 - 261.902008 - 290.652002 - 317.061992 - 576.521982-83 - 641.07
Actual Part I Crimes5 & 30 Years 2012 - 72,8712011 - 70,9592010 - 73,9982009 - 77,0142008 - 85,6622002 - 88,8121992 - 144,2161982-1983 - 123,686
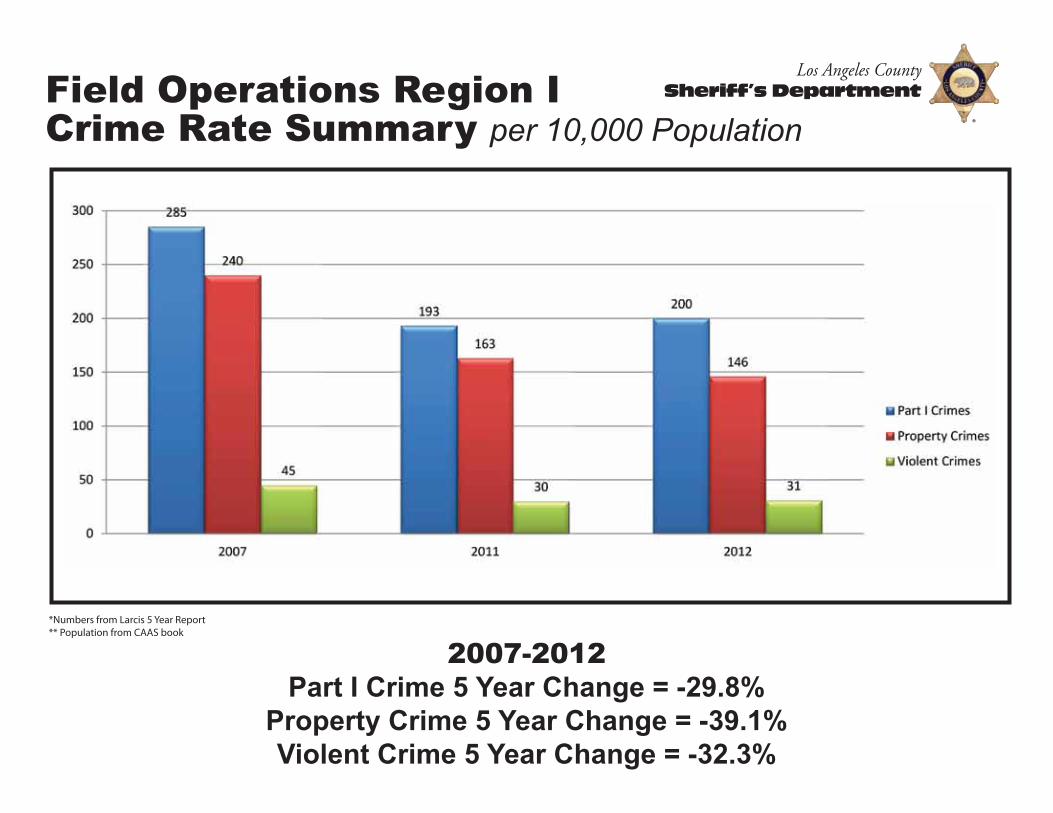
Field Operations Region ICrime Rate Summary per 10,000 Population
*Numbers from Larcis 5 Year Report** Population from CAAS book
2007-2012Part I Crime 5 Year Change = -29.8%
Property Crime 5 Year Change = -39.1%Violent Crime 5 Year Change = -32.3%
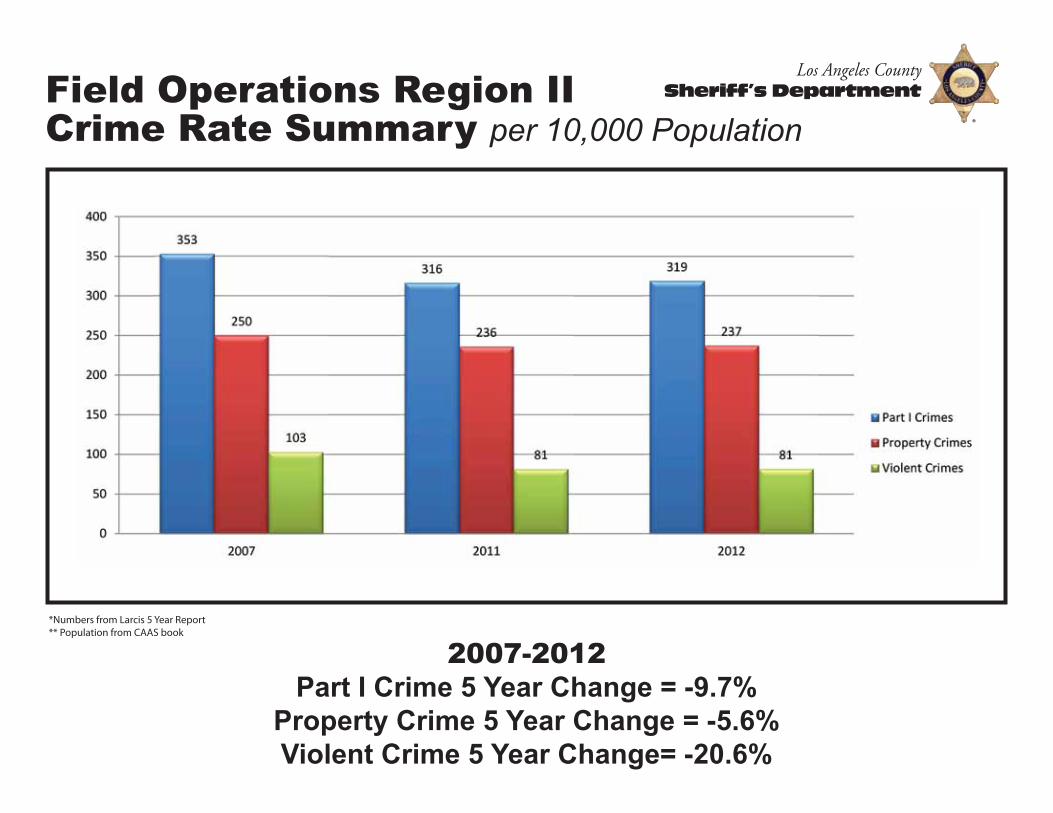
Field Operations Region IICrime Rate Summary per 10,000 Population
*Numbers from Larcis 5 Year Report** Population from CAAS book
2007-2012Part I Crime 5 Year Change = -9.7%
Property Crime 5 Year Change = -5.6%Violent Crime 5 Year Change= -20.6%
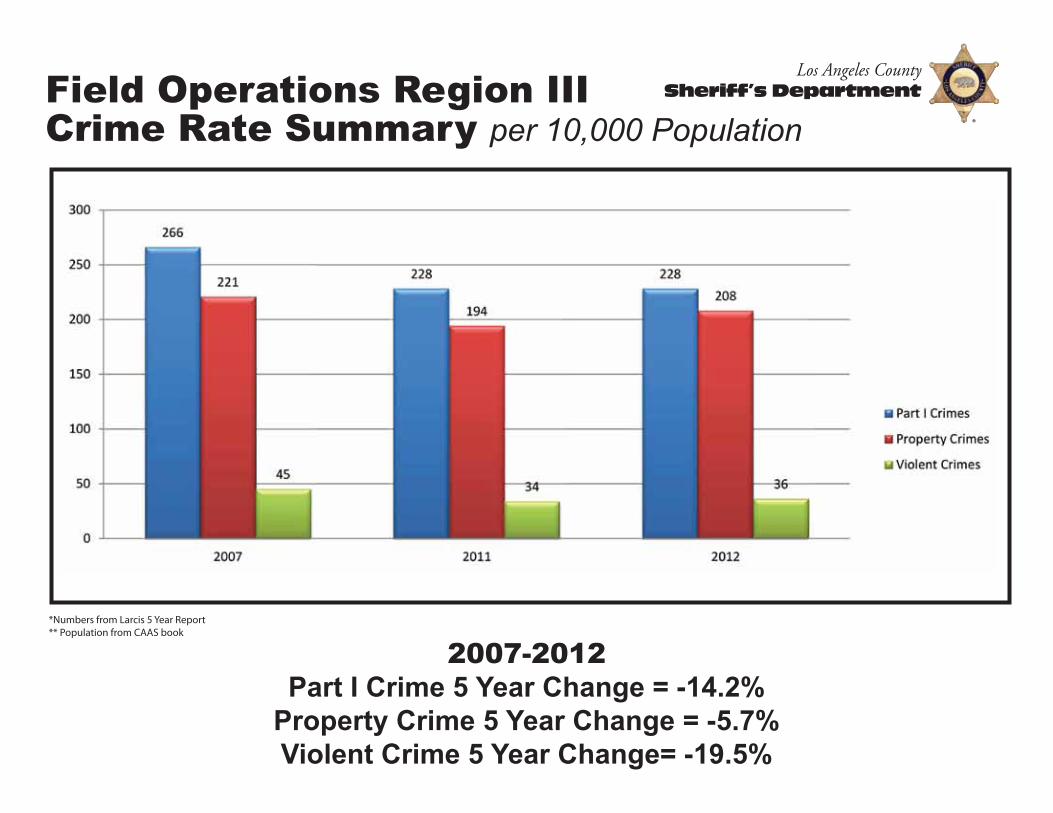
Field Operations Region IIICrime Rate Summary per 10,000 Population
*Numbers from Larcis 5 Year Report** Population from CAAS book
2007-2012Part I Crime 5 Year Change = -14.2%
Property Crime 5 Year Change = -5.7%Violent Crime 5 Year Change= -19.5%
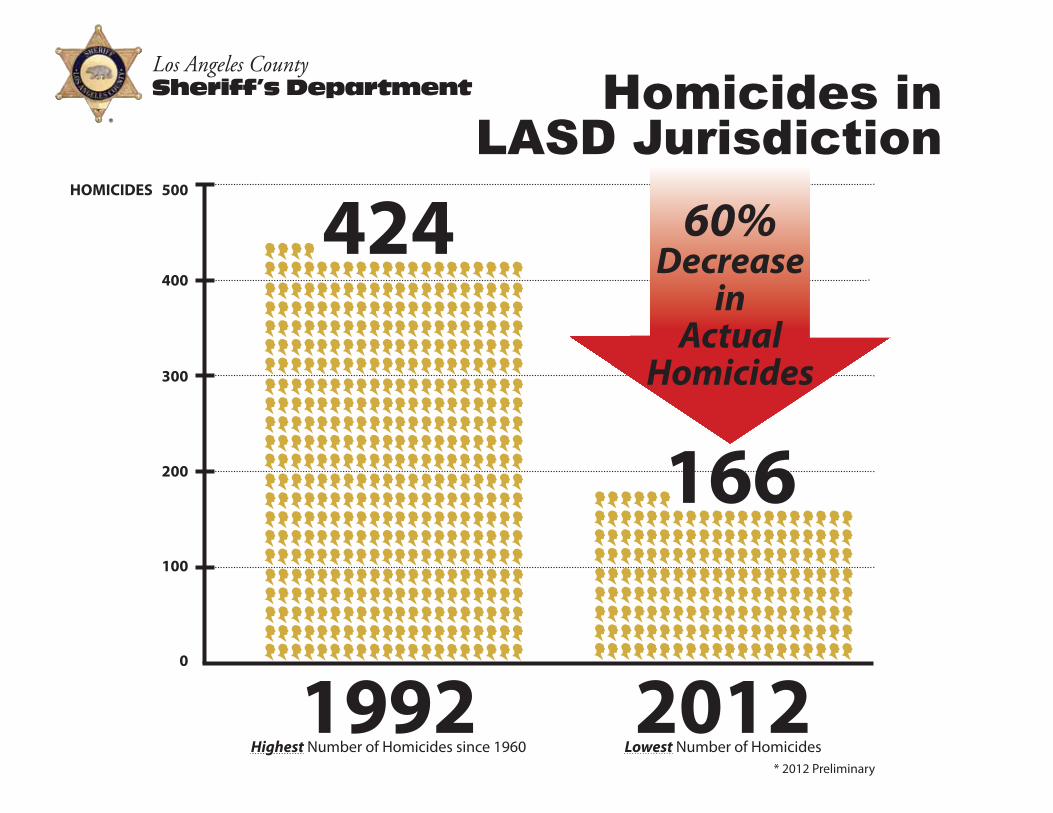
1992Highest Number of Homicides since 1960
2012Lowest Number of Homicides
500
* 2012 Preliminary
400
300
200
100
0
HOMICIDES
424 60%Decrease
inActual
Homicides
166
Homicides inLASD Jurisdiction
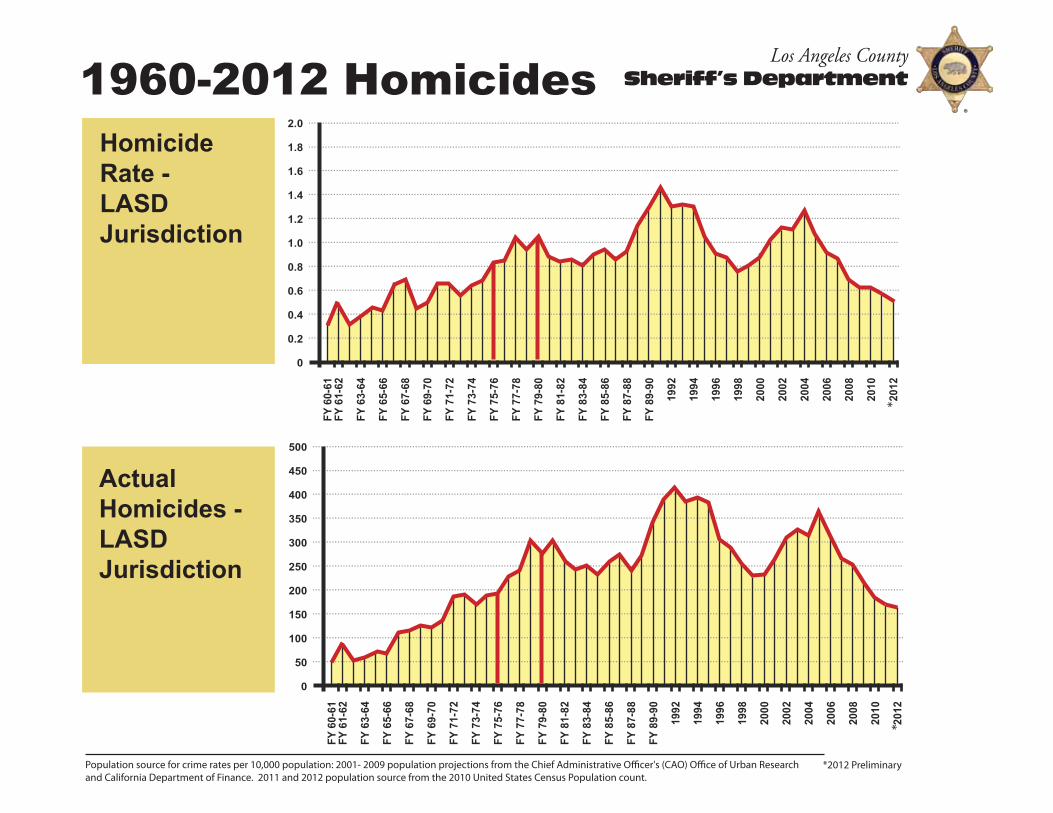
1960-2012 Homicides
Population source for crime rates per 10,000 population: 2001- 2009 population projections from the Chief Administrative O�cer's (CAO) O�ce of Urban Researchand California Department of Finance. 2011 and 2012 population source from the 2010 United States Census Population count.
2.0
1.8
1.6
1.4
1.2
1.0
0.8
0.6
0.4
0.2
0
FY 6
0-61
FY 6
1-62
FY 6
3-64
FY 6
5-66
FY 6
7-68
FY 6
9-70
FY 7
1-72
FY 7
3-74
FY 7
5-76
FY 7
7-78
FY 7
9-80
FY 8
1-82
FY 8
3-84
FY 8
5-86
FY 8
7-88
FY 8
9-90
1992
1994
1996
1998
2000
2002
2004
2006
2008
2010
2012
500
450
400
350
300
250
200
150
100
50
0
FY 6
0-61
FY 6
1-62
FY 6
3-64
FY 6
5-66
FY 6
7-68
FY 6
9-70
FY 7
1-72
FY 7
3-74
FY 7
5-76
FY 7
7-78
FY 7
9-80
FY 8
1-82
FY 8
3-84
FY 8
5-86
FY 8
7-88
FY 8
9-90
1992
1994
1996
1998
2000
2002
2004
2006
2008
2010
2012
ActualHomicides -LASDJurisdiction
HomicideRate -LASDJurisdiction
*2012 Preliminary
01/07/2013 09:25 am
Ver: 10.09.11.2012.0
YTDReportedIncidents
YTDCrime Rate
TotalReportedIncident
YTDReportedIncidents
YTDCrime Rate
TotalReportedIncidents
YTDReportedIncidents
YTDCrime Rate
5 YearChange inYTD Crime
Rate
1 YearChange inYTD Crime
Rate
2007 2011 2012
2012/2007 2012/20112007 2011
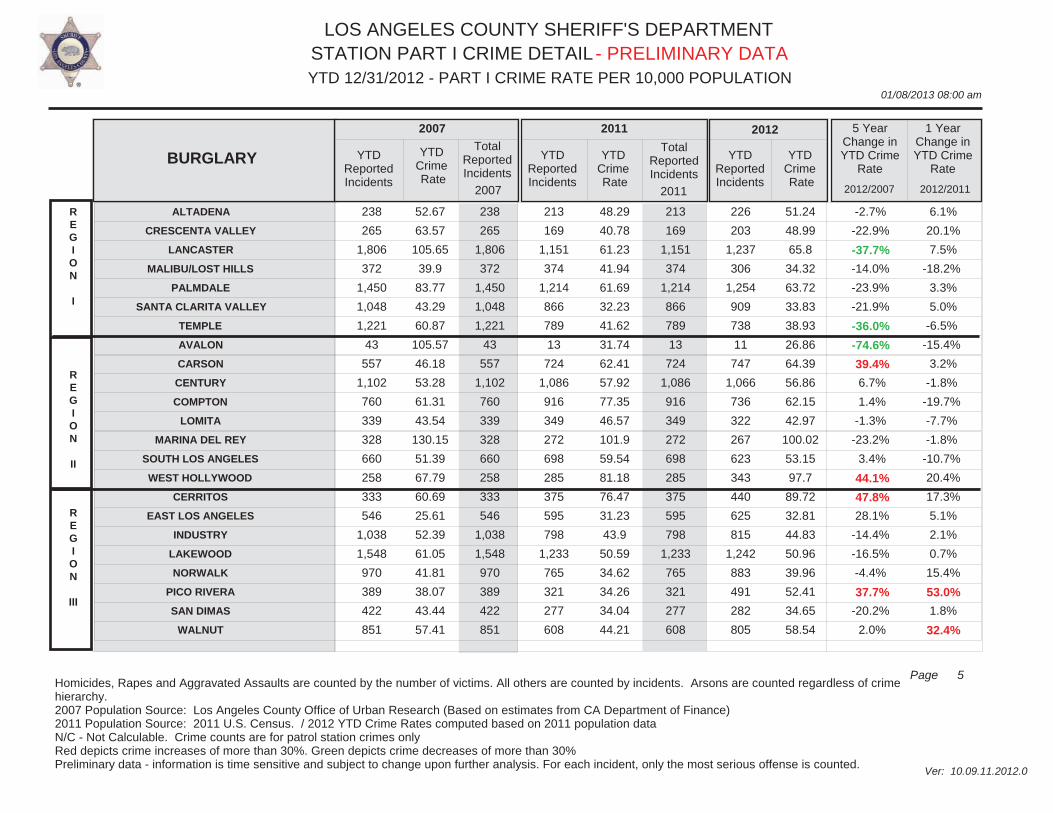
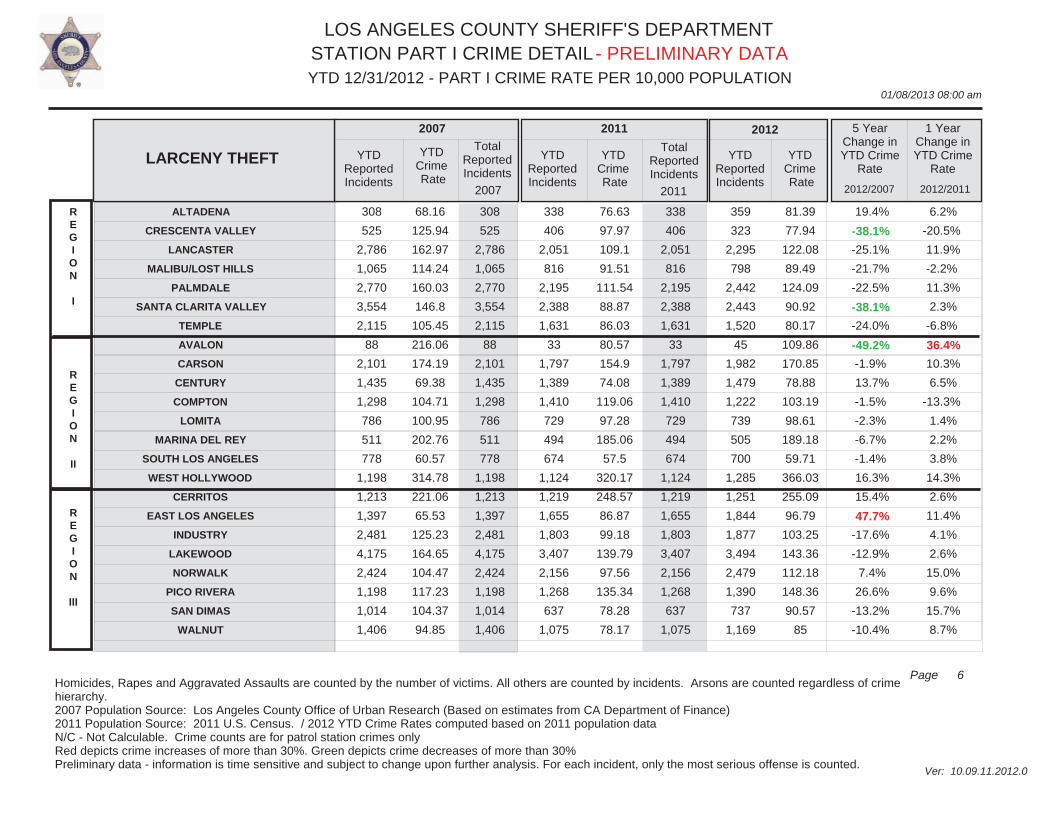
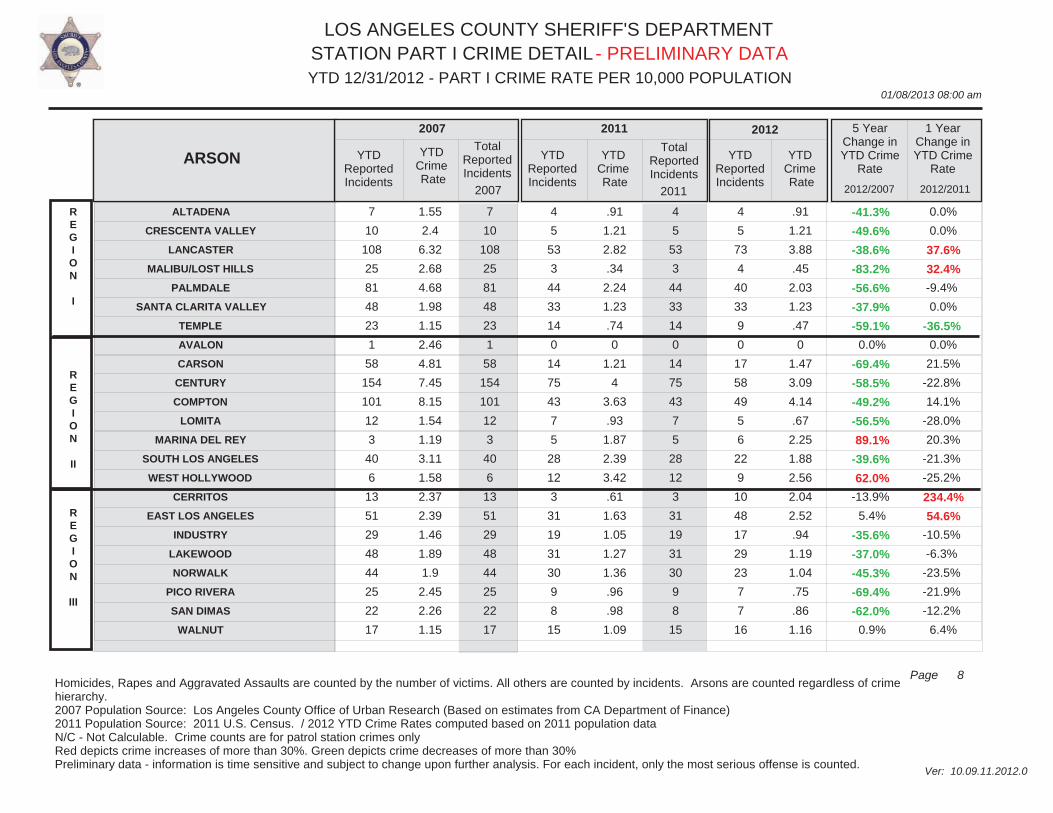
1PageHomicides, Rapes and Aggravated Assaults are counted by the number of victims. All others are counted by incidents. Arsons are counted regardless of crime hierarchy.2007 Population Source: Los Angeles County Office of Urban Research (Based on estimates from CA Department of Finance)2011 Population Source: 2011 U.S. Census. / 2012 YTD Crime Rates computed based on 2011 population dataN/C - Not Calculable. Crime counts are for patrol station crimes only Red depicts crime increases of more than 30%. Green depicts crime decreases of more than 30%Preliminary data - information is time sensitive and subject to change upon further analysis. For each incident, only the most serious offense is counted.
REGION
I
REGION
II
REGION
III
ALTADENA STATIONCRESCENTA VALLEY STATION
LANCASTER STATIONMALIBU/LOST HILLS STATION
PALMDALE STATIONSANTA CLARITA VALLEY STATION
TEMPLE STATION
AVALON STATIONCARSON STATIONCENTURY STATIONCOMPTON STATION
LOMITA STATIONMARINA DEL REY STATION
SOUTH LOS ANGELES STATIONWEST HOLLYWOOD STATION
CERRITOS STATIONEAST LOS ANGELES STATION
INDUSTRY STATIONLAKEWOOD STATIONNORWALK STATION
PICO RIVERA STATIONSAN DIMAS STATION
WALNUT STATION
896 935
7,100 1,684 6,289 5,709 4,932
216 4,360 7,297 5,554 1,452 1,094 3,541 2,064
2,024 4,442 5,454 9,425 5,639 2,663 1,944 2,971
896 935
7,100 1,684 6,289 5,709 4,932
216 4,360 7,297 5,554 1,452 1,094 3,541 2,064
2,024 4,442 5,454 9,425 5,639 2,663 1,944 2,971
720 657
4,698 1,294 4,817 3,945 3,474
76 3,758 5,783 4,730 1,334 940
2,967 1,901
1,847 4,612 3,882 6,848 4,513 2,357 1,221 2,066
720 657
4,698 1,294 4,817 3,945 3,474
76 3,758 5,783 4,730 1,334 940
2,967 1,901
1,847 4,612 3,882 6,848 4,513 2,357 1,221 2,066
753 629
5,096 1,224 5,091 4,247 3,303
89 4,111 5,680 4,494 1,304 925
2,947 2,108
2,001 4,929 3,921 7,072 4,903 2,737 1,331 2,401
198.27224.3
415.33180.64363.33235.81245.89
530.32361.48352.82448.05186.48434.09275.69542.33
368.85208.37275.29371.7
243.03260.6200.1
200.43
163.24158.54249.91145.12244.77146.81183.24
185.55323.93308.44399.41178.01352.14253.11541.5
376.62242.08213.54280.97204.22251.58150.05150.23
170.73151.79271.09137.27258.69158.05174.22
217.29354.36302.94379.48
174346.52251.4
600.47
408.03258.71215.68290.16221.87292.14163.57174.59
-13.9%-32.3%-34.7%-24.0%-28.8%-33.0%-29.2%
-59.0%-2.0%
-14.1%-15.3%-6.7%
-20.2%-8.8% 10.7%
10.6% 24.2%-21.7%-21.9%-8.7% 12.1%-18.3%-12.9%
4.6%-4.3% 8.5%-5.4% 5.7% 7.7%-4.9%
17.1% 9.4%-1.8%-5.0%-2.3%-1.6%-0.7% 10.9%
8.3% 6.9% 1.0% 3.3% 8.6%
16.1% 9.0%
16.2%
PART I CRIMES
YTD 12/31/2012 - Part I Crime Rate Per 10,000 Population - Preliminary Data
LOS ANGELES COUNTY SHERIFF'S DEPARTMENT PATROL STATIONS PART I CRIME SUMMARY
87,684PART I CRIMES 87,684 68,439 71,286 68,439293.14 236.29 246.12 -16.04 4.16
Ver: 10.07.13.2011.0
01/08/2013 08:00 am
1Page
YTD 12/31/2012 - PART I CRIME RATE PER 10,000 POPULATION - PRELIMINARY DATA
Homicides, Rapes and Aggravated Assaults are counted by the number of victims. All others are counted by incidents. Arsons are counted regardless of crime hierarchy.2007 Population Source: Los Angeles County Office of Urban Research (Based on estimates from CA Department of Finance)2011 Population Source: 2011 U.S. Census. / 2012 YTD Crime Rates computed based on 2011 population dataN/C - Not Calculable. Crime counts are for patrol station crimes only Red depicts crime increases of more than 30%. Green depicts crime decreases of more than 30%Preliminary data - information is time sensitive and subject to change upon further analysis. For each incident, only the most serious offense is counted.
DEPARTMENT YTDReportedIncidents
YTDCrimeRate
TotalReportedIncidents
YTDReported Incidents
YTDCrimeRate
TotalReportedIncidents
YTDReportedIncidents
YTDCrimeRate
5 YearChange inYTD Crime
Rate
1 YearChange in
YTDCrime
2007 2011 2012
VIOLENT CRIMES
PROPERTY CRIMES
CRIMINAL HOMICIDE
FORCIBLE RAPE
ROBBERY
AGGRAVATED ASSAULT
BURGLARY
LARCENY THEFT
GRAND THEFT AUTO
ARSON
264
622
6,111
10,694
16,544
36,626
15,897
926
264
622
6,111
10,694
16,544
36,626
15,897
926
168
485
4,177
7,747
14,091
30,695
10,590
486
168
485
4,177
7,747
14,091
30,695
10,590
486
160
492
4,332
8,030
14,571
32,378
10,832
491
17,691
69,993
17,691
69,993
12,577
55,862
12,577
55,862
13,014
58,272
.88
2.08
20.43
35.75
55.31
122.45
53.15
3.1
.58
1.67
14.42
26.75
48.65
105.97
36.56
1.68
.55
1.7
14.96
27.72
50.31
111.79
37.4
1.7
59.14
234
43.42
192.86
44.93
201.18
-37.50%
-18.27%
-26.77%
-22.46%
-9.04%
-8.71%
-29.63%
-45.16%
-5.17%
1.80%
3.74%
3.63%
3.41%
5.49%
2.30%
1.19%
-24.03%
-14.03%
3.48%
4.31%
2012/2007 2012/201120112007
LOS ANGELES COUNTY SHERIFF'S DEPARTMENT
01/08/2013 08:00 am
STATION PART I CRIME SUMMARY
Ver: 10.09.11.2012.0
YTDReportedIncidents
YTDCrime Rate
TotalReportedIncident
YTDReportedIncidents
YTDCrime Rate
TotalReportedIncidents
YTDReportedIncidents
YTDCrime Rate
5 YearChange inYTD Crime
Rate
1 YearChange inYTD Crime
RatePART I CRIMES
2007 2011 2012
2012/2007 2012/2011
YTD 12/31/2012 - PART I CRIME RATE PER 10,000 POPULATION
2007 2011
1Page
- PRELIMINARY DATA
Homicides, Rapes and Aggravated Assaults are counted by the number of victims. All others are counted by incidents. Arsons are counted regardless of crime hierarchy.2007 Population Source: Los Angeles County Office of Urban Research (Based on estimates from CA Department of Finance)2011 Population Source: 2011 U.S. Census. / 2012 YTD Crime Rates computed based on 2011 population dataN/C - Not Calculable. Crime counts are for patrol station crimes only Red depicts crime increases of more than 30%. Green depicts crime decreases of more than 30%Preliminary data - information is time sensitive and subject to change upon further analysis. For each incident, only the most serious offense is counted.
REGION
I
REGION
II
REGION
III
ALTADENA STATION
CRESCENTA VALLEY STATION
LANCASTER STATION
MALIBU/LOST HILLS STATION
PALMDALE STATION
SANTA CLARITA VALLEY STATION
TEMPLE STATION
AVALON STATION
CARSON STATION
CENTURY STATION
COMPTON STATION
LOMITA STATION
MARINA DEL REY STATION
SOUTH LOS ANGELES STATION
WEST HOLLYWOOD STATION
CERRITOS STATION
EAST LOS ANGELES STATION
INDUSTRY STATION
LAKEWOOD STATION
NORWALK STATION
PICO RIVERA STATION
SAN DIMAS STATION
WALNUT STATION
896
935
7,099
1,684
6,289
5,709
4,932
216
4,360
7,297
5,554
1,452
1,094
3,541
2,064
2,024
4,442
5,454
9,425
5,639
2,663
1,944
2,971
896
935
7,099
1,684
6,289
5,709
4,932
216
4,360
7,297
5,554
1,452
1,094
3,541
2,064
2,024
4,442
5,454
9,425
5,639
2,663
1,944
2,971
720
657
4,697
1,294
4,817
3,945
3,474
76
3,758
5,783
4,730
1,334
940
2,967
1,901
1,847
4,612
3,882
6,848
4,513
2,357
1,221
2,066
720
657
4,697
1,294
4,817
3,945
3,474
76
3,758
5,783
4,730
1,334
940
2,967
1,901
1,847
4,612
3,882
6,848
4,513
2,357
1,221
2,066
753
629
5,094
1,224
5,090
4,250
3,301
89
4,109
5,680
4,495
1,304
925
2,947
2,108
2,001
4,926
3,920
7,072
4,901
2,737
1,331
2,400
198.27
224.3
415.27
180.64
363.33
235.81
245.89
530.32
361.48
352.82
448.05
186.48
434.09
275.69
542.33
368.85
208.37
275.29
371.7
243.03
260.6
200.1
200.43
163.24
158.54
249.86
145.12
244.77
146.81
183.24
185.55
323.93
308.44
399.41
178.01
352.14
253.11
541.5
376.62
242.08
213.54
280.97
204.22
251.58
150.05
150.23
170.73
151.79
270.98
137.27
258.64
158.17
174.11
217.29
354.19
302.94
379.57
174
346.52
251.4
600.47
408.03
258.56
215.63
290.16
221.78
292.14
163.57
174.52
-13.9%
-32.3%
-34.8%
-24.0%
-28.8%
-32.9%
-29.2%
-59.0%
-2.0%
-14.1%
-15.3%
-6.7%
-20.2%
-8.8%
10.7%
10.6%
24.1%
-21.7%
-21.9%
-8.7%
12.1%
-18.3%
-12.9%
4.6%
-4.3%
8.5%
-5.4%
5.7%
7.7%
-5.0%
17.1%
9.3%
-1.8%
-5.0%
-2.3%
-1.6%
-0.7%
10.9%
8.3%
6.8%
1.0%
3.3%
8.6%
16.1%
9.0%
16.2%
LOS ANGELES COUNTY SHERIFF'S DEPARTMENT
01/08/2013 08:00 am
STATION PART I CRIME DETAIL
Ver: 10.09.11.2012.0
YTD 12/31/2012 - PART I CRIME RATE PER 10,000 POPULATION
1Page
- PRELIMINARY DATA
Homicides, Rapes and Aggravated Assaults are counted by the number of victims. All others are counted by incidents. Arsons are counted regardless of crime hierarchy.2007 Population Source: Los Angeles County Office of Urban Research (Based on estimates from CA Department of Finance)2011 Population Source: 2011 U.S. Census. / 2012 YTD Crime Rates computed based on 2011 population dataN/C - Not Calculable. Crime counts are for patrol station crimes only Red depicts crime increases of more than 30%. Green depicts crime decreases of more than 30%Preliminary data - information is time sensitive and subject to change upon further analysis. For each incident, only the most serious offense is counted.
2
1
18
4
15
9
8
0
16
38
45
3
0
25
1
0
14
14
20
10
11
1
9
2
1
18
4
15
9
8
0
16
38
45
3
0
25
1
0
14
14
20
10
11
1
9
1
3
7
1
11
6
4
0
5
35
25
2
0
22
0
0
11
8
7
9
7
1
3
1
3
7
1
11
6
4
0
5
35
25
2
0
22
0
0
11
8
7
9
7
1
3
2
2
10
1
8
1
4
0
11
25
31
1
1
17
0
0
7
5
10
16
6
2
0
.44
.24
1.05
.43
.87
.37
.4
0
1.33
1.84
3.63
.39
0
1.95
.26
0
.66
.71
.79
.43
1.08
.1
.61
.23
.72
.37
.11
.56
.22
.21
0
.43
1.87
2.11
.27
0
1.88
0
0
.58
.44
.29
.41
.75
.12
.22
.45
.48
.53
.11
.41
.04
.21
0
.95
1.33
2.62
.13
.37
1.45
0
0
.37
.28
.41
.72
.64
.25
0
2.3%
100.0%
-49.5%
-74.4%
-52.9%
-89.2%
-47.5%
0.0%
-28.6%
-27.7%
-27.8%
-66.7%
0.0%
-25.6%
0.0%
0.0%
-43.9%
-60.6%
-48.1%
67.4%
-40.7%
150.0%
0.0%
95.7%
-33.3%
43.2%
0.0%
-26.8%
-81.8%
0.0%
0.0%
120.9%
-28.9%
24.2%
-51.9%
0.0%
-22.9%
0.0%
0.0%
-36.2%
-36.4%
41.4%
75.6%
-14.7%
108.3%
0.0%
ALTADENA
CRESCENTA VALLEY
LANCASTER
MALIBU/LOST HILLS
PALMDALE
SANTA CLARITA VALLEY
TEMPLE
AVALON
CARSON
CENTURY
COMPTON
LOMITA
MARINA DEL REY
SOUTH LOS ANGELES
WEST HOLLYWOOD
CERRITOS
EAST LOS ANGELES
INDUSTRY
LAKEWOOD
NORWALK
PICO RIVERA
SAN DIMAS
WALNUT
CRIMINAL HOMICIDE YTDReportedIncidents
YTDCrime Rate
TotalReportedIncidents
YTDReportedIncidents
YTDCrime Rate
TotalReportedIncidents
YTDReportedIncidents
YTDCrime Rate
5 YearChange inYTD Crime
Rate
1 YearChange inYTD Crime
Rate
2007 2011 2012
2012/2007 2012/2011
REGION
I
REGION
II
REGION
III
20112007
LOS ANGELES COUNTY SHERIFF'S DEPARTMENT
01/08/2013 08:00 am
STATION PART I CRIME DETAIL
Ver: 10.09.11.2012.0
YTD 12/31/2012 - PART I CRIME RATE PER 10,000 POPULATION
2Page
- PRELIMINARY DATA
Homicides, Rapes and Aggravated Assaults are counted by the number of victims. All others are counted by incidents. Arsons are counted regardless of crime hierarchy.2007 Population Source: Los Angeles County Office of Urban Research (Based on estimates from CA Department of Finance)2011 Population Source: 2011 U.S. Census. / 2012 YTD Crime Rates computed based on 2011 population dataN/C - Not Calculable. Crime counts are for patrol station crimes only Red depicts crime increases of more than 30%. Green depicts crime decreases of more than 30%Preliminary data - information is time sensitive and subject to change upon further analysis. For each incident, only the most serious offense is counted.
6
5
66
6
48
34
29
3
19
71
52
8
5
41
21
3
29
37
60
30
18
18
13
6
5
66
6
48
34
29
3
19
71
52
8
5
41
21
3
29
37
60
30
18
18
13
6
3
49
6
40
25
29
1
14
43
52
6
5
28
19
4
32
27
34
19
19
12
12
6
3
49
6
40
25
29
1
14
43
52
6
5
28
19
4
32
27
34
19
19
12
12
8
4
65
12
45
42
18
0
15
55
36
2
3
31
12
8
33
18
34
28
10
7
6
1.33
1.2
3.86
.64
2.77
1.4
1.45
7.37
1.58
3.43
4.19
1.03
1.98
3.19
5.52
.55
1.36
1.87
2.37
1.29
1.76
1.85
.88
1.36
.72
2.61
.67
2.03
.93
1.53
2.44
1.21
2.29
4.39
.8
1.87
2.39
5.41
.82
1.68
1.49
1.4
.86
2.03
1.47
.87
1.81
.97
3.46
1.35
2.29
1.56
.95
0
1.29
2.93
3.04
.27
1.12
2.64
3.42
1.63
1.73
.99
1.4
1.27
1.07
.86
.44
36.1%
-19.2%
-10.4%
110.9%
-17.3%
11.4%
-34.5%
0.0%
-18.4%
-14.6%
-27.5%
-73.8%
-43.4%
-17.2%
-38.0%
196.4%
27.2%
-47.1%
-40.9%
-1.6%
-39.2%
-53.5%
-50.0%
33.1%
34.7%
32.6%
101.5%
12.8%
67.7%
-37.9%
0.0%
6.6%
28.0%
-30.8%
-66.3%
-40.1%
10.5%
-36.8%
98.8%
3.0%
-33.6%
0.0%
47.7%
-47.3%
-41.5%
-49.4%
ALTADENA
CRESCENTA VALLEY
LANCASTER
MALIBU/LOST HILLS
PALMDALE
SANTA CLARITA VALLEY
TEMPLE
AVALON
CARSON
CENTURY
COMPTON
LOMITA
MARINA DEL REY
SOUTH LOS ANGELES
WEST HOLLYWOOD
CERRITOS
EAST LOS ANGELES
INDUSTRY
LAKEWOOD
NORWALK
PICO RIVERA
SAN DIMAS
WALNUT
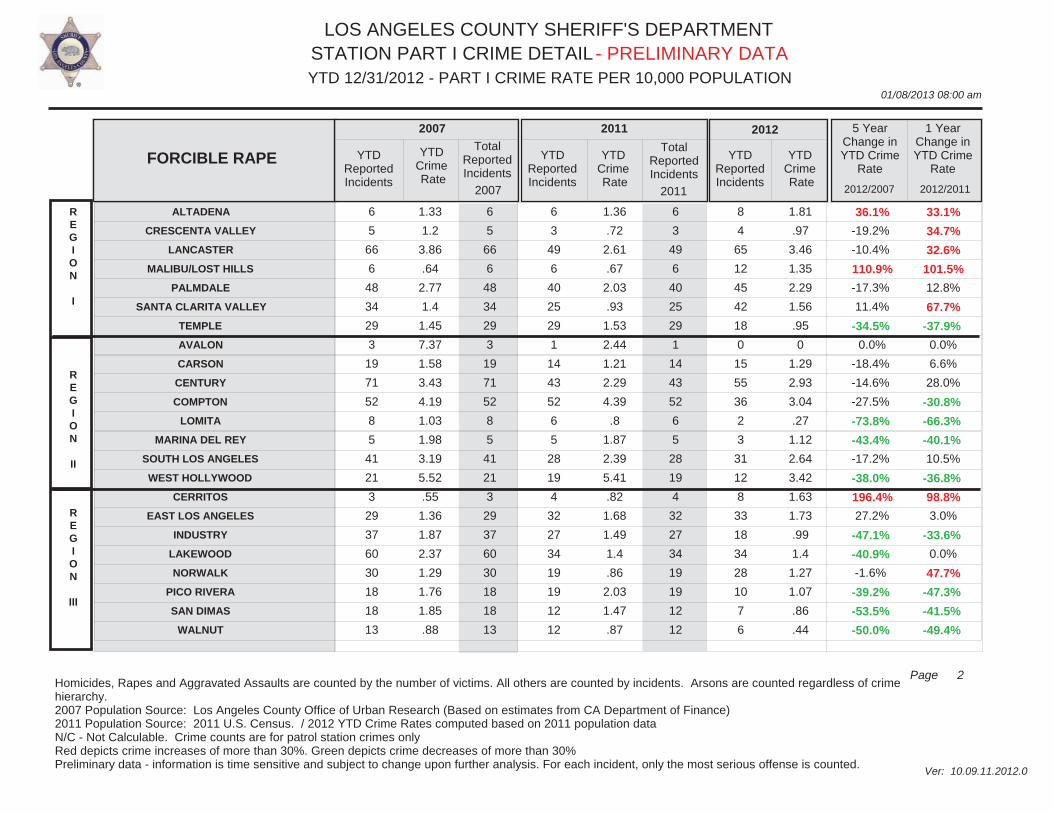
FORCIBLE RAPE YTDReportedIncidents
YTDCrime Rate
TotalReportedIncidents
YTDReportedIncidents
YTDCrime Rate
TotalReportedIncidents
YTDReportedIncidents
YTDCrime Rate
5 YearChange inYTD Crime
Rate
1 YearChange inYTD Crime
Rate
2007 2011 2012
2012/2007 2012/2011
REGION
I
REGION
II
REGION
III
20112007
LOS ANGELES COUNTY SHERIFF'S DEPARTMENT
01/08/2013 08:00 am
STATION PART I CRIME DETAIL
Ver: 10.09.11.2012.0
YTD 12/31/2012 - PART I CRIME RATE PER 10,000 POPULATION
3Page
- PRELIMINARY DATA
Homicides, Rapes and Aggravated Assaults are counted by the number of victims. All others are counted by incidents. Arsons are counted regardless of crime hierarchy.2007 Population Source: Los Angeles County Office of Urban Research (Based on estimates from CA Department of Finance)2011 Population Source: 2011 U.S. Census. / 2012 YTD Crime Rates computed based on 2011 population dataN/C - Not Calculable. Crime counts are for patrol station crimes only Red depicts crime increases of more than 30%. Green depicts crime decreases of more than 30%Preliminary data - information is time sensitive and subject to change upon further analysis. For each incident, only the most serious offense is counted.
35
22
466
28
381
150
310
5
272
842
564
54
63
534
149
78
395
270
809
315
131
65
173
35
22
466
28
381
150
310
5
272
842
564
54
63
534
149
78
395
270
809
315
131
65
173
32
11
291
13
266
102
179
2
129
724
443
46
39
379
127
51
393
143
407
189
101
39
71
32
11
291
13
266
102
179
2
129
724
443
46
39
379
127
51
393
143
407
189
101
39
71
23
11
334
11
245
122
145
3
179
667
488
39
37
363
139
67
427
154
434
223
115
37
69
7.75
5.28
27.26
3
22.01
6.2
15.46
12.28
22.55
40.71
45.5
6.94
25
41.58
39.15
14.21
18.53
13.63
31.91
13.58
12.82
6.69
11.67
7.26
2.65
15.48
1.46
13.52
3.8
9.44
4.88
11.12
38.61
37.41
6.14
14.61
32.33
36.18
10.4
20.63
7.87
16.7
8.55
10.78
4.79
5.16
5.21
2.65
17.77
1.23
12.45
4.54
7.65
7.32
15.43
35.57
41.21
5.2
13.86
30.97
39.59
13.66
22.41
8.47
17.81
10.09
12.27
4.55
5.02
-32.8%
-49.8%
-34.8%
-59.0%
-43.4%
-26.8%
-50.5%
-40.4%
-31.6%
-12.6%
-9.4%
-25.1%
-44.6%
-25.5%
1.1%
-3.9%
20.9%
-37.9%
-44.2%
-25.7%
-4.3%
-32.0%
-57.0%
-28.2%
0.0%
14.8%
-15.8%
-7.9%
19.5%
-19.0%
50.0%
38.8%
-7.9%
10.2%
-15.3%
-5.1%
-4.2%
9.4%
31.4%
8.6%
7.6%
6.7%
18.0%
13.8%
-5.0%
-2.7%
ALTADENA
CRESCENTA VALLEY
LANCASTER
MALIBU/LOST HILLS
PALMDALE
SANTA CLARITA VALLEY
TEMPLE
AVALON
CARSON
CENTURY
COMPTON
LOMITA
MARINA DEL REY
SOUTH LOS ANGELES
WEST HOLLYWOOD
CERRITOS
EAST LOS ANGELES
INDUSTRY
LAKEWOOD
NORWALK
PICO RIVERA
SAN DIMAS
WALNUT
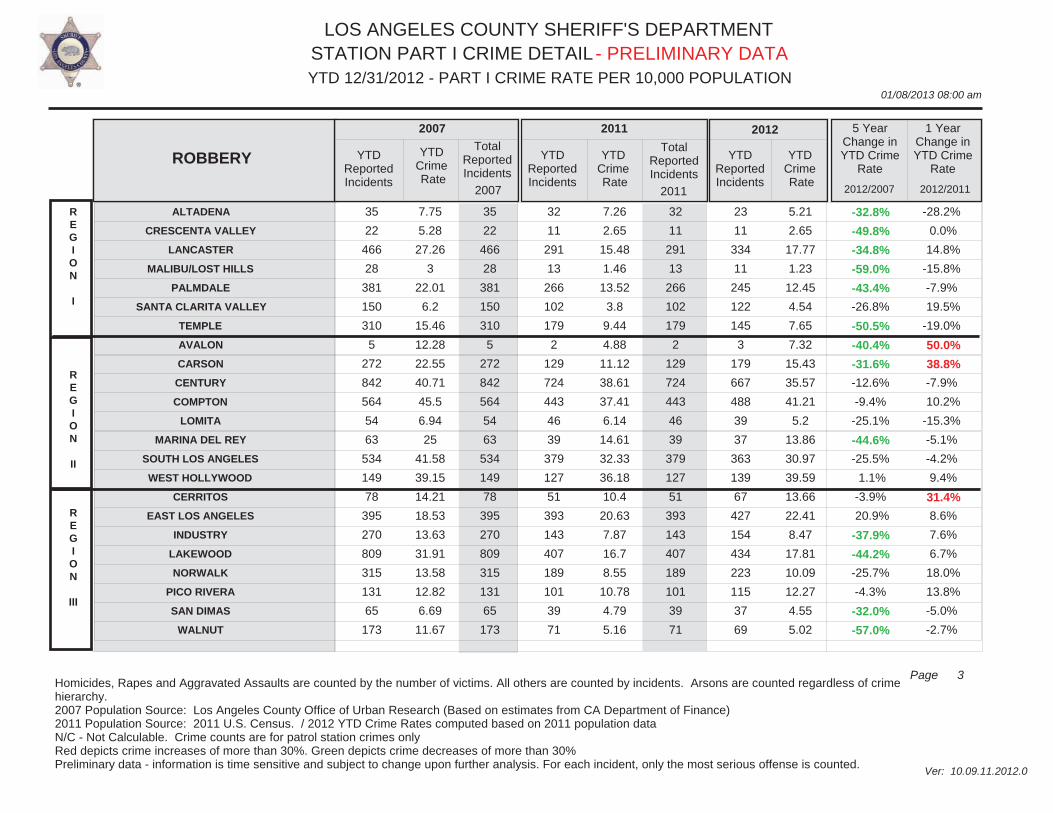
ROBBERY YTDReportedIncidents
YTDCrime Rate
TotalReportedIncidents
YTDReportedIncidents
YTDCrime Rate
TotalReportedIncidents
YTDReportedIncidents
YTDCrime Rate
5 YearChange inYTD Crime
Rate
1 YearChange inYTD Crime
Rate
2007 2011 2012
2012/2007 2012/2011
REGION
I
REGION
II
REGION
III
20112007
LOS ANGELES COUNTY SHERIFF'S DEPARTMENT
01/08/2013 08:00 am
STATION PART I CRIME DETAIL
Ver: 10.09.11.2012.0
YTD 12/31/2012 - PART I CRIME RATE PER 10,000 POPULATION
4Page
- PRELIMINARY DATA
Homicides, Rapes and Aggravated Assaults are counted by the number of victims. All others are counted by incidents. Arsons are counted regardless of crime hierarchy.2007 Population Source: Los Angeles County Office of Urban Research (Based on estimates from CA Department of Finance)2011 Population Source: 2011 U.S. Census. / 2012 YTD Crime Rates computed based on 2011 population dataN/C - Not Calculable. Crime counts are for patrol station crimes only Red depicts crime increases of more than 30%. Green depicts crime decreases of more than 30%Preliminary data - information is time sensitive and subject to change upon further analysis. For each incident, only the most serious offense is counted.
172
54
918
88
776
290
445
35
530
1,480
1,329
140
71
801
215
50
793
480
795
647
226
161
198
172
54
918
88
776
290
445
35
530
1,480
1,329
140
71
801
215
50
793
480
795
647
226
161
198
80
32
646
37
609
242
329
17
385
1,020
790
104
52
719
214
30
862
318
450
389
192
131
99
80
32
646
37
609
242
329
17
385
1,020
790
104
52
719
214
30
862
318
450
389
192
131
99
80
38
588
28
660
314
302
16
446
985
854
109
47
721
198
49
866
330
475
427
235
104
158
38.06
12.95
53.7
9.44
44.83
11.98
22.19
85.93
43.94
71.56
107.21
17.98
28.17
62.36
56.49
9.11
37.2
24.23
31.35
27.88
22.12
16.57
13.36
18.14
7.72
34.36
4.15
30.95
9.01
17.35
41.5
33.19
54.4
66.71
13.88
19.48
61.34
60.96
6.12
45.24
17.49
18.46
17.6
20.49
16.1
7.2
18.14
9.17
31.28
3.14
33.54
11.69
15.93
39.06
38.44
52.54
72.11
14.54
17.61
61.51
56.4
9.99
45.45
18.15
19.49
19.32
25.08
12.78
11.49
-52.3%
-29.2%
-41.8%
-66.7%
-25.2%
-2.4%
-28.2%
-54.5%
-12.5%
-26.6%
-32.7%
-19.1%
-37.5%
-1.4%
-0.2%
9.7%
22.2%
-25.1%
-37.8%
-30.7%
13.4%
-22.9%
-14.0%
0.0%
18.8%
-9.0%
-24.3%
8.4%
29.7%
-8.2%
-5.9%
15.8%
-3.4%
8.1%
4.8%
-9.6%
0.3%
-7.5%
63.2%
0.5%
3.8%
5.6%
9.8%
22.4%
-20.6%
59.6%
ALTADENA
CRESCENTA VALLEY
LANCASTER
MALIBU/LOST HILLS
PALMDALE
SANTA CLARITA VALLEY
TEMPLE
AVALON
CARSON
CENTURY
COMPTON
LOMITA
MARINA DEL REY
SOUTH LOS ANGELES
WEST HOLLYWOOD
CERRITOS
EAST LOS ANGELES
INDUSTRY
LAKEWOOD
NORWALK
PICO RIVERA
SAN DIMAS
WALNUT
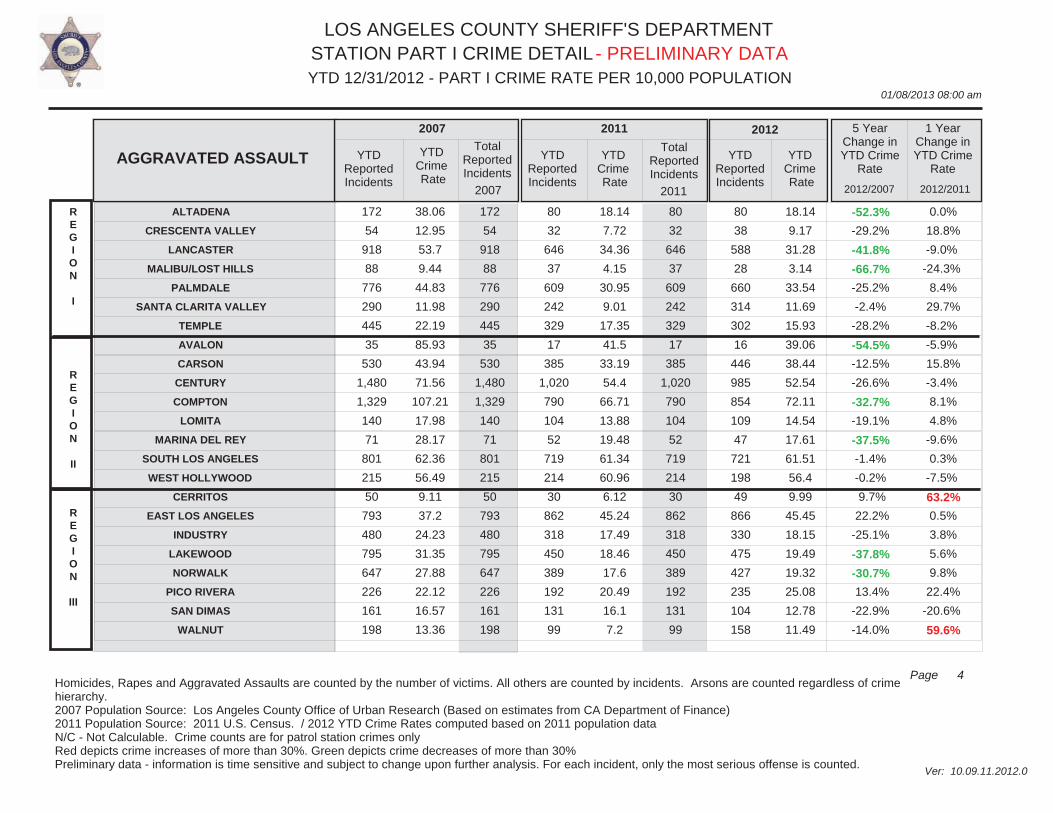
AGGRAVATED ASSAULT YTDReportedIncidents
YTDCrime Rate
TotalReportedIncidents
YTDReportedIncidents
YTDCrime Rate
TotalReportedIncidents
YTDReportedIncidents
YTDCrime Rate
5 YearChange inYTD Crime
Rate
1 YearChange inYTD Crime
Rate
2007 2011 2012
2012/2007 2012/2011
REGION
I
REGION
II
REGION
III
20112007
LOS ANGELES COUNTY SHERIFF'S DEPARTMENT
01/08/2013 08:00 am
STATION PART I CRIME DETAIL
Ver: 10.09.11.2012.0
YTD 12/31/2012 - PART I CRIME RATE PER 10,000 POPULATION
5Page
- PRELIMINARY DATA
Homicides, Rapes and Aggravated Assaults are counted by the number of victims. All others are counted by incidents. Arsons are counted regardless of crime hierarchy.2007 Population Source: Los Angeles County Office of Urban Research (Based on estimates from CA Department of Finance)2011 Population Source: 2011 U.S. Census. / 2012 YTD Crime Rates computed based on 2011 population dataN/C - Not Calculable. Crime counts are for patrol station crimes only Red depicts crime increases of more than 30%. Green depicts crime decreases of more than 30%Preliminary data - information is time sensitive and subject to change upon further analysis. For each incident, only the most serious offense is counted.
238
265
1,806
372
1,450
1,048
1,221
43
557
1,102
760
339
328
660
258
333
546
1,038
1,548
970
389
422
851
238
265
1,806
372
1,450
1,048
1,221
43
557
1,102
760
339
328
660
258
333
546
1,038
1,548
970
389
422
851
213
169
1,151
374
1,214
866
789
13
724
1,086
916
349
272
698
285
375
595
798
1,233
765
321
277
608
213
169
1,151
374
1,214
866
789
13
724
1,086
916
349
272
698
285
375
595
798
1,233
765
321
277
608
226
203
1,237
306
1,254
909
738
11
747
1,066
736
322
267
623
343
440
625
815
1,242
883
491
282
805
52.67
63.57
105.65
39.9
83.77
43.29
60.87
105.57
46.18
53.28
61.31
43.54
130.15
51.39
67.79
60.69
25.61
52.39
61.05
41.81
38.07
43.44
57.41
48.29
40.78
61.23
41.94
61.69
32.23
41.62
31.74
62.41
57.92
77.35
46.57
101.9
59.54
81.18
76.47
31.23
43.9
50.59
34.62
34.26
34.04
44.21
51.24
48.99
65.8
34.32
63.72
33.83
38.93
26.86
64.39
56.86
62.15
42.97
100.02
53.15
97.7
89.72
32.81
44.83
50.96
39.96
52.41
34.65
58.54
-2.7%
-22.9%
-37.7%
-14.0%
-23.9%
-21.9%
-36.0%
-74.6%
39.4%
6.7%
1.4%
-1.3%
-23.2%
3.4%
44.1%
47.8%
28.1%
-14.4%
-16.5%
-4.4%
37.7%
-20.2%
2.0%
6.1%
20.1%
7.5%
-18.2%
3.3%
5.0%
-6.5%
-15.4%
3.2%
-1.8%
-19.7%
-7.7%
-1.8%
-10.7%
20.4%
17.3%
5.1%
2.1%
0.7%
15.4%
53.0%
1.8%
32.4%
ALTADENA
CRESCENTA VALLEY
LANCASTER
MALIBU/LOST HILLS
PALMDALE
SANTA CLARITA VALLEY
TEMPLE
AVALON
CARSON
CENTURY
COMPTON
LOMITA
MARINA DEL REY
SOUTH LOS ANGELES
WEST HOLLYWOOD
CERRITOS
EAST LOS ANGELES
INDUSTRY
LAKEWOOD
NORWALK
PICO RIVERA
SAN DIMAS
WALNUT
BURGLARY YTDReportedIncidents
YTDCrime Rate
TotalReportedIncidents
YTDReportedIncidents
YTDCrime Rate
TotalReportedIncidents
YTDReportedIncidents
YTDCrime Rate
5 YearChange inYTD Crime
Rate
1 YearChange inYTD Crime
Rate
2007 2011 2012
2012/2007 2012/2011
REGION
I
REGION
II
REGION
III
20112007
LOS ANGELES COUNTY SHERIFF'S DEPARTMENT
01/08/2013 08:00 am
STATION PART I CRIME DETAIL
Ver: 10.09.11.2012.0
YTD 12/31/2012 - PART I CRIME RATE PER 10,000 POPULATION
6Page
- PRELIMINARY DATA
Homicides, Rapes and Aggravated Assaults are counted by the number of victims. All others are counted by incidents. Arsons are counted regardless of crime hierarchy.2007 Population Source: Los Angeles County Office of Urban Research (Based on estimates from CA Department of Finance)2011 Population Source: 2011 U.S. Census. / 2012 YTD Crime Rates computed based on 2011 population dataN/C - Not Calculable. Crime counts are for patrol station crimes only Red depicts crime increases of more than 30%. Green depicts crime decreases of more than 30%Preliminary data - information is time sensitive and subject to change upon further analysis. For each incident, only the most serious offense is counted.
308
525
2,786
1,065
2,770
3,554
2,115
88
2,101
1,435
1,298
786
511
778
1,198
1,213
1,397
2,481
4,175
2,424
1,198
1,014
1,406
308
525
2,786
1,065
2,770
3,554
2,115
88
2,101
1,435
1,298
786
511
778
1,198
1,213
1,397
2,481
4,175
2,424
1,198
1,014
1,406
338
406
2,051
816
2,195
2,388
1,631
33
1,797
1,389
1,410
729
494
674
1,124
1,219
1,655
1,803
3,407
2,156
1,268
637
1,075
338
406
2,051
816
2,195
2,388
1,631
33
1,797
1,389
1,410
729
494
674
1,124
1,219
1,655
1,803
3,407
2,156
1,268
637
1,075
359
323
2,295
798
2,442
2,443
1,520
45
1,982
1,479
1,222
739
505
700
1,285
1,251
1,844
1,877
3,494
2,479
1,390
737
1,169
68.16
125.94
162.97
114.24
160.03
146.8
105.45
216.06
174.19
69.38
104.71
100.95
202.76
60.57
314.78
221.06
65.53
125.23
164.65
104.47
117.23
104.37
94.85
76.63
97.97
109.1
91.51
111.54
88.87
86.03
80.57
154.9
74.08
119.06
97.28
185.06
57.5
320.17
248.57
86.87
99.18
139.79
97.56
135.34
78.28
78.17
81.39
77.94
122.08
89.49
124.09
90.92
80.17
109.86
170.85
78.88
103.19
98.61
189.18
59.71
366.03
255.09
96.79
103.25
143.36
112.18
148.36
90.57
85
19.4%
-38.1%
-25.1%
-21.7%
-22.5%
-38.1%
-24.0%
-49.2%
-1.9%
13.7%
-1.5%
-2.3%
-6.7%
-1.4%
16.3%
15.4%
47.7%
-17.6%
-12.9%
7.4%
26.6%
-13.2%
-10.4%
6.2%
-20.5%
11.9%
-2.2%
11.3%
2.3%
-6.8%
36.4%
10.3%
6.5%
-13.3%
1.4%
2.2%
3.8%
14.3%
2.6%
11.4%
4.1%
2.6%
15.0%
9.6%
15.7%
8.7%
ALTADENA
CRESCENTA VALLEY
LANCASTER
MALIBU/LOST HILLS
PALMDALE
SANTA CLARITA VALLEY
TEMPLE
AVALON
CARSON
CENTURY
COMPTON
LOMITA
MARINA DEL REY
SOUTH LOS ANGELES
WEST HOLLYWOOD
CERRITOS
EAST LOS ANGELES
INDUSTRY
LAKEWOOD
NORWALK
PICO RIVERA
SAN DIMAS
WALNUT
LARCENY THEFT YTDReportedIncidents
YTDCrime Rate
TotalReportedIncidents
YTDReportedIncidents
YTDCrime Rate
TotalReportedIncidents
YTDReportedIncidents
YTDCrime Rate
5 YearChange inYTD Crime
Rate
1 YearChange inYTD Crime
Rate
2007 2011 2012
2012/2007 2012/2011
REGION
I
REGION
II
REGION
III
20112007

LOS ANGELES COUNTY SHERIFF'S DEPARTMENT
01/08/2013 08:00 am
STATION PART I CRIME DETAIL
Ver: 10.09.11.2012.0
YTD 12/31/2012 - PART I CRIME RATE PER 10,000 POPULATION
7Page
- PRELIMINARY DATA
Homicides, Rapes and Aggravated Assaults are counted by the number of victims. All others are counted by incidents. Arsons are counted regardless of crime hierarchy.2007 Population Source: Los Angeles County Office of Urban Research (Based on estimates from CA Department of Finance)2011 Population Source: 2011 U.S. Census. / 2012 YTD Crime Rates computed based on 2011 population dataN/C - Not Calculable. Crime counts are for patrol station crimes only Red depicts crime increases of more than 30%. Green depicts crime decreases of more than 30%Preliminary data - information is time sensitive and subject to change upon further analysis. For each incident, only the most serious offense is counted.
128
53
931
96
768
576
781
41
807
2,175
1,405
110
113
662
216
334
1,217
1,105
1,970
1,199
665
241
304
128
53
931
96
768
576
781
41
807
2,175
1,405
110
113
662
216
334
1,217
1,105
1,970
1,199
665
241
304
46
28
449
44
438
283
499
10
690
1,411
1,051
91
73
419
120
165
1,033
766
1,279
956
440
116
183
46
28
449
44
438
283
499
10
690
1,411
1,051
91
73
419
120
165
1,033
766
1,279
956
440
116
183
51
43
492
64
396
386
565
14
712
1,345
1,079
87
59
470
122
176
1,076
704
1,354
822
483
155
177
28.32
12.71
54.46
10.3
44.37
23.79
38.94
100.66
66.91
105.16
113.34
14.13
44.84
51.54
56.76
60.87
57.09
55.78
77.69
51.68
65.08
24.81
20.51
10.43
6.76
23.88
4.93
22.26
10.53
26.32
24.41
59.48
75.26
88.75
12.14
27.35
35.74
34.18
33.65
54.22
42.14
52.48
43.26
46.96
14.26
13.31
11.56
10.38
26.17
7.18
20.12
14.37
29.8
34.18
61.37
71.74
91.11
11.61
22.1
40.09
34.75
35.89
56.48
38.73
55.55
37.2
51.55
19.05
12.87
-59.2%
-18.3%
-52.0%
-30.3%
-54.7%
-39.6%
-23.5%
-66.0%
-8.3%
-31.8%
-19.6%
-17.8%
-50.7%
-22.2%
-38.8%
-41.0%
-1.1%
-30.6%
-28.5%
-28.0%
-20.8%
-23.2%
-37.3%
10.8%
53.6%
9.6%
45.6%
-9.6%
36.5%
13.2%
40.0%
3.2%
-4.7%
2.7%
-4.4%
-19.2%
12.2%
1.7%
6.7%
4.2%
-8.1%
5.9%
-14.0%
9.8%
33.6%
-3.3%
ALTADENA
CRESCENTA VALLEY
LANCASTER
MALIBU/LOST HILLS
PALMDALE
SANTA CLARITA VALLEY
TEMPLE
AVALON
CARSON
CENTURY
COMPTON
LOMITA
MARINA DEL REY
SOUTH LOS ANGELES
WEST HOLLYWOOD
CERRITOS
EAST LOS ANGELES
INDUSTRY
LAKEWOOD
NORWALK
PICO RIVERA
SAN DIMAS
WALNUT
GRAND THEFT AUTO YTDReportedIncidents
YTDCrime Rate
TotalReportedIncidents
YTDReportedIncidents
YTDCrime Rate
TotalReportedIncidents
YTDReportedIncidents
YTDCrime Rate
5 YearChange inYTD Crime
Rate
1 YearChange inYTD Crime
Rate
2007 2011 2012
2012/2007 2012/2011
REGION
I
REGION
II
REGION
III
20112007
LOS ANGELES COUNTY SHERIFF'S DEPARTMENT
01/08/2013 08:00 am
STATION PART I CRIME DETAIL
Ver: 10.09.11.2012.0
YTD 12/31/2012 - PART I CRIME RATE PER 10,000 POPULATION
8Page
- PRELIMINARY DATA
Homicides, Rapes and Aggravated Assaults are counted by the number of victims. All others are counted by incidents. Arsons are counted regardless of crime hierarchy.2007 Population Source: Los Angeles County Office of Urban Research (Based on estimates from CA Department of Finance)2011 Population Source: 2011 U.S. Census. / 2012 YTD Crime Rates computed based on 2011 population dataN/C - Not Calculable. Crime counts are for patrol station crimes only Red depicts crime increases of more than 30%. Green depicts crime decreases of more than 30%Preliminary data - information is time sensitive and subject to change upon further analysis. For each incident, only the most serious offense is counted.
7
10
108
25
81
48
23
1
58
154
101
12
3
40
6
13
51
29
48
44
25
22
17
7
10
108
25
81
48
23
1
58
154
101
12
3
40
6
13
51
29
48
44
25
22
17
4
5
53
3
44
33
14
0
14
75
43
7
5
28
12
3
31
19
31
30
9
8
15
4
5
53
3
44
33
14
0
14
75
43
7
5
28
12
3
31
19
31
30
9
8
15
4
5
73
4
40
33
9
0
17
58
49
5
6
22
9
10
48
17
29
23
7
7
16
1.55
2.4
6.32
2.68
4.68
1.98
1.15
2.46
4.81
7.45
8.15
1.54
1.19
3.11
1.58
2.37
2.39
1.46
1.89
1.9
2.45
2.26
1.15
.91
1.21
2.82
.34
2.24
1.23
.74
0
1.21
4
3.63
.93
1.87
2.39
3.42
.61
1.63
1.05
1.27
1.36
.96
.98
1.09
.91
1.21
3.88
.45
2.03
1.23
.47
0
1.47
3.09
4.14
.67
2.25
1.88
2.56
2.04
2.52
.94
1.19
1.04
.75
.86
1.16
-41.3%
-49.6%
-38.6%
-83.2%
-56.6%
-37.9%
-59.1%
0.0%
-69.4%
-58.5%
-49.2%
-56.5%
89.1%
-39.6%
62.0%
-13.9%
5.4%
-35.6%
-37.0%
-45.3%
-69.4%
-62.0%
0.9%
0.0%
0.0%
37.6%
32.4%
-9.4%
0.0%
-36.5%
0.0%
21.5%
-22.8%
14.1%
-28.0%
20.3%
-21.3%
-25.2%
234.4%
54.6%
-10.5%
-6.3%
-23.5%
-21.9%
-12.2%
6.4%
ALTADENA
CRESCENTA VALLEY
LANCASTER
MALIBU/LOST HILLS
PALMDALE
SANTA CLARITA VALLEY
TEMPLE
AVALON
CARSON
CENTURY
COMPTON
LOMITA
MARINA DEL REY
SOUTH LOS ANGELES
WEST HOLLYWOOD
CERRITOS
EAST LOS ANGELES
INDUSTRY
LAKEWOOD
NORWALK
PICO RIVERA
SAN DIMAS
WALNUT
ARSON YTDReportedIncidents
YTDCrime Rate
TotalReportedIncidents
YTDReportedIncidents
YTDCrime Rate
TotalReportedIncidents
YTDReportedIncidents
YTDCrime Rate
5 YearChange inYTD Crime
Rate
1 YearChange inYTD Crime
Rate
2007 2011 2012
2012/2007 2012/2011
REGION
I
REGION
II
REGION
III
20112007
LOS ANGELES COUNTY SHERIFF'S DEPARTMENT
01/08/2013 08:00 am
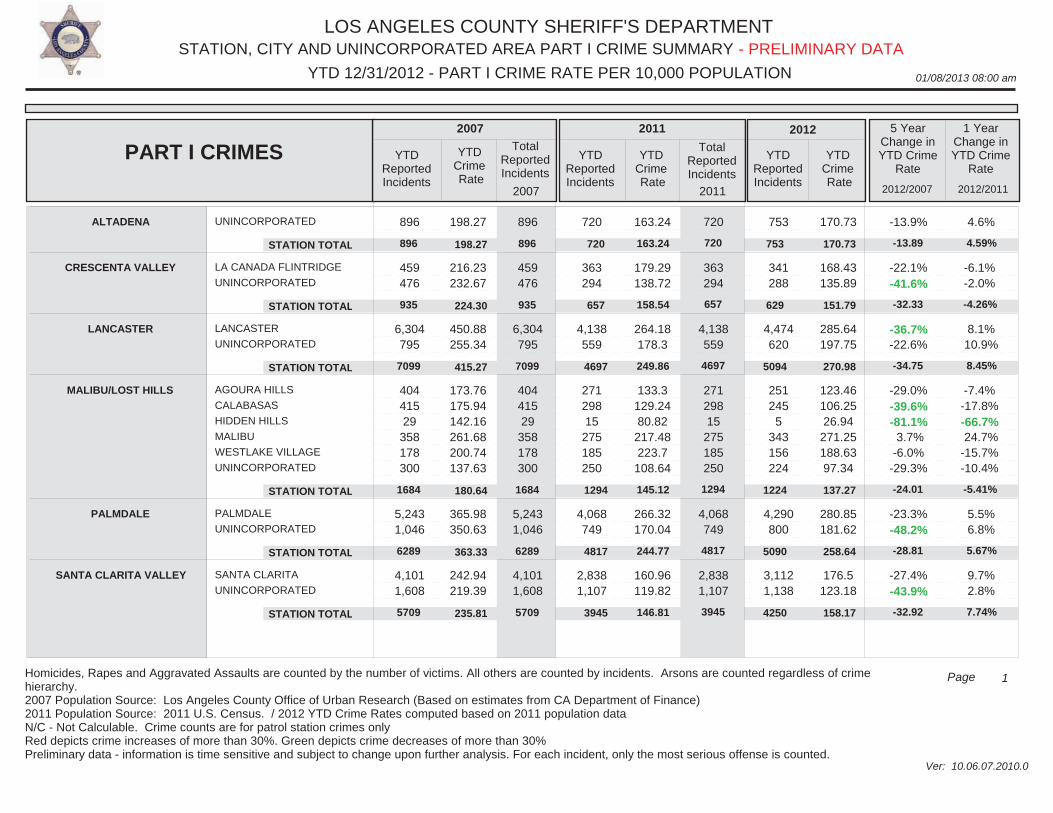
STATION, CITY AND UNINCORPORATED AREA PART I CRIME SUMMARY
Ver: 10.06.07.2010.0
YTD 12/31/2012 - PART I CRIME RATE PER 10,000 POPULATION
1Page
- PRELIMINARY DATA
Homicides, Rapes and Aggravated Assaults are counted by the number of victims. All others are counted by incidents. Arsons are counted regardless of crime hierarchy.2007 Population Source: Los Angeles County Office of Urban Research (Based on estimates from CA Department of Finance)2011 Population Source: 2011 U.S. Census. / 2012 YTD Crime Rates computed based on 2011 population dataN/C - Not Calculable. Crime counts are for patrol station crimes only Red depicts crime increases of more than 30%. Green depicts crime decreases of more than 30%Preliminary data - information is time sensitive and subject to change upon further analysis. For each incident, only the most serious offense is counted.
UNINCORPORATED
LA CANADA FLINTRIDGE
UNINCORPORATED
LANCASTER
UNINCORPORATED
AGOURA HILLS
CALABASAS
HIDDEN HILLS
MALIBU
WESTLAKE VILLAGE
UNINCORPORATED
PALMDALE
UNINCORPORATED
SANTA CLARITA
UNINCORPORATED
896
459 476
6,304 795
404 415 29
358 178 300
5,243 1,046
4,101 1,608
896
459 476
6,304 795
404 415 29
358 178 300
5,243 1,046
4,101 1,608
720
363 294
4,138 559
271 298 15
275 185 250
4,068 749
2,838 1,107
720
363 294
4,138 559
271 298 15
275 185 250
4,068 749
2,838 1,107
753
341 288
4,474 620
251 245 5
343 156 224
4,290 800
3,112 1,138
198.27
216.23232.67
450.88255.34
173.76175.94142.16261.68200.74137.63
365.98350.63
242.94219.39
163.24
179.29138.72
264.18178.3
133.3129.2480.82
217.48223.7
108.64
266.32170.04
160.96119.82
170.73
168.43135.89
285.64197.75
123.46106.2526.94
271.25188.6397.34
280.85181.62
176.5123.18
-13.9%
-22.1%-41.6%
-36.7%-22.6%
-29.0%-39.6%-81.1% 3.7%-6.0%
-29.3%
-23.3%-48.2%
-27.4%-43.9%
4.6%
-6.1%-2.0%
8.1% 10.9%
-7.4%-17.8%-66.7% 24.7%-15.7%-10.4%
5.5% 6.8%
9.7% 2.8%
ALTADENA
CRESCENTA VALLEY
LANCASTER
MALIBU/LOST HILLS
PALMDALE
SANTA CLARITA VALLEY
YTDReportedIncidents
YTDCrime Rate
TotalReportedIncidents
YTDReportedIncidents
YTDCrime Rate
TotalReportedIncidents
YTDReportedIncidents
YTDCrime Rate
5 YearChange inYTD Crime
Rate
1 YearChange inYTD Crime
Rate
2007 2011 2012
2012/2007 2012/2011
STATION TOTAL
STATION TOTAL
STATION TOTAL
STATION TOTAL
STATION TOTAL
STATION TOTAL
896
935
7099
1684
6289
5709
896
935
7099
1684
6289
5709
720
657
4697
1294
4817
3945
720
657
4697
1294
4817
3945
753
629
5094
1224
5090
4250
198.27
224.30
415.27
180.64
363.33
235.81
163.24
158.54
249.86
145.12
244.77
146.81
170.73
151.79
270.98
137.27
258.64
158.17
-13.89
-32.33
-34.75
-24.01
-28.81
-32.92
4.59%
-4.26%
8.45%
-5.41%
5.67%
7.74%
PART I CRIMES
2007 2011
LOS ANGELES COUNTY SHERIFF'S DEPARTMENT
01/08/2013 08:00 am
STATION, CITY AND UNINCORPORATED AREA PART I CRIME SUMMARY
Ver: 10.06.07.2010.0
YTD 12/31/2012 - PART I CRIME RATE PER 10,000 POPULATION
2Page
- PRELIMINARY DATA
Homicides, Rapes and Aggravated Assaults are counted by the number of victims. All others are counted by incidents. Arsons are counted regardless of crime hierarchy.2007 Population Source: Los Angeles County Office of Urban Research (Based on estimates from CA Department of Finance)2011 Population Source: 2011 U.S. Census. / 2012 YTD Crime Rates computed based on 2011 population dataN/C - Not Calculable. Crime counts are for patrol station crimes only Red depicts crime increases of more than 30%. Green depicts crime decreases of more than 30%Preliminary data - information is time sensitive and subject to change upon further analysis. For each incident, only the most serious offense is counted.
BRADBURY
DUARTE
ROSEMEAD
SOUTH EL MONTE
TEMPLE CITY
UNINCORPORATED
AVALON
UNINCORPORATED
CARSON
UNINCORPORATED
LYNWOOD
UNINCORPORATED
COMPTON
UNINCORPORATED
LOMITA
RANCHO PALOS VERDES
ROLLING HILLS
ROLLING HILLS ESTATES
UNINCORPORATED
13 602
1,644 787 774
1,112
203 13
3,316 1,044
2,585 4,712
4,539 1,015
549 585
9 200 109
13 602
1,644 787 774
1,112
203 13
3,316 1,044
2,585 4,712
4,539 1,015
549 585
9 200 109
13 493
1,310 503 400 755
70 6
2,935 823
2,019 3,764
3,968 762
431 595 15
170 123
13 493
1,310 503 400 755
70 6
2,935 823
2,019 3,764
3,968 762
431 595 15
170 123
10 577
1,059 494 393 768
81 8
3,227 882
1,951 3,729
3,662 833
499 545 27
139 94
138.59260.07286.83352.58218.12181.2
582222.22
338.03463.67
353.28352.57
455.44417.75
260.63136.5245.85
248.66276.65
124.05231.23243.66250.05112.49130.66
187.77163.04
320.02338.72
289.37319.74
411.38346.84
212.78142.8880.65
210.74394.86
95.42270.63196.97245.58110.52132.91
217.27217.39
351.85363.01
279.63316.76
379.66379.15
246.35130.87145.16172.31301.77
-31.2% 4.1%
-31.3%-30.4%-49.3%-26.7%
-62.7%-2.2%
4.1%-21.7%
-20.9%-10.2%
-16.6%-9.2%
-5.5%-4.1%
216.6%-30.7% 9.1%
-23.1% 17.0%-19.2%-1.8%-1.8% 1.7%
15.7% 33.3%
10.0% 7.2%
-3.4%-0.9%
-7.7% 9.3%
15.8%-8.4% 80.0%-18.2%-23.6%
TEMPLE
AVALON
CARSON
CENTURY
COMPTON
LOMITA
YTDReportedIncidents
YTDCrime Rate
TotalReportedIncidents
YTDReportedIncidents
YTDCrime Rate
TotalReportedIncidents
YTDReportedIncidents
YTDCrime Rate
5 YearChange inYTD Crime
Rate
1 YearChange inYTD Crime
Rate
2007 2011 2012
2012/2007 2012/2011
STATION TOTAL
STATION TOTAL
STATION TOTAL
STATION TOTAL
STATION TOTAL
4932
216
4360
7297
5554
4932
216
4360
7297
5554
3474
76
3758
5783
4730
3474
76
3758
5783
4730
3301
89
4109
5680
4495
245.89
530.32
361.48
352.82
448.05
183.24
185.55
323.93
308.44
399.41
174.11
217.29
354.19
302.94
379.57
-29.19
-59.03
-2.02
-14.14
-15.28
-4.98%
17.11%
9.34%
-1.78%
-4.97%
PART I CRIMES
2007 2011
LOS ANGELES COUNTY SHERIFF'S DEPARTMENT
01/08/2013 08:00 am
STATION, CITY AND UNINCORPORATED AREA PART I CRIME SUMMARY
Ver: 10.06.07.2010.0
YTD 12/31/2012 - PART I CRIME RATE PER 10,000 POPULATION
3Page
- PRELIMINARY DATA
Homicides, Rapes and Aggravated Assaults are counted by the number of victims. All others are counted by incidents. Arsons are counted regardless of crime hierarchy.2007 Population Source: Los Angeles County Office of Urban Research (Based on estimates from CA Department of Finance)2011 Population Source: 2011 U.S. Census. / 2012 YTD Crime Rates computed based on 2011 population dataN/C - Not Calculable. Crime counts are for patrol station crimes only Red depicts crime increases of more than 30%. Green depicts crime decreases of more than 30%Preliminary data - information is time sensitive and subject to change upon further analysis. For each incident, only the most serious offense is counted.
UNINCORPORATED
LAWNDALE
UNINCORPORATED
WEST HOLLYWOOD
UNINCORPORATED
CERRITOS
UNINCORPORATED
COMMERCE
CUDAHY
MAYWOOD
UNINCORPORATED
INDUSTRY
LA HABRA HEIGHTS
LA PUENTE
UNINCORPORATED
1,094
741 2,800
1,763 301
2,024 0
1,273 0 0
3,169
1,781 100 976
2,597
1,094
741 2,800
1,763 301
2,024 0
1,273 0 0
3,169
1,781 100 976
2,597
940
616 2,351
1,808 93
1,847 0
1,049 534 507
2,522
1,182 80
754 1,866
940
616 2,351
1,808 93
1,847
1,049 534 507
2,522
1,182 80
754 1,866
925
566 2,381
2,008 100
2,001 0
1,112 508 474
2,832
1,172 53
642 2,053
434.09
221.96294.56
471.244659.44
368.850
946.7500
219.06
27915.36164.31226.07175.21
352.14
187.98278.37
525.61315.42
376.620
818.06224.32185.07199.37
53972.6150.23189.37136.77
346.52
172.72281.93
583.741414.43
408.030
867.19213.4
173.02223.88
53515.9899.53
161.24150.48
-20.2%
-22.2%-4.3%
23.9%-69.6%
10.6% 0.0%
-8.4% 0.0% 0.0% 2.2%
91.7%-39.4%-28.7%-14.1%
-1.6%
-8.1% 1.3%
11.1% 7.5%
8.3% 0.0%
6.0%-4.9%-6.5% 12.3%
-0.9%-33.8%-14.9% 10.0%
LOMITA
MARINA DEL REY
SOUTH LOS ANGELES
WEST HOLLYWOOD
CERRITOS
EAST LOS ANGELES
INDUSTRY
YTDReportedIncidents
YTDCrime Rate
TotalReportedIncidents
YTDReportedIncidents
YTDCrime Rate
TotalReportedIncidents
YTDReportedIncidents
YTDCrime Rate
5 YearChange inYTD Crime
Rate
1 YearChange inYTD Crime
Rate
2007 2011 2012
2012/2007 2012/2011
STATION TOTAL
STATION TOTAL
STATION TOTAL
STATION TOTAL
STATION TOTAL
STATION TOTAL
1452
1094
3541
2064
2024
4442
1452
1094
3541
2064
2024
4442
1334
940
2967
1901
1847
4612
1334
940
2967
1901
1847
4612
1304
925
2947
2108
2001
4926
186.48
434.09
275.69
542.33
368.85
208.37
178.01
352.14
253.11
541.5
376.62
242.08
174
346.52
251.4
600.47
408.03
258.56
-6.69
-20.17
-8.81
10.72
10.62
24.09
-2.25%
-1.60%
-0.68%
10.89%
8.34%
6.81%
PART I CRIMES
2007 2011
LOS ANGELES COUNTY SHERIFF'S DEPARTMENT
01/08/2013 08:00 am
STATION, CITY AND UNINCORPORATED AREA PART I CRIME SUMMARY
Ver: 10.06.07.2010.0
YTD 12/31/2012 - PART I CRIME RATE PER 10,000 POPULATION
4Page
- PRELIMINARY DATA
Homicides, Rapes and Aggravated Assaults are counted by the number of victims. All others are counted by incidents. Arsons are counted regardless of crime hierarchy.2007 Population Source: Los Angeles County Office of Urban Research (Based on estimates from CA Department of Finance)2011 Population Source: 2011 U.S. Census. / 2012 YTD Crime Rates computed based on 2011 population dataN/C - Not Calculable. Crime counts are for patrol station crimes only Red depicts crime increases of more than 30%. Green depicts crime decreases of more than 30%Preliminary data - information is time sensitive and subject to change upon further analysis. For each incident, only the most serious offense is counted.
ARTESIA
BELLFLOWER
HAWAIIAN GARDENS
LAKEWOOD
PARAMOUNT
UNINCORPORATED
LA MIRADA
NORWALK
UNINCORPORATED
PICO RIVERA
UNINCORPORATED
SAN DIMAS
UNINCORPORATED
DIAMOND BAR
WALNUT
UNINCORPORATED
443 3,049 565
2,902 2,450
16
1,183 3,244 1,212
1,823 840
983 961
1,189 604
1,178
443 3,049 565
2,902 2,450
16
1,183 3,244 1,212
1,823 840
983 961
1,189 604
1,178
393 2,132 285
2,114 1,901
23
896 2,654 963
1,810 547
641 580
844 398 824
393 2,132 285
2,114 1,901
23
896 2,654 963
1,810 547
641 580
844 398 824
341 2,211 282
2,353 1,861
24
883 3,058 960
2,050 687
723 608
1,009 432 959
249.76395.81355.68348.2
423.8390.81
239.23295.57166.44
271.98238.89
266.39159.5
198.85186.39210.24
237.86278.27199.94264.09351.4
105.22
184.64251.45143.92
287.57177.9
192.08120.83
151.95136.43156.04
206.39288.58197.84293.95344.01109.79
181.96289.72143.47
325.7223.44
216.66126.66
181.66148.09181.61
-17.4%-27.1%-44.4%-15.6%-18.8% 20.9%
-23.9%-2.0%
-13.8%
19.8%-6.5%
-18.7%-20.6%
-8.6%-20.6%-13.6%
-13.2% 3.7%-1.1% 11.3%-2.1% 4.3%
-1.5% 15.2%-0.3%
13.3% 25.6%
12.8% 4.8%
19.6% 8.6%
16.4%
INDUSTRY
LAKEWOOD
NORWALK
PICO RIVERA
SAN DIMAS
WALNUT
YTDReportedIncidents
YTDCrime Rate
TotalReportedIncidents
YTDReportedIncidents
YTDCrime Rate
TotalReportedIncidents
YTDReportedIncidents
YTDCrime Rate
5 YearChange inYTD Crime
Rate
1 YearChange inYTD Crime
Rate
2007 2011 2012
2012/2007 2012/2011
STATION TOTAL
STATION TOTAL
STATION TOTAL
STATION TOTAL
STATION TOTAL
STATION TOTAL
5454
9425
5639
2663
1944
2971
5454
9425
5639
2663
1944
2971
3882
6848
4513
2357
1221
2066
3882
6848
4513
2357
1221
2066
3920
7072
4901
2737
1331
2400
275.29
371.70
243.03
260.60
200.10
200.43
213.54
280.97
204.22
251.58
150.05
150.23
215.63
290.16
221.78
292.14
163.57
174.52
-21.67
-21.94
-8.74
12.1
-18.26
-12.93
0.98%
3.27%
8.60%
16.12%
9.01%
16.17%
PART I CRIMES
2007 2011
LOS ANGELES COUNTY SHERIFF'S DEPARTMENT
01/08/2013 08:00 am
STATION, CITY AND UNINCORPORATED AREA PART I CRIME DETAIL
Ver: 10.07.13.2011.0
YTD 12/31/2012 - PART I CRIME RATE PER 10,000 POPULATION
1Page
- PRELIMINARY DATA
Homicides, Rapes and Aggravated Assaults are counted by the number of victims. All others are counted by incidents. Arsons are counted regardless of crime hierarchy.2007 Population Source: Los Angeles County Office of Urban Research (Based on estimates from CA Department of Finance)2011 Population Source: 2011 U.S. Census. / 2012 YTD Crime Rates computed based on 2011 population dataN/C - Not Calculable. Crime counts are for patrol station crimes only Red depicts crime increases of more than 30%. Green depicts crime decreases of more than 30%Preliminary data - information is time sensitive and subject to change upon further analysis. For each incident, only the most serious offense is counted.
UNINCORPORATED
LA CANADA FLINTRIDGE
UNINCORPORATED
LANCASTER
UNINCORPORATED
AGOURA HILLS
CALABASAS
HIDDEN HILLS
MALIBU
WESTLAKE VILLAGE
UNINCORPORATED
PALMDALE
UNINCORPORATED
SANTA CLARITA
UNINCORPORATED
2
0 1
12 6
0 2 0 0 0 2
11 4
1 8
2
0 1
12 6
0 2 0 0 0 2
11 4
1 8
1
0 3
3 4
1 0 0 0 0 0
9 2
5 1
1
0 3
3 4
1 0 0 0 0 0
9 2
5 1
2
0 2
9 1
0 1 0 0 0 0
6 2
1 0
.44
0.49
.861.93
0.85000
.92
.771.34
.061.09
.23
01.42
.191.28
.4900000
.59
.45
.28
.11
.45
0.94
.57
.32
0.430000
.39
.45
.060
2.3%
0.0% 91.8%
-33.7%-83.4%
0.0%-49.4% 0.0% 0.0% 0.0% 0.0%
-49.4%-66.4%
0.0% 0.0%
95.7%
0.0%-33.8%
200.0%-75.0%
0.0% 0.0% 0.0% 0.0% 0.0% 0.0%
-33.9% 0.0%
-78.6% 0.0%
ALTADENA
CRESCENTA VALLEY
LANCASTER
MALIBU/LOST HILLS
PALMDALE
SANTA CLARITA VALLEY
CRIMINAL HOMICIDE YTDReportedIncidents
YTDCrime Rate
TotalReportedIncidents
YTDReportedIncidents
YTDCrime Rate
TotalReportedIncidents
YTDReportedIncidents
YTDCrime Rate
5 YearChange inYTD Crime
Rate
1 YearChange inYTD Crime
Rate
2007 2011 2012
2012/2007 2012/2011
STATION TOTAL
STATION TOTAL
STATION TOTAL
STATION TOTAL
STATION TOTAL
STATION TOTAL
2
1
18
4
15
9
2
1
18
4
15
9
1
3
7
1
11
6
1
3
7
1
11
6
2
2
10
1
8
1
0.44
0.24
1.05
0.43
0.87
0.37
.23
.72
.37
.11
.56
.22
.45
.48
.53
.11
.41
.04
2.27
100
-49.52
-74.42
-52.87
-89.19
95.65%
-33.33%
43.24%
0.00%
-26.79%
-81.82%
2007 2011
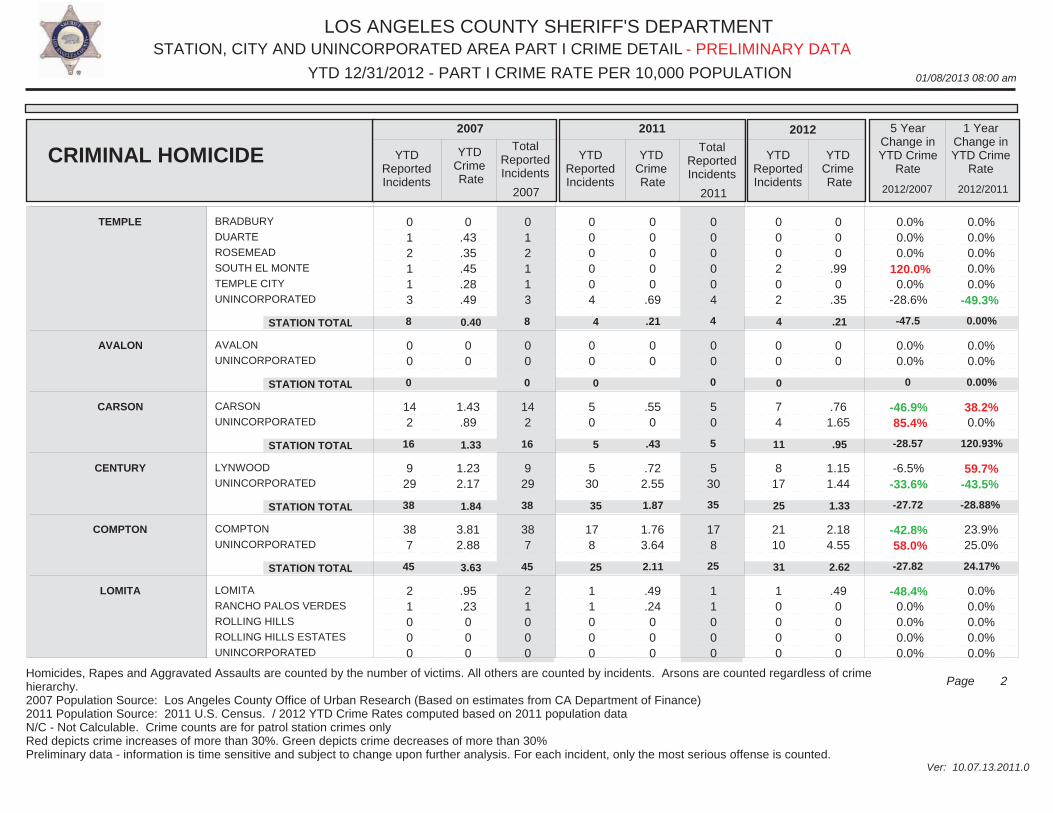
LOS ANGELES COUNTY SHERIFF'S DEPARTMENT
01/08/2013 08:00 am
STATION, CITY AND UNINCORPORATED AREA PART I CRIME DETAIL
Ver: 10.07.13.2011.0
YTD 12/31/2012 - PART I CRIME RATE PER 10,000 POPULATION
2Page
- PRELIMINARY DATA
Homicides, Rapes and Aggravated Assaults are counted by the number of victims. All others are counted by incidents. Arsons are counted regardless of crime hierarchy.2007 Population Source: Los Angeles County Office of Urban Research (Based on estimates from CA Department of Finance)2011 Population Source: 2011 U.S. Census. / 2012 YTD Crime Rates computed based on 2011 population dataN/C - Not Calculable. Crime counts are for patrol station crimes only Red depicts crime increases of more than 30%. Green depicts crime decreases of more than 30%Preliminary data - information is time sensitive and subject to change upon further analysis. For each incident, only the most serious offense is counted.
BRADBURY
DUARTE
ROSEMEAD
SOUTH EL MONTE
TEMPLE CITY
UNINCORPORATED
AVALON
UNINCORPORATED
CARSON
UNINCORPORATED
LYNWOOD
UNINCORPORATED
COMPTON
UNINCORPORATED
LOMITA
RANCHO PALOS VERDES
ROLLING HILLS
ROLLING HILLS ESTATES
UNINCORPORATED
0 1 2 1 1 3
0 0
14 2
9 29
38 7
2 1 0 0 0
0 1 2 1 1 3
0 0
14 2
9 29
38 7
2 1 0 0 0
0 0 0 0 0 4
0 0
5 0
5 30
17 8
1 1 0 0 0
0 0 0 0 0 4
0 0
5 0
5 30
17 8
1 1 0 0 0
0 0 0 2 0 2
0 0
7 4
8 17
21 10
1 0 0 0 0
0.43.35.45.28.49
00
1.43.89
1.232.17
3.812.88
.95
.23000
00000
.69
00
.550
.722.55
1.763.64
.49
.24000
000
.990
.35
00
.761.65
1.151.44
2.184.55
.490000
0.0% 0.0% 0.0%
120.0% 0.0%
-28.6%
0.0% 0.0%
-46.9% 85.4%
-6.5%-33.6%
-42.8% 58.0%
-48.4% 0.0% 0.0% 0.0% 0.0%
0.0% 0.0% 0.0% 0.0% 0.0%
-49.3%
0.0% 0.0%
38.2% 0.0%
59.7%-43.5%
23.9% 25.0%
0.0% 0.0% 0.0% 0.0% 0.0%
TEMPLE
AVALON
CARSON
CENTURY
COMPTON
LOMITA
CRIMINAL HOMICIDE YTDReportedIncidents
YTDCrime Rate
TotalReportedIncidents
YTDReportedIncidents
YTDCrime Rate
TotalReportedIncidents
YTDReportedIncidents
YTDCrime Rate
5 YearChange inYTD Crime
Rate
1 YearChange inYTD Crime
Rate
2007 2011 2012
2012/2007 2012/2011
STATION TOTAL
STATION TOTAL
STATION TOTAL
STATION TOTAL
STATION TOTAL
8
0
16
38
45
8
0
16
38
45
4
0
5
35
25
4
0
5
35
25
4
0
11
25
31
0.40
1.33
1.84
3.63
.21
.43
1.87
2.11
.21
.95
1.33
2.62
-47.5
0
-28.57
-27.72
-27.82
0.00%
0.00%
120.93%
-28.88%
24.17%
2007 2011
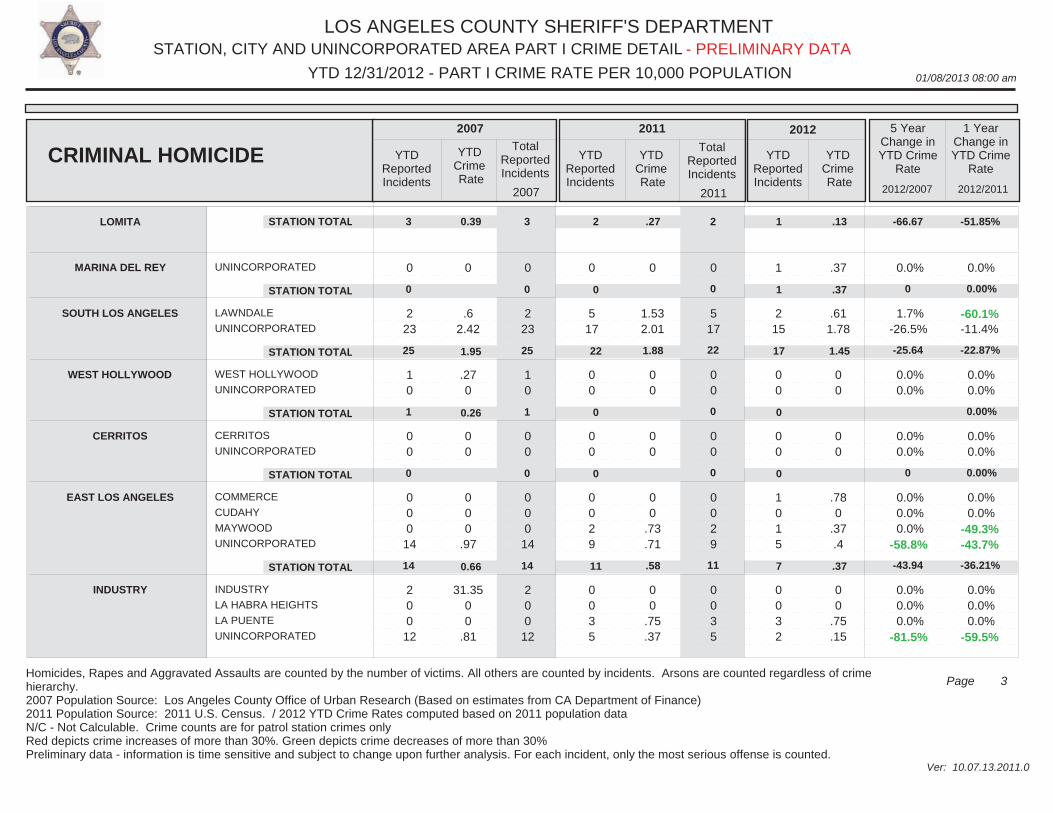
LOS ANGELES COUNTY SHERIFF'S DEPARTMENT
01/08/2013 08:00 am
STATION, CITY AND UNINCORPORATED AREA PART I CRIME DETAIL
Ver: 10.07.13.2011.0
YTD 12/31/2012 - PART I CRIME RATE PER 10,000 POPULATION
3Page
- PRELIMINARY DATA
Homicides, Rapes and Aggravated Assaults are counted by the number of victims. All others are counted by incidents. Arsons are counted regardless of crime hierarchy.2007 Population Source: Los Angeles County Office of Urban Research (Based on estimates from CA Department of Finance)2011 Population Source: 2011 U.S. Census. / 2012 YTD Crime Rates computed based on 2011 population dataN/C - Not Calculable. Crime counts are for patrol station crimes only Red depicts crime increases of more than 30%. Green depicts crime decreases of more than 30%Preliminary data - information is time sensitive and subject to change upon further analysis. For each incident, only the most serious offense is counted.
UNINCORPORATED
LAWNDALE
UNINCORPORATED
WEST HOLLYWOOD
UNINCORPORATED
CERRITOS
UNINCORPORATED
COMMERCE
CUDAHY
MAYWOOD
UNINCORPORATED
INDUSTRY
LA HABRA HEIGHTS
LA PUENTE
UNINCORPORATED
0
2 23
1 0
0 0
0 0 0
14
2 0 0
12
0
2 23
1 0
0 0
0 0 0
14
2 0 0
12
0
5 17
0 0
0 0
0 0 2 9
0 0 3 5
0
5 17
0 0
0 0
0 0 2 9
0 0 3 5
1
2 15
0 0
0 0
1 0 1 5
0 0 3 2
0
.62.42
.270
00
000
.97
31.3500
.81
0
1.532.01
00
00
00
.73
.71
00
.75
.37
.37
.611.78
00
00
.780
.37.4
00
.75
.15
0.0%
1.7%-26.5%
0.0% 0.0%
0.0% 0.0%
0.0% 0.0% 0.0%
-58.8%
0.0% 0.0% 0.0%
-81.5%
0.0%
-60.1%-11.4%
0.0% 0.0%
0.0% 0.0%
0.0% 0.0%
-49.3%-43.7%
0.0% 0.0% 0.0%
-59.5%
LOMITA
MARINA DEL REY
SOUTH LOS ANGELES
WEST HOLLYWOOD
CERRITOS
EAST LOS ANGELES
INDUSTRY
CRIMINAL HOMICIDE YTDReportedIncidents
YTDCrime Rate
TotalReportedIncidents
YTDReportedIncidents
YTDCrime Rate
TotalReportedIncidents
YTDReportedIncidents
YTDCrime Rate
5 YearChange inYTD Crime
Rate
1 YearChange inYTD Crime
Rate
2007 2011 2012
2012/2007 2012/2011
STATION TOTAL
STATION TOTAL
STATION TOTAL
STATION TOTAL
STATION TOTAL
STATION TOTAL
3
0
25
1
0
14
3
0
25
1
0
14
2
0
22
0
0
11
2
0
22
0
0
11
1
1
17
0
0
7
0.39
1.95
0.26
0.66
.27
1.88
.58
.13
.37
1.45
.37
-66.67
0
-25.64
0
-43.94
-51.85%
0.00%
-22.87%
0.00%
0.00%
-36.21%
2007 2011
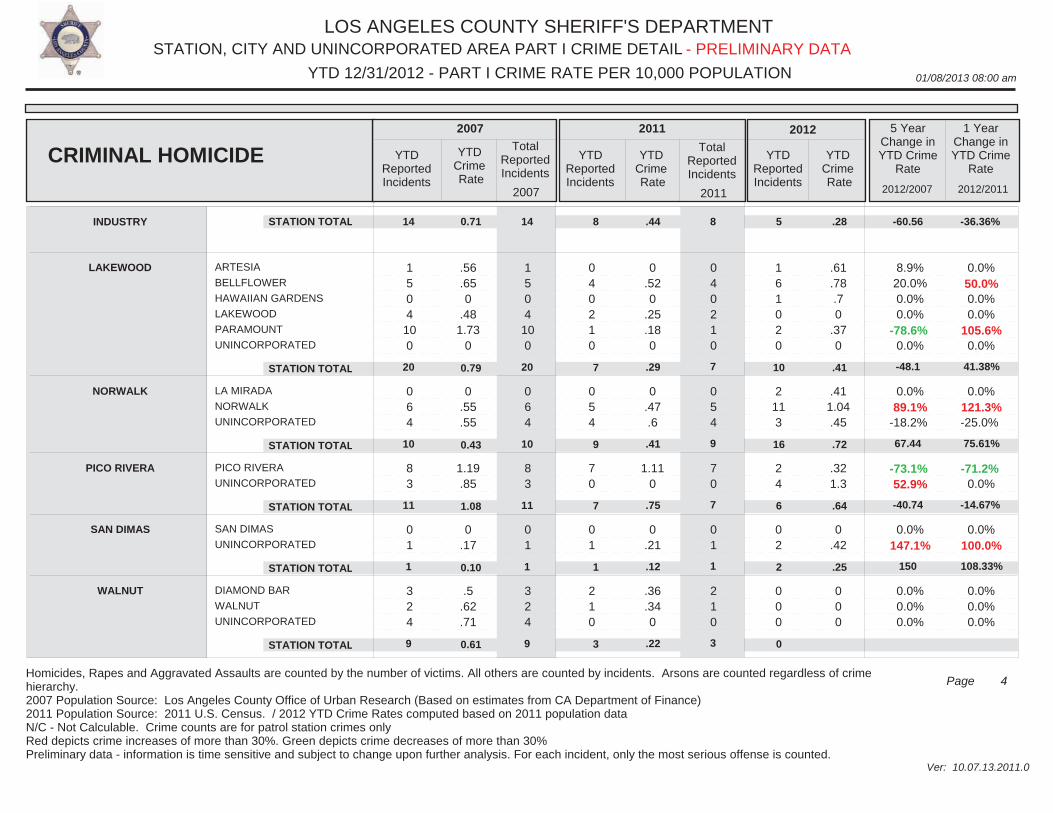
LOS ANGELES COUNTY SHERIFF'S DEPARTMENT
01/08/2013 08:00 am
STATION, CITY AND UNINCORPORATED AREA PART I CRIME DETAIL
Ver: 10.07.13.2011.0
YTD 12/31/2012 - PART I CRIME RATE PER 10,000 POPULATION
4Page
- PRELIMINARY DATA
Homicides, Rapes and Aggravated Assaults are counted by the number of victims. All others are counted by incidents. Arsons are counted regardless of crime hierarchy.2007 Population Source: Los Angeles County Office of Urban Research (Based on estimates from CA Department of Finance)2011 Population Source: 2011 U.S. Census. / 2012 YTD Crime Rates computed based on 2011 population dataN/C - Not Calculable. Crime counts are for patrol station crimes only Red depicts crime increases of more than 30%. Green depicts crime decreases of more than 30%Preliminary data - information is time sensitive and subject to change upon further analysis. For each incident, only the most serious offense is counted.
ARTESIA
BELLFLOWER
HAWAIIAN GARDENS
LAKEWOOD
PARAMOUNT
UNINCORPORATED
LA MIRADA
NORWALK
UNINCORPORATED
PICO RIVERA
UNINCORPORATED
SAN DIMAS
UNINCORPORATED
DIAMOND BAR
WALNUT
UNINCORPORATED
1 5 0 4
10 0
0 6 4
8 3
0 1
3 2 4
1 5 0 4
10 0
0 6 4
8 3
0 1
3 2 4
0 4 0 2 1 0
0 5 4
7 0
0 1
2 1 0
0 4 0 2 1 0
0 5 4
7 0
0 1
2 1 0
1 6 1 0 2 0
2 11 3
2 4
0 2
0 0 0
.56
.650
.481.73
0
0.55.55
1.19.85
0.17
.5.62.71
0.520
.25
.180
0.47.6
1.110
0.21
.36
.340
.61
.78.70
.370
.411.04.45
.321.3
0.42
000
8.9% 20.0% 0.0% 0.0%
-78.6% 0.0%
0.0% 89.1%-18.2%
-73.1% 52.9%
0.0% 147.1%
0.0% 0.0% 0.0%
0.0% 50.0% 0.0% 0.0%
105.6% 0.0%
0.0% 121.3%-25.0%
-71.2% 0.0%
0.0% 100.0%
0.0% 0.0% 0.0%
INDUSTRY
LAKEWOOD
NORWALK
PICO RIVERA
SAN DIMAS
WALNUT
CRIMINAL HOMICIDE YTDReportedIncidents
YTDCrime Rate
TotalReportedIncidents
YTDReportedIncidents
YTDCrime Rate
TotalReportedIncidents
YTDReportedIncidents
YTDCrime Rate
5 YearChange inYTD Crime
Rate
1 YearChange inYTD Crime
Rate
2007 2011 2012
2012/2007 2012/2011
STATION TOTAL
STATION TOTAL
STATION TOTAL
STATION TOTAL
STATION TOTAL
STATION TOTAL
14
20
10
11
1
9
14
20
10
11
1
9
8
7
9
7
1
3
8
7
9
7
1
3
5
10
16
6
2
0
0.71
0.79
0.43
1.08
0.10
0.61
.44
.29
.41
.75
.12
.22
.28
.41
.72
.64
.25
-60.56
-48.1
67.44
-40.74
150
-36.36%
41.38%
75.61%
-14.67%
108.33%
2007 2011
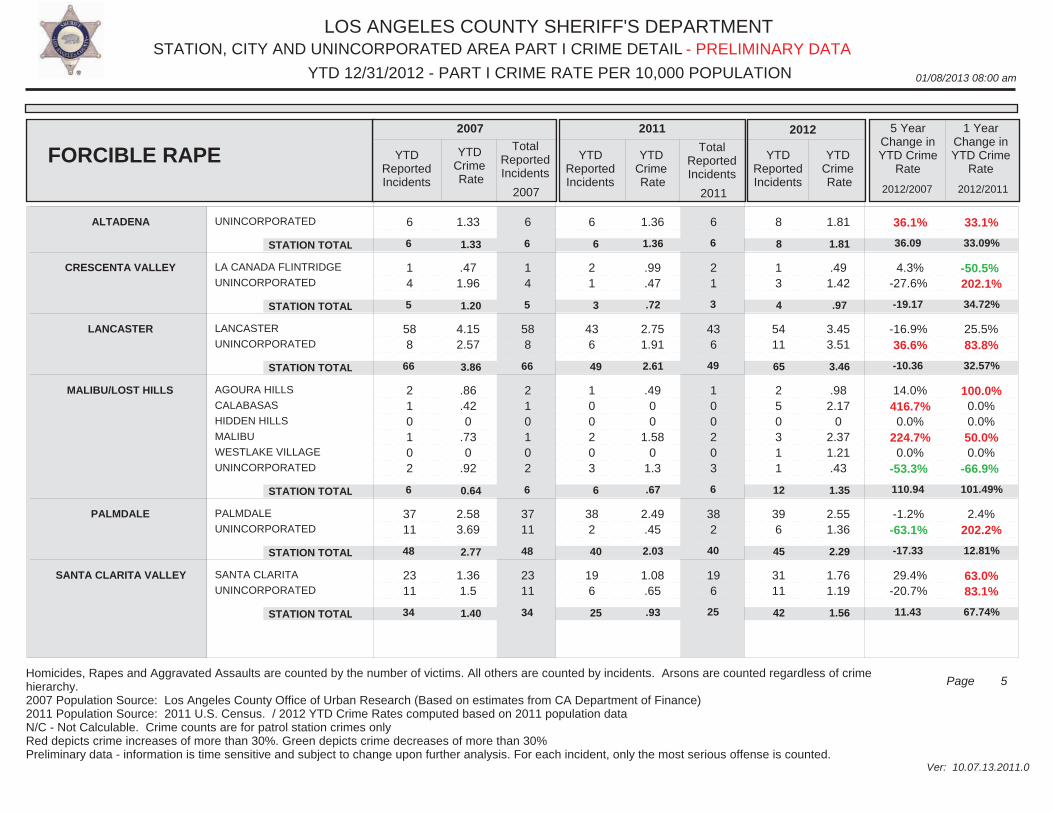
LOS ANGELES COUNTY SHERIFF'S DEPARTMENT
01/08/2013 08:00 am
STATION, CITY AND UNINCORPORATED AREA PART I CRIME DETAIL
Ver: 10.07.13.2011.0
YTD 12/31/2012 - PART I CRIME RATE PER 10,000 POPULATION
5Page
- PRELIMINARY DATA
Homicides, Rapes and Aggravated Assaults are counted by the number of victims. All others are counted by incidents. Arsons are counted regardless of crime hierarchy.2007 Population Source: Los Angeles County Office of Urban Research (Based on estimates from CA Department of Finance)2011 Population Source: 2011 U.S. Census. / 2012 YTD Crime Rates computed based on 2011 population dataN/C - Not Calculable. Crime counts are for patrol station crimes only Red depicts crime increases of more than 30%. Green depicts crime decreases of more than 30%Preliminary data - information is time sensitive and subject to change upon further analysis. For each incident, only the most serious offense is counted.
UNINCORPORATED
LA CANADA FLINTRIDGE
UNINCORPORATED
LANCASTER
UNINCORPORATED
AGOURA HILLS
CALABASAS
HIDDEN HILLS
MALIBU
WESTLAKE VILLAGE
UNINCORPORATED
PALMDALE
UNINCORPORATED
SANTA CLARITA
UNINCORPORATED
6
1 4
58 8
2 1 0 1 0 2
37 11
23 11
6
1 4
58 8
2 1 0 1 0 2
37 11
23 11
6
2 1
43 6
1 0 0 2 0 3
38 2
19 6
6
2 1
43 6
1 0 0 2 0 3
38 2
19 6
8
1 3
54 11
2 5 0 3 1 1
39 6
31 11
1.33
.471.96
4.152.57
.86
.420
.730
.92
2.583.69
1.361.5
1.36
.99
.47
2.751.91
.4900
1.580
1.3
2.49.45
1.08.65
1.81
.491.42
3.453.51
.982.17
02.371.21.43
2.551.36
1.761.19
36.1%
4.3%-27.6%
-16.9% 36.6%
14.0% 416.7% 0.0%
224.7% 0.0%
-53.3%
-1.2%-63.1%
29.4%-20.7%
33.1%
-50.5% 202.1%
25.5% 83.8%
100.0% 0.0% 0.0% 50.0% 0.0%
-66.9%
2.4% 202.2%
63.0% 83.1%
ALTADENA
CRESCENTA VALLEY
LANCASTER
MALIBU/LOST HILLS
PALMDALE
SANTA CLARITA VALLEY
FORCIBLE RAPE YTDReportedIncidents
YTDCrime Rate
TotalReportedIncidents
YTDReportedIncidents
YTDCrime Rate
TotalReportedIncidents
YTDReportedIncidents
YTDCrime Rate
5 YearChange inYTD Crime
Rate
1 YearChange inYTD Crime
Rate
2007 2011 2012
2012/2007 2012/2011
STATION TOTAL
STATION TOTAL
STATION TOTAL
STATION TOTAL
STATION TOTAL
STATION TOTAL
6
5
66
6
48
34
6
5
66
6
48
34
6
3
49
6
40
25
6
3
49
6
40
25
8
4
65
12
45
42
1.33
1.20
3.86
0.64
2.77
1.40
1.36
.72
2.61
.67
2.03
.93
1.81
.97
3.46
1.35
2.29
1.56
36.09
-19.17
-10.36
110.94
-17.33
11.43
33.09%
34.72%
32.57%
101.49%
12.81%
67.74%
2007 2011
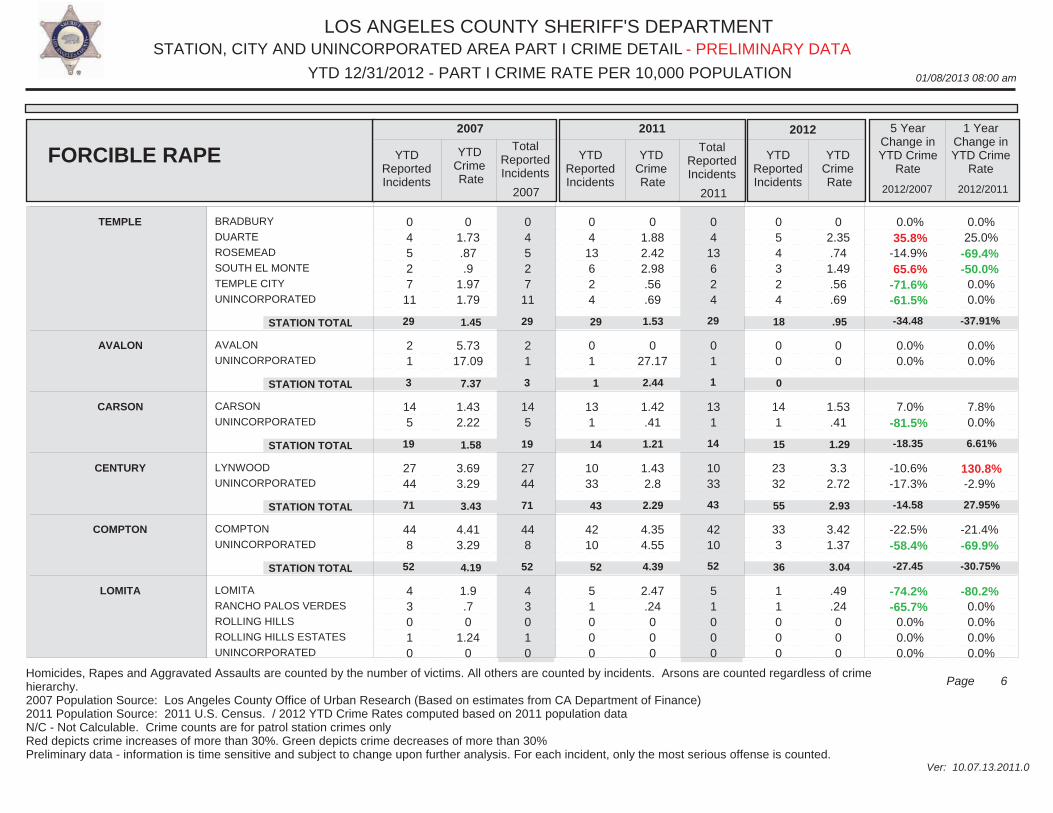
LOS ANGELES COUNTY SHERIFF'S DEPARTMENT
01/08/2013 08:00 am
STATION, CITY AND UNINCORPORATED AREA PART I CRIME DETAIL
Ver: 10.07.13.2011.0
YTD 12/31/2012 - PART I CRIME RATE PER 10,000 POPULATION
6Page
- PRELIMINARY DATA
Homicides, Rapes and Aggravated Assaults are counted by the number of victims. All others are counted by incidents. Arsons are counted regardless of crime hierarchy.2007 Population Source: Los Angeles County Office of Urban Research (Based on estimates from CA Department of Finance)2011 Population Source: 2011 U.S. Census. / 2012 YTD Crime Rates computed based on 2011 population dataN/C - Not Calculable. Crime counts are for patrol station crimes only Red depicts crime increases of more than 30%. Green depicts crime decreases of more than 30%Preliminary data - information is time sensitive and subject to change upon further analysis. For each incident, only the most serious offense is counted.
BRADBURY
DUARTE
ROSEMEAD
SOUTH EL MONTE
TEMPLE CITY
UNINCORPORATED
AVALON
UNINCORPORATED
CARSON
UNINCORPORATED
LYNWOOD
UNINCORPORATED
COMPTON
UNINCORPORATED
LOMITA
RANCHO PALOS VERDES
ROLLING HILLS
ROLLING HILLS ESTATES
UNINCORPORATED
0 4 5 2 7
11
2 1
14 5
27 44
44 8
4 3 0 1 0
0 4 5 2 7
11
2 1
14 5
27 44
44 8
4 3 0 1 0
0 4
13 6 2 4
0 1
13 1
10 33
42 10
5 1 0 0 0
0 4
13 6 2 4
0 1
13 1
10 33
42 10
5 1 0 0 0
0 5 4 3 2 4
0 0
14 1
23 32
33 3
1 1 0 0 0
01.73.87.9
1.971.79
5.7317.09
1.432.22
3.693.29
4.413.29
1.9.70
1.240
01.882.422.98.56.69
027.17
1.42.41
1.432.8
4.354.55
2.47.24000
02.35.74
1.49.56.69
00
1.53.41
3.32.72
3.421.37
.49
.24000
0.0% 35.8%-14.9% 65.6%-71.6%-61.5%
0.0% 0.0%
7.0%-81.5%
-10.6%-17.3%
-22.5%-58.4%
-74.2%-65.7% 0.0% 0.0% 0.0%
0.0% 25.0%-69.4%-50.0% 0.0% 0.0%
0.0% 0.0%
7.8% 0.0%
130.8%-2.9%
-21.4%-69.9%
-80.2% 0.0% 0.0% 0.0% 0.0%
TEMPLE
AVALON
CARSON
CENTURY
COMPTON
LOMITA
FORCIBLE RAPE YTDReportedIncidents
YTDCrime Rate
TotalReportedIncidents
YTDReportedIncidents
YTDCrime Rate
TotalReportedIncidents
YTDReportedIncidents
YTDCrime Rate
5 YearChange inYTD Crime
Rate
1 YearChange inYTD Crime
Rate
2007 2011 2012
2012/2007 2012/2011
STATION TOTAL
STATION TOTAL
STATION TOTAL
STATION TOTAL
STATION TOTAL
29
3
19
71
52
29
3
19
71
52
29
1
14
43
52
29
1
14
43
52
18
0
15
55
36
1.45
7.37
1.58
3.43
4.19
1.53
2.44
1.21
2.29
4.39
.95
1.29
2.93
3.04
-34.48
-18.35
-14.58
-27.45
-37.91%
6.61%
27.95%
-30.75%
2007 2011
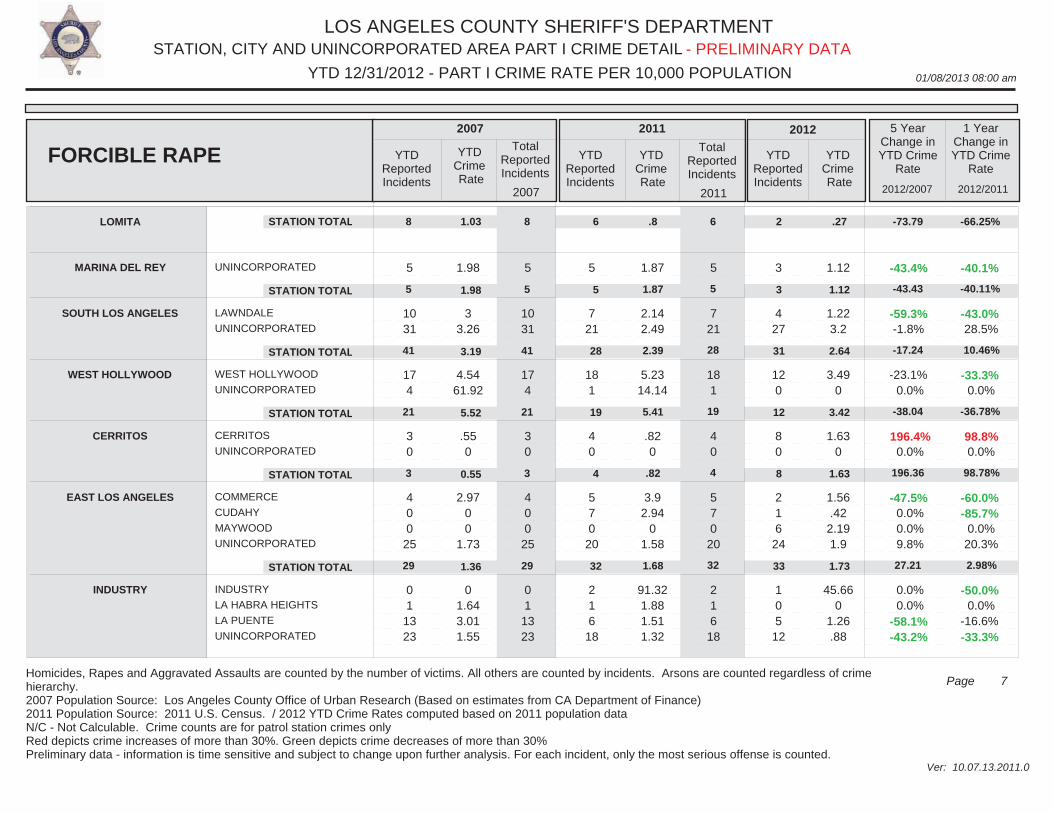
LOS ANGELES COUNTY SHERIFF'S DEPARTMENT
01/08/2013 08:00 am
STATION, CITY AND UNINCORPORATED AREA PART I CRIME DETAIL
Ver: 10.07.13.2011.0
YTD 12/31/2012 - PART I CRIME RATE PER 10,000 POPULATION
7Page
- PRELIMINARY DATA
Homicides, Rapes and Aggravated Assaults are counted by the number of victims. All others are counted by incidents. Arsons are counted regardless of crime hierarchy.2007 Population Source: Los Angeles County Office of Urban Research (Based on estimates from CA Department of Finance)2011 Population Source: 2011 U.S. Census. / 2012 YTD Crime Rates computed based on 2011 population dataN/C - Not Calculable. Crime counts are for patrol station crimes only Red depicts crime increases of more than 30%. Green depicts crime decreases of more than 30%Preliminary data - information is time sensitive and subject to change upon further analysis. For each incident, only the most serious offense is counted.
UNINCORPORATED
LAWNDALE
UNINCORPORATED
WEST HOLLYWOOD
UNINCORPORATED
CERRITOS
UNINCORPORATED
COMMERCE
CUDAHY
MAYWOOD
UNINCORPORATED
INDUSTRY
LA HABRA HEIGHTS
LA PUENTE
UNINCORPORATED
5
10 31
17 4
3 0
4 0 0
25
0 1
13 23
5
10 31
17 4
3 0
4 0 0
25
0 1
13 23
5
7 21
18 1
4 0
5 7 0
20
2 1 6
18
5
7 21
18 1
4 0
5 7 0
20
2 1 6
18
3
4 27
12 0
8 0
2 1 6 24
1 0 5 12
1.98
33.26
4.5461.92
.550
2.9700
1.73
01.643.011.55
1.87
2.142.49
5.2314.14
.820
3.92.94
01.58
91.321.881.511.32
1.12
1.223.2
3.490
1.630
1.56.42
2.191.9
45.660
1.26.88
-43.4%
-59.3%-1.8%
-23.1% 0.0%
196.4% 0.0%
-47.5% 0.0% 0.0% 9.8%
0.0% 0.0%
-58.1%-43.2%
-40.1%
-43.0% 28.5%
-33.3% 0.0%
98.8% 0.0%
-60.0%-85.7% 0.0%
20.3%
-50.0% 0.0%
-16.6%-33.3%
LOMITA
MARINA DEL REY
SOUTH LOS ANGELES
WEST HOLLYWOOD
CERRITOS
EAST LOS ANGELES
INDUSTRY
FORCIBLE RAPE YTDReportedIncidents
YTDCrime Rate
TotalReportedIncidents
YTDReportedIncidents
YTDCrime Rate
TotalReportedIncidents
YTDReportedIncidents
YTDCrime Rate
5 YearChange inYTD Crime
Rate
1 YearChange inYTD Crime
Rate
2007 2011 2012
2012/2007 2012/2011
STATION TOTAL
STATION TOTAL
STATION TOTAL
STATION TOTAL
STATION TOTAL
STATION TOTAL
8
5
41
21
3
29
8
5
41
21
3
29
6
5
28
19
4
32
6
5
28
19
4
32
2
3
31
12
8
33
1.03
1.98
3.19
5.52
0.55
1.36
.8
1.87
2.39
5.41
.82
1.68
.27
1.12
2.64
3.42
1.63
1.73
-73.79
-43.43
-17.24
-38.04
196.36
27.21
-66.25%
-40.11%
10.46%
-36.78%
98.78%
2.98%
2007 2011
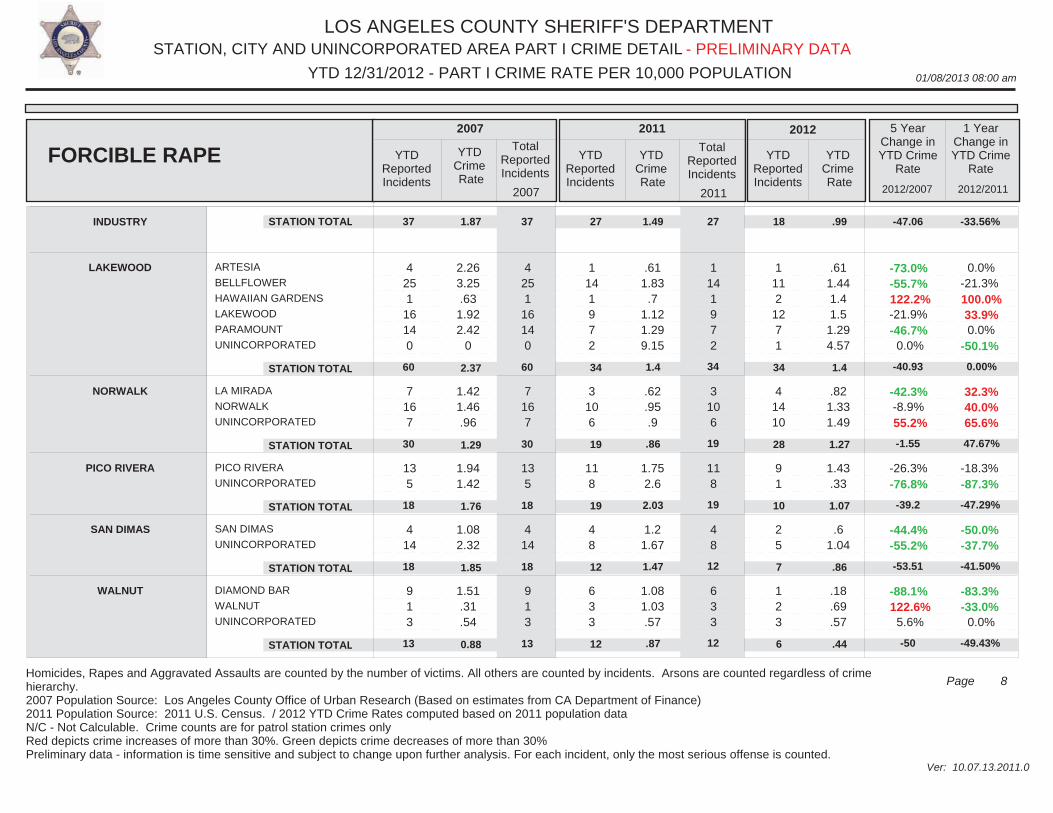
LOS ANGELES COUNTY SHERIFF'S DEPARTMENT
01/08/2013 08:00 am
STATION, CITY AND UNINCORPORATED AREA PART I CRIME DETAIL
Ver: 10.07.13.2011.0
YTD 12/31/2012 - PART I CRIME RATE PER 10,000 POPULATION
8Page
- PRELIMINARY DATA
Homicides, Rapes and Aggravated Assaults are counted by the number of victims. All others are counted by incidents. Arsons are counted regardless of crime hierarchy.2007 Population Source: Los Angeles County Office of Urban Research (Based on estimates from CA Department of Finance)2011 Population Source: 2011 U.S. Census. / 2012 YTD Crime Rates computed based on 2011 population dataN/C - Not Calculable. Crime counts are for patrol station crimes only Red depicts crime increases of more than 30%. Green depicts crime decreases of more than 30%Preliminary data - information is time sensitive and subject to change upon further analysis. For each incident, only the most serious offense is counted.
ARTESIA
BELLFLOWER
HAWAIIAN GARDENS
LAKEWOOD
PARAMOUNT
UNINCORPORATED
LA MIRADA
NORWALK
UNINCORPORATED
PICO RIVERA
UNINCORPORATED
SAN DIMAS
UNINCORPORATED
DIAMOND BAR
WALNUT
UNINCORPORATED
4 25 1
16 14 0
7 16 7
13 5
4 14
9 1 3
4 25 1
16 14 0
7 16 7
13 5
4 14
9 1 3
1 14 1 9 7 2
3 10 6
11 8
4 8
6 3 3
1 14 1 9 7 2
3 10 6
11 8
4 8
6 3 3
1 11 2 12 7 1
4 14 10
9 1
2 5
1 2 3
2.263.25.63
1.922.42
0
1.421.46.96
1.941.42
1.082.32
1.51.31.54
.611.83
.71.121.299.15
.62
.95.9
1.752.6
1.21.67
1.081.03.57
.611.441.41.5
1.294.57
.821.331.49
1.43.33
.61.04
.18
.69
.57
-73.0%-55.7% 122.2%-21.9%-46.7% 0.0%
-42.3%-8.9% 55.2%
-26.3%-76.8%
-44.4%-55.2%
-88.1% 122.6% 5.6%
0.0%-21.3% 100.0% 33.9% 0.0%
-50.1%
32.3% 40.0% 65.6%
-18.3%-87.3%
-50.0%-37.7%
-83.3%-33.0% 0.0%
INDUSTRY
LAKEWOOD
NORWALK
PICO RIVERA
SAN DIMAS
WALNUT
FORCIBLE RAPE YTDReportedIncidents
YTDCrime Rate
TotalReportedIncidents
YTDReportedIncidents
YTDCrime Rate
TotalReportedIncidents
YTDReportedIncidents
YTDCrime Rate
5 YearChange inYTD Crime
Rate
1 YearChange inYTD Crime
Rate
2007 2011 2012
2012/2007 2012/2011
STATION TOTAL
STATION TOTAL
STATION TOTAL
STATION TOTAL
STATION TOTAL
STATION TOTAL
37
60
30
18
18
13
37
60
30
18
18
13
27
34
19
19
12
12
27
34
19
19
12
12
18
34
28
10
7
6
1.87
2.37
1.29
1.76
1.85
0.88
1.49
1.4
.86
2.03
1.47
.87
.99
1.4
1.27
1.07
.86
.44
-47.06
-40.93
-1.55
-39.2
-53.51
-50
-33.56%
0.00%
47.67%
-47.29%
-41.50%
-49.43%
2007 2011
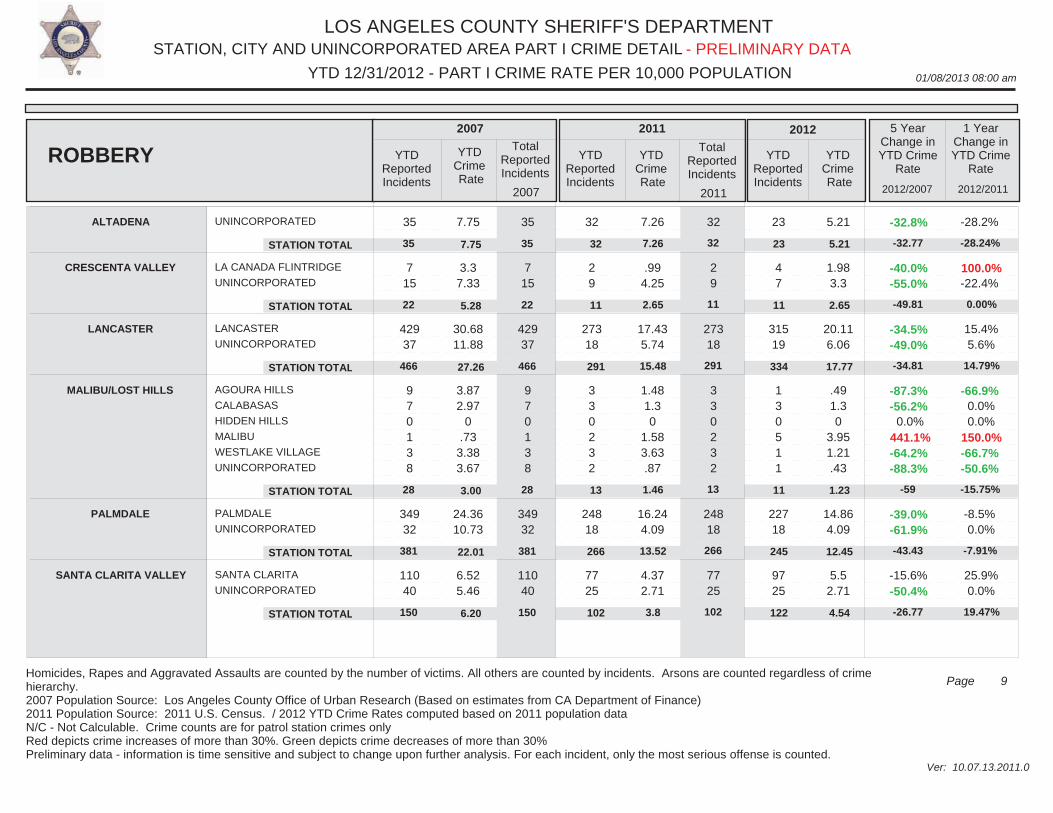
LOS ANGELES COUNTY SHERIFF'S DEPARTMENT
01/08/2013 08:00 am
STATION, CITY AND UNINCORPORATED AREA PART I CRIME DETAIL
Ver: 10.07.13.2011.0
YTD 12/31/2012 - PART I CRIME RATE PER 10,000 POPULATION
9Page
- PRELIMINARY DATA
Homicides, Rapes and Aggravated Assaults are counted by the number of victims. All others are counted by incidents. Arsons are counted regardless of crime hierarchy.2007 Population Source: Los Angeles County Office of Urban Research (Based on estimates from CA Department of Finance)2011 Population Source: 2011 U.S. Census. / 2012 YTD Crime Rates computed based on 2011 population dataN/C - Not Calculable. Crime counts are for patrol station crimes only Red depicts crime increases of more than 30%. Green depicts crime decreases of more than 30%Preliminary data - information is time sensitive and subject to change upon further analysis. For each incident, only the most serious offense is counted.
UNINCORPORATED
LA CANADA FLINTRIDGE
UNINCORPORATED
LANCASTER
UNINCORPORATED
AGOURA HILLS
CALABASAS
HIDDEN HILLS
MALIBU
WESTLAKE VILLAGE
UNINCORPORATED
PALMDALE
UNINCORPORATED
SANTA CLARITA
UNINCORPORATED
35
7 15
429 37
9 7 0 1 3 8
349 32
110 40
35
7 15
429 37
9 7 0 1 3 8
349 32
110 40
32
2 9
273 18
3 3 0 2 3 2
248 18
77 25
32
2 9
273 18
3 3 0 2 3 2
248 18
77 25
23
4 7
315 19
1 3 0 5 1 1
227 18
97 25
7.75
3.37.33
30.6811.88
3.872.97
0.73
3.383.67
24.3610.73
6.525.46
7.26
.994.25
17.435.74
1.481.30
1.583.63.87
16.244.09
4.372.71
5.21
1.983.3
20.116.06
.491.30
3.951.21.43
14.864.09
5.52.71
-32.8%
-40.0%-55.0%
-34.5%-49.0%
-87.3%-56.2% 0.0%
441.1%-64.2%-88.3%
-39.0%-61.9%
-15.6%-50.4%
-28.2%
100.0%-22.4%
15.4% 5.6%
-66.9% 0.0% 0.0%
150.0%-66.7%-50.6%
-8.5% 0.0%
25.9% 0.0%
ALTADENA
CRESCENTA VALLEY
LANCASTER
MALIBU/LOST HILLS
PALMDALE
SANTA CLARITA VALLEY
ROBBERY YTDReportedIncidents
YTDCrime Rate
TotalReportedIncidents
YTDReportedIncidents
YTDCrime Rate
TotalReportedIncidents
YTDReportedIncidents
YTDCrime Rate
5 YearChange inYTD Crime
Rate
1 YearChange inYTD Crime
Rate
2007 2011 2012
2012/2007 2012/2011
STATION TOTAL
STATION TOTAL
STATION TOTAL
STATION TOTAL
STATION TOTAL
STATION TOTAL
35
22
466
28
381
150
35
22
466
28
381
150
32
11
291
13
266
102
32
11
291
13
266
102
23
11
334
11
245
122
7.75
5.28
27.26
3.00
22.01
6.20
7.26
2.65
15.48
1.46
13.52
3.8
5.21
2.65
17.77
1.23
12.45
4.54
-32.77
-49.81
-34.81
-59
-43.43
-26.77
-28.24%
0.00%
14.79%
-15.75%
-7.91%
19.47%
2007 2011
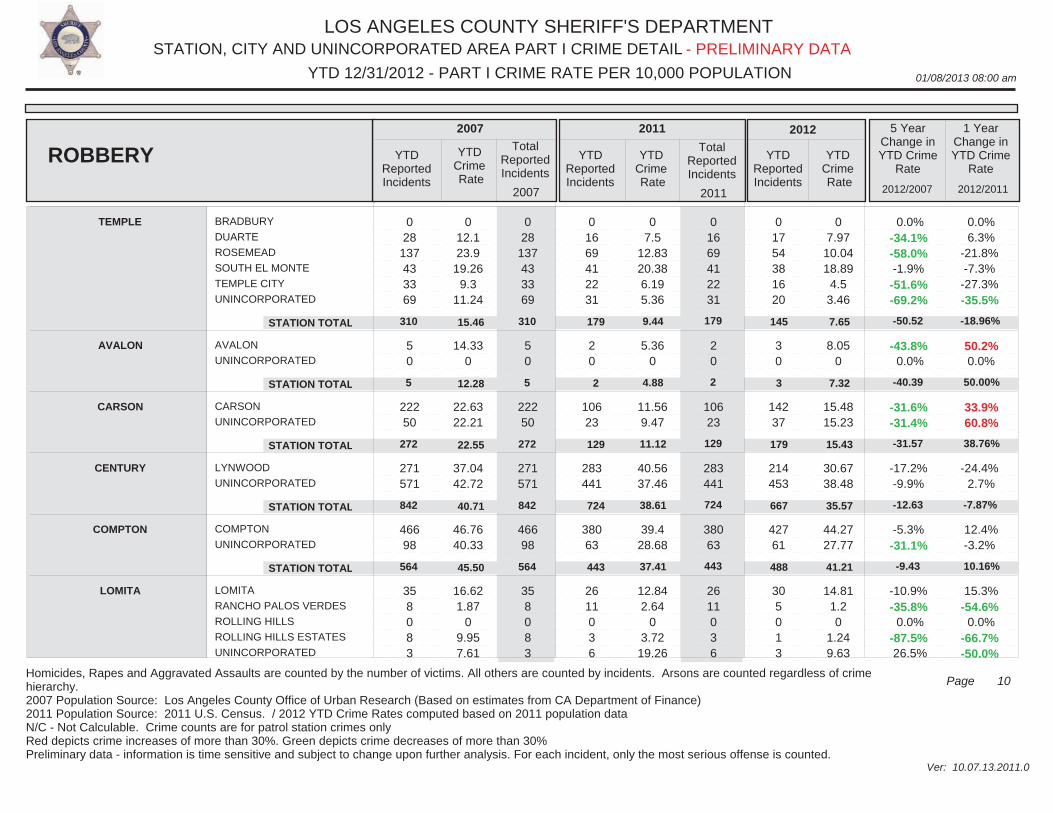
LOS ANGELES COUNTY SHERIFF'S DEPARTMENT
01/08/2013 08:00 am
STATION, CITY AND UNINCORPORATED AREA PART I CRIME DETAIL
Ver: 10.07.13.2011.0
YTD 12/31/2012 - PART I CRIME RATE PER 10,000 POPULATION
10Page
- PRELIMINARY DATA
Homicides, Rapes and Aggravated Assaults are counted by the number of victims. All others are counted by incidents. Arsons are counted regardless of crime hierarchy.2007 Population Source: Los Angeles County Office of Urban Research (Based on estimates from CA Department of Finance)2011 Population Source: 2011 U.S. Census. / 2012 YTD Crime Rates computed based on 2011 population dataN/C - Not Calculable. Crime counts are for patrol station crimes only Red depicts crime increases of more than 30%. Green depicts crime decreases of more than 30%Preliminary data - information is time sensitive and subject to change upon further analysis. For each incident, only the most serious offense is counted.
BRADBURY
DUARTE
ROSEMEAD
SOUTH EL MONTE
TEMPLE CITY
UNINCORPORATED
AVALON
UNINCORPORATED
CARSON
UNINCORPORATED
LYNWOOD
UNINCORPORATED
COMPTON
UNINCORPORATED
LOMITA
RANCHO PALOS VERDES
ROLLING HILLS
ROLLING HILLS ESTATES
UNINCORPORATED
0 28
137 43 33 69
5 0
222 50
271 571
466 98
35 8 0 8 3
0 28
137 43 33 69
5 0
222 50
271 571
466 98
35 8 0 8 3
0 16 69 41 22 31
2 0
106 23
283 441
380 63
26 11 0 3 6
0 16 69 41 22 31
2 0
106 23
283 441
380 63
26 11 0 3 6
0 17 54 38 16 20
3 0
142 37
214 453
427 61
30 5 0 1 3
012.123.9
19.269.3
11.24
14.330
22.6322.21
37.0442.72
46.7640.33
16.621.87
09.957.61
07.5
12.8320.386.195.36
5.360
11.569.47
40.5637.46
39.428.68
12.842.64
03.72
19.26
07.9710.0418.894.5
3.46
8.050
15.4815.23
30.6738.48
44.2727.77
14.811.20
1.249.63
0.0%-34.1%-58.0%-1.9%-51.6%-69.2%
-43.8% 0.0%
-31.6%-31.4%
-17.2%-9.9%
-5.3%-31.1%
-10.9%-35.8% 0.0%
-87.5% 26.5%
0.0% 6.3%
-21.8%-7.3%
-27.3%-35.5%
50.2% 0.0%
33.9% 60.8%
-24.4% 2.7%
12.4%-3.2%
15.3%-54.6% 0.0%
-66.7%-50.0%
TEMPLE
AVALON
CARSON
CENTURY
COMPTON
LOMITA
ROBBERY YTDReportedIncidents
YTDCrime Rate
TotalReportedIncidents
YTDReportedIncidents
YTDCrime Rate
TotalReportedIncidents
YTDReportedIncidents
YTDCrime Rate
5 YearChange inYTD Crime
Rate
1 YearChange inYTD Crime
Rate
2007 2011 2012
2012/2007 2012/2011
STATION TOTAL
STATION TOTAL
STATION TOTAL
STATION TOTAL
STATION TOTAL
310
5
272
842
564
310
5
272
842
564
179
2
129
724
443
179
2
129
724
443
145
3
179
667
488
15.46
12.28
22.55
40.71
45.50
9.44
4.88
11.12
38.61
37.41
7.65
7.32
15.43
35.57
41.21
-50.52
-40.39
-31.57
-12.63
-9.43
-18.96%
50.00%
38.76%
-7.87%
10.16%
2007 2011
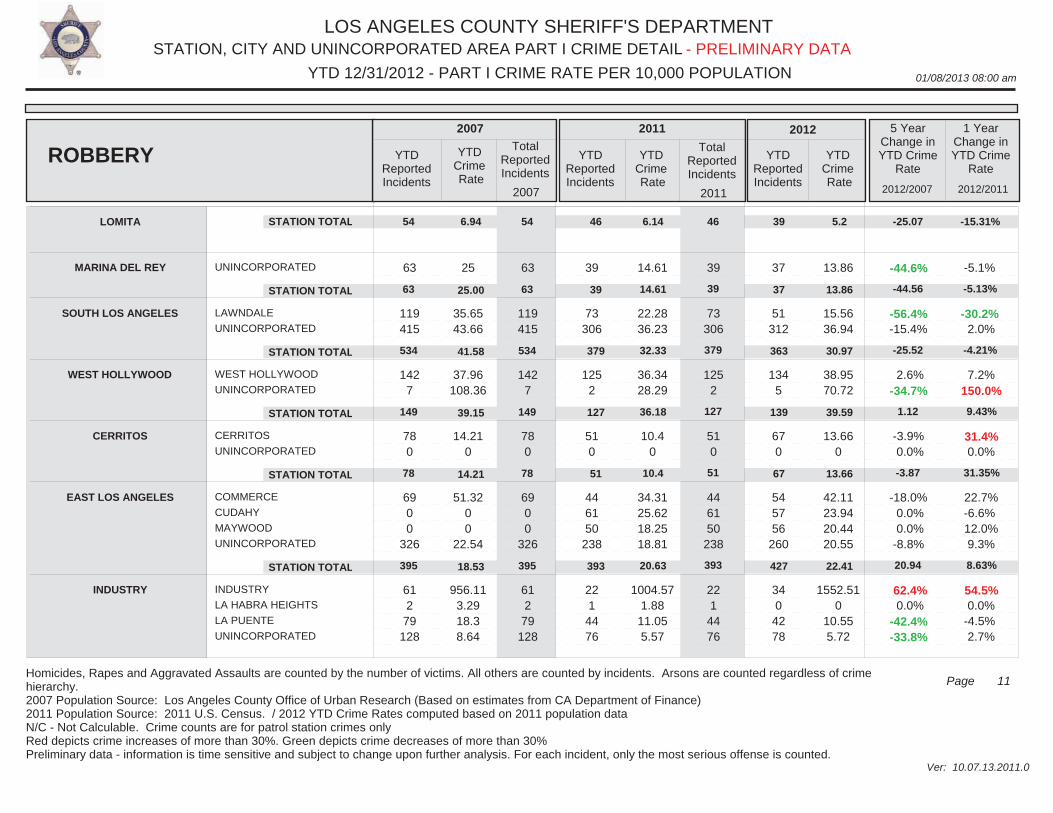
LOS ANGELES COUNTY SHERIFF'S DEPARTMENT
01/08/2013 08:00 am
STATION, CITY AND UNINCORPORATED AREA PART I CRIME DETAIL
Ver: 10.07.13.2011.0
YTD 12/31/2012 - PART I CRIME RATE PER 10,000 POPULATION
11Page
- PRELIMINARY DATA
Homicides, Rapes and Aggravated Assaults are counted by the number of victims. All others are counted by incidents. Arsons are counted regardless of crime hierarchy.2007 Population Source: Los Angeles County Office of Urban Research (Based on estimates from CA Department of Finance)2011 Population Source: 2011 U.S. Census. / 2012 YTD Crime Rates computed based on 2011 population dataN/C - Not Calculable. Crime counts are for patrol station crimes only Red depicts crime increases of more than 30%. Green depicts crime decreases of more than 30%Preliminary data - information is time sensitive and subject to change upon further analysis. For each incident, only the most serious offense is counted.
UNINCORPORATED
LAWNDALE
UNINCORPORATED
WEST HOLLYWOOD
UNINCORPORATED
CERRITOS
UNINCORPORATED
COMMERCE
CUDAHY
MAYWOOD
UNINCORPORATED
INDUSTRY
LA HABRA HEIGHTS
LA PUENTE
UNINCORPORATED
63
119 415
142 7
78 0
69 0 0
326
61 2
79 128
63
119 415
142 7
78 0
69 0 0
326
61 2
79 128
39
73 306
125 2
51 0
44 61 50
238
22 1
44 76
39
73 306
125 2
51 0
44 61 50
238
22 1
44 76
37
51 312
134 5
67 0
54 57 56
260
34 0 42 78
25
35.6543.66
37.96108.36
14.210
51.3200
22.54
956.113.2918.38.64
14.61
22.2836.23
36.3428.29
10.40
34.3125.6218.2518.81
1004.571.88
11.055.57
13.86
15.5636.94
38.9570.72
13.660
42.1123.9420.4420.55
1552.510
10.555.72
-44.6%
-56.4%-15.4%
2.6%-34.7%
-3.9% 0.0%
-18.0% 0.0% 0.0%-8.8%
62.4% 0.0%
-42.4%-33.8%
-5.1%
-30.2% 2.0%
7.2% 150.0%
31.4% 0.0%
22.7%-6.6% 12.0% 9.3%
54.5% 0.0%-4.5% 2.7%
LOMITA
MARINA DEL REY
SOUTH LOS ANGELES
WEST HOLLYWOOD
CERRITOS
EAST LOS ANGELES
INDUSTRY
ROBBERY YTDReportedIncidents
YTDCrime Rate
TotalReportedIncidents
YTDReportedIncidents
YTDCrime Rate
TotalReportedIncidents
YTDReportedIncidents
YTDCrime Rate
5 YearChange inYTD Crime
Rate
1 YearChange inYTD Crime
Rate
2007 2011 2012
2012/2007 2012/2011
STATION TOTAL
STATION TOTAL
STATION TOTAL
STATION TOTAL
STATION TOTAL
STATION TOTAL
54
63
534
149
78
395
54
63
534
149
78
395
46
39
379
127
51
393
46
39
379
127
51
393
39
37
363
139
67
427
6.94
25.00
41.58
39.15
14.21
18.53
6.14
14.61
32.33
36.18
10.4
20.63
5.2
13.86
30.97
39.59
13.66
22.41
-25.07
-44.56
-25.52
1.12
-3.87
20.94
-15.31%
-5.13%
-4.21%
9.43%
31.35%
8.63%
2007 2011
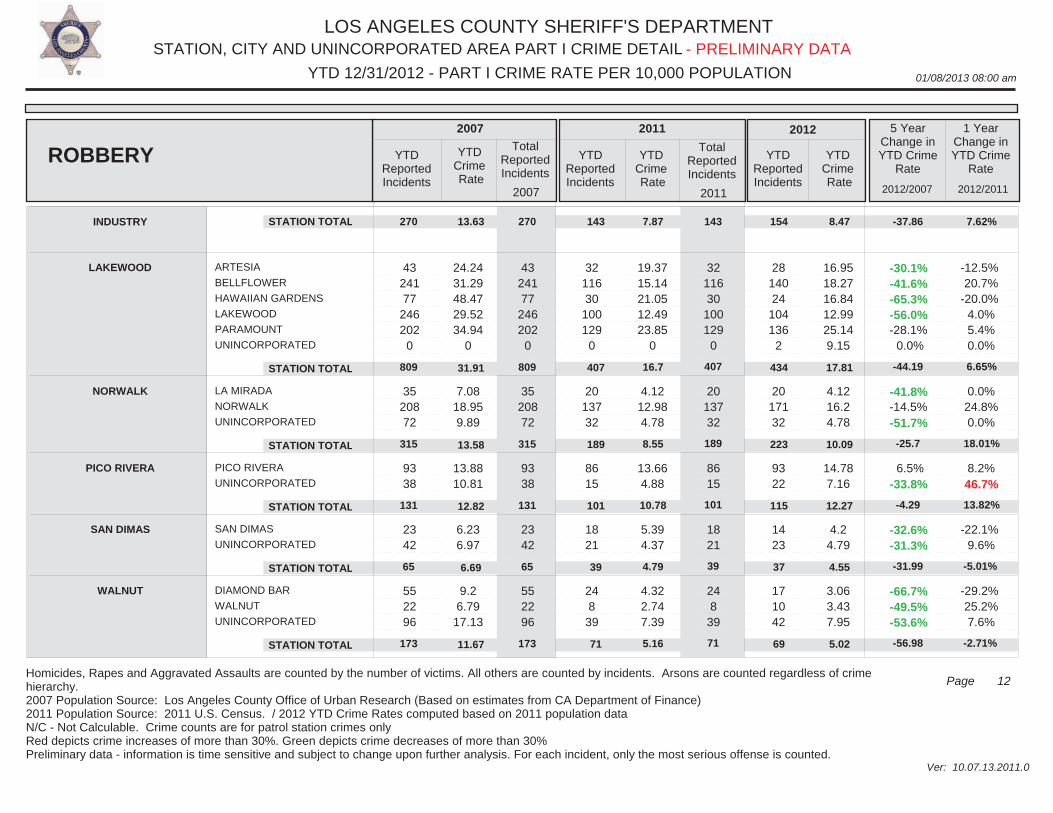
LOS ANGELES COUNTY SHERIFF'S DEPARTMENT
01/08/2013 08:00 am
STATION, CITY AND UNINCORPORATED AREA PART I CRIME DETAIL
Ver: 10.07.13.2011.0
YTD 12/31/2012 - PART I CRIME RATE PER 10,000 POPULATION
12Page
- PRELIMINARY DATA
Homicides, Rapes and Aggravated Assaults are counted by the number of victims. All others are counted by incidents. Arsons are counted regardless of crime hierarchy.2007 Population Source: Los Angeles County Office of Urban Research (Based on estimates from CA Department of Finance)2011 Population Source: 2011 U.S. Census. / 2012 YTD Crime Rates computed based on 2011 population dataN/C - Not Calculable. Crime counts are for patrol station crimes only Red depicts crime increases of more than 30%. Green depicts crime decreases of more than 30%Preliminary data - information is time sensitive and subject to change upon further analysis. For each incident, only the most serious offense is counted.
ARTESIA
BELLFLOWER
HAWAIIAN GARDENS
LAKEWOOD
PARAMOUNT
UNINCORPORATED
LA MIRADA
NORWALK
UNINCORPORATED
PICO RIVERA
UNINCORPORATED
SAN DIMAS
UNINCORPORATED
DIAMOND BAR
WALNUT
UNINCORPORATED
43 241 77
246 202
0
35 208 72
93 38
23 42
55 22 96
43 241 77
246 202
0
35 208 72
93 38
23 42
55 22 96
32 116 30
100 129
0
20 137 32
86 15
18 21
24 8
39
32 116 30
100 129
0
20 137 32
86 15
18 21
24 8
39
28 140 24
104 136 2
20 171 32
93 22
14 23
17 10 42
24.2431.2948.4729.5234.94
0
7.0818.959.89
13.8810.81
6.236.97
9.26.79
17.13
19.3715.1421.0512.4923.85
0
4.1212.984.78
13.664.88
5.394.37
4.322.747.39
16.9518.2716.8412.9925.149.15
4.1216.24.78
14.787.16
4.24.79
3.063.437.95
-30.1%-41.6%-65.3%-56.0%-28.1% 0.0%
-41.8%-14.5%-51.7%
6.5%-33.8%
-32.6%-31.3%
-66.7%-49.5%-53.6%
-12.5% 20.7%-20.0% 4.0% 5.4% 0.0%
0.0% 24.8% 0.0%
8.2% 46.7%
-22.1% 9.6%
-29.2% 25.2% 7.6%
INDUSTRY
LAKEWOOD
NORWALK
PICO RIVERA
SAN DIMAS
WALNUT
ROBBERY YTDReportedIncidents
YTDCrime Rate
TotalReportedIncidents
YTDReportedIncidents
YTDCrime Rate
TotalReportedIncidents
YTDReportedIncidents
YTDCrime Rate
5 YearChange inYTD Crime
Rate
1 YearChange inYTD Crime
Rate
2007 2011 2012
2012/2007 2012/2011
STATION TOTAL
STATION TOTAL
STATION TOTAL
STATION TOTAL
STATION TOTAL
STATION TOTAL
270
809
315
131
65
173
270
809
315
131
65
173
143
407
189
101
39
71
143
407
189
101
39
71
154
434
223
115
37
69
13.63
31.91
13.58
12.82
6.69
11.67
7.87
16.7
8.55
10.78
4.79
5.16
8.47
17.81
10.09
12.27
4.55
5.02
-37.86
-44.19
-25.7
-4.29
-31.99
-56.98
7.62%
6.65%
18.01%
13.82%
-5.01%
-2.71%
2007 2011
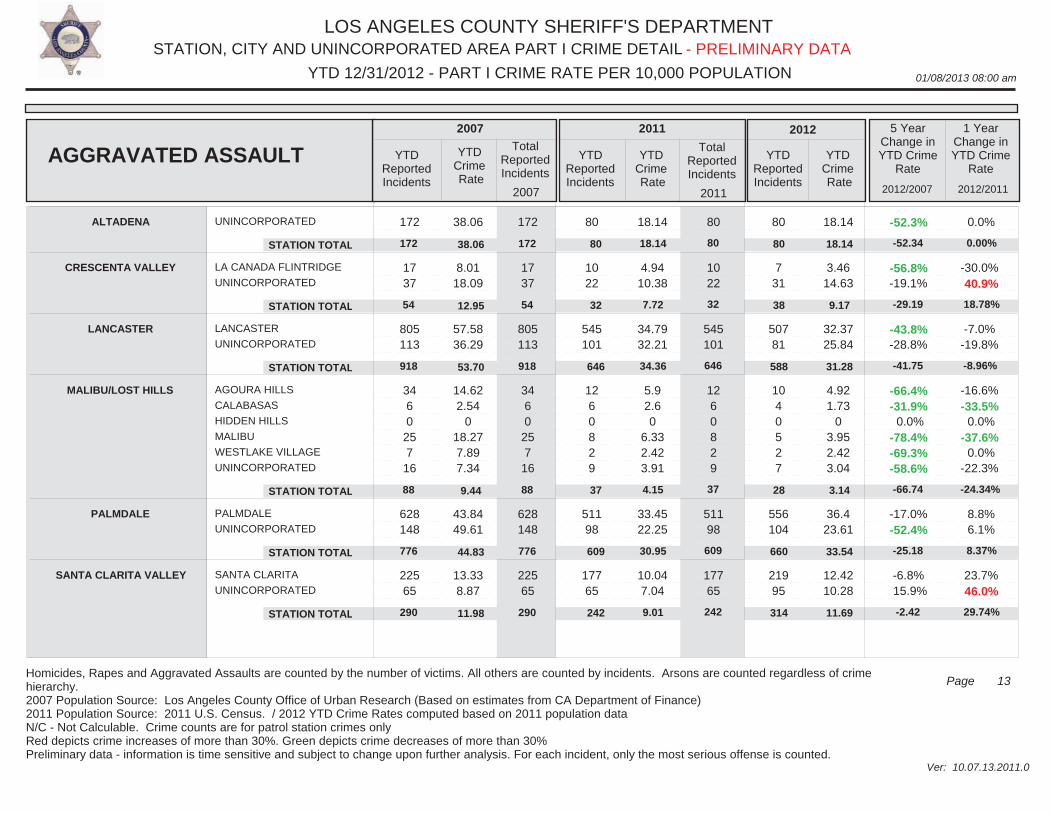
LOS ANGELES COUNTY SHERIFF'S DEPARTMENT
01/08/2013 08:00 am
STATION, CITY AND UNINCORPORATED AREA PART I CRIME DETAIL
Ver: 10.07.13.2011.0
YTD 12/31/2012 - PART I CRIME RATE PER 10,000 POPULATION
13Page
- PRELIMINARY DATA
Homicides, Rapes and Aggravated Assaults are counted by the number of victims. All others are counted by incidents. Arsons are counted regardless of crime hierarchy.2007 Population Source: Los Angeles County Office of Urban Research (Based on estimates from CA Department of Finance)2011 Population Source: 2011 U.S. Census. / 2012 YTD Crime Rates computed based on 2011 population dataN/C - Not Calculable. Crime counts are for patrol station crimes only Red depicts crime increases of more than 30%. Green depicts crime decreases of more than 30%Preliminary data - information is time sensitive and subject to change upon further analysis. For each incident, only the most serious offense is counted.
UNINCORPORATED
LA CANADA FLINTRIDGE
UNINCORPORATED
LANCASTER
UNINCORPORATED
AGOURA HILLS
CALABASAS
HIDDEN HILLS
MALIBU
WESTLAKE VILLAGE
UNINCORPORATED
PALMDALE
UNINCORPORATED
SANTA CLARITA
UNINCORPORATED
172
17 37
805 113
34 6 0
25 7
16
628 148
225 65
172
17 37
805 113
34 6 0
25 7
16
628 148
225 65
80
10 22
545 101
12 6 0 8 2 9
511 98
177 65
80
10 22
545 101
12 6 0 8 2 9
511 98
177 65
80
7 31
507 81
10 4 0 5 2 7
556 104
219 95
38.06
8.0118.09
57.5836.29
14.622.54
018.277.897.34
43.8449.61
13.338.87
18.14
4.9410.38
34.7932.21
5.92.60
6.332.423.91
33.4522.25
10.047.04
18.14
3.4614.63
32.3725.84
4.921.73
03.952.423.04
36.423.61
12.4210.28
-52.3%
-56.8%-19.1%
-43.8%-28.8%
-66.4%-31.9% 0.0%
-78.4%-69.3%-58.6%
-17.0%-52.4%
-6.8% 15.9%
0.0%
-30.0% 40.9%
-7.0%-19.8%
-16.6%-33.5% 0.0%
-37.6% 0.0%
-22.3%
8.8% 6.1%
23.7% 46.0%
ALTADENA
CRESCENTA VALLEY
LANCASTER
MALIBU/LOST HILLS
PALMDALE
SANTA CLARITA VALLEY
AGGRAVATED ASSAULT YTDReportedIncidents
YTDCrime Rate
TotalReportedIncidents
YTDReportedIncidents
YTDCrime Rate
TotalReportedIncidents
YTDReportedIncidents
YTDCrime Rate
5 YearChange inYTD Crime
Rate
1 YearChange inYTD Crime
Rate
2007 2011 2012
2012/2007 2012/2011
STATION TOTAL
STATION TOTAL
STATION TOTAL
STATION TOTAL
STATION TOTAL
STATION TOTAL
172
54
918
88
776
290
172
54
918
88
776
290
80
32
646
37
609
242
80
32
646
37
609
242
80
38
588
28
660
314
38.06
12.95
53.70
9.44
44.83
11.98
18.14
7.72
34.36
4.15
30.95
9.01
18.14
9.17
31.28
3.14
33.54
11.69
-52.34
-29.19
-41.75
-66.74
-25.18
-2.42
0.00%
18.78%
-8.96%
-24.34%
8.37%
29.74%
2007 2011
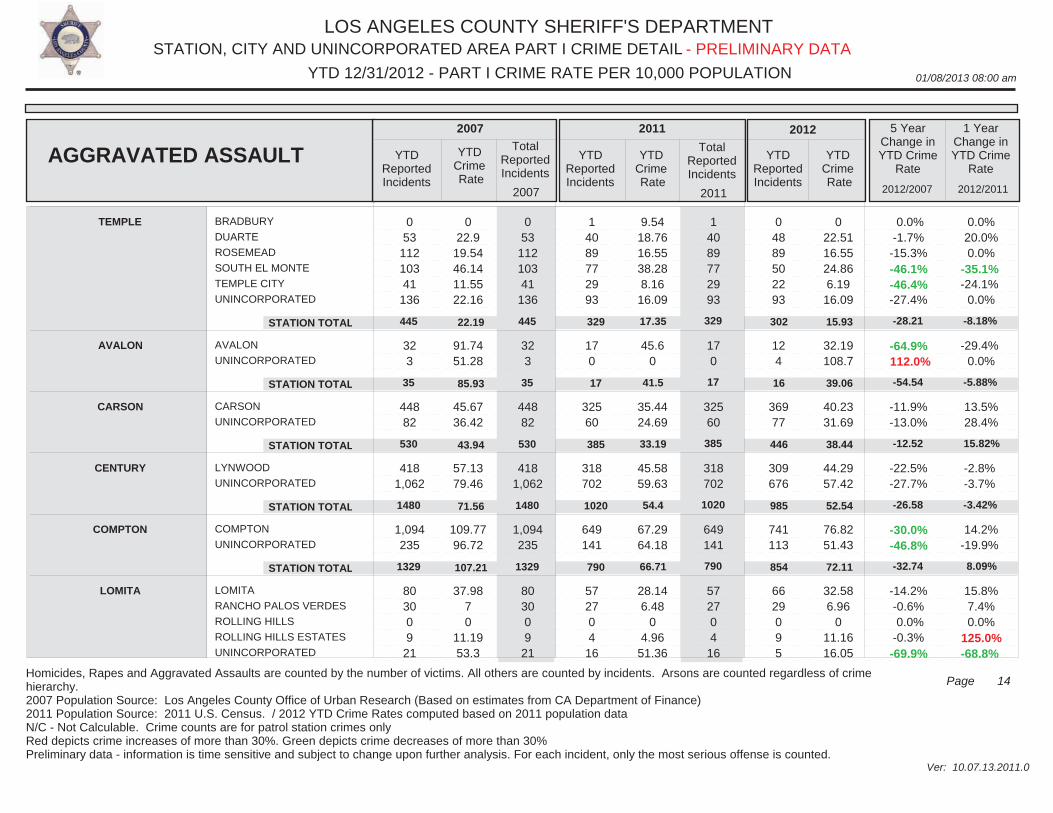
LOS ANGELES COUNTY SHERIFF'S DEPARTMENT
01/08/2013 08:00 am
STATION, CITY AND UNINCORPORATED AREA PART I CRIME DETAIL
Ver: 10.07.13.2011.0
YTD 12/31/2012 - PART I CRIME RATE PER 10,000 POPULATION
14Page
- PRELIMINARY DATA
Homicides, Rapes and Aggravated Assaults are counted by the number of victims. All others are counted by incidents. Arsons are counted regardless of crime hierarchy.2007 Population Source: Los Angeles County Office of Urban Research (Based on estimates from CA Department of Finance)2011 Population Source: 2011 U.S. Census. / 2012 YTD Crime Rates computed based on 2011 population dataN/C - Not Calculable. Crime counts are for patrol station crimes only Red depicts crime increases of more than 30%. Green depicts crime decreases of more than 30%Preliminary data - information is time sensitive and subject to change upon further analysis. For each incident, only the most serious offense is counted.
BRADBURY
DUARTE
ROSEMEAD
SOUTH EL MONTE
TEMPLE CITY
UNINCORPORATED
AVALON
UNINCORPORATED
CARSON
UNINCORPORATED
LYNWOOD
UNINCORPORATED
COMPTON
UNINCORPORATED
LOMITA
RANCHO PALOS VERDES
ROLLING HILLS
ROLLING HILLS ESTATES
UNINCORPORATED
0 53
112 103 41
136
32 3
448 82
418 1,062
1,094 235
80 30 0 9
21
0 53
112 103 41
136
32 3
448 82
418 1,062
1,094 235
80 30 0 9
21
1 40 89 77 29 93
17 0
325 60
318 702
649 141
57 27 0 4
16
1 40 89 77 29 93
17 0
325 60
318 702
649 141
57 27 0 4
16
0 48 89 50 22 93
12 4
369 77
309 676
741 113
66 29 0 9 5
022.9
19.5446.1411.5522.16
91.7451.28
45.6736.42
57.1379.46
109.7796.72
37.9870
11.1953.3
9.5418.7616.5538.288.16
16.09
45.60
35.4424.69
45.5859.63
67.2964.18
28.146.48
04.96
51.36
022.5116.5524.866.1916.09
32.19108.7
40.2331.69
44.2957.42
76.8251.43
32.586.96
011.1616.05
0.0%-1.7%
-15.3%-46.1%-46.4%-27.4%
-64.9% 112.0%
-11.9%-13.0%
-22.5%-27.7%
-30.0%-46.8%
-14.2%-0.6% 0.0%-0.3%-69.9%
0.0% 20.0% 0.0%
-35.1%-24.1% 0.0%
-29.4% 0.0%
13.5% 28.4%
-2.8%-3.7%
14.2%-19.9%
15.8% 7.4% 0.0%
125.0%-68.8%
TEMPLE
AVALON
CARSON
CENTURY
COMPTON
LOMITA
AGGRAVATED ASSAULT YTDReportedIncidents
YTDCrime Rate
TotalReportedIncidents
YTDReportedIncidents
YTDCrime Rate
TotalReportedIncidents
YTDReportedIncidents
YTDCrime Rate
5 YearChange inYTD Crime
Rate
1 YearChange inYTD Crime
Rate
2007 2011 2012
2012/2007 2012/2011
STATION TOTAL
STATION TOTAL
STATION TOTAL
STATION TOTAL
STATION TOTAL
445
35
530
1480
1329
445
35
530
1480
1329
329
17
385
1020
790
329
17
385
1020
790
302
16
446
985
854
22.19
85.93
43.94
71.56
107.21
17.35
41.5
33.19
54.4
66.71
15.93
39.06
38.44
52.54
72.11
-28.21
-54.54
-12.52
-26.58
-32.74
-8.18%
-5.88%
15.82%
-3.42%
8.09%
2007 2011
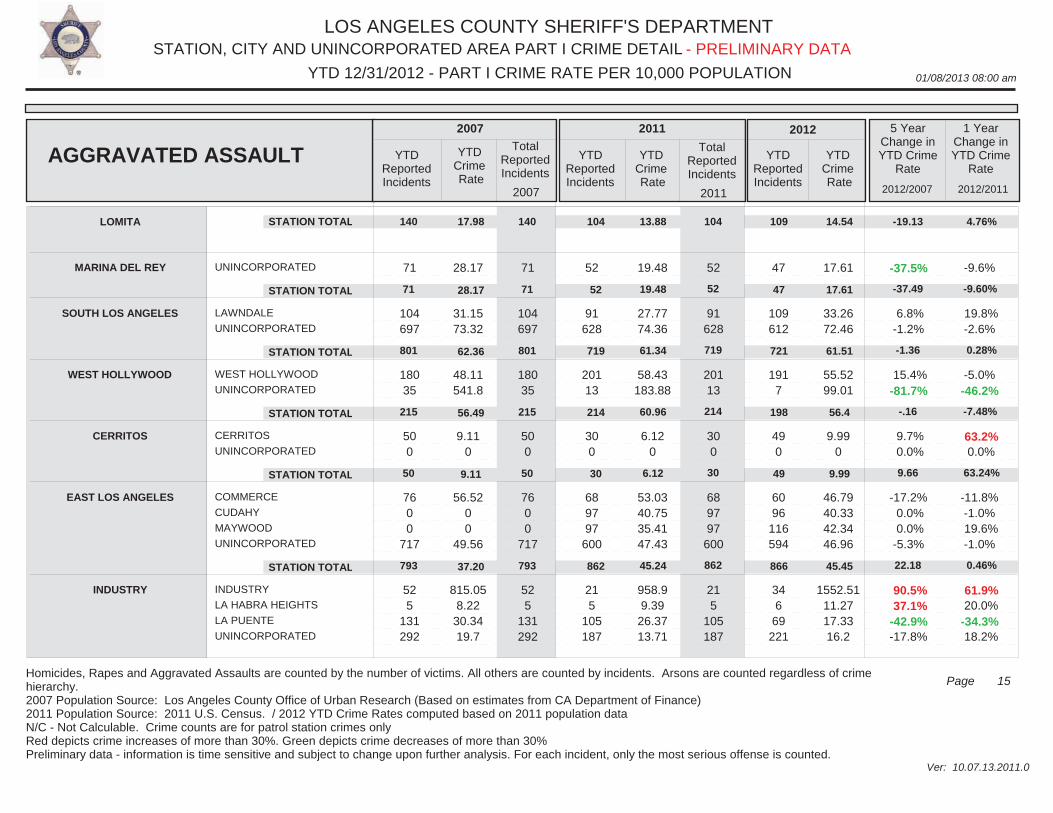
LOS ANGELES COUNTY SHERIFF'S DEPARTMENT
01/08/2013 08:00 am
STATION, CITY AND UNINCORPORATED AREA PART I CRIME DETAIL
Ver: 10.07.13.2011.0
YTD 12/31/2012 - PART I CRIME RATE PER 10,000 POPULATION
15Page
- PRELIMINARY DATA
Homicides, Rapes and Aggravated Assaults are counted by the number of victims. All others are counted by incidents. Arsons are counted regardless of crime hierarchy.2007 Population Source: Los Angeles County Office of Urban Research (Based on estimates from CA Department of Finance)2011 Population Source: 2011 U.S. Census. / 2012 YTD Crime Rates computed based on 2011 population dataN/C - Not Calculable. Crime counts are for patrol station crimes only Red depicts crime increases of more than 30%. Green depicts crime decreases of more than 30%Preliminary data - information is time sensitive and subject to change upon further analysis. For each incident, only the most serious offense is counted.
UNINCORPORATED
LAWNDALE
UNINCORPORATED
WEST HOLLYWOOD
UNINCORPORATED
CERRITOS
UNINCORPORATED
COMMERCE
CUDAHY
MAYWOOD
UNINCORPORATED
INDUSTRY
LA HABRA HEIGHTS
LA PUENTE
UNINCORPORATED
71
104 697
180 35
50 0
76 0 0
717
52 5
131 292
71
104 697
180 35
50 0
76 0 0
717
52 5
131 292
52
91 628
201 13
30 0
68 97 97
600
21 5
105 187
52
91 628
201 13
30 0
68 97 97
600
21 5
105 187
47
109 612
191 7
49 0
60 96
116 594
34 6 69
221
28.17
31.1573.32
48.11541.8
9.110
56.5200
49.56
815.058.22
30.3419.7
19.48
27.7774.36
58.43183.88
6.120
53.0340.7535.4147.43
958.99.39
26.3713.71
17.61
33.2672.46
55.5299.01
9.990
46.7940.3342.3446.96
1552.5111.2717.3316.2
-37.5%
6.8%-1.2%
15.4%-81.7%
9.7% 0.0%
-17.2% 0.0% 0.0%-5.3%
90.5% 37.1%-42.9%-17.8%
-9.6%
19.8%-2.6%
-5.0%-46.2%
63.2% 0.0%
-11.8%-1.0% 19.6%-1.0%
61.9% 20.0%-34.3% 18.2%
LOMITA
MARINA DEL REY
SOUTH LOS ANGELES
WEST HOLLYWOOD
CERRITOS
EAST LOS ANGELES
INDUSTRY
AGGRAVATED ASSAULT YTDReportedIncidents
YTDCrime Rate
TotalReportedIncidents
YTDReportedIncidents
YTDCrime Rate
TotalReportedIncidents
YTDReportedIncidents
YTDCrime Rate
5 YearChange inYTD Crime
Rate
1 YearChange inYTD Crime
Rate
2007 2011 2012
2012/2007 2012/2011
STATION TOTAL
STATION TOTAL
STATION TOTAL
STATION TOTAL
STATION TOTAL
STATION TOTAL
140
71
801
215
50
793
140
71
801
215
50
793
104
52
719
214
30
862
104
52
719
214
30
862
109
47
721
198
49
866
17.98
28.17
62.36
56.49
9.11
37.20
13.88
19.48
61.34
60.96
6.12
45.24
14.54
17.61
61.51
56.4
9.99
45.45
-19.13
-37.49
-1.36
-.16
9.66
22.18
4.76%
-9.60%
0.28%
-7.48%
63.24%
0.46%
2007 2011
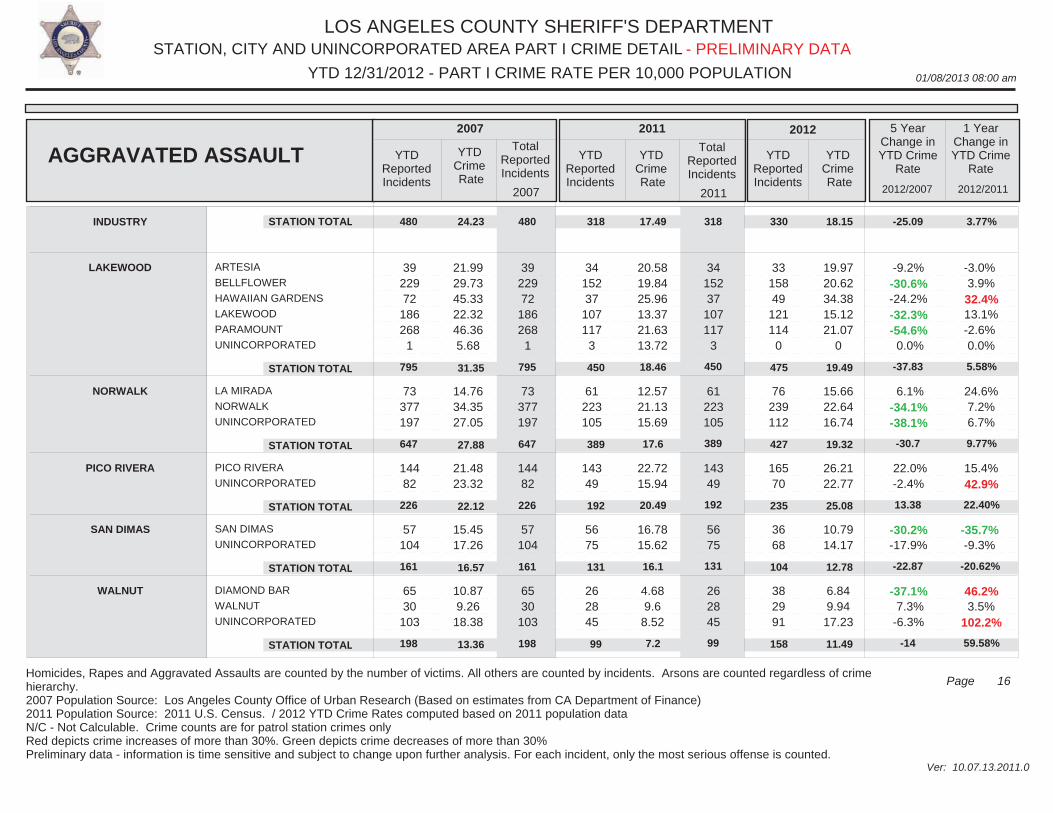
LOS ANGELES COUNTY SHERIFF'S DEPARTMENT
01/08/2013 08:00 am
STATION, CITY AND UNINCORPORATED AREA PART I CRIME DETAIL
Ver: 10.07.13.2011.0
YTD 12/31/2012 - PART I CRIME RATE PER 10,000 POPULATION
16Page
- PRELIMINARY DATA
Homicides, Rapes and Aggravated Assaults are counted by the number of victims. All others are counted by incidents. Arsons are counted regardless of crime hierarchy.2007 Population Source: Los Angeles County Office of Urban Research (Based on estimates from CA Department of Finance)2011 Population Source: 2011 U.S. Census. / 2012 YTD Crime Rates computed based on 2011 population dataN/C - Not Calculable. Crime counts are for patrol station crimes only Red depicts crime increases of more than 30%. Green depicts crime decreases of more than 30%Preliminary data - information is time sensitive and subject to change upon further analysis. For each incident, only the most serious offense is counted.
ARTESIA
BELLFLOWER
HAWAIIAN GARDENS
LAKEWOOD
PARAMOUNT
UNINCORPORATED
LA MIRADA
NORWALK
UNINCORPORATED
PICO RIVERA
UNINCORPORATED
SAN DIMAS
UNINCORPORATED
DIAMOND BAR
WALNUT
UNINCORPORATED
39 229 72
186 268
1
73 377 197
144 82
57 104
65 30
103
39 229 72
186 268
1
73 377 197
144 82
57 104
65 30
103
34 152 37
107 117
3
61 223 105
143 49
56 75
26 28 45
34 152 37
107 117
3
61 223 105
143 49
56 75
26 28 45
33 158 49
121 114 0
76 239 112
165 70
36 68
38 29 91
21.9929.7345.3322.3246.365.68
14.7634.3527.05
21.4823.32
15.4517.26
10.879.26
18.38
20.5819.8425.9613.3721.6313.72
12.5721.1315.69
22.7215.94
16.7815.62
4.689.6
8.52
19.9720.6234.3815.1221.07
0
15.6622.6416.74
26.2122.77
10.7914.17
6.849.9417.23
-9.2%-30.6%-24.2%-32.3%-54.6% 0.0%
6.1%-34.1%-38.1%
22.0%-2.4%
-30.2%-17.9%
-37.1% 7.3%-6.3%
-3.0% 3.9% 32.4% 13.1%-2.6% 0.0%
24.6% 7.2% 6.7%
15.4% 42.9%
-35.7%-9.3%
46.2% 3.5%
102.2%
INDUSTRY
LAKEWOOD
NORWALK
PICO RIVERA
SAN DIMAS
WALNUT
AGGRAVATED ASSAULT YTDReportedIncidents
YTDCrime Rate
TotalReportedIncidents
YTDReportedIncidents
YTDCrime Rate
TotalReportedIncidents
YTDReportedIncidents
YTDCrime Rate
5 YearChange inYTD Crime
Rate
1 YearChange inYTD Crime
Rate
2007 2011 2012
2012/2007 2012/2011
STATION TOTAL
STATION TOTAL
STATION TOTAL
STATION TOTAL
STATION TOTAL
STATION TOTAL
480
795
647
226
161
198
480
795
647
226
161
198
318
450
389
192
131
99
318
450
389
192
131
99
330
475
427
235
104
158
24.23
31.35
27.88
22.12
16.57
13.36
17.49
18.46
17.6
20.49
16.1
7.2
18.15
19.49
19.32
25.08
12.78
11.49
-25.09
-37.83
-30.7
13.38
-22.87
-14
3.77%
5.58%
9.77%
22.40%
-20.62%
59.58%
2007 2011
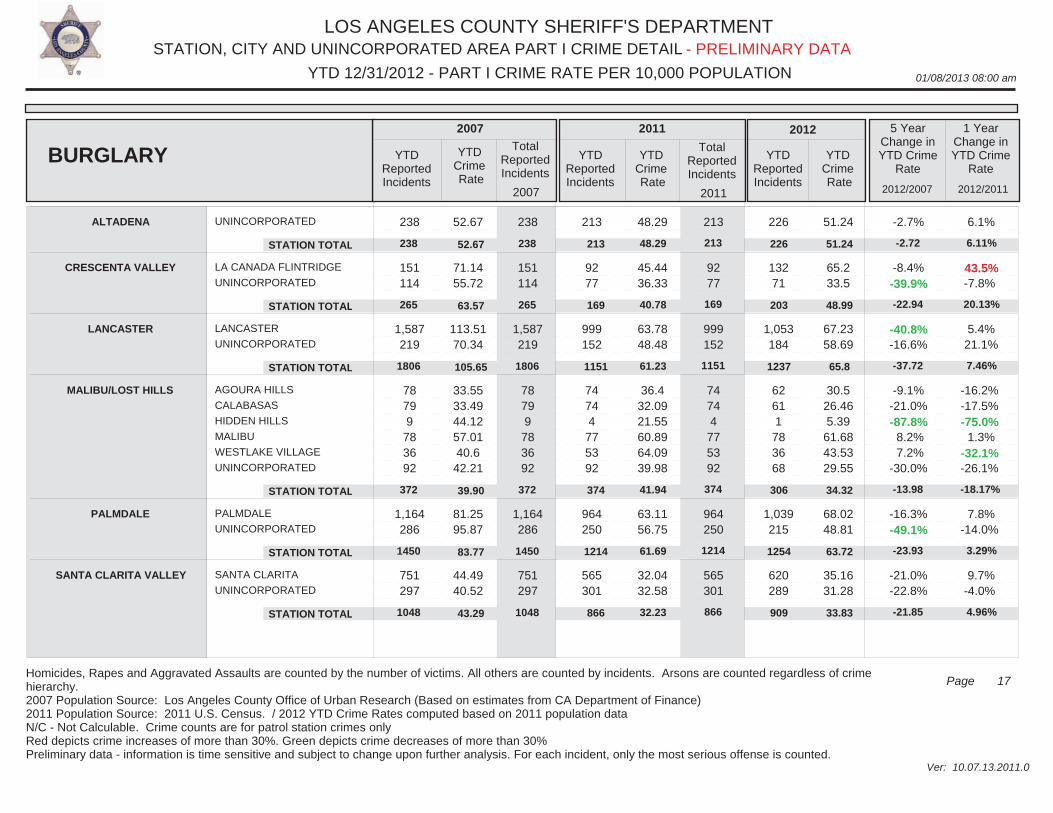
LOS ANGELES COUNTY SHERIFF'S DEPARTMENT
01/08/2013 08:00 am
STATION, CITY AND UNINCORPORATED AREA PART I CRIME DETAIL
Ver: 10.07.13.2011.0
YTD 12/31/2012 - PART I CRIME RATE PER 10,000 POPULATION
17Page
- PRELIMINARY DATA
Homicides, Rapes and Aggravated Assaults are counted by the number of victims. All others are counted by incidents. Arsons are counted regardless of crime hierarchy.2007 Population Source: Los Angeles County Office of Urban Research (Based on estimates from CA Department of Finance)2011 Population Source: 2011 U.S. Census. / 2012 YTD Crime Rates computed based on 2011 population dataN/C - Not Calculable. Crime counts are for patrol station crimes only Red depicts crime increases of more than 30%. Green depicts crime decreases of more than 30%Preliminary data - information is time sensitive and subject to change upon further analysis. For each incident, only the most serious offense is counted.
UNINCORPORATED
LA CANADA FLINTRIDGE
UNINCORPORATED
LANCASTER
UNINCORPORATED
AGOURA HILLS
CALABASAS
HIDDEN HILLS
MALIBU
WESTLAKE VILLAGE
UNINCORPORATED
PALMDALE
UNINCORPORATED
SANTA CLARITA
UNINCORPORATED
238
151 114
1,587 219
78 79 9
78 36 92
1,164 286
751 297
238
151 114
1,587 219
78 79 9
78 36 92
1,164 286
751 297
213
92 77
999 152
74 74 4
77 53 92
964 250
565 301
213
92 77
999 152
74 74 4
77 53 92
964 250
565 301
226
132 71
1,053 184
62 61 1 78 36 68
1,039 215
620 289
52.67
71.1455.72
113.5170.34
33.5533.4944.1257.0140.6
42.21
81.2595.87
44.4940.52
48.29
45.4436.33
63.7848.48
36.432.0921.5560.8964.0939.98
63.1156.75
32.0432.58
51.24
65.233.5
67.2358.69
30.526.465.3961.6843.5329.55
68.0248.81
35.1631.28
-2.7%
-8.4%-39.9%
-40.8%-16.6%
-9.1%-21.0%-87.8% 8.2% 7.2%
-30.0%
-16.3%-49.1%
-21.0%-22.8%
6.1%
43.5%-7.8%
5.4% 21.1%
-16.2%-17.5%-75.0% 1.3%
-32.1%-26.1%
7.8%-14.0%
9.7%-4.0%
ALTADENA
CRESCENTA VALLEY
LANCASTER
MALIBU/LOST HILLS
PALMDALE
SANTA CLARITA VALLEY
BURGLARY YTDReportedIncidents
YTDCrime Rate
TotalReportedIncidents
YTDReportedIncidents
YTDCrime Rate
TotalReportedIncidents
YTDReportedIncidents
YTDCrime Rate
5 YearChange inYTD Crime
Rate
1 YearChange inYTD Crime
Rate
2007 2011 2012
2012/2007 2012/2011
STATION TOTAL
STATION TOTAL
STATION TOTAL
STATION TOTAL
STATION TOTAL
STATION TOTAL
238
265
1806
372
1450
1048
238
265
1806
372
1450
1048
213
169
1151
374
1214
866
213
169
1151
374
1214
866
226
203
1237
306
1254
909
52.67
63.57
105.65
39.90
83.77
43.29
48.29
40.78
61.23
41.94
61.69
32.23
51.24
48.99
65.8
34.32
63.72
33.83
-2.72
-22.94
-37.72
-13.98
-23.93
-21.85
6.11%
20.13%
7.46%
-18.17%
3.29%
4.96%
2007 2011
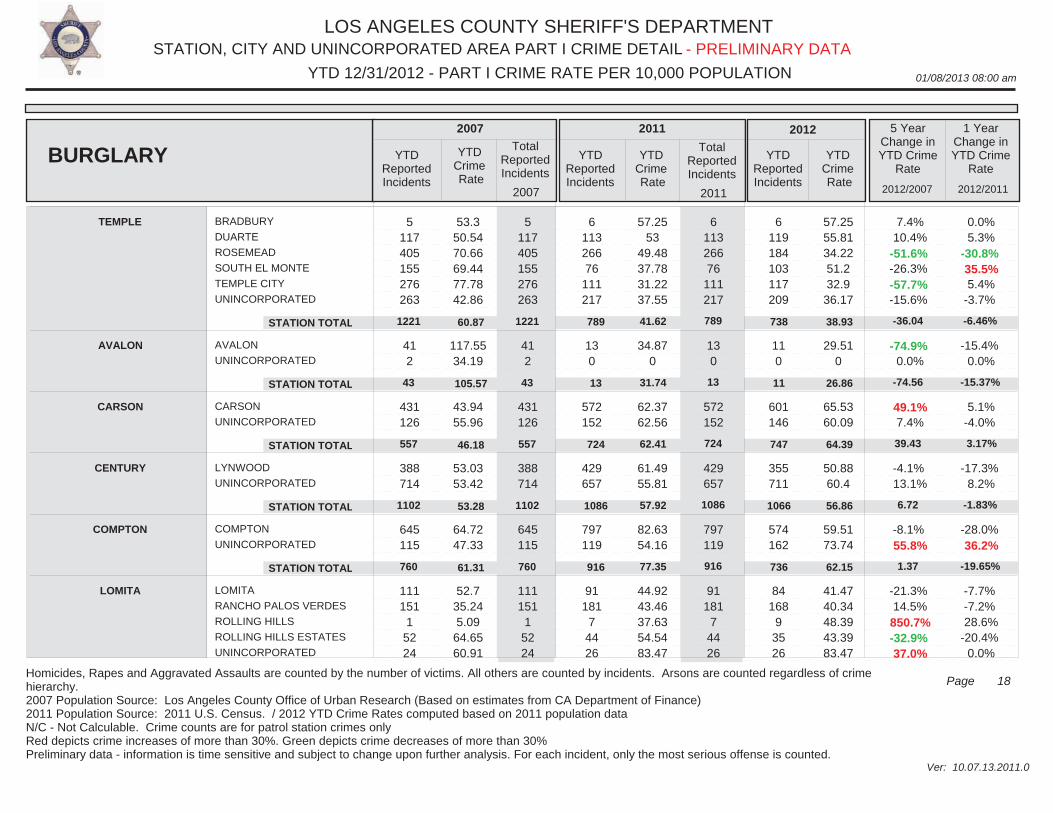
LOS ANGELES COUNTY SHERIFF'S DEPARTMENT
01/08/2013 08:00 am
STATION, CITY AND UNINCORPORATED AREA PART I CRIME DETAIL
Ver: 10.07.13.2011.0
YTD 12/31/2012 - PART I CRIME RATE PER 10,000 POPULATION
18Page
- PRELIMINARY DATA
Homicides, Rapes and Aggravated Assaults are counted by the number of victims. All others are counted by incidents. Arsons are counted regardless of crime hierarchy.2007 Population Source: Los Angeles County Office of Urban Research (Based on estimates from CA Department of Finance)2011 Population Source: 2011 U.S. Census. / 2012 YTD Crime Rates computed based on 2011 population dataN/C - Not Calculable. Crime counts are for patrol station crimes only Red depicts crime increases of more than 30%. Green depicts crime decreases of more than 30%Preliminary data - information is time sensitive and subject to change upon further analysis. For each incident, only the most serious offense is counted.
BRADBURY
DUARTE
ROSEMEAD
SOUTH EL MONTE
TEMPLE CITY
UNINCORPORATED
AVALON
UNINCORPORATED
CARSON
UNINCORPORATED
LYNWOOD
UNINCORPORATED
COMPTON
UNINCORPORATED
LOMITA
RANCHO PALOS VERDES
ROLLING HILLS
ROLLING HILLS ESTATES
UNINCORPORATED
5 117 405 155 276 263
41 2
431 126
388 714
645 115
111 151
1 52 24
5 117 405 155 276 263
41 2
431 126
388 714
645 115
111 151
1 52 24
6 113 266 76
111 217
13 0
572 152
429 657
797 119
91 181
7 44 26
6 113 266 76
111 217
13 0
572 152
429 657
797 119
91 181
7 44 26
6 119 184 103 117 209
11 0
601 146
355 711
574 162
84 168 9 35 26
53.350.5470.6669.4477.7842.86
117.5534.19
43.9455.96
53.0353.42
64.7247.33
52.735.245.09
64.6560.91
57.2553
49.4837.7831.2237.55
34.870
62.3762.56
61.4955.81
82.6354.16
44.9243.4637.6354.5483.47
57.2555.8134.2251.232.936.17
29.510
65.5360.09
50.8860.4
59.5173.74
41.4740.3448.3943.3983.47
7.4% 10.4%-51.6%-26.3%-57.7%-15.6%
-74.9% 0.0%
49.1% 7.4%
-4.1% 13.1%
-8.1% 55.8%
-21.3% 14.5% 850.7%-32.9% 37.0%
0.0% 5.3%
-30.8% 35.5% 5.4%-3.7%
-15.4% 0.0%
5.1%-4.0%
-17.3% 8.2%
-28.0% 36.2%
-7.7%-7.2% 28.6%-20.4% 0.0%
TEMPLE
AVALON
CARSON
CENTURY
COMPTON
LOMITA
BURGLARY YTDReportedIncidents
YTDCrime Rate
TotalReportedIncidents
YTDReportedIncidents
YTDCrime Rate
TotalReportedIncidents
YTDReportedIncidents
YTDCrime Rate
5 YearChange inYTD Crime
Rate
1 YearChange inYTD Crime
Rate
2007 2011 2012
2012/2007 2012/2011
STATION TOTAL
STATION TOTAL
STATION TOTAL
STATION TOTAL
STATION TOTAL
1221
43
557
1102
760
1221
43
557
1102
760
789
13
724
1086
916
789
13
724
1086
916
738
11
747
1066
736
60.87
105.57
46.18
53.28
61.31
41.62
31.74
62.41
57.92
77.35
38.93
26.86
64.39
56.86
62.15
-36.04
-74.56
39.43
6.72
1.37
-6.46%
-15.37%
3.17%
-1.83%
-19.65%
2007 2011
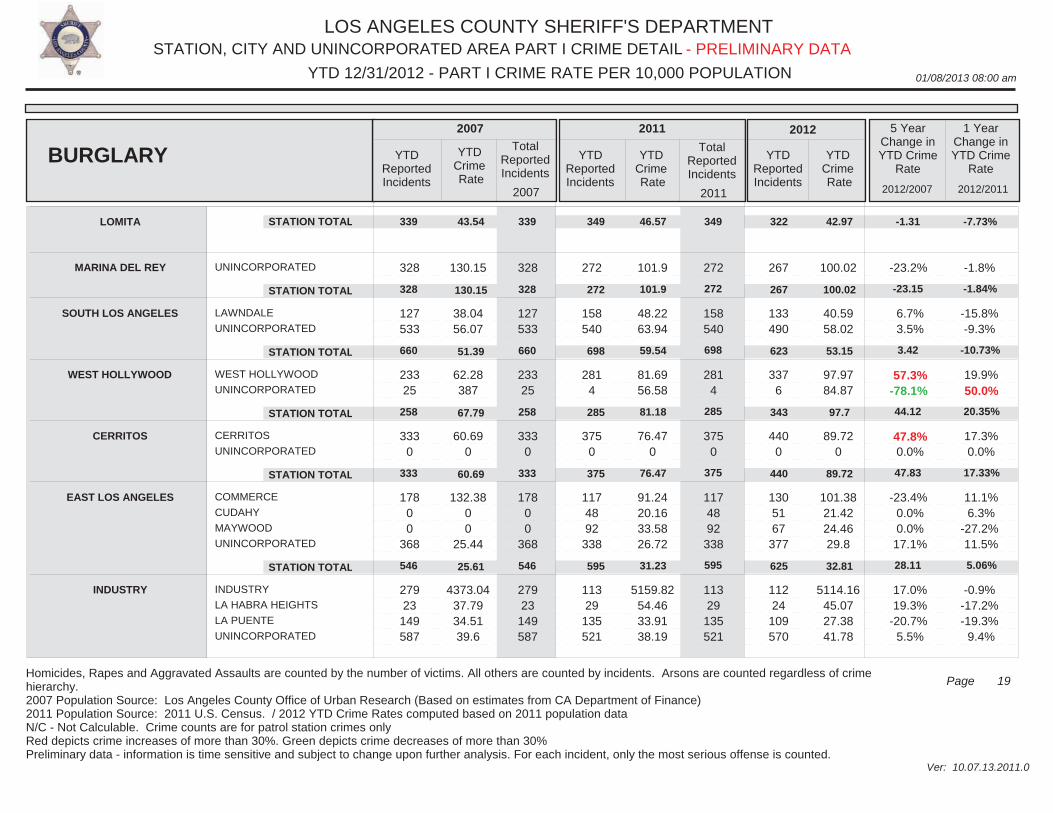
LOS ANGELES COUNTY SHERIFF'S DEPARTMENT
01/08/2013 08:00 am
STATION, CITY AND UNINCORPORATED AREA PART I CRIME DETAIL
Ver: 10.07.13.2011.0
YTD 12/31/2012 - PART I CRIME RATE PER 10,000 POPULATION
19Page
- PRELIMINARY DATA
Homicides, Rapes and Aggravated Assaults are counted by the number of victims. All others are counted by incidents. Arsons are counted regardless of crime hierarchy.2007 Population Source: Los Angeles County Office of Urban Research (Based on estimates from CA Department of Finance)2011 Population Source: 2011 U.S. Census. / 2012 YTD Crime Rates computed based on 2011 population dataN/C - Not Calculable. Crime counts are for patrol station crimes only Red depicts crime increases of more than 30%. Green depicts crime decreases of more than 30%Preliminary data - information is time sensitive and subject to change upon further analysis. For each incident, only the most serious offense is counted.
UNINCORPORATED
LAWNDALE
UNINCORPORATED
WEST HOLLYWOOD
UNINCORPORATED
CERRITOS
UNINCORPORATED
COMMERCE
CUDAHY
MAYWOOD
UNINCORPORATED
INDUSTRY
LA HABRA HEIGHTS
LA PUENTE
UNINCORPORATED
328
127 533
233 25
333 0
178 0 0
368
279 23
149 587
328
127 533
233 25
333 0
178 0 0
368
279 23
149 587
272
158 540
281 4
375 0
117 48 92
338
113 29
135 521
272
158 540
281 4
375 0
117 48 92
338
113 29
135 521
267
133 490
337 6
440 0
130 51 67
377
112 24
109 570
130.15
38.0456.07
62.28387
60.690
132.3800
25.44
4373.0437.7934.5139.6
101.9
48.2263.94
81.6956.58
76.470
91.2420.1633.5826.72
5159.8254.4633.9138.19
100.02
40.5958.02
97.9784.87
89.720
101.3821.4224.4629.8
5114.1645.0727.3841.78
-23.2%
6.7% 3.5%
57.3%-78.1%
47.8% 0.0%
-23.4% 0.0% 0.0%
17.1%
17.0% 19.3%-20.7% 5.5%
-1.8%
-15.8%-9.3%
19.9% 50.0%
17.3% 0.0%
11.1% 6.3%
-27.2% 11.5%
-0.9%-17.2%-19.3% 9.4%
LOMITA
MARINA DEL REY
SOUTH LOS ANGELES
WEST HOLLYWOOD
CERRITOS
EAST LOS ANGELES
INDUSTRY
BURGLARY YTDReportedIncidents
YTDCrime Rate
TotalReportedIncidents
YTDReportedIncidents
YTDCrime Rate
TotalReportedIncidents
YTDReportedIncidents
YTDCrime Rate
5 YearChange inYTD Crime
Rate
1 YearChange inYTD Crime
Rate
2007 2011 2012
2012/2007 2012/2011
STATION TOTAL
STATION TOTAL
STATION TOTAL
STATION TOTAL
STATION TOTAL
STATION TOTAL
339
328
660
258
333
546
339
328
660
258
333
546
349
272
698
285
375
595
349
272
698
285
375
595
322
267
623
343
440
625
43.54
130.15
51.39
67.79
60.69
25.61
46.57
101.9
59.54
81.18
76.47
31.23
42.97
100.02
53.15
97.7
89.72
32.81
-1.31
-23.15
3.42
44.12
47.83
28.11
-7.73%
-1.84%
-10.73%
20.35%
17.33%
5.06%
2007 2011
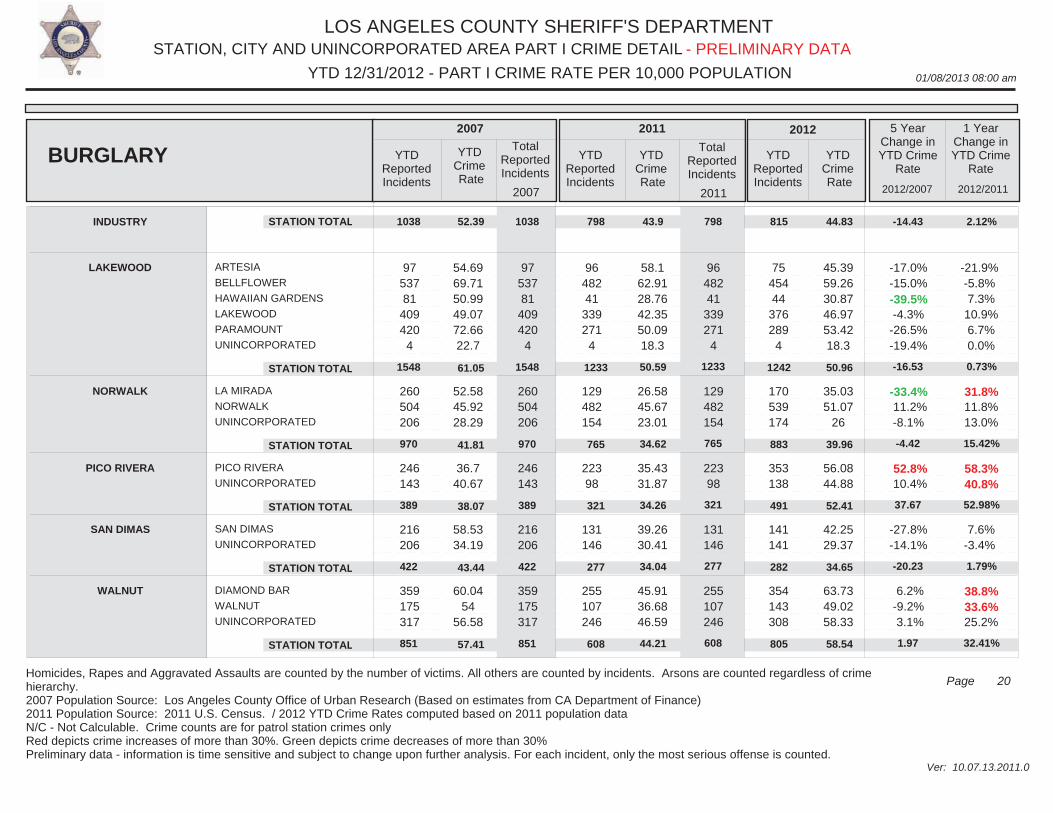
LOS ANGELES COUNTY SHERIFF'S DEPARTMENT
01/08/2013 08:00 am
STATION, CITY AND UNINCORPORATED AREA PART I CRIME DETAIL
Ver: 10.07.13.2011.0
YTD 12/31/2012 - PART I CRIME RATE PER 10,000 POPULATION
20Page
- PRELIMINARY DATA
Homicides, Rapes and Aggravated Assaults are counted by the number of victims. All others are counted by incidents. Arsons are counted regardless of crime hierarchy.2007 Population Source: Los Angeles County Office of Urban Research (Based on estimates from CA Department of Finance)2011 Population Source: 2011 U.S. Census. / 2012 YTD Crime Rates computed based on 2011 population dataN/C - Not Calculable. Crime counts are for patrol station crimes only Red depicts crime increases of more than 30%. Green depicts crime decreases of more than 30%Preliminary data - information is time sensitive and subject to change upon further analysis. For each incident, only the most serious offense is counted.
ARTESIA
BELLFLOWER
HAWAIIAN GARDENS
LAKEWOOD
PARAMOUNT
UNINCORPORATED
LA MIRADA
NORWALK
UNINCORPORATED
PICO RIVERA
UNINCORPORATED
SAN DIMAS
UNINCORPORATED
DIAMOND BAR
WALNUT
UNINCORPORATED
97 537 81
409 420
4
260 504 206
246 143
216 206
359 175 317
97 537 81
409 420
4
260 504 206
246 143
216 206
359 175 317
96 482 41
339 271
4
129 482 154
223 98
131 146
255 107 246
96 482 41
339 271
4
129 482 154
223 98
131 146
255 107 246
75 454 44
376 289 4
170 539 174
353 138
141 141
354 143 308
54.6969.7150.9949.0772.6622.7
52.5845.9228.29
36.740.67
58.5334.19
60.0454
56.58
58.162.9128.7642.3550.0918.3
26.5845.6723.01
35.4331.87
39.2630.41
45.9136.6846.59
45.3959.2630.8746.9753.4218.3
35.0351.07
26
56.0844.88
42.2529.37
63.7349.0258.33
-17.0%-15.0%-39.5%-4.3%
-26.5%-19.4%
-33.4% 11.2%-8.1%
52.8% 10.4%
-27.8%-14.1%
6.2%-9.2% 3.1%
-21.9%-5.8% 7.3%
10.9% 6.7% 0.0%
31.8% 11.8% 13.0%
58.3% 40.8%
7.6%-3.4%
38.8% 33.6% 25.2%
INDUSTRY
LAKEWOOD
NORWALK
PICO RIVERA
SAN DIMAS
WALNUT
BURGLARY YTDReportedIncidents
YTDCrime Rate
TotalReportedIncidents
YTDReportedIncidents
YTDCrime Rate
TotalReportedIncidents
YTDReportedIncidents
YTDCrime Rate
5 YearChange inYTD Crime
Rate
1 YearChange inYTD Crime
Rate
2007 2011 2012
2012/2007 2012/2011
STATION TOTAL
STATION TOTAL
STATION TOTAL
STATION TOTAL
STATION TOTAL
STATION TOTAL
1038
1548
970
389
422
851
1038
1548
970
389
422
851
798
1233
765
321
277
608
798
1233
765
321
277
608
815
1242
883
491
282
805
52.39
61.05
41.81
38.07
43.44
57.41
43.9
50.59
34.62
34.26
34.04
44.21
44.83
50.96
39.96
52.41
34.65
58.54
-14.43
-16.53
-4.42
37.67
-20.23
1.97
2.12%
0.73%
15.42%
52.98%
1.79%
32.41%
2007 2011
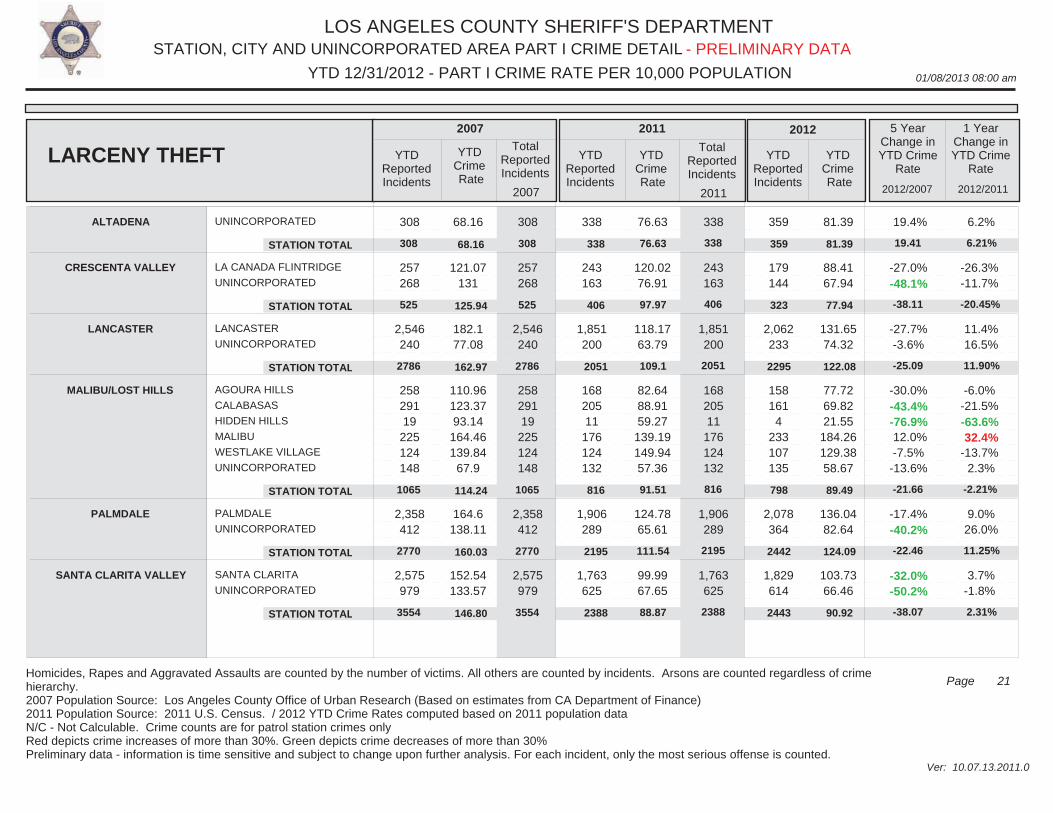
LOS ANGELES COUNTY SHERIFF'S DEPARTMENT
01/08/2013 08:00 am
STATION, CITY AND UNINCORPORATED AREA PART I CRIME DETAIL
Ver: 10.07.13.2011.0
YTD 12/31/2012 - PART I CRIME RATE PER 10,000 POPULATION
21Page
- PRELIMINARY DATA
Homicides, Rapes and Aggravated Assaults are counted by the number of victims. All others are counted by incidents. Arsons are counted regardless of crime hierarchy.2007 Population Source: Los Angeles County Office of Urban Research (Based on estimates from CA Department of Finance)2011 Population Source: 2011 U.S. Census. / 2012 YTD Crime Rates computed based on 2011 population dataN/C - Not Calculable. Crime counts are for patrol station crimes only Red depicts crime increases of more than 30%. Green depicts crime decreases of more than 30%Preliminary data - information is time sensitive and subject to change upon further analysis. For each incident, only the most serious offense is counted.
UNINCORPORATED
LA CANADA FLINTRIDGE
UNINCORPORATED
LANCASTER
UNINCORPORATED
AGOURA HILLS
CALABASAS
HIDDEN HILLS
MALIBU
WESTLAKE VILLAGE
UNINCORPORATED
PALMDALE
UNINCORPORATED
SANTA CLARITA
UNINCORPORATED
308
257 268
2,546 240
258 291 19
225 124 148
2,358 412
2,575 979
308
257 268
2,546 240
258 291 19
225 124 148
2,358 412
2,575 979
338
243 163
1,851 200
168 205 11
176 124 132
1,906 289
1,763 625
338
243 163
1,851 200
168 205 11
176 124 132
1,906 289
1,763 625
359
179 144
2,062 233
158 161 4
233 107 135
2,078 364
1,829 614
68.16
121.07131
182.177.08
110.96123.3793.14
164.46139.84
67.9
164.6138.11
152.54133.57
76.63
120.0276.91
118.1763.79
82.6488.9159.27
139.19149.9457.36
124.7865.61
99.9967.65
81.39
88.4167.94
131.6574.32
77.7269.8221.55
184.26129.3858.67
136.0482.64
103.7366.46
19.4%
-27.0%-48.1%
-27.7%-3.6%
-30.0%-43.4%-76.9% 12.0%-7.5%
-13.6%
-17.4%-40.2%
-32.0%-50.2%
6.2%
-26.3%-11.7%
11.4% 16.5%
-6.0%-21.5%-63.6% 32.4%-13.7% 2.3%
9.0% 26.0%
3.7%-1.8%
ALTADENA
CRESCENTA VALLEY
LANCASTER
MALIBU/LOST HILLS
PALMDALE
SANTA CLARITA VALLEY
LARCENY THEFT YTDReportedIncidents
YTDCrime Rate
TotalReportedIncidents
YTDReportedIncidents
YTDCrime Rate
TotalReportedIncidents
YTDReportedIncidents
YTDCrime Rate
5 YearChange inYTD Crime
Rate
1 YearChange inYTD Crime
Rate
2007 2011 2012
2012/2007 2012/2011
STATION TOTAL
STATION TOTAL
STATION TOTAL
STATION TOTAL
STATION TOTAL
STATION TOTAL
308
525
2786
1065
2770
3554
308
525
2786
1065
2770
3554
338
406
2051
816
2195
2388
338
406
2051
816
2195
2388
359
323
2295
798
2442
2443
68.16
125.94
162.97
114.24
160.03
146.80
76.63
97.97
109.1
91.51
111.54
88.87
81.39
77.94
122.08
89.49
124.09
90.92
19.41
-38.11
-25.09
-21.66
-22.46
-38.07
6.21%
-20.45%
11.90%
-2.21%
11.25%
2.31%
2007 2011
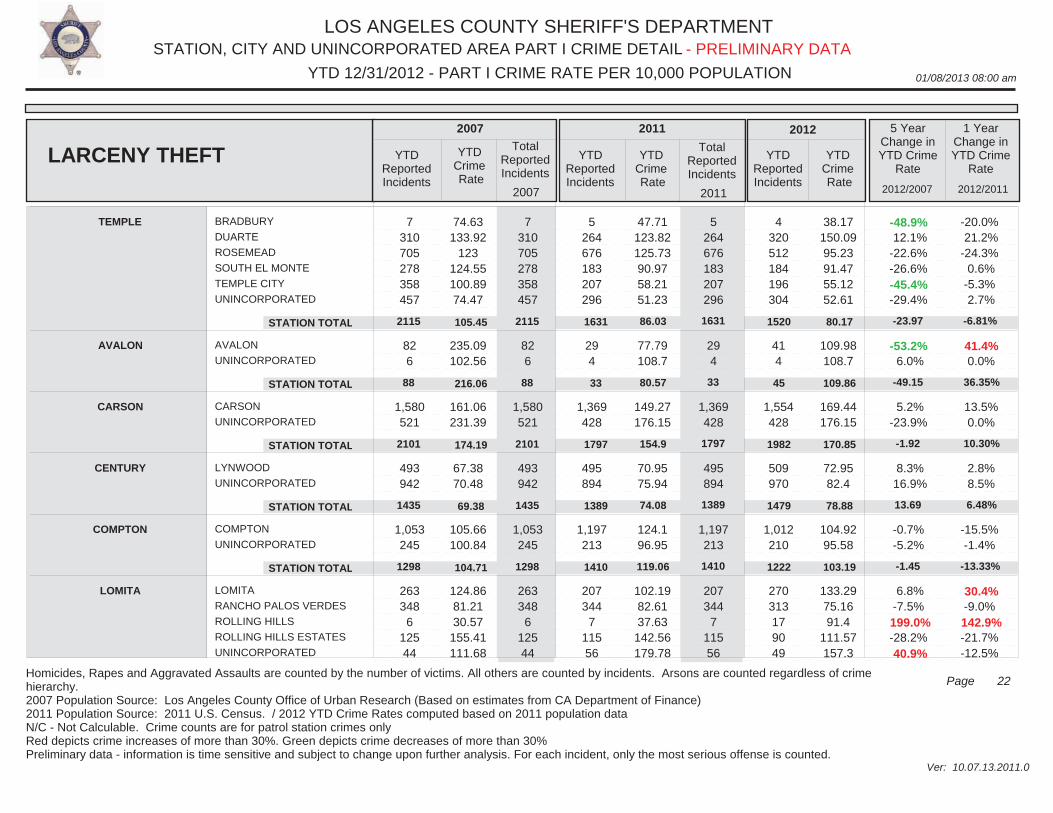
LOS ANGELES COUNTY SHERIFF'S DEPARTMENT
01/08/2013 08:00 am
STATION, CITY AND UNINCORPORATED AREA PART I CRIME DETAIL
Ver: 10.07.13.2011.0
YTD 12/31/2012 - PART I CRIME RATE PER 10,000 POPULATION
22Page
- PRELIMINARY DATA
Homicides, Rapes and Aggravated Assaults are counted by the number of victims. All others are counted by incidents. Arsons are counted regardless of crime hierarchy.2007 Population Source: Los Angeles County Office of Urban Research (Based on estimates from CA Department of Finance)2011 Population Source: 2011 U.S. Census. / 2012 YTD Crime Rates computed based on 2011 population dataN/C - Not Calculable. Crime counts are for patrol station crimes only Red depicts crime increases of more than 30%. Green depicts crime decreases of more than 30%Preliminary data - information is time sensitive and subject to change upon further analysis. For each incident, only the most serious offense is counted.
BRADBURY
DUARTE
ROSEMEAD
SOUTH EL MONTE
TEMPLE CITY
UNINCORPORATED
AVALON
UNINCORPORATED
CARSON
UNINCORPORATED
LYNWOOD
UNINCORPORATED
COMPTON
UNINCORPORATED
LOMITA
RANCHO PALOS VERDES
ROLLING HILLS
ROLLING HILLS ESTATES
UNINCORPORATED
7 310 705 278 358 457
82 6
1,580 521
493 942
1,053 245
263 348
6 125 44
7 310 705 278 358 457
82 6
1,580 521
493 942
1,053 245
263 348
6 125 44
5 264 676 183 207 296
29 4
1,369 428
495 894
1,197 213
207 344
7 115 56
5 264 676 183 207 296
29 4
1,369 428
495 894
1,197 213
207 344
7 115 56
4 320 512 184 196 304
41 4
1,554 428
509 970
1,012 210
270 313 17 90 49
74.63133.92
123124.55100.8974.47
235.09102.56
161.06231.39
67.3870.48
105.66100.84
124.8681.2130.57
155.41111.68
47.71123.82125.7390.9758.2151.23
77.79108.7
149.27176.15
70.9575.94
124.196.95
102.1982.6137.63
142.56179.78
38.17150.0995.2391.4755.1252.61
109.98108.7
169.44176.15
72.9582.4
104.9295.58
133.2975.1691.4
111.57157.3
-48.9% 12.1%-22.6%-26.6%-45.4%-29.4%
-53.2% 6.0%
5.2%-23.9%
8.3% 16.9%
-0.7%-5.2%
6.8%-7.5%
199.0%-28.2% 40.9%
-20.0% 21.2%-24.3% 0.6%-5.3% 2.7%
41.4% 0.0%
13.5% 0.0%
2.8% 8.5%
-15.5%-1.4%
30.4%-9.0%
142.9%-21.7%-12.5%
TEMPLE
AVALON
CARSON
CENTURY
COMPTON
LOMITA
LARCENY THEFT YTDReportedIncidents
YTDCrime Rate
TotalReportedIncidents
YTDReportedIncidents
YTDCrime Rate
TotalReportedIncidents
YTDReportedIncidents
YTDCrime Rate
5 YearChange inYTD Crime
Rate
1 YearChange inYTD Crime
Rate
2007 2011 2012
2012/2007 2012/2011
STATION TOTAL
STATION TOTAL
STATION TOTAL
STATION TOTAL
STATION TOTAL
2115
88
2101
1435
1298
2115
88
2101
1435
1298
1631
33
1797
1389
1410
1631
33
1797
1389
1410
1520
45
1982
1479
1222
105.45
216.06
174.19
69.38
104.71
86.03
80.57
154.9
74.08
119.06
80.17
109.86
170.85
78.88
103.19
-23.97
-49.15
-1.92
13.69
-1.45
-6.81%
36.35%
10.30%
6.48%
-13.33%
2007 2011
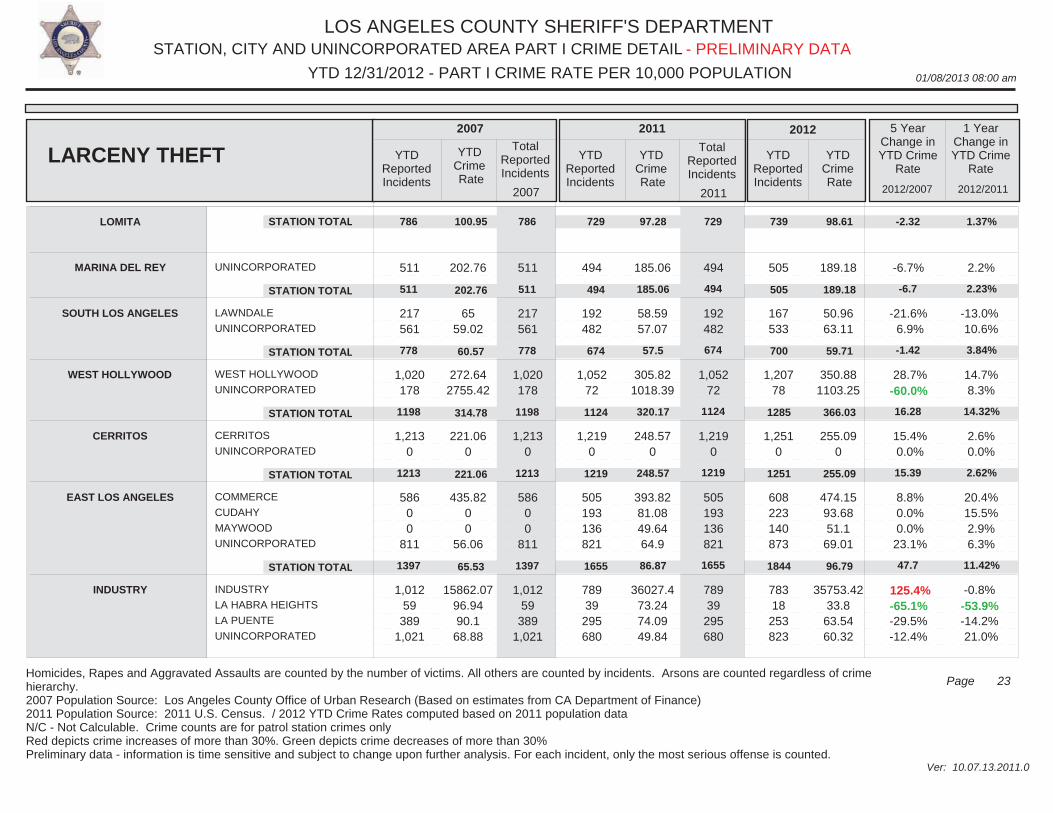
LOS ANGELES COUNTY SHERIFF'S DEPARTMENT
01/08/2013 08:00 am
STATION, CITY AND UNINCORPORATED AREA PART I CRIME DETAIL
Ver: 10.07.13.2011.0
YTD 12/31/2012 - PART I CRIME RATE PER 10,000 POPULATION
23Page
- PRELIMINARY DATA
Homicides, Rapes and Aggravated Assaults are counted by the number of victims. All others are counted by incidents. Arsons are counted regardless of crime hierarchy.2007 Population Source: Los Angeles County Office of Urban Research (Based on estimates from CA Department of Finance)2011 Population Source: 2011 U.S. Census. / 2012 YTD Crime Rates computed based on 2011 population dataN/C - Not Calculable. Crime counts are for patrol station crimes only Red depicts crime increases of more than 30%. Green depicts crime decreases of more than 30%Preliminary data - information is time sensitive and subject to change upon further analysis. For each incident, only the most serious offense is counted.
UNINCORPORATED
LAWNDALE
UNINCORPORATED
WEST HOLLYWOOD
UNINCORPORATED
CERRITOS
UNINCORPORATED
COMMERCE
CUDAHY
MAYWOOD
UNINCORPORATED
INDUSTRY
LA HABRA HEIGHTS
LA PUENTE
UNINCORPORATED
511
217 561
1,020 178
1,213 0
586 0 0
811
1,012 59
389 1,021
511
217 561
1,020 178
1,213 0
586 0 0
811
1,012 59
389 1,021
494
192 482
1,052 72
1,219 0
505 193 136 821
789 39
295 680
494
192 482
1,052 72
1,219 0
505 193 136 821
789 39
295 680
505
167 533
1,207 78
1,251 0
608 223 140 873
783 18
253 823
202.76
6559.02
272.642755.42
221.060
435.8200
56.06
15862.0796.9490.1
68.88
185.06
58.5957.07
305.821018.39
248.570
393.8281.0849.6464.9
36027.473.2474.0949.84
189.18
50.9663.11
350.881103.25
255.090
474.1593.6851.169.01
35753.4233.863.5460.32
-6.7%
-21.6% 6.9%
28.7%-60.0%
15.4% 0.0%
8.8% 0.0% 0.0%
23.1%
125.4%-65.1%-29.5%-12.4%
2.2%
-13.0% 10.6%
14.7% 8.3%
2.6% 0.0%
20.4% 15.5% 2.9% 6.3%
-0.8%-53.9%-14.2% 21.0%
LOMITA
MARINA DEL REY
SOUTH LOS ANGELES
WEST HOLLYWOOD
CERRITOS
EAST LOS ANGELES
INDUSTRY
LARCENY THEFT YTDReportedIncidents
YTDCrime Rate
TotalReportedIncidents
YTDReportedIncidents
YTDCrime Rate
TotalReportedIncidents
YTDReportedIncidents
YTDCrime Rate
5 YearChange inYTD Crime
Rate
1 YearChange inYTD Crime
Rate
2007 2011 2012
2012/2007 2012/2011
STATION TOTAL
STATION TOTAL
STATION TOTAL
STATION TOTAL
STATION TOTAL
STATION TOTAL
786
511
778
1198
1213
1397
786
511
778
1198
1213
1397
729
494
674
1124
1219
1655
729
494
674
1124
1219
1655
739
505
700
1285
1251
1844
100.95
202.76
60.57
314.78
221.06
65.53
97.28
185.06
57.5
320.17
248.57
86.87
98.61
189.18
59.71
366.03
255.09
96.79
-2.32
-6.7
-1.42
16.28
15.39
47.7
1.37%
2.23%
3.84%
14.32%
2.62%
11.42%
2007 2011
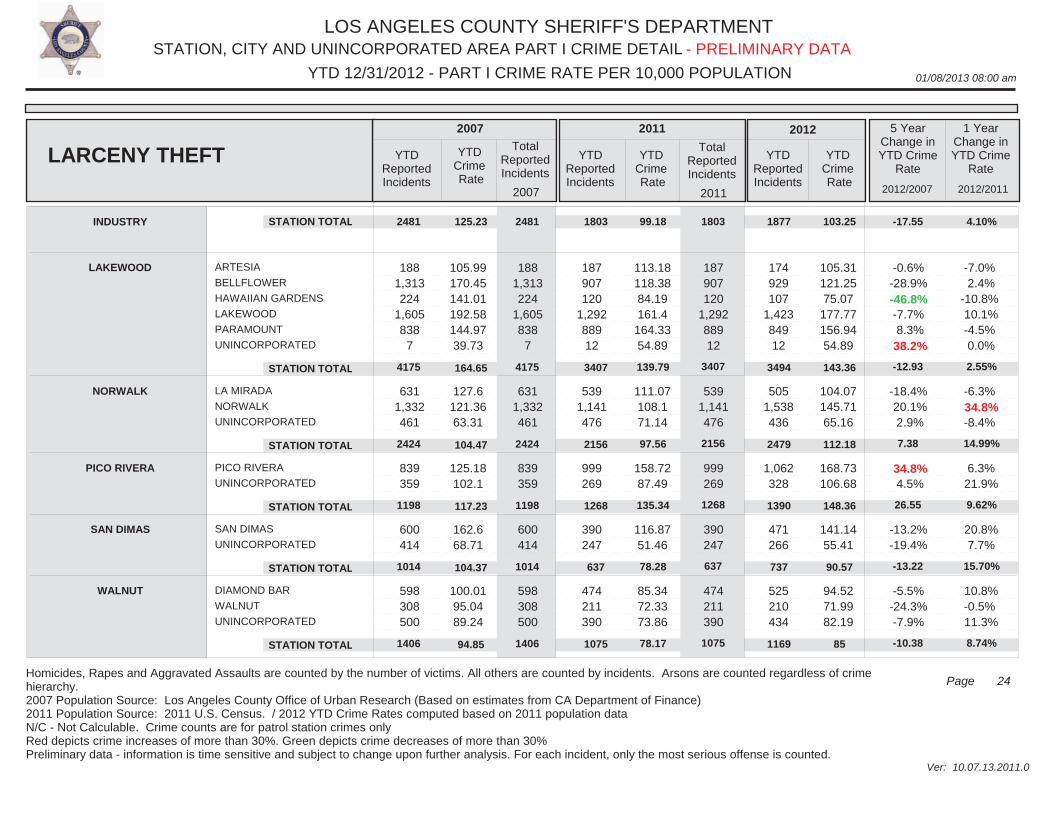
LOS ANGELES COUNTY SHERIFF'S DEPARTMENT
01/08/2013 08:00 am
STATION, CITY AND UNINCORPORATED AREA PART I CRIME DETAIL
Ver: 10.07.13.2011.0
YTD 12/31/2012 - PART I CRIME RATE PER 10,000 POPULATION
24Page
- PRELIMINARY DATA
Homicides, Rapes and Aggravated Assaults are counted by the number of victims. All others are counted by incidents. Arsons are counted regardless of crime hierarchy.2007 Population Source: Los Angeles County Office of Urban Research (Based on estimates from CA Department of Finance)2011 Population Source: 2011 U.S. Census. / 2012 YTD Crime Rates computed based on 2011 population dataN/C - Not Calculable. Crime counts are for patrol station crimes only Red depicts crime increases of more than 30%. Green depicts crime decreases of more than 30%Preliminary data - information is time sensitive and subject to change upon further analysis. For each incident, only the most serious offense is counted.
ARTESIA
BELLFLOWER
HAWAIIAN GARDENS
LAKEWOOD
PARAMOUNT
UNINCORPORATED
LA MIRADA
NORWALK
UNINCORPORATED
PICO RIVERA
UNINCORPORATED
SAN DIMAS
UNINCORPORATED
DIAMOND BAR
WALNUT
UNINCORPORATED
188 1,313 224
1,605 838
7
631 1,332 461
839 359
600 414
598 308 500
188 1,313 224
1,605 838
7
631 1,332 461
839 359
600 414
598 308 500
187 907 120
1,292 889 12
539 1,141 476
999 269
390 247
474 211 390
187 907 120
1,292 889 12
539 1,141 476
999 269
390 247
474 211 390
174 929 107
1,423 849 12
505 1,538 436
1,062 328
471 266
525 210 434
105.99170.45141.01192.58144.9739.73
127.6121.3663.31
125.18102.1
162.668.71
100.0195.0489.24
113.18118.3884.19161.4
164.3354.89
111.07108.171.14
158.7287.49
116.8751.46
85.3472.3373.86
105.31121.2575.07
177.77156.9454.89
104.07145.7165.16
168.73106.68
141.1455.41
94.5271.9982.19
-0.6%-28.9%-46.8%-7.7% 8.3% 38.2%
-18.4% 20.1% 2.9%
34.8% 4.5%
-13.2%-19.4%
-5.5%-24.3%-7.9%
-7.0% 2.4%
-10.8% 10.1%-4.5% 0.0%
-6.3% 34.8%-8.4%
6.3% 21.9%
20.8% 7.7%
10.8%-0.5% 11.3%
INDUSTRY
LAKEWOOD
NORWALK
PICO RIVERA
SAN DIMAS
WALNUT
LARCENY THEFT YTDReportedIncidents
YTDCrime Rate
TotalReportedIncidents
YTDReportedIncidents
YTDCrime Rate
TotalReportedIncidents
YTDReportedIncidents
YTDCrime Rate
5 YearChange inYTD Crime
Rate
1 YearChange inYTD Crime
Rate
2007 2011 2012
2012/2007 2012/2011
STATION TOTAL
STATION TOTAL
STATION TOTAL
STATION TOTAL
STATION TOTAL
STATION TOTAL
2481
4175
2424
1198
1014
1406
2481
4175
2424
1198
1014
1406
1803
3407
2156
1268
637
1075
1803
3407
2156
1268
637
1075
1877
3494
2479
1390
737
1169
125.23
164.65
104.47
117.23
104.37
94.85
99.18
139.79
97.56
135.34
78.28
78.17
103.25
143.36
112.18
148.36
90.57
85
-17.55
-12.93
7.38
26.55
-13.22
-10.38
4.10%
2.55%
14.99%
9.62%
15.70%
8.74%
2007 2011
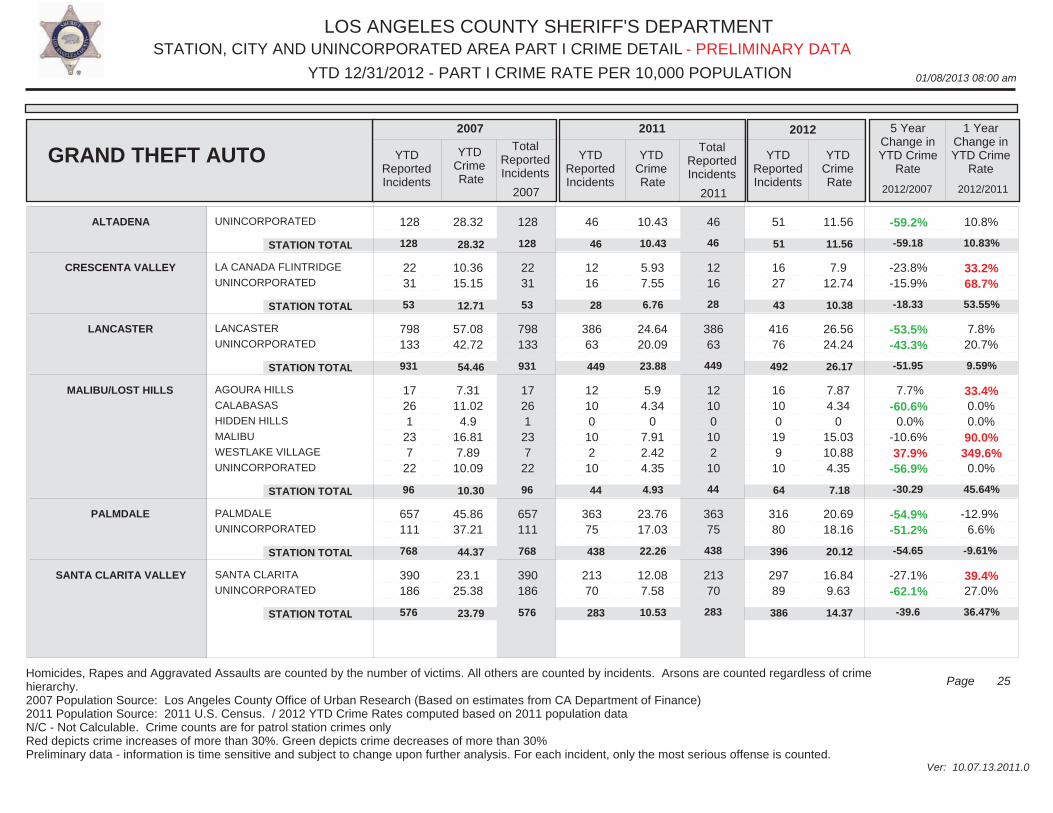
LOS ANGELES COUNTY SHERIFF'S DEPARTMENT
01/08/2013 08:00 am
STATION, CITY AND UNINCORPORATED AREA PART I CRIME DETAIL
Ver: 10.07.13.2011.0
YTD 12/31/2012 - PART I CRIME RATE PER 10,000 POPULATION
25Page
- PRELIMINARY DATA
Homicides, Rapes and Aggravated Assaults are counted by the number of victims. All others are counted by incidents. Arsons are counted regardless of crime hierarchy.2007 Population Source: Los Angeles County Office of Urban Research (Based on estimates from CA Department of Finance)2011 Population Source: 2011 U.S. Census. / 2012 YTD Crime Rates computed based on 2011 population dataN/C - Not Calculable. Crime counts are for patrol station crimes only Red depicts crime increases of more than 30%. Green depicts crime decreases of more than 30%Preliminary data - information is time sensitive and subject to change upon further analysis. For each incident, only the most serious offense is counted.
UNINCORPORATED
LA CANADA FLINTRIDGE
UNINCORPORATED
LANCASTER
UNINCORPORATED
AGOURA HILLS
CALABASAS
HIDDEN HILLS
MALIBU
WESTLAKE VILLAGE
UNINCORPORATED
PALMDALE
UNINCORPORATED
SANTA CLARITA
UNINCORPORATED
128
22 31
798 133
17 26 1
23 7
22
657 111
390 186
128
22 31
798 133
17 26 1
23 7
22
657 111
390 186
46
12 16
386 63
12 10 0
10 2
10
363 75
213 70
46
12 16
386 63
12 10 0
10 2
10
363 75
213 70
51
16 27
416 76
16 10 0 19 9 10
316 80
297 89
28.32
10.3615.15
57.0842.72
7.3111.02
4.916.817.89
10.09
45.8637.21
23.125.38
10.43
5.937.55
24.6420.09
5.94.34
07.912.424.35
23.7617.03
12.087.58
11.56
7.912.74
26.5624.24
7.874.34
015.0310.884.35
20.6918.16
16.849.63
-59.2%
-23.8%-15.9%
-53.5%-43.3%
7.7%-60.6% 0.0%
-10.6% 37.9%-56.9%
-54.9%-51.2%
-27.1%-62.1%
10.8%
33.2% 68.7%
7.8% 20.7%
33.4% 0.0% 0.0% 90.0%
349.6% 0.0%
-12.9% 6.6%
39.4% 27.0%
ALTADENA
CRESCENTA VALLEY
LANCASTER
MALIBU/LOST HILLS
PALMDALE
SANTA CLARITA VALLEY
GRAND THEFT AUTO YTDReportedIncidents
YTDCrime Rate
TotalReportedIncidents
YTDReportedIncidents
YTDCrime Rate
TotalReportedIncidents
YTDReportedIncidents
YTDCrime Rate
5 YearChange inYTD Crime
Rate
1 YearChange inYTD Crime
Rate
2007 2011 2012
2012/2007 2012/2011
STATION TOTAL
STATION TOTAL
STATION TOTAL
STATION TOTAL
STATION TOTAL
STATION TOTAL
128
53
931
96
768
576
128
53
931
96
768
576
46
28
449
44
438
283
46
28
449
44
438
283
51
43
492
64
396
386
28.32
12.71
54.46
10.30
44.37
23.79
10.43
6.76
23.88
4.93
22.26
10.53
11.56
10.38
26.17
7.18
20.12
14.37
-59.18
-18.33
-51.95
-30.29
-54.65
-39.6
10.83%
53.55%
9.59%
45.64%
-9.61%
36.47%
2007 2011
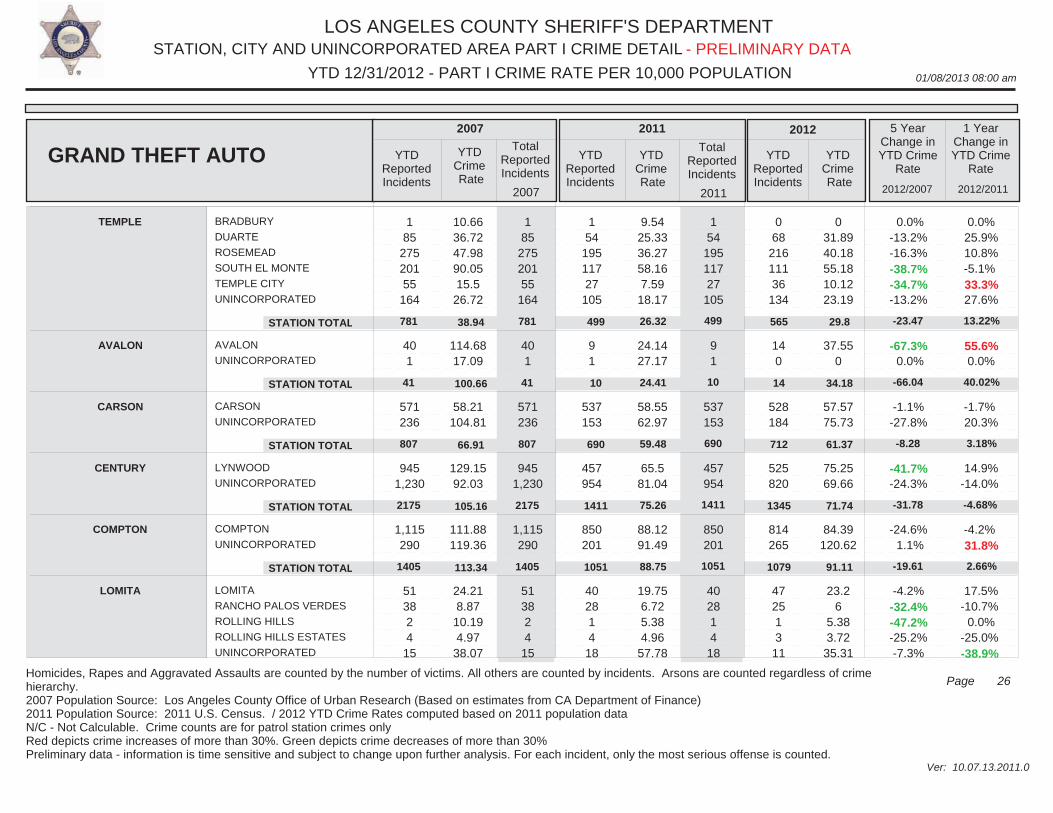
LOS ANGELES COUNTY SHERIFF'S DEPARTMENT
01/08/2013 08:00 am
STATION, CITY AND UNINCORPORATED AREA PART I CRIME DETAIL
Ver: 10.07.13.2011.0
YTD 12/31/2012 - PART I CRIME RATE PER 10,000 POPULATION
26Page
- PRELIMINARY DATA
Homicides, Rapes and Aggravated Assaults are counted by the number of victims. All others are counted by incidents. Arsons are counted regardless of crime hierarchy.2007 Population Source: Los Angeles County Office of Urban Research (Based on estimates from CA Department of Finance)2011 Population Source: 2011 U.S. Census. / 2012 YTD Crime Rates computed based on 2011 population dataN/C - Not Calculable. Crime counts are for patrol station crimes only Red depicts crime increases of more than 30%. Green depicts crime decreases of more than 30%Preliminary data - information is time sensitive and subject to change upon further analysis. For each incident, only the most serious offense is counted.
BRADBURY
DUARTE
ROSEMEAD
SOUTH EL MONTE
TEMPLE CITY
UNINCORPORATED
AVALON
UNINCORPORATED
CARSON
UNINCORPORATED
LYNWOOD
UNINCORPORATED
COMPTON
UNINCORPORATED
LOMITA
RANCHO PALOS VERDES
ROLLING HILLS
ROLLING HILLS ESTATES
UNINCORPORATED
1 85
275 201 55
164
40 1
571 236
945 1,230
1,115 290
51 38 2 4
15
1 85
275 201 55
164
40 1
571 236
945 1,230
1,115 290
51 38 2 4
15
1 54
195 117 27
105
9 1
537 153
457 954
850 201
40 28 1 4
18
1 54
195 117 27
105
9 1
537 153
457 954
850 201
40 28 1 4
18
0 68
216 111 36
134
14 0
528 184
525 820
814 265
47 25 1 3 11
10.6636.7247.9890.0515.5
26.72
114.6817.09
58.21104.81
129.1592.03
111.88119.36
24.218.87
10.194.97
38.07
9.5425.3336.2758.167.59
18.17
24.1427.17
58.5562.97
65.581.04
88.1291.49
19.756.725.384.96
57.78
031.8940.1855.1810.1223.19
37.550
57.5775.73
75.2569.66
84.39120.62
23.26
5.383.7235.31
0.0%-13.2%-16.3%-38.7%-34.7%-13.2%
-67.3% 0.0%
-1.1%-27.8%
-41.7%-24.3%
-24.6% 1.1%
-4.2%-32.4%-47.2%-25.2%-7.3%
0.0% 25.9% 10.8%-5.1% 33.3% 27.6%
55.6% 0.0%
-1.7% 20.3%
14.9%-14.0%
-4.2% 31.8%
17.5%-10.7% 0.0%
-25.0%-38.9%
TEMPLE
AVALON
CARSON
CENTURY
COMPTON
LOMITA
GRAND THEFT AUTO YTDReportedIncidents
YTDCrime Rate
TotalReportedIncidents
YTDReportedIncidents
YTDCrime Rate
TotalReportedIncidents
YTDReportedIncidents
YTDCrime Rate
5 YearChange inYTD Crime
Rate
1 YearChange inYTD Crime
Rate
2007 2011 2012
2012/2007 2012/2011
STATION TOTAL
STATION TOTAL
STATION TOTAL
STATION TOTAL
STATION TOTAL
781
41
807
2175
1405
781
41
807
2175
1405
499
10
690
1411
1051
499
10
690
1411
1051
565
14
712
1345
1079
38.94
100.66
66.91
105.16
113.34
26.32
24.41
59.48
75.26
88.75
29.8
34.18
61.37
71.74
91.11
-23.47
-66.04
-8.28
-31.78
-19.61
13.22%
40.02%
3.18%
-4.68%
2.66%
2007 2011
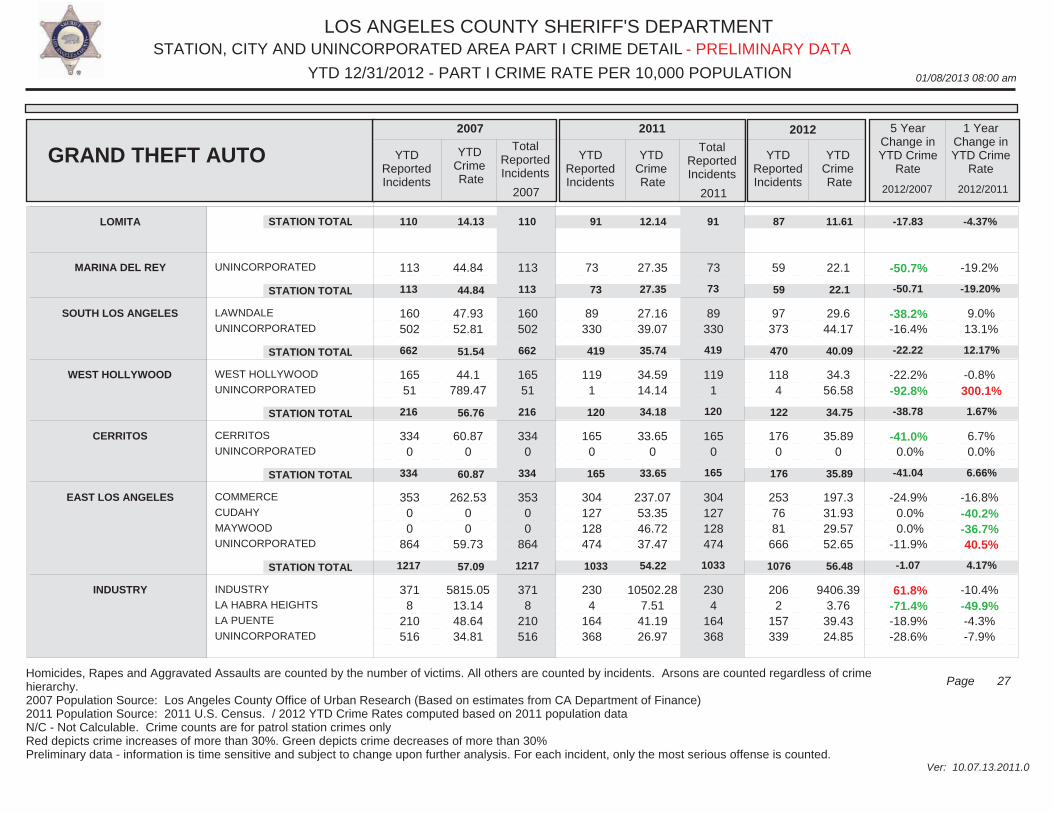
LOS ANGELES COUNTY SHERIFF'S DEPARTMENT
01/08/2013 08:00 am
STATION, CITY AND UNINCORPORATED AREA PART I CRIME DETAIL
Ver: 10.07.13.2011.0
YTD 12/31/2012 - PART I CRIME RATE PER 10,000 POPULATION
27Page
- PRELIMINARY DATA
Homicides, Rapes and Aggravated Assaults are counted by the number of victims. All others are counted by incidents. Arsons are counted regardless of crime hierarchy.2007 Population Source: Los Angeles County Office of Urban Research (Based on estimates from CA Department of Finance)2011 Population Source: 2011 U.S. Census. / 2012 YTD Crime Rates computed based on 2011 population dataN/C - Not Calculable. Crime counts are for patrol station crimes only Red depicts crime increases of more than 30%. Green depicts crime decreases of more than 30%Preliminary data - information is time sensitive and subject to change upon further analysis. For each incident, only the most serious offense is counted.
UNINCORPORATED
LAWNDALE
UNINCORPORATED
WEST HOLLYWOOD
UNINCORPORATED
CERRITOS
UNINCORPORATED
COMMERCE
CUDAHY
MAYWOOD
UNINCORPORATED
INDUSTRY
LA HABRA HEIGHTS
LA PUENTE
UNINCORPORATED
113
160 502
165 51
334 0
353 0 0
864
371 8
210 516
113
160 502
165 51
334 0
353 0 0
864
371 8
210 516
73
89 330
119 1
165 0
304 127 128 474
230 4
164 368
73
89 330
119 1
165 0
304 127 128 474
230 4
164 368
59
97 373
118 4
176 0
253 76 81
666
206 2
157 339
44.84
47.9352.81
44.1789.47
60.870
262.5300
59.73
5815.0513.1448.6434.81
27.35
27.1639.07
34.5914.14
33.650
237.0753.3546.7237.47
10502.287.51
41.1926.97
22.1
29.644.17
34.356.58
35.890
197.331.9329.5752.65
9406.393.7639.4324.85
-50.7%
-38.2%-16.4%
-22.2%-92.8%
-41.0% 0.0%
-24.9% 0.0% 0.0%
-11.9%
61.8%-71.4%-18.9%-28.6%
-19.2%
9.0% 13.1%
-0.8% 300.1%
6.7% 0.0%
-16.8%-40.2%-36.7% 40.5%
-10.4%-49.9%-4.3%-7.9%
LOMITA
MARINA DEL REY
SOUTH LOS ANGELES
WEST HOLLYWOOD
CERRITOS
EAST LOS ANGELES
INDUSTRY
GRAND THEFT AUTO YTDReportedIncidents
YTDCrime Rate
TotalReportedIncidents
YTDReportedIncidents
YTDCrime Rate
TotalReportedIncidents
YTDReportedIncidents
YTDCrime Rate
5 YearChange inYTD Crime
Rate
1 YearChange inYTD Crime
Rate
2007 2011 2012
2012/2007 2012/2011
STATION TOTAL
STATION TOTAL
STATION TOTAL
STATION TOTAL
STATION TOTAL
STATION TOTAL
110
113
662
216
334
1217
110
113
662
216
334
1217
91
73
419
120
165
1033
91
73
419
120
165
1033
87
59
470
122
176
1076
14.13
44.84
51.54
56.76
60.87
57.09
12.14
27.35
35.74
34.18
33.65
54.22
11.61
22.1
40.09
34.75
35.89
56.48
-17.83
-50.71
-22.22
-38.78
-41.04
-1.07
-4.37%
-19.20%
12.17%
1.67%
6.66%
4.17%
2007 2011
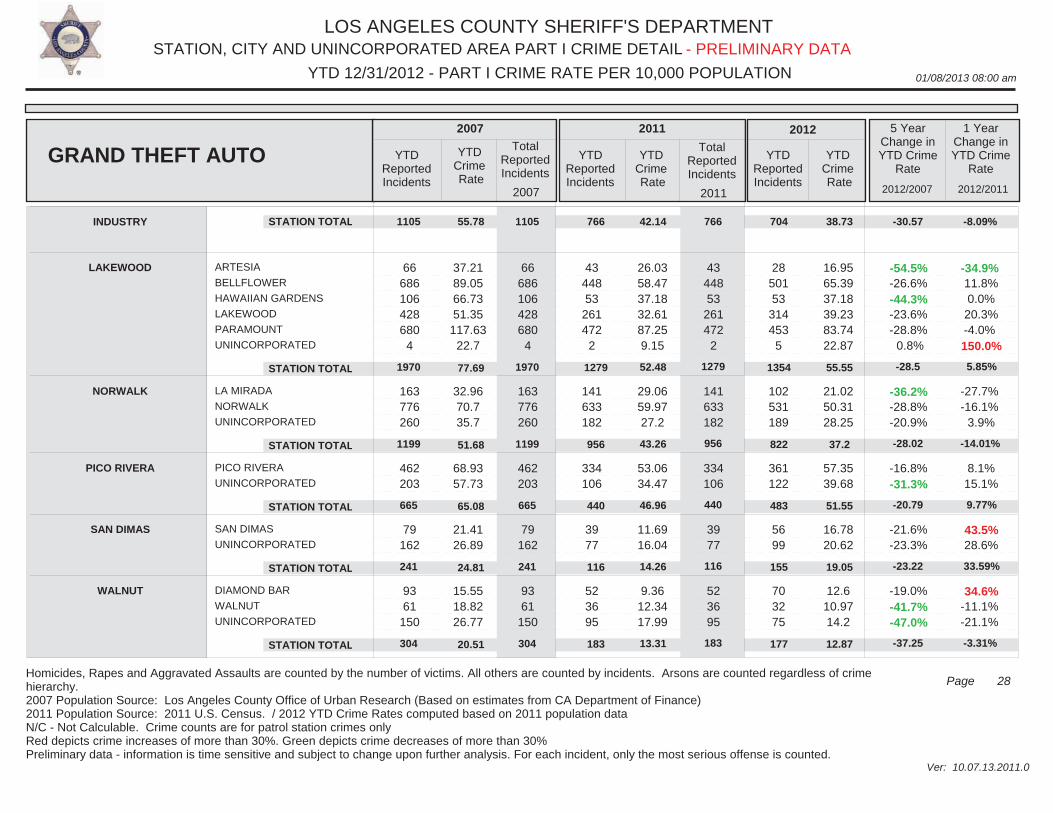
LOS ANGELES COUNTY SHERIFF'S DEPARTMENT
01/08/2013 08:00 am
STATION, CITY AND UNINCORPORATED AREA PART I CRIME DETAIL
Ver: 10.07.13.2011.0
YTD 12/31/2012 - PART I CRIME RATE PER 10,000 POPULATION
28Page
- PRELIMINARY DATA
Homicides, Rapes and Aggravated Assaults are counted by the number of victims. All others are counted by incidents. Arsons are counted regardless of crime hierarchy.2007 Population Source: Los Angeles County Office of Urban Research (Based on estimates from CA Department of Finance)2011 Population Source: 2011 U.S. Census. / 2012 YTD Crime Rates computed based on 2011 population dataN/C - Not Calculable. Crime counts are for patrol station crimes only Red depicts crime increases of more than 30%. Green depicts crime decreases of more than 30%Preliminary data - information is time sensitive and subject to change upon further analysis. For each incident, only the most serious offense is counted.
ARTESIA
BELLFLOWER
HAWAIIAN GARDENS
LAKEWOOD
PARAMOUNT
UNINCORPORATED
LA MIRADA
NORWALK
UNINCORPORATED
PICO RIVERA
UNINCORPORATED
SAN DIMAS
UNINCORPORATED
DIAMOND BAR
WALNUT
UNINCORPORATED
66 686 106 428 680
4
163 776 260
462 203
79 162
93 61
150
66 686 106 428 680
4
163 776 260
462 203
79 162
93 61
150
43 448 53
261 472
2
141 633 182
334 106
39 77
52 36 95
43 448 53
261 472
2
141 633 182
334 106
39 77
52 36 95
28 501 53
314 453 5
102 531 189
361 122
56 99
70 32 75
37.2189.0566.7351.35
117.6322.7
32.9670.735.7
68.9357.73
21.4126.89
15.5518.8226.77
26.0358.4737.1832.6187.259.15
29.0659.9727.2
53.0634.47
11.6916.04
9.3612.3417.99
16.9565.3937.1839.2383.7422.87
21.0250.3128.25
57.3539.68
16.7820.62
12.610.9714.2
-54.5%-26.6%-44.3%-23.6%-28.8% 0.8%
-36.2%-28.8%-20.9%
-16.8%-31.3%
-21.6%-23.3%
-19.0%-41.7%-47.0%
-34.9% 11.8% 0.0%
20.3%-4.0%
150.0%
-27.7%-16.1% 3.9%
8.1% 15.1%
43.5% 28.6%
34.6%-11.1%-21.1%
INDUSTRY
LAKEWOOD
NORWALK
PICO RIVERA
SAN DIMAS
WALNUT
GRAND THEFT AUTO YTDReportedIncidents
YTDCrime Rate
TotalReportedIncidents
YTDReportedIncidents
YTDCrime Rate
TotalReportedIncidents
YTDReportedIncidents
YTDCrime Rate
5 YearChange inYTD Crime
Rate
1 YearChange inYTD Crime
Rate
2007 2011 2012
2012/2007 2012/2011
STATION TOTAL
STATION TOTAL
STATION TOTAL
STATION TOTAL
STATION TOTAL
STATION TOTAL
1105
1970
1199
665
241
304
1105
1970
1199
665
241
304
766
1279
956
440
116
183
766
1279
956
440
116
183
704
1354
822
483
155
177
55.78
77.69
51.68
65.08
24.81
20.51
42.14
52.48
43.26
46.96
14.26
13.31
38.73
55.55
37.2
51.55
19.05
12.87
-30.57
-28.5
-28.02
-20.79
-23.22
-37.25
-8.09%
5.85%
-14.01%
9.77%
33.59%
-3.31%
2007 2011
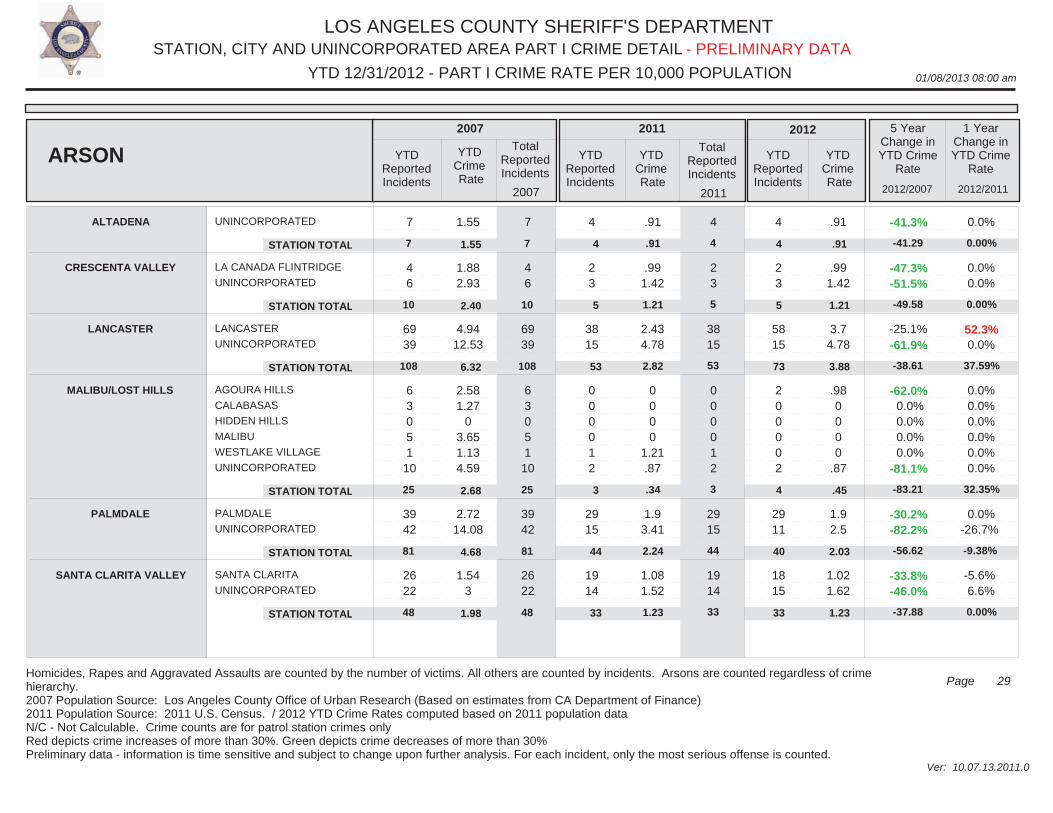
LOS ANGELES COUNTY SHERIFF'S DEPARTMENT
01/08/2013 08:00 am
STATION, CITY AND UNINCORPORATED AREA PART I CRIME DETAIL
Ver: 10.07.13.2011.0
YTD 12/31/2012 - PART I CRIME RATE PER 10,000 POPULATION
29Page
- PRELIMINARY DATA
Homicides, Rapes and Aggravated Assaults are counted by the number of victims. All others are counted by incidents. Arsons are counted regardless of crime hierarchy.2007 Population Source: Los Angeles County Office of Urban Research (Based on estimates from CA Department of Finance)2011 Population Source: 2011 U.S. Census. / 2012 YTD Crime Rates computed based on 2011 population dataN/C - Not Calculable. Crime counts are for patrol station crimes only Red depicts crime increases of more than 30%. Green depicts crime decreases of more than 30%Preliminary data - information is time sensitive and subject to change upon further analysis. For each incident, only the most serious offense is counted.
UNINCORPORATED
LA CANADA FLINTRIDGE
UNINCORPORATED
LANCASTER
UNINCORPORATED
AGOURA HILLS
CALABASAS
HIDDEN HILLS
MALIBU
WESTLAKE VILLAGE
UNINCORPORATED
PALMDALE
UNINCORPORATED
SANTA CLARITA
UNINCORPORATED
7
4 6
69 39
6 3 0 5 1
10
39 42
26 22
7
4 6
69 39
6 3 0 5 1
10
39 42
26 22
4
2 3
38 15
0 0 0 0 1 2
29 15
19 14
4
2 3
38 15
0 0 0 0 1 2
29 15
19 14
4
2 3
58 15
2 0 0 0 0 2
29 11
18 15
1.55
1.882.93
4.9412.53
2.581.27
03.651.134.59
2.7214.08
1.543
.91
.991.42
2.434.78
0000
1.21.87
1.93.41
1.081.52
.91
.991.42
3.74.78
.980000
.87
1.92.5
1.021.62
-41.3%
-47.3%-51.5%
-25.1%-61.9%
-62.0% 0.0% 0.0% 0.0% 0.0%
-81.1%
-30.2%-82.2%
-33.8%-46.0%
0.0%
0.0% 0.0%
52.3% 0.0%
0.0% 0.0% 0.0% 0.0% 0.0% 0.0%
0.0%-26.7%
-5.6% 6.6%
ALTADENA
CRESCENTA VALLEY
LANCASTER
MALIBU/LOST HILLS
PALMDALE
SANTA CLARITA VALLEY
ARSON YTDReportedIncidents
YTDCrime Rate
TotalReportedIncidents
YTDReportedIncidents
YTDCrime Rate
TotalReportedIncidents
YTDReportedIncidents
YTDCrime Rate
5 YearChange inYTD Crime
Rate
1 YearChange inYTD Crime
Rate
2007 2011 2012
2012/2007 2012/2011
STATION TOTAL
STATION TOTAL
STATION TOTAL
STATION TOTAL
STATION TOTAL
STATION TOTAL
7
10
108
25
81
48
7
10
108
25
81
48
4
5
53
3
44
33
4
5
53
3
44
33
4
5
73
4
40
33
1.55
2.40
6.32
2.68
4.68
1.98
.91
1.21
2.82
.34
2.24
1.23
.91
1.21
3.88
.45
2.03
1.23
-41.29
-49.58
-38.61
-83.21
-56.62
-37.88
0.00%
0.00%
37.59%
32.35%
-9.38%
0.00%
2007 2011
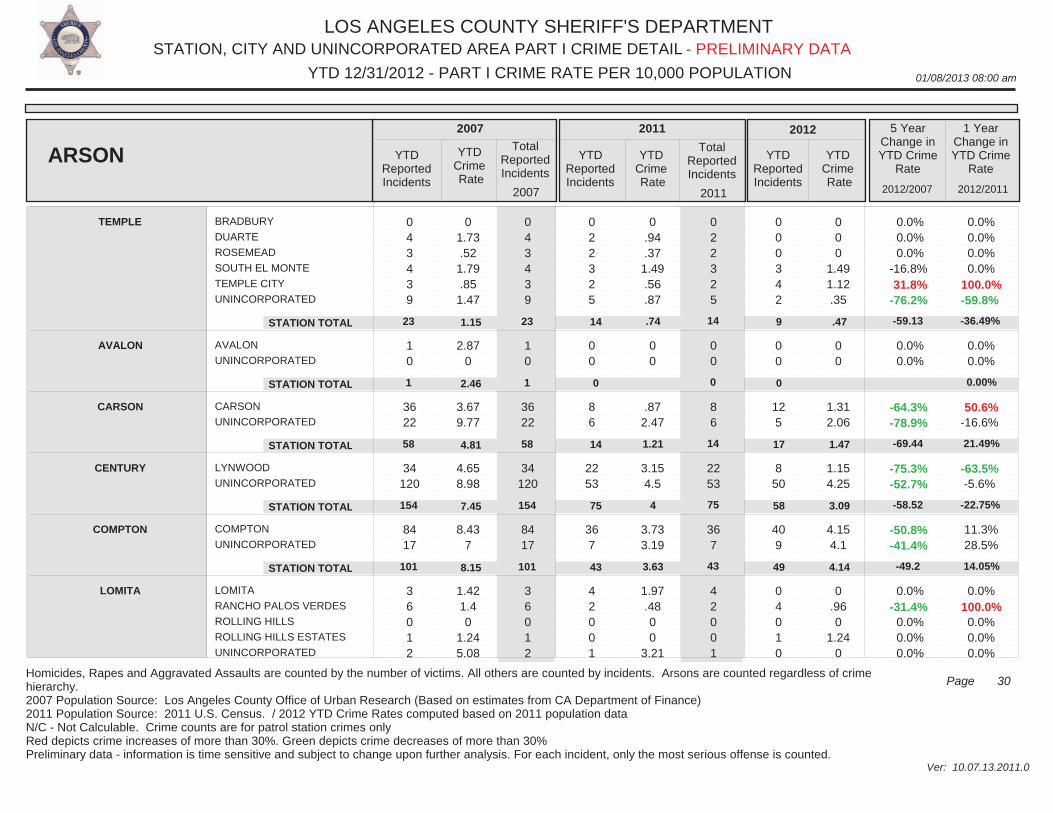
LOS ANGELES COUNTY SHERIFF'S DEPARTMENT
01/08/2013 08:00 am
STATION, CITY AND UNINCORPORATED AREA PART I CRIME DETAIL
Ver: 10.07.13.2011.0
YTD 12/31/2012 - PART I CRIME RATE PER 10,000 POPULATION
30Page
- PRELIMINARY DATA
Homicides, Rapes and Aggravated Assaults are counted by the number of victims. All others are counted by incidents. Arsons are counted regardless of crime hierarchy.2007 Population Source: Los Angeles County Office of Urban Research (Based on estimates from CA Department of Finance)2011 Population Source: 2011 U.S. Census. / 2012 YTD Crime Rates computed based on 2011 population dataN/C - Not Calculable. Crime counts are for patrol station crimes only Red depicts crime increases of more than 30%. Green depicts crime decreases of more than 30%Preliminary data - information is time sensitive and subject to change upon further analysis. For each incident, only the most serious offense is counted.
BRADBURY
DUARTE
ROSEMEAD
SOUTH EL MONTE
TEMPLE CITY
UNINCORPORATED
AVALON
UNINCORPORATED
CARSON
UNINCORPORATED
LYNWOOD
UNINCORPORATED
COMPTON
UNINCORPORATED
LOMITA
RANCHO PALOS VERDES
ROLLING HILLS
ROLLING HILLS ESTATES
UNINCORPORATED
0 4 3 4 3 9
1 0
36 22
34 120
84 17
3 6 0 1 2
0 4 3 4 3 9
1 0
36 22
34 120
84 17
3 6 0 1 2
0 2 2 3 2 5
0 0
8 6
22 53
36 7
4 2 0 0 1
0 2 2 3 2 5
0 0
8 6
22 53
36 7
4 2 0 0 1
0 0 0 3 4 2
0 0
12 5
8 50
40 9
0 4 0 1 0
01.73.52
1.79.85
1.47
2.870
3.679.77
4.658.98
8.437
1.421.40
1.245.08
0.94.37
1.49.56.87
00
.872.47
3.154.5
3.733.19
1.97.4800
3.21
000
1.491.12.35
00
1.312.06
1.154.25
4.154.1
0.960
1.240
0.0% 0.0% 0.0%
-16.8% 31.8%-76.2%
0.0% 0.0%
-64.3%-78.9%
-75.3%-52.7%
-50.8%-41.4%
0.0%-31.4% 0.0% 0.0% 0.0%
0.0% 0.0% 0.0% 0.0%
100.0%-59.8%
0.0% 0.0%
50.6%-16.6%
-63.5%-5.6%
11.3% 28.5%
0.0% 100.0% 0.0% 0.0% 0.0%
TEMPLE
AVALON
CARSON
CENTURY
COMPTON
LOMITA
ARSON YTDReportedIncidents
YTDCrime Rate
TotalReportedIncidents
YTDReportedIncidents
YTDCrime Rate
TotalReportedIncidents
YTDReportedIncidents
YTDCrime Rate
5 YearChange inYTD Crime
Rate
1 YearChange inYTD Crime
Rate
2007 2011 2012
2012/2007 2012/2011
STATION TOTAL
STATION TOTAL
STATION TOTAL
STATION TOTAL
STATION TOTAL
23
1
58
154
101
23
1
58
154
101
14
0
14
75
43
14
0
14
75
43
9
0
17
58
49
1.15
2.46
4.81
7.45
8.15
.74
1.21
4
3.63
.47
1.47
3.09
4.14
-59.13
-69.44
-58.52
-49.2
-36.49%
0.00%
21.49%
-22.75%
14.05%
2007 2011
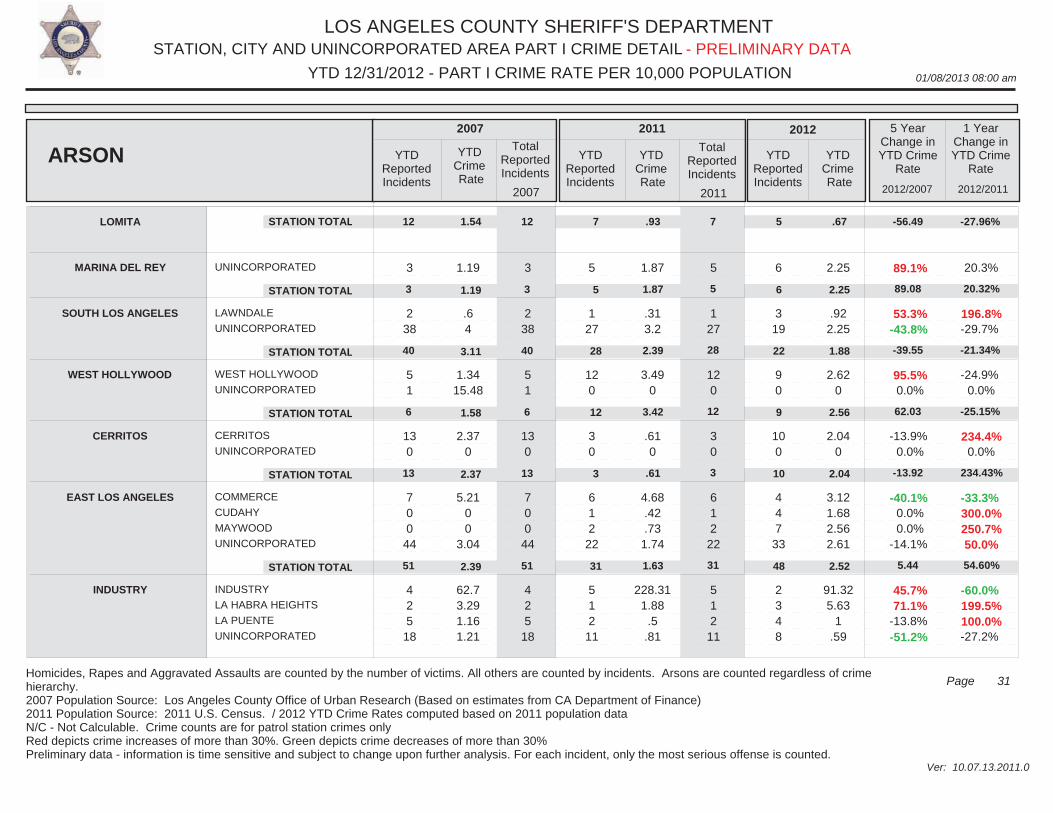
LOS ANGELES COUNTY SHERIFF'S DEPARTMENT
01/08/2013 08:00 am
STATION, CITY AND UNINCORPORATED AREA PART I CRIME DETAIL
Ver: 10.07.13.2011.0
YTD 12/31/2012 - PART I CRIME RATE PER 10,000 POPULATION
31Page
- PRELIMINARY DATA
Homicides, Rapes and Aggravated Assaults are counted by the number of victims. All others are counted by incidents. Arsons are counted regardless of crime hierarchy.2007 Population Source: Los Angeles County Office of Urban Research (Based on estimates from CA Department of Finance)2011 Population Source: 2011 U.S. Census. / 2012 YTD Crime Rates computed based on 2011 population dataN/C - Not Calculable. Crime counts are for patrol station crimes only Red depicts crime increases of more than 30%. Green depicts crime decreases of more than 30%Preliminary data - information is time sensitive and subject to change upon further analysis. For each incident, only the most serious offense is counted.
UNINCORPORATED
LAWNDALE
UNINCORPORATED
WEST HOLLYWOOD
UNINCORPORATED
CERRITOS
UNINCORPORATED
COMMERCE
CUDAHY
MAYWOOD
UNINCORPORATED
INDUSTRY
LA HABRA HEIGHTS
LA PUENTE
UNINCORPORATED
3
2 38
5 1
13 0
7 0 0
44
4 2 5
18
3
2 38
5 1
13 0
7 0 0
44
4 2 5
18
5
1 27
12 0
3 0
6 1 2
22
5 1 2
11
5
1 27
12 0
3 0
6 1 2
22
5 1 2
11
6
3 19
9 0
10 0
4 4 7 33
2 3 4 8
1.19
.64
1.3415.48
2.370
5.2100
3.04
62.73.291.161.21
1.87
.313.2
3.490
.610
4.68.42.73
1.74
228.311.88
.5.81
2.25
.922.25
2.620
2.040
3.121.682.562.61
91.325.63
1.59
89.1%
53.3%-43.8%
95.5% 0.0%
-13.9% 0.0%
-40.1% 0.0% 0.0%
-14.1%
45.7% 71.1%-13.8%-51.2%
20.3%
196.8%-29.7%
-24.9% 0.0%
234.4% 0.0%
-33.3% 300.0% 250.7% 50.0%
-60.0% 199.5% 100.0%-27.2%
LOMITA
MARINA DEL REY
SOUTH LOS ANGELES
WEST HOLLYWOOD
CERRITOS
EAST LOS ANGELES
INDUSTRY
ARSON YTDReportedIncidents
YTDCrime Rate
TotalReportedIncidents
YTDReportedIncidents
YTDCrime Rate
TotalReportedIncidents
YTDReportedIncidents
YTDCrime Rate
5 YearChange inYTD Crime
Rate
1 YearChange inYTD Crime
Rate
2007 2011 2012
2012/2007 2012/2011
STATION TOTAL
STATION TOTAL
STATION TOTAL
STATION TOTAL
STATION TOTAL
STATION TOTAL
12
3
40
6
13
51
12
3
40
6
13
51
7
5
28
12
3
31
7
5
28
12
3
31
5
6
22
9
10
48
1.54
1.19
3.11
1.58
2.37
2.39
.93
1.87
2.39
3.42
.61
1.63
.67
2.25
1.88
2.56
2.04
2.52
-56.49
89.08
-39.55
62.03
-13.92
5.44
-27.96%
20.32%
-21.34%
-25.15%
234.43%
54.60%
2007 2011
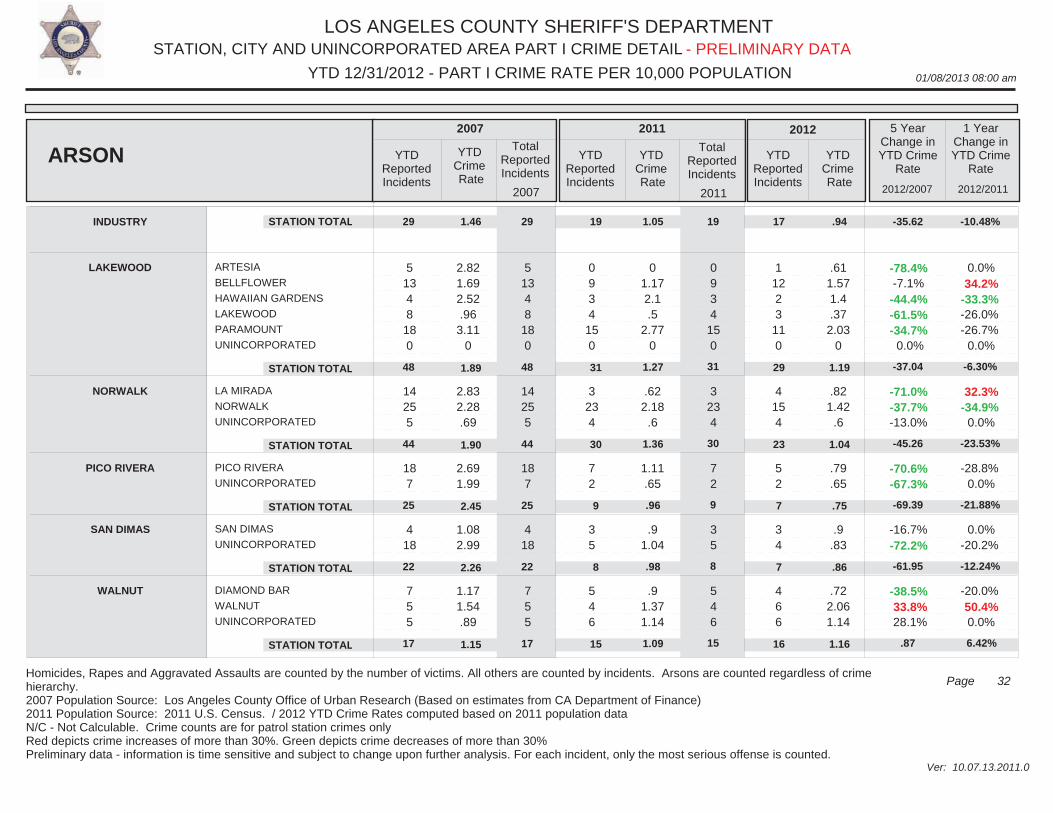
LOS ANGELES COUNTY SHERIFF'S DEPARTMENT
01/08/2013 08:00 am
STATION, CITY AND UNINCORPORATED AREA PART I CRIME DETAIL
Ver: 10.07.13.2011.0
YTD 12/31/2012 - PART I CRIME RATE PER 10,000 POPULATION
32Page
- PRELIMINARY DATA
Homicides, Rapes and Aggravated Assaults are counted by the number of victims. All others are counted by incidents. Arsons are counted regardless of crime hierarchy.2007 Population Source: Los Angeles County Office of Urban Research (Based on estimates from CA Department of Finance)2011 Population Source: 2011 U.S. Census. / 2012 YTD Crime Rates computed based on 2011 population dataN/C - Not Calculable. Crime counts are for patrol station crimes only Red depicts crime increases of more than 30%. Green depicts crime decreases of more than 30%Preliminary data - information is time sensitive and subject to change upon further analysis. For each incident, only the most serious offense is counted.
ARTESIA
BELLFLOWER
HAWAIIAN GARDENS
LAKEWOOD
PARAMOUNT
UNINCORPORATED
LA MIRADA
NORWALK
UNINCORPORATED
PICO RIVERA
UNINCORPORATED
SAN DIMAS
UNINCORPORATED
DIAMOND BAR
WALNUT
UNINCORPORATED
5 13 4 8
18 0
14 25 5
18 7
4 18
7 5 5
5 13 4 8
18 0
14 25 5
18 7
4 18
7 5 5
0 9 3 4
15 0
3 23 4
7 2
3 5
5 4 6
0 9 3 4
15 0
3 23 4
7 2
3 5
5 4 6
1 12 2 3 11 0
4 15 4
5 2
3 4
4 6 6
2.821.692.52.96
3.110
2.832.28.69
2.691.99
1.082.99
1.171.54.89
01.172.1.5
2.770
.622.18
.6
1.11.65
.91.04
.91.371.14
.611.571.4.37
2.030
.821.42
.6
.79
.65
.9.83
.722.061.14
-78.4%-7.1%-44.4%-61.5%-34.7% 0.0%
-71.0%-37.7%-13.0%
-70.6%-67.3%
-16.7%-72.2%
-38.5% 33.8% 28.1%
0.0% 34.2%-33.3%-26.0%-26.7% 0.0%
32.3%-34.9% 0.0%
-28.8% 0.0%
0.0%-20.2%
-20.0% 50.4% 0.0%
INDUSTRY
LAKEWOOD
NORWALK
PICO RIVERA
SAN DIMAS
WALNUT
ARSON YTDReportedIncidents
YTDCrime Rate
TotalReportedIncidents
YTDReportedIncidents
YTDCrime Rate
TotalReportedIncidents
YTDReportedIncidents
YTDCrime Rate
5 YearChange inYTD Crime
Rate
1 YearChange inYTD Crime
Rate
2007 2011 2012
2012/2007 2012/2011
STATION TOTAL
STATION TOTAL
STATION TOTAL
STATION TOTAL
STATION TOTAL
STATION TOTAL
29
48
44
25
22
17
29
48
44
25
22
17
19
31
30
9
8
15
19
31
30
9
8
15
17
29
23
7
7
16
1.46
1.89
1.90
2.45
2.26
1.15
1.05
1.27
1.36
.96
.98
1.09
.94
1.19
1.04
.75
.86
1.16
-35.62
-37.04
-45.26
-69.39
-61.95
.87
-10.48%
-6.30%
-23.53%
-21.88%
-12.24%
6.42%
2007 2011
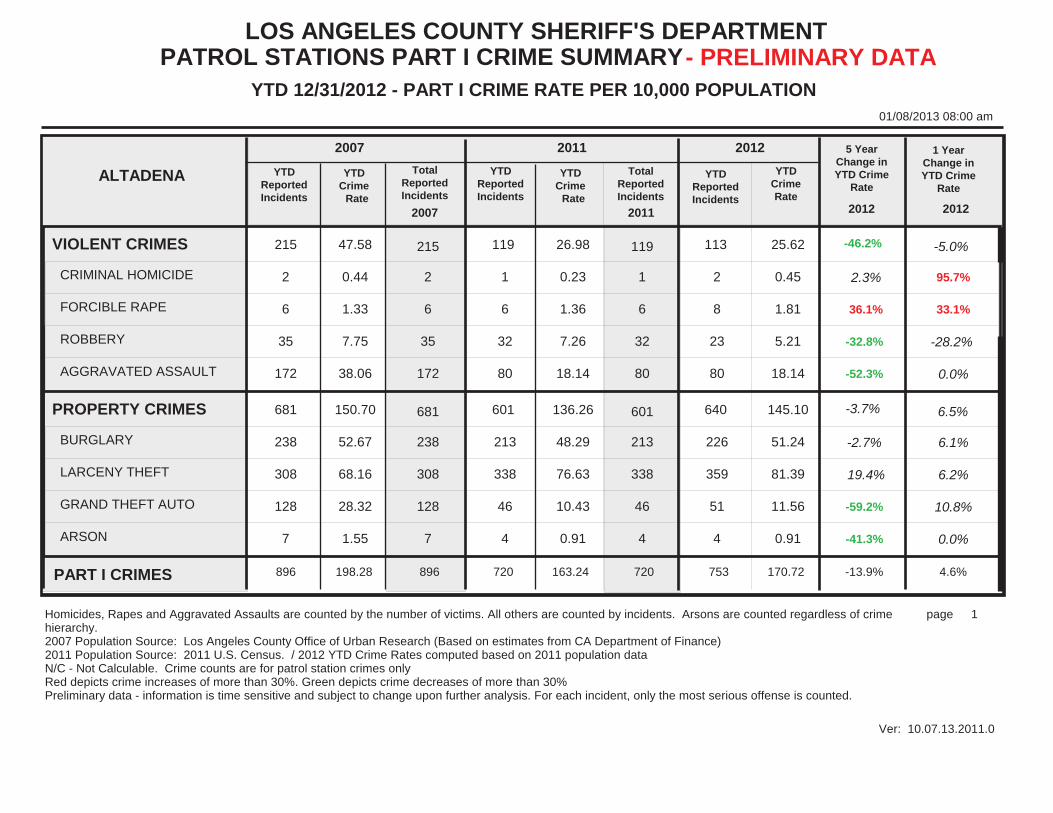
LOS ANGELES COUNTY SHERIFF'S DEPARTMENT
YTD 12/31/2012 - PART I CRIME RATE PER 10,000 POPULATION 01/08/2013 08:00 am
Ver: 10.07.13.2011.0
1page
PATROL STATIONS PART I CRIME SUMMARY- PRELIMINARY DATA
Homicides, Rapes and Aggravated Assaults are counted by the number of victims. All others are counted by incidents. Arsons are counted regardless of crime hierarchy.2007 Population Source: Los Angeles County Office of Urban Research (Based on estimates from CA Department of Finance)2011 Population Source: 2011 U.S. Census. / 2012 YTD Crime Rates computed based on 2011 population dataN/C - Not Calculable. Crime counts are for patrol station crimes only Red depicts crime increases of more than 30%. Green depicts crime decreases of more than 30%Preliminary data - information is time sensitive and subject to change upon further analysis. For each incident, only the most serious offense is counted.
ALTADENA
VIOLENT CRIMES
PROPERTY CRIMES
CRIMINAL HOMICIDE
FORCIBLE RAPE
ROBBERY
AGGRAVATED ASSAULT
BURGLARY
LARCENY THEFT
GRAND THEFT AUTO
ARSON
215
681
47.58
150.70
215
681
YTDReportedIncidents
YTDCrime Rate
TotalReportedIncidents
YTDReportedIncidents
YTDCrime Rate
TotalReportedIncidents
YTDReportedIncidents
YTDCrimeRate
5 YearChange inYTD Crime
Rate
1 YearChange inYTD Crime
Rate
119
601
26.98
136.26
119
601
113
640
25.62
145.10
2
6
35
172
238
308
128
7
0.44
1.33
7.75
38.06
52.67
68.16
28.32
1.55
2
6
35
172
238
308
128
7
1
6
32
80
213
338
46
4
0.23
1.36
7.26
18.14
48.29
76.63
10.43
0.91
1
6
32
80
213
338
46
4
2
8
23
80
226
359
51
4
0.45
1.81
5.21
18.14
51.24
81.39
11.56
0.91
-46.2%
-3.7%
2.3%
36.1%
-32.8%
-52.3%
-2.7%
19.4%
-59.2%
-41.3%
-5.0%
6.5%
95.7%
33.1%
-28.2%
0.0%
6.1%
6.2%
10.8%
0.0%
2007 2011 2012
2007 2011 2012 2012
896PART I CRIMES 720 753198.28 163.24 170.72 896 720 -13.9% 4.6%

LOS ANGELES COUNTY SHERIFF'S DEPARTMENT
YTD 12/31/2012 - PART I CRIME RATE PER 10,000 POPULATION 01/08/2013 08:00 am
Ver: 10.07.13.2011.0
2page
PATROL STATIONS PART I CRIME SUMMARY- PRELIMINARY DATA
Homicides, Rapes and Aggravated Assaults are counted by the number of victims. All others are counted by incidents. Arsons are counted regardless of crime hierarchy.2007 Population Source: Los Angeles County Office of Urban Research (Based on estimates from CA Department of Finance)2011 Population Source: 2011 U.S. Census. / 2012 YTD Crime Rates computed based on 2011 population dataN/C - Not Calculable. Crime counts are for patrol station crimes only Red depicts crime increases of more than 30%. Green depicts crime decreases of more than 30%Preliminary data - information is time sensitive and subject to change upon further analysis. For each incident, only the most serious offense is counted.
AVALON
VIOLENT CRIMES
PROPERTY CRIMES
CRIMINAL HOMICIDE
FORCIBLE RAPE
ROBBERY
AGGRAVATED ASSAULT
BURGLARY
LARCENY THEFT
GRAND THEFT AUTO
ARSON
43
173
105.57
424.75
43
173
YTDReportedIncidents
YTDCrime Rate
TotalReportedIncidents
YTDReportedIncidents
YTDCrime Rate
TotalReportedIncidents
YTDReportedIncidents
YTDCrimeRate
5 YearChange inYTD Crime
Rate
1 YearChange inYTD Crime
Rate
20
56
48.83
136.72
20
56
19
70
46.39
170.90
0
3
5
35
43
88
41
1
0.00
7.37
12.28
85.93
105.57
216.06
100.66
2.46
0
3
5
35
43
88
41
1
0
1
2
17
13
33
10
0
0.00
2.44
4.88
41.50
31.74
80.57
24.41
0.00
0
1
2
17
13
33
10
0
0
0
3
16
11
45
14
0
0.00
0.00
7.32
39.06
26.86
109.86
34.18
0.00
-56.1%
-59.8%
0.0%
0.0%
-40.4%
-54.5%
-74.6%
-49.2%
-66.0%
0.0%
-5.0%
25.0%
0.0%
0.0%
50.0%
-5.9%
-15.4%
36.4%
40.0%
0.0%
2007 2011 2012
2007 2011 2012 2012
216PART I CRIMES 76 89530.32 185.55 217.29 216 76 -59.0% 17.1%

LOS ANGELES COUNTY SHERIFF'S DEPARTMENT
YTD 12/31/2012 - PART I CRIME RATE PER 10,000 POPULATION 01/08/2013 08:00 am
Ver: 10.07.13.2011.0
3page
PATROL STATIONS PART I CRIME SUMMARY- PRELIMINARY DATA
Homicides, Rapes and Aggravated Assaults are counted by the number of victims. All others are counted by incidents. Arsons are counted regardless of crime hierarchy.2007 Population Source: Los Angeles County Office of Urban Research (Based on estimates from CA Department of Finance)2011 Population Source: 2011 U.S. Census. / 2012 YTD Crime Rates computed based on 2011 population dataN/C - Not Calculable. Crime counts are for patrol station crimes only Red depicts crime increases of more than 30%. Green depicts crime decreases of more than 30%Preliminary data - information is time sensitive and subject to change upon further analysis. For each incident, only the most serious offense is counted.
CARSON
VIOLENT CRIMES
PROPERTY CRIMES
CRIMINAL HOMICIDE
FORCIBLE RAPE
ROBBERY
AGGRAVATED ASSAULT
BURGLARY
LARCENY THEFT
GRAND THEFT AUTO
ARSON
837
3,523
69.39
292.09
837
3,523
YTDReportedIncidents
YTDCrime Rate
TotalReportedIncidents
YTDReportedIncidents
YTDCrime Rate
TotalReportedIncidents
YTDReportedIncidents
YTDCrimeRate
5 YearChange inYTD Crime
Rate
1 YearChange inYTD Crime
Rate
533
3225
45.94
277.99
533
3,225
651
3458
56.12
298.08
16
19
272
530
557
2,101
807
58
1.33
1.58
22.55
43.94
46.18
174.19
66.91
4.81
16
19
272
530
557
2,101
807
58
5
14
129
385
724
1,797
690
14
0.43
1.21
11.12
33.19
62.41
154.90
59.48
1.21
5
14
129
385
724
1,797
690
14
11
15
179
446
747
1,982
712
17
0.95
1.29
15.43
38.44
64.39
170.85
61.37
1.47
-19.1%
2.1%
-28.6%
-18.4%
-31.6%
-12.5%
39.4%
-1.9%
-8.3%
-69.4%
22.2%
7.2%
120.9%
6.6%
38.8%
15.8%
3.2%
10.3%
3.2%
21.5%
2007 2011 2012
2007 2011 2012 2012
4,360PART I CRIMES 3,758 4,109361.48 323.93 354.2 4,360 3,758 -2.0% 9.3%

LOS ANGELES COUNTY SHERIFF'S DEPARTMENT
YTD 12/31/2012 - PART I CRIME RATE PER 10,000 POPULATION 01/08/2013 08:00 am
Ver: 10.07.13.2011.0
4page
PATROL STATIONS PART I CRIME SUMMARY- PRELIMINARY DATA
Homicides, Rapes and Aggravated Assaults are counted by the number of victims. All others are counted by incidents. Arsons are counted regardless of crime hierarchy.2007 Population Source: Los Angeles County Office of Urban Research (Based on estimates from CA Department of Finance)2011 Population Source: 2011 U.S. Census. / 2012 YTD Crime Rates computed based on 2011 population dataN/C - Not Calculable. Crime counts are for patrol station crimes only Red depicts crime increases of more than 30%. Green depicts crime decreases of more than 30%Preliminary data - information is time sensitive and subject to change upon further analysis. For each incident, only the most serious offense is counted.
CENTURY
VIOLENT CRIMES
PROPERTY CRIMES
CRIMINAL HOMICIDE
FORCIBLE RAPE
ROBBERY
AGGRAVATED ASSAULT
BURGLARY
LARCENY THEFT
GRAND THEFT AUTO
ARSON
2,431
4,866
117.54
235.28
2,431
4,866
YTDReportedIncidents
YTDCrime Rate
TotalReportedIncidents
YTDReportedIncidents
YTDCrime Rate
TotalReportedIncidents
YTDReportedIncidents
YTDCrimeRate
5 YearChange inYTD Crime
Rate
1 YearChange inYTD Crime
Rate
1822
3961
97.18
211.26
1,822
3,961
1732
3948
92.38
210.57
38
71
842
1,480
1,102
1,435
2,175
154
1.84
3.43
40.71
71.56
53.28
69.38
105.16
7.45
38
71
842
1,480
1,102
1,435
2,175
154
35
43
724
1,020
1,086
1,389
1,411
75
1.87
2.29
38.61
54.40
57.92
74.08
75.26
4.00
35
43
724
1,020
1,086
1,389
1,411
75
25
55
667
985
1,066
1,479
1,345
58
1.33
2.93
35.57
52.54
56.86
78.88
71.74
3.09
-21.4%
-10.5%
-27.7%
-14.6%
-12.6%
-26.6%
6.7%
13.7%
-31.8%
-58.5%
-4.9%
-0.3%
-28.9%
28.0%
-7.9%
-3.4%
-1.8%
6.5%
-4.7%
-22.8%
2007 2011 2012
2007 2011 2012 2012
7,297PART I CRIMES 5,783 5,680352.82 308.44 302.95 7,297 5,783 -14.1% -1.8%
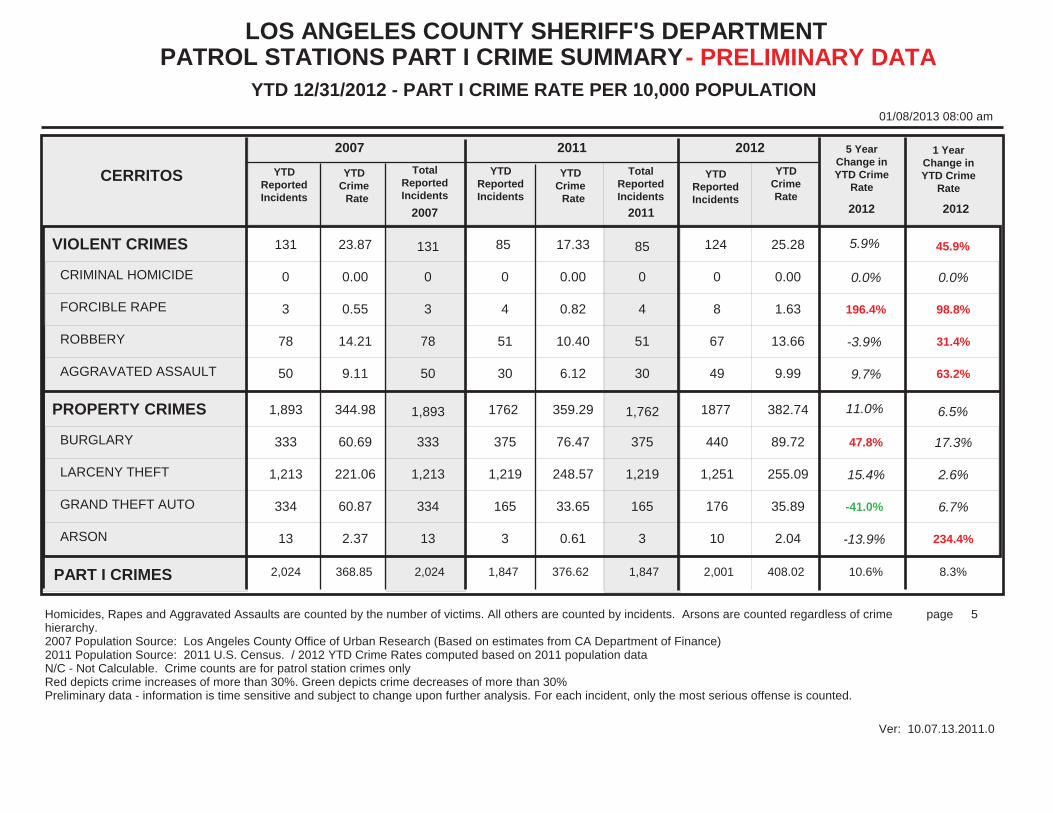
LOS ANGELES COUNTY SHERIFF'S DEPARTMENT
YTD 12/31/2012 - PART I CRIME RATE PER 10,000 POPULATION 01/08/2013 08:00 am
Ver: 10.07.13.2011.0
5page
PATROL STATIONS PART I CRIME SUMMARY- PRELIMINARY DATA
Homicides, Rapes and Aggravated Assaults are counted by the number of victims. All others are counted by incidents. Arsons are counted regardless of crime hierarchy.2007 Population Source: Los Angeles County Office of Urban Research (Based on estimates from CA Department of Finance)2011 Population Source: 2011 U.S. Census. / 2012 YTD Crime Rates computed based on 2011 population dataN/C - Not Calculable. Crime counts are for patrol station crimes only Red depicts crime increases of more than 30%. Green depicts crime decreases of more than 30%Preliminary data - information is time sensitive and subject to change upon further analysis. For each incident, only the most serious offense is counted.
CERRITOS
VIOLENT CRIMES
PROPERTY CRIMES
CRIMINAL HOMICIDE
FORCIBLE RAPE
ROBBERY
AGGRAVATED ASSAULT
BURGLARY
LARCENY THEFT
GRAND THEFT AUTO
ARSON
131
1,893
23.87
344.98
131
1,893
YTDReportedIncidents
YTDCrime Rate
TotalReportedIncidents
YTDReportedIncidents
YTDCrime Rate
TotalReportedIncidents
YTDReportedIncidents
YTDCrimeRate
5 YearChange inYTD Crime
Rate
1 YearChange inYTD Crime
Rate
85
1762
17.33
359.29
85
1,762
124
1877
25.28
382.74
0
3
78
50
333
1,213
334
13
0.00
0.55
14.21
9.11
60.69
221.06
60.87
2.37
0
3
78
50
333
1,213
334
13
0
4
51
30
375
1,219
165
3
0.00
0.82
10.40
6.12
76.47
248.57
33.65
0.61
0
4
51
30
375
1,219
165
3
0
8
67
49
440
1,251
176
10
0.00
1.63
13.66
9.99
89.72
255.09
35.89
2.04
5.9%
11.0%
0.0%
196.4%
-3.9%
9.7%
47.8%
15.4%
-41.0%
-13.9%
45.9%
6.5%
0.0%
98.8%
31.4%
63.2%
17.3%
2.6%
6.7%
234.4%
2007 2011 2012
2007 2011 2012 2012
2,024PART I CRIMES 1,847 2,001368.85 376.62 408.02 2,024 1,847 10.6% 8.3%

LOS ANGELES COUNTY SHERIFF'S DEPARTMENT
YTD 12/31/2012 - PART I CRIME RATE PER 10,000 POPULATION 01/08/2013 08:00 am
Ver: 10.07.13.2011.0
6page
PATROL STATIONS PART I CRIME SUMMARY- PRELIMINARY DATA
Homicides, Rapes and Aggravated Assaults are counted by the number of victims. All others are counted by incidents. Arsons are counted regardless of crime hierarchy.2007 Population Source: Los Angeles County Office of Urban Research (Based on estimates from CA Department of Finance)2011 Population Source: 2011 U.S. Census. / 2012 YTD Crime Rates computed based on 2011 population dataN/C - Not Calculable. Crime counts are for patrol station crimes only Red depicts crime increases of more than 30%. Green depicts crime decreases of more than 30%Preliminary data - information is time sensitive and subject to change upon further analysis. For each incident, only the most serious offense is counted.
COMPTON
VIOLENT CRIMES
PROPERTY CRIMES
CRIMINAL HOMICIDE
FORCIBLE RAPE
ROBBERY
AGGRAVATED ASSAULT
BURGLARY
LARCENY THEFT
GRAND THEFT AUTO
ARSON
1,990
3,564
160.54
287.51
1,990
3,564
YTDReportedIncidents
YTDCrime Rate
TotalReportedIncidents
YTDReportedIncidents
YTDCrime Rate
TotalReportedIncidents
YTDReportedIncidents
YTDCrimeRate
5 YearChange inYTD Crime
Rate
1 YearChange inYTD Crime
Rate
1310
3420
110.62
288.79
1,310
3,420
1409
3086
118.98
260.59
45
52
564
1,329
760
1,298
1,405
101
3.63
4.19
45.50
107.21
61.31
104.71
113.34
8.15
45
52
564
1,329
760
1,298
1,405
101
25
52
443
790
916
1,410
1,051
43
2.11
4.39
37.41
66.71
77.35
119.06
88.75
3.63
25
52
443
790
916
1,410
1,051
43
31
36
488
854
736
1,222
1,079
49
2.62
3.04
41.21
72.11
62.15
103.19
91.11
4.14
-25.9%
-9.4%
-27.8%
-27.5%
-9.4%
-32.7%
1.4%
-1.5%
-19.6%
-49.2%
7.6%
-9.8%
24.2%
-30.8%
10.2%
8.1%
-19.7%
-13.3%
2.7%
14.1%
2007 2011 2012
2007 2011 2012 2012
5,554PART I CRIMES 4,730 4,495448.05 399.41 379.57 5,554 4,730 -15.3% -5.0%

LOS ANGELES COUNTY SHERIFF'S DEPARTMENT
YTD 12/31/2012 - PART I CRIME RATE PER 10,000 POPULATION 01/08/2013 08:00 am
Ver: 10.07.13.2011.0
7page
PATROL STATIONS PART I CRIME SUMMARY- PRELIMINARY DATA
Homicides, Rapes and Aggravated Assaults are counted by the number of victims. All others are counted by incidents. Arsons are counted regardless of crime hierarchy.2007 Population Source: Los Angeles County Office of Urban Research (Based on estimates from CA Department of Finance)2011 Population Source: 2011 U.S. Census. / 2012 YTD Crime Rates computed based on 2011 population dataN/C - Not Calculable. Crime counts are for patrol station crimes only Red depicts crime increases of more than 30%. Green depicts crime decreases of more than 30%Preliminary data - information is time sensitive and subject to change upon further analysis. For each incident, only the most serious offense is counted.
CRESCENTA VALLEY
VIOLENT CRIMES
PROPERTY CRIMES
CRIMINAL HOMICIDE
FORCIBLE RAPE
ROBBERY
AGGRAVATED ASSAULT
BURGLARY
LARCENY THEFT
GRAND THEFT AUTO
ARSON
82
853
19.67
204.63
82
853
YTDReportedIncidents
YTDCrime Rate
TotalReportedIncidents
YTDReportedIncidents
YTDCrime Rate
TotalReportedIncidents
YTDReportedIncidents
YTDCrimeRate
5 YearChange inYTD Crime
Rate
1 YearChange inYTD Crime
Rate
49
608
11.82
146.72
49
608
55
574
13.27
138.51
1
5
22
54
265
525
53
10
0.24
1.20
5.28
12.95
63.57
125.94
12.71
2.40
1
5
22
54
265
525
53
10
3
3
11
32
169
406
28
5
0.72
0.72
2.65
7.72
40.78
97.97
6.76
1.21
3
3
11
32
169
406
28
5
2
4
11
38
203
323
43
5
0.48
0.97
2.65
9.17
48.99
77.94
10.38
1.21
-32.5%
-32.3%
100.0%
-19.2%
-49.8%
-29.2%
-22.9%
-38.1%
-18.3%
-49.6%
12.3%
-5.6%
-33.3%
34.7%
0.0%
18.8%
20.1%
-20.5%
53.6%
0.0%
2007 2011 2012
2007 2011 2012 2012
935PART I CRIMES 657 629224.3 158.54 151.78 935 657 -32.3% -4.3%
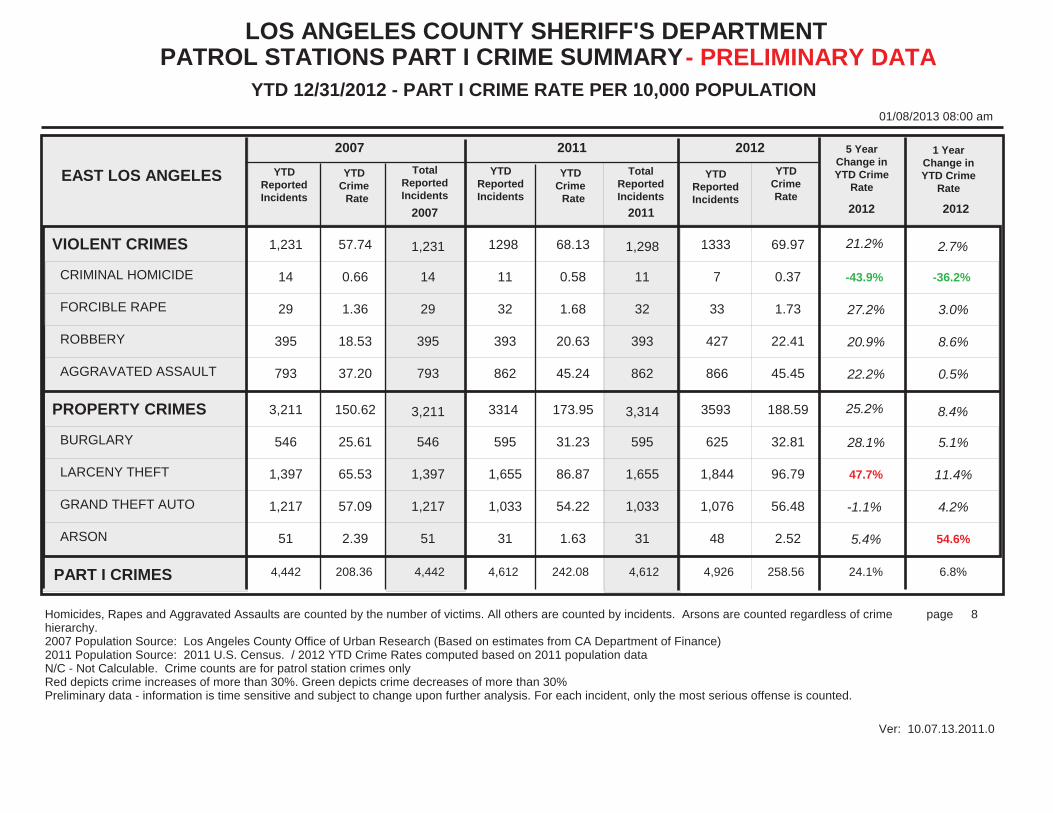
LOS ANGELES COUNTY SHERIFF'S DEPARTMENT
YTD 12/31/2012 - PART I CRIME RATE PER 10,000 POPULATION 01/08/2013 08:00 am
Ver: 10.07.13.2011.0
8page
PATROL STATIONS PART I CRIME SUMMARY- PRELIMINARY DATA
Homicides, Rapes and Aggravated Assaults are counted by the number of victims. All others are counted by incidents. Arsons are counted regardless of crime hierarchy.2007 Population Source: Los Angeles County Office of Urban Research (Based on estimates from CA Department of Finance)2011 Population Source: 2011 U.S. Census. / 2012 YTD Crime Rates computed based on 2011 population dataN/C - Not Calculable. Crime counts are for patrol station crimes only Red depicts crime increases of more than 30%. Green depicts crime decreases of more than 30%Preliminary data - information is time sensitive and subject to change upon further analysis. For each incident, only the most serious offense is counted.
EAST LOS ANGELES
VIOLENT CRIMES
PROPERTY CRIMES
CRIMINAL HOMICIDE
FORCIBLE RAPE
ROBBERY
AGGRAVATED ASSAULT
BURGLARY
LARCENY THEFT
GRAND THEFT AUTO
ARSON
1,231
3,211
57.74
150.62
1,231
3,211
YTDReportedIncidents
YTDCrime Rate
TotalReportedIncidents
YTDReportedIncidents
YTDCrime Rate
TotalReportedIncidents
YTDReportedIncidents
YTDCrimeRate
5 YearChange inYTD Crime
Rate
1 YearChange inYTD Crime
Rate
1298
3314
68.13
173.95
1,298
3,314
1333
3593
69.97
188.59
14
29
395
793
546
1,397
1,217
51
0.66
1.36
18.53
37.20
25.61
65.53
57.09
2.39
14
29
395
793
546
1,397
1,217
51
11
32
393
862
595
1,655
1,033
31
0.58
1.68
20.63
45.24
31.23
86.87
54.22
1.63
11
32
393
862
595
1,655
1,033
31
7
33
427
866
625
1,844
1,076
48
0.37
1.73
22.41
45.45
32.81
96.79
56.48
2.52
21.2%
25.2%
-43.9%
27.2%
20.9%
22.2%
28.1%
47.7%
-1.1%
5.4%
2.7%
8.4%
-36.2%
3.0%
8.6%
0.5%
5.1%
11.4%
4.2%
54.6%
2007 2011 2012
2007 2011 2012 2012
4,442PART I CRIMES 4,612 4,926208.36 242.08 258.56 4,442 4,612 24.1% 6.8%

LOS ANGELES COUNTY SHERIFF'S DEPARTMENT
YTD 12/31/2012 - PART I CRIME RATE PER 10,000 POPULATION 01/08/2013 08:00 am
Ver: 10.07.13.2011.0
9page
PATROL STATIONS PART I CRIME SUMMARY- PRELIMINARY DATA
Homicides, Rapes and Aggravated Assaults are counted by the number of victims. All others are counted by incidents. Arsons are counted regardless of crime hierarchy.2007 Population Source: Los Angeles County Office of Urban Research (Based on estimates from CA Department of Finance)2011 Population Source: 2011 U.S. Census. / 2012 YTD Crime Rates computed based on 2011 population dataN/C - Not Calculable. Crime counts are for patrol station crimes only Red depicts crime increases of more than 30%. Green depicts crime decreases of more than 30%Preliminary data - information is time sensitive and subject to change upon further analysis. For each incident, only the most serious offense is counted.
INDUSTRY
VIOLENT CRIMES
PROPERTY CRIMES
CRIMINAL HOMICIDE
FORCIBLE RAPE
ROBBERY
AGGRAVATED ASSAULT
BURGLARY
LARCENY THEFT
GRAND THEFT AUTO
ARSON
801
4,653
40.43
234.86
801
4,653
YTDReportedIncidents
YTDCrime Rate
TotalReportedIncidents
YTDReportedIncidents
YTDCrime Rate
TotalReportedIncidents
YTDReportedIncidents
YTDCrimeRate
5 YearChange inYTD Crime
Rate
1 YearChange inYTD Crime
Rate
496
3386
27.28
186.26
496
3,386
507
3413
27.89
187.74
14
37
270
480
1,038
2,481
1,105
29
0.71
1.87
13.63
24.23
52.39
125.23
55.78
1.46
14
37
270
480
1,038
2,481
1,105
29
8
27
143
318
798
1,803
766
19
0.44
1.49
7.87
17.49
43.90
99.18
42.14
1.05
8
27
143
318
798
1,803
766
19
5
18
154
330
815
1,877
704
17
0.28
0.99
8.47
18.15
44.83
103.25
38.73
0.94
-31.0%
-20.1%
-60.6%
-47.1%
-37.9%
-25.1%
-14.4%
-17.6%
-30.6%
-35.6%
2.2%
0.8%
-36.4%
-33.6%
7.6%
3.8%
2.1%
4.1%
-8.1%
-10.5%
2007 2011 2012
2007 2011 2012 2012
5,454PART I CRIMES 3,882 3,920275.29 213.54 215.63 5,454 3,882 -21.7% 1.0%

LOS ANGELES COUNTY SHERIFF'S DEPARTMENT
YTD 12/31/2012 - PART I CRIME RATE PER 10,000 POPULATION 01/08/2013 08:00 am
Ver: 10.07.13.2011.0
10page
PATROL STATIONS PART I CRIME SUMMARY- PRELIMINARY DATA
Homicides, Rapes and Aggravated Assaults are counted by the number of victims. All others are counted by incidents. Arsons are counted regardless of crime hierarchy.2007 Population Source: Los Angeles County Office of Urban Research (Based on estimates from CA Department of Finance)2011 Population Source: 2011 U.S. Census. / 2012 YTD Crime Rates computed based on 2011 population dataN/C - Not Calculable. Crime counts are for patrol station crimes only Red depicts crime increases of more than 30%. Green depicts crime decreases of more than 30%Preliminary data - information is time sensitive and subject to change upon further analysis. For each incident, only the most serious offense is counted.
LAKEWOOD
VIOLENT CRIMES
PROPERTY CRIMES
CRIMINAL HOMICIDE
FORCIBLE RAPE
ROBBERY
AGGRAVATED ASSAULT
BURGLARY
LARCENY THEFT
GRAND THEFT AUTO
ARSON
1,684
7,741
66.41
305.29
1,684
7,741
YTDReportedIncidents
YTDCrime Rate
TotalReportedIncidents
YTDReportedIncidents
YTDCrime Rate
TotalReportedIncidents
YTDReportedIncidents
YTDCrimeRate
5 YearChange inYTD Crime
Rate
1 YearChange inYTD Crime
Rate
898
5950
36.84
244.13
898
5,950
953
6119
39.10
251.06
20
60
809
795
1,548
4,175
1,970
48
0.79
2.37
31.91
31.35
61.05
164.65
77.69
1.89
20
60
809
795
1,548
4,175
1,970
48
7
34
407
450
1,233
3,407
1,279
31
0.29
1.40
16.70
18.46
50.59
139.79
52.48
1.27
7
34
407
450
1,233
3,407
1,279
31
10
34
434
475
1,242
3,494
1,354
29
0.41
1.40
17.81
19.49
50.96
143.36
55.55
1.19
-41.1%
-17.8%
-48.1%
-40.9%
-44.2%
-37.8%
-16.5%
-12.9%
-28.5%
-37.0%
6.1%
2.8%
41.4%
0.0%
6.7%
5.6%
0.7%
2.6%
5.9%
-6.3%
2007 2011 2012
2007 2011 2012 2012
9,425PART I CRIMES 6,848 7,072371.7 280.97 290.16 9,425 6,848 -21.9% 3.3%
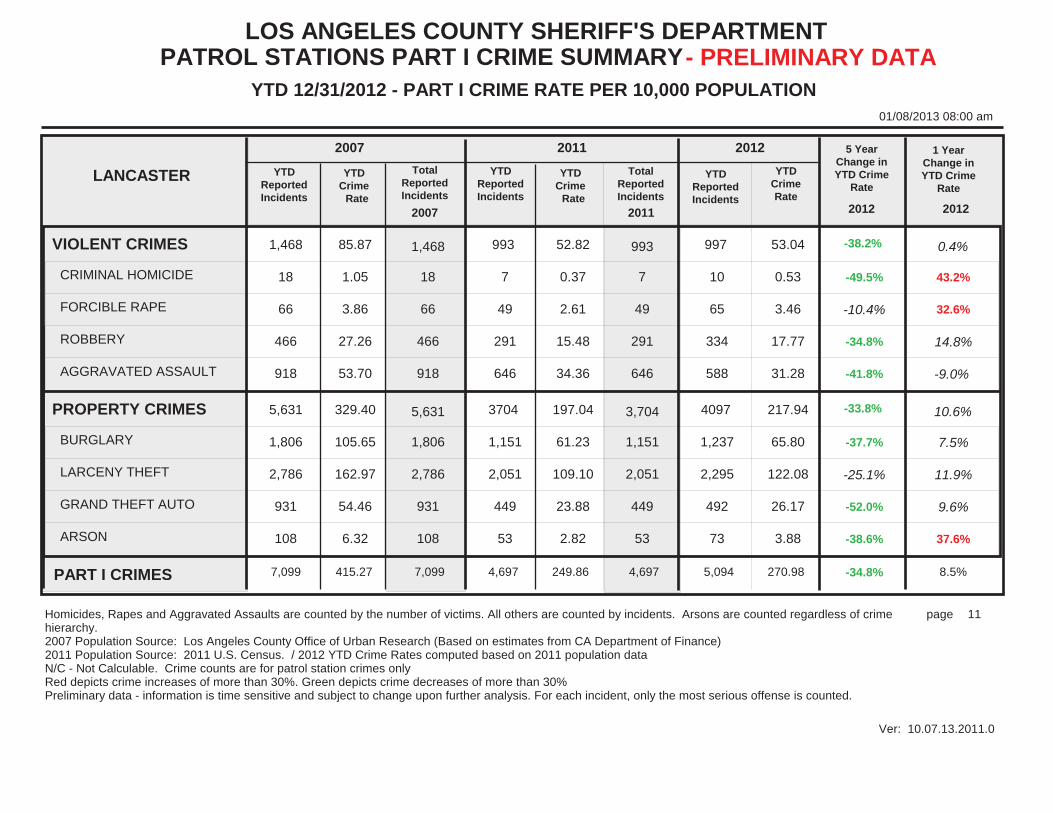
LOS ANGELES COUNTY SHERIFF'S DEPARTMENT
YTD 12/31/2012 - PART I CRIME RATE PER 10,000 POPULATION 01/08/2013 08:00 am
Ver: 10.07.13.2011.0
11page
PATROL STATIONS PART I CRIME SUMMARY- PRELIMINARY DATA
Homicides, Rapes and Aggravated Assaults are counted by the number of victims. All others are counted by incidents. Arsons are counted regardless of crime hierarchy.2007 Population Source: Los Angeles County Office of Urban Research (Based on estimates from CA Department of Finance)2011 Population Source: 2011 U.S. Census. / 2012 YTD Crime Rates computed based on 2011 population dataN/C - Not Calculable. Crime counts are for patrol station crimes only Red depicts crime increases of more than 30%. Green depicts crime decreases of more than 30%Preliminary data - information is time sensitive and subject to change upon further analysis. For each incident, only the most serious offense is counted.
LANCASTER
VIOLENT CRIMES
PROPERTY CRIMES
CRIMINAL HOMICIDE
FORCIBLE RAPE
ROBBERY
AGGRAVATED ASSAULT
BURGLARY
LARCENY THEFT
GRAND THEFT AUTO
ARSON
1,468
5,631
85.87
329.40
1,468
5,631
YTDReportedIncidents
YTDCrime Rate
TotalReportedIncidents
YTDReportedIncidents
YTDCrime Rate
TotalReportedIncidents
YTDReportedIncidents
YTDCrimeRate
5 YearChange inYTD Crime
Rate
1 YearChange inYTD Crime
Rate
993
3704
52.82
197.04
993
3,704
997
4097
53.04
217.94
18
66
466
918
1,806
2,786
931
108
1.05
3.86
27.26
53.70
105.65
162.97
54.46
6.32
18
66
466
918
1,806
2,786
931
108
7
49
291
646
1,151
2,051
449
53
0.37
2.61
15.48
34.36
61.23
109.10
23.88
2.82
7
49
291
646
1,151
2,051
449
53
10
65
334
588
1,237
2,295
492
73
0.53
3.46
17.77
31.28
65.80
122.08
26.17
3.88
-38.2%
-33.8%
-49.5%
-10.4%
-34.8%
-41.8%
-37.7%
-25.1%
-52.0%
-38.6%
0.4%
10.6%
43.2%
32.6%
14.8%
-9.0%
7.5%
11.9%
9.6%
37.6%
2007 2011 2012
2007 2011 2012 2012
7,099PART I CRIMES 4,697 5,094415.27 249.86 270.98 7,099 4,697 -34.8% 8.5%

LOS ANGELES COUNTY SHERIFF'S DEPARTMENT
YTD 12/31/2012 - PART I CRIME RATE PER 10,000 POPULATION 01/08/2013 08:00 am
Ver: 10.07.13.2011.0
12page
PATROL STATIONS PART I CRIME SUMMARY- PRELIMINARY DATA
Homicides, Rapes and Aggravated Assaults are counted by the number of victims. All others are counted by incidents. Arsons are counted regardless of crime hierarchy.2007 Population Source: Los Angeles County Office of Urban Research (Based on estimates from CA Department of Finance)2011 Population Source: 2011 U.S. Census. / 2012 YTD Crime Rates computed based on 2011 population dataN/C - Not Calculable. Crime counts are for patrol station crimes only Red depicts crime increases of more than 30%. Green depicts crime decreases of more than 30%Preliminary data - information is time sensitive and subject to change upon further analysis. For each incident, only the most serious offense is counted.
LOMITA
VIOLENT CRIMES
PROPERTY CRIMES
CRIMINAL HOMICIDE
FORCIBLE RAPE
ROBBERY
AGGRAVATED ASSAULT
BURGLARY
LARCENY THEFT
GRAND THEFT AUTO
ARSON
205
1,247
26.33
160.16
205
1,247
YTDReportedIncidents
YTDCrime Rate
TotalReportedIncidents
YTDReportedIncidents
YTDCrime Rate
TotalReportedIncidents
YTDReportedIncidents
YTDCrimeRate
5 YearChange inYTD Crime
Rate
1 YearChange inYTD Crime
Rate
158
1176
21.08
156.92
158
1,176
151
1153
20.15
153.85
3
8
54
140
339
786
110
12
0.39
1.03
6.94
17.98
43.54
100.95
14.13
1.54
3
8
54
140
339
786
110
12
2
6
46
104
349
729
91
7
0.27
0.80
6.14
13.88
46.57
97.28
12.14
0.93
2
6
46
104
349
729
91
7
1
2
39
109
322
739
87
5
0.13
0.27
5.20
14.54
42.97
98.61
11.61
0.67
-23.5%
-3.9%
-66.7%
-73.8%
-25.1%
-19.1%
-1.3%
-2.3%
-17.8%
-56.5%
-4.4%
-2.0%
-51.9%
-66.3%
-15.3%
4.8%
-7.7%
1.4%
-4.4%
-28.0%
2007 2011 2012
2007 2011 2012 2012
1,452PART I CRIMES 1,334 1,304186.49 178 174 1,452 1,334 -6.7% -2.3%

LOS ANGELES COUNTY SHERIFF'S DEPARTMENT
YTD 12/31/2012 - PART I CRIME RATE PER 10,000 POPULATION 01/08/2013 08:00 am
Ver: 10.07.13.2011.0
13page
PATROL STATIONS PART I CRIME SUMMARY- PRELIMINARY DATA
Homicides, Rapes and Aggravated Assaults are counted by the number of victims. All others are counted by incidents. Arsons are counted regardless of crime hierarchy.2007 Population Source: Los Angeles County Office of Urban Research (Based on estimates from CA Department of Finance)2011 Population Source: 2011 U.S. Census. / 2012 YTD Crime Rates computed based on 2011 population dataN/C - Not Calculable. Crime counts are for patrol station crimes only Red depicts crime increases of more than 30%. Green depicts crime decreases of more than 30%Preliminary data - information is time sensitive and subject to change upon further analysis. For each incident, only the most serious offense is counted.
MALIBU/LOST HILLS
VIOLENT CRIMES
PROPERTY CRIMES
CRIMINAL HOMICIDE
FORCIBLE RAPE
ROBBERY
AGGRAVATED ASSAULT
BURGLARY
LARCENY THEFT
GRAND THEFT AUTO
ARSON
126
1,558
13.52
167.12
126
1,558
YTDReportedIncidents
YTDCrime Rate
TotalReportedIncidents
YTDReportedIncidents
YTDCrime Rate
TotalReportedIncidents
YTDReportedIncidents
YTDCrimeRate
5 YearChange inYTD Crime
Rate
1 YearChange inYTD Crime
Rate
57
1237
6.39
138.72
57
1,237
52
1172
5.83
131.43
4
6
28
88
372
1,065
96
25
0.43
0.64
3.00
9.44
39.90
114.24
10.30
2.68
4
6
28
88
372
1,065
96
25
1
6
13
37
374
816
44
3
0.11
0.67
1.46
4.15
41.94
91.51
4.93
0.34
1
6
13
37
374
816
44
3
1
12
11
28
306
798
64
4
0.11
1.35
1.23
3.14
34.32
89.49
7.18
0.45
-56.9%
-21.4%
-74.4%
110.9%
-59.0%
-66.7%
-14.0%
-21.7%
-30.3%
-83.2%
-8.8%
-5.3%
0.0%
101.5%
-15.8%
-24.3%
-18.2%
-2.2%
45.6%
32.4%
2007 2011 2012
2007 2011 2012 2012
1,684PART I CRIMES 1,294 1,224180.64 145.11 137.26 1,684 1,294 -24.0% -5.4%

LOS ANGELES COUNTY SHERIFF'S DEPARTMENT
YTD 12/31/2012 - PART I CRIME RATE PER 10,000 POPULATION 01/08/2013 08:00 am
Ver: 10.07.13.2011.0
14page
PATROL STATIONS PART I CRIME SUMMARY- PRELIMINARY DATA
Homicides, Rapes and Aggravated Assaults are counted by the number of victims. All others are counted by incidents. Arsons are counted regardless of crime hierarchy.2007 Population Source: Los Angeles County Office of Urban Research (Based on estimates from CA Department of Finance)2011 Population Source: 2011 U.S. Census. / 2012 YTD Crime Rates computed based on 2011 population dataN/C - Not Calculable. Crime counts are for patrol station crimes only Red depicts crime increases of more than 30%. Green depicts crime decreases of more than 30%Preliminary data - information is time sensitive and subject to change upon further analysis. For each incident, only the most serious offense is counted.
MARINA DEL REY
VIOLENT CRIMES
PROPERTY CRIMES
CRIMINAL HOMICIDE
FORCIBLE RAPE
ROBBERY
AGGRAVATED ASSAULT
BURGLARY
LARCENY THEFT
GRAND THEFT AUTO
ARSON
139
955
55.15
378.94
139
955
YTDReportedIncidents
YTDCrime Rate
TotalReportedIncidents
YTDReportedIncidents
YTDCrime Rate
TotalReportedIncidents
YTDReportedIncidents
YTDCrimeRate
5 YearChange inYTD Crime
Rate
1 YearChange inYTD Crime
Rate
96
844
35.96
316.18
96
844
88
837
32.97
313.55
0
5
63
71
328
511
113
3
0.00
1.98
25.00
28.17
130.15
202.76
44.84
1.19
0
5
63
71
328
511
113
3
0
5
39
52
272
494
73
5
0.00
1.87
14.61
19.48
101.90
185.06
27.35
1.87
0
5
39
52
272
494
73
5
1
3
37
47
267
505
59
6
0.37
1.12
13.86
17.61
100.02
189.18
22.10
2.25
-40.2%
-17.3%
0.0%
-43.4%
-44.6%
-37.5%
-23.2%
-6.7%
-50.7%
89.1%
-8.3%
-0.8%
0.0%
-40.1%
-5.1%
-9.6%
-1.8%
2.2%
-19.2%
20.3%
2007 2011 2012
2007 2011 2012 2012
1,094PART I CRIMES 940 925434.09 352.14 346.52 1,094 940 -20.2% -1.6%

LOS ANGELES COUNTY SHERIFF'S DEPARTMENT
YTD 12/31/2012 - PART I CRIME RATE PER 10,000 POPULATION 01/08/2013 08:00 am
Ver: 10.07.13.2011.0
15page
PATROL STATIONS PART I CRIME SUMMARY- PRELIMINARY DATA
Homicides, Rapes and Aggravated Assaults are counted by the number of victims. All others are counted by incidents. Arsons are counted regardless of crime hierarchy.2007 Population Source: Los Angeles County Office of Urban Research (Based on estimates from CA Department of Finance)2011 Population Source: 2011 U.S. Census. / 2012 YTD Crime Rates computed based on 2011 population dataN/C - Not Calculable. Crime counts are for patrol station crimes only Red depicts crime increases of more than 30%. Green depicts crime decreases of more than 30%Preliminary data - information is time sensitive and subject to change upon further analysis. For each incident, only the most serious offense is counted.
NORWALK
VIOLENT CRIMES
PROPERTY CRIMES
CRIMINAL HOMICIDE
FORCIBLE RAPE
ROBBERY
AGGRAVATED ASSAULT
BURGLARY
LARCENY THEFT
GRAND THEFT AUTO
ARSON
1,002
4,637
43.19
199.85
1,002
4,637
YTDReportedIncidents
YTDCrime Rate
TotalReportedIncidents
YTDReportedIncidents
YTDCrime Rate
TotalReportedIncidents
YTDReportedIncidents
YTDCrimeRate
5 YearChange inYTD Crime
Rate
1 YearChange inYTD Crime
Rate
606
3907
27.42
176.80
606
3,907
694
4207
31.40
190.37
10
30
315
647
970
2,424
1,199
44
0.43
1.29
13.58
27.88
41.81
104.47
51.68
1.90
10
30
315
647
970
2,424
1,199
44
9
19
189
389
765
2,156
956
30
0.41
0.86
8.55
17.60
34.62
97.56
43.26
1.36
9
19
189
389
765
2,156
956
30
16
28
223
427
883
2,479
822
23
0.72
1.27
10.09
19.32
39.96
112.18
37.20
1.04
-27.3%
-4.7%
67.4%
-1.6%
-25.7%
-30.7%
-4.4%
7.4%
-28.0%
-45.3%
14.5%
7.7%
75.6%
47.7%
18.0%
9.8%
15.4%
15.0%
-14.0%
-23.5%
2007 2011 2012
2007 2011 2012 2012
5,639PART I CRIMES 4,513 4,901243.04 204.22 221.77 5,639 4,513 -8.7% 8.6%

LOS ANGELES COUNTY SHERIFF'S DEPARTMENT
YTD 12/31/2012 - PART I CRIME RATE PER 10,000 POPULATION 01/08/2013 08:00 am
Ver: 10.07.13.2011.0
16page
PATROL STATIONS PART I CRIME SUMMARY- PRELIMINARY DATA
Homicides, Rapes and Aggravated Assaults are counted by the number of victims. All others are counted by incidents. Arsons are counted regardless of crime hierarchy.2007 Population Source: Los Angeles County Office of Urban Research (Based on estimates from CA Department of Finance)2011 Population Source: 2011 U.S. Census. / 2012 YTD Crime Rates computed based on 2011 population dataN/C - Not Calculable. Crime counts are for patrol station crimes only Red depicts crime increases of more than 30%. Green depicts crime decreases of more than 30%Preliminary data - information is time sensitive and subject to change upon further analysis. For each incident, only the most serious offense is counted.
PALMDALE
VIOLENT CRIMES
PROPERTY CRIMES
CRIMINAL HOMICIDE
FORCIBLE RAPE
ROBBERY
AGGRAVATED ASSAULT
BURGLARY
LARCENY THEFT
GRAND THEFT AUTO
ARSON
1,220
5,069
70.48
292.85
1,220
5,069
YTDReportedIncidents
YTDCrime Rate
TotalReportedIncidents
YTDReportedIncidents
YTDCrime Rate
TotalReportedIncidents
YTDReportedIncidents
YTDCrimeRate
5 YearChange inYTD Crime
Rate
1 YearChange inYTD Crime
Rate
926
3891
47.05
197.71
926
3,891
958
4132
48.68
209.96
15
48
381
776
1,450
2,770
768
81
0.87
2.77
22.01
44.83
83.77
160.03
44.37
4.68
15
48
381
776
1,450
2,770
768
81
11
40
266
609
1,214
2,195
438
44
0.56
2.03
13.52
30.95
61.69
111.54
22.26
2.24
11
40
266
609
1,214
2,195
438
44
8
45
245
660
1,254
2,442
396
40
0.41
2.29
12.45
33.54
63.72
124.09
20.12
2.03
-30.9%
-28.3%
-52.9%
-17.3%
-43.4%
-25.2%
-23.9%
-22.5%
-54.7%
-56.6%
3.5%
6.2%
-26.8%
12.8%
-7.9%
8.4%
3.3%
11.3%
-9.6%
-9.4%
2007 2011 2012
2007 2011 2012 2012
6,289PART I CRIMES 4,817 5,090363.33 244.76 258.64 6,289 4,817 -28.8% 5.7%

LOS ANGELES COUNTY SHERIFF'S DEPARTMENT
YTD 12/31/2012 - PART I CRIME RATE PER 10,000 POPULATION 01/08/2013 08:00 am
Ver: 10.07.13.2011.0
17page
PATROL STATIONS PART I CRIME SUMMARY- PRELIMINARY DATA
Homicides, Rapes and Aggravated Assaults are counted by the number of victims. All others are counted by incidents. Arsons are counted regardless of crime hierarchy.2007 Population Source: Los Angeles County Office of Urban Research (Based on estimates from CA Department of Finance)2011 Population Source: 2011 U.S. Census. / 2012 YTD Crime Rates computed based on 2011 population dataN/C - Not Calculable. Crime counts are for patrol station crimes only Red depicts crime increases of more than 30%. Green depicts crime decreases of more than 30%Preliminary data - information is time sensitive and subject to change upon further analysis. For each incident, only the most serious offense is counted.
PICO RIVERA
VIOLENT CRIMES
PROPERTY CRIMES
CRIMINAL HOMICIDE
FORCIBLE RAPE
ROBBERY
AGGRAVATED ASSAULT
BURGLARY
LARCENY THEFT
GRAND THEFT AUTO
ARSON
386
2,277
37.77
222.82
386
2,277
YTDReportedIncidents
YTDCrime Rate
TotalReportedIncidents
YTDReportedIncidents
YTDCrime Rate
TotalReportedIncidents
YTDReportedIncidents
YTDCrimeRate
5 YearChange inYTD Crime
Rate
1 YearChange inYTD Crime
Rate
319
2038
34.05
217.53
319
2,038
366
2371
39.07
253.07
11
18
131
226
389
1,198
665
25
1.08
1.76
12.82
22.12
38.07
117.23
65.08
2.45
11
18
131
226
389
1,198
665
25
7
19
101
192
321
1,268
440
9
0.75
2.03
10.78
20.49
34.26
135.34
46.96
0.96
7
19
101
192
321
1,268
440
9
6
10
115
235
491
1,390
483
7
0.64
1.07
12.27
25.08
52.41
148.36
51.55
0.75
3.4%
13.6%
-40.7%
-39.2%
-4.3%
13.4%
37.7%
26.6%
-20.8%
-69.4%
14.7%
16.3%
-14.7%
-47.3%
13.8%
22.4%
53.0%
9.6%
9.8%
-21.9%
2007 2011 2012
2007 2011 2012 2012
2,663PART I CRIMES 2,357 2,737260.59 251.58 292.14 2,663 2,357 12.1% 16.1%

LOS ANGELES COUNTY SHERIFF'S DEPARTMENT
YTD 12/31/2012 - PART I CRIME RATE PER 10,000 POPULATION 01/08/2013 08:00 am
Ver: 10.07.13.2011.0
18page
PATROL STATIONS PART I CRIME SUMMARY- PRELIMINARY DATA
Homicides, Rapes and Aggravated Assaults are counted by the number of victims. All others are counted by incidents. Arsons are counted regardless of crime hierarchy.2007 Population Source: Los Angeles County Office of Urban Research (Based on estimates from CA Department of Finance)2011 Population Source: 2011 U.S. Census. / 2012 YTD Crime Rates computed based on 2011 population dataN/C - Not Calculable. Crime counts are for patrol station crimes only Red depicts crime increases of more than 30%. Green depicts crime decreases of more than 30%Preliminary data - information is time sensitive and subject to change upon further analysis. For each incident, only the most serious offense is counted.
SAN DIMAS
VIOLENT CRIMES
PROPERTY CRIMES
CRIMINAL HOMICIDE
FORCIBLE RAPE
ROBBERY
AGGRAVATED ASSAULT
BURGLARY
LARCENY THEFT
GRAND THEFT AUTO
ARSON
245
1,699
25.22
174.88
245
1,699
YTDReportedIncidents
YTDCrime Rate
TotalReportedIncidents
YTDReportedIncidents
YTDCrime Rate
TotalReportedIncidents
YTDReportedIncidents
YTDCrimeRate
5 YearChange inYTD Crime
Rate
1 YearChange inYTD Crime
Rate
183
1038
22.49
127.56
183
1,038
150
1181
18.43
145.13
1
18
65
161
422
1,014
241
22
0.10
1.85
6.69
16.57
43.44
104.37
24.81
2.26
1
18
65
161
422
1,014
241
22
1
12
39
131
277
637
116
8
0.12
1.47
4.79
16.10
34.04
78.28
14.26
0.98
1
12
39
131
277
637
116
8
2
7
37
104
282
737
155
7
0.25
0.86
4.55
12.78
34.65
90.57
19.05
0.86
-26.9%
-17.0%
150.0%
-53.5%
-32.0%
-22.9%
-20.2%
-13.2%
-23.2%
-62.0%
-18.1%
13.8%
108.3%
-41.5%
-5.0%
-20.6%
1.8%
15.7%
33.6%
-12.2%
2007 2011 2012
2007 2011 2012 2012
1,944PART I CRIMES 1,221 1,331200.1 150.05 163.56 1,944 1,221 -18.3% 9.0%
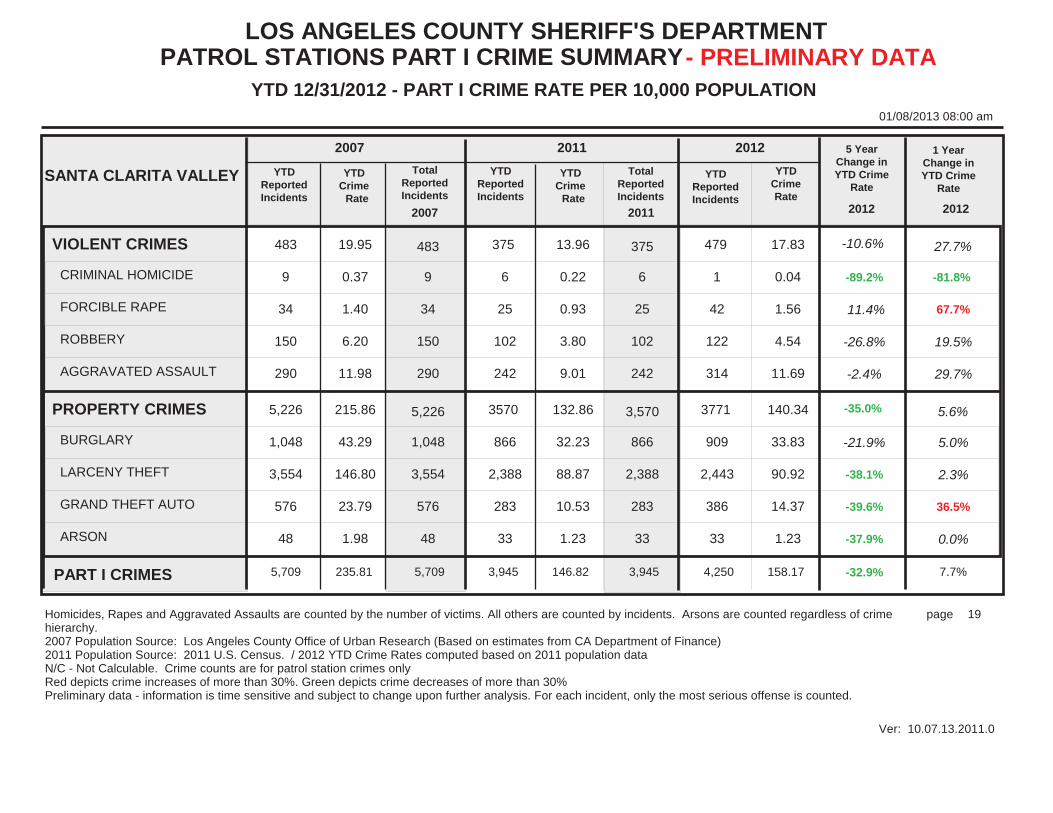
LOS ANGELES COUNTY SHERIFF'S DEPARTMENT
YTD 12/31/2012 - PART I CRIME RATE PER 10,000 POPULATION 01/08/2013 08:00 am
Ver: 10.07.13.2011.0
19page
PATROL STATIONS PART I CRIME SUMMARY- PRELIMINARY DATA
Homicides, Rapes and Aggravated Assaults are counted by the number of victims. All others are counted by incidents. Arsons are counted regardless of crime hierarchy.2007 Population Source: Los Angeles County Office of Urban Research (Based on estimates from CA Department of Finance)2011 Population Source: 2011 U.S. Census. / 2012 YTD Crime Rates computed based on 2011 population dataN/C - Not Calculable. Crime counts are for patrol station crimes only Red depicts crime increases of more than 30%. Green depicts crime decreases of more than 30%Preliminary data - information is time sensitive and subject to change upon further analysis. For each incident, only the most serious offense is counted.
SANTA CLARITA VALLEY
VIOLENT CRIMES
PROPERTY CRIMES
CRIMINAL HOMICIDE
FORCIBLE RAPE
ROBBERY
AGGRAVATED ASSAULT
BURGLARY
LARCENY THEFT
GRAND THEFT AUTO
ARSON
483
5,226
19.95
215.86
483
5,226
YTDReportedIncidents
YTDCrime Rate
TotalReportedIncidents
YTDReportedIncidents
YTDCrime Rate
TotalReportedIncidents
YTDReportedIncidents
YTDCrimeRate
5 YearChange inYTD Crime
Rate
1 YearChange inYTD Crime
Rate
375
3570
13.96
132.86
375
3,570
479
3771
17.83
140.34
9
34
150
290
1,048
3,554
576
48
0.37
1.40
6.20
11.98
43.29
146.80
23.79
1.98
9
34
150
290
1,048
3,554
576
48
6
25
102
242
866
2,388
283
33
0.22
0.93
3.80
9.01
32.23
88.87
10.53
1.23
6
25
102
242
866
2,388
283
33
1
42
122
314
909
2,443
386
33
0.04
1.56
4.54
11.69
33.83
90.92
14.37
1.23
-10.6%
-35.0%
-89.2%
11.4%
-26.8%
-2.4%
-21.9%
-38.1%
-39.6%
-37.9%
27.7%
5.6%
-81.8%
67.7%
19.5%
29.7%
5.0%
2.3%
36.5%
0.0%
2007 2011 2012
2007 2011 2012 2012
5,709PART I CRIMES 3,945 4,250235.81 146.82 158.17 5,709 3,945 -32.9% 7.7%

LOS ANGELES COUNTY SHERIFF'S DEPARTMENT
YTD 12/31/2012 - PART I CRIME RATE PER 10,000 POPULATION 01/08/2013 08:00 am
Ver: 10.07.13.2011.0
20page
PATROL STATIONS PART I CRIME SUMMARY- PRELIMINARY DATA
Homicides, Rapes and Aggravated Assaults are counted by the number of victims. All others are counted by incidents. Arsons are counted regardless of crime hierarchy.2007 Population Source: Los Angeles County Office of Urban Research (Based on estimates from CA Department of Finance)2011 Population Source: 2011 U.S. Census. / 2012 YTD Crime Rates computed based on 2011 population dataN/C - Not Calculable. Crime counts are for patrol station crimes only Red depicts crime increases of more than 30%. Green depicts crime decreases of more than 30%Preliminary data - information is time sensitive and subject to change upon further analysis. For each incident, only the most serious offense is counted.
SOUTH LOS ANGELES
VIOLENT CRIMES
PROPERTY CRIMES
CRIMINAL HOMICIDE
FORCIBLE RAPE
ROBBERY
AGGRAVATED ASSAULT
BURGLARY
LARCENY THEFT
GRAND THEFT AUTO
ARSON
1,401
2,140
109.08
166.61
1,401
2,140
YTDReportedIncidents
YTDCrime Rate
TotalReportedIncidents
YTDReportedIncidents
YTDCrime Rate
TotalReportedIncidents
YTDReportedIncidents
YTDCrimeRate
5 YearChange inYTD Crime
Rate
1 YearChange inYTD Crime
Rate
1148
1819
97.93
155.17
1,148
1,819
1132
1815
96.57
154.83
25
41
534
801
660
778
662
40
1.95
3.19
41.58
62.36
51.39
60.57
51.54
3.11
25
41
534
801
660
778
662
40
22
28
379
719
698
674
419
28
1.88
2.39
32.33
61.34
59.54
57.50
35.74
2.39
22
28
379
719
698
674
419
28
17
31
363
721
623
700
470
22
1.45
2.64
30.97
61.51
53.15
59.71
40.09
1.88
-11.5%
-7.1%
-25.6%
-17.2%
-25.5%
-1.4%
3.4%
-1.4%
-22.2%
-39.6%
-1.4%
-0.2%
-22.9%
10.5%
-4.2%
0.3%
-10.7%
3.8%
12.2%
-21.3%
2007 2011 2012
2007 2011 2012 2012
3,541PART I CRIMES 2,967 2,947275.69 253.1 251.4 3,541 2,967 -8.8% -0.7%
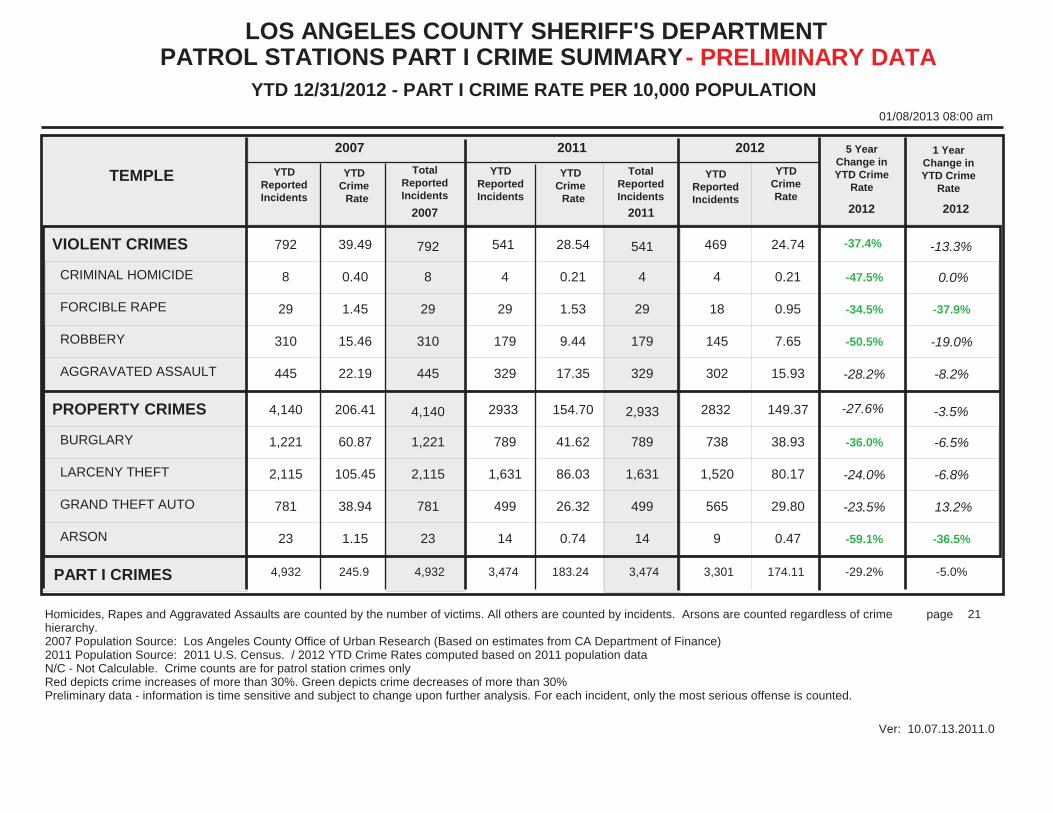
LOS ANGELES COUNTY SHERIFF'S DEPARTMENT
YTD 12/31/2012 - PART I CRIME RATE PER 10,000 POPULATION 01/08/2013 08:00 am
Ver: 10.07.13.2011.0
21page
PATROL STATIONS PART I CRIME SUMMARY- PRELIMINARY DATA
Homicides, Rapes and Aggravated Assaults are counted by the number of victims. All others are counted by incidents. Arsons are counted regardless of crime hierarchy.2007 Population Source: Los Angeles County Office of Urban Research (Based on estimates from CA Department of Finance)2011 Population Source: 2011 U.S. Census. / 2012 YTD Crime Rates computed based on 2011 population dataN/C - Not Calculable. Crime counts are for patrol station crimes only Red depicts crime increases of more than 30%. Green depicts crime decreases of more than 30%Preliminary data - information is time sensitive and subject to change upon further analysis. For each incident, only the most serious offense is counted.
TEMPLE
VIOLENT CRIMES
PROPERTY CRIMES
CRIMINAL HOMICIDE
FORCIBLE RAPE
ROBBERY
AGGRAVATED ASSAULT
BURGLARY
LARCENY THEFT
GRAND THEFT AUTO
ARSON
792
4,140
39.49
206.41
792
4,140
YTDReportedIncidents
YTDCrime Rate
TotalReportedIncidents
YTDReportedIncidents
YTDCrime Rate
TotalReportedIncidents
YTDReportedIncidents
YTDCrimeRate
5 YearChange inYTD Crime
Rate
1 YearChange inYTD Crime
Rate
541
2933
28.54
154.70
541
2,933
469
2832
24.74
149.37
8
29
310
445
1,221
2,115
781
23
0.40
1.45
15.46
22.19
60.87
105.45
38.94
1.15
8
29
310
445
1,221
2,115
781
23
4
29
179
329
789
1,631
499
14
0.21
1.53
9.44
17.35
41.62
86.03
26.32
0.74
4
29
179
329
789
1,631
499
14
4
18
145
302
738
1,520
565
9
0.21
0.95
7.65
15.93
38.93
80.17
29.80
0.47
-37.4%
-27.6%
-47.5%
-34.5%
-50.5%
-28.2%
-36.0%
-24.0%
-23.5%
-59.1%
-13.3%
-3.5%
0.0%
-37.9%
-19.0%
-8.2%
-6.5%
-6.8%
13.2%
-36.5%
2007 2011 2012
2007 2011 2012 2012
4,932PART I CRIMES 3,474 3,301245.9 183.24 174.11 4,932 3,474 -29.2% -5.0%

LOS ANGELES COUNTY SHERIFF'S DEPARTMENT
YTD 12/31/2012 - PART I CRIME RATE PER 10,000 POPULATION 01/08/2013 08:00 am
Ver: 10.07.13.2011.0
22page
PATROL STATIONS PART I CRIME SUMMARY- PRELIMINARY DATA
Homicides, Rapes and Aggravated Assaults are counted by the number of victims. All others are counted by incidents. Arsons are counted regardless of crime hierarchy.2007 Population Source: Los Angeles County Office of Urban Research (Based on estimates from CA Department of Finance)2011 Population Source: 2011 U.S. Census. / 2012 YTD Crime Rates computed based on 2011 population dataN/C - Not Calculable. Crime counts are for patrol station crimes only Red depicts crime increases of more than 30%. Green depicts crime decreases of more than 30%Preliminary data - information is time sensitive and subject to change upon further analysis. For each incident, only the most serious offense is counted.
WALNUT
VIOLENT CRIMES
PROPERTY CRIMES
CRIMINAL HOMICIDE
FORCIBLE RAPE
ROBBERY
AGGRAVATED ASSAULT
BURGLARY
LARCENY THEFT
GRAND THEFT AUTO
ARSON
393
2,578
26.51
173.92
393
2,578
YTDReportedIncidents
YTDCrime Rate
TotalReportedIncidents
YTDReportedIncidents
YTDCrime Rate
TotalReportedIncidents
YTDReportedIncidents
YTDCrimeRate
5 YearChange inYTD Crime
Rate
1 YearChange inYTD Crime
Rate
185
1881
13.45
136.78
185
1,881
233
2167
16.94
157.57
9
13
173
198
851
1,406
304
17
0.61
0.88
11.67
13.36
57.41
94.85
20.51
1.15
9
13
173
198
851
1,406
304
17
3
12
71
99
608
1,075
183
15
0.22
0.87
5.16
7.20
44.21
78.17
13.31
1.09
3
12
71
99
608
1,075
183
15
0
6
69
158
805
1,169
177
16
0.00
0.44
5.02
11.49
58.54
85.00
12.87
1.16
-36.1%
-9.4%
0.0%
-50.0%
-57.0%
-14.0%
2.0%
-10.4%
-37.3%
0.9%
26.0%
15.2%
0.0%
-49.4%
-2.7%
59.6%
32.4%
8.7%
-3.3%
6.4%
2007 2011 2012
2007 2011 2012 2012
2,971PART I CRIMES 2,066 2,400200.43 150.23 174.51 2,971 2,066 -12.9% 16.2%

LOS ANGELES COUNTY SHERIFF'S DEPARTMENT
YTD 12/31/2012 - PART I CRIME RATE PER 10,000 POPULATION 01/08/2013 08:00 am
Ver: 10.07.13.2011.0
23page
PATROL STATIONS PART I CRIME SUMMARY- PRELIMINARY DATA
Homicides, Rapes and Aggravated Assaults are counted by the number of victims. All others are counted by incidents. Arsons are counted regardless of crime hierarchy.2007 Population Source: Los Angeles County Office of Urban Research (Based on estimates from CA Department of Finance)2011 Population Source: 2011 U.S. Census. / 2012 YTD Crime Rates computed based on 2011 population dataN/C - Not Calculable. Crime counts are for patrol station crimes only Red depicts crime increases of more than 30%. Green depicts crime decreases of more than 30%Preliminary data - information is time sensitive and subject to change upon further analysis. For each incident, only the most serious offense is counted.
WEST HOLLYWOOD
VIOLENT CRIMES
PROPERTY CRIMES
CRIMINAL HOMICIDE
FORCIBLE RAPE
ROBBERY
AGGRAVATED ASSAULT
BURGLARY
LARCENY THEFT
GRAND THEFT AUTO
ARSON
386
1,678
101.42
440.91
386
1,678
YTDReportedIncidents
YTDCrime Rate
TotalReportedIncidents
YTDReportedIncidents
YTDCrime Rate
TotalReportedIncidents
YTDReportedIncidents
YTDCrimeRate
5 YearChange inYTD Crime
Rate
1 YearChange inYTD Crime
Rate
360
1541
102.55
438.96
360
1,541
349
1759
99.41
501.05
1
21
149
215
258
1,198
216
6
0.26
5.52
39.15
56.49
67.79
314.78
56.76
1.58
1
21
149
215
258
1,198
216
6
0
19
127
214
285
1,124
120
12
0.00
5.41
36.18
60.96
81.18
320.17
34.18
3.42
0
19
127
214
285
1,124
120
12
0
12
139
198
343
1,285
122
9
0.00
3.42
39.59
56.40
97.70
366.03
34.75
2.56
-2.0%
13.6%
0.0%
-38.0%
1.1%
-0.2%
44.1%
16.3%
-38.8%
62.0%
-3.1%
14.1%
0.0%
-36.8%
9.4%
-7.5%
20.4%
14.3%
1.7%
-25.2%
2007 2011 2012
2007 2011 2012 2012
2,064PART I CRIMES 1,901 2,108542.33 541.51 600.46 2,064 1,901 10.7% 10.9%
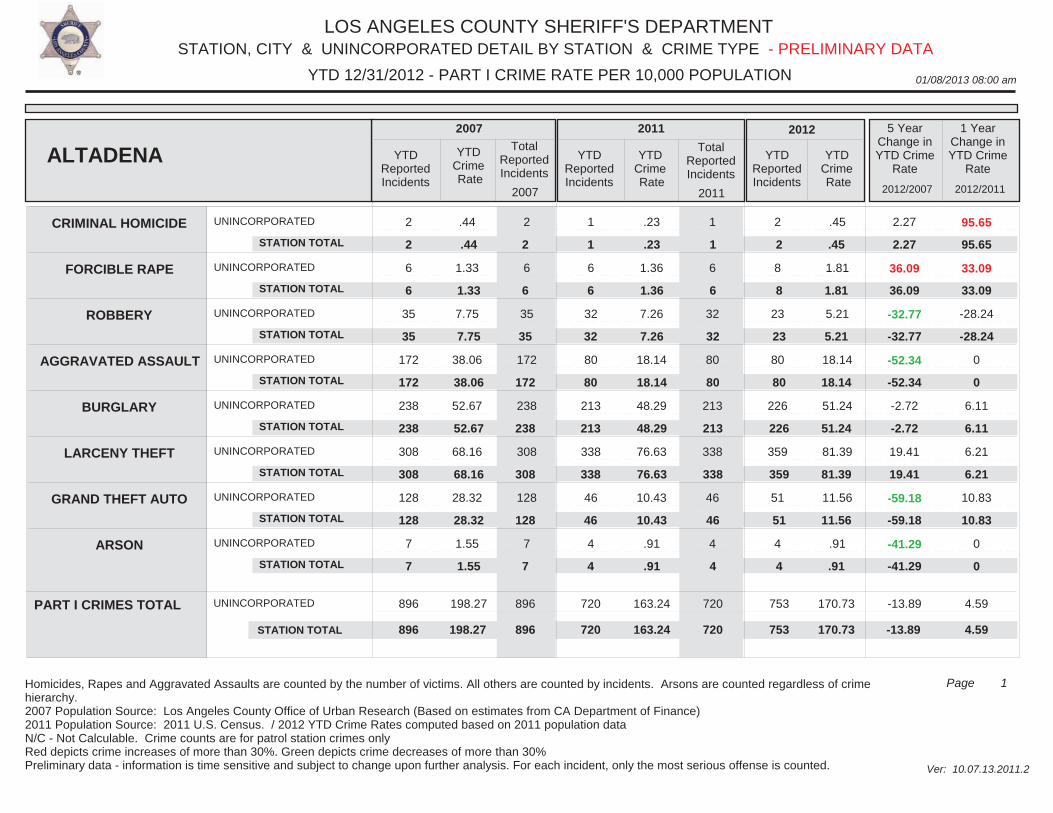
LOS ANGELES COUNTY SHERIFF'S DEPARTMENT
01/08/2013 08:00 am
STATION, CITY & UNINCORPORATED DETAIL BY STATION & CRIME TYPE
Ver: 10.07.13.2011.2
YTD 12/31/2012 - PART I CRIME RATE PER 10,000 POPULATION
1Page
- PRELIMINARY DATA
Homicides, Rapes and Aggravated Assaults are counted by the number of victims. All others are counted by incidents. Arsons are counted regardless of crime hierarchy.2007 Population Source: Los Angeles County Office of Urban Research (Based on estimates from CA Department of Finance)2011 Population Source: 2011 U.S. Census. / 2012 YTD Crime Rates computed based on 2011 population dataN/C - Not Calculable. Crime counts are for patrol station crimes only Red depicts crime increases of more than 30%. Green depicts crime decreases of more than 30%Preliminary data - information is time sensitive and subject to change upon further analysis. For each incident, only the most serious offense is counted.
UNINCORPORATED
UNINCORPORATED
UNINCORPORATED
UNINCORPORATED
UNINCORPORATED
UNINCORPORATED
UNINCORPORATED
UNINCORPORATED
2
6
35
172
238
308
128
7
2
6
35
172
238
308
128
7
1
6
32
80
213
338
46
4
1
6
32
80
213
338
46
4
2
8
23
80
226
359
51
4
.44
1.33
7.75
38.06
52.67
68.16
28.32
1.55
.23
1.36
7.26
18.14
48.29
76.63
10.43
.91
.45
1.81
5.21
18.14
51.24
81.39
11.56
.91
2.27
36.09
-32.77
-52.34
-2.72
19.41
-59.18
-41.29
95.65
33.09
-28.24
0
6.11
6.21
10.83
0
CRIMINAL HOMICIDE
FORCIBLE RAPE
ROBBERY
AGGRAVATED ASSAULT
BURGLARY
LARCENY THEFT
GRAND THEFT AUTO
ARSON
ALTADENA YTDReportedIncidents
YTDCrime Rate
TotalReportedIncidents
YTDReportedIncidents
YTDCrime Rate
TotalReportedIncidents
YTDReportedIncidents
YTDCrime Rate
5 YearChange inYTD Crime
Rate
1 YearChange inYTD Crime
Rate
2007 2011 2012
2012/2007 2012/2011
PART I CRIMES TOTAL
STATION TOTAL
STATION TOTAL
STATION TOTAL
STATION TOTAL
STATION TOTAL
STATION TOTAL
STATION TOTAL
STATION TOTAL
UNINCORPORATED 896
2007
720
2011
753
2
6
35
172
238
308
128
7
1
6
32
80
213
338
46
4
2
8
23
80
226
359
51
4
198.27 896
2
6
35
172
238
308
128
7
1
6
32
80
213
338
46
4
163.24 720
.44
1.33
7.75
38.06
52.67
68.16
28.32
1.55
.23
1.36
7.26
18.14
48.29
76.63
10.43
.91
170.73
.45
1.81
5.21
18.14
51.24
81.39
11.56
.91
-13.89
95.65
33.09
-28.24
0
6.11
6.21
10.83
0
STATION TOTAL
4.59
896 720
2.27
36.09
-32.77
-52.34
-2.72
19.41
-59.18
-41.29
753 896 720 170.73198.27 163.24 -13.89 4.59
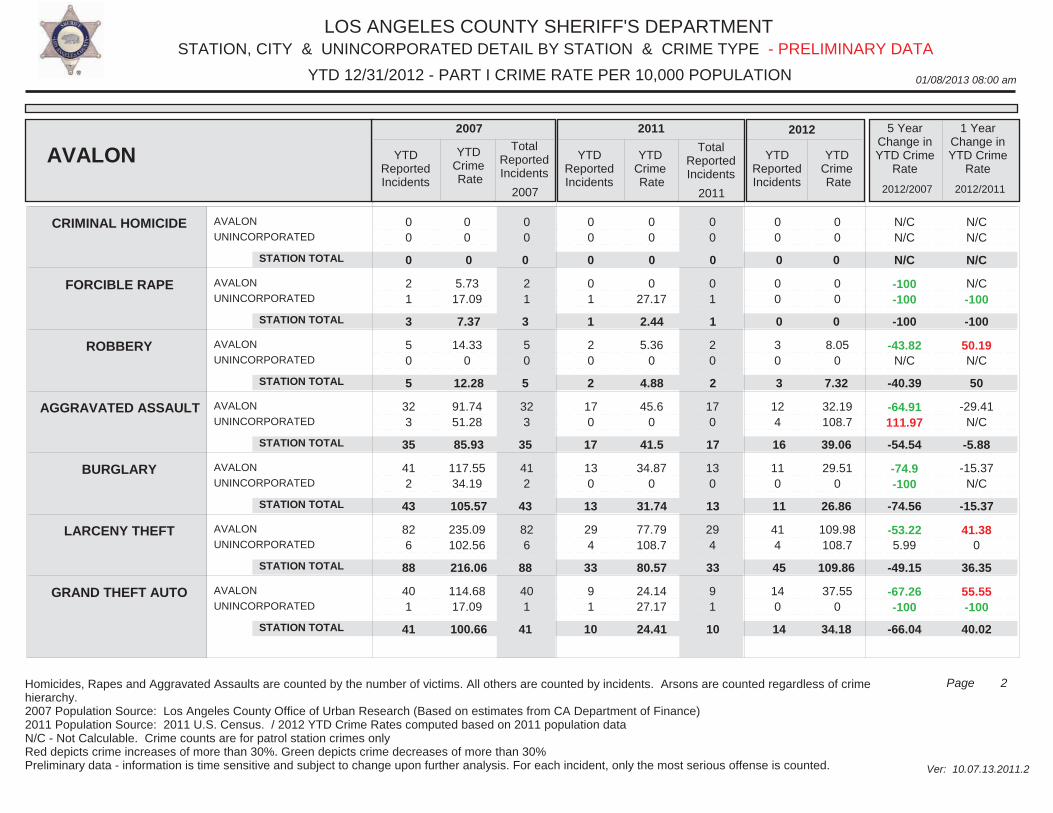
LOS ANGELES COUNTY SHERIFF'S DEPARTMENT
01/08/2013 08:00 am
STATION, CITY & UNINCORPORATED DETAIL BY STATION & CRIME TYPE
Ver: 10.07.13.2011.2
YTD 12/31/2012 - PART I CRIME RATE PER 10,000 POPULATION
2Page
- PRELIMINARY DATA
Homicides, Rapes and Aggravated Assaults are counted by the number of victims. All others are counted by incidents. Arsons are counted regardless of crime hierarchy.2007 Population Source: Los Angeles County Office of Urban Research (Based on estimates from CA Department of Finance)2011 Population Source: 2011 U.S. Census. / 2012 YTD Crime Rates computed based on 2011 population dataN/C - Not Calculable. Crime counts are for patrol station crimes only Red depicts crime increases of more than 30%. Green depicts crime decreases of more than 30%Preliminary data - information is time sensitive and subject to change upon further analysis. For each incident, only the most serious offense is counted.
AVALON
UNINCORPORATED
AVALON
UNINCORPORATED
AVALON
UNINCORPORATED
AVALON
UNINCORPORATED
AVALON
UNINCORPORATED
AVALON
UNINCORPORATED
AVALON
UNINCORPORATED
0 0
2 1
5 0
32 3
41 2
82 6
40 1
0 0
2 1
5 0
32 3
41 2
82 6
40 1
0 0
0 1
2 0
17 0
13 0
29 4
9 1
0 0
0 1
2 0
17 0
13 0
29 4
9 1
0 0
0 0
3 0
12 4
11 0
41 4
14 0
00
5.7317.09
14.330
91.7451.28
117.5534.19
235.09102.56
114.6817.09
00
027.17
5.360
45.60
34.870
77.79108.7
24.1427.17
00
00
8.050
32.19108.7
29.510
109.98108.7
37.550
N/CN/C
-100-100
-43.82N/C
-64.91111.97
-74.9-100
-53.225.99
-67.26-100
N/CN/C
N/C-100
50.19N/C
-29.41N/C
-15.37N/C
41.380
55.55-100
CRIMINAL HOMICIDE
FORCIBLE RAPE
ROBBERY
AGGRAVATED ASSAULT
BURGLARY
LARCENY THEFT
GRAND THEFT AUTO
AVALON YTDReportedIncidents
YTDCrime Rate
TotalReportedIncidents
YTDReportedIncidents
YTDCrime Rate
TotalReportedIncidents
YTDReportedIncidents
YTDCrime Rate
5 YearChange inYTD Crime
Rate
1 YearChange inYTD Crime
Rate
2007 2011 2012
2012/2007 2012/2011
STATION TOTAL
STATION TOTAL
STATION TOTAL
STATION TOTAL
STATION TOTAL
STATION TOTAL
STATION TOTAL
2007 2011
0
3
5
35
43
88
41
0
1
2
17
13
33
10
0
0
3
16
11
45
14
0
3
5
35
43
88
41
0
1
2
17
13
33
10
0
7.37
12.28
85.93
105.57
216.06
100.66
0
2.44
4.88
41.5
31.74
80.57
24.41
0
0
7.32
39.06
26.86
109.86
34.18
N/C
-100
50
-5.88
-15.37
36.35
40.02
N/C
-100
-40.39
-54.54
-74.56
-49.15
-66.04
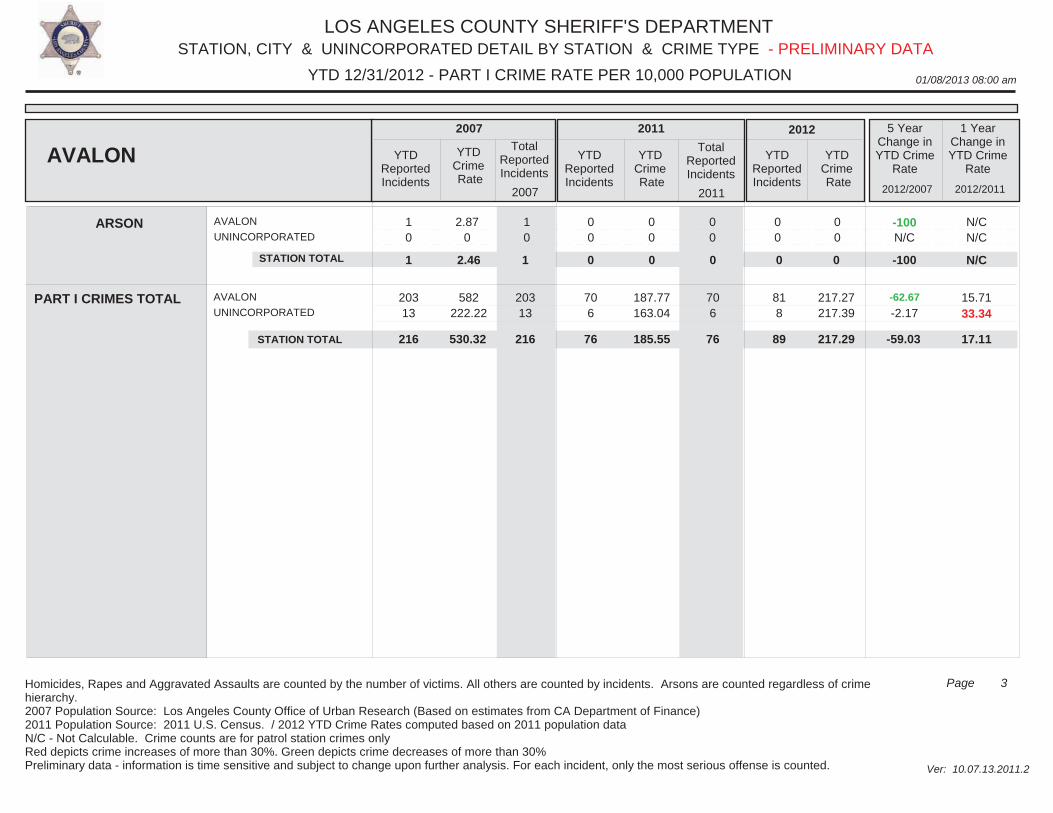
LOS ANGELES COUNTY SHERIFF'S DEPARTMENT
01/08/2013 08:00 am
STATION, CITY & UNINCORPORATED DETAIL BY STATION & CRIME TYPE
Ver: 10.07.13.2011.2
YTD 12/31/2012 - PART I CRIME RATE PER 10,000 POPULATION
3Page
- PRELIMINARY DATA
Homicides, Rapes and Aggravated Assaults are counted by the number of victims. All others are counted by incidents. Arsons are counted regardless of crime hierarchy.2007 Population Source: Los Angeles County Office of Urban Research (Based on estimates from CA Department of Finance)2011 Population Source: 2011 U.S. Census. / 2012 YTD Crime Rates computed based on 2011 population dataN/C - Not Calculable. Crime counts are for patrol station crimes only Red depicts crime increases of more than 30%. Green depicts crime decreases of more than 30%Preliminary data - information is time sensitive and subject to change upon further analysis. For each incident, only the most serious offense is counted.
AVALON
UNINCORPORATED 1 0
1 0
0 0
0 0
0 0
2.870
00
00
-100N/C
N/CN/C
ARSON
AVALON YTDReportedIncidents
YTDCrime Rate
TotalReportedIncidents
YTDReportedIncidents
YTDCrime Rate
TotalReportedIncidents
YTDReportedIncidents
YTDCrime Rate
5 YearChange inYTD Crime
Rate
1 YearChange inYTD Crime
Rate
2007 2011 2012
2012/2007 2012/2011
PART I CRIMES TOTAL
STATION TOTAL
AVALON
UNINCORPORATED 203 13
2007
70 6
2011
81 8
1 0 0
582222.22
203 13
1 0
187.77163.04
70 6
2.46 0
217.27217.39
0
-62.67
-2.17
N/C
STATION TOTAL
15.7133.34
216 76
-100
89 216 76 217.29530.32 185.55 -59.03 17.11
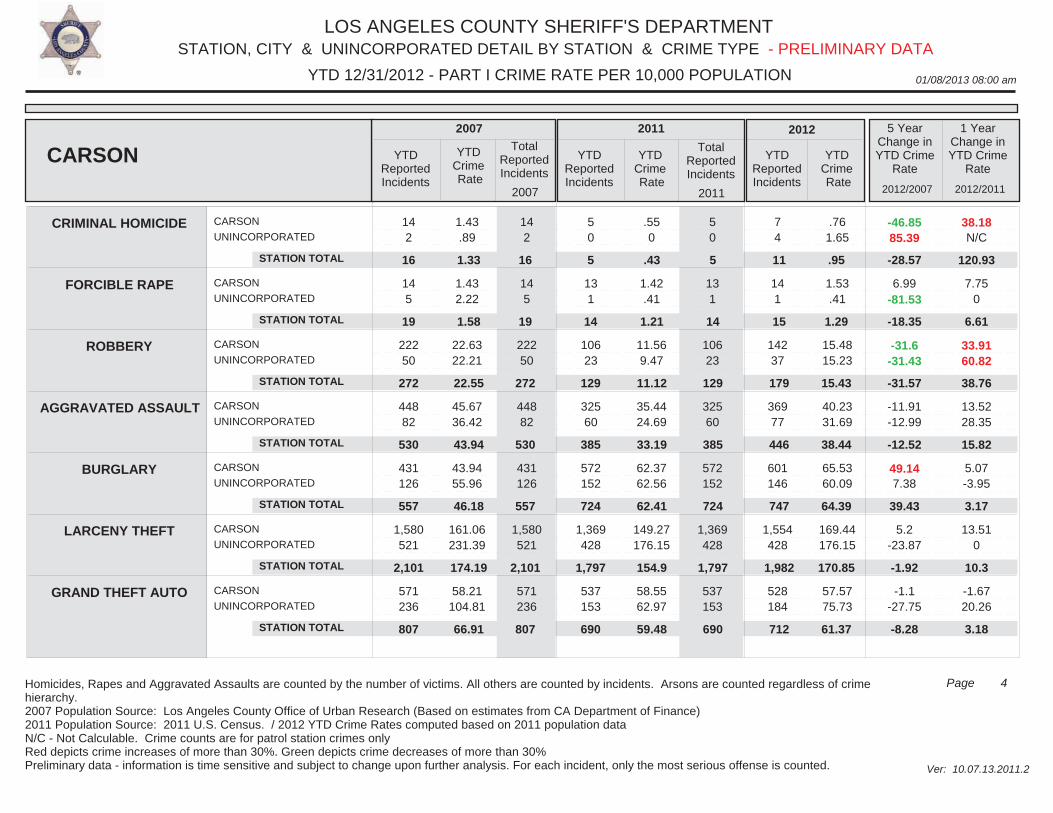
LOS ANGELES COUNTY SHERIFF'S DEPARTMENT
01/08/2013 08:00 am
STATION, CITY & UNINCORPORATED DETAIL BY STATION & CRIME TYPE
Ver: 10.07.13.2011.2
YTD 12/31/2012 - PART I CRIME RATE PER 10,000 POPULATION
4Page
- PRELIMINARY DATA
Homicides, Rapes and Aggravated Assaults are counted by the number of victims. All others are counted by incidents. Arsons are counted regardless of crime hierarchy.2007 Population Source: Los Angeles County Office of Urban Research (Based on estimates from CA Department of Finance)2011 Population Source: 2011 U.S. Census. / 2012 YTD Crime Rates computed based on 2011 population dataN/C - Not Calculable. Crime counts are for patrol station crimes only Red depicts crime increases of more than 30%. Green depicts crime decreases of more than 30%Preliminary data - information is time sensitive and subject to change upon further analysis. For each incident, only the most serious offense is counted.
CARSON
UNINCORPORATED
CARSON
UNINCORPORATED
CARSON
UNINCORPORATED
CARSON
UNINCORPORATED
CARSON
UNINCORPORATED
CARSON
UNINCORPORATED
CARSON
UNINCORPORATED
14 2
14 5
222 50
448 82
431 126
1,580 521
571 236
14 2
14 5
222 50
448 82
431 126
1,580 521
571 236
5 0
13 1
106 23
325 60
572 152
1,369 428
537 153
5 0
13 1
106 23
325 60
572 152
1,369 428
537 153
7 4
14 1
142 37
369 77
601 146
1,554 428
528 184
1.43.89
1.432.22
22.6322.21
45.6736.42
43.9455.96
161.06231.39
58.21104.81
.550
1.42.41
11.569.47
35.4424.69
62.3762.56
149.27176.15
58.5562.97
.761.65
1.53.41
15.4815.23
40.2331.69
65.5360.09
169.44176.15
57.5775.73
-46.8585.39
6.99-81.53
-31.6-31.43
-11.91-12.99
49.147.38
5.2-23.87
-1.1-27.75
38.18N/C
7.750
33.9160.82
13.5228.35
5.07-3.95
13.510
-1.6720.26
CRIMINAL HOMICIDE
FORCIBLE RAPE
ROBBERY
AGGRAVATED ASSAULT
BURGLARY
LARCENY THEFT
GRAND THEFT AUTO
CARSON YTDReportedIncidents
YTDCrime Rate
TotalReportedIncidents
YTDReportedIncidents
YTDCrime Rate
TotalReportedIncidents
YTDReportedIncidents
YTDCrime Rate
5 YearChange inYTD Crime
Rate
1 YearChange inYTD Crime
Rate
2007 2011 2012
2012/2007 2012/2011
STATION TOTAL
STATION TOTAL
STATION TOTAL
STATION TOTAL
STATION TOTAL
STATION TOTAL
STATION TOTAL
2007 2011
16
19
272
530
557
2,101
807
5
14
129
385
724
1,797
690
11
15
179
446
747
1,982
712
16
19
272
530
557
2,101
807
5
14
129
385
724
1,797
690
1.33
1.58
22.55
43.94
46.18
174.19
66.91
.43
1.21
11.12
33.19
62.41
154.9
59.48
.95
1.29
15.43
38.44
64.39
170.85
61.37
120.93
6.61
38.76
15.82
3.17
10.3
3.18
-28.57
-18.35
-31.57
-12.52
39.43
-1.92
-8.28
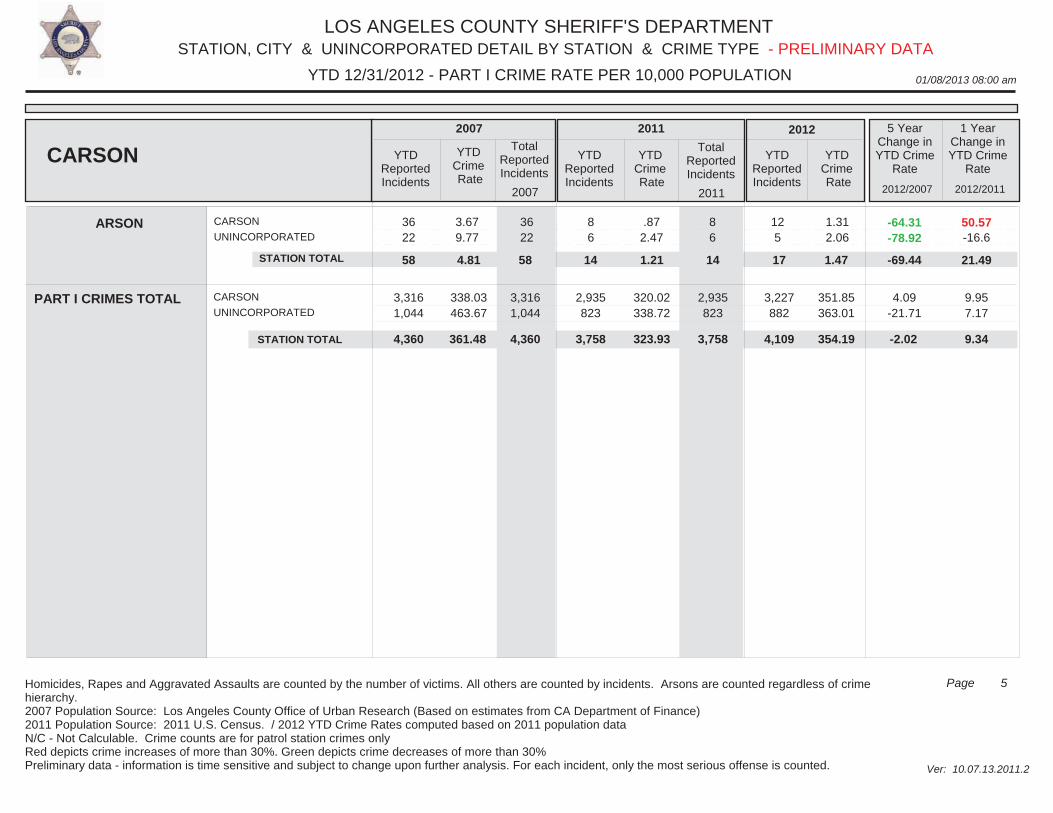
LOS ANGELES COUNTY SHERIFF'S DEPARTMENT
01/08/2013 08:00 am
STATION, CITY & UNINCORPORATED DETAIL BY STATION & CRIME TYPE
Ver: 10.07.13.2011.2
YTD 12/31/2012 - PART I CRIME RATE PER 10,000 POPULATION
5Page
- PRELIMINARY DATA
Homicides, Rapes and Aggravated Assaults are counted by the number of victims. All others are counted by incidents. Arsons are counted regardless of crime hierarchy.2007 Population Source: Los Angeles County Office of Urban Research (Based on estimates from CA Department of Finance)2011 Population Source: 2011 U.S. Census. / 2012 YTD Crime Rates computed based on 2011 population dataN/C - Not Calculable. Crime counts are for patrol station crimes only Red depicts crime increases of more than 30%. Green depicts crime decreases of more than 30%Preliminary data - information is time sensitive and subject to change upon further analysis. For each incident, only the most serious offense is counted.
CARSON
UNINCORPORATED 36 22
36 22
8 6
8 6
12 5
3.679.77
.872.47
1.312.06
-64.31-78.92
50.57-16.6
ARSON
CARSON YTDReportedIncidents
YTDCrime Rate
TotalReportedIncidents
YTDReportedIncidents
YTDCrime Rate
TotalReportedIncidents
YTDReportedIncidents
YTDCrime Rate
5 YearChange inYTD Crime
Rate
1 YearChange inYTD Crime
Rate
2007 2011 2012
2012/2007 2012/2011
PART I CRIMES TOTAL
STATION TOTAL
CARSON
UNINCORPORATED 3,316 1,044
2007
2,935 823
2011
3,227 882
58 14 17
338.03463.67
3,316 1,044
58 14
320.02338.72
2,935 823
4.81 1.21
351.85363.01
1.47
4.09-21.71
21.49
STATION TOTAL
9.957.17
4,360 3,758
-69.44
4,109 4,360 3,758 354.19361.48 323.93 -2.02 9.34
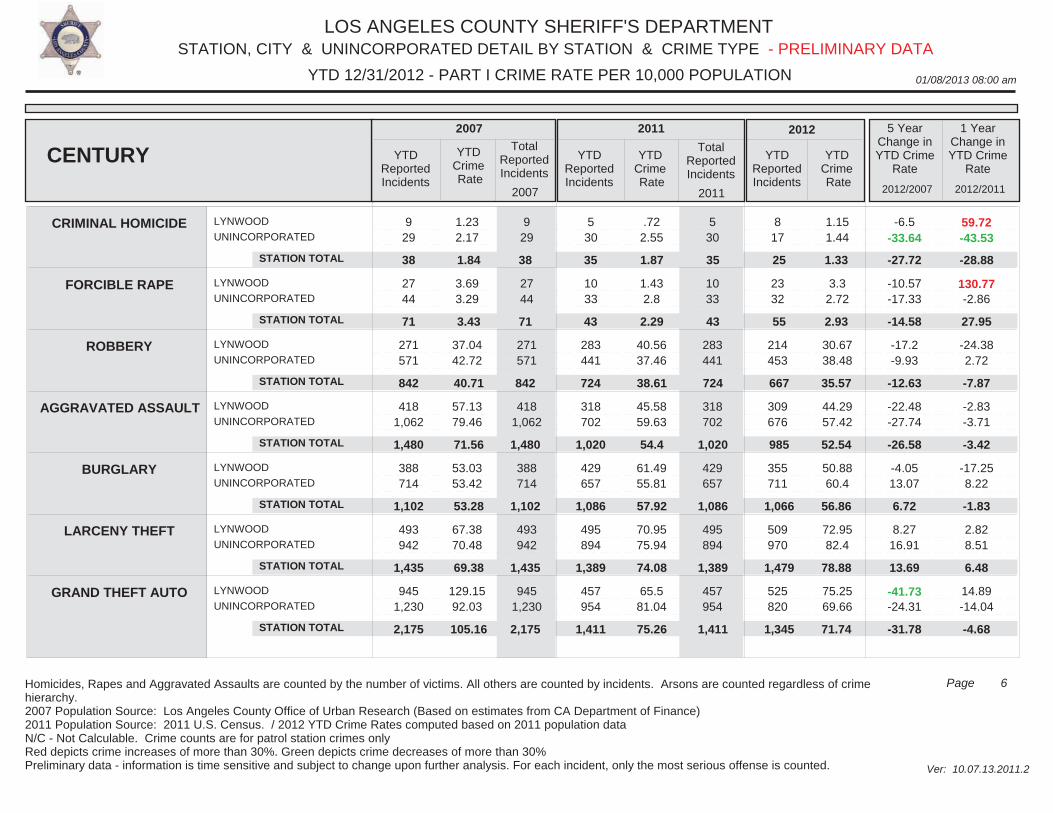
LOS ANGELES COUNTY SHERIFF'S DEPARTMENT
01/08/2013 08:00 am
STATION, CITY & UNINCORPORATED DETAIL BY STATION & CRIME TYPE
Ver: 10.07.13.2011.2
YTD 12/31/2012 - PART I CRIME RATE PER 10,000 POPULATION
6Page
- PRELIMINARY DATA
Homicides, Rapes and Aggravated Assaults are counted by the number of victims. All others are counted by incidents. Arsons are counted regardless of crime hierarchy.2007 Population Source: Los Angeles County Office of Urban Research (Based on estimates from CA Department of Finance)2011 Population Source: 2011 U.S. Census. / 2012 YTD Crime Rates computed based on 2011 population dataN/C - Not Calculable. Crime counts are for patrol station crimes only Red depicts crime increases of more than 30%. Green depicts crime decreases of more than 30%Preliminary data - information is time sensitive and subject to change upon further analysis. For each incident, only the most serious offense is counted.
LYNWOOD
UNINCORPORATED
LYNWOOD
UNINCORPORATED
LYNWOOD
UNINCORPORATED
LYNWOOD
UNINCORPORATED
LYNWOOD
UNINCORPORATED
LYNWOOD
UNINCORPORATED
LYNWOOD
UNINCORPORATED
9 29
27 44
271 571
418 1,062
388 714
493 942
945 1,230
9 29
27 44
271 571
418 1,062
388 714
493 942
945 1,230
5 30
10 33
283 441
318 702
429 657
495 894
457 954
5 30
10 33
283 441
318 702
429 657
495 894
457 954
8 17
23 32
214 453
309 676
355 711
509 970
525 820
1.232.17
3.693.29
37.0442.72
57.1379.46
53.0353.42
67.3870.48
129.1592.03
.722.55
1.432.8
40.5637.46
45.5859.63
61.4955.81
70.9575.94
65.581.04
1.151.44
3.32.72
30.6738.48
44.2957.42
50.8860.4
72.9582.4
75.2569.66
-6.5-33.64
-10.57-17.33
-17.2-9.93
-22.48-27.74
-4.0513.07
8.2716.91
-41.73-24.31
59.72-43.53
130.77-2.86
-24.382.72
-2.83-3.71
-17.258.22
2.828.51
14.89-14.04
CRIMINAL HOMICIDE
FORCIBLE RAPE
ROBBERY
AGGRAVATED ASSAULT
BURGLARY
LARCENY THEFT
GRAND THEFT AUTO
CENTURY YTDReportedIncidents
YTDCrime Rate
TotalReportedIncidents
YTDReportedIncidents
YTDCrime Rate
TotalReportedIncidents
YTDReportedIncidents
YTDCrime Rate
5 YearChange inYTD Crime
Rate
1 YearChange inYTD Crime
Rate
2007 2011 2012
2012/2007 2012/2011
STATION TOTAL
STATION TOTAL
STATION TOTAL
STATION TOTAL
STATION TOTAL
STATION TOTAL
STATION TOTAL
2007 2011
38
71
842
1,480
1,102
1,435
2,175
35
43
724
1,020
1,086
1,389
1,411
25
55
667
985
1,066
1,479
1,345
38
71
842
1,480
1,102
1,435
2,175
35
43
724
1,020
1,086
1,389
1,411
1.84
3.43
40.71
71.56
53.28
69.38
105.16
1.87
2.29
38.61
54.4
57.92
74.08
75.26
1.33
2.93
35.57
52.54
56.86
78.88
71.74
-28.88
27.95
-7.87
-3.42
-1.83
6.48
-4.68
-27.72
-14.58
-12.63
-26.58
6.72
13.69
-31.78
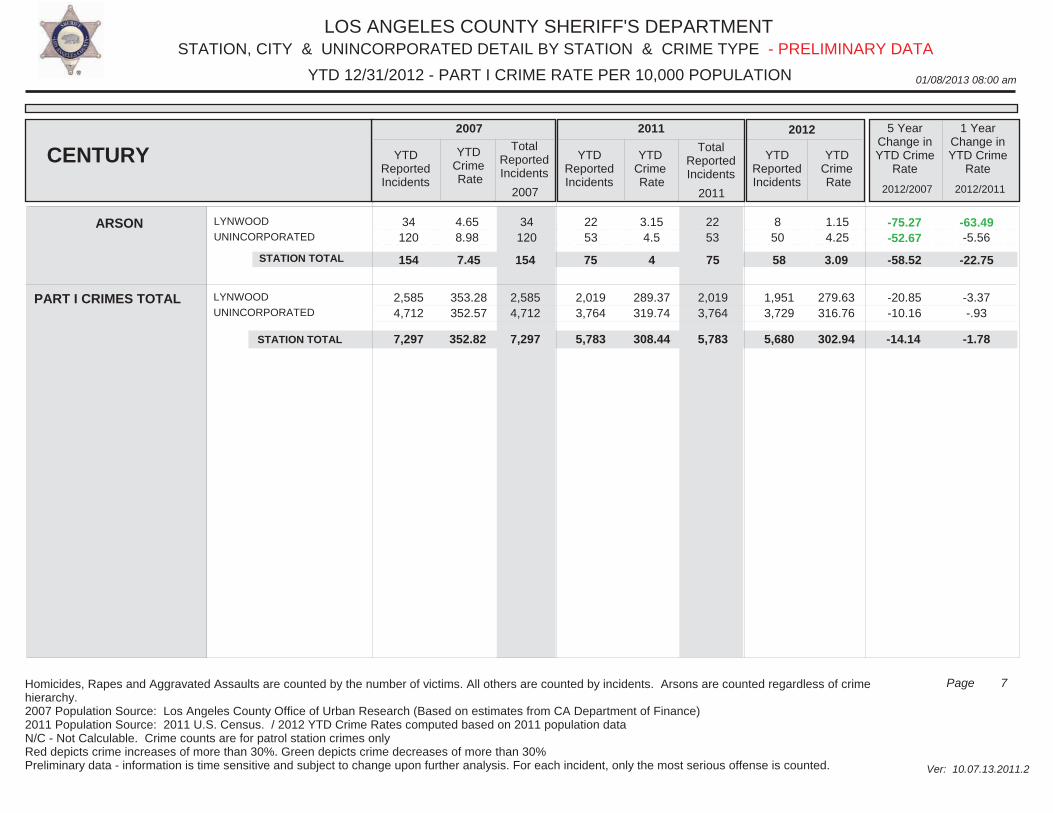
LOS ANGELES COUNTY SHERIFF'S DEPARTMENT
01/08/2013 08:00 am
STATION, CITY & UNINCORPORATED DETAIL BY STATION & CRIME TYPE
Ver: 10.07.13.2011.2
YTD 12/31/2012 - PART I CRIME RATE PER 10,000 POPULATION
7Page
- PRELIMINARY DATA
Homicides, Rapes and Aggravated Assaults are counted by the number of victims. All others are counted by incidents. Arsons are counted regardless of crime hierarchy.2007 Population Source: Los Angeles County Office of Urban Research (Based on estimates from CA Department of Finance)2011 Population Source: 2011 U.S. Census. / 2012 YTD Crime Rates computed based on 2011 population dataN/C - Not Calculable. Crime counts are for patrol station crimes only Red depicts crime increases of more than 30%. Green depicts crime decreases of more than 30%Preliminary data - information is time sensitive and subject to change upon further analysis. For each incident, only the most serious offense is counted.
LYNWOOD
UNINCORPORATED 34
120 34
120 22 53
22 53
8 50
4.658.98
3.154.5
1.154.25
-75.27-52.67
-63.49-5.56
ARSON
CENTURY YTDReportedIncidents
YTDCrime Rate
TotalReportedIncidents
YTDReportedIncidents
YTDCrime Rate
TotalReportedIncidents
YTDReportedIncidents
YTDCrime Rate
5 YearChange inYTD Crime
Rate
1 YearChange inYTD Crime
Rate
2007 2011 2012
2012/2007 2012/2011
PART I CRIMES TOTAL
STATION TOTAL
LYNWOOD
UNINCORPORATED 2,585 4,712
2007
2,019 3,764
2011
1,951 3,729
154 75 58
353.28352.57
2,585 4,712
154 75
289.37319.74
2,019 3,764
7.45 4
279.63316.76
3.09
-20.85-10.16
-22.75
STATION TOTAL
-3.37-.93
7,297 5,783
-58.52
5,680 7,297 5,783 302.94352.82 308.44 -14.14 -1.78
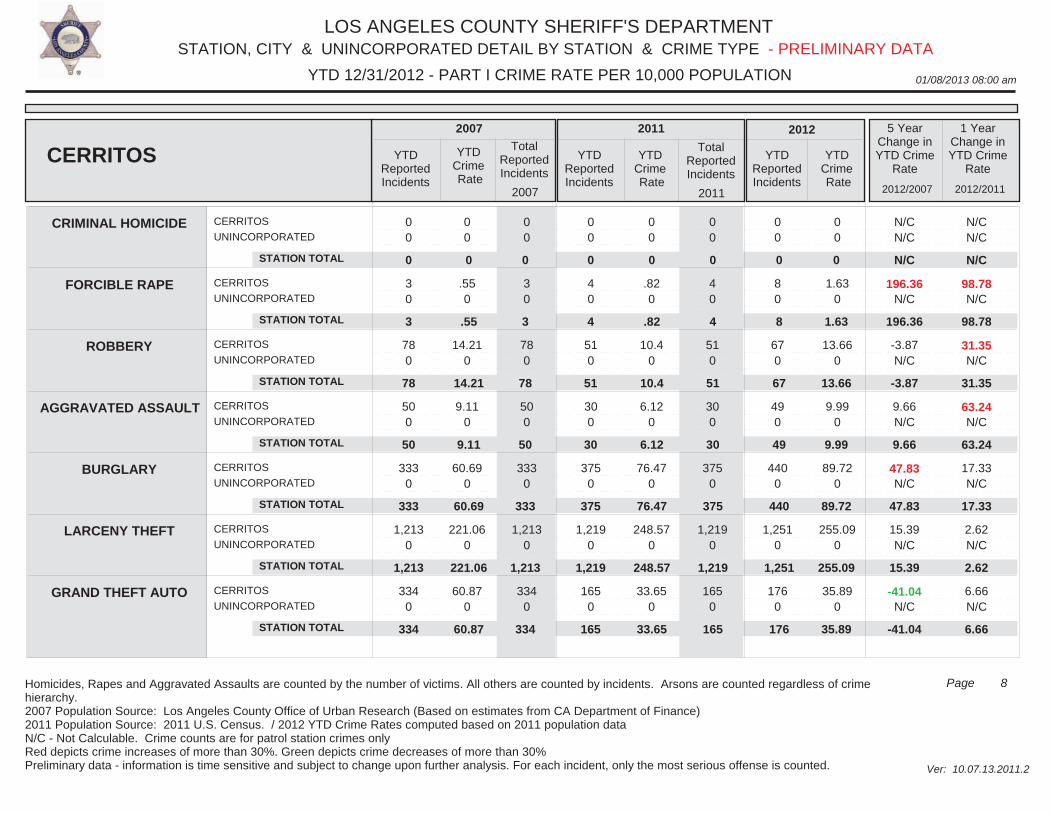
LOS ANGELES COUNTY SHERIFF'S DEPARTMENT
01/08/2013 08:00 am
STATION, CITY & UNINCORPORATED DETAIL BY STATION & CRIME TYPE
Ver: 10.07.13.2011.2
YTD 12/31/2012 - PART I CRIME RATE PER 10,000 POPULATION
8Page
- PRELIMINARY DATA
Homicides, Rapes and Aggravated Assaults are counted by the number of victims. All others are counted by incidents. Arsons are counted regardless of crime hierarchy.2007 Population Source: Los Angeles County Office of Urban Research (Based on estimates from CA Department of Finance)2011 Population Source: 2011 U.S. Census. / 2012 YTD Crime Rates computed based on 2011 population dataN/C - Not Calculable. Crime counts are for patrol station crimes only Red depicts crime increases of more than 30%. Green depicts crime decreases of more than 30%Preliminary data - information is time sensitive and subject to change upon further analysis. For each incident, only the most serious offense is counted.
CERRITOS
UNINCORPORATED
CERRITOS
UNINCORPORATED
CERRITOS
UNINCORPORATED
CERRITOS
UNINCORPORATED
CERRITOS
UNINCORPORATED
CERRITOS
UNINCORPORATED
CERRITOS
UNINCORPORATED
0 0
3 0
78 0
50 0
333 0
1,213 0
334 0
0 0
3 0
78 0
50 0
333 0
1,213 0
334 0
0 0
4 0
51 0
30 0
375 0
1,219 0
165 0
0 0
4 0
51 0
30 0
375 0
1,219 0
165 0
0 0
8 0
67 0
49 0
440 0
1,251 0
176 0
00
.550
14.210
9.110
60.690
221.060
60.870
00
.820
10.40
6.120
76.470
248.570
33.650
00
1.630
13.660
9.990
89.720
255.090
35.890
N/CN/C
196.36N/C
-3.87N/C
9.66N/C
47.83N/C
15.39N/C
-41.04N/C
N/CN/C
98.78N/C
31.35N/C
63.24N/C
17.33N/C
2.62N/C
6.66N/C
CRIMINAL HOMICIDE
FORCIBLE RAPE
ROBBERY
AGGRAVATED ASSAULT
BURGLARY
LARCENY THEFT
GRAND THEFT AUTO
CERRITOS YTDReportedIncidents
YTDCrime Rate
TotalReportedIncidents
YTDReportedIncidents
YTDCrime Rate
TotalReportedIncidents
YTDReportedIncidents
YTDCrime Rate
5 YearChange inYTD Crime
Rate
1 YearChange inYTD Crime
Rate
2007 2011 2012
2012/2007 2012/2011
STATION TOTAL
STATION TOTAL
STATION TOTAL
STATION TOTAL
STATION TOTAL
STATION TOTAL
STATION TOTAL
2007 2011
0
3
78
50
333
1,213
334
0
4
51
30
375
1,219
165
0
8
67
49
440
1,251
176
0
3
78
50
333
1,213
334
0
4
51
30
375
1,219
165
0
.55
14.21
9.11
60.69
221.06
60.87
0
.82
10.4
6.12
76.47
248.57
33.65
0
1.63
13.66
9.99
89.72
255.09
35.89
N/C
98.78
31.35
63.24
17.33
2.62
6.66
N/C
196.36
-3.87
9.66
47.83
15.39
-41.04
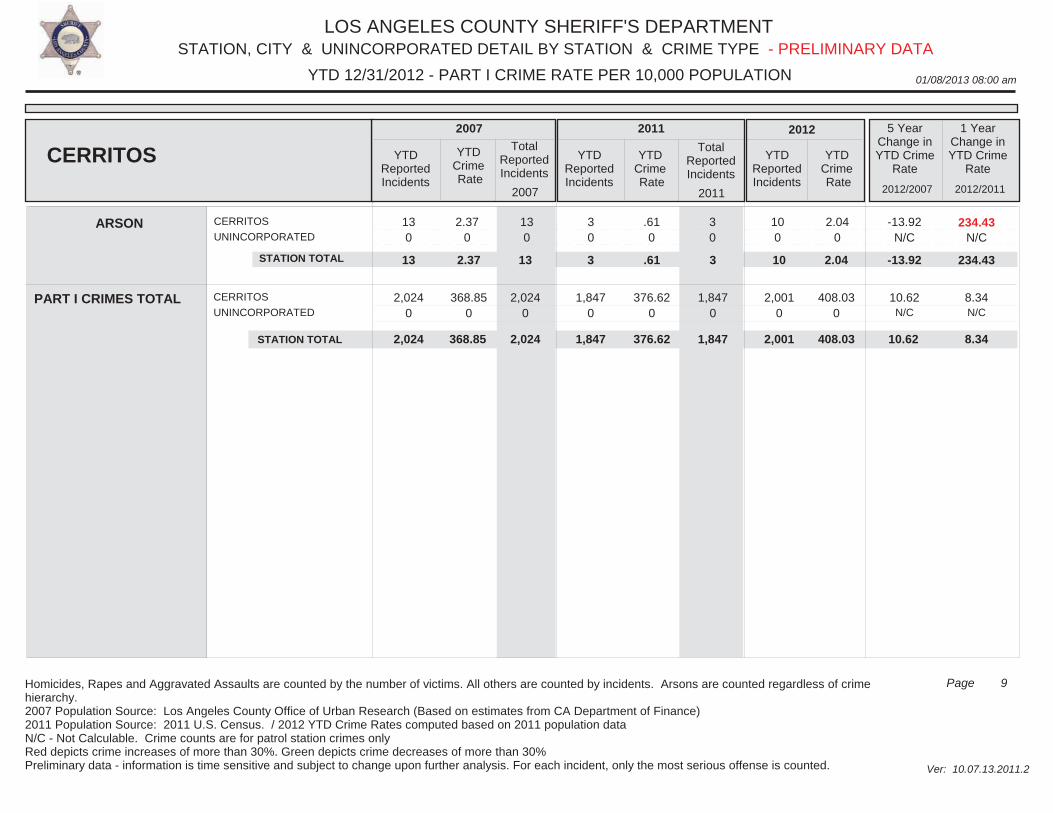
LOS ANGELES COUNTY SHERIFF'S DEPARTMENT
01/08/2013 08:00 am
STATION, CITY & UNINCORPORATED DETAIL BY STATION & CRIME TYPE
Ver: 10.07.13.2011.2
YTD 12/31/2012 - PART I CRIME RATE PER 10,000 POPULATION
9Page
- PRELIMINARY DATA
Homicides, Rapes and Aggravated Assaults are counted by the number of victims. All others are counted by incidents. Arsons are counted regardless of crime hierarchy.2007 Population Source: Los Angeles County Office of Urban Research (Based on estimates from CA Department of Finance)2011 Population Source: 2011 U.S. Census. / 2012 YTD Crime Rates computed based on 2011 population dataN/C - Not Calculable. Crime counts are for patrol station crimes only Red depicts crime increases of more than 30%. Green depicts crime decreases of more than 30%Preliminary data - information is time sensitive and subject to change upon further analysis. For each incident, only the most serious offense is counted.
CERRITOS
UNINCORPORATED 13 0
13 0
3 0
3 0
10 0
2.370
.610
2.040
-13.92N/C
234.43N/C
ARSON
CERRITOS YTDReportedIncidents
YTDCrime Rate
TotalReportedIncidents
YTDReportedIncidents
YTDCrime Rate
TotalReportedIncidents
YTDReportedIncidents
YTDCrime Rate
5 YearChange inYTD Crime
Rate
1 YearChange inYTD Crime
Rate
2007 2011 2012
2012/2007 2012/2011
PART I CRIMES TOTAL
STATION TOTAL
CERRITOS
UNINCORPORATED 2,024
0
2007
1,847 0
2011
2,001 0
13 3 10
368.850
2,024 0
13 3
376.620
1,847 0
2.37 .61
408.030
2.04
10.62N/C
234.43
STATION TOTAL
8.34N/C
2,024 1,847
-13.92
2,001 2,024 1,847 408.03368.85 376.62 10.62 8.34
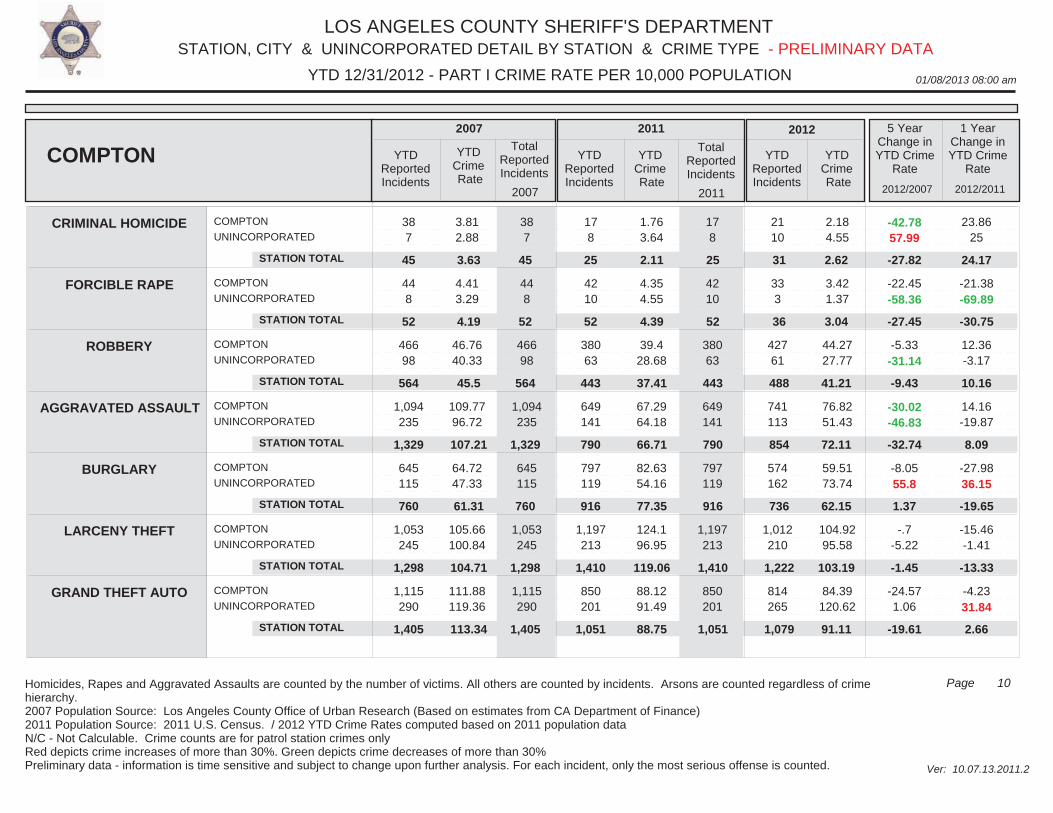
LOS ANGELES COUNTY SHERIFF'S DEPARTMENT
01/08/2013 08:00 am
STATION, CITY & UNINCORPORATED DETAIL BY STATION & CRIME TYPE
Ver: 10.07.13.2011.2
YTD 12/31/2012 - PART I CRIME RATE PER 10,000 POPULATION
10Page
- PRELIMINARY DATA
Homicides, Rapes and Aggravated Assaults are counted by the number of victims. All others are counted by incidents. Arsons are counted regardless of crime hierarchy.2007 Population Source: Los Angeles County Office of Urban Research (Based on estimates from CA Department of Finance)2011 Population Source: 2011 U.S. Census. / 2012 YTD Crime Rates computed based on 2011 population dataN/C - Not Calculable. Crime counts are for patrol station crimes only Red depicts crime increases of more than 30%. Green depicts crime decreases of more than 30%Preliminary data - information is time sensitive and subject to change upon further analysis. For each incident, only the most serious offense is counted.
COMPTON
UNINCORPORATED
COMPTON
UNINCORPORATED
COMPTON
UNINCORPORATED
COMPTON
UNINCORPORATED
COMPTON
UNINCORPORATED
COMPTON
UNINCORPORATED
COMPTON
UNINCORPORATED
38 7
44 8
466 98
1,094 235
645 115
1,053 245
1,115 290
38 7
44 8
466 98
1,094 235
645 115
1,053 245
1,115 290
17 8
42 10
380 63
649 141
797 119
1,197 213
850 201
17 8
42 10
380 63
649 141
797 119
1,197 213
850 201
21 10
33 3
427 61
741 113
574 162
1,012 210
814 265
3.812.88
4.413.29
46.7640.33
109.7796.72
64.7247.33
105.66100.84
111.88119.36
1.763.64
4.354.55
39.428.68
67.2964.18
82.6354.16
124.196.95
88.1291.49
2.184.55
3.421.37
44.2727.77
76.8251.43
59.5173.74
104.9295.58
84.39120.62
-42.7857.99
-22.45-58.36
-5.33-31.14
-30.02-46.83
-8.0555.8
-.7-5.22
-24.571.06
23.8625
-21.38-69.89
12.36-3.17
14.16-19.87
-27.9836.15
-15.46-1.41
-4.2331.84
CRIMINAL HOMICIDE
FORCIBLE RAPE
ROBBERY
AGGRAVATED ASSAULT
BURGLARY
LARCENY THEFT
GRAND THEFT AUTO
COMPTON YTDReportedIncidents
YTDCrime Rate
TotalReportedIncidents
YTDReportedIncidents
YTDCrime Rate
TotalReportedIncidents
YTDReportedIncidents
YTDCrime Rate
5 YearChange inYTD Crime
Rate
1 YearChange inYTD Crime
Rate
2007 2011 2012
2012/2007 2012/2011
STATION TOTAL
STATION TOTAL
STATION TOTAL
STATION TOTAL
STATION TOTAL
STATION TOTAL
STATION TOTAL
2007 2011
45
52
564
1,329
760
1,298
1,405
25
52
443
790
916
1,410
1,051
31
36
488
854
736
1,222
1,079
45
52
564
1,329
760
1,298
1,405
25
52
443
790
916
1,410
1,051
3.63
4.19
45.5
107.21
61.31
104.71
113.34
2.11
4.39
37.41
66.71
77.35
119.06
88.75
2.62
3.04
41.21
72.11
62.15
103.19
91.11
24.17
-30.75
10.16
8.09
-19.65
-13.33
2.66
-27.82
-27.45
-9.43
-32.74
1.37
-1.45
-19.61
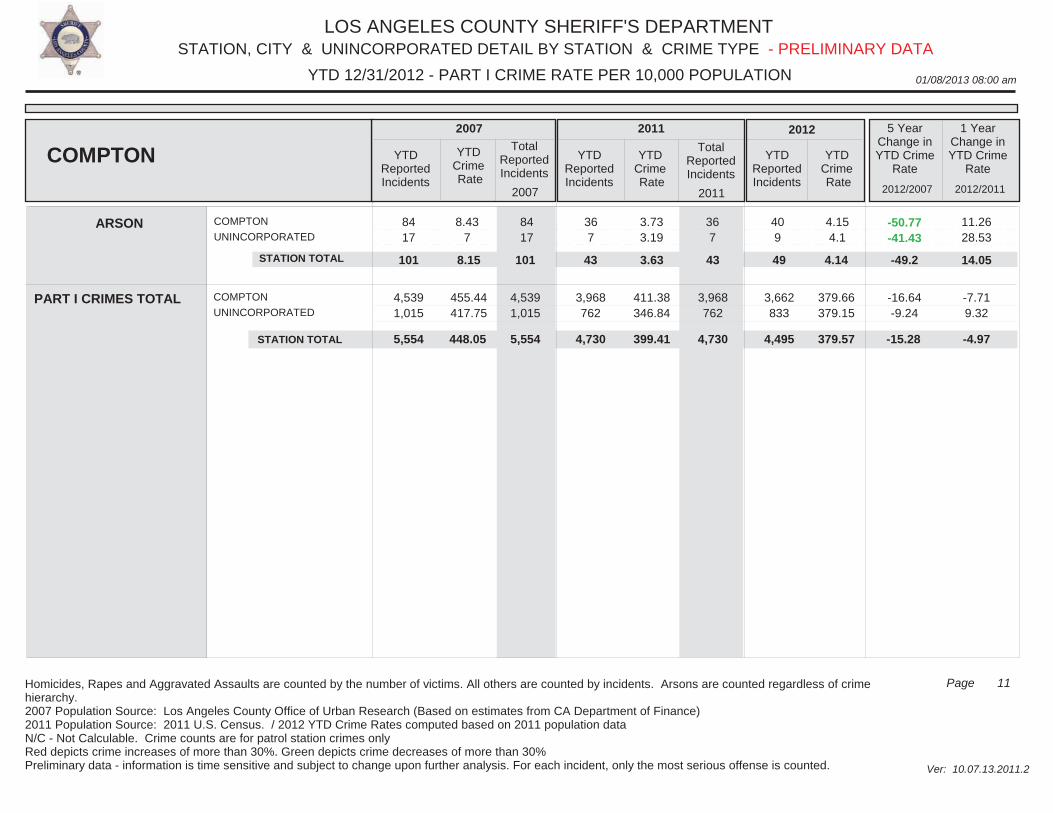
LOS ANGELES COUNTY SHERIFF'S DEPARTMENT
01/08/2013 08:00 am
STATION, CITY & UNINCORPORATED DETAIL BY STATION & CRIME TYPE
Ver: 10.07.13.2011.2
YTD 12/31/2012 - PART I CRIME RATE PER 10,000 POPULATION
11Page
- PRELIMINARY DATA
Homicides, Rapes and Aggravated Assaults are counted by the number of victims. All others are counted by incidents. Arsons are counted regardless of crime hierarchy.2007 Population Source: Los Angeles County Office of Urban Research (Based on estimates from CA Department of Finance)2011 Population Source: 2011 U.S. Census. / 2012 YTD Crime Rates computed based on 2011 population dataN/C - Not Calculable. Crime counts are for patrol station crimes only Red depicts crime increases of more than 30%. Green depicts crime decreases of more than 30%Preliminary data - information is time sensitive and subject to change upon further analysis. For each incident, only the most serious offense is counted.
COMPTON
UNINCORPORATED 84 17
84 17
36 7
36 7
40 9
8.437
3.733.19
4.154.1
-50.77-41.43
11.2628.53
ARSON
COMPTON YTDReportedIncidents
YTDCrime Rate
TotalReportedIncidents
YTDReportedIncidents
YTDCrime Rate
TotalReportedIncidents
YTDReportedIncidents
YTDCrime Rate
5 YearChange inYTD Crime
Rate
1 YearChange inYTD Crime
Rate
2007 2011 2012
2012/2007 2012/2011
PART I CRIMES TOTAL
STATION TOTAL
COMPTON
UNINCORPORATED 4,539 1,015
2007
3,968 762
2011
3,662 833
101 43 49
455.44417.75
4,539 1,015
101 43
411.38346.84
3,968 762
8.15 3.63
379.66379.15
4.14
-16.64-9.24
14.05
STATION TOTAL
-7.719.32
5,554 4,730
-49.2
4,495 5,554 4,730 379.57448.05 399.41 -15.28 -4.97
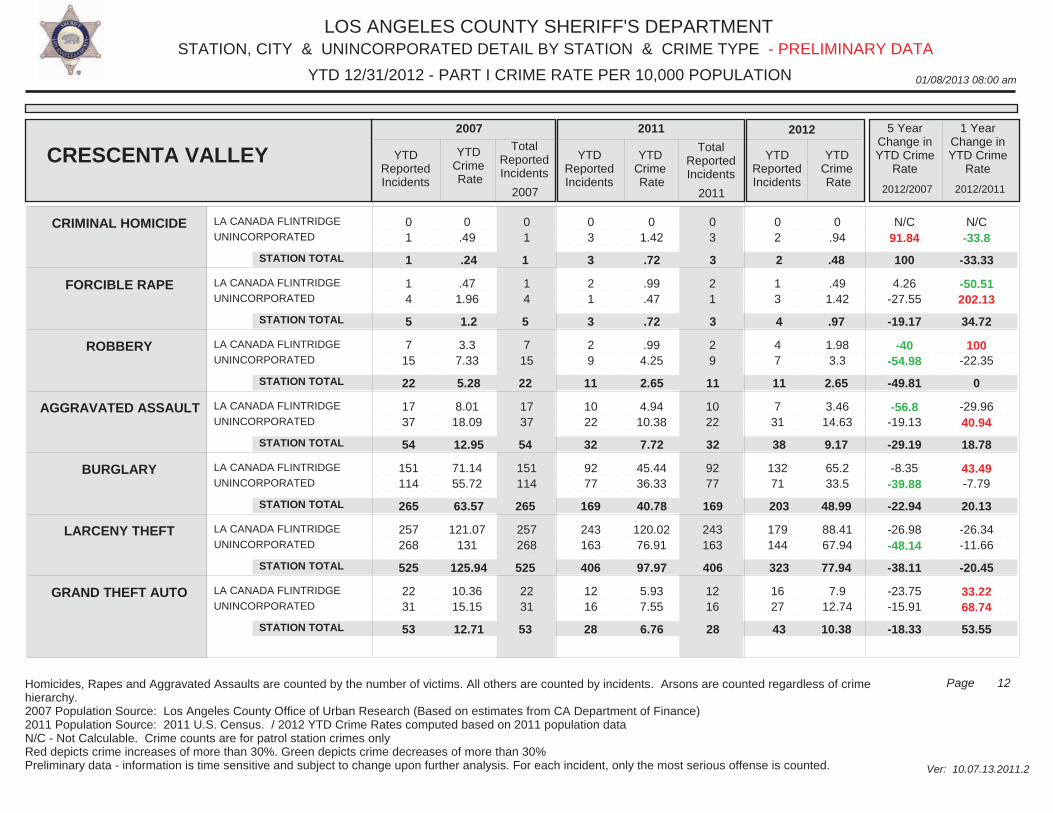
LOS ANGELES COUNTY SHERIFF'S DEPARTMENT
01/08/2013 08:00 am
STATION, CITY & UNINCORPORATED DETAIL BY STATION & CRIME TYPE
Ver: 10.07.13.2011.2
YTD 12/31/2012 - PART I CRIME RATE PER 10,000 POPULATION
12Page
- PRELIMINARY DATA
Homicides, Rapes and Aggravated Assaults are counted by the number of victims. All others are counted by incidents. Arsons are counted regardless of crime hierarchy.2007 Population Source: Los Angeles County Office of Urban Research (Based on estimates from CA Department of Finance)2011 Population Source: 2011 U.S. Census. / 2012 YTD Crime Rates computed based on 2011 population dataN/C - Not Calculable. Crime counts are for patrol station crimes only Red depicts crime increases of more than 30%. Green depicts crime decreases of more than 30%Preliminary data - information is time sensitive and subject to change upon further analysis. For each incident, only the most serious offense is counted.
LA CANADA FLINTRIDGE
UNINCORPORATED
LA CANADA FLINTRIDGE
UNINCORPORATED
LA CANADA FLINTRIDGE
UNINCORPORATED
LA CANADA FLINTRIDGE
UNINCORPORATED
LA CANADA FLINTRIDGE
UNINCORPORATED
LA CANADA FLINTRIDGE
UNINCORPORATED
LA CANADA FLINTRIDGE
UNINCORPORATED
0 1
1 4
7 15
17 37
151 114
257 268
22 31
0 1
1 4
7 15
17 37
151 114
257 268
22 31
0 3
2 1
2 9
10 22
92 77
243 163
12 16
0 3
2 1
2 9
10 22
92 77
243 163
12 16
0 2
1 3
4 7
7 31
132 71
179 144
16 27
0.49
.471.96
3.37.33
8.0118.09
71.1455.72
121.07131
10.3615.15
01.42
.99
.47
.994.25
4.9410.38
45.4436.33
120.0276.91
5.937.55
0.94
.491.42
1.983.3
3.4614.63
65.233.5
88.4167.94
7.912.74
N/C91.84
4.26-27.55
-40-54.98
-56.8-19.13
-8.35-39.88
-26.98-48.14
-23.75-15.91
N/C-33.8
-50.51202.13
100-22.35
-29.9640.94
43.49-7.79
-26.34-11.66
33.2268.74
CRIMINAL HOMICIDE
FORCIBLE RAPE
ROBBERY
AGGRAVATED ASSAULT
BURGLARY
LARCENY THEFT
GRAND THEFT AUTO
CRESCENTA VALLEY YTDReportedIncidents
YTDCrime Rate
TotalReportedIncidents
YTDReportedIncidents
YTDCrime Rate
TotalReportedIncidents
YTDReportedIncidents
YTDCrime Rate
5 YearChange inYTD Crime
Rate
1 YearChange inYTD Crime
Rate
2007 2011 2012
2012/2007 2012/2011
STATION TOTAL
STATION TOTAL
STATION TOTAL
STATION TOTAL
STATION TOTAL
STATION TOTAL
STATION TOTAL
2007 2011
1
5
22
54
265
525
53
3
3
11
32
169
406
28
2
4
11
38
203
323
43
1
5
22
54
265
525
53
3
3
11
32
169
406
28
.24
1.2
5.28
12.95
63.57
125.94
12.71
.72
.72
2.65
7.72
40.78
97.97
6.76
.48
.97
2.65
9.17
48.99
77.94
10.38
-33.33
34.72
0
18.78
20.13
-20.45
53.55
100
-19.17
-49.81
-29.19
-22.94
-38.11
-18.33
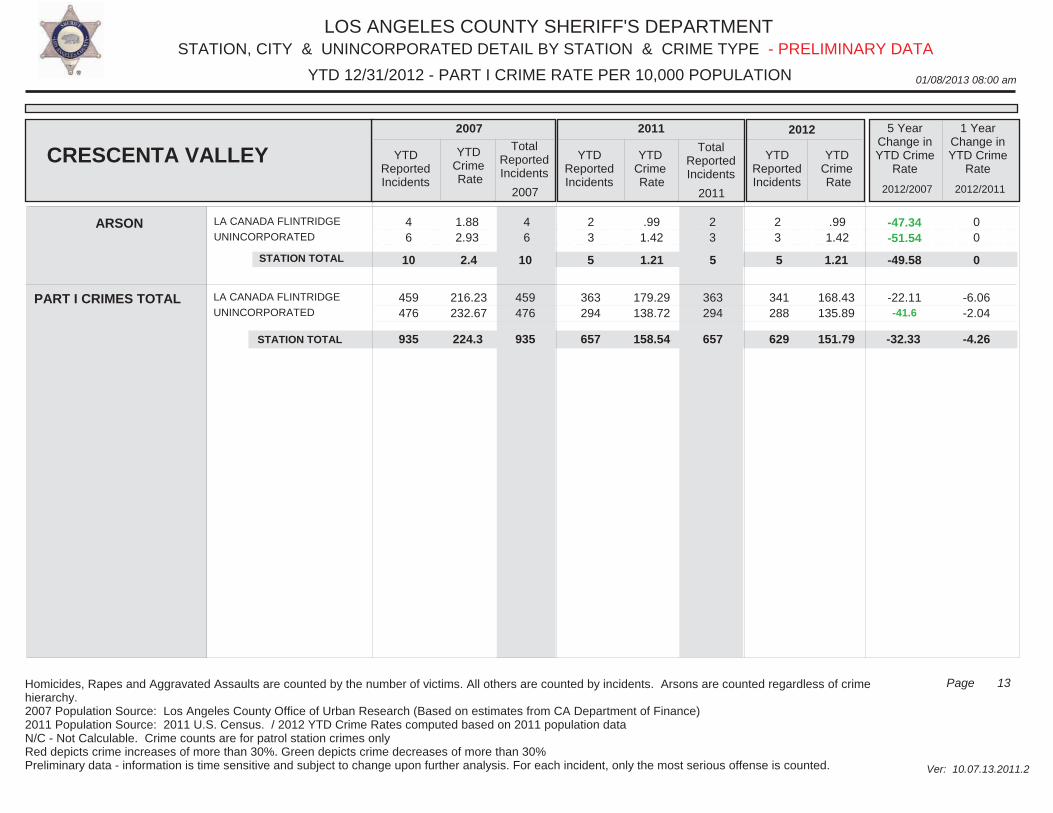
LOS ANGELES COUNTY SHERIFF'S DEPARTMENT
01/08/2013 08:00 am
STATION, CITY & UNINCORPORATED DETAIL BY STATION & CRIME TYPE
Ver: 10.07.13.2011.2
YTD 12/31/2012 - PART I CRIME RATE PER 10,000 POPULATION
13Page
- PRELIMINARY DATA
Homicides, Rapes and Aggravated Assaults are counted by the number of victims. All others are counted by incidents. Arsons are counted regardless of crime hierarchy.2007 Population Source: Los Angeles County Office of Urban Research (Based on estimates from CA Department of Finance)2011 Population Source: 2011 U.S. Census. / 2012 YTD Crime Rates computed based on 2011 population dataN/C - Not Calculable. Crime counts are for patrol station crimes only Red depicts crime increases of more than 30%. Green depicts crime decreases of more than 30%Preliminary data - information is time sensitive and subject to change upon further analysis. For each incident, only the most serious offense is counted.
LA CANADA FLINTRIDGE
UNINCORPORATED 4 6
4 6
2 3
2 3
2 3
1.882.93
.991.42
.991.42
-47.34-51.54
00
ARSON
CRESCENTA VALLEY YTDReportedIncidents
YTDCrime Rate
TotalReportedIncidents
YTDReportedIncidents
YTDCrime Rate
TotalReportedIncidents
YTDReportedIncidents
YTDCrime Rate
5 YearChange inYTD Crime
Rate
1 YearChange inYTD Crime
Rate
2007 2011 2012
2012/2007 2012/2011
PART I CRIMES TOTAL
STATION TOTAL
LA CANADA FLINTRIDGE
UNINCORPORATED 459 476
2007
363 294
2011
341 288
10 5 5
216.23232.67
459 476
10 5
179.29138.72
363 294
2.4 1.21
168.43135.89
1.21
-22.11-41.6
0
STATION TOTAL
-6.06-2.04
935 657
-49.58
629 935 657 151.79224.3 158.54 -32.33 -4.26
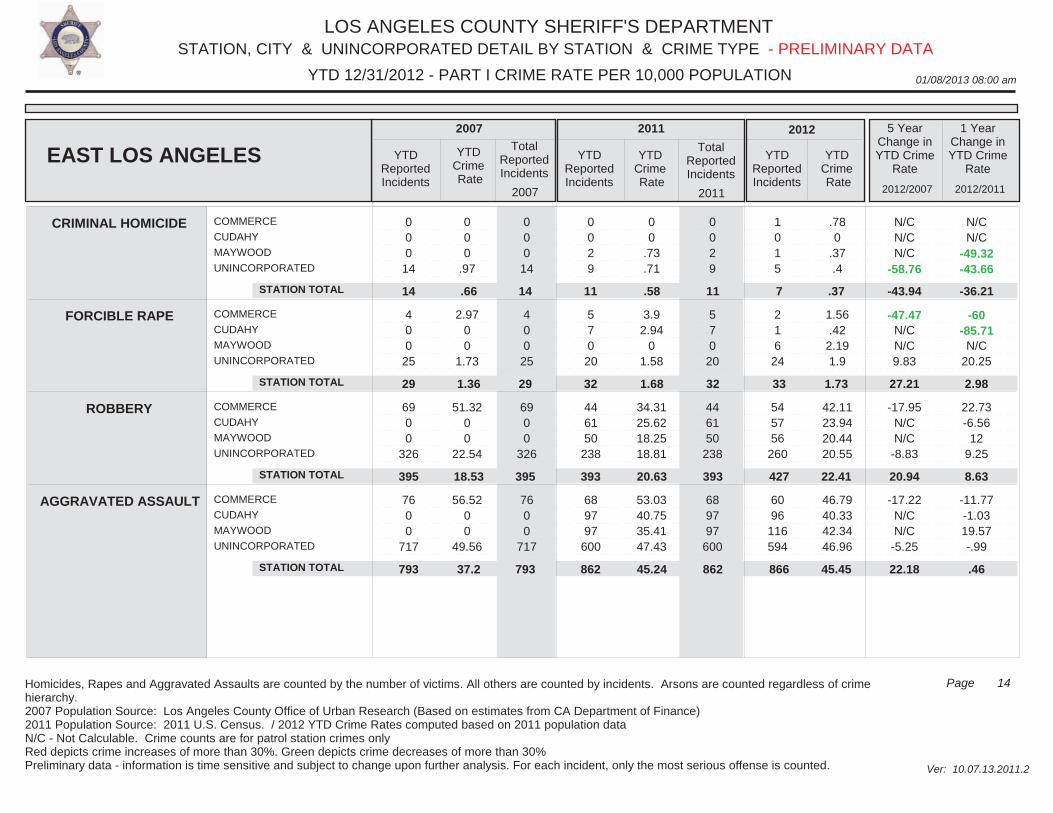
LOS ANGELES COUNTY SHERIFF'S DEPARTMENT
01/08/2013 08:00 am
STATION, CITY & UNINCORPORATED DETAIL BY STATION & CRIME TYPE
Ver: 10.07.13.2011.2
YTD 12/31/2012 - PART I CRIME RATE PER 10,000 POPULATION
14Page
- PRELIMINARY DATA
Homicides, Rapes and Aggravated Assaults are counted by the number of victims. All others are counted by incidents. Arsons are counted regardless of crime hierarchy.2007 Population Source: Los Angeles County Office of Urban Research (Based on estimates from CA Department of Finance)2011 Population Source: 2011 U.S. Census. / 2012 YTD Crime Rates computed based on 2011 population dataN/C - Not Calculable. Crime counts are for patrol station crimes only Red depicts crime increases of more than 30%. Green depicts crime decreases of more than 30%Preliminary data - information is time sensitive and subject to change upon further analysis. For each incident, only the most serious offense is counted.
COMMERCE
CUDAHY
MAYWOOD
UNINCORPORATED
COMMERCE
CUDAHY
MAYWOOD
UNINCORPORATED
COMMERCE
CUDAHY
MAYWOOD
UNINCORPORATED
COMMERCE
CUDAHY
MAYWOOD
UNINCORPORATED
0 0 0
14
4 0 0
25
69 0 0
326
76 0 0
717
0 0 0
14
4 0 0
25
69 0 0
326
76 0 0
717
0 0 2 9
5 7 0 20
44 61 50
238
68 97 97
600
0 0 2 9
5 7 0
20
44 61 50
238
68 97 97
600
1 0 1 5
2 1 6
24
54 57 56
260
60 96
116 594
000
.97
2.9700
1.73
51.3200
22.54
56.5200
49.56
00
.73
.71
3.92.94
01.58
34.3125.6218.2518.81
53.0340.7535.4147.43
.780
.37.4
1.56.42
2.191.9
42.1123.9420.4420.55
46.7940.3342.3446.96
N/CN/CN/C
-58.76
-47.47N/CN/C9.83
-17.95N/CN/C
-8.83
-17.22N/CN/C
-5.25
N/CN/C
-49.32-43.66
-60-85.71
N/C20.25
22.73-6.56
129.25
-11.77-1.0319.57-.99
CRIMINAL HOMICIDE
FORCIBLE RAPE
ROBBERY
AGGRAVATED ASSAULT
EAST LOS ANGELES YTDReportedIncidents
YTDCrime Rate
TotalReportedIncidents
YTDReportedIncidents
YTDCrime Rate
TotalReportedIncidents
YTDReportedIncidents
YTDCrime Rate
5 YearChange inYTD Crime
Rate
1 YearChange inYTD Crime
Rate
2007 2011 2012
2012/2007 2012/2011
STATION TOTAL
STATION TOTAL
STATION TOTAL
STATION TOTAL
2007 2011
14
29
395
793
11
32
393
862
7
33
427
866
14
29
395
793
11
32
393
862
.66
1.36
18.53
37.2
.58
1.68
20.63
45.24
.37
1.73
22.41
45.45
-36.21
2.98
8.63
.46
-43.94
27.21
20.94
22.18
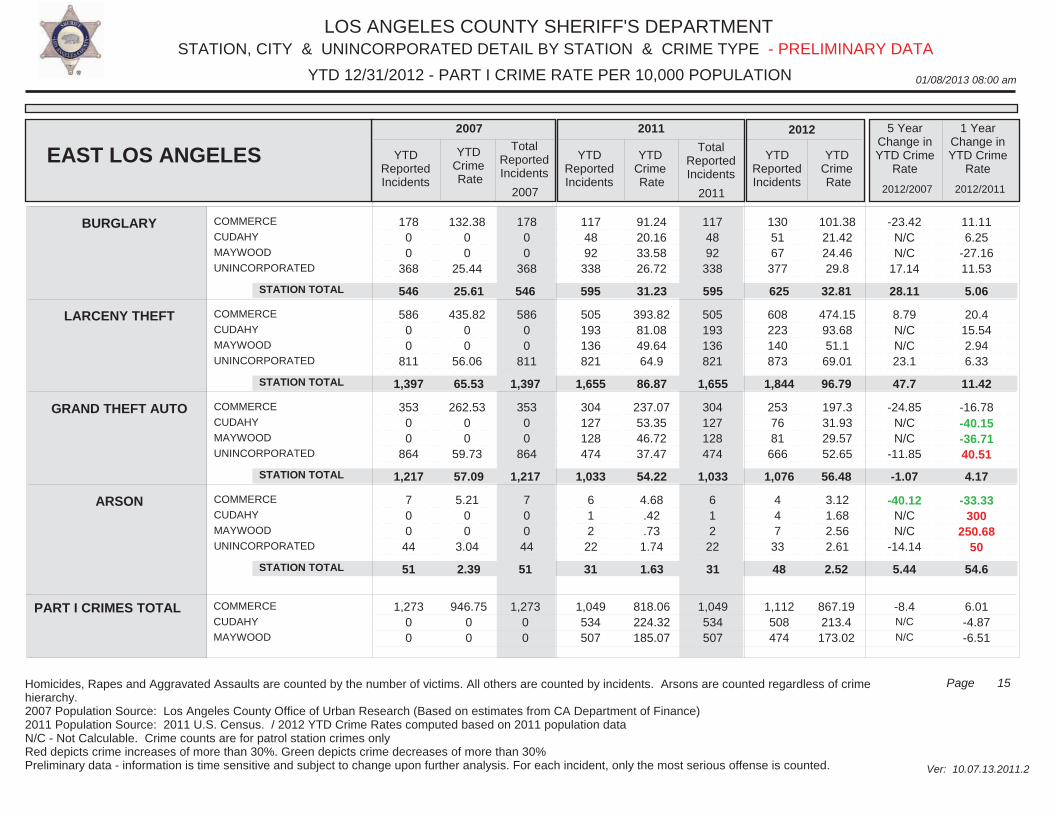
LOS ANGELES COUNTY SHERIFF'S DEPARTMENT
01/08/2013 08:00 am
STATION, CITY & UNINCORPORATED DETAIL BY STATION & CRIME TYPE
Ver: 10.07.13.2011.2
YTD 12/31/2012 - PART I CRIME RATE PER 10,000 POPULATION
15Page
- PRELIMINARY DATA
Homicides, Rapes and Aggravated Assaults are counted by the number of victims. All others are counted by incidents. Arsons are counted regardless of crime hierarchy.2007 Population Source: Los Angeles County Office of Urban Research (Based on estimates from CA Department of Finance)2011 Population Source: 2011 U.S. Census. / 2012 YTD Crime Rates computed based on 2011 population dataN/C - Not Calculable. Crime counts are for patrol station crimes only Red depicts crime increases of more than 30%. Green depicts crime decreases of more than 30%Preliminary data - information is time sensitive and subject to change upon further analysis. For each incident, only the most serious offense is counted.
COMMERCE
CUDAHY
MAYWOOD
UNINCORPORATED
COMMERCE
CUDAHY
MAYWOOD
UNINCORPORATED
COMMERCE
CUDAHY
MAYWOOD
UNINCORPORATED
COMMERCE
CUDAHY
MAYWOOD
UNINCORPORATED
178 0 0
368
586 0 0
811
353 0 0
864
7 0 0
44
178 0 0
368
586 0 0
811
353 0 0
864
7 0 0
44
117 48 92
338
505 193 136 821
304 127 128 474
6 1 2 22
117 48 92
338
505 193 136 821
304 127 128 474
6 1 2
22
130 51 67
377
608 223 140 873
253 76 81
666
4 4 7
33
132.3800
25.44
435.8200
56.06
262.5300
59.73
5.2100
3.04
91.2420.1633.5826.72
393.8281.0849.6464.9
237.0753.3546.7237.47
4.68.42.73
1.74
101.3821.4224.4629.8
474.1593.6851.1
69.01
197.331.9329.5752.65
3.121.682.562.61
-23.42N/CN/C
17.14
8.79N/CN/C23.1
-24.85N/CN/C
-11.85
-40.12N/CN/C
-14.14
11.116.25
-27.1611.53
20.415.542.946.33
-16.78-40.15-36.7140.51
-33.33300
250.6850
BURGLARY
LARCENY THEFT
GRAND THEFT AUTO
ARSON
EAST LOS ANGELES YTDReportedIncidents
YTDCrime Rate
TotalReportedIncidents
YTDReportedIncidents
YTDCrime Rate
TotalReportedIncidents
YTDReportedIncidents
YTDCrime Rate
5 YearChange inYTD Crime
Rate
1 YearChange inYTD Crime
Rate
2007 2011 2012
2012/2007 2012/2011
PART I CRIMES TOTAL
STATION TOTAL
STATION TOTAL
STATION TOTAL
STATION TOTAL
COMMERCE
CUDAHY
MAYWOOD
1,273 0 0
2007
1,049 534 507
2011
1,112 508 474
546
1,397
1,217
51
595
1,655
1,033
31
625
1,844
1,076
48
946.7500
1,273 0 0
546
1,397
1,217
51
595
1,655
1,033
31
818.06224.32185.07
1,049 534 507
25.61
65.53
57.09
2.39
31.23
86.87
54.22
1.63
867.19213.4
173.02
32.81
96.79
56.48
2.52
-8.4N/C
N/C
5.06
11.42
4.17
54.6
6.01-4.87-6.51
28.11
47.7
-1.07
5.44
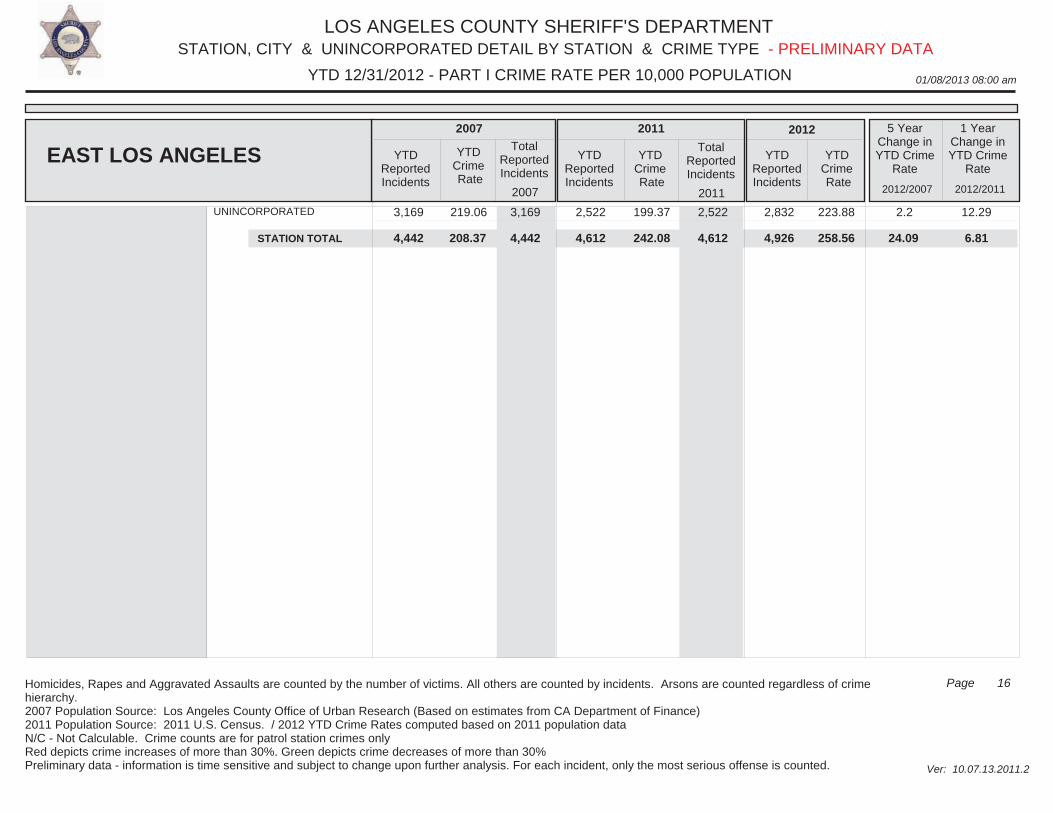
LOS ANGELES COUNTY SHERIFF'S DEPARTMENT
01/08/2013 08:00 am
STATION, CITY & UNINCORPORATED DETAIL BY STATION & CRIME TYPE
Ver: 10.07.13.2011.2
YTD 12/31/2012 - PART I CRIME RATE PER 10,000 POPULATION
16Page
- PRELIMINARY DATA
Homicides, Rapes and Aggravated Assaults are counted by the number of victims. All others are counted by incidents. Arsons are counted regardless of crime hierarchy.2007 Population Source: Los Angeles County Office of Urban Research (Based on estimates from CA Department of Finance)2011 Population Source: 2011 U.S. Census. / 2012 YTD Crime Rates computed based on 2011 population dataN/C - Not Calculable. Crime counts are for patrol station crimes only Red depicts crime increases of more than 30%. Green depicts crime decreases of more than 30%Preliminary data - information is time sensitive and subject to change upon further analysis. For each incident, only the most serious offense is counted.
EAST LOS ANGELES YTDReportedIncidents
YTDCrime Rate
TotalReportedIncidents
YTDReportedIncidents
YTDCrime Rate
TotalReportedIncidents
YTDReportedIncidents
YTDCrime Rate
5 YearChange inYTD Crime
Rate
1 YearChange inYTD Crime
Rate
2007 2011 2012
2012/2007 2012/2011
UNINCORPORATED 3,169
2007
2,522
2011
2,832219.06 3,169 199.37 2,522 223.88 2.2
STATION TOTAL
12.29
4,442 4,612 4,926 4,442 4,612 258.56208.37 242.08 24.09 6.81
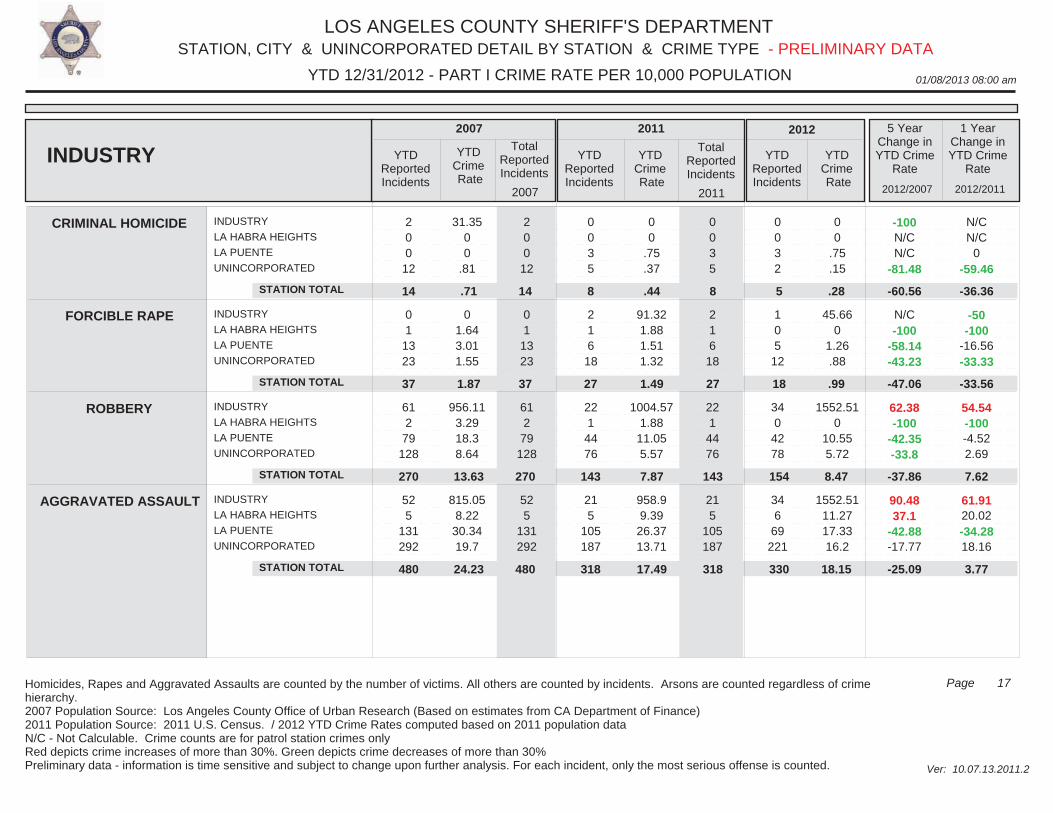
LOS ANGELES COUNTY SHERIFF'S DEPARTMENT
01/08/2013 08:00 am
STATION, CITY & UNINCORPORATED DETAIL BY STATION & CRIME TYPE
Ver: 10.07.13.2011.2
YTD 12/31/2012 - PART I CRIME RATE PER 10,000 POPULATION
17Page
- PRELIMINARY DATA
Homicides, Rapes and Aggravated Assaults are counted by the number of victims. All others are counted by incidents. Arsons are counted regardless of crime hierarchy.2007 Population Source: Los Angeles County Office of Urban Research (Based on estimates from CA Department of Finance)2011 Population Source: 2011 U.S. Census. / 2012 YTD Crime Rates computed based on 2011 population dataN/C - Not Calculable. Crime counts are for patrol station crimes only Red depicts crime increases of more than 30%. Green depicts crime decreases of more than 30%Preliminary data - information is time sensitive and subject to change upon further analysis. For each incident, only the most serious offense is counted.
INDUSTRY
LA HABRA HEIGHTS
LA PUENTE
UNINCORPORATED
INDUSTRY
LA HABRA HEIGHTS
LA PUENTE
UNINCORPORATED
INDUSTRY
LA HABRA HEIGHTS
LA PUENTE
UNINCORPORATED
INDUSTRY
LA HABRA HEIGHTS
LA PUENTE
UNINCORPORATED
2 0 0
12
0 1
13 23
61 2
79 128
52 5
131 292
2 0 0
12
0 1
13 23
61 2
79 128
52 5
131 292
0 0 3 5
2 1 6 18
22 1 44 76
21 5
105 187
0 0 3 5
2 1 6
18
22 1
44 76
21 5
105 187
0 0 3 2
1 0 5
12
34 0
42 78
34 6
69 221
31.3500
.81
01.643.011.55
956.113.2918.38.64
815.058.22
30.3419.7
00
.75
.37
91.321.881.511.32
1004.571.88
11.055.57
958.99.39
26.3713.71
00
.75
.15
45.660
1.26.88
1552.510
10.555.72
1552.5111.2717.3316.2
-100N/CN/C
-81.48
N/C-100
-58.14-43.23
62.38-100
-42.35-33.8
90.4837.1
-42.88-17.77
N/CN/C
0-59.46
-50-100
-16.56-33.33
54.54-100-4.522.69
61.9120.02-34.2818.16
CRIMINAL HOMICIDE
FORCIBLE RAPE
ROBBERY
AGGRAVATED ASSAULT
INDUSTRY YTDReportedIncidents
YTDCrime Rate
TotalReportedIncidents
YTDReportedIncidents
YTDCrime Rate
TotalReportedIncidents
YTDReportedIncidents
YTDCrime Rate
5 YearChange inYTD Crime
Rate
1 YearChange inYTD Crime
Rate
2007 2011 2012
2012/2007 2012/2011
STATION TOTAL
STATION TOTAL
STATION TOTAL
STATION TOTAL
2007 2011
14
37
270
480
8
27
143
318
5
18
154
330
14
37
270
480
8
27
143
318
.71
1.87
13.63
24.23
.44
1.49
7.87
17.49
.28
.99
8.47
18.15
-36.36
-33.56
7.62
3.77
-60.56
-47.06
-37.86
-25.09
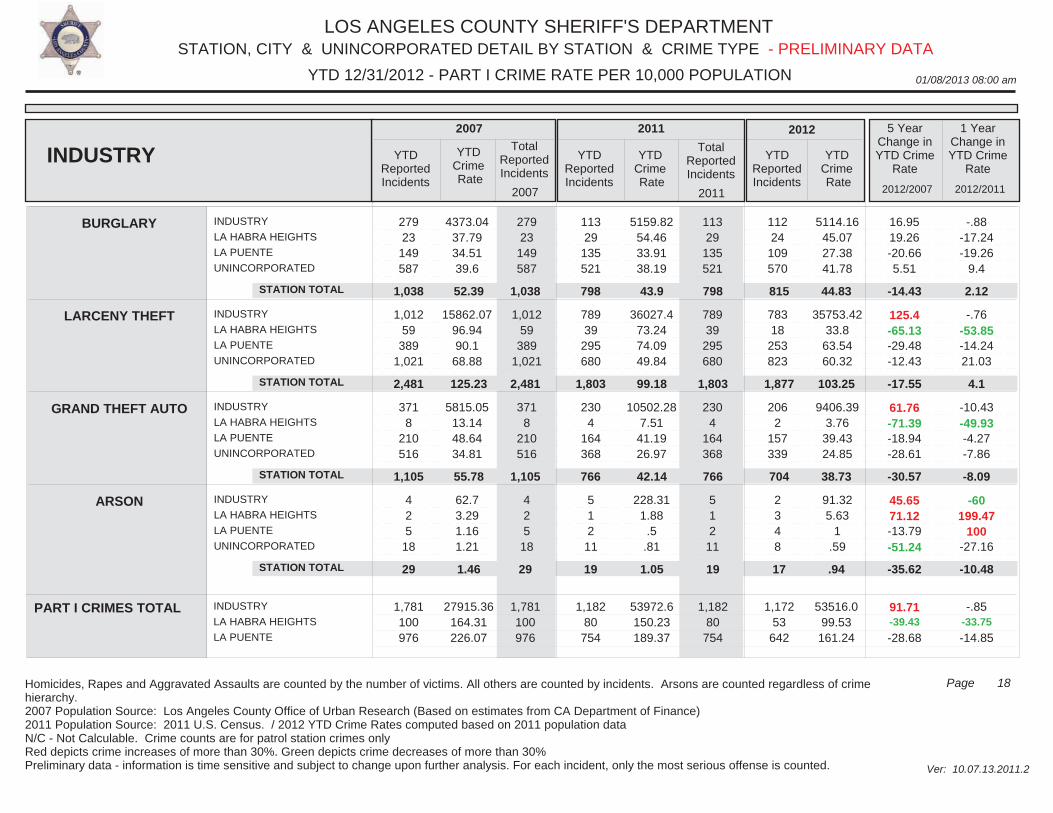
LOS ANGELES COUNTY SHERIFF'S DEPARTMENT
01/08/2013 08:00 am
STATION, CITY & UNINCORPORATED DETAIL BY STATION & CRIME TYPE
Ver: 10.07.13.2011.2
YTD 12/31/2012 - PART I CRIME RATE PER 10,000 POPULATION
18Page
- PRELIMINARY DATA
Homicides, Rapes and Aggravated Assaults are counted by the number of victims. All others are counted by incidents. Arsons are counted regardless of crime hierarchy.2007 Population Source: Los Angeles County Office of Urban Research (Based on estimates from CA Department of Finance)2011 Population Source: 2011 U.S. Census. / 2012 YTD Crime Rates computed based on 2011 population dataN/C - Not Calculable. Crime counts are for patrol station crimes only Red depicts crime increases of more than 30%. Green depicts crime decreases of more than 30%Preliminary data - information is time sensitive and subject to change upon further analysis. For each incident, only the most serious offense is counted.
INDUSTRY
LA HABRA HEIGHTS
LA PUENTE
UNINCORPORATED
INDUSTRY
LA HABRA HEIGHTS
LA PUENTE
UNINCORPORATED
INDUSTRY
LA HABRA HEIGHTS
LA PUENTE
UNINCORPORATED
INDUSTRY
LA HABRA HEIGHTS
LA PUENTE
UNINCORPORATED
279 23
149 587
1,012 59
389 1,021
371 8
210 516
4 2 5
18
279 23
149 587
1,012 59
389 1,021
371 8
210 516
4 2 5
18
113 29
135 521
789 39
295 680
230 4
164 368
5 1 2 11
113 29
135 521
789 39
295 680
230 4
164 368
5 1 2
11
112 24
109 570
783 18
253 823
206 2
157 339
2 3 4 8
4373.0437.7934.5139.6
15862.0796.9490.1
68.88
5815.0513.1448.6434.81
62.73.291.161.21
5159.8254.4633.9138.19
36027.473.2474.0949.84
10502.287.51
41.1926.97
228.311.88
.5.81
5114.1645.0727.3841.78
35753.4233.8
63.5460.32
9406.393.76
39.4324.85
91.325.63
1.59
16.9519.26-20.665.51
125.4-65.13-29.48-12.43
61.76-71.39-18.94-28.61
45.6571.12-13.79-51.24
-.88-17.24-19.26
9.4
-.76-53.85-14.2421.03
-10.43-49.93-4.27-7.86
-60199.47
100-27.16
BURGLARY
LARCENY THEFT
GRAND THEFT AUTO
ARSON
INDUSTRY YTDReportedIncidents
YTDCrime Rate
TotalReportedIncidents
YTDReportedIncidents
YTDCrime Rate
TotalReportedIncidents
YTDReportedIncidents
YTDCrime Rate
5 YearChange inYTD Crime
Rate
1 YearChange inYTD Crime
Rate
2007 2011 2012
2012/2007 2012/2011
PART I CRIMES TOTAL
STATION TOTAL
STATION TOTAL
STATION TOTAL
STATION TOTAL
INDUSTRY
LA HABRA HEIGHTS
LA PUENTE
1,781 100 976
2007
1,182 80
754
2011
1,172 53
642
1,038
2,481
1,105
29
798
1,803
766
19
815
1,877
704
17
27915.36164.31226.07
1,781 100 976
1,038
2,481
1,105
29
798
1,803
766
19
53972.6150.23189.37
1,182 80
754
52.39
125.23
55.78
1.46
43.9
99.18
42.14
1.05
53516.099.53
161.24
44.83
103.25
38.73
.94
91.71-39.43
-28.68
2.12
4.1
-8.09
-10.48
-.85-33.75
-14.85
-14.43
-17.55
-30.57
-35.62
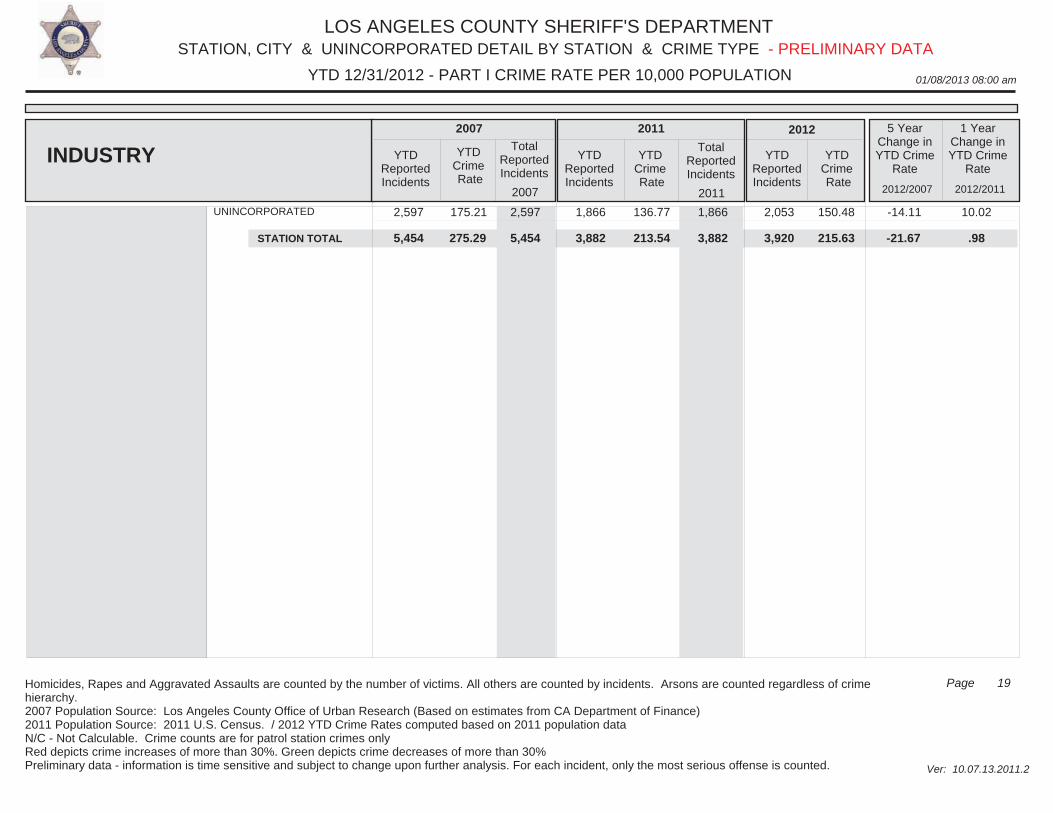
LOS ANGELES COUNTY SHERIFF'S DEPARTMENT
01/08/2013 08:00 am
STATION, CITY & UNINCORPORATED DETAIL BY STATION & CRIME TYPE
Ver: 10.07.13.2011.2
YTD 12/31/2012 - PART I CRIME RATE PER 10,000 POPULATION
19Page
- PRELIMINARY DATA
Homicides, Rapes and Aggravated Assaults are counted by the number of victims. All others are counted by incidents. Arsons are counted regardless of crime hierarchy.2007 Population Source: Los Angeles County Office of Urban Research (Based on estimates from CA Department of Finance)2011 Population Source: 2011 U.S. Census. / 2012 YTD Crime Rates computed based on 2011 population dataN/C - Not Calculable. Crime counts are for patrol station crimes only Red depicts crime increases of more than 30%. Green depicts crime decreases of more than 30%Preliminary data - information is time sensitive and subject to change upon further analysis. For each incident, only the most serious offense is counted.
INDUSTRY YTDReportedIncidents
YTDCrime Rate
TotalReportedIncidents
YTDReportedIncidents
YTDCrime Rate
TotalReportedIncidents
YTDReportedIncidents
YTDCrime Rate
5 YearChange inYTD Crime
Rate
1 YearChange inYTD Crime
Rate
2007 2011 2012
2012/2007 2012/2011
UNINCORPORATED 2,597
2007
1,866
2011
2,053175.21 2,597 136.77 1,866 150.48 -14.11
STATION TOTAL
10.02
5,454 3,882 3,920 5,454 3,882 215.63275.29 213.54 -21.67 .98
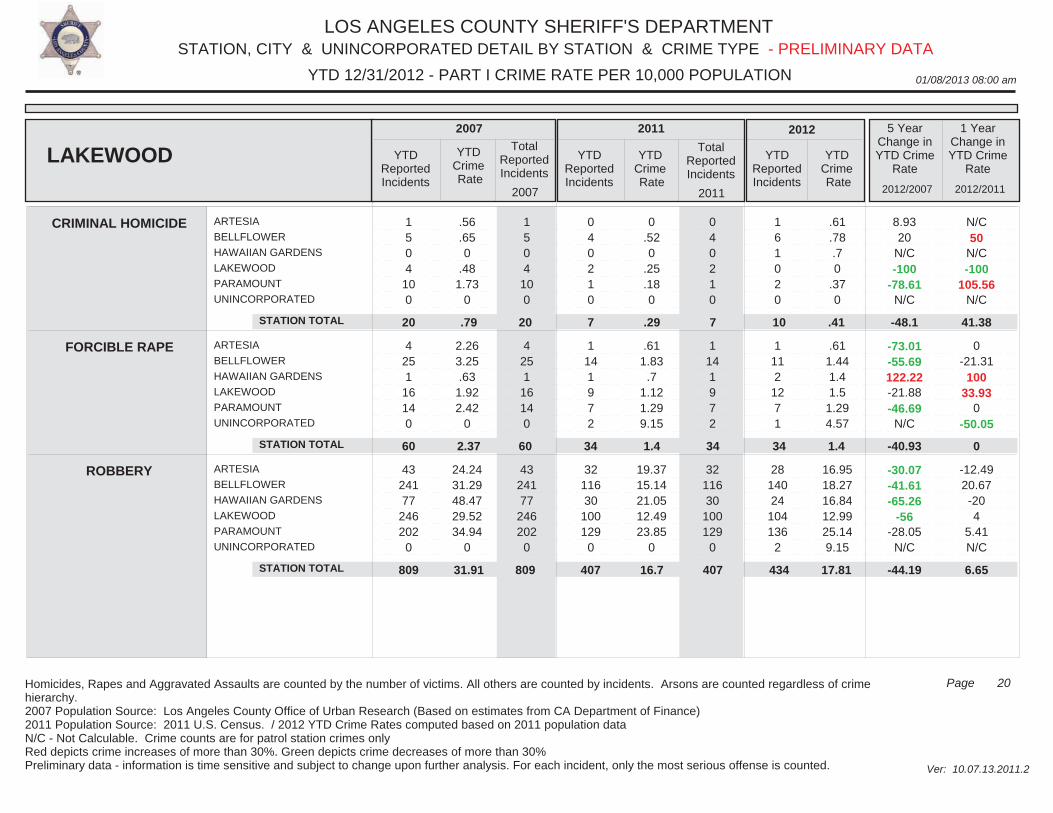
LOS ANGELES COUNTY SHERIFF'S DEPARTMENT
01/08/2013 08:00 am
STATION, CITY & UNINCORPORATED DETAIL BY STATION & CRIME TYPE
Ver: 10.07.13.2011.2
YTD 12/31/2012 - PART I CRIME RATE PER 10,000 POPULATION
20Page
- PRELIMINARY DATA
Homicides, Rapes and Aggravated Assaults are counted by the number of victims. All others are counted by incidents. Arsons are counted regardless of crime hierarchy.2007 Population Source: Los Angeles County Office of Urban Research (Based on estimates from CA Department of Finance)2011 Population Source: 2011 U.S. Census. / 2012 YTD Crime Rates computed based on 2011 population dataN/C - Not Calculable. Crime counts are for patrol station crimes only Red depicts crime increases of more than 30%. Green depicts crime decreases of more than 30%Preliminary data - information is time sensitive and subject to change upon further analysis. For each incident, only the most serious offense is counted.
ARTESIA
BELLFLOWER
HAWAIIAN GARDENS
LAKEWOOD
PARAMOUNT
UNINCORPORATED
ARTESIA
BELLFLOWER
HAWAIIAN GARDENS
LAKEWOOD
PARAMOUNT
UNINCORPORATED
ARTESIA
BELLFLOWER
HAWAIIAN GARDENS
LAKEWOOD
PARAMOUNT
UNINCORPORATED
1 5 0 4
10 0
4 25 1
16 14 0
43 241 77
246 202
0
1 5 0 4
10 0
4 25 1
16 14 0
43 241 77
246 202
0
0 4 0 2 1 0
1 14 1 9 7 2
32 116 30
100 129
0
0 4 0 2 1 0
1 14 1 9 7 2
32 116 30
100 129
0
1 6 1 0 2 0
1 11 2
12 7 1
28 140 24
104 136
2
.56
.650
.481.73
0
2.263.25.63
1.922.42
0
24.2431.2948.4729.5234.94
0
0.520
.25
.180
.611.83
.71.121.299.15
19.3715.1421.0512.4923.85
0
.61
.78.70
.370
.611.441.41.5
1.294.57
16.9518.2716.8412.9925.149.15
8.9320
N/C-100
-78.61N/C
-73.01-55.69122.22-21.88-46.69
N/C
-30.07-41.61-65.26
-56-28.05
N/C
N/C50
N/C-100
105.56N/C
0-21.31
10033.93
0-50.05
-12.4920.67-204
5.41N/C
CRIMINAL HOMICIDE
FORCIBLE RAPE
ROBBERY
LAKEWOOD YTDReportedIncidents
YTDCrime Rate
TotalReportedIncidents
YTDReportedIncidents
YTDCrime Rate
TotalReportedIncidents
YTDReportedIncidents
YTDCrime Rate
5 YearChange inYTD Crime
Rate
1 YearChange inYTD Crime
Rate
2007 2011 2012
2012/2007 2012/2011
STATION TOTAL
STATION TOTAL
STATION TOTAL
2007 2011
20
60
809
7
34
407
10
34
434
20
60
809
7
34
407
.79
2.37
31.91
.29
1.4
16.7
.41
1.4
17.81
41.38
0
6.65
-48.1
-40.93
-44.19
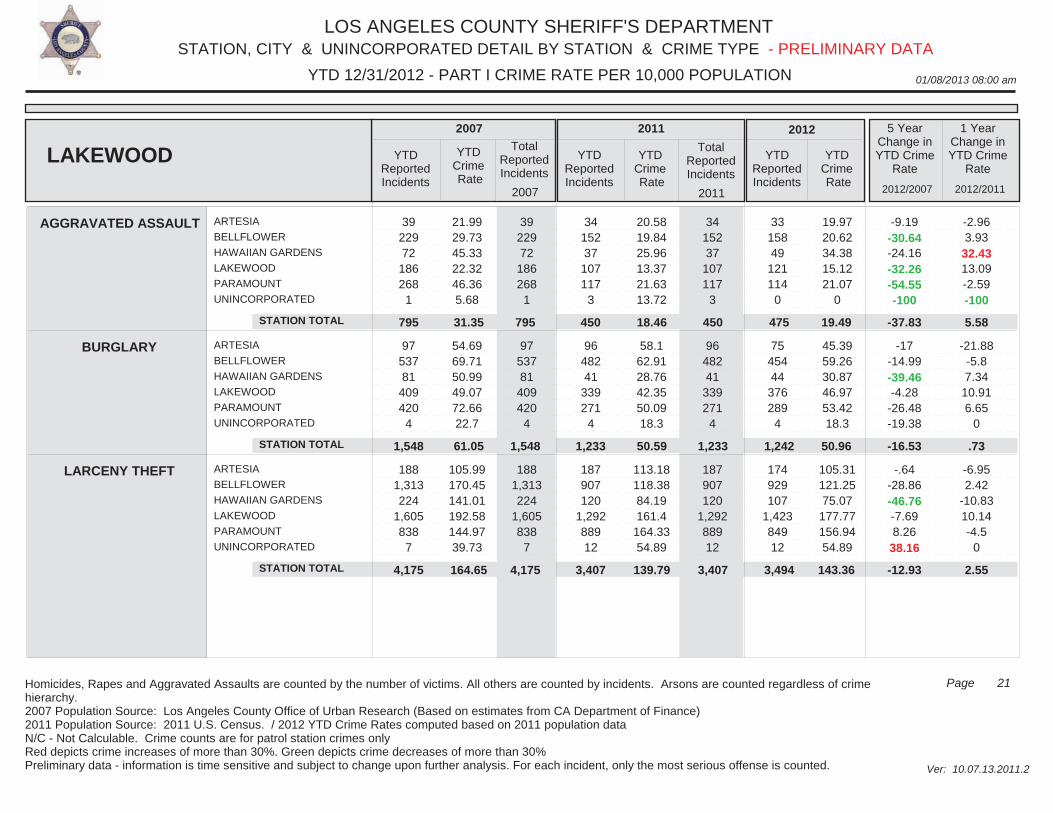
LOS ANGELES COUNTY SHERIFF'S DEPARTMENT
01/08/2013 08:00 am
STATION, CITY & UNINCORPORATED DETAIL BY STATION & CRIME TYPE
Ver: 10.07.13.2011.2
YTD 12/31/2012 - PART I CRIME RATE PER 10,000 POPULATION
21Page
- PRELIMINARY DATA
Homicides, Rapes and Aggravated Assaults are counted by the number of victims. All others are counted by incidents. Arsons are counted regardless of crime hierarchy.2007 Population Source: Los Angeles County Office of Urban Research (Based on estimates from CA Department of Finance)2011 Population Source: 2011 U.S. Census. / 2012 YTD Crime Rates computed based on 2011 population dataN/C - Not Calculable. Crime counts are for patrol station crimes only Red depicts crime increases of more than 30%. Green depicts crime decreases of more than 30%Preliminary data - information is time sensitive and subject to change upon further analysis. For each incident, only the most serious offense is counted.
ARTESIA
BELLFLOWER
HAWAIIAN GARDENS
LAKEWOOD
PARAMOUNT
UNINCORPORATED
ARTESIA
BELLFLOWER
HAWAIIAN GARDENS
LAKEWOOD
PARAMOUNT
UNINCORPORATED
ARTESIA
BELLFLOWER
HAWAIIAN GARDENS
LAKEWOOD
PARAMOUNT
UNINCORPORATED
39 229 72
186 268
1
97 537 81
409 420
4
188 1,313 224
1,605 838
7
39 229 72
186 268
1
97 537 81
409 420
4
188 1,313 224
1,605 838
7
34 152 37
107 117
3
96 482 41
339 271
4
187 907 120
1,292 889 12
34 152 37
107 117
3
96 482 41
339 271
4
187 907 120
1,292 889 12
33 158 49
121 114
0
75 454 44
376 289
4
174 929 107
1,423 849 12
21.9929.7345.3322.3246.365.68
54.6969.7150.9949.0772.6622.7
105.99170.45141.01192.58144.9739.73
20.5819.8425.9613.3721.6313.72
58.162.9128.7642.3550.0918.3
113.18118.3884.19161.4
164.3354.89
19.9720.6234.3815.1221.07
0
45.3959.2630.8746.9753.4218.3
105.31121.2575.07
177.77156.9454.89
-9.19-30.64-24.16-32.26-54.55-100
-17-14.99-39.46-4.28
-26.48-19.38
-.64-28.86-46.76-7.698.26
38.16
-2.963.93
32.4313.09-2.59-100
-21.88-5.87.34
10.916.65
0
-6.952.42
-10.8310.14-4.5
0
AGGRAVATED ASSAULT
BURGLARY
LARCENY THEFT
LAKEWOOD YTDReportedIncidents
YTDCrime Rate
TotalReportedIncidents
YTDReportedIncidents
YTDCrime Rate
TotalReportedIncidents
YTDReportedIncidents
YTDCrime Rate
5 YearChange inYTD Crime
Rate
1 YearChange inYTD Crime
Rate
2007 2011 2012
2012/2007 2012/2011
STATION TOTAL
STATION TOTAL
STATION TOTAL
2007 2011
795
1,548
4,175
450
1,233
3,407
475
1,242
3,494
795
1,548
4,175
450
1,233
3,407
31.35
61.05
164.65
18.46
50.59
139.79
19.49
50.96
143.36
5.58
.73
2.55
-37.83
-16.53
-12.93
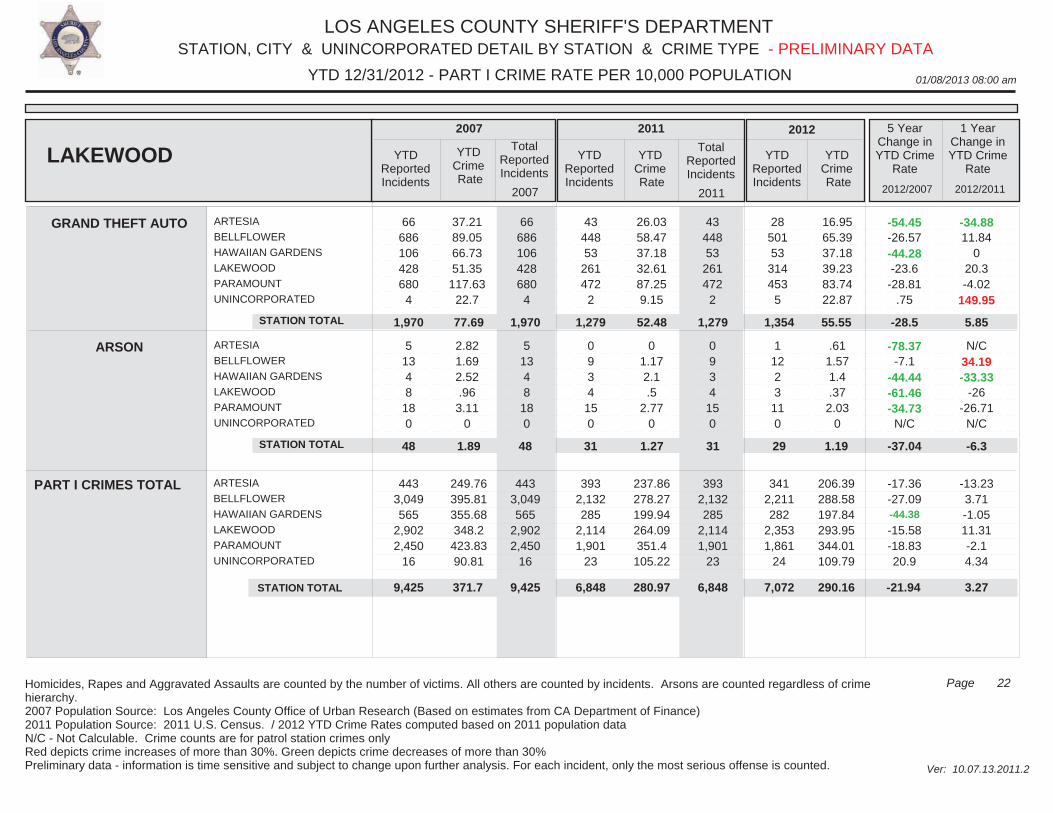
LOS ANGELES COUNTY SHERIFF'S DEPARTMENT
01/08/2013 08:00 am
STATION, CITY & UNINCORPORATED DETAIL BY STATION & CRIME TYPE
Ver: 10.07.13.2011.2
YTD 12/31/2012 - PART I CRIME RATE PER 10,000 POPULATION
22Page
- PRELIMINARY DATA
Homicides, Rapes and Aggravated Assaults are counted by the number of victims. All others are counted by incidents. Arsons are counted regardless of crime hierarchy.2007 Population Source: Los Angeles County Office of Urban Research (Based on estimates from CA Department of Finance)2011 Population Source: 2011 U.S. Census. / 2012 YTD Crime Rates computed based on 2011 population dataN/C - Not Calculable. Crime counts are for patrol station crimes only Red depicts crime increases of more than 30%. Green depicts crime decreases of more than 30%Preliminary data - information is time sensitive and subject to change upon further analysis. For each incident, only the most serious offense is counted.
ARTESIA
BELLFLOWER
HAWAIIAN GARDENS
LAKEWOOD
PARAMOUNT
UNINCORPORATED
ARTESIA
BELLFLOWER
HAWAIIAN GARDENS
LAKEWOOD
PARAMOUNT
UNINCORPORATED
66 686 106 428 680
4
5 13 4 8
18 0
66 686 106 428 680
4
5 13 4 8
18 0
43 448 53
261 472
2
0 9 3 4 15 0
43 448 53
261 472
2
0 9 3 4
15 0
28 501 53
314 453
5
1 12 2 3
11 0
37.2189.0566.7351.35
117.6322.7
2.821.692.52.96
3.110
26.0358.4737.1832.6187.259.15
01.172.1.5
2.770
16.9565.3937.1839.2383.7422.87
.611.571.4.37
2.030
-54.45-26.57-44.28-23.6
-28.81.75
-78.37-7.1
-44.44-61.46-34.73
N/C
-34.8811.84
020.3-4.02
149.95
N/C34.19-33.33
-26-26.71
N/C
GRAND THEFT AUTO
ARSON
LAKEWOOD YTDReportedIncidents
YTDCrime Rate
TotalReportedIncidents
YTDReportedIncidents
YTDCrime Rate
TotalReportedIncidents
YTDReportedIncidents
YTDCrime Rate
5 YearChange inYTD Crime
Rate
1 YearChange inYTD Crime
Rate
2007 2011 2012
2012/2007 2012/2011
PART I CRIMES TOTAL
STATION TOTAL
STATION TOTAL
ARTESIA
BELLFLOWER
HAWAIIAN GARDENS
LAKEWOOD
PARAMOUNT
UNINCORPORATED
443 3,049 565
2,902 2,450
16
2007
393 2,132 285
2,114 1,901
23
2011
341 2,211 282
2,353 1,861
24
1,970
48
1,279
31
1,354
29
249.76395.81355.68348.2
423.8390.81
443 3,049 565
2,902 2,450
16
1,970
48
1,279
31
237.86278.27199.94264.09351.4
105.22
393 2,132 285
2,114 1,901
23
77.69
1.89
52.48
1.27
206.39288.58197.84293.95344.01109.79
55.55
1.19
-17.36-27.09-44.38
-15.58-18.8320.9
5.85
-6.3
STATION TOTAL
-13.233.71-1.0511.31-2.14.34
9,425 6,848
-28.5
-37.04
7,072 9,425 6,848 290.16371.7 280.97 -21.94 3.27
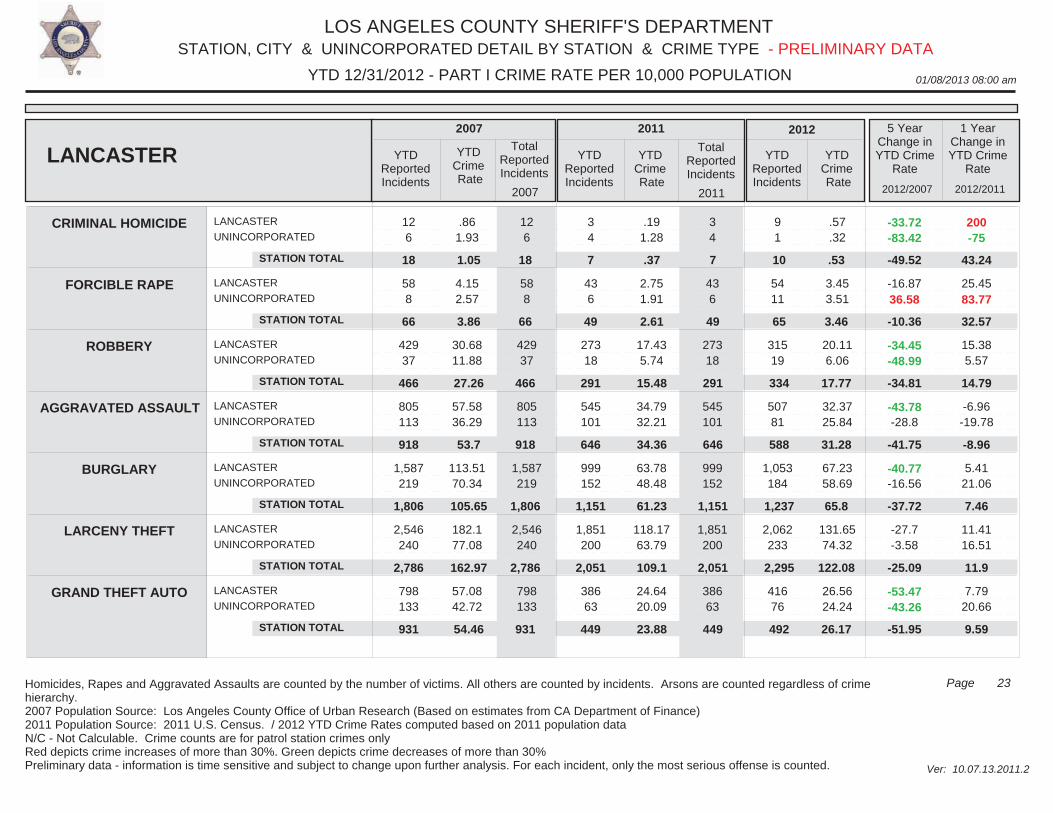
LOS ANGELES COUNTY SHERIFF'S DEPARTMENT
01/08/2013 08:00 am
STATION, CITY & UNINCORPORATED DETAIL BY STATION & CRIME TYPE
Ver: 10.07.13.2011.2
YTD 12/31/2012 - PART I CRIME RATE PER 10,000 POPULATION
23Page
- PRELIMINARY DATA
Homicides, Rapes and Aggravated Assaults are counted by the number of victims. All others are counted by incidents. Arsons are counted regardless of crime hierarchy.2007 Population Source: Los Angeles County Office of Urban Research (Based on estimates from CA Department of Finance)2011 Population Source: 2011 U.S. Census. / 2012 YTD Crime Rates computed based on 2011 population dataN/C - Not Calculable. Crime counts are for patrol station crimes only Red depicts crime increases of more than 30%. Green depicts crime decreases of more than 30%Preliminary data - information is time sensitive and subject to change upon further analysis. For each incident, only the most serious offense is counted.
LANCASTER
UNINCORPORATED
LANCASTER
UNINCORPORATED
LANCASTER
UNINCORPORATED
LANCASTER
UNINCORPORATED
LANCASTER
UNINCORPORATED
LANCASTER
UNINCORPORATED
LANCASTER
UNINCORPORATED
12 6
58 8
429 37
805 113
1,587 219
2,546 240
798 133
12 6
58 8
429 37
805 113
1,587 219
2,546 240
798 133
3 4
43 6
273 18
545 101
999 152
1,851 200
386 63
3 4
43 6
273 18
545 101
999 152
1,851 200
386 63
9 1
54 11
315 19
507 81
1,053 184
2,062 233
416 76
.861.93
4.152.57
30.6811.88
57.5836.29
113.5170.34
182.177.08
57.0842.72
.191.28
2.751.91
17.435.74
34.7932.21
63.7848.48
118.1763.79
24.6420.09
.57
.32
3.453.51
20.116.06
32.3725.84
67.2358.69
131.6574.32
26.5624.24
-33.72-83.42
-16.8736.58
-34.45-48.99
-43.78-28.8
-40.77-16.56
-27.7-3.58
-53.47-43.26
200-75
25.4583.77
15.385.57
-6.96-19.78
5.4121.06
11.4116.51
7.7920.66
CRIMINAL HOMICIDE
FORCIBLE RAPE
ROBBERY
AGGRAVATED ASSAULT
BURGLARY
LARCENY THEFT
GRAND THEFT AUTO
LANCASTER YTDReportedIncidents
YTDCrime Rate
TotalReportedIncidents
YTDReportedIncidents
YTDCrime Rate
TotalReportedIncidents
YTDReportedIncidents
YTDCrime Rate
5 YearChange inYTD Crime
Rate
1 YearChange inYTD Crime
Rate
2007 2011 2012
2012/2007 2012/2011
STATION TOTAL
STATION TOTAL
STATION TOTAL
STATION TOTAL
STATION TOTAL
STATION TOTAL
STATION TOTAL
2007 2011
18
66
466
918
1,806
2,786
931
7
49
291
646
1,151
2,051
449
10
65
334
588
1,237
2,295
492
18
66
466
918
1,806
2,786
931
7
49
291
646
1,151
2,051
449
1.05
3.86
27.26
53.7
105.65
162.97
54.46
.37
2.61
15.48
34.36
61.23
109.1
23.88
.53
3.46
17.77
31.28
65.8
122.08
26.17
43.24
32.57
14.79
-8.96
7.46
11.9
9.59
-49.52
-10.36
-34.81
-41.75
-37.72
-25.09
-51.95
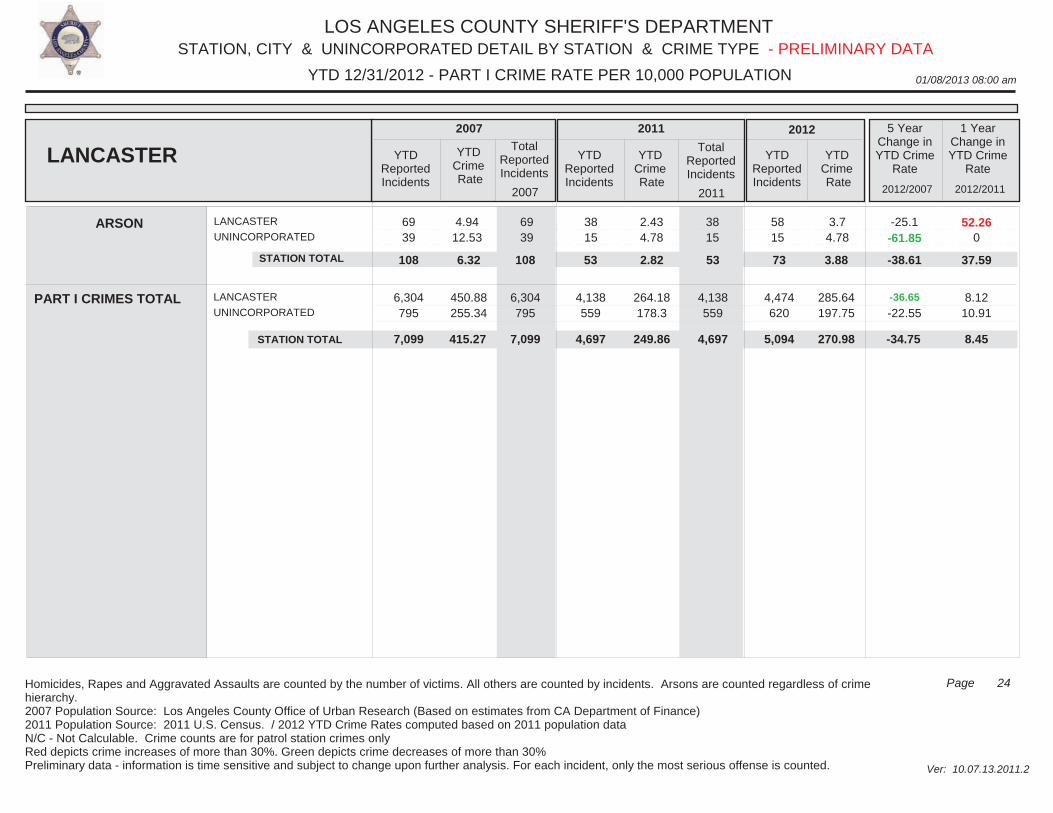
LOS ANGELES COUNTY SHERIFF'S DEPARTMENT
01/08/2013 08:00 am
STATION, CITY & UNINCORPORATED DETAIL BY STATION & CRIME TYPE
Ver: 10.07.13.2011.2
YTD 12/31/2012 - PART I CRIME RATE PER 10,000 POPULATION
24Page
- PRELIMINARY DATA
Homicides, Rapes and Aggravated Assaults are counted by the number of victims. All others are counted by incidents. Arsons are counted regardless of crime hierarchy.2007 Population Source: Los Angeles County Office of Urban Research (Based on estimates from CA Department of Finance)2011 Population Source: 2011 U.S. Census. / 2012 YTD Crime Rates computed based on 2011 population dataN/C - Not Calculable. Crime counts are for patrol station crimes only Red depicts crime increases of more than 30%. Green depicts crime decreases of more than 30%Preliminary data - information is time sensitive and subject to change upon further analysis. For each incident, only the most serious offense is counted.
LANCASTER
UNINCORPORATED 69 39
69 39
38 15
38 15
58 15
4.9412.53
2.434.78
3.74.78
-25.1-61.85
52.260
ARSON
LANCASTER YTDReportedIncidents
YTDCrime Rate
TotalReportedIncidents
YTDReportedIncidents
YTDCrime Rate
TotalReportedIncidents
YTDReportedIncidents
YTDCrime Rate
5 YearChange inYTD Crime
Rate
1 YearChange inYTD Crime
Rate
2007 2011 2012
2012/2007 2012/2011
PART I CRIMES TOTAL
STATION TOTAL
LANCASTER
UNINCORPORATED 6,304 795
2007
4,138 559
2011
4,474 620
108 53 73
450.88255.34
6,304 795
108 53
264.18178.3
4,138 559
6.32 2.82
285.64197.75
3.88
-36.65
-22.55
37.59
STATION TOTAL
8.1210.91
7,099 4,697
-38.61
5,094 7,099 4,697 270.98415.27 249.86 -34.75 8.45
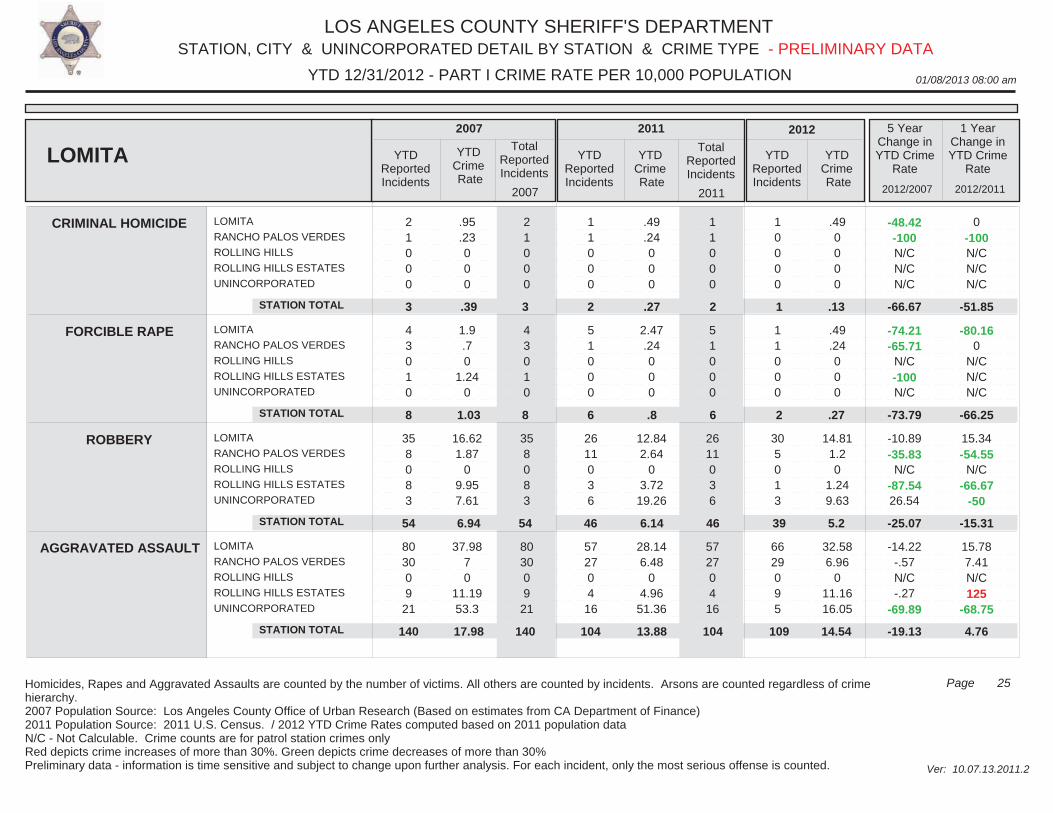
LOS ANGELES COUNTY SHERIFF'S DEPARTMENT
01/08/2013 08:00 am
STATION, CITY & UNINCORPORATED DETAIL BY STATION & CRIME TYPE
Ver: 10.07.13.2011.2
YTD 12/31/2012 - PART I CRIME RATE PER 10,000 POPULATION
25Page
- PRELIMINARY DATA
Homicides, Rapes and Aggravated Assaults are counted by the number of victims. All others are counted by incidents. Arsons are counted regardless of crime hierarchy.2007 Population Source: Los Angeles County Office of Urban Research (Based on estimates from CA Department of Finance)2011 Population Source: 2011 U.S. Census. / 2012 YTD Crime Rates computed based on 2011 population dataN/C - Not Calculable. Crime counts are for patrol station crimes only Red depicts crime increases of more than 30%. Green depicts crime decreases of more than 30%Preliminary data - information is time sensitive and subject to change upon further analysis. For each incident, only the most serious offense is counted.
LOMITA
RANCHO PALOS VERDES
ROLLING HILLS
ROLLING HILLS ESTATES
UNINCORPORATED
LOMITA
RANCHO PALOS VERDES
ROLLING HILLS
ROLLING HILLS ESTATES
UNINCORPORATED
LOMITA
RANCHO PALOS VERDES
ROLLING HILLS
ROLLING HILLS ESTATES
UNINCORPORATED
LOMITA
RANCHO PALOS VERDES
ROLLING HILLS
ROLLING HILLS ESTATES
UNINCORPORATED
2 1 0 0 0
4 3 0 1 0
35 8 0 8 3
80 30 0 9
21
2 1 0 0 0
4 3 0 1 0
35 8 0 8 3
80 30 0 9
21
1 1 0 0 0
5 1 0 0 0
26 11 0 3 6
57 27 0 4 16
1 1 0 0 0
5 1 0 0 0
26 11 0 3 6
57 27 0 4
16
1 0 0 0 0
1 1 0 0 0
30 5 0 1 3
66 29 0 9 5
.95
.23000
1.9.70
1.240
16.621.87
09.957.61
37.9870
11.1953.3
.49
.24000
2.47.24000
12.842.64
03.72
19.26
28.146.48
04.96
51.36
.490000
.49
.24000
14.811.20
1.249.63
32.586.96
011.1616.05
-48.42-100N/CN/CN/C
-74.21-65.71
N/C-100N/C
-10.89-35.83
N/C-87.5426.54
-14.22-.57N/C-.27
-69.89
0-100N/CN/CN/C
-80.160
N/CN/CN/C
15.34-54.55
N/C-66.67
-50
15.787.41N/C125
-68.75
CRIMINAL HOMICIDE
FORCIBLE RAPE
ROBBERY
AGGRAVATED ASSAULT
LOMITA YTDReportedIncidents
YTDCrime Rate
TotalReportedIncidents
YTDReportedIncidents
YTDCrime Rate
TotalReportedIncidents
YTDReportedIncidents
YTDCrime Rate
5 YearChange inYTD Crime
Rate
1 YearChange inYTD Crime
Rate
2007 2011 2012
2012/2007 2012/2011
STATION TOTAL
STATION TOTAL
STATION TOTAL
STATION TOTAL
2007 2011
3
8
54
140
2
6
46
104
1
2
39
109
3
8
54
140
2
6
46
104
.39
1.03
6.94
17.98
.27
.8
6.14
13.88
.13
.27
5.2
14.54
-51.85
-66.25
-15.31
4.76
-66.67
-73.79
-25.07
-19.13
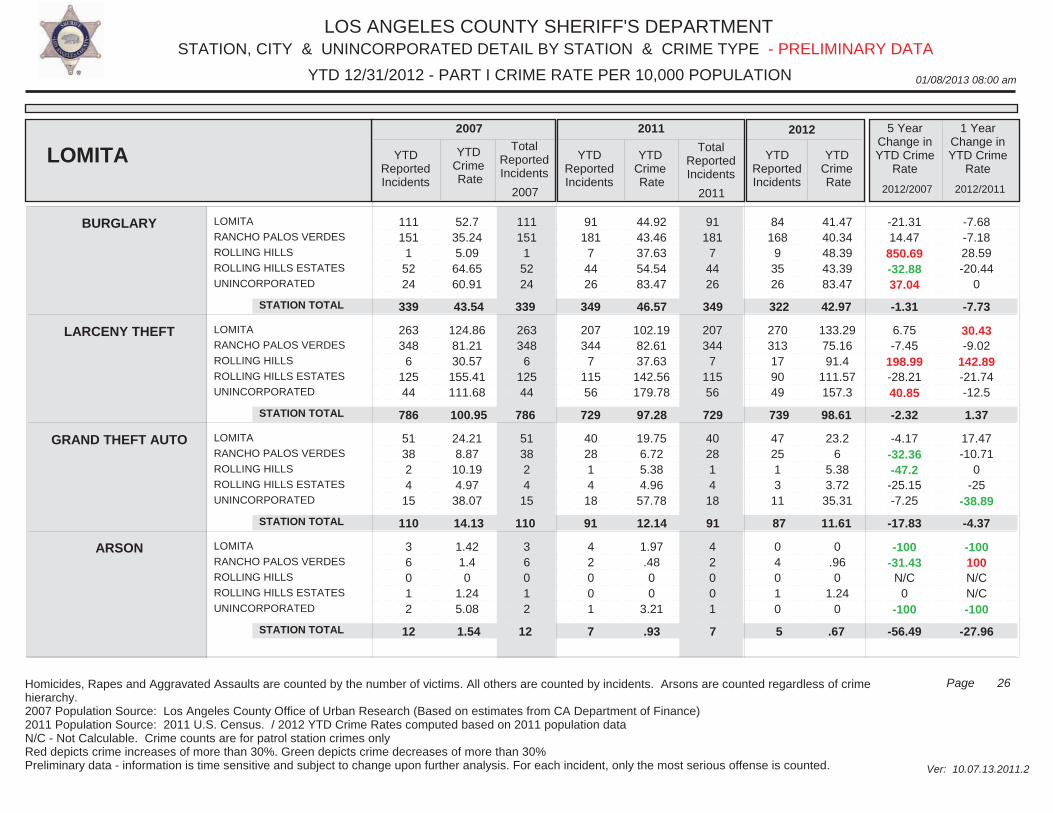
LOS ANGELES COUNTY SHERIFF'S DEPARTMENT
01/08/2013 08:00 am
STATION, CITY & UNINCORPORATED DETAIL BY STATION & CRIME TYPE
Ver: 10.07.13.2011.2
YTD 12/31/2012 - PART I CRIME RATE PER 10,000 POPULATION
26Page
- PRELIMINARY DATA
Homicides, Rapes and Aggravated Assaults are counted by the number of victims. All others are counted by incidents. Arsons are counted regardless of crime hierarchy.2007 Population Source: Los Angeles County Office of Urban Research (Based on estimates from CA Department of Finance)2011 Population Source: 2011 U.S. Census. / 2012 YTD Crime Rates computed based on 2011 population dataN/C - Not Calculable. Crime counts are for patrol station crimes only Red depicts crime increases of more than 30%. Green depicts crime decreases of more than 30%Preliminary data - information is time sensitive and subject to change upon further analysis. For each incident, only the most serious offense is counted.
LOMITA
RANCHO PALOS VERDES
ROLLING HILLS
ROLLING HILLS ESTATES
UNINCORPORATED
LOMITA
RANCHO PALOS VERDES
ROLLING HILLS
ROLLING HILLS ESTATES
UNINCORPORATED
LOMITA
RANCHO PALOS VERDES
ROLLING HILLS
ROLLING HILLS ESTATES
UNINCORPORATED
LOMITA
RANCHO PALOS VERDES
ROLLING HILLS
ROLLING HILLS ESTATES
UNINCORPORATED
111 151
1 52 24
263 348
6 125 44
51 38 2 4
15
3 6 0 1 2
111 151
1 52 24
263 348
6 125 44
51 38 2 4
15
3 6 0 1 2
91 181
7 44 26
207 344
7 115 56
40 28 1 4 18
4 2 0 0 1
91 181
7 44 26
207 344
7 115 56
40 28 1 4
18
4 2 0 0 1
84 168
9 35 26
270 313 17 90 49
47 25 1 3
11
0 4 0 1 0
52.735.245.09
64.6560.91
124.8681.2130.57
155.41111.68
24.218.87
10.194.97
38.07
1.421.40
1.245.08
44.9243.4637.6354.5483.47
102.1982.6137.63
142.56179.78
19.756.725.384.96
57.78
1.97.4800
3.21
41.4740.3448.3943.3983.47
133.2975.1691.4
111.57157.3
23.26
5.383.72
35.31
0.960
1.240
-21.3114.47
850.69-32.8837.04
6.75-7.45
198.99-28.2140.85
-4.17-32.36-47.2
-25.15-7.25
-100-31.43
N/C0
-100
-7.68-7.1828.59-20.44
0
30.43-9.02
142.89-21.74-12.5
17.47-10.71
0-25
-38.89
-100100N/CN/C-100
BURGLARY
LARCENY THEFT
GRAND THEFT AUTO
ARSON
LOMITA YTDReportedIncidents
YTDCrime Rate
TotalReportedIncidents
YTDReportedIncidents
YTDCrime Rate
TotalReportedIncidents
YTDReportedIncidents
YTDCrime Rate
5 YearChange inYTD Crime
Rate
1 YearChange inYTD Crime
Rate
2007 2011 2012
2012/2007 2012/2011
STATION TOTAL
STATION TOTAL
STATION TOTAL
STATION TOTAL
2007 2011
339
786
110
12
349
729
91
7
322
739
87
5
339
786
110
12
349
729
91
7
43.54
100.95
14.13
1.54
46.57
97.28
12.14
.93
42.97
98.61
11.61
.67
-7.73
1.37
-4.37
-27.96
-1.31
-2.32
-17.83
-56.49
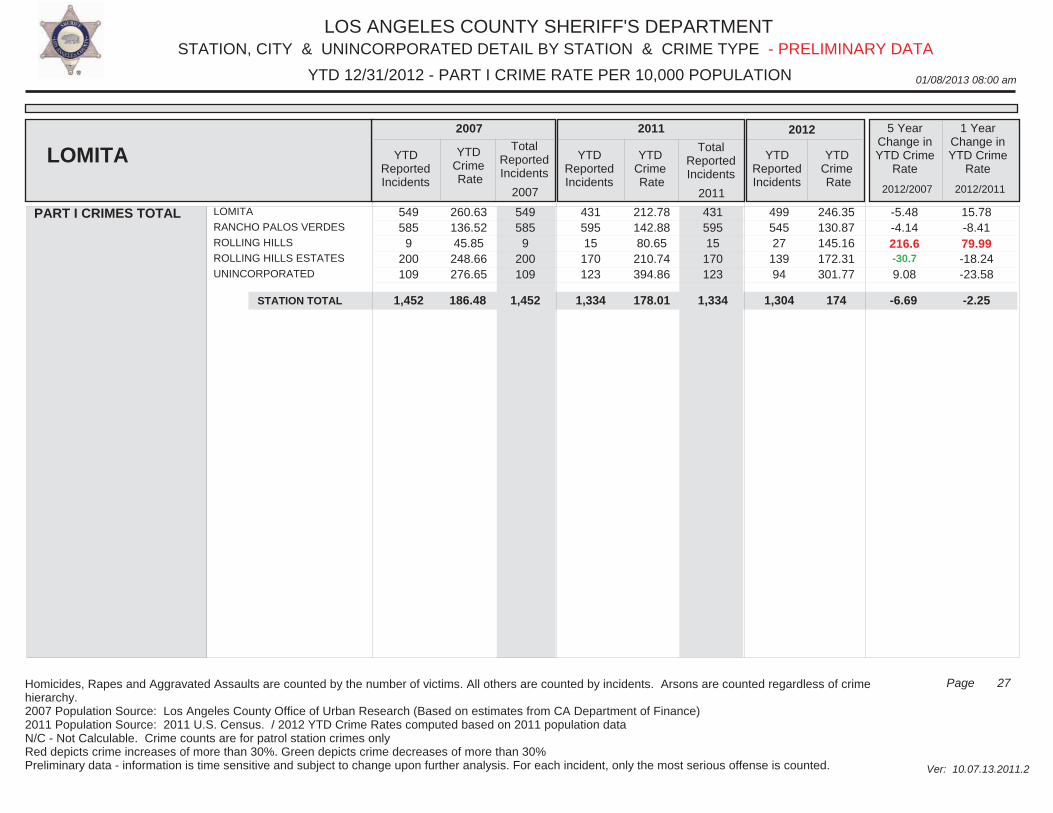
LOS ANGELES COUNTY SHERIFF'S DEPARTMENT
01/08/2013 08:00 am
STATION, CITY & UNINCORPORATED DETAIL BY STATION & CRIME TYPE
Ver: 10.07.13.2011.2
YTD 12/31/2012 - PART I CRIME RATE PER 10,000 POPULATION
27Page
- PRELIMINARY DATA
Homicides, Rapes and Aggravated Assaults are counted by the number of victims. All others are counted by incidents. Arsons are counted regardless of crime hierarchy.2007 Population Source: Los Angeles County Office of Urban Research (Based on estimates from CA Department of Finance)2011 Population Source: 2011 U.S. Census. / 2012 YTD Crime Rates computed based on 2011 population dataN/C - Not Calculable. Crime counts are for patrol station crimes only Red depicts crime increases of more than 30%. Green depicts crime decreases of more than 30%Preliminary data - information is time sensitive and subject to change upon further analysis. For each incident, only the most serious offense is counted.
LOMITA YTDReportedIncidents
YTDCrime Rate
TotalReportedIncidents
YTDReportedIncidents
YTDCrime Rate
TotalReportedIncidents
YTDReportedIncidents
YTDCrime Rate
5 YearChange inYTD Crime
Rate
1 YearChange inYTD Crime
Rate
2007 2011 2012
2012/2007 2012/2011
PART I CRIMES TOTAL LOMITA
RANCHO PALOS VERDES
ROLLING HILLS
ROLLING HILLS ESTATES
UNINCORPORATED
549 585
9 200 109
2007
431 595 15
170 123
2011
499 545 27
139 94
260.63136.5245.85
248.66276.65
549 585
9 200 109
212.78142.8880.65
210.74394.86
431 595 15
170 123
246.35130.87145.16172.31301.77
-5.48-4.14216.6-30.7
9.08
STATION TOTAL
15.78-8.4179.99-18.24-23.58
1,452 1,334 1,304 1,452 1,334 174186.48 178.01 -6.69 -2.25
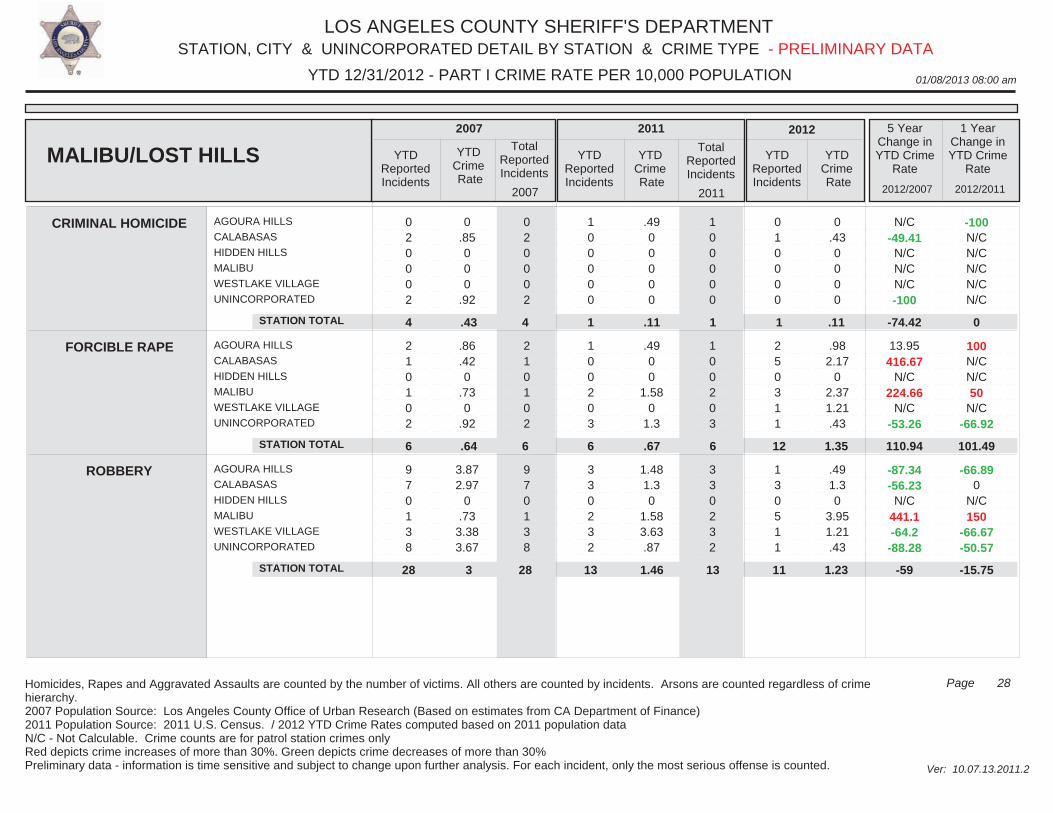
LOS ANGELES COUNTY SHERIFF'S DEPARTMENT
01/08/2013 08:00 am
STATION, CITY & UNINCORPORATED DETAIL BY STATION & CRIME TYPE
Ver: 10.07.13.2011.2
YTD 12/31/2012 - PART I CRIME RATE PER 10,000 POPULATION
28Page
- PRELIMINARY DATA
Homicides, Rapes and Aggravated Assaults are counted by the number of victims. All others are counted by incidents. Arsons are counted regardless of crime hierarchy.2007 Population Source: Los Angeles County Office of Urban Research (Based on estimates from CA Department of Finance)2011 Population Source: 2011 U.S. Census. / 2012 YTD Crime Rates computed based on 2011 population dataN/C - Not Calculable. Crime counts are for patrol station crimes only Red depicts crime increases of more than 30%. Green depicts crime decreases of more than 30%Preliminary data - information is time sensitive and subject to change upon further analysis. For each incident, only the most serious offense is counted.
AGOURA HILLS
CALABASAS
HIDDEN HILLS
MALIBU
WESTLAKE VILLAGE
UNINCORPORATED
AGOURA HILLS
CALABASAS
HIDDEN HILLS
MALIBU
WESTLAKE VILLAGE
UNINCORPORATED
AGOURA HILLS
CALABASAS
HIDDEN HILLS
MALIBU
WESTLAKE VILLAGE
UNINCORPORATED
0 2 0 0 0 2
2 1 0 1 0 2
9 7 0 1 3 8
0 2 0 0 0 2
2 1 0 1 0 2
9 7 0 1 3 8
1 0 0 0 0 0
1 0 0 2 0 3
3 3 0 2 3 2
1 0 0 0 0 0
1 0 0 2 0 3
3 3 0 2 3 2
0 1 0 0 0 0
2 5 0 3 1 1
1 3 0 5 1 1
0.85000
.92
.86
.420
.730
.92
3.872.97
0.73
3.383.67
.4900000
.4900
1.580
1.3
1.481.30
1.583.63.87
0.430000
.982.17
02.371.21.43
.491.30
3.951.21.43
N/C-49.41
N/CN/CN/C-100
13.95416.67
N/C224.66
N/C-53.26
-87.34-56.23
N/C441.1-64.2
-88.28
-100N/CN/CN/CN/CN/C
100N/CN/C50
N/C-66.92
-66.890
N/C150
-66.67-50.57
CRIMINAL HOMICIDE
FORCIBLE RAPE
ROBBERY
MALIBU/LOST HILLS YTDReportedIncidents
YTDCrime Rate
TotalReportedIncidents
YTDReportedIncidents
YTDCrime Rate
TotalReportedIncidents
YTDReportedIncidents
YTDCrime Rate
5 YearChange inYTD Crime
Rate
1 YearChange inYTD Crime
Rate
2007 2011 2012
2012/2007 2012/2011
STATION TOTAL
STATION TOTAL
STATION TOTAL
2007 2011
4
6
28
1
6
13
1
12
11
4
6
28
1
6
13
.43
.64
3
.11
.67
1.46
.11
1.35
1.23
0
101.49
-15.75
-74.42
110.94
-59
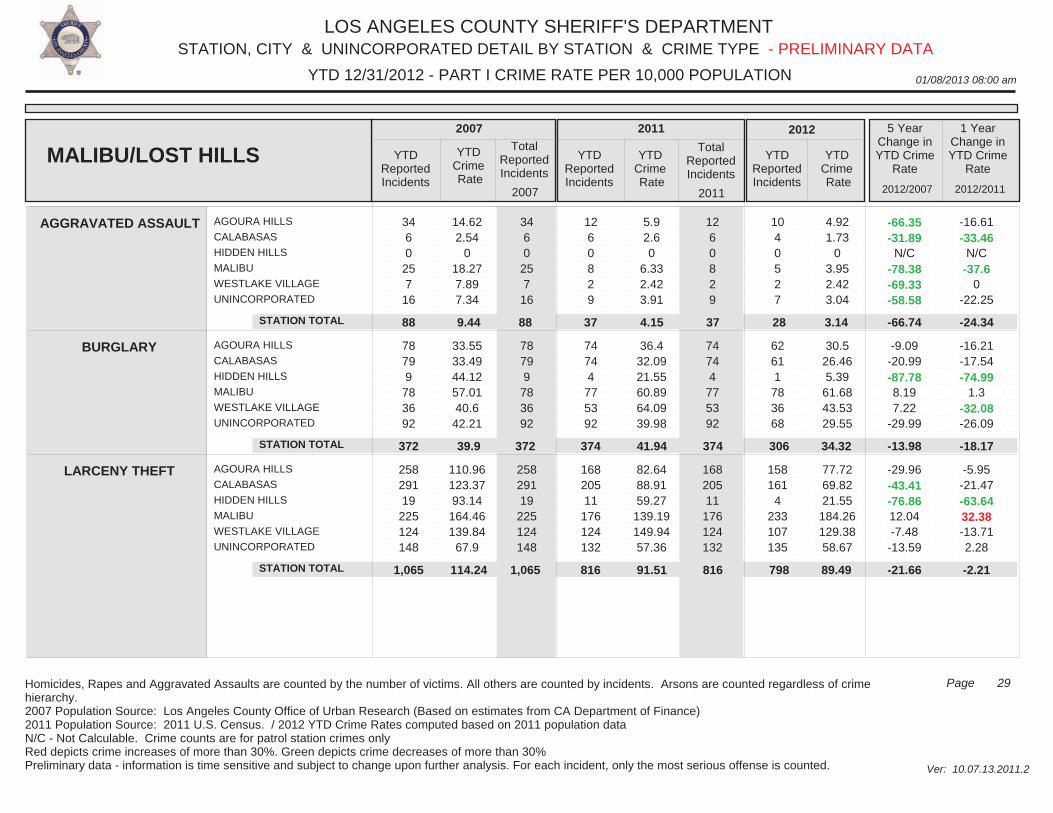
LOS ANGELES COUNTY SHERIFF'S DEPARTMENT
01/08/2013 08:00 am
STATION, CITY & UNINCORPORATED DETAIL BY STATION & CRIME TYPE
Ver: 10.07.13.2011.2
YTD 12/31/2012 - PART I CRIME RATE PER 10,000 POPULATION
29Page
- PRELIMINARY DATA
Homicides, Rapes and Aggravated Assaults are counted by the number of victims. All others are counted by incidents. Arsons are counted regardless of crime hierarchy.2007 Population Source: Los Angeles County Office of Urban Research (Based on estimates from CA Department of Finance)2011 Population Source: 2011 U.S. Census. / 2012 YTD Crime Rates computed based on 2011 population dataN/C - Not Calculable. Crime counts are for patrol station crimes only Red depicts crime increases of more than 30%. Green depicts crime decreases of more than 30%Preliminary data - information is time sensitive and subject to change upon further analysis. For each incident, only the most serious offense is counted.
AGOURA HILLS
CALABASAS
HIDDEN HILLS
MALIBU
WESTLAKE VILLAGE
UNINCORPORATED
AGOURA HILLS
CALABASAS
HIDDEN HILLS
MALIBU
WESTLAKE VILLAGE
UNINCORPORATED
AGOURA HILLS
CALABASAS
HIDDEN HILLS
MALIBU
WESTLAKE VILLAGE
UNINCORPORATED
34 6 0
25 7
16
78 79 9
78 36 92
258 291 19
225 124 148
34 6 0
25 7
16
78 79 9
78 36 92
258 291 19
225 124 148
12 6 0 8 2 9
74 74 4 77 53 92
168 205 11
176 124 132
12 6 0 8 2 9
74 74 4
77 53 92
168 205 11
176 124 132
10 4 0 5 2 7
62 61 1
78 36 68
158 161
4 233 107 135
14.622.54
018.277.897.34
33.5533.4944.1257.0140.6
42.21
110.96123.3793.14
164.46139.84
67.9
5.92.60
6.332.423.91
36.432.0921.5560.8964.0939.98
82.6488.9159.27
139.19149.9457.36
4.921.73
03.952.423.04
30.526.465.39
61.6843.5329.55
77.7269.8221.55
184.26129.3858.67
-66.35-31.89
N/C-78.38-69.33-58.58
-9.09-20.99-87.788.197.22
-29.99
-29.96-43.41-76.8612.04-7.48
-13.59
-16.61-33.46
N/C-37.6
0-22.25
-16.21-17.54-74.99
1.3-32.08-26.09
-5.95-21.47-63.6432.38-13.712.28
AGGRAVATED ASSAULT
BURGLARY
LARCENY THEFT
MALIBU/LOST HILLS YTDReportedIncidents
YTDCrime Rate
TotalReportedIncidents
YTDReportedIncidents
YTDCrime Rate
TotalReportedIncidents
YTDReportedIncidents
YTDCrime Rate
5 YearChange inYTD Crime
Rate
1 YearChange inYTD Crime
Rate
2007 2011 2012
2012/2007 2012/2011
STATION TOTAL
STATION TOTAL
STATION TOTAL
2007 2011
88
372
1,065
37
374
816
28
306
798
88
372
1,065
37
374
816
9.44
39.9
114.24
4.15
41.94
91.51
3.14
34.32
89.49
-24.34
-18.17
-2.21
-66.74
-13.98
-21.66
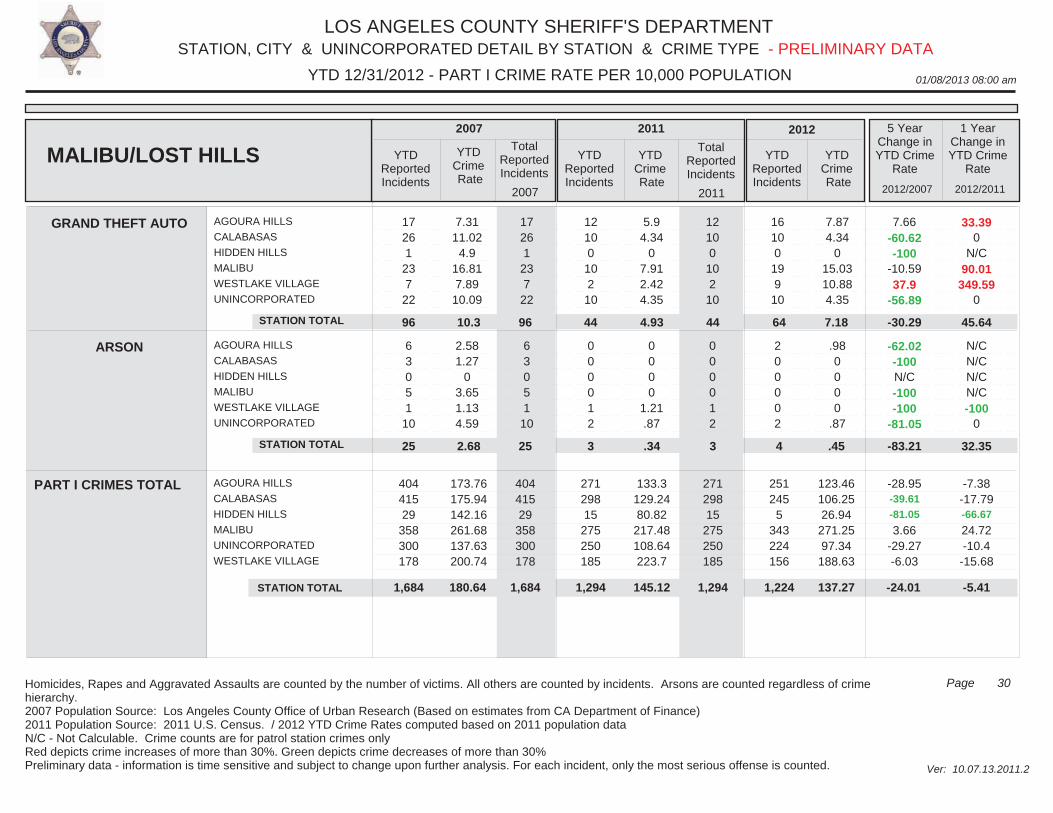
LOS ANGELES COUNTY SHERIFF'S DEPARTMENT
01/08/2013 08:00 am
STATION, CITY & UNINCORPORATED DETAIL BY STATION & CRIME TYPE
Ver: 10.07.13.2011.2
YTD 12/31/2012 - PART I CRIME RATE PER 10,000 POPULATION
30Page
- PRELIMINARY DATA
Homicides, Rapes and Aggravated Assaults are counted by the number of victims. All others are counted by incidents. Arsons are counted regardless of crime hierarchy.2007 Population Source: Los Angeles County Office of Urban Research (Based on estimates from CA Department of Finance)2011 Population Source: 2011 U.S. Census. / 2012 YTD Crime Rates computed based on 2011 population dataN/C - Not Calculable. Crime counts are for patrol station crimes only Red depicts crime increases of more than 30%. Green depicts crime decreases of more than 30%Preliminary data - information is time sensitive and subject to change upon further analysis. For each incident, only the most serious offense is counted.
AGOURA HILLS
CALABASAS
HIDDEN HILLS
MALIBU
WESTLAKE VILLAGE
UNINCORPORATED
AGOURA HILLS
CALABASAS
HIDDEN HILLS
MALIBU
WESTLAKE VILLAGE
UNINCORPORATED
17 26 1
23 7
22
6 3 0 5 1
10
17 26 1
23 7
22
6 3 0 5 1
10
12 10 0 10 2 10
0 0 0 0 1 2
12 10 0
10 2
10
0 0 0 0 1 2
16 10 0
19 9
10
2 0 0 0 0 2
7.3111.02
4.916.817.89
10.09
2.581.27
03.651.134.59
5.94.34
07.912.424.35
0000
1.21.87
7.874.34
015.0310.884.35
.980000
.87
7.66-60.62-100
-10.5937.9
-56.89
-62.02-100N/C-100-100
-81.05
33.390
N/C90.01
349.590
N/CN/CN/CN/C-100
0
GRAND THEFT AUTO
ARSON
MALIBU/LOST HILLS YTDReportedIncidents
YTDCrime Rate
TotalReportedIncidents
YTDReportedIncidents
YTDCrime Rate
TotalReportedIncidents
YTDReportedIncidents
YTDCrime Rate
5 YearChange inYTD Crime
Rate
1 YearChange inYTD Crime
Rate
2007 2011 2012
2012/2007 2012/2011
PART I CRIMES TOTAL
STATION TOTAL
STATION TOTAL
AGOURA HILLS
CALABASAS
HIDDEN HILLS
MALIBU
UNINCORPORATED
WESTLAKE VILLAGE
404 415 29
358 300 178
2007
271 298 15
275 250 185
2011
251 245
5 343 224 156
96
25
44
3
64
4
173.76175.94142.16261.68137.63200.74
404 415 29
358 300 178
96
25
44
3
133.3129.2480.82
217.48108.64223.7
271 298 15
275 250 185
10.3
2.68
4.93
.34
123.46106.2526.94
271.2597.34
188.63
7.18
.45
-28.95-39.61
-81.05
3.66-29.27-6.03
45.64
32.35
STATION TOTAL
-7.38-17.79-66.67
24.72-10.4-15.68
1,684 1,294
-30.29
-83.21
1,224 1,684 1,294 137.27180.64 145.12 -24.01 -5.41
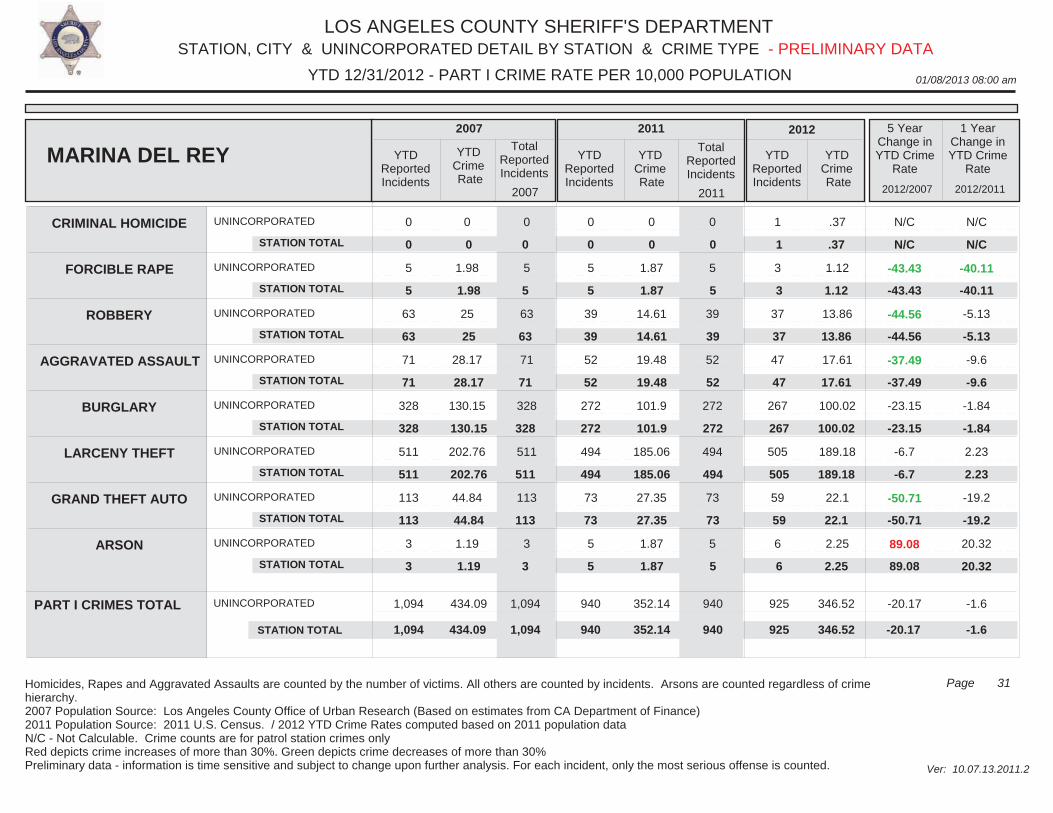
LOS ANGELES COUNTY SHERIFF'S DEPARTMENT
01/08/2013 08:00 am
STATION, CITY & UNINCORPORATED DETAIL BY STATION & CRIME TYPE
Ver: 10.07.13.2011.2
YTD 12/31/2012 - PART I CRIME RATE PER 10,000 POPULATION
31Page
- PRELIMINARY DATA
Homicides, Rapes and Aggravated Assaults are counted by the number of victims. All others are counted by incidents. Arsons are counted regardless of crime hierarchy.2007 Population Source: Los Angeles County Office of Urban Research (Based on estimates from CA Department of Finance)2011 Population Source: 2011 U.S. Census. / 2012 YTD Crime Rates computed based on 2011 population dataN/C - Not Calculable. Crime counts are for patrol station crimes only Red depicts crime increases of more than 30%. Green depicts crime decreases of more than 30%Preliminary data - information is time sensitive and subject to change upon further analysis. For each incident, only the most serious offense is counted.
UNINCORPORATED
UNINCORPORATED
UNINCORPORATED
UNINCORPORATED
UNINCORPORATED
UNINCORPORATED
UNINCORPORATED
UNINCORPORATED
0
5
63
71
328
511
113
3
0
5
63
71
328
511
113
3
0
5
39
52
272
494
73
5
0
5
39
52
272
494
73
5
1
3
37
47
267
505
59
6
0
1.98
25
28.17
130.15
202.76
44.84
1.19
0
1.87
14.61
19.48
101.9
185.06
27.35
1.87
.37
1.12
13.86
17.61
100.02
189.18
22.1
2.25
N/C
-43.43
-44.56
-37.49
-23.15
-6.7
-50.71
89.08
N/C
-40.11
-5.13
-9.6
-1.84
2.23
-19.2
20.32
CRIMINAL HOMICIDE
FORCIBLE RAPE
ROBBERY
AGGRAVATED ASSAULT
BURGLARY
LARCENY THEFT
GRAND THEFT AUTO
ARSON
MARINA DEL REY YTDReportedIncidents
YTDCrime Rate
TotalReportedIncidents
YTDReportedIncidents
YTDCrime Rate
TotalReportedIncidents
YTDReportedIncidents
YTDCrime Rate
5 YearChange inYTD Crime
Rate
1 YearChange inYTD Crime
Rate
2007 2011 2012
2012/2007 2012/2011
PART I CRIMES TOTAL
STATION TOTAL
STATION TOTAL
STATION TOTAL
STATION TOTAL
STATION TOTAL
STATION TOTAL
STATION TOTAL
STATION TOTAL
UNINCORPORATED 1,094
2007
940
2011
925
0
5
63
71
328
511
113
3
0
5
39
52
272
494
73
5
1
3
37
47
267
505
59
6
434.09 1,094
0
5
63
71
328
511
113
3
0
5
39
52
272
494
73
5
352.14 940
0
1.98
25
28.17
130.15
202.76
44.84
1.19
0
1.87
14.61
19.48
101.9
185.06
27.35
1.87
346.52
.37
1.12
13.86
17.61
100.02
189.18
22.1
2.25
-20.17
N/C
-40.11
-5.13
-9.6
-1.84
2.23
-19.2
20.32
STATION TOTAL
-1.6
1,094 940
N/C
-43.43
-44.56
-37.49
-23.15
-6.7
-50.71
89.08
925 1,094 940 346.52434.09 352.14 -20.17 -1.6
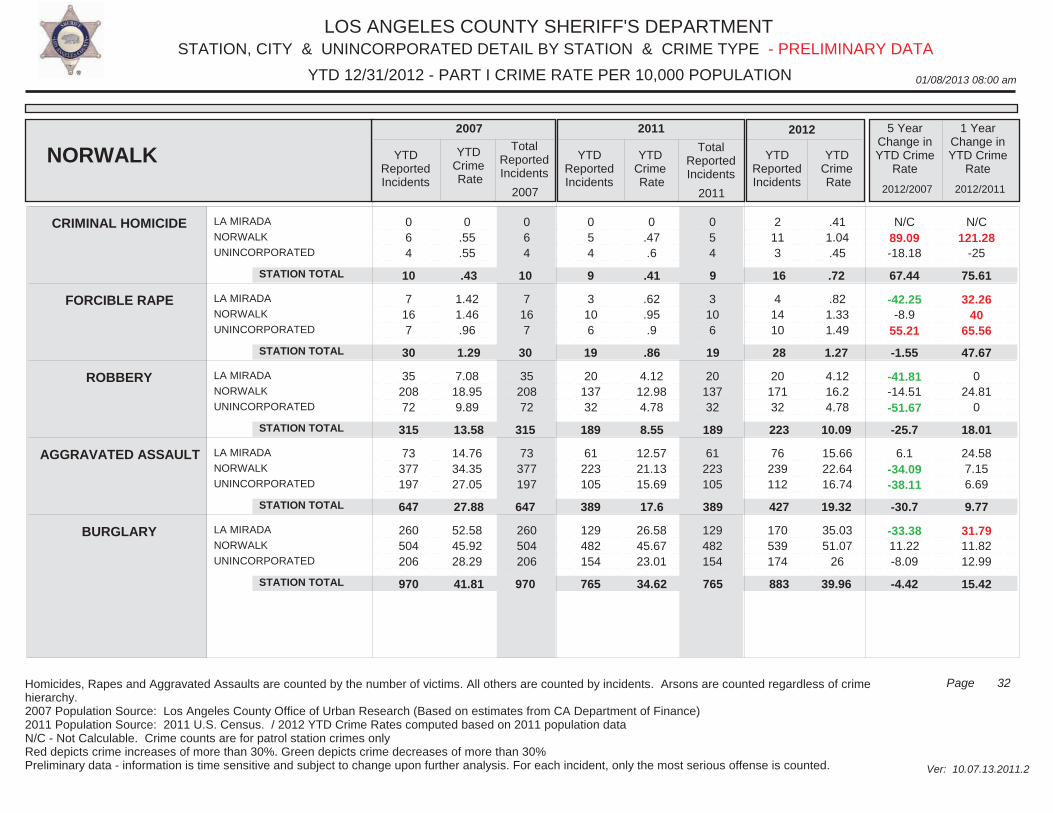
LOS ANGELES COUNTY SHERIFF'S DEPARTMENT
01/08/2013 08:00 am
STATION, CITY & UNINCORPORATED DETAIL BY STATION & CRIME TYPE
Ver: 10.07.13.2011.2
YTD 12/31/2012 - PART I CRIME RATE PER 10,000 POPULATION
32Page
- PRELIMINARY DATA
Homicides, Rapes and Aggravated Assaults are counted by the number of victims. All others are counted by incidents. Arsons are counted regardless of crime hierarchy.2007 Population Source: Los Angeles County Office of Urban Research (Based on estimates from CA Department of Finance)2011 Population Source: 2011 U.S. Census. / 2012 YTD Crime Rates computed based on 2011 population dataN/C - Not Calculable. Crime counts are for patrol station crimes only Red depicts crime increases of more than 30%. Green depicts crime decreases of more than 30%Preliminary data - information is time sensitive and subject to change upon further analysis. For each incident, only the most serious offense is counted.
LA MIRADA
NORWALK
UNINCORPORATED
LA MIRADA
NORWALK
UNINCORPORATED
LA MIRADA
NORWALK
UNINCORPORATED
LA MIRADA
NORWALK
UNINCORPORATED
LA MIRADA
NORWALK
UNINCORPORATED
0 6 4
7 16 7
35 208 72
73 377 197
260 504 206
0 6 4
7 16 7
35 208 72
73 377 197
260 504 206
0 5 4
3 10 6
20 137 32
61 223 105
129 482 154
0 5 4
3 10 6
20 137 32
61 223 105
129 482 154
2 11 3
4 14 10
20 171 32
76 239 112
170 539 174
0.55.55
1.421.46.96
7.0818.959.89
14.7634.3527.05
52.5845.9228.29
0.47.6
.62
.95.9
4.1212.984.78
12.5721.1315.69
26.5845.6723.01
.411.04.45
.821.331.49
4.1216.24.78
15.6622.6416.74
35.0351.07
26
N/C89.09-18.18
-42.25-8.9
55.21
-41.81-14.51-51.67
6.1-34.09-38.11
-33.3811.22-8.09
N/C121.28
-25
32.2640
65.56
024.81
0
24.587.156.69
31.7911.8212.99
CRIMINAL HOMICIDE
FORCIBLE RAPE
ROBBERY
AGGRAVATED ASSAULT
BURGLARY
NORWALK YTDReportedIncidents
YTDCrime Rate
TotalReportedIncidents
YTDReportedIncidents
YTDCrime Rate
TotalReportedIncidents
YTDReportedIncidents
YTDCrime Rate
5 YearChange inYTD Crime
Rate
1 YearChange inYTD Crime
Rate
2007 2011 2012
2012/2007 2012/2011
STATION TOTAL
STATION TOTAL
STATION TOTAL
STATION TOTAL
STATION TOTAL
2007 2011
10
30
315
647
970
9
19
189
389
765
16
28
223
427
883
10
30
315
647
970
9
19
189
389
765
.43
1.29
13.58
27.88
41.81
.41
.86
8.55
17.6
34.62
.72
1.27
10.09
19.32
39.96
75.61
47.67
18.01
9.77
15.42
67.44
-1.55
-25.7
-30.7
-4.42
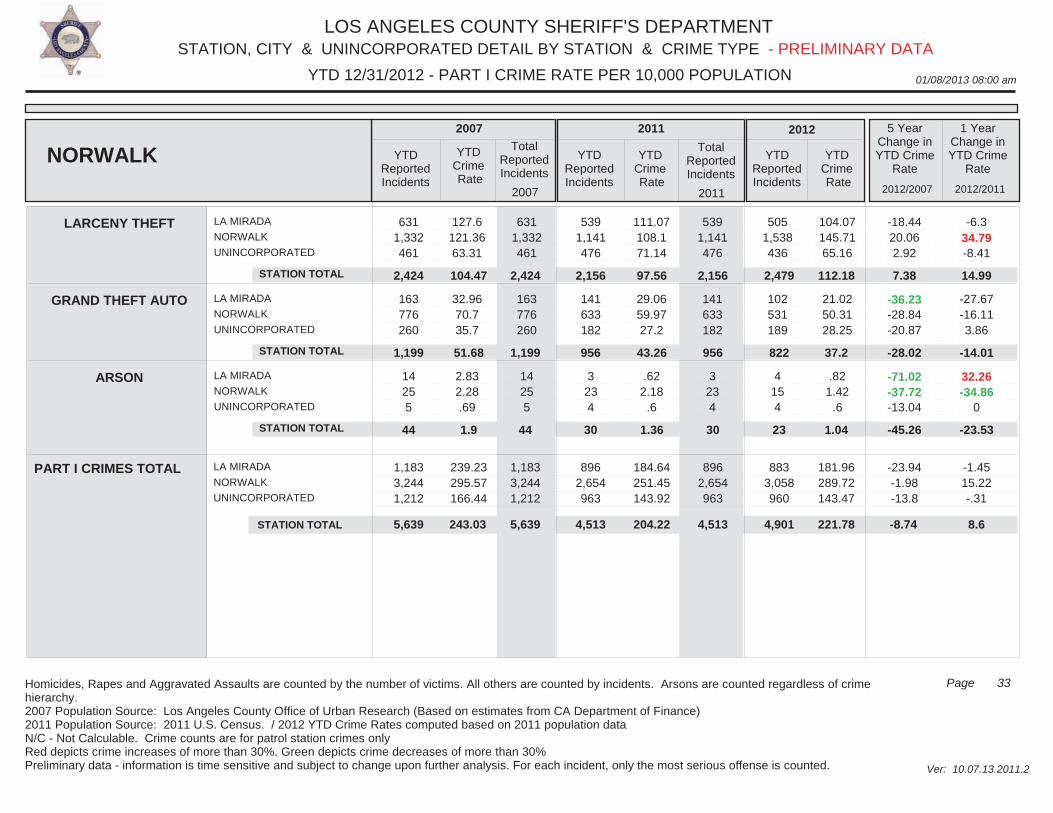
LOS ANGELES COUNTY SHERIFF'S DEPARTMENT
01/08/2013 08:00 am
STATION, CITY & UNINCORPORATED DETAIL BY STATION & CRIME TYPE
Ver: 10.07.13.2011.2
YTD 12/31/2012 - PART I CRIME RATE PER 10,000 POPULATION
33Page
- PRELIMINARY DATA
Homicides, Rapes and Aggravated Assaults are counted by the number of victims. All others are counted by incidents. Arsons are counted regardless of crime hierarchy.2007 Population Source: Los Angeles County Office of Urban Research (Based on estimates from CA Department of Finance)2011 Population Source: 2011 U.S. Census. / 2012 YTD Crime Rates computed based on 2011 population dataN/C - Not Calculable. Crime counts are for patrol station crimes only Red depicts crime increases of more than 30%. Green depicts crime decreases of more than 30%Preliminary data - information is time sensitive and subject to change upon further analysis. For each incident, only the most serious offense is counted.
LA MIRADA
NORWALK
UNINCORPORATED
LA MIRADA
NORWALK
UNINCORPORATED
LA MIRADA
NORWALK
UNINCORPORATED
631 1,332 461
163 776 260
14 25 5
631 1,332 461
163 776 260
14 25 5
539 1,141 476
141 633 182
3 23 4
539 1,141 476
141 633 182
3 23 4
505 1,538 436
102 531 189
4 15 4
127.6121.3663.31
32.9670.735.7
2.832.28.69
111.07108.171.14
29.0659.9727.2
.622.18
.6
104.07145.7165.16
21.0250.3128.25
.821.42
.6
-18.4420.062.92
-36.23-28.84-20.87
-71.02-37.72-13.04
-6.334.79-8.41
-27.67-16.113.86
32.26-34.86
0
LARCENY THEFT
GRAND THEFT AUTO
ARSON
NORWALK YTDReportedIncidents
YTDCrime Rate
TotalReportedIncidents
YTDReportedIncidents
YTDCrime Rate
TotalReportedIncidents
YTDReportedIncidents
YTDCrime Rate
5 YearChange inYTD Crime
Rate
1 YearChange inYTD Crime
Rate
2007 2011 2012
2012/2007 2012/2011
PART I CRIMES TOTAL
STATION TOTAL
STATION TOTAL
STATION TOTAL
LA MIRADA
NORWALK
UNINCORPORATED
1,183 3,244 1,212
2007
896 2,654 963
2011
883 3,058 960
2,424
1,199
44
2,156
956
30
2,479
822
23
239.23295.57166.44
1,183 3,244 1,212
2,424
1,199
44
2,156
956
30
184.64251.45143.92
896 2,654 963
104.47
51.68
1.9
97.56
43.26
1.36
181.96289.72143.47
112.18
37.2
1.04
-23.94-1.98-13.8
14.99
-14.01
-23.53
STATION TOTAL
-1.4515.22-.31
5,639 4,513
7.38
-28.02
-45.26
4,901 5,639 4,513 221.78243.03 204.22 -8.74 8.6
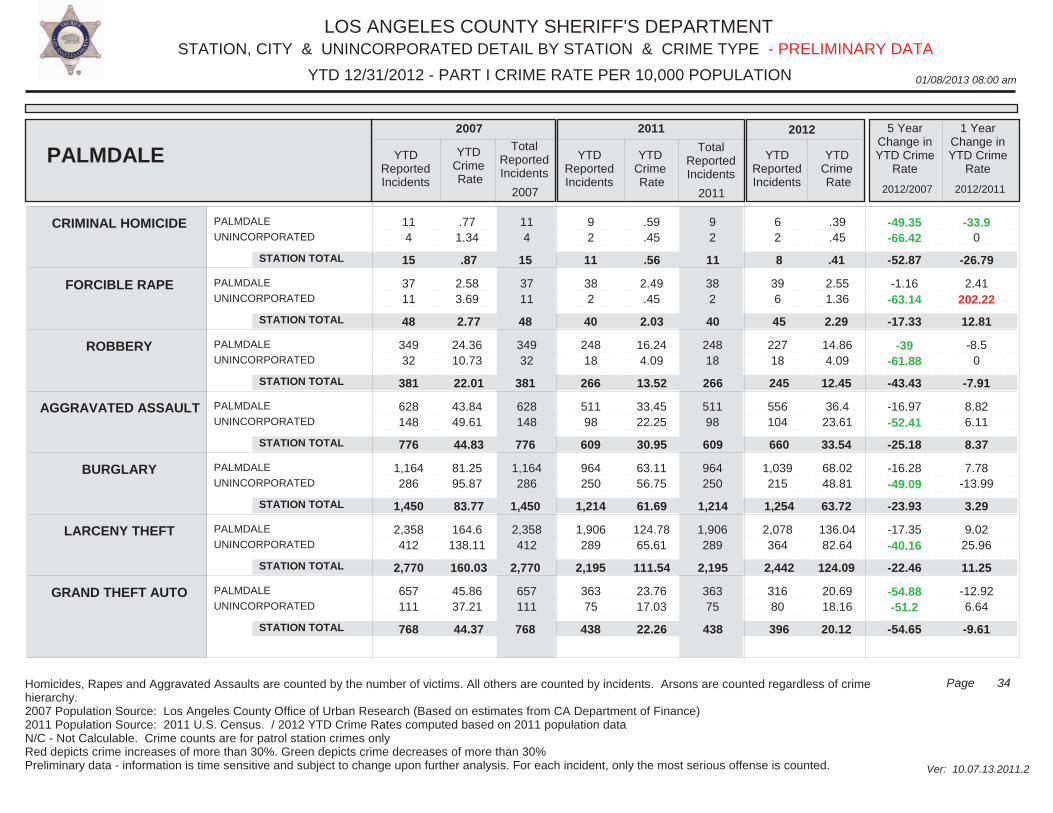
LOS ANGELES COUNTY SHERIFF'S DEPARTMENT
01/08/2013 08:00 am
STATION, CITY & UNINCORPORATED DETAIL BY STATION & CRIME TYPE
Ver: 10.07.13.2011.2
YTD 12/31/2012 - PART I CRIME RATE PER 10,000 POPULATION
34Page
- PRELIMINARY DATA
Homicides, Rapes and Aggravated Assaults are counted by the number of victims. All others are counted by incidents. Arsons are counted regardless of crime hierarchy.2007 Population Source: Los Angeles County Office of Urban Research (Based on estimates from CA Department of Finance)2011 Population Source: 2011 U.S. Census. / 2012 YTD Crime Rates computed based on 2011 population dataN/C - Not Calculable. Crime counts are for patrol station crimes only Red depicts crime increases of more than 30%. Green depicts crime decreases of more than 30%Preliminary data - information is time sensitive and subject to change upon further analysis. For each incident, only the most serious offense is counted.
PALMDALE
UNINCORPORATED
PALMDALE
UNINCORPORATED
PALMDALE
UNINCORPORATED
PALMDALE
UNINCORPORATED
PALMDALE
UNINCORPORATED
PALMDALE
UNINCORPORATED
PALMDALE
UNINCORPORATED
11 4
37 11
349 32
628 148
1,164 286
2,358 412
657 111
11 4
37 11
349 32
628 148
1,164 286
2,358 412
657 111
9 2
38 2
248 18
511 98
964 250
1,906 289
363 75
9 2
38 2
248 18
511 98
964 250
1,906 289
363 75
6 2
39 6
227 18
556 104
1,039 215
2,078 364
316 80
.771.34
2.583.69
24.3610.73
43.8449.61
81.2595.87
164.6138.11
45.8637.21
.59
.45
2.49.45
16.244.09
33.4522.25
63.1156.75
124.7865.61
23.7617.03
.39
.45
2.551.36
14.864.09
36.423.61
68.0248.81
136.0482.64
20.6918.16
-49.35-66.42
-1.16-63.14
-39-61.88
-16.97-52.41
-16.28-49.09
-17.35-40.16
-54.88-51.2
-33.90
2.41202.22
-8.50
8.826.11
7.78-13.99
9.0225.96
-12.926.64
CRIMINAL HOMICIDE
FORCIBLE RAPE
ROBBERY
AGGRAVATED ASSAULT
BURGLARY
LARCENY THEFT
GRAND THEFT AUTO
PALMDALE YTDReportedIncidents
YTDCrime Rate
TotalReportedIncidents
YTDReportedIncidents
YTDCrime Rate
TotalReportedIncidents
YTDReportedIncidents
YTDCrime Rate
5 YearChange inYTD Crime
Rate
1 YearChange inYTD Crime
Rate
2007 2011 2012
2012/2007 2012/2011
STATION TOTAL
STATION TOTAL
STATION TOTAL
STATION TOTAL
STATION TOTAL
STATION TOTAL
STATION TOTAL
2007 2011
15
48
381
776
1,450
2,770
768
11
40
266
609
1,214
2,195
438
8
45
245
660
1,254
2,442
396
15
48
381
776
1,450
2,770
768
11
40
266
609
1,214
2,195
438
.87
2.77
22.01
44.83
83.77
160.03
44.37
.56
2.03
13.52
30.95
61.69
111.54
22.26
.41
2.29
12.45
33.54
63.72
124.09
20.12
-26.79
12.81
-7.91
8.37
3.29
11.25
-9.61
-52.87
-17.33
-43.43
-25.18
-23.93
-22.46
-54.65
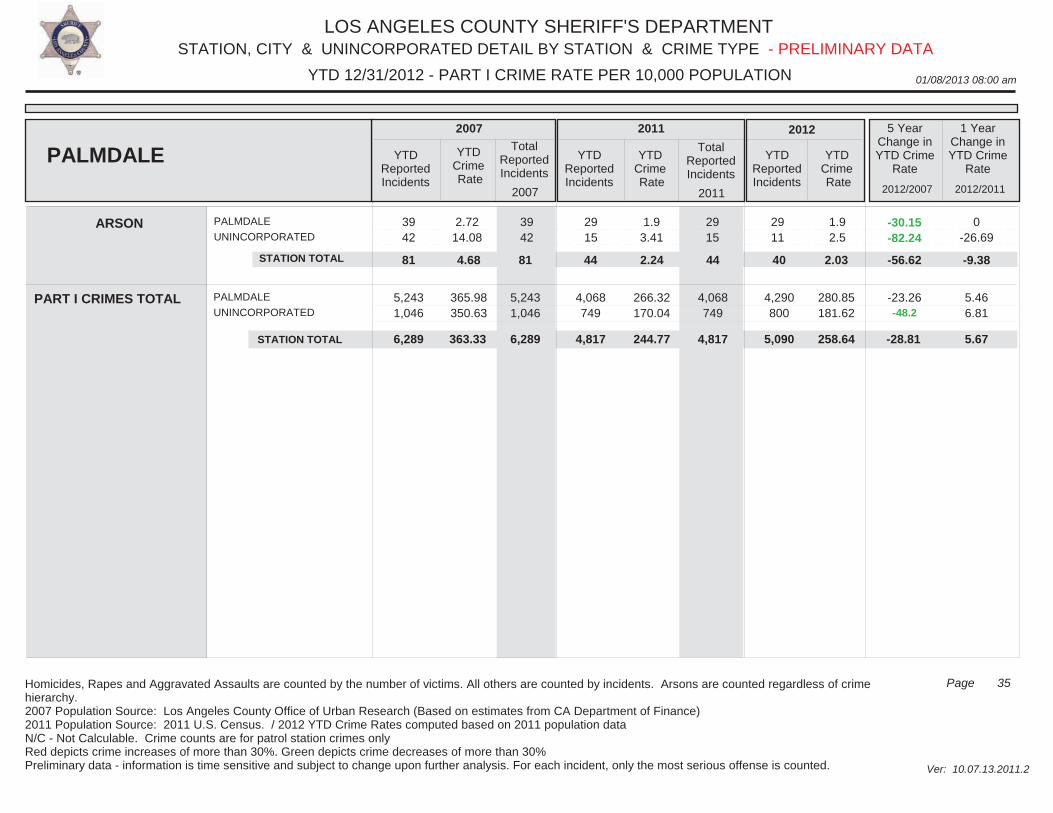
LOS ANGELES COUNTY SHERIFF'S DEPARTMENT
01/08/2013 08:00 am
STATION, CITY & UNINCORPORATED DETAIL BY STATION & CRIME TYPE
Ver: 10.07.13.2011.2
YTD 12/31/2012 - PART I CRIME RATE PER 10,000 POPULATION
35Page
- PRELIMINARY DATA
Homicides, Rapes and Aggravated Assaults are counted by the number of victims. All others are counted by incidents. Arsons are counted regardless of crime hierarchy.2007 Population Source: Los Angeles County Office of Urban Research (Based on estimates from CA Department of Finance)2011 Population Source: 2011 U.S. Census. / 2012 YTD Crime Rates computed based on 2011 population dataN/C - Not Calculable. Crime counts are for patrol station crimes only Red depicts crime increases of more than 30%. Green depicts crime decreases of more than 30%Preliminary data - information is time sensitive and subject to change upon further analysis. For each incident, only the most serious offense is counted.
PALMDALE
UNINCORPORATED 39 42
39 42
29 15
29 15
29 11
2.7214.08
1.93.41
1.92.5
-30.15-82.24
0-26.69
ARSON
PALMDALE YTDReportedIncidents
YTDCrime Rate
TotalReportedIncidents
YTDReportedIncidents
YTDCrime Rate
TotalReportedIncidents
YTDReportedIncidents
YTDCrime Rate
5 YearChange inYTD Crime
Rate
1 YearChange inYTD Crime
Rate
2007 2011 2012
2012/2007 2012/2011
PART I CRIMES TOTAL
STATION TOTAL
PALMDALE
UNINCORPORATED 5,243 1,046
2007
4,068 749
2011
4,290 800
81 44 40
365.98350.63
5,243 1,046
81 44
266.32170.04
4,068 749
4.68 2.24
280.85181.62
2.03
-23.26-48.2
-9.38
STATION TOTAL
5.466.81
6,289 4,817
-56.62
5,090 6,289 4,817 258.64363.33 244.77 -28.81 5.67
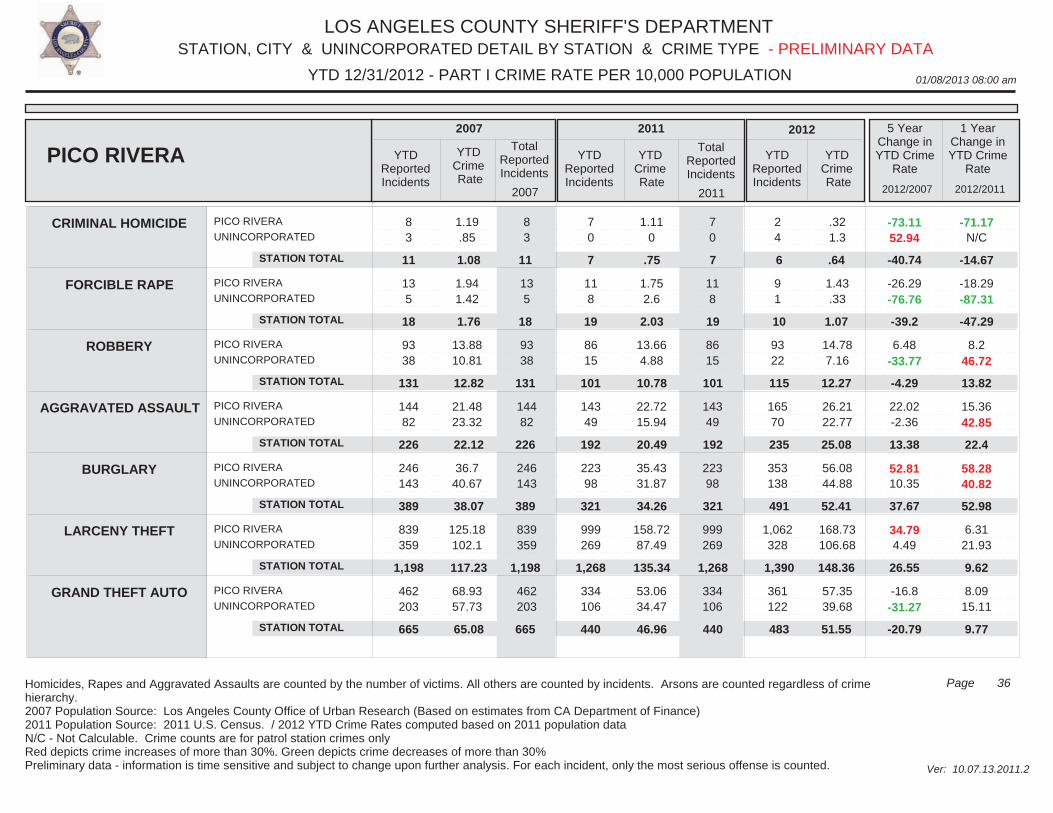
LOS ANGELES COUNTY SHERIFF'S DEPARTMENT
01/08/2013 08:00 am
STATION, CITY & UNINCORPORATED DETAIL BY STATION & CRIME TYPE
Ver: 10.07.13.2011.2
YTD 12/31/2012 - PART I CRIME RATE PER 10,000 POPULATION
36Page
- PRELIMINARY DATA
Homicides, Rapes and Aggravated Assaults are counted by the number of victims. All others are counted by incidents. Arsons are counted regardless of crime hierarchy.2007 Population Source: Los Angeles County Office of Urban Research (Based on estimates from CA Department of Finance)2011 Population Source: 2011 U.S. Census. / 2012 YTD Crime Rates computed based on 2011 population dataN/C - Not Calculable. Crime counts are for patrol station crimes only Red depicts crime increases of more than 30%. Green depicts crime decreases of more than 30%Preliminary data - information is time sensitive and subject to change upon further analysis. For each incident, only the most serious offense is counted.
PICO RIVERA
UNINCORPORATED
PICO RIVERA
UNINCORPORATED
PICO RIVERA
UNINCORPORATED
PICO RIVERA
UNINCORPORATED
PICO RIVERA
UNINCORPORATED
PICO RIVERA
UNINCORPORATED
PICO RIVERA
UNINCORPORATED
8 3
13 5
93 38
144 82
246 143
839 359
462 203
8 3
13 5
93 38
144 82
246 143
839 359
462 203
7 0
11 8
86 15
143 49
223 98
999 269
334 106
7 0
11 8
86 15
143 49
223 98
999 269
334 106
2 4
9 1
93 22
165 70
353 138
1,062 328
361 122
1.19.85
1.941.42
13.8810.81
21.4823.32
36.740.67
125.18102.1
68.9357.73
1.110
1.752.6
13.664.88
22.7215.94
35.4331.87
158.7287.49
53.0634.47
.321.3
1.43.33
14.787.16
26.2122.77
56.0844.88
168.73106.68
57.3539.68
-73.1152.94
-26.29-76.76
6.48-33.77
22.02-2.36
52.8110.35
34.794.49
-16.8-31.27
-71.17N/C
-18.29-87.31
8.246.72
15.3642.85
58.2840.82
6.3121.93
8.0915.11
CRIMINAL HOMICIDE
FORCIBLE RAPE
ROBBERY
AGGRAVATED ASSAULT
BURGLARY
LARCENY THEFT
GRAND THEFT AUTO
PICO RIVERA YTDReportedIncidents
YTDCrime Rate
TotalReportedIncidents
YTDReportedIncidents
YTDCrime Rate
TotalReportedIncidents
YTDReportedIncidents
YTDCrime Rate
5 YearChange inYTD Crime
Rate
1 YearChange inYTD Crime
Rate
2007 2011 2012
2012/2007 2012/2011
STATION TOTAL
STATION TOTAL
STATION TOTAL
STATION TOTAL
STATION TOTAL
STATION TOTAL
STATION TOTAL
2007 2011
11
18
131
226
389
1,198
665
7
19
101
192
321
1,268
440
6
10
115
235
491
1,390
483
11
18
131
226
389
1,198
665
7
19
101
192
321
1,268
440
1.08
1.76
12.82
22.12
38.07
117.23
65.08
.75
2.03
10.78
20.49
34.26
135.34
46.96
.64
1.07
12.27
25.08
52.41
148.36
51.55
-14.67
-47.29
13.82
22.4
52.98
9.62
9.77
-40.74
-39.2
-4.29
13.38
37.67
26.55
-20.79
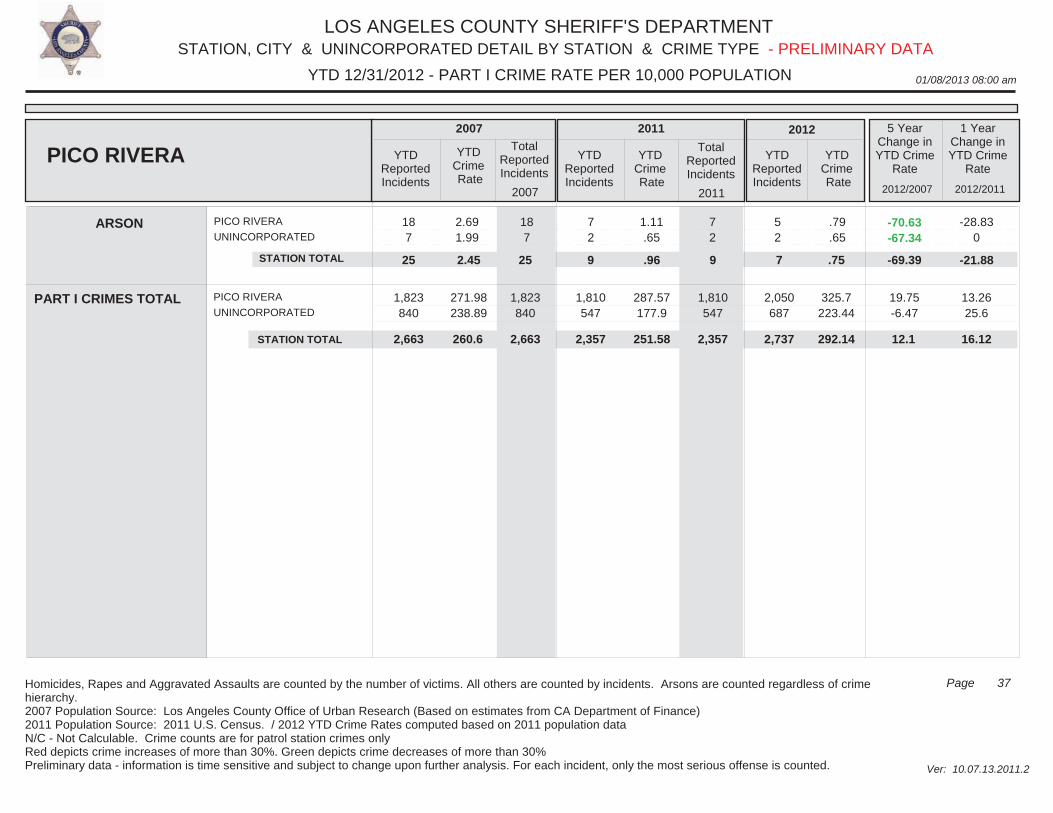
LOS ANGELES COUNTY SHERIFF'S DEPARTMENT
01/08/2013 08:00 am
STATION, CITY & UNINCORPORATED DETAIL BY STATION & CRIME TYPE
Ver: 10.07.13.2011.2
YTD 12/31/2012 - PART I CRIME RATE PER 10,000 POPULATION
37Page
- PRELIMINARY DATA
Homicides, Rapes and Aggravated Assaults are counted by the number of victims. All others are counted by incidents. Arsons are counted regardless of crime hierarchy.2007 Population Source: Los Angeles County Office of Urban Research (Based on estimates from CA Department of Finance)2011 Population Source: 2011 U.S. Census. / 2012 YTD Crime Rates computed based on 2011 population dataN/C - Not Calculable. Crime counts are for patrol station crimes only Red depicts crime increases of more than 30%. Green depicts crime decreases of more than 30%Preliminary data - information is time sensitive and subject to change upon further analysis. For each incident, only the most serious offense is counted.
PICO RIVERA
UNINCORPORATED 18 7
18 7
7 2
7 2
5 2
2.691.99
1.11.65
.79
.65-70.63-67.34
-28.830
ARSON
PICO RIVERA YTDReportedIncidents
YTDCrime Rate
TotalReportedIncidents
YTDReportedIncidents
YTDCrime Rate
TotalReportedIncidents
YTDReportedIncidents
YTDCrime Rate
5 YearChange inYTD Crime
Rate
1 YearChange inYTD Crime
Rate
2007 2011 2012
2012/2007 2012/2011
PART I CRIMES TOTAL
STATION TOTAL
PICO RIVERA
UNINCORPORATED 1,823 840
2007
1,810 547
2011
2,050 687
25 9 7
271.98238.89
1,823 840
25 9
287.57177.9
1,810 547
2.45 .96
325.7223.44
.75
19.75-6.47
-21.88
STATION TOTAL
13.2625.6
2,663 2,357
-69.39
2,737 2,663 2,357 292.14260.6 251.58 12.1 16.12
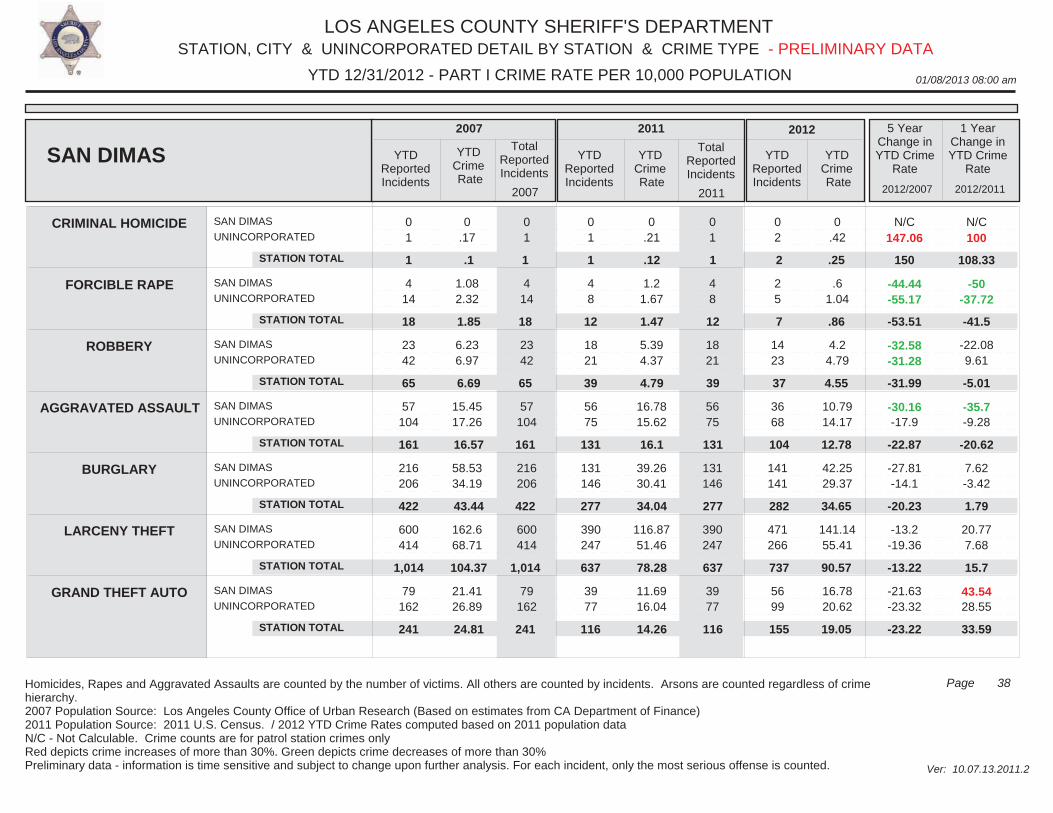
LOS ANGELES COUNTY SHERIFF'S DEPARTMENT
01/08/2013 08:00 am
STATION, CITY & UNINCORPORATED DETAIL BY STATION & CRIME TYPE
Ver: 10.07.13.2011.2
YTD 12/31/2012 - PART I CRIME RATE PER 10,000 POPULATION
38Page
- PRELIMINARY DATA
Homicides, Rapes and Aggravated Assaults are counted by the number of victims. All others are counted by incidents. Arsons are counted regardless of crime hierarchy.2007 Population Source: Los Angeles County Office of Urban Research (Based on estimates from CA Department of Finance)2011 Population Source: 2011 U.S. Census. / 2012 YTD Crime Rates computed based on 2011 population dataN/C - Not Calculable. Crime counts are for patrol station crimes only Red depicts crime increases of more than 30%. Green depicts crime decreases of more than 30%Preliminary data - information is time sensitive and subject to change upon further analysis. For each incident, only the most serious offense is counted.
SAN DIMAS
UNINCORPORATED
SAN DIMAS
UNINCORPORATED
SAN DIMAS
UNINCORPORATED
SAN DIMAS
UNINCORPORATED
SAN DIMAS
UNINCORPORATED
SAN DIMAS
UNINCORPORATED
SAN DIMAS
UNINCORPORATED
0 1
4 14
23 42
57 104
216 206
600 414
79 162
0 1
4 14
23 42
57 104
216 206
600 414
79 162
0 1
4 8
18 21
56 75
131 146
390 247
39 77
0 1
4 8
18 21
56 75
131 146
390 247
39 77
0 2
2 5
14 23
36 68
141 141
471 266
56 99
0.17
1.082.32
6.236.97
15.4517.26
58.5334.19
162.668.71
21.4126.89
0.21
1.21.67
5.394.37
16.7815.62
39.2630.41
116.8751.46
11.6916.04
0.42
.61.04
4.24.79
10.7914.17
42.2529.37
141.1455.41
16.7820.62
N/C147.06
-44.44-55.17
-32.58-31.28
-30.16-17.9
-27.81-14.1
-13.2-19.36
-21.63-23.32
N/C100
-50-37.72
-22.089.61
-35.7-9.28
7.62-3.42
20.777.68
43.5428.55
CRIMINAL HOMICIDE
FORCIBLE RAPE
ROBBERY
AGGRAVATED ASSAULT
BURGLARY
LARCENY THEFT
GRAND THEFT AUTO
SAN DIMAS YTDReportedIncidents
YTDCrime Rate
TotalReportedIncidents
YTDReportedIncidents
YTDCrime Rate
TotalReportedIncidents
YTDReportedIncidents
YTDCrime Rate
5 YearChange inYTD Crime
Rate
1 YearChange inYTD Crime
Rate
2007 2011 2012
2012/2007 2012/2011
STATION TOTAL
STATION TOTAL
STATION TOTAL
STATION TOTAL
STATION TOTAL
STATION TOTAL
STATION TOTAL
2007 2011
1
18
65
161
422
1,014
241
1
12
39
131
277
637
116
2
7
37
104
282
737
155
1
18
65
161
422
1,014
241
1
12
39
131
277
637
116
.1
1.85
6.69
16.57
43.44
104.37
24.81
.12
1.47
4.79
16.1
34.04
78.28
14.26
.25
.86
4.55
12.78
34.65
90.57
19.05
108.33
-41.5
-5.01
-20.62
1.79
15.7
33.59
150
-53.51
-31.99
-22.87
-20.23
-13.22
-23.22
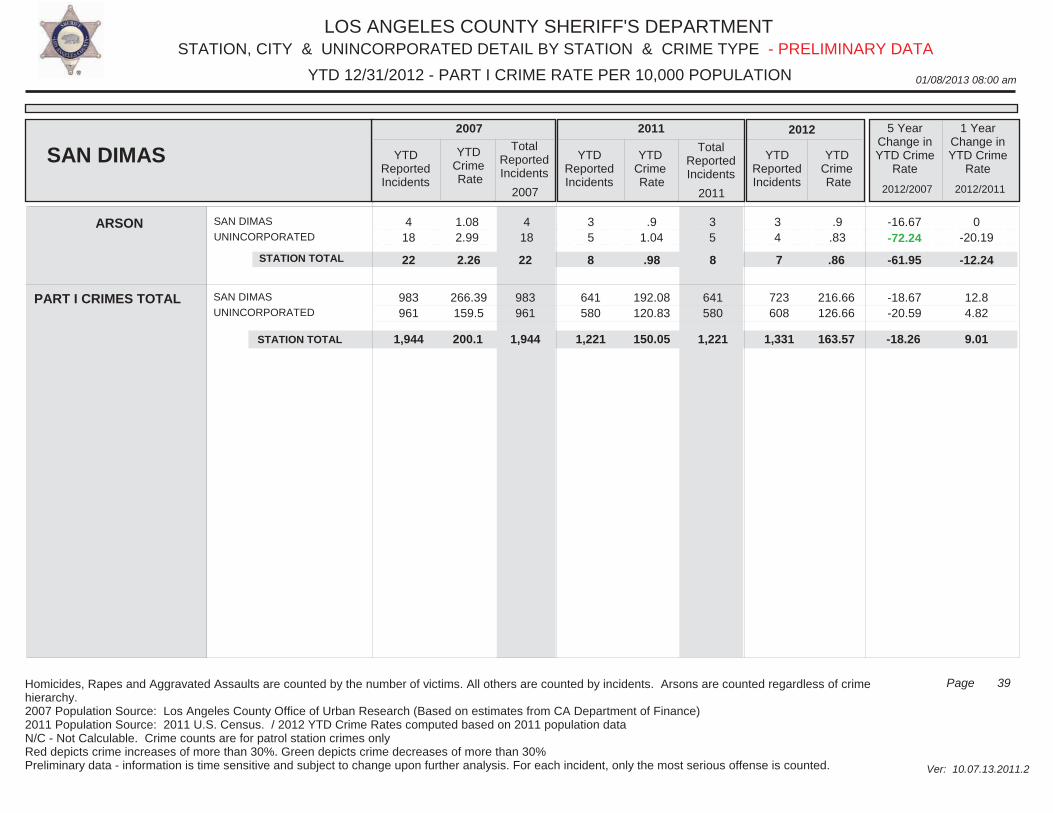
LOS ANGELES COUNTY SHERIFF'S DEPARTMENT
01/08/2013 08:00 am
STATION, CITY & UNINCORPORATED DETAIL BY STATION & CRIME TYPE
Ver: 10.07.13.2011.2
YTD 12/31/2012 - PART I CRIME RATE PER 10,000 POPULATION
39Page
- PRELIMINARY DATA
Homicides, Rapes and Aggravated Assaults are counted by the number of victims. All others are counted by incidents. Arsons are counted regardless of crime hierarchy.2007 Population Source: Los Angeles County Office of Urban Research (Based on estimates from CA Department of Finance)2011 Population Source: 2011 U.S. Census. / 2012 YTD Crime Rates computed based on 2011 population dataN/C - Not Calculable. Crime counts are for patrol station crimes only Red depicts crime increases of more than 30%. Green depicts crime decreases of more than 30%Preliminary data - information is time sensitive and subject to change upon further analysis. For each incident, only the most serious offense is counted.
SAN DIMAS
UNINCORPORATED 4
18 4
18 3 5
3 5
3 4
1.082.99
.91.04
.9.83
-16.67-72.24
0-20.19
ARSON
SAN DIMAS YTDReportedIncidents
YTDCrime Rate
TotalReportedIncidents
YTDReportedIncidents
YTDCrime Rate
TotalReportedIncidents
YTDReportedIncidents
YTDCrime Rate
5 YearChange inYTD Crime
Rate
1 YearChange inYTD Crime
Rate
2007 2011 2012
2012/2007 2012/2011
PART I CRIMES TOTAL
STATION TOTAL
SAN DIMAS
UNINCORPORATED 983 961
2007
641 580
2011
723 608
22 8 7
266.39159.5
983 961
22 8
192.08120.83
641 580
2.26 .98
216.66126.66
.86
-18.67-20.59
-12.24
STATION TOTAL
12.84.82
1,944 1,221
-61.95
1,331 1,944 1,221 163.57200.1 150.05 -18.26 9.01
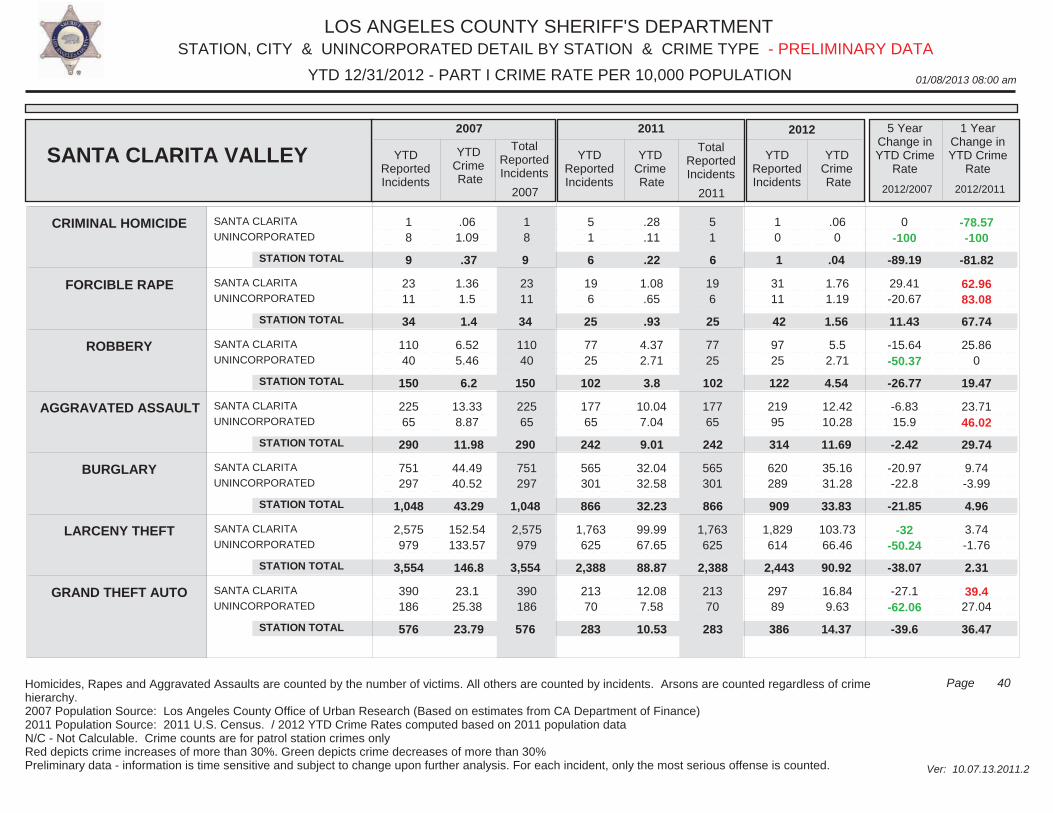
LOS ANGELES COUNTY SHERIFF'S DEPARTMENT
01/08/2013 08:00 am
STATION, CITY & UNINCORPORATED DETAIL BY STATION & CRIME TYPE
Ver: 10.07.13.2011.2
YTD 12/31/2012 - PART I CRIME RATE PER 10,000 POPULATION
40Page
- PRELIMINARY DATA
Homicides, Rapes and Aggravated Assaults are counted by the number of victims. All others are counted by incidents. Arsons are counted regardless of crime hierarchy.2007 Population Source: Los Angeles County Office of Urban Research (Based on estimates from CA Department of Finance)2011 Population Source: 2011 U.S. Census. / 2012 YTD Crime Rates computed based on 2011 population dataN/C - Not Calculable. Crime counts are for patrol station crimes only Red depicts crime increases of more than 30%. Green depicts crime decreases of more than 30%Preliminary data - information is time sensitive and subject to change upon further analysis. For each incident, only the most serious offense is counted.
SANTA CLARITA
UNINCORPORATED
SANTA CLARITA
UNINCORPORATED
SANTA CLARITA
UNINCORPORATED
SANTA CLARITA
UNINCORPORATED
SANTA CLARITA
UNINCORPORATED
SANTA CLARITA
UNINCORPORATED
SANTA CLARITA
UNINCORPORATED
1 8
23 11
110 40
225 65
751 297
2,575 979
390 186
1 8
23 11
110 40
225 65
751 297
2,575 979
390 186
5 1
19 6
77 25
177 65
565 301
1,763 625
213 70
5 1
19 6
77 25
177 65
565 301
1,763 625
213 70
1 0
31 11
97 25
219 95
620 289
1,829 614
297 89
.061.09
1.361.5
6.525.46
13.338.87
44.4940.52
152.54133.57
23.125.38
.28
.11
1.08.65
4.372.71
10.047.04
32.0432.58
99.9967.65
12.087.58
.060
1.761.19
5.52.71
12.4210.28
35.1631.28
103.7366.46
16.849.63
0-100
29.41-20.67
-15.64-50.37
-6.8315.9
-20.97-22.8
-32-50.24
-27.1-62.06
-78.57-100
62.9683.08
25.860
23.7146.02
9.74-3.99
3.74-1.76
39.427.04
CRIMINAL HOMICIDE
FORCIBLE RAPE
ROBBERY
AGGRAVATED ASSAULT
BURGLARY
LARCENY THEFT
GRAND THEFT AUTO
SANTA CLARITA VALLEY YTDReportedIncidents
YTDCrime Rate
TotalReportedIncidents
YTDReportedIncidents
YTDCrime Rate
TotalReportedIncidents
YTDReportedIncidents
YTDCrime Rate
5 YearChange inYTD Crime
Rate
1 YearChange inYTD Crime
Rate
2007 2011 2012
2012/2007 2012/2011
STATION TOTAL
STATION TOTAL
STATION TOTAL
STATION TOTAL
STATION TOTAL
STATION TOTAL
STATION TOTAL
2007 2011
9
34
150
290
1,048
3,554
576
6
25
102
242
866
2,388
283
1
42
122
314
909
2,443
386
9
34
150
290
1,048
3,554
576
6
25
102
242
866
2,388
283
.37
1.4
6.2
11.98
43.29
146.8
23.79
.22
.93
3.8
9.01
32.23
88.87
10.53
.04
1.56
4.54
11.69
33.83
90.92
14.37
-81.82
67.74
19.47
29.74
4.96
2.31
36.47
-89.19
11.43
-26.77
-2.42
-21.85
-38.07
-39.6
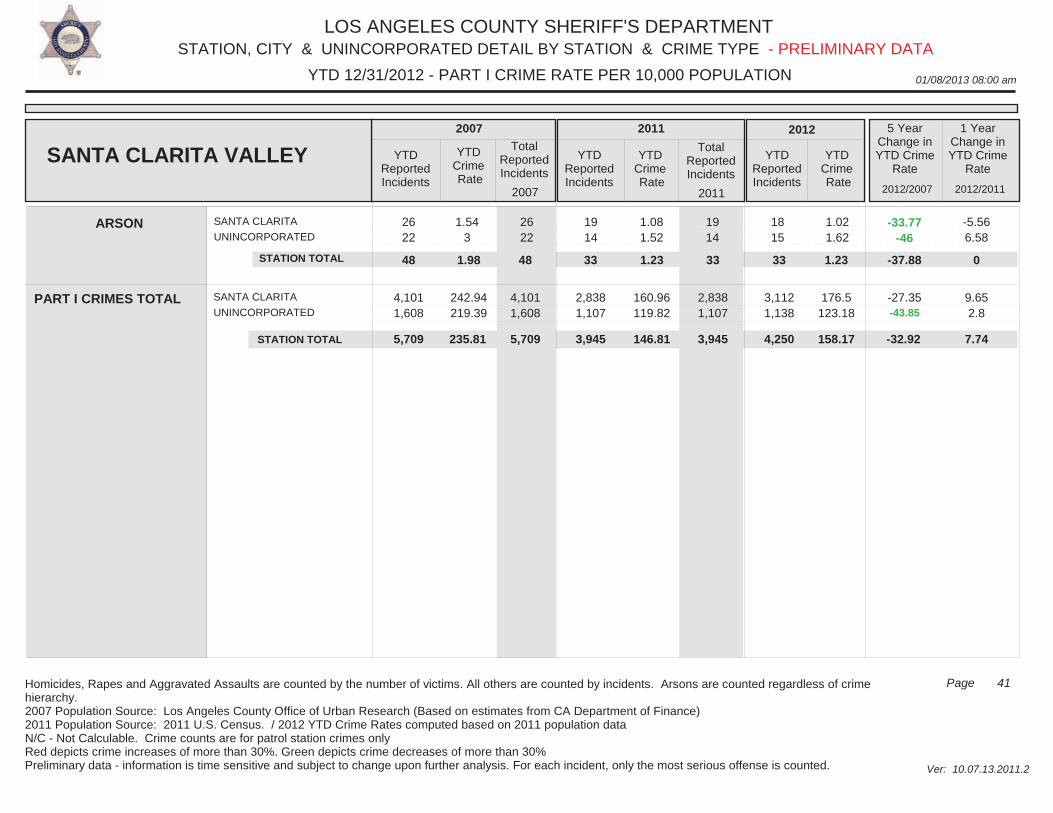
LOS ANGELES COUNTY SHERIFF'S DEPARTMENT
01/08/2013 08:00 am
STATION, CITY & UNINCORPORATED DETAIL BY STATION & CRIME TYPE
Ver: 10.07.13.2011.2
YTD 12/31/2012 - PART I CRIME RATE PER 10,000 POPULATION
41Page
- PRELIMINARY DATA
Homicides, Rapes and Aggravated Assaults are counted by the number of victims. All others are counted by incidents. Arsons are counted regardless of crime hierarchy.2007 Population Source: Los Angeles County Office of Urban Research (Based on estimates from CA Department of Finance)2011 Population Source: 2011 U.S. Census. / 2012 YTD Crime Rates computed based on 2011 population dataN/C - Not Calculable. Crime counts are for patrol station crimes only Red depicts crime increases of more than 30%. Green depicts crime decreases of more than 30%Preliminary data - information is time sensitive and subject to change upon further analysis. For each incident, only the most serious offense is counted.
SANTA CLARITA
UNINCORPORATED 26 22
26 22
19 14
19 14
18 15
1.543
1.081.52
1.021.62
-33.77-46
-5.566.58
ARSON
SANTA CLARITA VALLEY YTDReportedIncidents
YTDCrime Rate
TotalReportedIncidents
YTDReportedIncidents
YTDCrime Rate
TotalReportedIncidents
YTDReportedIncidents
YTDCrime Rate
5 YearChange inYTD Crime
Rate
1 YearChange inYTD Crime
Rate
2007 2011 2012
2012/2007 2012/2011
PART I CRIMES TOTAL
STATION TOTAL
SANTA CLARITA
UNINCORPORATED 4,101 1,608
2007
2,838 1,107
2011
3,112 1,138
48 33 33
242.94219.39
4,101 1,608
48 33
160.96119.82
2,838 1,107
1.98 1.23
176.5123.18
1.23
-27.35-43.85
0
STATION TOTAL
9.652.8
5,709 3,945
-37.88
4,250 5,709 3,945 158.17235.81 146.81 -32.92 7.74
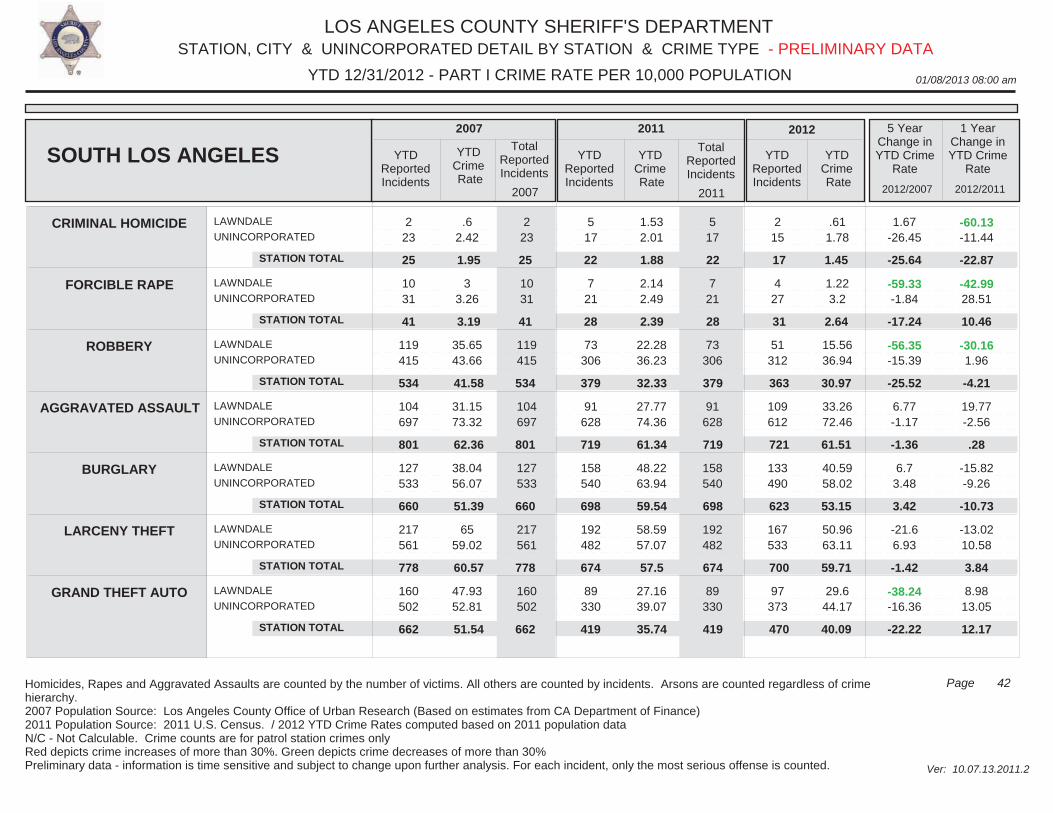
LOS ANGELES COUNTY SHERIFF'S DEPARTMENT
01/08/2013 08:00 am
STATION, CITY & UNINCORPORATED DETAIL BY STATION & CRIME TYPE
Ver: 10.07.13.2011.2
YTD 12/31/2012 - PART I CRIME RATE PER 10,000 POPULATION
42Page
- PRELIMINARY DATA
Homicides, Rapes and Aggravated Assaults are counted by the number of victims. All others are counted by incidents. Arsons are counted regardless of crime hierarchy.2007 Population Source: Los Angeles County Office of Urban Research (Based on estimates from CA Department of Finance)2011 Population Source: 2011 U.S. Census. / 2012 YTD Crime Rates computed based on 2011 population dataN/C - Not Calculable. Crime counts are for patrol station crimes only Red depicts crime increases of more than 30%. Green depicts crime decreases of more than 30%Preliminary data - information is time sensitive and subject to change upon further analysis. For each incident, only the most serious offense is counted.
LAWNDALE
UNINCORPORATED
LAWNDALE
UNINCORPORATED
LAWNDALE
UNINCORPORATED
LAWNDALE
UNINCORPORATED
LAWNDALE
UNINCORPORATED
LAWNDALE
UNINCORPORATED
LAWNDALE
UNINCORPORATED
2 23
10 31
119 415
104 697
127 533
217 561
160 502
2 23
10 31
119 415
104 697
127 533
217 561
160 502
5 17
7 21
73 306
91 628
158 540
192 482
89 330
5 17
7 21
73 306
91 628
158 540
192 482
89 330
2 15
4 27
51 312
109 612
133 490
167 533
97 373
.62.42
33.26
35.6543.66
31.1573.32
38.0456.07
6559.02
47.9352.81
1.532.01
2.142.49
22.2836.23
27.7774.36
48.2263.94
58.5957.07
27.1639.07
.611.78
1.223.2
15.5636.94
33.2672.46
40.5958.02
50.9663.11
29.644.17
1.67-26.45
-59.33-1.84
-56.35-15.39
6.77-1.17
6.73.48
-21.66.93
-38.24-16.36
-60.13-11.44
-42.9928.51
-30.161.96
19.77-2.56
-15.82-9.26
-13.0210.58
8.9813.05
CRIMINAL HOMICIDE
FORCIBLE RAPE
ROBBERY
AGGRAVATED ASSAULT
BURGLARY
LARCENY THEFT
GRAND THEFT AUTO
SOUTH LOS ANGELES YTDReportedIncidents
YTDCrime Rate
TotalReportedIncidents
YTDReportedIncidents
YTDCrime Rate
TotalReportedIncidents
YTDReportedIncidents
YTDCrime Rate
5 YearChange inYTD Crime
Rate
1 YearChange inYTD Crime
Rate
2007 2011 2012
2012/2007 2012/2011
STATION TOTAL
STATION TOTAL
STATION TOTAL
STATION TOTAL
STATION TOTAL
STATION TOTAL
STATION TOTAL
2007 2011
25
41
534
801
660
778
662
22
28
379
719
698
674
419
17
31
363
721
623
700
470
25
41
534
801
660
778
662
22
28
379
719
698
674
419
1.95
3.19
41.58
62.36
51.39
60.57
51.54
1.88
2.39
32.33
61.34
59.54
57.5
35.74
1.45
2.64
30.97
61.51
53.15
59.71
40.09
-22.87
10.46
-4.21
.28
-10.73
3.84
12.17
-25.64
-17.24
-25.52
-1.36
3.42
-1.42
-22.22
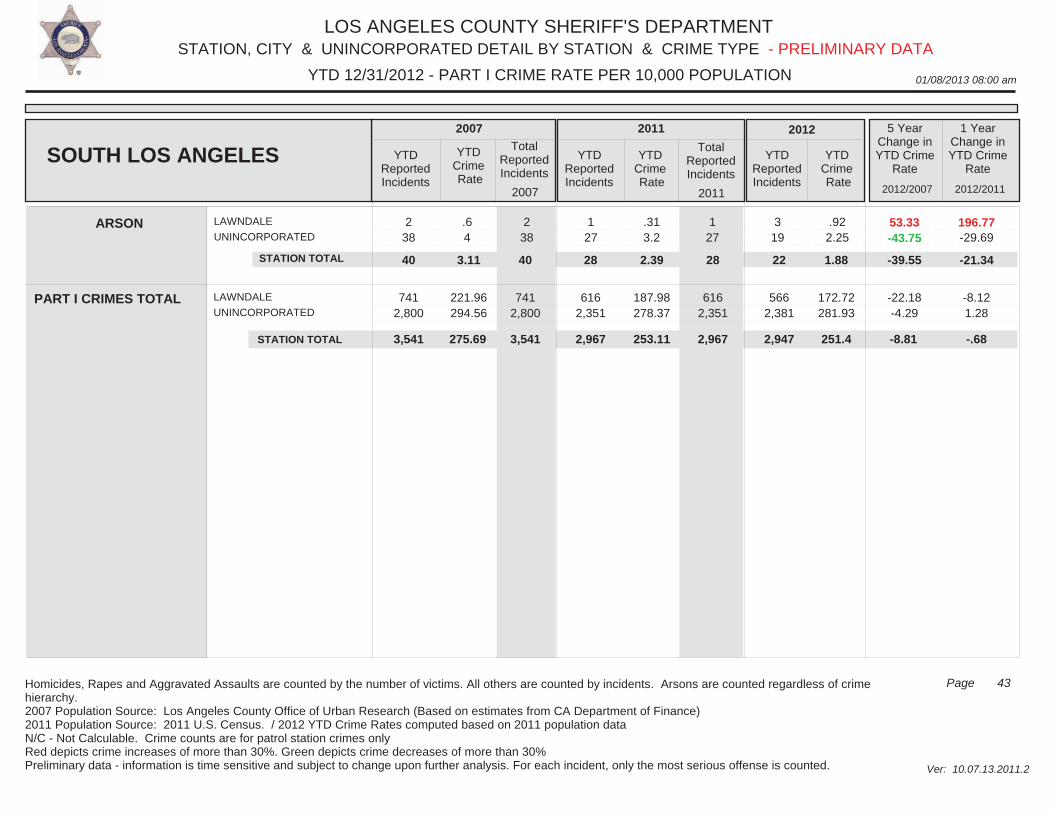
LOS ANGELES COUNTY SHERIFF'S DEPARTMENT
01/08/2013 08:00 am
STATION, CITY & UNINCORPORATED DETAIL BY STATION & CRIME TYPE
Ver: 10.07.13.2011.2
YTD 12/31/2012 - PART I CRIME RATE PER 10,000 POPULATION
43Page
- PRELIMINARY DATA
Homicides, Rapes and Aggravated Assaults are counted by the number of victims. All others are counted by incidents. Arsons are counted regardless of crime hierarchy.2007 Population Source: Los Angeles County Office of Urban Research (Based on estimates from CA Department of Finance)2011 Population Source: 2011 U.S. Census. / 2012 YTD Crime Rates computed based on 2011 population dataN/C - Not Calculable. Crime counts are for patrol station crimes only Red depicts crime increases of more than 30%. Green depicts crime decreases of more than 30%Preliminary data - information is time sensitive and subject to change upon further analysis. For each incident, only the most serious offense is counted.
LAWNDALE
UNINCORPORATED 2
38 2
38 1 27
1 27
3 19
.64
.313.2
.922.25
53.33-43.75
196.77-29.69
ARSON
SOUTH LOS ANGELES YTDReportedIncidents
YTDCrime Rate
TotalReportedIncidents
YTDReportedIncidents
YTDCrime Rate
TotalReportedIncidents
YTDReportedIncidents
YTDCrime Rate
5 YearChange inYTD Crime
Rate
1 YearChange inYTD Crime
Rate
2007 2011 2012
2012/2007 2012/2011
PART I CRIMES TOTAL
STATION TOTAL
LAWNDALE
UNINCORPORATED 741
2,800
2007
616 2,351
2011
566 2,381
40 28 22
221.96294.56
741 2,800
40 28
187.98278.37
616 2,351
3.11 2.39
172.72281.93
1.88
-22.18-4.29
-21.34
STATION TOTAL
-8.121.28
3,541 2,967
-39.55
2,947 3,541 2,967 251.4275.69 253.11 -8.81 -.68
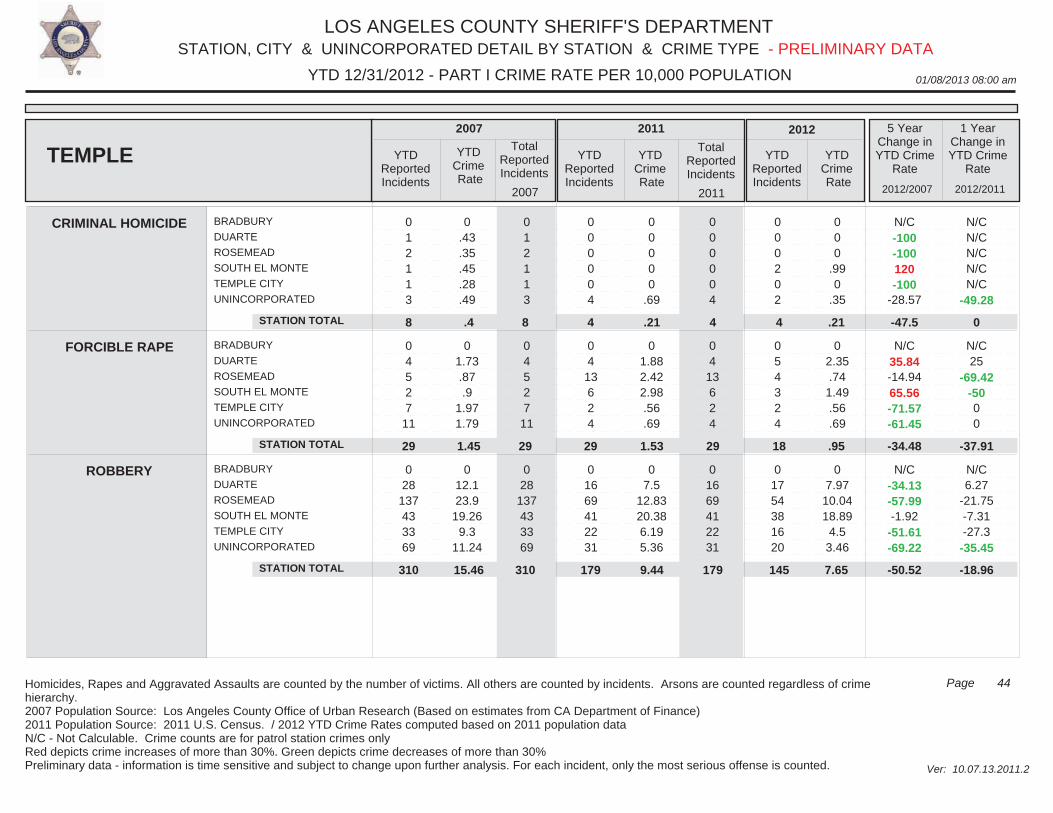
LOS ANGELES COUNTY SHERIFF'S DEPARTMENT
01/08/2013 08:00 am
STATION, CITY & UNINCORPORATED DETAIL BY STATION & CRIME TYPE
Ver: 10.07.13.2011.2
YTD 12/31/2012 - PART I CRIME RATE PER 10,000 POPULATION
44Page
- PRELIMINARY DATA
Homicides, Rapes and Aggravated Assaults are counted by the number of victims. All others are counted by incidents. Arsons are counted regardless of crime hierarchy.2007 Population Source: Los Angeles County Office of Urban Research (Based on estimates from CA Department of Finance)2011 Population Source: 2011 U.S. Census. / 2012 YTD Crime Rates computed based on 2011 population dataN/C - Not Calculable. Crime counts are for patrol station crimes only Red depicts crime increases of more than 30%. Green depicts crime decreases of more than 30%Preliminary data - information is time sensitive and subject to change upon further analysis. For each incident, only the most serious offense is counted.
BRADBURY
DUARTE
ROSEMEAD
SOUTH EL MONTE
TEMPLE CITY
UNINCORPORATED
BRADBURY
DUARTE
ROSEMEAD
SOUTH EL MONTE
TEMPLE CITY
UNINCORPORATED
BRADBURY
DUARTE
ROSEMEAD
SOUTH EL MONTE
TEMPLE CITY
UNINCORPORATED
0 1 2 1 1 3
0 4 5 2 7
11
0 28
137 43 33 69
0 1 2 1 1 3
0 4 5 2 7
11
0 28
137 43 33 69
0 0 0 0 0 4
0 4 13 6 2 4
0 16 69 41 22 31
0 0 0 0 0 4
0 4
13 6 2 4
0 16 69 41 22 31
0 0 0 2 0 2
0 5 4 3 2 4
0 17 54 38 16 20
0.43.35.45.28.49
01.73.87.9
1.971.79
012.123.9
19.269.3
11.24
00000
.69
01.882.422.98.56.69
07.5
12.8320.386.195.36
000
.990
.35
02.35.74
1.49.56.69
07.97
10.0418.89
4.53.46
N/C-100-100120-100
-28.57
N/C35.84-14.9465.56-71.57-61.45
N/C-34.13-57.99-1.92
-51.61-69.22
N/CN/CN/CN/CN/C
-49.28
N/C25
-69.42-5000
N/C6.27
-21.75-7.31-27.3-35.45
CRIMINAL HOMICIDE
FORCIBLE RAPE
ROBBERY
TEMPLE YTDReportedIncidents
YTDCrime Rate
TotalReportedIncidents
YTDReportedIncidents
YTDCrime Rate
TotalReportedIncidents
YTDReportedIncidents
YTDCrime Rate
5 YearChange inYTD Crime
Rate
1 YearChange inYTD Crime
Rate
2007 2011 2012
2012/2007 2012/2011
STATION TOTAL
STATION TOTAL
STATION TOTAL
2007 2011
8
29
310
4
29
179
4
18
145
8
29
310
4
29
179
.4
1.45
15.46
.21
1.53
9.44
.21
.95
7.65
0
-37.91
-18.96
-47.5
-34.48
-50.52
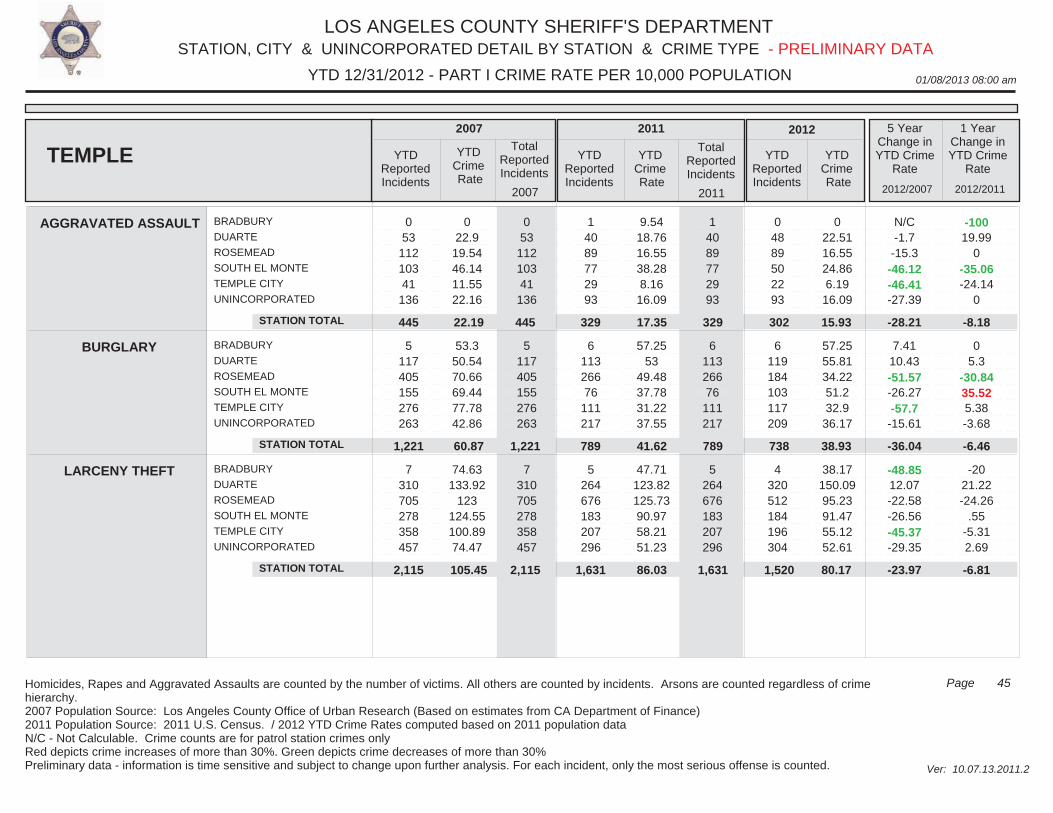
LOS ANGELES COUNTY SHERIFF'S DEPARTMENT
01/08/2013 08:00 am
STATION, CITY & UNINCORPORATED DETAIL BY STATION & CRIME TYPE
Ver: 10.07.13.2011.2
YTD 12/31/2012 - PART I CRIME RATE PER 10,000 POPULATION
45Page
- PRELIMINARY DATA
Homicides, Rapes and Aggravated Assaults are counted by the number of victims. All others are counted by incidents. Arsons are counted regardless of crime hierarchy.2007 Population Source: Los Angeles County Office of Urban Research (Based on estimates from CA Department of Finance)2011 Population Source: 2011 U.S. Census. / 2012 YTD Crime Rates computed based on 2011 population dataN/C - Not Calculable. Crime counts are for patrol station crimes only Red depicts crime increases of more than 30%. Green depicts crime decreases of more than 30%Preliminary data - information is time sensitive and subject to change upon further analysis. For each incident, only the most serious offense is counted.
BRADBURY
DUARTE
ROSEMEAD
SOUTH EL MONTE
TEMPLE CITY
UNINCORPORATED
BRADBURY
DUARTE
ROSEMEAD
SOUTH EL MONTE
TEMPLE CITY
UNINCORPORATED
BRADBURY
DUARTE
ROSEMEAD
SOUTH EL MONTE
TEMPLE CITY
UNINCORPORATED
0 53
112 103 41
136
5 117 405 155 276 263
7 310 705 278 358 457
0 53
112 103 41
136
5 117 405 155 276 263
7 310 705 278 358 457
1 40 89 77 29 93
6 113 266 76
111 217
5 264 676 183 207 296
1 40 89 77 29 93
6 113 266 76
111 217
5 264 676 183 207 296
0 48 89 50 22 93
6 119 184 103 117 209
4 320 512 184 196 304
022.9
19.5446.1411.5522.16
53.350.5470.6669.4477.7842.86
74.63133.92
123124.55100.8974.47
9.5418.7616.5538.288.16
16.09
57.2553
49.4837.7831.2237.55
47.71123.82125.7390.9758.2151.23
022.5116.5524.866.19
16.09
57.2555.8134.2251.232.9
36.17
38.17150.0995.2391.4755.1252.61
N/C-1.7
-15.3-46.12-46.41-27.39
7.4110.43-51.57-26.27-57.7
-15.61
-48.8512.07-22.58-26.56-45.37-29.35
-10019.99
0-35.06-24.14
0
05.3
-30.8435.525.38-3.68
-2021.22-24.26
.55-5.312.69
AGGRAVATED ASSAULT
BURGLARY
LARCENY THEFT
TEMPLE YTDReportedIncidents
YTDCrime Rate
TotalReportedIncidents
YTDReportedIncidents
YTDCrime Rate
TotalReportedIncidents
YTDReportedIncidents
YTDCrime Rate
5 YearChange inYTD Crime
Rate
1 YearChange inYTD Crime
Rate
2007 2011 2012
2012/2007 2012/2011
STATION TOTAL
STATION TOTAL
STATION TOTAL
2007 2011
445
1,221
2,115
329
789
1,631
302
738
1,520
445
1,221
2,115
329
789
1,631
22.19
60.87
105.45
17.35
41.62
86.03
15.93
38.93
80.17
-8.18
-6.46
-6.81
-28.21
-36.04
-23.97
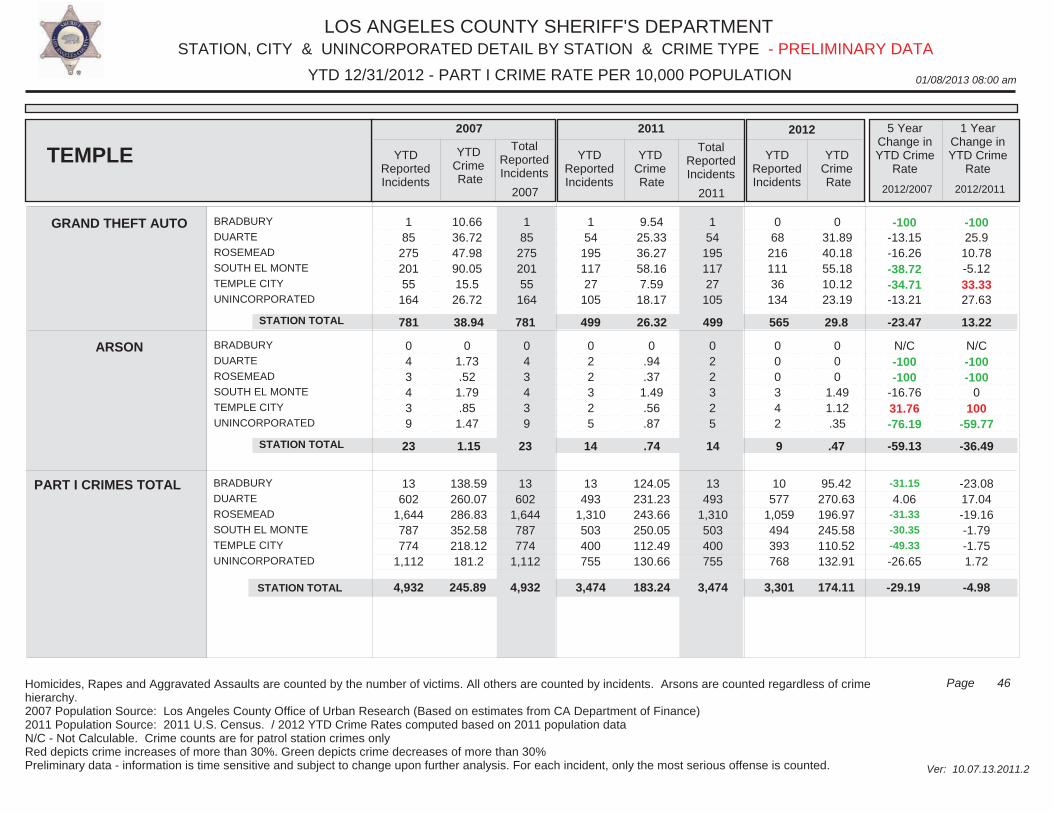
LOS ANGELES COUNTY SHERIFF'S DEPARTMENT
01/08/2013 08:00 am
STATION, CITY & UNINCORPORATED DETAIL BY STATION & CRIME TYPE
Ver: 10.07.13.2011.2
YTD 12/31/2012 - PART I CRIME RATE PER 10,000 POPULATION
46Page
- PRELIMINARY DATA
Homicides, Rapes and Aggravated Assaults are counted by the number of victims. All others are counted by incidents. Arsons are counted regardless of crime hierarchy.2007 Population Source: Los Angeles County Office of Urban Research (Based on estimates from CA Department of Finance)2011 Population Source: 2011 U.S. Census. / 2012 YTD Crime Rates computed based on 2011 population dataN/C - Not Calculable. Crime counts are for patrol station crimes only Red depicts crime increases of more than 30%. Green depicts crime decreases of more than 30%Preliminary data - information is time sensitive and subject to change upon further analysis. For each incident, only the most serious offense is counted.
BRADBURY
DUARTE
ROSEMEAD
SOUTH EL MONTE
TEMPLE CITY
UNINCORPORATED
BRADBURY
DUARTE
ROSEMEAD
SOUTH EL MONTE
TEMPLE CITY
UNINCORPORATED
1 85
275 201 55
164
0 4 3 4 3 9
1 85
275 201 55
164
0 4 3 4 3 9
1 54
195 117 27
105
0 2 2 3 2 5
1 54
195 117 27
105
0 2 2 3 2 5
0 68
216 111 36
134
0 0 0 3 4 2
10.6636.7247.9890.0515.5
26.72
01.73.52
1.79.85
1.47
9.5425.3336.2758.167.59
18.17
0.94.37
1.49.56.87
031.8940.1855.1810.1223.19
000
1.491.12.35
-100-13.15-16.26-38.72-34.71-13.21
N/C-100-100
-16.7631.76-76.19
-10025.9
10.78-5.1233.3327.63
N/C-100-100
0100
-59.77
GRAND THEFT AUTO
ARSON
TEMPLE YTDReportedIncidents
YTDCrime Rate
TotalReportedIncidents
YTDReportedIncidents
YTDCrime Rate
TotalReportedIncidents
YTDReportedIncidents
YTDCrime Rate
5 YearChange inYTD Crime
Rate
1 YearChange inYTD Crime
Rate
2007 2011 2012
2012/2007 2012/2011
PART I CRIMES TOTAL
STATION TOTAL
STATION TOTAL
BRADBURY
DUARTE
ROSEMEAD
SOUTH EL MONTE
TEMPLE CITY
UNINCORPORATED
13 602
1,644 787 774
1,112
2007
13 493
1,310 503 400 755
2011
10 577
1,059 494 393 768
781
23
499
14
565
9
138.59260.07286.83352.58218.12181.2
13 602
1,644 787 774
1,112
781
23
499
14
124.05231.23243.66250.05112.49130.66
13 493
1,310 503 400 755
38.94
1.15
26.32
.74
95.42270.63196.97245.58110.52132.91
29.8
.47
-31.15
4.06-31.33
-30.35
-49.33
-26.65
13.22
-36.49
STATION TOTAL
-23.0817.04-19.16-1.79-1.751.72
4,932 3,474
-23.47
-59.13
3,301 4,932 3,474 174.11245.89 183.24 -29.19 -4.98
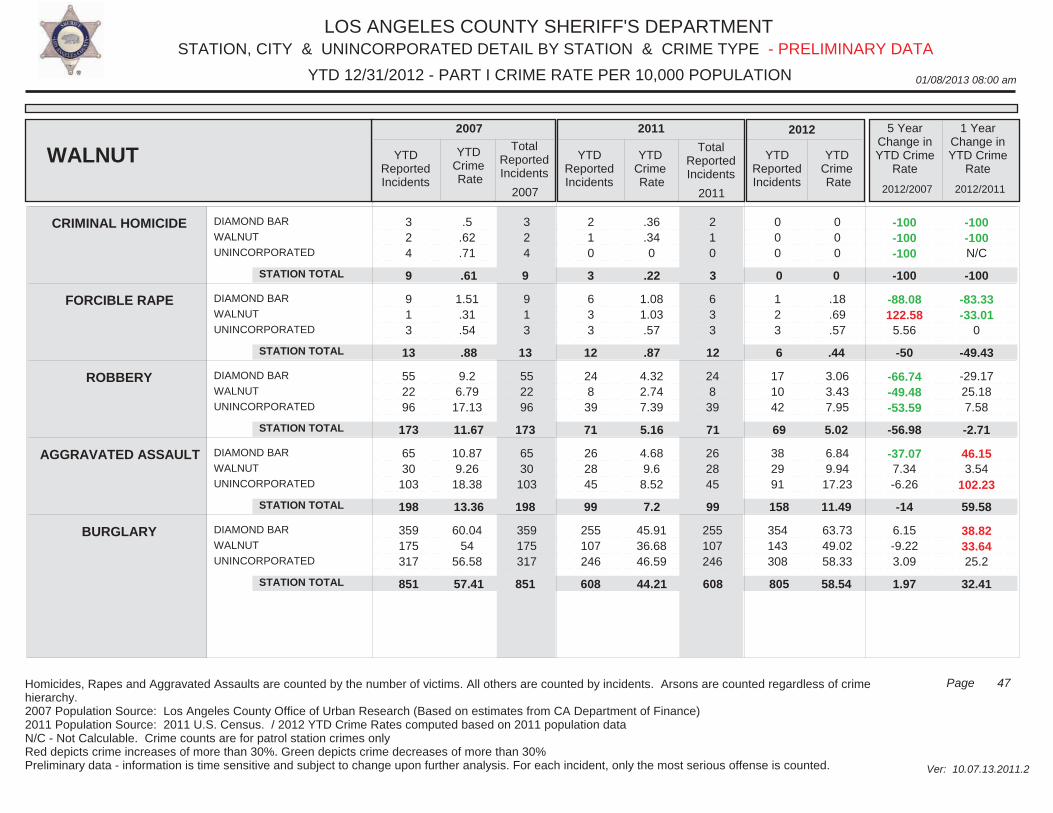
LOS ANGELES COUNTY SHERIFF'S DEPARTMENT
01/08/2013 08:00 am
STATION, CITY & UNINCORPORATED DETAIL BY STATION & CRIME TYPE
Ver: 10.07.13.2011.2
YTD 12/31/2012 - PART I CRIME RATE PER 10,000 POPULATION
47Page
- PRELIMINARY DATA
Homicides, Rapes and Aggravated Assaults are counted by the number of victims. All others are counted by incidents. Arsons are counted regardless of crime hierarchy.2007 Population Source: Los Angeles County Office of Urban Research (Based on estimates from CA Department of Finance)2011 Population Source: 2011 U.S. Census. / 2012 YTD Crime Rates computed based on 2011 population dataN/C - Not Calculable. Crime counts are for patrol station crimes only Red depicts crime increases of more than 30%. Green depicts crime decreases of more than 30%Preliminary data - information is time sensitive and subject to change upon further analysis. For each incident, only the most serious offense is counted.
DIAMOND BAR
WALNUT
UNINCORPORATED
DIAMOND BAR
WALNUT
UNINCORPORATED
DIAMOND BAR
WALNUT
UNINCORPORATED
DIAMOND BAR
WALNUT
UNINCORPORATED
DIAMOND BAR
WALNUT
UNINCORPORATED
3 2 4
9 1 3
55 22 96
65 30
103
359 175 317
3 2 4
9 1 3
55 22 96
65 30
103
359 175 317
2 1 0
6 3 3
24 8 39
26 28 45
255 107 246
2 1 0
6 3 3
24 8
39
26 28 45
255 107 246
0 0 0
1 2 3
17 10 42
38 29 91
354 143 308
.5.62.71
1.51.31.54
9.26.79
17.13
10.879.26
18.38
60.0454
56.58
.36
.340
1.081.03.57
4.322.747.39
4.689.6
8.52
45.9136.6846.59
000
.18
.69
.57
3.063.437.95
6.849.94
17.23
63.7349.0258.33
-100-100-100
-88.08122.58
5.56
-66.74-49.48-53.59
-37.077.34-6.26
6.15-9.223.09
-100-100N/C
-83.33-33.01
0
-29.1725.187.58
46.153.54
102.23
38.8233.6425.2
CRIMINAL HOMICIDE
FORCIBLE RAPE
ROBBERY
AGGRAVATED ASSAULT
BURGLARY
WALNUT YTDReportedIncidents
YTDCrime Rate
TotalReportedIncidents
YTDReportedIncidents
YTDCrime Rate
TotalReportedIncidents
YTDReportedIncidents
YTDCrime Rate
5 YearChange inYTD Crime
Rate
1 YearChange inYTD Crime
Rate
2007 2011 2012
2012/2007 2012/2011
STATION TOTAL
STATION TOTAL
STATION TOTAL
STATION TOTAL
STATION TOTAL
2007 2011
9
13
173
198
851
3
12
71
99
608
0
6
69
158
805
9
13
173
198
851
3
12
71
99
608
.61
.88
11.67
13.36
57.41
.22
.87
5.16
7.2
44.21
0
.44
5.02
11.49
58.54
-100
-49.43
-2.71
59.58
32.41
-100
-50
-56.98
-14
1.97
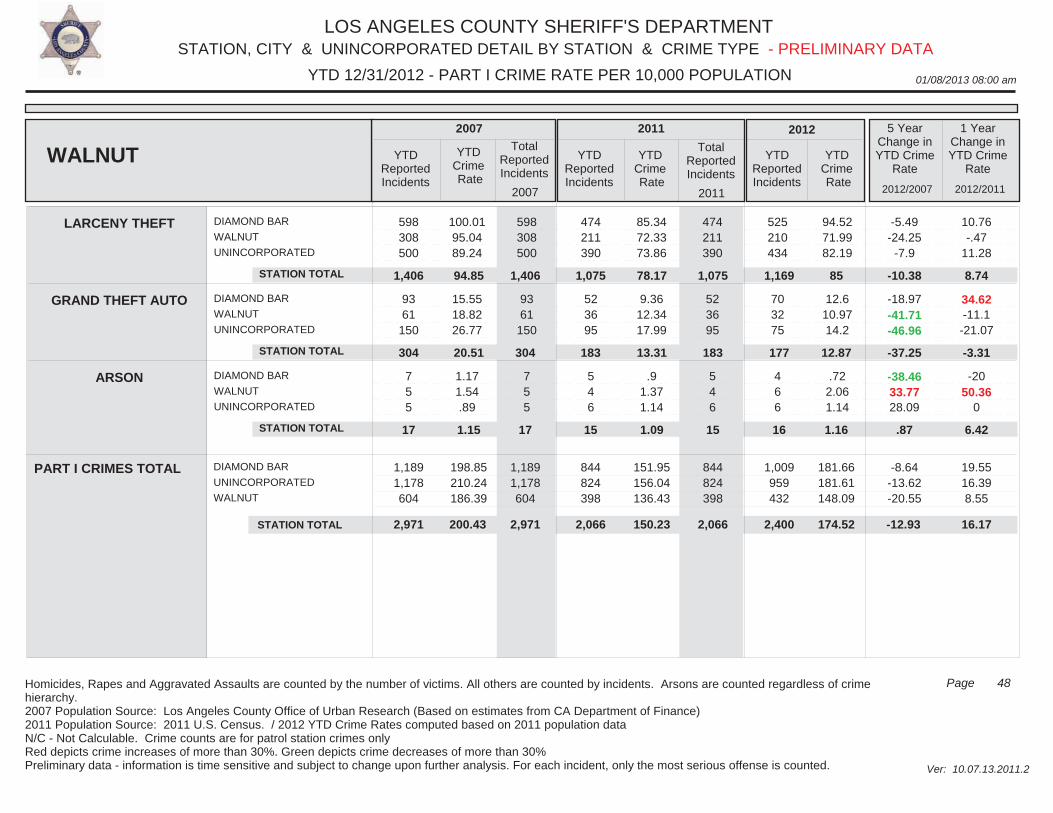
LOS ANGELES COUNTY SHERIFF'S DEPARTMENT
01/08/2013 08:00 am
STATION, CITY & UNINCORPORATED DETAIL BY STATION & CRIME TYPE
Ver: 10.07.13.2011.2
YTD 12/31/2012 - PART I CRIME RATE PER 10,000 POPULATION
48Page
- PRELIMINARY DATA
Homicides, Rapes and Aggravated Assaults are counted by the number of victims. All others are counted by incidents. Arsons are counted regardless of crime hierarchy.2007 Population Source: Los Angeles County Office of Urban Research (Based on estimates from CA Department of Finance)2011 Population Source: 2011 U.S. Census. / 2012 YTD Crime Rates computed based on 2011 population dataN/C - Not Calculable. Crime counts are for patrol station crimes only Red depicts crime increases of more than 30%. Green depicts crime decreases of more than 30%Preliminary data - information is time sensitive and subject to change upon further analysis. For each incident, only the most serious offense is counted.
DIAMOND BAR
WALNUT
UNINCORPORATED
DIAMOND BAR
WALNUT
UNINCORPORATED
DIAMOND BAR
WALNUT
UNINCORPORATED
598 308 500
93 61
150
7 5 5
598 308 500
93 61
150
7 5 5
474 211 390
52 36 95
5 4 6
474 211 390
52 36 95
5 4 6
525 210 434
70 32 75
4 6 6
100.0195.0489.24
15.5518.8226.77
1.171.54.89
85.3472.3373.86
9.3612.3417.99
.91.371.14
94.5271.9982.19
12.610.9714.2
.722.061.14
-5.49-24.25
-7.9
-18.97-41.71-46.96
-38.4633.7728.09
10.76-.47
11.28
34.62-11.1-21.07
-2050.36
0
LARCENY THEFT
GRAND THEFT AUTO
ARSON
WALNUT YTDReportedIncidents
YTDCrime Rate
TotalReportedIncidents
YTDReportedIncidents
YTDCrime Rate
TotalReportedIncidents
YTDReportedIncidents
YTDCrime Rate
5 YearChange inYTD Crime
Rate
1 YearChange inYTD Crime
Rate
2007 2011 2012
2012/2007 2012/2011
PART I CRIMES TOTAL
STATION TOTAL
STATION TOTAL
STATION TOTAL
DIAMOND BAR
UNINCORPORATED
WALNUT
1,189 1,178 604
2007
844 824 398
2011
1,009 959 432
1,406
304
17
1,075
183
15
1,169
177
16
198.85210.24186.39
1,189 1,178 604
1,406
304
17
1,075
183
15
151.95156.04136.43
844 824 398
94.85
20.51
1.15
78.17
13.31
1.09
181.66181.61148.09
85
12.87
1.16
-8.64-13.62-20.55
8.74
-3.31
6.42
STATION TOTAL
19.5516.398.55
2,971 2,066
-10.38
-37.25
.87
2,400 2,971 2,066 174.52200.43 150.23 -12.93 16.17
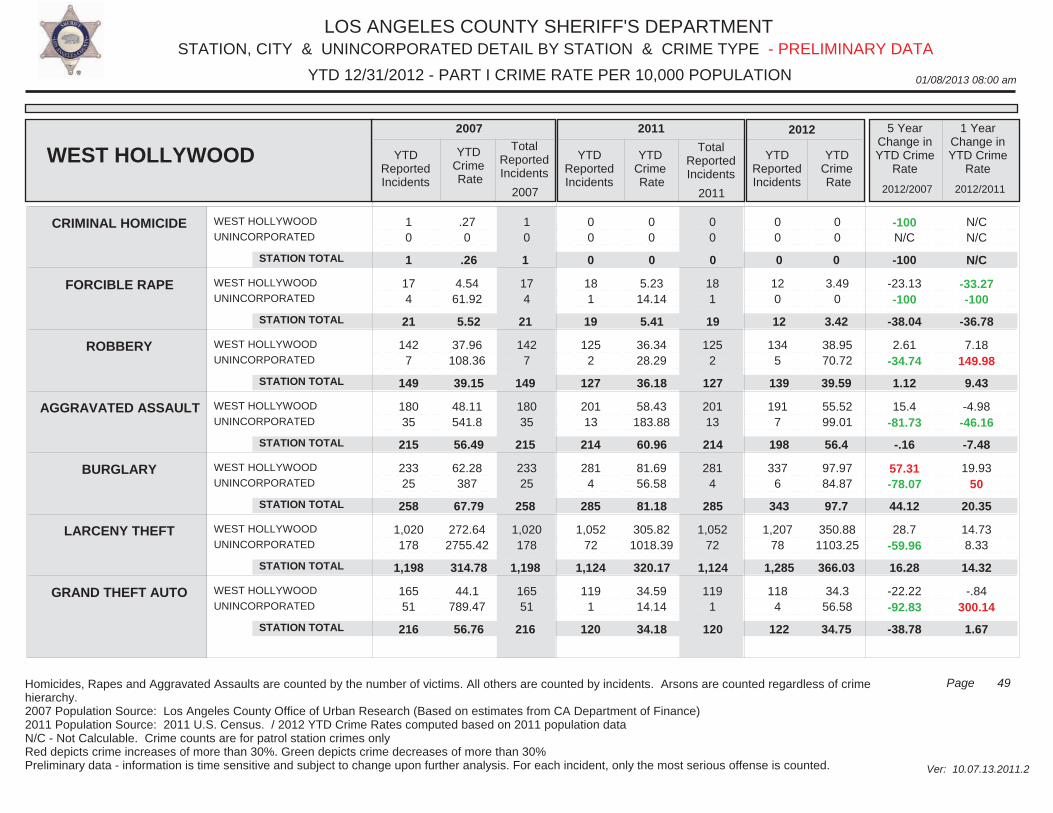
LOS ANGELES COUNTY SHERIFF'S DEPARTMENT
01/08/2013 08:00 am
STATION, CITY & UNINCORPORATED DETAIL BY STATION & CRIME TYPE
Ver: 10.07.13.2011.2
YTD 12/31/2012 - PART I CRIME RATE PER 10,000 POPULATION
49Page
- PRELIMINARY DATA
Homicides, Rapes and Aggravated Assaults are counted by the number of victims. All others are counted by incidents. Arsons are counted regardless of crime hierarchy.2007 Population Source: Los Angeles County Office of Urban Research (Based on estimates from CA Department of Finance)2011 Population Source: 2011 U.S. Census. / 2012 YTD Crime Rates computed based on 2011 population dataN/C - Not Calculable. Crime counts are for patrol station crimes only Red depicts crime increases of more than 30%. Green depicts crime decreases of more than 30%Preliminary data - information is time sensitive and subject to change upon further analysis. For each incident, only the most serious offense is counted.
WEST HOLLYWOOD
UNINCORPORATED
WEST HOLLYWOOD
UNINCORPORATED
WEST HOLLYWOOD
UNINCORPORATED
WEST HOLLYWOOD
UNINCORPORATED
WEST HOLLYWOOD
UNINCORPORATED
WEST HOLLYWOOD
UNINCORPORATED
WEST HOLLYWOOD
UNINCORPORATED
1 0
17 4
142 7
180 35
233 25
1,020 178
165 51
1 0
17 4
142 7
180 35
233 25
1,020 178
165 51
0 0
18 1
125 2
201 13
281 4
1,052 72
119 1
0 0
18 1
125 2
201 13
281 4
1,052 72
119 1
0 0
12 0
134 5
191 7
337 6
1,207 78
118 4
.270
4.5461.92
37.96108.36
48.11541.8
62.28387
272.642755.42
44.1789.47
00
5.2314.14
36.3428.29
58.43183.88
81.6956.58
305.821018.39
34.5914.14
00
3.490
38.9570.72
55.5299.01
97.9784.87
350.881103.25
34.356.58
-100N/C
-23.13-100
2.61-34.74
15.4-81.73
57.31-78.07
28.7-59.96
-22.22-92.83
N/CN/C
-33.27-100
7.18149.98
-4.98-46.16
19.9350
14.738.33
-.84300.14
CRIMINAL HOMICIDE
FORCIBLE RAPE
ROBBERY
AGGRAVATED ASSAULT
BURGLARY
LARCENY THEFT
GRAND THEFT AUTO
WEST HOLLYWOOD YTDReportedIncidents
YTDCrime Rate
TotalReportedIncidents
YTDReportedIncidents
YTDCrime Rate
TotalReportedIncidents
YTDReportedIncidents
YTDCrime Rate
5 YearChange inYTD Crime
Rate
1 YearChange inYTD Crime
Rate
2007 2011 2012
2012/2007 2012/2011
STATION TOTAL
STATION TOTAL
STATION TOTAL
STATION TOTAL
STATION TOTAL
STATION TOTAL
STATION TOTAL
2007 2011
1
21
149
215
258
1,198
216
0
19
127
214
285
1,124
120
0
12
139
198
343
1,285
122
1
21
149
215
258
1,198
216
0
19
127
214
285
1,124
120
.26
5.52
39.15
56.49
67.79
314.78
56.76
0
5.41
36.18
60.96
81.18
320.17
34.18
0
3.42
39.59
56.4
97.7
366.03
34.75
N/C
-36.78
9.43
-7.48
20.35
14.32
1.67
-100
-38.04
1.12
-.16
44.12
16.28
-38.78
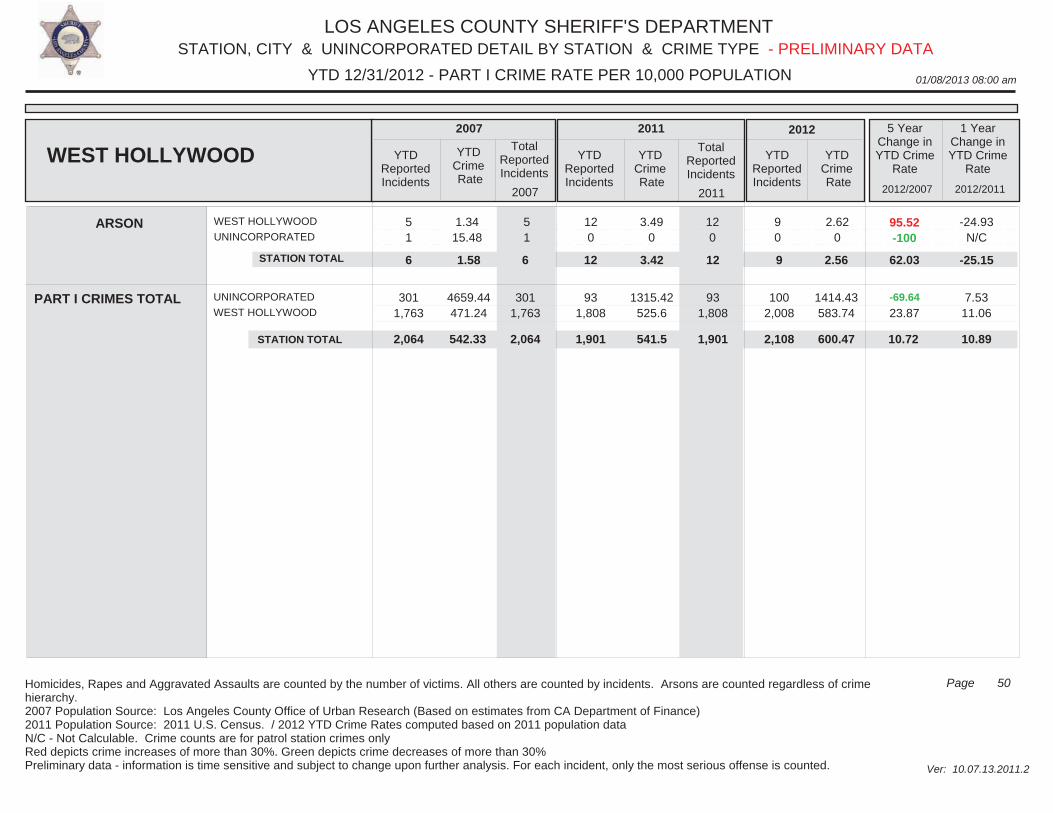
LOS ANGELES COUNTY SHERIFF'S DEPARTMENT
01/08/2013 08:00 am
STATION, CITY & UNINCORPORATED DETAIL BY STATION & CRIME TYPE
Ver: 10.07.13.2011.2
YTD 12/31/2012 - PART I CRIME RATE PER 10,000 POPULATION
50Page
- PRELIMINARY DATA
Homicides, Rapes and Aggravated Assaults are counted by the number of victims. All others are counted by incidents. Arsons are counted regardless of crime hierarchy.2007 Population Source: Los Angeles County Office of Urban Research (Based on estimates from CA Department of Finance)2011 Population Source: 2011 U.S. Census. / 2012 YTD Crime Rates computed based on 2011 population dataN/C - Not Calculable. Crime counts are for patrol station crimes only Red depicts crime increases of more than 30%. Green depicts crime decreases of more than 30%Preliminary data - information is time sensitive and subject to change upon further analysis. For each incident, only the most serious offense is counted.
WEST HOLLYWOOD
UNINCORPORATED 5 1
5 1
12 0
12 0
9 0
1.3415.48
3.490
2.620
95.52-100
-24.93N/C
ARSON
WEST HOLLYWOOD YTDReportedIncidents
YTDCrime Rate
TotalReportedIncidents
YTDReportedIncidents
YTDCrime Rate
TotalReportedIncidents
YTDReportedIncidents
YTDCrime Rate
5 YearChange inYTD Crime
Rate
1 YearChange inYTD Crime
Rate
2007 2011 2012
2012/2007 2012/2011
PART I CRIMES TOTAL
STATION TOTAL
UNINCORPORATED
WEST HOLLYWOOD 301
1,763
2007
93 1,808
2011
100 2,008
6 12 9
4659.44471.24
301 1,763
6 12
1315.42525.6
93 1,808
1.58 3.42
1414.43583.74
2.56
-69.64
23.87
-25.15
STATION TOTAL
7.5311.06
2,064 1,901
62.03
2,108 2,064 1,901 600.47542.33 541.5 10.72 10.89