Embed Size (px)
Citation preview
Executive Summary
In October 2004 we conclude the Title III grant that enabled us to create the framework of a comprehensive developmental education program at Los Medanos College. That framework was first outlined in the Developmental Education Task Force report of 1998 which ended with the observation that “ this report marks the beginning of the work to be done.” Five years later, we can say the same of this formative evaluation of the developmental education program. The end of the grant signals the beginning of institutional support for our developmental education model, which was designed to shift our perspective from a student deficit model to one that focuses on institutional preparedness to educate our students.
As readers of the original task force report will recall, we designed our developmental education program to include all levels of Dr. Ruth Keimig’s hierarchy (the “pyramid”) that she describes in Raising Academic Standards: A Guide to Learning Improvement. Keimig outlines four institutional options for developmental education:
Level 1: Basic Skills CoursesLevel 2: Student – Level InterventionsLevel 3: Course – Level InterventionsLevel 4: Institutional- Level Interventions
Each level builds on the previous, and requires greater institutional resources and commitment. Keimig’s thesis is that institutions reap what they sow in terms of institutional investment in developmental education. Colleges that only offer disconnected basic skills courses will see relatively little improvement in student learning and success. The addition of help for individual students offered at level 2, such as tutoring or learning centers, improves academic outcomes, but only to a degree. The real shift occurs at levels 3 and 4. Here, rather than focusing resources on remediating skills deficits for individual students, the college begins to ask itself how to redesign fundamental elements of teaching, learning and student support in order to be a “prepared institution” – one that is ready to meet the needs of its students.
After five years of work, Los Medanos College is well on its way to being a prepared institution. This report reviews our progress in implementing research-based best practices at each level of our developmental education program:
Section 1 gives an overview of the program, including its history, overall organization, mission/philosophy and goals.
Section 2 addresses each component of the program at successively higher levels of Keimig’s hierarchy. For each component we begin with an overview of research on best practice, a snapshot of where we were relative to this practice in
1

1998, a review of task force recommendations, and a report on our current status in 2003.
Section 3 summarizes the relevant data that we have gathered over the last five years, states our conclusions, and outlines our recommendations/action plan.
So, how are we a better-prepared institution in 2003-2004 than we were in 1998, before Title III funding provided the means to implement the recommendations of the Developmental Education Task Force?
1. We have a well-coordinated program that makes targeted efforts to achieve our mission “to provide students with a coordinated curriculum and comprehensive support services that will engage, challenge and support them as learners.”
TLC Advisory Committee includes the program coordinator, faculty leads in English and math, the Reading/Writing Center Director and Lab Coordinator, Tutor Coordinator, Dean of Liberal Arts & Sciences, and Dean of Student Services. This committee provides overall coordination for the program.
Faculty leads in English and math work with the program coordinator to provide departmental leadership in curriculum development, professional development and assessment.
An integrated program (as opposed to a series of disconnected courses) is in place represented by the metaphor of a tree with its roots grounding the program in assessment and placement, its trunk defining goals/intended student learning outcomes, and the three primary branches of curriculum, student support and faculty development providing a framework for coordinating various interventions.
2. We have aligned our practices with research- based recommendations for achieving the stated goals of our program:
Course and program level student learning outcomes have been defined for developmental courses in English and math.
Faculty in English and math, both full and part-time, participate in teaching communities each semester to design assessments of student learning outcomes for targeted courses, creating and using rubrics to assess student work, providing direct feedback for needed revisions of curriculum and instructional strategies.
Teaching communities provide faculty teaching developmental courses with curriculum-based professional development, the only kind of professional development known to directly impact student achievement.
2

Basic skills courses (English 70 and Math 12) have integrated a counseling component that ensures that students enrolled in those courses are informed of counseling services and have an educational plan.
Students in developmental courses have greater access to technology as a result of the opening of CAI classrooms/labs in math and English.
Students have access to individual professional consultation on their reading and writing assignments across the curriculum through the Reading and Writing Center.
Students benefit from tutors who are trained and evaluated using the professional standards of the College Reading and Learning Association.
A research agenda has been designed in collaboration with the Office of Institutional Research to track measures of student success such as course completion, persistence, and performance in progressively higher levels within the development sequence leading to degree/transfer level courses.
3. We have a plan for both formative and summative evaluations of the developmental education program, the most frequently cited feature of successful developmental education programs. This report marks our first formative evaluation of the program, and future reports will be aligned with accreditation cycles. Each report will include actions taken on previous recommendations and the outcomes of those actions.
Because this is a formative, rather than a summative evaluation of the developmental education program, our focus in this report is on how well we have been able to implement research-based best practices. We have, however, included as much data as we have been able to gather over the last five years, not as a summative measure of program effectiveness, but as a basis for dialogue and direction.
That dialogue has led us to the realization that there are two key shifts that have occurred as a result of our work on the Title III grant.
The first is the shift from a focus on the underprepared student to a focus on a prepared institution.
The second is the shift from a series of disconnected courses and support services to a programmatic approach to developmental education.
It has not always been easy to ask faculty to incorporate new activities such as computer-assisted instruction, counseling partnerships, teaching communities or assessment of student learning outcomes into their already established repertoires. Adding to that challenge is the well-known fact that innovation does not usually meet with immediate success – making it even more difficult for administrators to stand by in steadfast support. And yet, that shift is happening and will continue to happen as long as we keep up the dialogue, carefully consider multiple sources of data, and consistently move toward aligning our data, dialogue and decisions.
This report concludes with recommendations and action plans for each major component of developmental education. In most cases, the Teaching and Learning Advisory
3

Committee refers its conclusions and recommendations to other organizational units on campus: matriculation, tutoring, counseling, the English and math departments, etc. Because we are a decentralized program, we rely on college-wide communication and coordination to get the job done. And we rely on collegial dialogue, collaboration and mutual commitment to our goals to maintain our forward momentum. The necessary resources, both human and fiscal, are considerable. The costs of regressing to the status quo or relinquishing our resolve to the laws of entropy are even greater.
And so, once again, we find ourselves both ending and beginning. Or as T.S. Eliot wrote
To make an end is to make a beginning.The end is where we start from…We shall not cease from explorationAnd the end of all our exploringWill be to arrive where we startedAnd know the place for the first time.
Four Quartets
Just as we wish our students to study, explore and reconsider their current perspectives, we too must continuously engage the question of who we are as a college and what we want to be. One answer to that question is we want to be prepared to educate the students who come to us. We want to be able to deliver on the promise of a real education – one that meets them where they are and takes them where they want to go. “ LMC: You can get there from here”, our college brochure proclaims. Yes, they can, if we are prepared to help them along the way. And, as this report documents, Los Medanos College is better prepared in 2004 than it was in 1998 to meet the majority of our students who rely on our preparation to realize their goals.
Nancy Ybarra Director, Teaching & Learning Center
4
SECTION 1: PROGRAM OVERVIEW
I. Program History
In Spring 1998, a task force of the Academic Senate issued the Developmental Education Task Force Report. The task force was comprised of 17 members and included faculty, classified and management representation. We spent two years researching best practices, attending conferences and summer institutes, visiting other colleges, and discussing a vision for developmental education at Los Medanos College. The task force report articulated that vision and set forth a number of recommendations aligned with research in best practice and our values and history as a college. The report was endorsed by the Academic Senate and supported by the college administration. Subsequently, the college was awarded a Title III grant that provided funding for the implementation of our recommendations.
It has been five years since that report was issued, and we are now in the final year of that five-year Title III grant. One of the best practices that research validates as essential to a successful developmental education program is on-going, systematic program evaluation, comprised of a cycle of formative and summative assessments (Boylan, Bliss & Bonham, 1997; Roueche & Roueche, 1999).
Formative evaluation efforts are those activities that are designed specifically with the goal of program improvement in mind. Boylan (2002) states:
If formative evaluation is to result in program improvement, it must be
shared, reviewed, and analyzed by those people who can have the most impact on
developmental education. This includes the administrators, faculty and staff who
work with developmental education. These individuals should be the ones to plan
program revisions based on evaluation results. (p. 45)
Summative evaluation is “aimed at giving answers about the merits and shortcomings of a particular curriculum or a specific set of instructional materials” (as cited in Boylan, Bonham, White, & George, p. 371). Summative evaluation should not be implemented during the initial stages of a new curriculum or program. Programs need adequate time to
5

refine and revise (through formative evaluation) their methods and processes before evaluation is appropriate and valid. In fact, Boylan stresses that many innovative and promising programs are squelched in formative stages by pre-mature efforts at summative evaluation.
Because we are still in the process of establishing the developmental education program, this report is a formative evaluation of where we are now and what we need to do in order to improve the program. It is anticipated that there will be a summative evaluation of selected components of the program in the future, and that will be followed by future cycles of formative and summative evaluations.
II. Program Organization
Research/Best Practice
Organizational strategies for developmental education can make a difference in student success. Centralized programs, those characterized by developmental education departments, seem to correlate with greater student success than decentralized programs, those in which developmental instruction and support services are the responsibility of separate disciplines or offices (Boylan, Bliss, & Bonham, 1997). Boylan stresses that it is the high degree of coordination and communication typically found in centralized programs that is the key factor in success. He suggests that decentralized programs, which are most common in community colleges, can be equally successful if the program structure includes high levels of communication and coordination. Regular meetings of all faculty and staff involved in basic skills programs, including lead faculty in disciplines such as English and math along with counselors, tutors, reading and writing center staff, and administrators might accomplish this goal. Many community colleges do have basic skills committees or advisory committees. Membership on these committees should be wide-ranging, and the charge of the committee should include a mission statement, goals and objectives for basic skills, and clearly defined evaluation processes and criteria to measure program and student success.
In “The Organization of Developmental Education: In or Out of Academic Departments?” Delores Perin of Teachers College, Columbia University (2002) offers a detailed critique of the advantages and disadvantages of mainstreamed versus centralized developmental education program structures. She notes that mainstreamed programs (programs in which remedial or developmental courses are offered within academic departments) are more likely to have better alignment between remedial and college level course content and greater dialogue and communication between instructors who teach remedial and college level courses than centralized programs. Perin also suggests that decentralized programs tend to have less of a stigma in the eyes of students who may consider centralized programs as isolated and inferior in terms of social status.
Despite these advantages of decentralized programs, Perin points out that centralized programs may be superior in terms of teacher motivation and experience because these
6

instructors have chosen to devote their careers to developmental education. Also centralized programs may be more likely than mainstream programs to offer high quality support services such as tutoring and academic advising. Perin concludes her critique with a number of recommendations for incorporating the “best of both worlds,” whichever model a college adopts. She suggests that centralized programs may be most beneficial to students with the lowest level of skills, especially those with reading difficulties. On the other hand, students with higher-level skills, with perhaps only one area of academic difficulty, may thrive in mainstreamed programs where they get the help they need but still feel a part of the mainstream life of the college.
LMC Practice 1998
LMC had no developmental program, centralized or decentralized. We did have basic skills courses in English and math, and tutoring services were available in a number of departments, but there was no overall coordination of these component courses and services.
Recommendation of 1998 Task ForceEstablish a Teaching/Learning Center in a central location. The following services may be provided:
Writing and Reading Across the CurriculumTutor TrainingCoordination of Supplemental InstructionCoordination of Learning CommunitiesAdvising for Developmental StudentsScholarship Applications/Essay WritingStaff Development:
Computer Assisted InstructionIncorporating Learning Strategies into Content CoursesConsultancy on Designing and Evaluating Reading/Writing Assignments Grant Writing
New Faculty Orientation (NEXUS)Intersegmental projects with K-12 and 4-year colleges
LMC Current Practice (2003)
A Teaching/Learning Center was established in Fall 2000. Located in LRC 1, it includes a Reading/Writing Center staffed by professional consultants, a computer lab with Internet access and printing for any student to use, and study/meeting rooms equipped with VCRs for students to use for supplemental instruction, tutoring, workshops, or group study sessions.
Los Medanos College has a decentralized, yet highly coordinated model of developmental education. Coordination is provided by the Teaching and Learning Center Advisory Committee that has representatives from all aspects of the developmental
7

program including math, English, counseling, English as a Second Language, tutoring and the Reading and Writing Center in addition to representatives from general education, occupational education, the college administration and students. Chaired by the TLC Director with .50 reassigned time, this group is responsible for comprehensive and systematic evaluation of all aspects of the developmental education program, working in concert with the Office of Institutional Research.
III. Program Mission and Philosophy
Students who benefit from developmental education are learners whose difficulty lies not in their ability, but in their preparation. Developmental education includes, but is not limited to, basic skills courses. Since learning is a developmental process, developmental education is inclusive of all learners, but is particularly mindful of students who do not yet possess the prerequisite skills to successfully pursue a course of study leading to a certificate, degree or transfer. It is our belief that students deserve the best educational opportunities our college can offer to help them achieve their academic and career goals.
The mission of the developmental education program is to provide students with a coordinated curriculum and comprehensive support services that will engage, challenge and support them as learners.
Developmental education is a college wide commitment. As an essential part of teaching and learning, developmental education is comprehensive in its services, and an integrated part of the academic mainstream. A dynamic partnership between instruction and student services is needed to ensure that social and affective dimensions of learning are addressed as well as cognitive skills.
We are committed to the ideal of both access and quality. The developmental education program of Los Medanos College exists to help students achieve their goals and to promote academic integrity. We are committed to assessing student learning and achievement, as well as our own effectiveness as a program, and to using assessment data to improve both student learning and our curriculum and support services. In this way, faculty are supported in maintaining academic standards while students are supported in gaining the critical skills and abilities that will serve as the foundation of their success.
8

IV. Program Goals
1. Sustain an on-going evaluation (formative and summative) of the curricular component of the developmental education program: assess student learning outcomes in math, English and ESL sequences designed to lead students to college level coursework. Use information gained from the assessment process to improve teaching and learning, identify problems and challenges, and support innovation that addresses students’ needs.
2. Effectively integrate instruction and academic support services: tutoring, labs, supplemental instruction, Reading and Writing Center, counseling services, assessment, and learning communities. Make recommendations based on systematic assessment of these services, and periodically report to the college community on their effectiveness.
3. Working with the Office of Institutional Research, implement a comprehensive and on-going research plan to monitor student success, persistence and performance in progressively higher level courses within English, math, and ESL sequences leading to transfer level courses. In addition, research should provide information on students’ achievement of their academic/career goal.
4. Provide curriculum-based professional development that supports teachers in creating, sustaining, and assessing learning experiences that are directly linked to explicitly stated student learning outcomes. Provide evidence that students who successfully complete developmental education courses can demonstrate proficiency relative to those learning outcomes.
9
SECTION 2: PROGRAM COMPONENTS
I. Assessment and Placement
Research/Best Practice
There is clearly a consensus in the field of developmental education that mandatory assessment and placement are key components of successful programs (Boylan, 2002; McCabe, 2000; Roueche & Roueche, 1999.) While a majority of community collegesrequire assessment for incoming students unless they meet specific criteria for exemption, mandatory placement is more likely to occur in four-year colleges and universities than in community colleges (Roueche & Roueche, 1999, p. 24). Boylan (2002) in What Works explores a number of reasons why mandatory placement has not been instituted in more community colleges. He concludes that the most valid argument against mandatory placement is that developmental courses are not effective. Agreeing with Norton Grubb that too many developmental courses are “dull, poorly taught, and emphasize low level drill and practice” (Boylan, 2002, p. 36), Boylan recommends that institutions evaluate their developmental courses before instituting mandatory placement to ensure that the quality of instruction is high, and that the methods and techniques used are found to be effective.
LMC Practice 1998
New students were informed of the matriculation process including assessment, orientation, and advisement. Students could be exempted from the matriculation process, but the criteria for exemption were not in line with Title 5 regulations. The assessment instrument in use, the APS, was about to be removed from the approved list of acceptable placement tests by the Chancellor’s Office.
Recommendations of 1998 Task Force
1. Review the current matriculation procedures to ensure that all students are systematically informed of assessment, orientation and advising requirements upon application to the college; exemption policies should be reviewed for consistency with Title 5 regulations. In addition, the college’s use of multiple measures in the assessment process should be examined.
2. The math and English departments select and pilot a new assessment instrument which best places students within basic skills classes.
10

LMC Current Practice (2003)
The matriculation committee has reviewed all matriculation policies and procedures. These are clearly stated in the college catalog. The exemption policy has been revised to comply with Title 5 regulations. Students may be exempted from matriculation processes of assessment, orientation and advising if they a) already have an Associate Degree or higher or b) enroll in fewer than 6 units and state that they are not pursuing a long-term educational objective.
Students are also informed of their right to waive matriculation services and this is listed as an option on the matriculation exemption request form. However, students are not required at this time to fill out the exemption/waiver form.
A new assessment instrument, Accuplacer, was adopted in 1999 for both English and math placement. This is a computerized placement test published by the College Board and accepted by our state Chancellor’s Office as valid for community college students. It uses an adaptive testing mode that presents different questions to different students depending on their responses to test items. This allows for quicker and more accurate testing. Background questions allow for the embedding of multiple measures, although the advent of on-line test administration in 2002 has made this problematic due to technical difficulties. The College Board is still working to resolve this issue.
In 2002, the LOEP (Levels of English Proficiency) was introduced for placement of non-native speakers of English in English and/or ESL courses. LOEP is part of the Accuplacer package, and students can be “branched” into the LOEP test depending on their responses to background questions and test item responses.
Cut score validation studies were completed for English courses in Fall 2000. (“Cut score” refers to the range of scores needed for placement in different level courses.) Cut score validation studies for developmental math courses were completed in Fall 2003. Cut score studies are currently being conducted on the LOEP.
What percentage of LMC students take the assessment test when they enter the college?
The Office of Institutional Research responded to that question with the following data:
First Time Freshmen with Long Term Educational Goal: Fall 2001There were 626 first-time freshmen with long–term objectives in Fall 2001. (The majority of students are “undecided” or “unreported,” and this data does not reflect whether or not those students were assessed.)
Of the 626 students, 62% were assessed. 31% did not participate
7% were exempt.
11
Of the students who were assessed, 54% enrolled in English and 57% enrolled in Math in Fall 2001.
This data suggests that a majority of first time students with long-term educational goals do participate in the assessment process, although a substantial number do not. A relatively small number of these students are granted exemptions. Students who are seeking exemptions are asked to fill out a form stating the reason for their exemption. For the general student population, LMC matriculation data indicates that approximately 13% of the 261 students who filled out the exemption request form from July 1, 2002 and June 30, 2003 were exempted. The majority of students were requesting a waiver because they had previously completed orientation and assessment.
Overall Student Population: Fall 2001
There were 1,566 students who were assessed in a six-month period prior to Fall 2001. Of those, 94% enrolled at LMC in Fall 2001. Of the 1,566 students assessed, 727 (46%) enrolled in an English course and 726 (46%) enrolled in a math course.
Of the 726 who enrolled in a math course, 309 or 43% enrolled in the recommended course.
Of the 727 who enrolled in an English course, 582 or 80% enrolled in the recommended course. (Note that English has prerequisites for English 90 and 10S.)
II. Developmental Courses
Research/Best Practice
The following practices are cited from1. What Works by Dr. Boylan. This monograph reports on a 1999 national
benchmarking study that was a collaboration of the National Center for Developmental Education, the Continuous Quality Improvement Network, and the American Productivity and Quality Center
2. NADE (National Association of Developmental Education) Self Evaluation Guides
A set of common goals exists for all developmental courses in the same discipline.
Measurable objectives exist for each course, and material is carefully sequenced
12

There is a clear sequence and linkage of developmental courses with college level courses. (Exit criteria for developmental courses are clearly aligned with entry requirements for college level courses.)
Critical thinking, learning strategies and active learning are hallmarks of all developmental courses.
Classroom assessment techniques are a regular part of developmental courses.
Formative evaluation is used to improve courses. Professional development is consistently provided for instructors of
developmental courses. Adjunct faculty are treated as a valued resource, but teach no more than
50% of developmental course offerings.
LMC Practice 1998
LMC offered pre-collegiate basic skills (non-degree applicable) and developmental courses (degree applicable, but not transferable) in English and math.
The English department had just begun to offer integrated reading and writing courses, English 70 and 90, instead of stand-alone course in reading and composition. The department made this change based on research that indicated that despite documented reading problems among students in developmental courses, and their own self-report that poor reading comprehension was their number one academic concern, students were not enrolling in the stand alone reading courses. In addition, integrated reading and writing approaches were receiving increased professional support as a more effective approach to academic literacy.
The math department did not engage the question of a developmental program in mathematics until January 2000, about three years later than the English department. In 1998, its approach to basic skills courses was still largely defined by self-paced instruction, although alternatives to self-paced were available for Elementary Algebra.
Recommendations of 1998 Task Force
Designate coordinators for basic skills classes in English and math with reassigned time to ensure the quality of those courses.
Track student progress in both math and English basic skills courses. English and math faculty include evaluation and critique of their basic skills
programs within their unit review and planning processes.
13

LMC Current Practice (2003)
Faculty Coordinators
Through a combination of Title III grant funding and institutional funds, both the English and math departments have had faculty coordinators with reassigned time for their developmental programs since 2000. These coordinators have worked with full andpart-time faculty to:
1. develop program and course level student learning outcomes2. align learning outcomes in a developmental sequence3. design learning experiences that provide students with the opportunity to achieve
the learning outcomes4. design classroom assessment techniques/rubrics 5. plan for course level assessment6. assess and improve support services such as tutoring, and Reading/Writing Center
consultation services7. provide professional development experiences for faculty teaching developmental
courses
Tracking Student Progress in Developmental Courses
In response to the recommendation that we track student progress through developmental course sequences, we worked with the Office of Institutional Research to write an on-going research agenda that would systematically provide us with information on student achievement. In addition, we continue to collect data on assessment/placement. The resulting data can be found in Appendix A of this report.
The vast majority of our students need developmental coursework before they are prepared for transfer level courses. Data from our placement testing is relatively consistent from year to year. Approximately 27% of students assess at the transfer level in English and less than 15% assess into transfer level math courses.
Students enrolled in English developmental courses at LMC succeed in those courses at higher rates than the state average since the adoption of our integrated reading and writing curriculum. (It should be noted that a number of interventions were instituted at the same time as the new curriculum, and we do not know which variables contributed most to rising success rates.) In addition, persistence and success rates in the next higher-level course in the developmental English sequence are steadily rising. The English department continues to explore ways to help students be more successful in reaching and succeeding in transfer level courses. At the same time, efforts to directly assess student work on a programmatic level are underway to ensure that those success rates reflect students’ abilities to demonstrate proficiency on the student learning outcomes that were carefully defined by English faculty.
14

Students enrolled in Elementary Algebra at LMC succeed at higher rates than the state average with the exception of self-paced sections, which are being phased out. The math department has worked intensively on direct assessment of student learning outcomes in Elementary Algebra and has developed extensive curricular materials and assessments to document student learning. (See below discussion on the Math 25 Teaching Community.)
Students enrolled in pre-collegiate basic skills math courses at LMC succeed in those courses at lower rates than the state average; however, more recent alternatives to self-paced instruction, the primary mode of instruction for those courses, are showing some promise. The department is currently considering expanding alternatives to self-paced basic skills math courses.
Evaluation and Critique of Developmental Courses in Unit Planning/Program Review
In Fall 2003, the English and math departments completed unit planning and program review. Both departments dedicated significant portions of these documents to the on-going work of instituting and maintaining a comprehensive developmental education program that embodies research based best practices.
Both English and math seek institutional support for faculty leads that will provide the necessary leadership and coordination for continued implementation and evaluation of these practices. In addition, both departments want to continue teaching communities that support faculty in assessing student learning, using results to inform discussion about curriculum and instructional strategies.
Other Initiatives Related to Developmental Courses
In addition to addressing the recommendations of the 1998 Task Force, a number of other initiatives were undertaken by both the math and English departments to improve our developmental program. We conceptualized a “program,” as opposed to just a series of courses, as consisting of the following components, which we represent visually as a tree. The tree is rooted in valid and reliable assessment and placement practices, the trunk consists of goals or desired learning outcomes, and the three main branches of the tree are curriculum, student support and faculty development. The following sections of this report describe the work we have done to nurture the growth and development of this “tree”. As assessment and placement practices have already been addressed, the following begins with the “tree trunk,” the effort to develop and assess student-learning outcomes for developmental courses in math and English.
15
Development of Student Learning Outcomes
Beginning in 2000 – 2001, both departments worked on the development of student learning outcomes for several years. The English department worked first on course-level outcomes for English 70, 90 and 10S, arriving at program level outcomes in Fall 2003. The math department worked first on program level outcomes, and then wrote aligned course level outcomes for Math 4, 9, 12, and 25.
The program level outcomes for the English developmental program are:
As readers, students will Read independently for a variety of purposes in college-level materials Engage in reading using a critical thinking, problem-solving approach Respond fluently to text in critical, creative and personal ways Continue reading as a way of understanding self and others Research and evaluate written works Choose reading as a means for life-long learning
As writers, students will Use writing as a tool for learning, communicating, and thinking critically Engage in writing as a recursive process Research, evaluate, and integrate the ideas of others into their own work
As learners, students will Observe, monitor and evaluate strengths and weaknesses, and use feedback to
improve learning. Use college resources to expand learning effectiveness, e.g. Reading & Writing
Center, counseling, tutoring
The program level outcomes for the math developmental program are:
1. The student will read, write, listen to, and speak mathematics with understanding.
2. The student will use mathematical reasoning to solve problems and a generalized problem solving process to work word problems.
3. The student will demonstrate the ability to use verbal, graphical, numerical, and symbolic representations of mathematical ideas.
4. The student will demonstrate the characteristics of an effective learner.
5. The student will recognize and apply math concepts in a variety of relevant settings and demonstrate the math skills and knowledge necessary to succeed in subsequent courses.
16

Direct Assessment of Student Learning Outcomes
The research plan developed in concert with the Office of Institutional Research provides us with indirect measures of student success: course success rates, persistence rates, comparative success rates, performance in next level courses, etc. While these are important measures of student achievement, they do not give us specific feedback about what our students are learning, and what we can do to improve their performance relative to our course and program level student learning outcomes. For this purpose, we have piloted teaching communities that focus on how to assess student achievement of course level learning outcomes, and how to use the result of that assessment to make informed decisions about our curriculum and instructional strategies.
Math 25 Teaching Community: Spring 2003 and Fall 2003
Eight instructors participated in the Math 25 teaching community in Spring 2003 and eight participated in Fall 2003, with six participating in both semesters. Part-time instructors made up 50% of the spring group and 63% of the fall group. Under the facilitation of a DE lead, instructors met twice weekly to align course goals with broader program learning outcomes, develop common exams and grading rubrics, write curriculum, and discuss instructional strategies. During the semester, they assessed samples of student work to clarify grading criteria, norm standards, and revise instructional methods and curriculum based on the results. At the end of both semesters, math faculty holistically assessed a random sample of student work on a common final exam. In the spring the sample was drawn from 6 of 11 sections of Elementary Algebra and the assessment focused on two of five program outcomes. In the fall the sample represented 9 of 11 sections and an assessment was made of student achievement relative to all five program outcomes. The participants analyzed the results and formed action plans for improvement. Assessment results and action plans were then discussed during flex activities for Elementary Algebra instructors the next semester. See Appendix C for summaries of these assessments and the respective action plans.
English 90 Teaching Community: Fall 2003
Nine instructors, full and part-time, participated in an English 90 teaching community in Fall 2003. They met for two-hour blocks, approximately every three weeks, and discussed instructional strategies, particularly for the integration of reading and writing instruction. They also designed parameters for a final writing assignment that would be holistically scored at the end of the semester. A rubric was developed for scoring the writing assignment that required students to synthesize course readings in response to a particular topic. Instructors agreed to provide a copy of students’ upgraded essays with the students’ names removed. Thus, the instructor would grade papers as usual, and from the student perspective the holistic scoring would not affect their course grade. The purpose of the assessment was to provide the English department with feedback on how well students in English 90 were achieving course level outcomes.
17

Six of the nine instructors provided student essays to be scored for the final holistic assessment. One of the six provided first drafts rather than final drafts of the students’ work. Given this sample, approximately half of the student essays were assessed as “passing” and half were “not passing”.
The papers assessed as “not passing” were then read again in an English department meeting as a flex activity, and we discussed why these student papers did not reflect competency relative to our defined learning outcomes. Furthermore, we explored the implications for our curriculum and instructional approaches. We realized that the final assignments called for greater levels of sophistication than the outcomes called for, and that we needed to put greater instructional emphasis on logic and clarity both at the sentence level and on the macro level for the essay as a whole.
Action: The English 90 coordinator will work with English 90 instructors on designing assignments in alignment with the learning outcomes, and will encourage greater instructional emphasis on logic and clarity at the sentence and essay level. We plan to repeat this assessment at the end of the Spring 2004 semester.
A teaching community for English 10S with a focus on assessment is also planned for Spring 2004.
Branch #1: Curriculum Development
English
In addition to the integration of reading and writing for all developmental courses that occurred in 1998, and the development of course level outcomes for English 70, 90 and 10S; the other major curriculum change was the addition of a two semester “bridge” from ESL courses to English 70. These bridge courses, English 62 and 63 were first offered in Fall 2001. One of our full time instructors has completed a TESOL certificate, and is currently teaching these courses. Five additional instructors have begun taking classes toward completing a TESOL certificate. Research is planned to evaluate the effectiveness of these courses, but is not yet available.
In addition, English 64 was developed and offered for the first time in Fall 2001. This course is designed for native speakers of English who assess below the English 70 level on the Accuplacer placement test. Research on the effectiveness of this course is also pending.
18

Math
Curriculum development has been a primary focus for the math developmental education program. At the basic skills level, alternatives to self-paced instruction have been developed and offered. Math 4, an alternative to Math 1, focuses on integrating study skills into the math curriculum in a one-semester lecture format. Math 7 is a computer-assisted alternative to Math 1 and 2. Students earn units in .5 increments and we are currently researching how many students actually complete the equivalent of 3 units. Math 12 is a pre-algebra course first offered in 2001; the mode of instruction is lecture with the incorporation of computer-assisted instruction. Math 9, a one-semester lecture course that also includes computer-assisted instruction, is the most recent alternative to the self-paced Math 1 and 2 courses.
Math 25, Elementary Algebra, was revised in Fall 2003 to align with the developmental math program learning outcomes. Other changes included a 1unit increase to 5 units, and approval of a prerequisite that requires students to demonstrate that they have pre-algebra skills. These changes were carefully considered in the light of available data. A random sample of CA community colleges verified similar practices in a significant portion of those sampled. In addition, data from the Office of Institutional Research suggested significant differences between the success rates of underprepared students and those who could demonstrate requisite pre-algebra skills.
Branch #2: Student Support
Students enrolled in developmental English and math courses receive support in the form of tutoring, counseling and computer- assisted instruction. Tutoring and counseling will be addressed in subsequent sections of this report; therefore, the following information focuses on computer-assisted instruction in developmental courses.
The new English Computer Classroom opened in Fall 2003. All developmental courses have at least one hour of instructional time scheduled in the computer classroom. It was designed to supplement regular, face-to-face classroom instruction. To this end, we purchased special tables where the monitors sit at an angle just below a tempered glass top. Instructors and students can clearly see each other without a bulky monitor in the way; the computers do not dominate the classroom, but can be incorporated naturally whenever needed.
All 30 computers have Internet connection, Microsoft Word, and NetTeacher (a program that allows the teacher to see all students’ work, show students’ work, and many other functions). Some instructors will use the classroom to augment course readings, having students research for background knowledge about a subject. Others will use the
19

classroom to connect to textbook web sites for grammar exercises. And some will simply use the computer classroom for easy access to word processing.
The new math computer lab/classroom opened in Fall 2002. The first year it operated primarily as a lab with software from Academic.com available for student use. Students were surveyed on their feedback about the computer lab between January 3 and May 19 of 2003.
The following is a summary of the responses of 264 students surveyed:
A little more than half of the students surveyed had used Academic.com software in the CML. About a quarter of the students reported using Excel.
The vast majority did not report any major difficulty with the functioning of the computers or the software.
95% reported that their time in the CML was helpful.
88% reported that they planned to return to the CML; 10% thought they might.
In Fall 2003 fourteen math instructors used computer-aided instruction (CAI), with 12 instructors scheduling approximately one-fourth of instructional hours for a class in the Computer Math Lab (CML). Three Pre-algebra instructors and the 9 instructors in the Elementary Algebra Teaching Community piloted an extensive experiment in CAI. The CML was plagued with technical problems for the first 7 weeks of the semester, which had an adverse impact on the experience of some instructors and some students. Despite these difficulties, student feedback about CAI at the end of the semester was positive. Of the 99 Elementary Algebra students who submitted feedback, 58% rated computer-aided instruction as important or very important to their learning; 85% rated mastery-based learning connected to CAI as important or very important to their learning. Seven of the nine instructors in the Teaching Community felt that CAI allowed them more class time to focus on higher level learning outcomes. A common theme in the feedback from these instructors was the need in future semesters for better integration of the CAI component, which focused on procedural skills, and the more conceptual and application-oriented work done in class. Two instructors of 9 in the Teaching Community made CAI optional after initial technical difficulties in the CML. Eleven of the 14 instructors using CAI in Fall 2003 are continuing with CAI in Spring 2004.
In addition to the computer math classroom/lab, the math department offers drop-in tutoring to all math students in the general math lab. In Spring 2002, students were surveyed on their satisfaction with the tutoring they received in this lab. Over 300 students responded to the survey. The results tabulated below indicate a high degree of student satisfaction with the help they received in the math lab.
20
Yes Somewhat NoHave you received assistance this semester from lab tutors/instructors? 72% — 28%Do you feel that you received personalized help in the math lab from tutors/instructors? 69% 22% 8%
Do you feel that the tutors/instructors in the math lab understand the math in your class well enough to effectively assist you? 75% 20% 5%
Are tutors/instructors familiar enough with how your class is taught to effectively assist you? 58% 32% 10%
Do you feel that the help you receive in the math lab enables you to work better on your own? 67% 23% 10%
Do tutors/instructors in the lab help you learn how to learn? 46% 40% 14%Has the math lab helped you to feel better about math? 50% 38% 12%Do you feel that LMC's math lab is useful to students? 87% 12% 1%Do you feel that the tutors/instructors in the math lab are useful to students? 92% 7% 1%
Branch #3: Faculty Development
In What Works (2002), Boylan cites several studies that highlight the impact of professional development and training on student success. He concludes, “No matter what component of developmental education was being studied, an emphasis on training and professional development improved its outcomes” (p.46). The evidence is clear. Successful developmental education programs make staff development a priority, and make sure that adjunct faculty participate in professional development activities. Boylan recommends ongoing, long-term programs over “one-shot” approaches and a combination of discipline-specific and overall instructional/learning strategy topics.
Nowhere is professional development more imperative than in the design and delivery of basic skills education. Norton Grubb, author of Honored But Invisible: An Inside Look at Teaching in Community Colleges (1999), is critical of the “skills and drills” approach that historically has dominated remedial coursework. He refers to this as a behaviorist approach, and agreeing with the philosophy espoused by Bartholomae and Petrosky, states that “implicitly instructors in this tradition assume that literacy and numeracy are individual skills, following a set of formulaic rules, rather than forms of social communication and practices where individuals must have a deeper understanding of the purposes or reading, writing and mathematics in different settings” (Grubb, p. 3). The latter he refers to as constructivist approaches that are student-centered and meaning-centered. In the absence of structured opportunities to engage in dialogue about good teaching practices and to construct coherent philosophies of teaching that emphasize meaning-making, individual instructors are more likely to turn to conventional approaches with which they are most familiar. He states
Thus the very absence of discussions about pedagogy within a college and
the absence of any institutional mechanisms to prepare developmental instructors
21

(especially part-timers) are indications that instruction has veered in the direction
of skills and drills. Instead, community colleges that want to improve the quality
of their developmental programs need to have explicit discussions about
pedagogy, explicit agreements and mechanisms to move those agreements into
practice. (p.4)
Heeding this advice, we have emphasized faculty development in the formation and on-going implementation of our developmental program in English and math. We are particularly aware that we must provide professional development for our adjunct faculty as they teach, on average, 74% of our courses in our English developmental sequence (including English 10S), and approximately 50% of our developmental math courses.
English faculty, full and part time, have been involved in the following faculty development activities:
Kellogg Institute for Developmental EducatorsThree English faculty were trained and certified as Developmental Educators in 1997. This institute is an intensive month-long residency program offered at Appalachian State University, site of the National Center for Developmental Education.
Seminar Series in 1999-2000: Theoretical Perspectives on Reading/WritingAll full- time and many part-time faculty participated in four 2-hour seminars to discuss 10 professional articles that offered different perspectives on theoretical models for teaching reading and writing.
Flex Workshop by Alverno College faculty on outcomes-based assessmentMost full-time and several part-time faculty participated in a day long flex workshop in January 2002 with faculty consultants from Alverno college, nationally recognized for their pioneering work in student learning outcomes.
Course Specific Curriculum Development and Determination of Learning Outcomes/Assessments (Team 70, 90 and 10)
Most full-time, and several part-time faculty participated in these curricular development teams that met bi-monthly for two years to develop course level learning outcomes, curriculum that addressed those outcomes, and assignments/rubrics to assess student achievement of those outcomes.
22

English 90 Teaching Community In Fall 2003, nine instructors participated in this teaching community that focused on how to assess student work relative to our learning outcomes for English 90.
TESOL certification for English faculty (a 2-year collaboration with Cal State Hayward to certify English faculty to teach ESL students.) Seven instructors enrolled in TESOL classes at Cal State Hayward in courses that were offered specifically for LMC instructors.
Two English faculty received the Postsecondary Reading Certificate at San Francisco State. (12 unit program)
Five English faculty attended an intensive week long national training institute in Summer 2003 in Academic Literacy: A Reading Apprenticeship Model. This is a program designed to teach faculty across the curriculum effective strategies for improving reading comprehension and academic performance.
Math faculty, full and part time, have been involved in the following faculty development activities:
Kellogg Institute for Developmental Educators
Two math faculty were trained and certified as Developmental Educators in 2002. This institute is an intensive month-long residency program offered at Appalachian State University, site of the National Center for Developmental Education.
Course Specific Curriculum Development and Determination of Learning Outcomes/Assessments
83% of full-time faculty participated in weekly course-specific focus sessions for two years
Training in assessment
67% of full-time math faculty participated in a 10 one-hour workshops on assessing student learning outcomes, including an introduction to program assessment using AAHE Assessment materials, rubric-writing, and classroom assessment techniques
Individual projects based on learning outcomes with assessment components
Training in the use of technology
Training for Academic.com (14 instructors, 8 full-time)
23

Flex activities on software: Excel, Geometer’s Sketchpad, Math Pro5
Multiple sessions on PHIM-2 (11 instructors, 6 full-time)
Individualized support for instructors developing CAI materials
Math 25 Teaching Community (Spring and Fall 2003)Two hours a week for eight instructors each semester with at least 50% part-time participants
III. Counseling Interventions in Developmental Courses
Research/Best Practice
In What Works: Research-Based Practices in Developmental Education, Hunter Boylan emphasizes the need to integrate academic and student services for students in developmental education. He states, “It is essential that all courses and support services connected with developmental education be viewed as a system rather than as random activities.” (p.28)
Martha Maxwell in “ The Role of Counseling in a Comprehensive Developmental Program for Post-Secondary Students”(1997) argues that “ counseling should be an integral part of a successful developmental education program” (p.1). She contends that students often need help to overcome “affective blocks” based on prior negative experiences in school and to plan effectively for their future. Maxwell recommends that counselors be “an integral part of the developmental program team” and work to “ reduce the perceived formality and distance of counseling by making it more accessible to students.” (p.2)
LMC Practice 1998
Except for special programs such as DSPS, EOPS and AVANCE, students enrolled in basic skills courses were not specifically targeted for counseling interventions.
Recommendations of 1998 Task Force
Counselors review the literature on counseling in developmental programs, consult with experts in this field, and arrive at their own recommendations for this critical component of the developmental education program at LMC.
24

LMC Current Practice (2003)
In Fall 2000, we formed a partnership between counselors and instructors who teach English 70, a developmental English course two levels below English 1A. Counselors met periodically with groups of students during the English class time, made some classroom presentations, and helped students develop educational plans for the following semester. Our goal was to help students become “consumers” of counseling services and to encourage enrollment in the next level English course the following semester.
Based on student, faculty and counseling evaluations of the pilot we have made changes to the original pilot design. Counselors now make two presentations in the English course, one near the beginning of the semester, and one near the end. Students complete mid-semester self-evaluations that are used by faculty to make individual referrals to counseling as well as to give students feedback on how they are doing mid-semester and a tentative recommendation for the following semester. All students in the course are required to see a counselor outside of class for at least one individual counseling session for educational planning.
In Fall 2003, a newly hired full time counselor was assigned the coordination of the counseling partnership. In addition to English 70, all sections of Math 12, a pre-algebra course, are now participating in the counseling partnership.
Evidence of Success
We compared persistence rates from English 70 to English 90 for students who succeeded in English 70 in Fall 1999 and Fall 2001. In Fall 1999 (no counseling intervention) 44% of those who successfully completed English 70 went on to enroll in English 90. In Fall 2001 (counseling intervention), 64% of those who succeeded in English 70 went on to enroll in English 90.
Student Evaluation of Counseling Partnership (Spring 2003)
At the end of each semester, students fill out an evaluation of the counseling partnership. The evaluation is based on the stated goals:
1. Students will have an educational goal, including a major, or at least an understanding of the eventual need to declare a major.
2. Student will identify possible obstacles to successful completion of their courses, and will be able to access resources to help them overcome these obstacles
25

3. Faculty will advise students of next level course recommended by week.
4. Students will have an educational plan prior to registration period for the following semester.
In Spring 2003, 76 students completed the final evaluation. Of these respondents, 95% reported that they had an education goal, but only 68% reported having an educational plan. In addition, 90% said that their English instructor had advised them about the next level course they should take in English.
IV. Reading and Writing Center
Research/Best Practice
The National Writing Centers Association (Simpson, 1985) offers the following basic guidelines for operating a writing center.
1. Because writing is a skill used in all subjects and at all levels of the educational process, a writing center should be considered a support service for the entire institution rather than simply for a single department. Although the budget and staff of a writing center may come from a single department, the mission of the center and its constituencies should encompass the entire institution.
2. Regardless of its organization and design, a writing center should be based on the idea of individualized instruction. Therefore, materials and methods chosen for writing centers should be adjusted to individual needs.
3. Access to the writing center should not be limited by a student's level of preparation or physical capabilities.
4. The writing center should have instructional goals that are clearly understood by tutors and students.
5. Writing center records should provide for continuity of instruction regardless of how its staff is organized.
26

6. A writing center should have clearly stated, consistent, and ethical principles to guide its tutors. The National Writing Centers Association suggests the following:
o Tutors should be provided clear explanations of writing center procedures. o Tutors should neither directly nor indirectly offer criticism of a teacher's
assignments, methods, or grading practices. o Tutors should be given guidelines for defining acceptable and
unacceptable intervention in a student's writing process.
LMC Practice 1998
There was no Reading and Writing Center at LMC in 1998. Students enrolled in English courses could receive peer tutoring in the English lab.
Recommendations of 1998 Task Force
A Writing/Reading Center be established for students who are taking courses across the curriculum and who need assistance with writing and reading assignments.
The Writing/Reading Center be staffed by a Coordinator, faculty consultants with expertise in reading and writing who work with referred students, and trained tutors who work under the supervision of the faculty consultants and Coordinator. Clerical support would also be needed.
CRLA certification be sought for the tutor-training component of this center. The Coordinator should conduct on-going evaluation of the center.
The Writing/Reading Center offer workshops throughout the semester designed to help students with specific courses, e.g. writing a research paper, writing a science report, writing a business report, etc. with faculty brought in from different departments to participate in these workshops.
LMC Current Practice (2003)
The Reading and Writing Center opened in Spring 2000, providing quality reading and writing support to all students, staff and faculty. Staffed primarily by faculty consultants and graduate students, its mission is to work collaboratively with students and faculty as they work through the reading and writing process, providing strategies, feedback and motivation. In order to accomplish its mission, the Reading and Writing Center strives to provide a learning environment that creates a supportive and enjoyable learning climate that fosters critical thinking, freedom of expression and effective communication.
27

In its efforts to be self-supporting as much as possible, the Center initiated the capturing of positive attendance in Fall 2002. According to the LMC Business Office, the Reading and Writing Center generated 31.83 non-credit FTES for 2002 –2003 for which it has requested $ 17,507 from the district office as its share of the apportionment the district received from the state. (The district receives $ 2,145 per non-credit FTES for which it reimburses the college $550.)
CRLA certification was not sought for the Reading and Writing Center because it is staffed primarily by professional consultants rather than peer tutors. (The English department did receive CRLA certification for its peer-tutoring program.)
In addition to English faculty and graduate students, we employ faculty from different disciplines as writing consultants so that not only can we better support all of our students, but also that we can initiate various faculty members into the realities and possibilities of working with students on their reading and writing issues.
The consultants meet monthly for professional development training and to be updated on current assignments that they are likely to encounter while working in the Reading and Writing Center. Faculty across the curriculum are invited to present their current assignments to the consultants, and collaborate on ways to emphasize key points and expectations for student work.
In addition to presentations and participation as writing consultants, we also offer in-service work for individual faculty about reading and writing issues in their classroom, such as the first day handout, the research paper assignment and grading rubrics. We have put on all day retreats for the members of various disciplines such as Humanistic Studies 2LS and 3LS to work on their research paper and rubric. We also visit 4 to 8 classrooms each semester to present an introduction to the MLA/APA style sheet. Finally, to encourage reading across the curriculum, the Center sponsors a monthly Los Medanos Book Club that has 22 faculty members from across the curriculum and is now encouraging student participation.
The Reading and Writing Center provides workshops for students on selected topics such as documenting sources (MLA and APA), using Blackboard for on-line course components, correcting common grammatical errors, and writing scholarship and transfer application essays.
How many students use the Reading and Writing Center?
In Spring 2000, 330 students made appointments to see a consultant in the Reading and Writing Center. In Spring 2003, that number rose to 800 students.
In addition to seeing consultants, large numbers of students use the computer lab in the Reading and Writing Center, which is equipped with Internet access and printing services. It is the only computer lab on campus that is open to all students, i.e. they do not
28

have to be enrolled in a particular course to use the lab. In Spring 2000, 3,419 “contacts” were recorded for the Computer lab. In Spring 2003, that number had risen to 12,036. (“Contacts” represent the number of times a student signs in to use the computer lab.)
Who uses the Reading and Writing Center?
Students enrolled in English courses constitute the majority of students using the Center. On average, 37% of the students seeking consultations are enrolled in English 10 and 25% are in English 90. The Reading & Writing Center also sees 32% of its contacts from across the curriculum in the following disciplines—History and Political Science (2%), Humanistic Studies (10%), Sciences (2%), Anthropology (3%), Art (4%), Business (2%), Child Development (1%) and Miscellaneous (7%).
Does the Reading and Writing Center help students succeed in their courses?
In Spring 2002 the Office of Institutional Research conducted a small study that compared the success and retention rates of English 10 students who went to the Reading and Writing Center with those who did not. The study found that those who worked with consultants in the Center three or more times during the semester had a success rate in English 10 of .76 compared to a success rate of .58 for those who never used the Center. Retention rates for those who used the Center were .88 compared to .74 for those who did not.
Are students satisfied with the services they receive in the Reading and Writing Center?
In Spring of 2003, we conducted our first Student Satisfaction Survey. Of the 171 responses, the overwhelming majority were “very satisfied” with the helpfulness of the consultants, the availability of appointments, and the work of the writing consultants.
V. Tutoring
Research/Best Practice
Research indicates that tutoring with tutor training is an important factor in the success of students in developmental education programs. The National Study of Developmental Education carried out with an Exxon Education Foundation from 1989 through 1996 followed over 6000 developmental education students nationwide in both 4-year and 2-year colleges. From that large study, a number of reports were issued on various components of developmental education programs and their impact on student success. Martha Maxwell, in Evaluating Peer Tutoring (1999), cites one such report issued in 1992 that found that “tutor training is the best programmatic indicator of successful
29

college developmental programs. Institutions that graduate more than 75% of their developmental students are more likely to have tutor training programs than those with low graduation rates where fewer than 25% graduate” (p.6).
LMC Practice 1998
LMC has a long history of providing tutoring services. While tutoring had been offered in some form since its inception, Los Medanos formalized its tutoring program in 1986 with a position paper that created an Advisory Committee for Tutoring (ACT), chaired by a college-wide Tutor Coordinator. In addition to the Tutor Coordinator, faculty received load for serving as “designees” from departments across the curriculum. A full time classified position was allocated to the program. Tutor training was highly structured, with all new tutors required to attend both pre-semester and weekly tutor training sessions for one semester. In addition, second and third semester tutors were required to receive training and engage in on going projects to refine their tutoring skills. In 1993, this centralized system was dismantled as many faculty and tutors expressed dissatisfaction with the demands placed on tutors’ time and the relevance of the tutor-training curriculum, particularly in math and science.
By 1996, all that remained of that centralized system was the budget. Because there were concerns about the fairness and equity of the distribution of tutoring funds, a new position paper was passed that once again established a college wide tutoring committee. However, this time the primary charge of the committee was the equitable distribution of tutoring funds. There was no provision for a tutor coordinator position, nor were there any criteria established for assessing the effectiveness of tutor training or tutoring services.
By 1998, tutoring was completely decentralized. Departments were responsible for tutor training and evaluation, but no release time was provided for a coordinator. The position was rotated among faculty in departments. In English, the new 70 and 90 curriculum included in-class tutors as part of the course structure, moving away from the “hours by arrangement” lab system. The English lab continued to provide drop-in tutoring for students in all English courses. In math, self-paced courses had peer tutors within the class and the math lab provided tutoring for students in all math courses.
Recommendations of 1998 Task Force
The English and math departments train tutors who work in the classroom. This type of tutor training would best include a thorough understanding of the curriculum in the basic skills classes, the strategies used to help students access
30

that curriculum, and also training in the unique needs of developmental students- their characteristics, needs and common obstacles.
Tutor training for basic skills classes be reviewed periodically and tutors evaluated each semester using criteria designed by each department.
Departmental tutoring be one of three options for courses across the curriculum. (The other two options would be a Writing/Reading Center Across the Curriculum and Supplemental Instruction.) For departments that choose to have their own tutoring programs, it is crucial that comprehensive tutor training and on-going evaluation be the responsibility of the department. The CRLA and NADE guidelines are recommended for this purpose.)
LMC Current Practice (2003)
Tutoring at Los Medanos College currently follows a decentralized model. Different college departments employ tutors to help students in developmental, general education and occupational courses. Each department determines how tutors are to be recruited, trained, utilized, and evaluated. In addition, DSPS and EOPS provide tutoring to students who are eligible for their services. Providing support and direction to these departments and also determining the allocation of tutoring money is the College Tutoring Committee, comprised of faculty and classified staff from various departments connected to tutoring. The Director of Student Services is also a committee member. Tutoring at Los Medanos is designed to give students peer instruction and support so they themselves can become independent, successful students.
Tutor Coordinator /Tutor Training
Although tutor training was delegated to departments, not every department has a background in providing tutor training, which research has indicated is crucial to successful programs; therefore, the Title III grant provided for a college wide tutor coordinator who could advise LMC departments on ways to strengthen their tutor training program with information on essential topics such as
How to structure a tutoring session Basic tutoring goals and techniques How to encourage independent learning Tutoring students from different cultures Tutoring students with different learning styles Handling conflicts in tutoring situations
The developmental program recognizes that each department’s instructors are experts in their particular subject area and that each subject area has different tutoring needs. The
31

college-wide tutor coordinator’s role is to serve as consultant, helping each department develop a program that suits its particular needs.
All the departments using tutoring money require a minimum of ten hours of tutor training of their tutors. Currently at LMC, tutor training falls into three modes: pre-semester tutor training which takes place during flex week; a tutor training course, Human Services 57, or department delivered training, the model followed by Math and sometimes Biology.
All the trainings focus on topics like the structure of a tutoring session, communication skills, fostering critical thinking, and learning styles etc., topics prescribed by the College Reading and Learning Association (CRLA), the international organization which certifies college tutoring programs.
The English department, which received CRLA certification of its tutor-training program in 2001, requires all new tutors to enroll in a semester length course, Human Services 57.
In Math, all new tutors go through 24 hours of tutor training before the semester. Tutor training consists of
A review of the math content in Math 1, 2, and 25(A/B/AX/BX)
PSI policies and procedures
Fundamentals of good tutoring practice, including tutor’s rights and responsibilities, the tutoring cycles, the Socratic method, diagnosis through observation, role modeling, learning styles, referral skills, cultural and gender diversity, critical thinking, and problem solving.
The tutor-training program meets the CRLA Level 1 standards, although they have not applied for CLRA certification.
A number of other departments have chosen to send their tutors to both the pre-semester training conducted by the college tutor coordinator, and/or have required them to enroll in Human Services 57. Most of the general education departments have one or two tutors who work with students individually or in small groups. The tutors help students to better understand the content of the course for which they’re tutoring or help students with projects or assignments they may not fully understand. There were approximately 20 tutors serving 81 sections of General Education courses in the Spring semester of 2002.
In the Occupational Education courses like travel, business, and computer science whose curriculum is strongly linked to computers, one to two tutors are present during class time to help students master the computer skills required by these departments’ respective courses. There were approximately 14 tutors serving approximately 49 sections of Occupational Education courses in the Spring semester of 2002.
32

Evaluation of Tutoring
All the departments using tutoring money evaluate their tutoring programs each semester. These evaluations include student evaluation of tutors and tutoring; tutor evaluation of themselves and the tutoring program for which they worked; and instructor evaluation of tutors.
In addition, as part of the annual application process for tutoring money, departments prepare a written summary of the strengths, weaknesses, and plans for improvements of their tutoring programs. The idea in these summaries comes from the information gathered from the evaluation process.
The English Department is beginning to critically examine the tutoring model it has chosen. When it works, it works well, but the department is also seeing how easily it doesn’t work well. Having enough skilled tutors and having instructors who are skilled in using in-class tutors are the two main issues affecting the quality of tutoring in English classes.
In the future, the English Department will be examining other ways to offer tutoring to its developmental students. One aspect of this exploration will be how the English Department’s new computer classroom/lab might be used in conjunction with tutors.
Math, like English, has difficulty recruiting enough tutors for its self-paced courses and for the two lecture courses that use in-class tutors, Math 25 AX and 25B. Often, instructors don’t know how to use their tutors. In addition, the math department is grappling with the effectiveness of its PSI model. Changes to this model would also affect the tutoring program.
Although there is no single problem confronting all the GE and Oc.Ed. tutoring programs, there are two concerns with which many struggle: tutor recruitment and student disinterest in tutoring services. Finding qualified students who have time to tutor and who won’t be immediately transferring or entering the work world is an ongoing challenge for many departments. A different kind of problem is student apathy. “The students who need tutoring are the students who don’t use tutoring” is one of the most frequently repeated statements about tutoring. Some departments have considered terminating their tutoring programs simply because their students aren’t using them.
33

College Resources for Tutoring
The college budgets around $80,000 per year for tutoring. For the academic year 2001-2002, that money was divided among thirteen LMC departments and disciplines in the following manner:
Department
Amount Received 2001-2002
Anthropology $1,588Art 720Biological Sciences 4,130Business 8,500Child Development 590Computer Science 1,935Economics 1,060English 11,025Foreign Language 2,835History 190Math 38,275Music 5,145Physical Science 1,512Travel 2,495
TOTAL $80,000
34

Chart 2 – Number of Courses Served by Tutoring and Student Ratings of Tutoring Experience
Department Average number of sections/semester
Average number of sections/summer session
Average number of tutors/semester
Student Satisfaction (Scale of 1-5)1
In-Class Tutoring for Developmental CoursesEnglish 20 3 10 4Math 17 9 22 5
General Education and Occupational Education TutoringAnthropology 6 - 1 5Art 4 2 1 Not availableAstronomy 6 2 2 4.5Biology 14 5 5 5*Business 26 5 6 4.5*Child Development 10 - 3 4*Computer Science 8 3 2 5Economics 6 2 1 Not availableForeign Language 16 6 1 4History 3 - 2 Not availableMusic 26 3 7 4*Travel 5 - 3 Not available
TOTAL 130 28 34 N/A*Occupational Education programs.
1
35

Alternatives to Tutoring
In addition to tutoring, students can receive academic support through the Reading and Writing Center and supplemental instruction. We have already reported on the Reading and Writing Center, so we will now examine the third alternative, supplemental instruction.
VI. Supplemental Instruction
Research/Best Practice
Supplemental Instruction was developed by Dr. Deanna Martin at the University of Missouri- Kansas City in 1973. It is an academic support program that targets courses that typically have high rates of student failure. According to the UMKC monthly newsletter
SI is a non- remedial approach to learning enrichment that increases student
performance and retention. SI offers regularly scheduled, out-of-class review
sessions to all students enrolled in a targeted course. SI study sessions are
informal seminars in which students review notes, discuss readings, develop
organizational tools, and prepare for examinations. Students learn how to
integrate course content with reasoning and study skills. The SI sessions are
facilitated by “SI leaders,” students who have previously and successfully
completed the target courses. SI leaders attend all class lectures, take notes, and
act as model students for their classmates. (6)
In 1981, SI was certified by the U.S. Department of Education as an Exemplary Educational Program. A large body of research supports its effectiveness at the university level. In What Works, Boylan reports that community colleges often have trouble retaining good SI leaders, since many leave the institution within two years and are not identified as potential SI leaders early on in their careers at the community college. He emphasizes that community colleges need to identify SI leaders in their first semester at the college, and must commit to rigorous training of the SI leaders. Regular meetings with the course instructor to discuss key course concepts and learning strategies are central to the success of the SI model. In addition, Boylan reports that
36

many community colleges report using a “modified” version of SI, and that while some of these may be successful, many are not. (78)
LMC Practice 1998
Athough a few departments had experience with encouraging students to work in study groups, there was no supplemental instruction program at LMC.
Recommendations of 1998 Task Force
LMC identify two faculty/staff to attend Supervisor trainings, which are offered several times each year at the University of Missouri-Kansas City. These SI supervisors would then identify two or three courses to pilot a SI program and recruit and train SI leaders for those courses.
A pilot SI program be supported for at least two years while data is collected about its effectiveness. If found to be effective, the SI model would be adopted and expanded as an on-going program.
LMC Current Practice (2003)
In Summer 2000, four LMC faculty were trained in the SI model at the University of Missouri – Kansas City. All four returned and started SI pilots in their departments – physical science, mathematics and nursing. Since that time, the following SI sessions have been offered. In summer 2002, one additional faculty member from child development attended the SI training at UMKC.
(TAP has also offered SI as part of their Math 25 and Math 30 learning community. Those sections are not included in the table below.)
Fall 2000 Spring 2001 Fall 2001 Spring 2002 Fall 2002 Spring 2003Math 34S Math 40 Math 25 Math 30 Math 25 PhySci.36Math 50 Math 60 Math 30 Math 34S PhySci 35 PhySci.40VocNurs 5 Math 34S Math 34S PhySci 36 PhySci 40 PhySci.42BioSci 40 PhySci 36 Math 40S PhySci 40 BioSci 40 BioSci.40
PhySci 40 PhySci 35VocNurs
See Appendix B for specific data on the comparative success rates of students who attended SI sessions versus those who did not. In most courses, students who attended SI received higher grades than those who did not. Students enrolled in Physics and Human Anatomy attended SI sessions in much higher numbers than students enrolled in math courses. Students enrolled in these science courses and their instructors found SI to be
37
very helpful in contributing to student success. Satisfaction with the SI leaders was high, and students consistently received quality assistance with their coursework.
VII. Learning Communities
Research/Best Practice
Research overwhelmingly supports the use of learning communities (Levine, 1999). With roots in a model created by Joseph Tussman at U.C. Berkeley in the 1960’s, contemporary learning communities are flourishing in higher education. While there are a number of different models, learning communities share some critical defining features: a cohort of students, two or more linked courses, and a focus on active learning and collaboration. (Levine, 1999) Many are interdisciplinary in nature and involve team teaching. Learning communities help students see the connections among disciplines, and encourage them to work with peers in a supportive and engaging environment. Faculty who teach in learning communities meet frequently to collaborate on making curricular connections and to discuss the needs of the students they share in common.
Barbara Leigh Smith, academic dean at Evergreen State College and director of the Washington Center for Improving the Quality of Undergraduate Education, points out in“Taking Structure Seriously: The Learning Community Model” that “restructuring efforts around learning communities are guided by assumptions about rethinking organizational practices and structures” (1991, p.42). She defines learning communities as
a variety of curricular models that purposefully restructure the curriculum to
link together courses or coursework during the same quarter or semester so that a
group of students finds greater coherence in what they are studying and
experience increased intellectual interaction with faculty members and other
students. In learning communities, students and faculty members experience
courses and disciplines as complementary and connected enterprises. (p.42)
Learning communities are increasingly being used as an alternative to traditional basic skills remediation. Tinto’s research (1997) supports this trend, as does the success of LaGuardia Community College (NY) in its New Student House program, which offers developmental reading, writing and oral communication. Evergreen State College in Olympia, Washington houses the National Learning Communities Project. Resource information is available at http:// learning commons.evergreen.edu
38

LMC Practice 1998
LMC had some experience with learning communities prior to 1998. AVANCE is a learning community with a thematic link of Latino culture and studies. There were two pilots, STAR and EXCEL, which targeted basic skills students by linking courses in English, math, and college success. There was, however, no thematic link in these pilot learning communities. Students were particularly enthusiastic about the counseling component and the sense of community that they experienced in these programs; however, English faculty recommended that future learning communities focus on students in higher-level courses with a thematic link.
Recommendations of 1998 Task Force
Learning Communities should be developed and utilized as part of our developmental education program. As a start, development of linked courses should be encouraged.
Resources should be provided for a Coordinator to develop, implement and evaluate these programs, which should be given at least two years for “pilot” time and formative evaluation before any summative evaluation is undertaken. This Coordinator might be housed in the Teaching/Learning Center.
Faculty participating in Learning Communities be given reassigned time to plan effectively and coordinate their classes.
LMC Current Practice (2003)
Because one of the key components of the second Title III grant (transfer) was the establishment of a learning community that would help students move from developmental courses to transfer-level courses (TAP), we did not initiate another learning community at the developmental level. In addition to TAP, which decided to focus on helping students advance from developmental to transfer-level math, LMC also instituted a Puente program that focuses on English 90 and English 10S. Therefore, the one learning community that we did pilot was at the transfer level, thematically linking an English 10S and PolySci 5 course.
Although TAP is an initiative of the transfer Title III grant, we discuss it here because it is a learning community that addresses the needs of students enrolled in developmental math courses who have a goal of transfer. TAP does have a Coordinator with release time, as recommended by the 1998 Task Force.
Transfer Achievement Program
The Los Medanos College Transfer Achievement Program (TAP) is a community of learners who link together by enrolling in the same beginning algebra (Math 25) and
39

study strategies course (Education 5). Participants share a common goal of successfully completing transfer requirements with a special emphasis on math achievement.
The TAP Counseling Program is a case management, team approach that seeks to create a broad-based, supportive learning environment for each student in the program. Counselors work as advocates and problem solvers in helping students to remove personal barriers to their education as well as to develop short- term goals and long range educational plans as they engage in the task of becoming independent learners.
Outcomes
Fall 2002 (cohort 1) Retention SuccessAll Math 25 sections .73 .51TAP Math 25 .89 .63Education 5 .85 .73
Spring 2003 (cohort 1) Retention SuccessAll Math 30 sections .80 .61TAP Math 30 .80 .42
Spring 2003 (cohort 2) Retention SuccessAll Math 25 sections .75 .55TAP Math 25 .88 .67Education 5 .95 .91
Learning Community Linking English 10S and PolySci 5
In Fall 2003, we are piloting a new learning community, combining two transferable courses, English 10S-College Composition and Political Science 5- American Institutions and Ideals. The learning community is entitled “Poets and Politicians,” highlighting common themes and helping students to make connections between the different disciplines. The course also focuses on reading, writing and thinking skills critical for both English and Political Science. One of the six hours of class instruction is held in the computer classroom to give students access to Internet interfaced instructional modules. An on-line Blackboard classroom has also been developed to support the course. In addition to the facilitated small group discussion in class, students are also invited to attend a weekly study group facilitated by one or both of the instructors in the Reading and Writing Center.
40
The faculty members who designed and taught the learning community were not given release time, but were compensated on an hourly basis for the additional time that was required to coordinate their curriculum.
Evaluation
At the end of the Fall 2003 semester, students enrolled in the learning community were interviewed (as a group) without their instructors present. Feedback was extremely positive. All of the students reported having a positive experience and emphasized the support they received from their instructors and fellow students, the reduced sense of stress and overload due to the coordination of assignments and due dates, the integration of knowledge, and above all, the sense of community and closeness that developed over the course of the semester. However, the major “disadvantage” from their perspective was that this was a “serious” class, you had to do the reading, and there was a lot of work! Some mentioned that this is why some of the students had dropped out of the learning community, and why they would only recommend it to other students who were serious about learning.
“Poetry and Politics” will be offered again in Spring 2004.
41
SECTION 3: CONCLUSIONS AND RECOMMENDATIONS (2003)
In Fall 2003, the Teaching and Learning Advisory Committee reviewed, analyzed and critiqued all of the data provided in this report. As a result of those discussions, we offer the following conclusions and recommendations regarding each of the components of the developmental education program:
I. Assessment and Placement
Relevant Data
According to one study in Fall 2001, 31% of first time freshmen with long-term goals were not assessed upon entry to the college. (An additional 7% were exempt from assessment.)
About 46% of all students who assess enroll in a math or English course that semester. (For students with long-term goals, these percentages might be higher. A Fall 2001 study indicated that 54% of first time freshmen with long term goals enrolled in English and 57% enrolled in math.)
Of those who enroll in math courses, about 43% enroll in the course recommended by the assessment process, compared to 80% who enroll in recommended English courses. (This is probably due to prerequisites for English 90 and 10S.)
Of students who took the English assessment for Fall 2002:27% (530) placed at college-level English (English 10S)39% (776) placed one-level below (English 90)23% (457) placed two- levels below (English 70)11% (216) placed below English 70
Of students who took the LOEP (for ESL placement)13% (20) placed above the ESL level19% (30) place at the “bridge” level (English 62)22% (34) placed at advanced ESL (ESL 56)46% (971) placed at intermediate ESL (ESL 55)
Of students who took the math assessment for Fall 2002:65% placed at basic arithmetic or prealgebra20% placed at elementary algebra15% placed at intermediate algebra or above
42

Conclusions We need to assess a higher percentage of incoming freshmen with long-term
goals. A higher percentage of students should enroll in English and math courses their
first semester at LMC, particularly if their educational goal is to earn a certificate, degree or transfer.
Recommendations/Action Plan
Refer the above conclusions to the matriculation committee for action. Inform the Enrollment Management committee of this data and our conclusions. Inform department chairs in English and math.
II. Developmental Courses (English and math)
Relevant Data
An average of 74% of our developmental courses and English 10S are taught by part-time faculty.
An average of 50% of developmental math courses are taught by part-time faculty.
Course success rates in English developmental courses have improved since 1998 and are above the state average for English basic skills. (See Appendix A)
Persistence to progressively higher levels of English courses has improved steadily over a 1993 baseline study. (See Appendix A.)
Students who complete English 90 are more successful in English 10 than students who assess directly into English 10.
Students who complete English 70 are less successful in English 90 than students who assess directly into English 90.
Course success rates in Elementary Algebra are above the state average, except for self-paced sections. (See Appendix A).
Course success rates in math pre-collegiate basic skills courses are below the state average. (See Appendix A).
Conclusions
We need more full time faculty to teach developmental courses in English and math; however, we need to invest in professional development for our adjunct faculty as well as our full time faculty, as they are an essential resource for our developmental program.
43

We need an increased focus in our English department on courses below English 70, and on our articulation with ESL courses.
We need to re-examine the English 70 curriculum to assess whether or not it is adequately preparing students for English 90.
We need to reconsider the cut-off scores for English 10S on the placement exam, as it may be set too low.
We need more training for English faculty to use the computer classroom/lab. We need to conduct faculty and student satisfaction surveys/focus groups for both
English and math developmental courses. We need to invest resources in teaching communities that focus on DIRECT
measures of student learning in addition to the indirect measures of course success and persistence rates. (Can we provide direct evidence of student performance relative to our defined student learning outcomes?)
We need to develop measures of effectiveness for teaching communities.
Recommendations/Action Plan
Forward the following recommendations to the chairs of the English and math department for consideration by the department:
Develop a staff development curriculum and a plan for delivering that curriculum to full and part-time faculty who teach developmental courses. That curriculum might include
o Assessment of learning outcomes and how to use assessment results to improve teaching and learning
o Effective use of tutors in the classroomo Effective use of computer-assisted instructiono Integrating counseling services in the curriculum (English 70 and Math
12)o Reading instruction (Essential to English courses, but relevant to math
courses as well.)
Find resources to support the continuation of teaching communities that focus on direct assessment of student learning outcomes at the course and program level. Develop measures of effectiveness for these teaching communities.
Conduct faculty and student satisfaction surveys and/or focus groups to assess their experiences with developmental courses.
Rewrite developmental course outlines to align with course level and program level learning outcomes.
44

English department: Look at effectiveness of courses below English 70, particularly the ESL bridge courses and articulation with the ESL program.
Math department: Continue to increase alternatives to self-paced instruction. Work with counselors to raise student awareness of these alternatives.
III. Counseling Interventions in Developmental Courses
Relevant Data
Fall 1999 (no counseling partnership in English 70): 44% of students who successfully completed English 70 enrolled in English 90 the next semester.
Fall 2001 (counseling partnership in English 70): 64% of students who successfully completed English 70 enrolled in English 90 the next semester
Spring 2003 evaluation: 76 students from 4 sections of English 70 responded to an end of semester survey that specifically targeted achievement of the counseling partnership goals. Students reported that
o 95% of English 70 students had an educational goalo 58% encountered obstacles to staying in English 70 that semestero 26% used college resources to overcome those obstacleso 68% reported that they had an educational plan
Conclusions
The counseling partnership appears to be helping English 70 students develop and educational goal and plan, and is encouraging persistence in the developmental sequence of courses leading to transfer level courses.
New faculty, especially part-time faculty, need to be oriented to their role in the counseling partnership in English 70 and Math 12.
We need to increase the response rate to our end-of-semester evaluation, and use institutional data to verify counseling contacts for English 70 and Math 12 students.
Recommendations/Action Plan
Work with counselors to ensure that the counseling partnership project continues to receive the coordination and support necessary to provide this service to at least, English 70 and Math 12 students. Should additional resources become available, consider expanding the partnership to other developmental courses.
Recommend to English and math department chairs that an orientation to the counseling partnership be provided each semester for faculty teaching English 70 and Math 12. This orientation should include the goals of the project, the timeline for activities, instructor responsibilities, suggestions for integrating
45

the counseling visits with the course curriculum, and the importance of completing the end of semester evaluation survey.
Recommend to chair of counseling department that an orientation to the counseling partnership be provided each semester to counselors who will participate in the project. This orientation should include the goals of the project, the timeline for activities, counselor responsibilities, periodic review of the content of counseling presentations, and evaluation of the counseling presentations.
Request that a counselor join the TLC Advisory Committee, preferably the counselor who is responsible for coordinating the counseling partnership.
Ask counselors to research and recommend ways to further integrate counseling and developmental education.
IV. Reading and Writing Center
Relevant Data
Student usage of the Reading and Writing Center has increased dramatically since its opening in Spring 2000. In Spring 2000, 330 students made appointments to see a writing consultant and there were 3,419 sign-ins for the computer lab. In Spring 2003, 800 students made appointments to see writing consultants and there were 12, 036 sign-ins for the computer lab.
According to the LMC Business Office, the Reading and Writing Center generated 31.83 non-credit FTES for 2002-2003, resulting in a request for $17,507 from the district office as its share of the apportionment the district received from the state. (The district receives $2,145 per non-credit FTES for which it reimburses the college $550.)
The majority of students using the Reading and Writing Center are from English 10S (37%) and English 90 (25%), and 38% of the students are seeking help for reading and writing assignments across the curriculum.
A Spring 2002 study indicated that English 10S students who went to the Reading and Writing Center for help on their assignments at least 3 times during the semester had course success rates of .76 compared to success rates of .58 for those who did not.
A Spring 2003 student satisfaction survey found that of 171 students who completed the survey, the vast majority were “very satisfied” with the services provided.
Conclusions
The Reading and Writing Center is in high demand by students who are satisfied with its services. Consultants are well trained, and we are increasing the number of faculty across the curriculum who work in the Center.
46
We need to do a better job of informing students and faculty in courses other than English that the Reading and Writing Center is a valuable resource available to them.
We need to develop student-learning outcomes for students who use the Reading and Writing Center and determine how to assess achievement of those outcomes.
We need a code of ethical conduct for consultants and criteria for evaluating their performance.
Recommendations/Action Plan
Write goals for the Center and intended learning outcomes for students who use its services.
Write a code of ethical conduct for consultants.
Write evaluation guidelines for consultants.
Design a cohesive staff development curriculum for consultant training. Include
Goals and learning outcomes Principles for ethical conduct Model of 25 minute consultancy session How to help students with reading assignments How to help students with writing assignments
Increase outreach to departments. Encourage use of Center on many levels – increase faculty awareness of the number of ways that the Center can support teaching and learning in their courses.
Publish consultants’ training session dates at the same time schedules are developed. Send out an invitation for faculty to work in the Center at that time so they can work it into their own schedules.
Get out the message that the Center can support reading instruction on campus, including reading of graphs, tables, and illustrations – not just traditional texts.
47

V. Tutoring
Relevant Data
We currently have a decentralized tutoring model; allocations are determined by the College Tutoring Committee, which requires that all departments that receive tutoring funds meet criteria for tutor selection, training and evaluation.
The English department received CRLA certification of its tutoring program in 2001, and requires new tutors to take a semester length course in tutor training. This course is open to all new tutors on campus, from any discipline.
The math department requires 24 hours of pre-semester tutor-training. All departments require at least 10 hours of tutor training. Students are generally satisfied with tutoring services. The college invests approximately $80,000 in tutoring. In 2001-2002, that
budget was distributed as follows:
o Math 48%o English 15%o Business 10%o Music 7%o Biology 5%o Travel 3%o Anthro 2%o PhySci 2%o CompSci 2%o Other 6%
Conclusions
The math department uses the greatest amount of tutoring funds, as tutoring is an essential component of self-paced courses.
Following math, English is the next greatest consumer of tutoring funds, as many sections of English 70 and 90 use in-class tutors.
Because math and English get the lion’s share of the tutoring budget, they need to be especially accountable for their tutoring services. Is the money being used well?
We need to connect tutoring with effectiveness measures: Is tutoring having a positive impact on student learning?
We need to re-examine the goals of tutoring and evaluate how well those goals are being met.
Faculty need more training in the effective use of tutors, both in and outside of the classroom.
There is no centralized location for tutoring that occurs outside of the classroom, excepting the math lab.
48
Recommendations/Action Plan
Recommend to the College Tutoring Committee:
Analyze the relationship between tutoring goals and tutoring outcomes.
Determine research questions for programmatic assessment of tutoring, relative to goals.
Determine whether or not access to tutoring on campus is equitable, and if not, seek changes to make it more equitable.
Define where “Tutoring” is housed in the college on the organizational chart.
Consider a centralized location for tutoring services for departments that have no physical space for tutoring to occur.
Provide staff development for teachers using tutors.
VI. Supplemental Instruction
Relevant Data
We have six semesters of experience with Supplemental Instruction (SI), mostly in Math, Physics and Human Anatomy. In most sections, students who attended SI earned higher grades in the course than students who did not.
SI is more expensive than tutoring because SI leaders are paid to attend the course for which they are leading SI sessions, and they are paid to meet with the instructor and prepare for their SI sessions.
Conclusions
SI has been a successful model for Physics and Human Anatomy. This may be due both to the quality of the SI leaders for those courses, and the motivation of the students enrolled.
If we expand SI beyond those courses we may need to consider a more formal system of training SI leaders and evaluating the effectiveness of the SI model.
SI is a component of the TAP program for both Math 25 and 30, but it is not yet clear whether or not it is contributing to student success in those courses.
49

Recommendations/Action Plan
Recommend to the College Tutoring Committee that they:
Consider the outcomes we have documented for Physics and Human Anatomy, and decide whether or not to continue SI for those courses, either in its present or modified version.
Consider how the SI model, or other small group workshop models, might be encouraged for other courses in addition to individual tutoring.
VII. Learning Communities
Relevant Data
TAP Learning Community
Goal: to help students successfully complete Math 25 (Elementary Algebra) and Math 30 (Intermediate Algebra), and then enroll and succeed in a transfer level math course.
Fall 2002 (cohort 1) Retention SuccessAll Math 25 sections .73 .51TAP Math 25 .89 .63Education 5 .85 .73
Spring 2003 (cohort 1) Retention SuccessAll Math 30 sections .80 .61TAP Math 30 .80 .42
Spring 2003 (cohort 2) Retention SuccessAll Math 25 sections .75 .55TAP Math 25 .88 .67Education 5 .95 .91
While retention and success rates for the TAP section of Math 25 are significantly higher than the average success rates of all Math 25 sections, the first cohort was not able to maintain that success in Math 30 the following semester. The TAP Advisory Board is considering possible explanations for that lower success rate in Math 30, and discussing possible interventions to improve success in Intermediate Algebra.
50

Poetry and Politics: A Learning Community that links English 10S and PolySci 5
Success and retention rates are not yet available for Fall 2003. However, student feedback about this learning community was overwhelmingly positive. Students were especially appreciative of the coordination of assignments and due dates, the high level of support from both instructors and peers, the integration of knowledge, and the sense of community created in the classroom.
Conclusions
We have just begun to explore the possibilities of learning communities for our students. More time is needed to determine how effective they are in improving student learning. Student feedback, however, is very positive. Students enjoy learning communities and feel they are beneficial.
There is no specific group on campus that coordinates all learning communities on campus. Each learning community functions independently, e.g. Puente, TAP, pilots such as English 10S/PolySci 5.
Recommendations/Action Plan
Continue to evaluate pilot learning communities and evaluate their effectiveness, in terms of the quality of the learning experience provided for students, direct evidence of student learning outcomes, and measures of student success, such as retention, course completion, and persistence.
The TLC Advisory Committee should determine the interest in forming some kind of learning community alliance on campus that would provide a forum for everyone who is interested in the work of learning communities on campus.
51

References
Bartholomae,D. & Petrosky.A. (1986). Facts, artifacts and counterfacts: Theory and
method for a reading and writing course. Portsmouth, NH: Boynton/Cook Publishers.
Boylan, H.R. (2002). What works: Research-based best practices in developmental
education. Boone, NC: Continuous Quality Improvement Network with the
National Center for Developmental Education.
Boylan,H., Bliss, L., & Bonham, B. (1997). Program components and their relationship
to student performance. Journal of Developmental Education, 20(3), 2-9.
Boylan, H., Bonham, B., White, R., & George, A. (2000). Evaluation of college reading
and study strategies programs. In R. Flippo & D. Caverly (Eds.), Handbook of
college reading and study strategy research (pp. 365-402). Mahwah, NJ:
Lawrence Erlbaum & Associates.
Center for Supplemental Instruction, University of Missouri-Kansas City. Review of
research concerning the effectiveness of SI from the University of Missouri-
Kansas City and other institutions from across the United States. (2000)
Clark-Thayer, S. (Ed.)(1995) Nade: Self-evaluation guides. Clearwater, FL.: H&H
Publishing Company.
Grubb,N. (1999) Honored but invisible: An inside look at teaching in community
colleges. New York, N.Y.: Routeledge.
Keimig, R. (1983) Raising academic standards: A guide to learning improvement.
Washington, DC: Association for the Study of Higher Education/Educational
Resource Information Center.
52
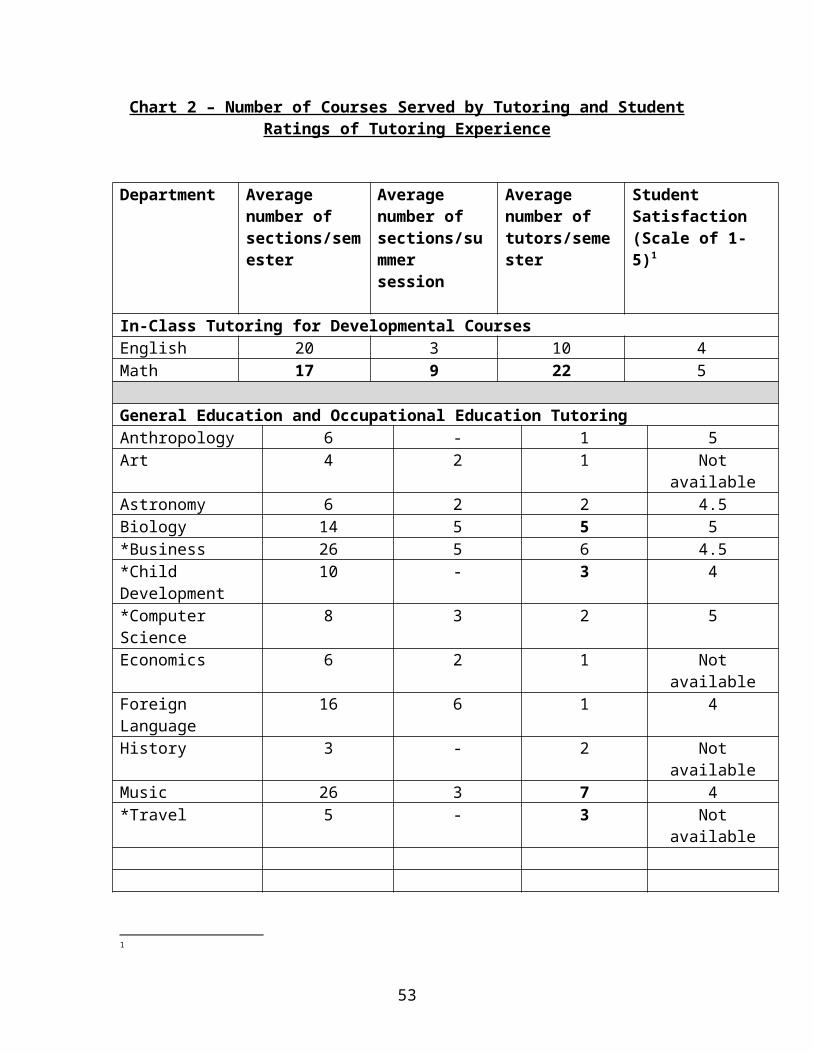
Levine, J.H. (Ed.). (1999) Learning communities: New structures, new partnerships for
learning. (Monograph Series No. 26) Columbia, SC: University of South
Carolina, National Resource Center for The First-Year Experience and Students
in Transition.
Maxwell, M. (1997). The role of counseling in a comprehensive developmental program
for post-secondary students. Kensington, MD: MM Associates ( ERIC
Document Reproduction Service No. ED 415 932).
Maxwell, M. (1999) Evaluating peer tutoring. Mitchellville, MD: MM Associates.
McCabe, R.H. (2000) No one to waste: A report to public decision makers and
community college leaders. Washington, DC: Community College Press.
Perin, D. (2002, April). The organization of developmental education: In or out of
academic departments? Community College Research Center Brief (14).
Roueche, J.E. & Roueche, S.D. (1999). High stakes, high performance: Making remedial
education work. Washington, DC: Community College Press.
Simpson, J.H. (1985). What lie ahead for writing centers: Position statement on
professional concerns. Writing Center Journal 5.2/6.1, 35-39.
Smith, B.L. (1991). Taking structure seriously: The learning community model. Liberal
Education 77(2), 42-48.
Tinto, V. (1997) Classrooms as communities: Exploring the educational character of
student persistence. Journal of Higher Education, 68 (6), 599-623.
53

APPENDIX A
Course Completion and Persistence Rates for Students Enrolled in Developmental Courses
Fall 2000 – Fall 2002
Assessment Data
Of students who took the English assessment for Fall 2002: 27% (530) placed at college-level English (English 10S) 39% (776) placed one-level below (English 90) 23% (457) placed two- levels below (English 70) 11% (216) placed below English 70
Of students who took the LOEP (for ESL placement) 13% (20) placed above the ESL level 19% (30) place at the “bridge” level (English 62) 22% (34) placed at advanced ESL (ESL 56) 46% (71) placed at intermediate ESL (ESL 55)
Of students who took the math assessment for Fall 2002: 65% placed at basic arithmetic or pre-algebra 20% placed at elementary algebra 15% placed at intermediate algebra or above
These percentages are fairly typical of other California Community Colleges. A 2002 Basic Skills Survey conducted by the Academic Senate of the California Community Colleges indicated that of the colleges that responded to the survey (about 50 for the assessment/placement question), most reported similar percentages.
For Fall 2002, 1260 students were enrolled in pre-collegiate basic skills/and or developmental math or English courses.
English Course Success Rates
According to the California Community Colleges Chancellor’s Office Data Mart website,
the statewide average success rate for pre-collegiate basic skills courses in English was
56% for Spring 2002.
54

At Los Medanos College, the student success rate (a grade of A, B, C or CR) in
developmental English courses has steadily improved over the 1998 baseline when we
began our integrated reading and writing curriculum.
In our pre-collegiate basic skills course, English 70, success rates went from 49%(baseline) to 63% in Fall 2000, 61% in Fall 2001, and 60% in Fall 2002. In addition, enrollments climbed from 81 to 242.
In English 90, success rates went from 59%(baseline) to 65% in both Fall 2000 and 2001, and 62% in Fall 2002. In addition, enrollments climbed from 141 to 458.
Success rates in the stand-alone composition courses averaged 55% for a 4-year period (1994 –1998).
Success rates in the stand-alone reading courses averaged 57% for a 3-year period. (1994 –1997).
Persistence Rates/Subsequent Enrollment and Success in Next Level English Course
Statewide, The Center for Student Success (a project of the Research and Planning Group) conducted an MIS Project that followed student persistence from lower level English courses to any transferable English class after 8 semesters. The sample size for this study was 40,150 students. We cannot directly compare our numbers to their numbers because of three differences:1. We measured success in higher level courses as well as persistence (simply
enrolling in the higher level course)2. The CSS study allowed eight semesters before measuring persistence3. The CSS study used any transferable English course instead of English 1A
Still, the following data may give us some idea of reasonable goals to set:
Persistence from 1 level below to any English transferable course: 56% Persistence from 2 levels below to any English transferable course: 31%Persistence from 3 levels below to any English transferable course: 20%
55

Los Medanos College Persistence Rates within an English Sequence
Baseline Study: Fall 1993 English 70 cohort (n= 177). By Fall 1996, 8 students in the 1993 cohort had persisted and succeeded in English 10S. This was an overall persistence and success rate of 4.5%.
Fall 1999 English 70 cohort (n = 239). By Fall 2002, 21 students in the Fall 1999 cohort study had persisted and succeeded in English 10S. This was an overall persistence and success rate of 9%. Of those who enrolled in English 10S from the 1999 English 70 cohort, 60% succeeded in the course
Fall 2001 English 70 cohort (n= 233). By Fall 2002, 31 students in the Fall 2001 cohort study had persisted and succeeded in English 10S. This was an overall persistence and success rate of 13% after only 2 semesters. Of those who enrolled in English 10Sfrom the Fall 2001 cohort, 84% succeeded in the course.
In Fall 2002, 476 students enrolled in English 90. Of these, 210* (44%) went on to enroll in English 10S in Spring 2003, and 147 (70%) passed the course. This was an overall persistence and success rate of 31% after only one semester.
(*Since the success rate for English 90 was 62% in Fall 2002 (295 out of 476 students passed English 90), 210 students going on to enroll in English 10S represents 71% of all students who passed English 90 going on to enroll in English 10S the following semester.)
Comparison of Student Success in English 10S and English 90 based on past preparation
Students who enrolled in English 10S after assessing directly into that course had a success rate of 59% in Fall 2002. Those who enrolled in English 10S after completing English 90 had a success rate of 65%.
Students who enrolled in English 90 after assessing directly into that course had a 65% success rate for both the Fall 2001 and 2002 semesters. Those who enrolled in English 90 after completing English 70 had a success rate of 61% in Fall 2001 and a 53% success rate in Fall 2002.
56
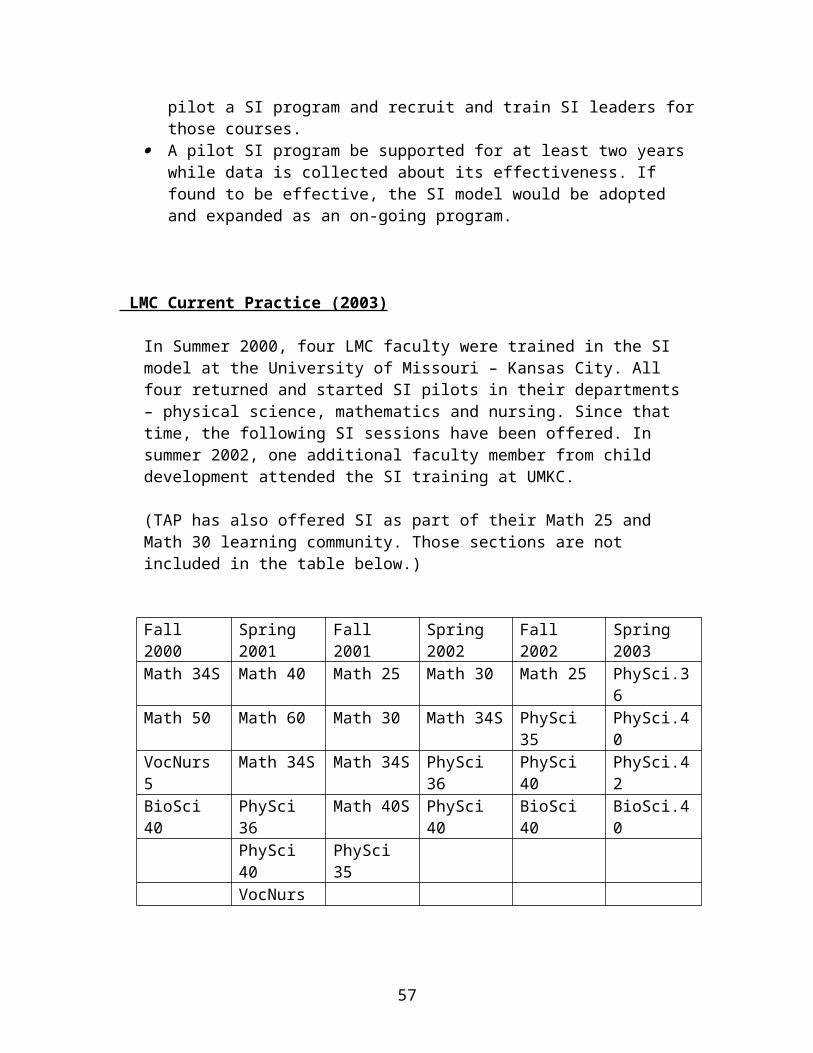
Math Course Success Rates
According to the Algebra Pathways Task Force, as of June 2001, the overall success rate within California community colleges in Elementary Algebra courses averaged 46%.
The 1998 baseline for Math 25 (4 unit lecture only) is a course success rate of 45%.
Course success rates in Elementary Algebra (Fall 2000 – Fall 2002 average)Math 25 (4 unit lecture) 51%Math 25AX (2 unit lecture) 61%Math 25BX (2 unit lecture) 64%Math 25A (self-paced) 25%Math 25B (self-paced) 34%
In spring 2003 the math department began to use student success rates in developmental courses to make decisions about scheduling and course offerings. They have drastically cut back the self-paced Elementary Algebra in favor of the more successful two-semester lecture version. They have replaced many sections of self-paced basic skills courses with a prealgebra course that incorporates counseling and computer-aided instruction. This course is a bridge into algebra for the under prepared student with transfer as a goal.
Also, in spring 2003, the Office of Institutional Research completed the first research cycle connected to the developmental math program. Specifically, they compared Elementary Algebra success rates for students who have experienced different preparatory interventions.
Results of Institutional Research on Math 25, 25A/AX
For Fall 2001, Spring 2002, and Fall 2002 an average of 40% of students enrolled in Math 12, 15, and 25 (all versions) never took an assessment test at LMC.
Success rates of students enrolled in Math 25 (all versions) based on preparation:
Assessed into Math 25: 48.1% (26 out of 54 students) Spring 2002
53.7% (66 out of 123 students) Fall 200254.9% (45 out of 82 students) Fall 2001
Assessed below Math 25: 41.5% (73 out of 176 students) Spring 2002 42.7% (100 out of 234 students) Fall 2002
36.7% (72 out of 196 students) Fall 2001
57

Completed Math 12 previous semester: 75% (7 out of 12 students) Spring 2002 71.4% (10 out of 14 students) Fall 2002
Completed Math 1 previous semester: 42.9% (15 out of 35 students) Spring 200254.1% (20 out of 37 students) Fall 200232.1% (9 out of 28 students) Fall 2001
Success Rates of students enrolled in Math 30 based on preparation:
Assessed into Math 30: 50% (1 out of 2 students) Spring 200271.4% (5 out of 7 students) Fall 200250% (3 out of 6 students) Fall 2001
Assessed below Math 30: 59.4% (19 out of 32 students) Spring 200260% (18 out of 30 students) Fall 200231.8% (7 out of 22 students) Fall 2001
Completed Math 25 (all) previous semester: 69.9% (58 out of 83 students) Spring 2002 65.4% (53 out of 81 students) Fall 2002 55.5% (35 out of 63 students) Fall 2001
Success Rates of Students Enrolled in Pre-collegiate Basic Skills Courses
According to the State Chancellor’s Office Data Mart website, the statewide average success rate for pre-collegiate basic skills math courses in Fall 2002 was 53.6%.
The 1998 baseline for Math 1 was a course success rate of 46%.
Pre-collegiate basic skills courses at LMC include Math 1, 2, 7, 904 and 12. Fall 2002 success rates for these courses were:
Course success rates in Math 1 averaged 45% from Fall 2000 – Fall 2002. Course success rates in Math 2 averaged 42% from Fall 2000 – Fall 2002. Course success rates in Math 12 averaged 50% from Fall 2001 – Fall 2002.
Beginning in Spring 2004, a new 4-unit pre-collegiate basic skills math course, Math 9, will be offered. It will be a lecture format. This course was designed specifically to address the learning outcomes defined by the developmental math program, and to incorporate recommended best practices.
58
APPENDIX B
SI Outcomes Spring 2002
Math 30 sec. 7391
Total Enrollment= 21SI participants= 7 mean final grade = 2.88Non-participants=14 mean final grade = 1.08
PhySci 36 sec.3032
Total Enrollment= 17SI participants= 14 mean final grade= 3.00Non-participants=3 mean final grade= 1.33
PhySci 40 sec.7481
Total Enrollment = 14 SI participants= 9 mean final grade= 2.67Non-participants=5 mean final grade = 2.00
SI Outcomes: Fall 2002
Physical Science 40 sec. 0602
Total Enrollment = 12SI participants = 10 mean final grade = 2.67Non- participants =2 mean final grade = 2.50
Physical Science 35 sec.0601
Total Enrollment = 19SI participants= 18 mean final grade = 2.5Non-participants= 1 final grade = 1.0
Biological Science 40 sec. 0776
59
Total Enrollment = 25SI participants= 20 mean final grade = 2.85Non-participants= 5 mean final grade = 2.40
Biological Science 40 sec. 0777
Total Enrollment = 33SI participants= 29 mean final grade= 2.69Non-participants=4 mean final grade= 1.25
Math 25 sec. 1170
Total Enrollment = 36SI participants = 4 mean final grade = 1.75Non- participants= 32 mean final grade = 2.41
Math 25 sec. 2213
Total Enrollment = 17SI participants = 6 mean final grade= 2.00Non-participants= 11 mean final grade = 1.64
SI Outcomes Spring 2003
Bio Science 40 sec.2796
Total Enrollment = 39SI participants = 28 mean final grade = 2.90Non-participants = 11 mean final grade = 2.00
BioScience 40 sec.7304
Total Enrollment= 39SI Participants= 29 mean final grade= 2.74Non-participants= 10 mean final grade= 2.25
Physical Science 36 sec. 3032
Total Enrollment = 12SI Participants = 8 mean final grade = 3.00Non-participants=4 mean final grade = 3.00
60

Physical Science 40 sec.7481
Total Enrollment = 12SI participants= 7 mean final grade= 2.5Non-participants=5 mean final grade= 2.5
Physical Science 42 sec.7482
Total Enrollment = 19SI participants= 10 mean final grade= 3.4Non-participants= 9 mean final grade= 1.83
61
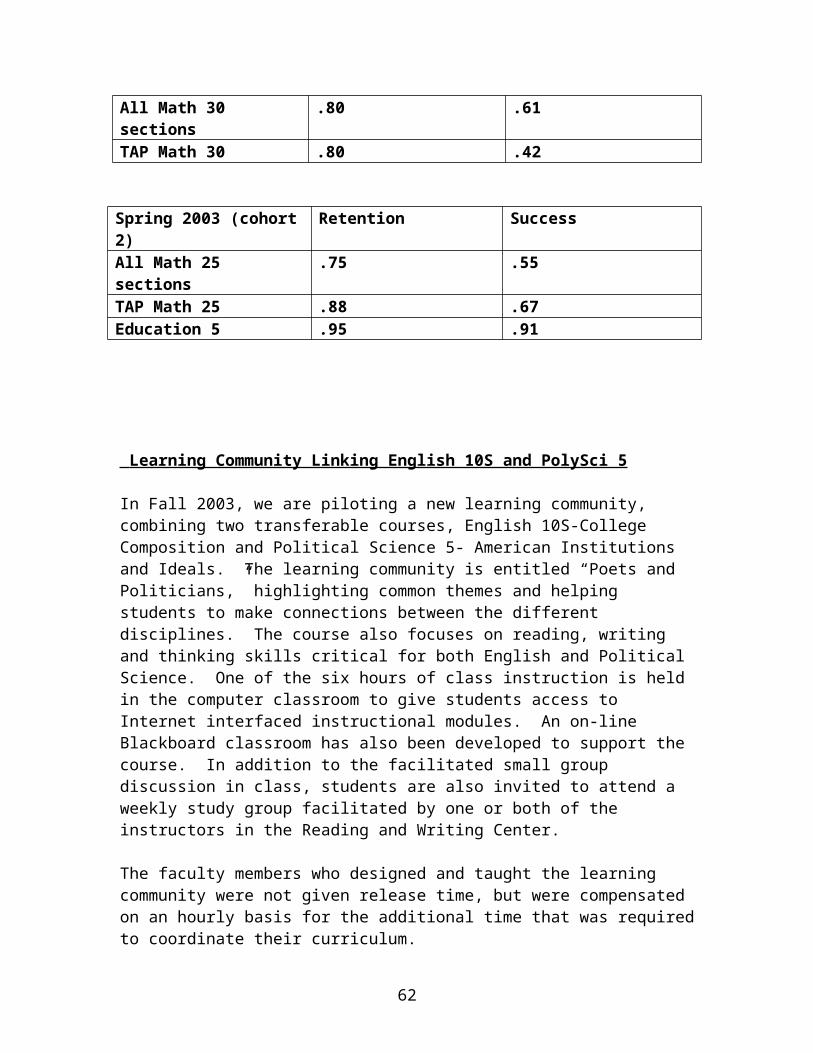
APPENDIX C
Elementary Algebra Teaching Community Spring 2003
Summary: Summative Assessment of Problem-solving Outcome
Outcome: Students will use mathematical reasoning to solve problems and a generalized problem solving process to work word problems.
Sampling design: From nine Math 25 sections taught by instructors participating in the Teaching Community, we chose a random sample of three students from each section. The sample was taken from students who were passing the course prior to taking the final exam. The sample contained 18 students. (Two of the eight instructors did not submit student work, so the sample did not contain students from three sections.)
Method: We wrote four problems that met the criteria for problem-solving in the DE Problem-solving Outcome. The four problems required students to apply concepts in a context, demonstrate conceptual understanding, explain their reasoning, and use multiple approaches. The four problems were also designed so that multiple strategies could lead to a solution; in this way, the problems were more than standard word problems. Every instructor put these four problems on his/her final exam. (#2, 3, 7, and 17 from the common final exam)
Technique: All four problems from each student paper were assessed holistically using a rubric written by the Teaching Community earlier in the semester. We began with a benchmarking exercise in which each instructor graded the same three papers. We then discussed the scores on these three papers and reached consensus. Next, each final was assessed independently by three instructors. If at least one of the three scores differed from the mean of the three scores by more than 0.5, that student’s work was discussed by the whole group until consensus was reached. Otherwise, scores were averaged.
Summary: See rubric for description of scoresStemplot of rubric scores
2| 5 represents an average score of 2.5
Mean 3.6 Standard deviation .8
Quartiles: 2.5 3 3.5 4 5
62
012 5 5 73 0 0 0 5 5 5 5 5 74 0 0 55 0 0 06

Observations: Instructors noted that nearly all students in the sample attempted every problem. Uniformly, the students did a good job defining variables and using multiple approaches when prompted. Very few papers explicitly demonstrated more sophisticated use of a general problem-solving process (e.g. stating givens and assumptions, giving estimates, checking). Generalizing other weaknesses was more difficult. Instructors noted that frequently a student performed inconsistently on the four problems, demonstrating good understanding in one setting and having difficulty with similar concepts in another setting.
Action: Instructors in the Teaching Community will focus more on problem-solving in fall 2003. The use of computer-aided instruction to teach procedural algebra skills will provide more class time for instructors to work on problem-solving and the other DE program learning outcomes. During the summer session, eight instructors met for 3-hours a week to write and discuss classroom activities that focus on conceptual development of algebra content and problem-solving. We will see if this increased classroom focus on developing problem-solving skills improves student performance.
Elementary Algebra Teaching Community Spring 2003
Summary: Summative Assessment of Procedural Skills
Sampling design: From nine Math 25 sections taught by instructors participating in the Teaching Community, we used all students who were passing the course prior to taking the final exam. The sample contained 136 students from seven sections; 122 took the same final exam. (One instructor who taught two sections did not submit data.)
Method: We identified six content objectives fundamental to Elementary Algebra. Using the common final exam, we ranked problems (referenced in the table) by skill into three levels of difficulty. One instructor gave a different final exam but ranked his problems similarly.
Technique: Instructors tallied the number of students who made minor errors and the number who got the problem completely correct.
Level of Difficulty Low Medium High
Minor Correct Minor Correct Minor CorrectSkill errors errors errorsSolve linear equationsFinal exam: low=1a, med=1b, high=1f
16/12213%
102/12284%
24/12220%
86/12270%
35/13626%
61/13645%
Find the equation of a lineFinal exam: low=18, med=2, high=7
8/1227%
90/12274%
33/13624%
76/13656%
44/13632%
62/13646%
Solve quadratic equations 31/122 71/122 30/122 67/122 43/136 68/136
63
Final exam: low=9, med=1e, high=1g 25% 58% 25% 55% 32% 50%
Solve a linear inequality Final exam: med=1h
XXX XXX 37/12230%
59/12248%
XXX XXX
Simplify polynomials: add/subtractFinal exam: low=11, med=12
12/1369%
106/13678%
40/13629%
82/13660%
XXX3/1421%
XXX11/1479%
Laws of ExponentsFinal exam: low=15a, med=15b
27/12222%
57/12247%
35/12229%
49/12240%
XXX4/1429%
XXX10/1471%
Observations: In all skills at all levels of difficulty, over 69% of the students could either perform the skill perfectly or with only minor errors. This sample of students had strengths in solving linear equations (without fractions), finding the equation of a line from two points, and simplifying polynomials. If we demand complete accuracy, we see weaknesses in solving linear equations with fractions, finding equations of lines from verbal descriptions, solving linear inequalities, and using the laws of exponents to simplify expressions. In all other skills at all levels of difficulty at least 50% of the students performed the skill without errors.
Action: In an attempt to improve students’ procedural algebra skills, the Teaching Community is experimenting with computer-aided instruction in fall 2003. With the PHIM-2 software, students will be able to choose from a variety of instructional methods, receive immediate feedback, and work problems until they reach mastery (defined as 85% correct in a given problem set). We will see if computer-aided instruction improves students’ skills.
64
Fall 2003: Summative Assessment of Math 25 Finals
Background: Last spring five members of the SP03 Elementary Algebra Teaching Community conducted a holistic assessment of final exams for the Problem-Solving Outcome and procedural skills using a different sampling design, similar exam questions, but a different rubric than this fall. Because of these changes, data gathered this semester (FA03) should be treated as a baseline, rather than used for comparative purposes. This is the first summative assessment of Math 25 finals relative to all five DE Program Outcomes. Twelve instructors (7 full time and 5 part-time) participated in the assessment session this time.
Sampling design: From eight Math 25 sections taught by instructors participating in the Teaching Community, we chose a random sample of 23. Students who took the final but either failed the course (or had no hope of passing before finals were graded) were excluded from the pool.
Method: The Teaching Community wrote a common final exam. Then chose problems on the final to assess each of the five DE Program Outcomes. All outcomes except for the Effective Learner Outcome were assessed using at least four problems or parts of problems.
Technique: Each final exam was assessed holistically relative to each outcome using a rubric written by the Teaching Community earlier in the semester. For each outcome we conducted a benchmarking exercise in which each instructor graded the same paper. We then discussed the scores and reached consensus. Next, for each outcome each final was assessed independently by two instructors. If the two scores differed by ± 1, the scores were averaged. If the two scores differed by more than one level, that student’s work was assessed by a third instructor. The closest two scores were then averaged. Eleven instructors participated in the grading and one facilitated.
Outcome Criteria Final Exam problems
Communication Outcome: Students will read, write, listen to, and speak mathematics with understanding.
Work shownExplanationsUse of vocabulary or notationDefinitions of variables Interpretations: m, intercepts, solutions in context
Final exam # 8, 9b, 10a,b, 11
Problem-Solving Outcome: Students will use mathematical reasoning to solve problems and ageneralized problem solving process to work word problems.
Understanding of problemRight answers with standard methodsUse of general problem-solving processEstimation and checking
Final exam # 10, 11, 12, 14
Multiple Representation Outcome: Students will demonstrate the ability to use verbal, graphical, numerical, and symbolic representations of mathematical ideas.
Interpretation and use of tablesConstruction of tablesLabeling of tablesInterpretation and use of graphsConstruction of graphsLabeling of graphs
Final exam # 7, 8, 9,10
“Skills” Outcome: Students will recognize and apply math concepts in a variety ofrelevant settings and demonstrate the math skills and knowledge necessary to succeed in subsequent courses.
Percent of procedural skills correct or with minor errors
Final exam # 1, 2, 3, 4, 5, 6
Effective Learner Outcome: Students will demonstrate the characteristics of an effective learner.
Complete and on-timeFollows directionsUse of resourcesSelf-assessment
Final exam # 16
65

Summary : See rubric for description of scores
Communication Outcome : stem plot of rubric scores
2| 5 represents an average score of 2.5 rounded to the tenths
Mean 2.8 Standard deviation 1.1 n = 23
Quartiles: 1.5 1.5 3 3.5 5
Problem-solving Outcome : stem plot of rubric scores
2| 5 represents an average score of 2.5 rounded to the tenths
Mean 2.5 Standard deviation 1.1 n = 23Quartiles: 1 1.5 2.5 3.5 5
Multiple Representations Outcome : stemplot of rubric scores
2| 5 represents an average score of 2.5 rounded to the tenths
Mean 2.9 Standard deviation 1.0 n = 23
Quartiles: 1 2 3 3.5 4.3
“Skills” Outcome : stemplot of rubric scores
2| 5 represents an average score of 2.5 rounded to the tenths
Mean 3.3 Standard deviation 0.9 n = 23
Quartiles: 1.5 2.5 3.5 4 4.5
Effective Learner Outcome : stemplot of rubric scores
2| 5 represents an average score of 2.5 rounded to the tenths
Mean 3.1 Standard deviation 1.0 n = 21Quartiles: 1.5 2 3 4 4.5
66
01 5 5 5 5 5 5 82 0 3 53 0 0 0 0 5 5 5 5 5 5 84 85 0
01 0 0 0 5 5 5 8 82 0 0 3 5 5 83 0 0 5 5 5 54 0 55 0
01 0 5 5 52 0 0 0 5 83 0 0 0 5 5 5 5 5 54 0 0 0 0 35
01 52 0 0 3 5 53 0 0 0 0 5 5 5 5 54 0 0 0 0 5 5 5 55
01 5 5 52 0 0 0 5 53 0 0 0 5 5 5 54 0 0 0 5 5 55

Observations:
1. Several instructors reported bimodal results on the final exam, with students either performing very well or very poorly.
2. The holistic assessment showed that students had strengths in finding and interpreting linear models when information was given verbally, numerically, or graphically.
3. Procedural skills do not seem to have improved relative to SP 03, despite the use of CAI. The mean score dropped 0.3 points, but some felt this reflected a difference in the rubrics.
4. For FA 03, students appeared to be stronger in skills taught toward the end of the course.5. For three of the outcomes the mean performance was below 3 = proficient. Does this say
something about the rubric? the difficulty of the exam? our grading standards?
Action Plans: The following suggestions were made verbally or in writing at the end of the assessment activity.
Suggestions for improving student performance:
1. Because student performance was weaker on skills taught earlier in the course (e.g. unit analysis), we need to “recycle” or spiral material more. Activities need to be revised to incorporate more review and homework and class assessments should include review material in a systematic way.
2. Instructors need to work on how to use the activities in class --- the coaching principle.3. Use more CAT’s to assess student understanding after an activity and as an opportunity to
incorporate review.
Suggestions for revising the final exam:
1. Final exam should include more than one problem requiring students to graph. Assessment of student ability to graph in problem (#7) was confounded because it was in the context of solving a system of equations.
2. In general, directions should be clarified by use of bold type or capitalization for key instructions, e.g. #9b Find the slope AND the intercept or #7 Solve the system by GRAPHING.
3. Final should include a problem that requires students to label and scale graphs.4. #8c should include “and state the solution”.5. Reformat #7. Many students were confused because the system of equations was written
horizontally.
Suggestions for revising the rubric:
1. The rubric and the criteria for the Multiple Representation Outcome focus on two prongs (numerical and graphical). Rewrite these to include the symbolic and verbal prongs.
2. The proficient and excellent levels for the Multiple Representation Outcome part of the rubric are too close. Revise these levels.
3. Include “% correct” in levels for the Multiple Representation Outcome.4. Levels for the Problem Solving Outcome are too high.
Suggestions for improving the holistic assessment session:
1. Decide what to do if a problem is left blank or no work is shown to support an answer. Should this lower the score for the outcome or should we disregard these problems in some outcomes (e.g. N/A)?
2. Discuss the validity of using the final exam as the sole source of assessment conclusions. Finals are timed situations during a week when students are overwhelmed with academic obligations. In this setting do we get an accurate snapshot of what they know and can do?
67

Fall 2003: Summative Assessment of Math 25 Finals
Instructor feedback on Assessment Session: n = 11 (6 full time, 5 part-time instructors)
m
ean
Not
Som
ewha
t
Ver
y
1. How experienced are you with criteria-based grading? 2.9 11
9%
22
18%
35
45%
43
27%
50
2. Are you interested in future staff development on designing and using criteria-based grading in the classroom?
4.3 10
20
32
18%
44
36%
55
45%
3. To what extent is the rubric consistent with your definition of proficiency in the five DE outcomes for the Math 25 student?
Comments: Levels in PS rubric are too high.Levels 3 and 5 in MR not differentiated enough and missing 2 prongs.My EL rubric is nonexistent.
3.9 10
20
32
18%
48
73%
51
9%
4. Assuming algebra instructors read the results from today’s activities, how useful do you think the information gathered today will be in improving teaching and learning in Elementary Algebra?
Comments: I think instructors need to experience staff development to see the benefits.Extrapolate?
3.8 1 2 34
36%
45
45%
52
18%
5. Rate the future importance of these types of assessment activities to the Math DE Program.
4.5 1 2 31
9%
44
36%
56
55%
Other comments and feedback:
This type of exercise should be mandatory for all staff because of the insights I made from my colleagues and how this affected my grading. This should be done in all course committees with the final exam questions. This kind of activity will be very useful when we do program and course assessment.Thank you for the invite and all the prep work to make the day very informative and a learning experience.The holistic grading method is new to me but very useful. I learned a lot about how other people are doing things. I intend to use some of these methods in future courses.You are on the right path to improving student learning.Good job Myra. Several questions on the test need to be re-written/edited.You did a phenomenal job, again, Myra. I might suggest we keep looking at the same four exams so that we become familiar with the tests, since we look at the same questions for different criteria.
68

Elementary Algebra Teaching Community Fall 2003Instructor Assessment of Teaching Community: Summary(9 of 9 instructors responded)
1. Has participation in the Teaching Community impacted your teaching? If so, how? Please give examples.
If not, why not? Please give suggestions for future staff development activities that would be more relevant to your interests.
The Teaching Community has extremely influenced my Elementary Algebra instruction, more this semester than last semester. The activities were not only high level but downright fun. Instead of crowding algebra with useless info, we focused on some crucial areas only (less is best). Next semester I plan to use the activities again at Brentwood and Solano (my algebra is there in the spring).
Yes --- more emphasis on outcomes; collaborative quizzes and exams --- a good thing!; activities --- still need some work on effectiveness; content issues --- good to discuss what to cut out.
Yes! I used to teaching elementary math using lecture/practicing format. I lectured new ideas, new concepts, new skills, then students practiced what’s lectured. Since I join the TC, I learned other means and wasy of teaching. Activity based teaching and learning allows students to “discover” the math and puts math in context. Students learn to solve problems in real life world.
The Math 25 Teaching Community has impacted my teaching greatly. As a young instructor I have rarely been given the opportunity to collaborate with other instructors. It was a forum in which there was a collective approach to creating the lesson plans. I learned quite a bit about improving group work exercises and computer aided instruction as well. Finally, I was able to forecast problems that I would potentially face through the instructors in the teaching community. After being part of the teaching community I feel that my classroom has more balance than it did before.
Yes, my participation has positively impacted my teaching because more and more I am teaching with the end in mind. That is, teaching with the DE outcomes as my main emphasis, particularly having activities for the effective learner outcome. The teaching community has developed excellent classroom activities that are designed to accomplish those goals. Staff development in designing activities that address the outcomes is essential and necessary to help guide instructors to teaching to the outcomes. Student success in these outcomes becomes by design and not by chance.
It was a very positive experience. Exchanging ideas on curriculum and pedagogy improved my own teaching and the quality of my students’ classroom experience. Working backwards from the objectives to the assessment instrument to the curriculum and activities to the instructional strategies really helped me and my students. I don’t think I could have weathered the Phim2 problems without the support and help of the teaching community. Also the curriculum developed by other instructors in the teaching
69

community (esp. effective learner and problem solving) opened new doors for me. Finally, Myra and George are very inspirational and working with them twice a week was great.
Definitely. Being part of a teaching community allowed me to hear and learn from other instructors who were trying similar things in the classroom. It helped me see other ways to accomplish the same goals and helped me define exactly what I wanted to accomplish. For example in prior algebra courses I knew I wanted my students to know how to work through the main procedures of the course, I didn’t realize the importance or the capability of them learning the applications. Working in the community has raised my standards both of what students can learn and what I can teach. Using the classroom activities and the comments from our discussions, I was able to actually guide my students in solving problems rather than just going through a step by step process to get a right answer.
Yes, this semester I spent much more class time on DE outcomes, and relegated almost all procedural material to PHim2. (I think I went overboard.) I changed a number of content objectives, based on TC discussions. I would not have used CAI if not for the TC.
Yes definitely. This semester I focused on incorporating the DE Outcomes into Elementary Algebra. In the past my lesson planning in algebra was often based on a series of examples with the goal of teaching a procedural skill and basic template applications. This semester I worked backwards from the objectives and DE Outcomes that were stated in the unit plans when designing my lessons. The resulting lessons demanded from the students higher levels of critical thinking and problem solving as well as communication. I used all of the Teaching Community’s classroom activities and PHim2 computer-aided instruction. My students enjoyed and benefited from the variety of teaching methods encouraged by the Teaching Community (e.g. CAI, group work, student presentations of problems, quick CATs).
Other comments and suggestions:
I think that the teaching community would be even better if there was one dedicated to Math 25AX and Math 25BX as well as Math 25. It was fine the way it was but, some issues in the Math 25 TC would not have impacted my Math 25AX course.
I would love to have seen an actual teaching demonstration. Although I could have arranged this on my own, maybe arranging for the teaching community participants to sit in on a class of one of the experienced teachers would be helpful.
I like starting with exams and working backwards to designing activities. However, I felt that this semester’s activities were not always well-aligned with exams.
70

2. This semester in Teaching Community we used computer-aided instruction for the first time and class-tested a lot of new activities, homework problems, and exams. Our work was based on the hypothesis that the use of computer-aided instruction to teach procedural algebra skills would provide more class time for instructors to work on problem-solving and the other DE program learning outcomes. The activities were designed to teach the “why” behind the “how” in order to foster conceptual understanding and to provide a variety of applications in order to motivate students and help them transfer the algebra to settings outside of the classroom.
Approximately what percentage of the activities did you use?
Please use your classroom experiences this semester to comment on the validity of our working hypothesis. What changes do you think the Teaching Community should make as it continues to investigate student learning in elementary algebra?
100% My previous teaching experience has been 90% how , 10% why. This semester it was probably about 20% how, 80% why. Needless to say, its been a complete change in my philosophy for effective teaching. It certainly made the course more rich, although I realize there were several students who probably would have preferred more “hand-holding”, but I resisted. I’m still not completely convinced that Phim2 fully taught them the procedures however. If I were to use Phim2 again, I’d probably lecture for 30 minutes on the procedures, then quizzing, and group activities. Sometimes I think the student missed watching me simply solve some problems.
60% The computer-aided instruction did not work for all students --- perhaps 50%. I think a more “blended” version might work with my style --- I might try to accommodate different learning styles of students. Or, use computers as a supplement. I think using “mastery” exams for certain topics is a good idea.
Over 60%
Through the activities done for linear equations, students learn to interpret the meaning of slope and y-intercept in real world application. Students realize how algebra is used in the real world.
75-85%
At first, I thought that the introduction of so many new things at once was a mistake. I think the problems with the computer software at the beginning turned me off the idea of depending on the computer alone to teach the procedural skills. I opted to assign homework problems out of the book, discuss some of them in class, and use the classroom exercises as supplementary material. I think things may have worked out ok because the Math 25AX course contained only half of the material the TC addressed. The classroom activities worked well but some were too long to fit in the time frame of a 50 minute 8:00 am course. I think if the teaching community designed a more structured pace chart that pertained to both 3 session courses and 2 session/week courses it would be nice.
95% If you examine the interaction among students using the activities, you would be able to conclude that it is valid.1. Continue to modify and refine the activities and the assessment instruments 2. Continue staff development for the effective learner outcome
95% I think the hypothesis is a great idea but my implementation needs to be improved. Students really need to keep up with the computer skills in order for the classroom activities to be effective. I need to increase my communication about the importance of both parts of the class. Even with these first-run issues, I believe my current Math 25 students have learned a lot more algebra and are more powerful math students than my previous semesters’ Math 25 students.
95% Allowing the computer to teach the procedures is a good concept. Once the kinks were
71

out of PHIM2 things went a lot smoother. This was new to me so in hindsight I need to improve on making the connection between the procedures and the classroom activities. Most of the activities did fairly well, but I think it was important for students to hear me make the connection and validate the importance of both. I also needed to improve on checking for understanding. It was a little difficult to balance the time between verifying their understanding of the procedures and classroom activities, especially since during any given day one student could have finished the appropriate lesson and another would only have time on the weekend to go through it. I did pick up some ideas in the teaching community though.
90% Students liked the activities and the DE goals; they felt they were relevant. However, students tended not to see the link between PHim and activities, and often felt PHim (procedural) material was irrelevant. We need better links between PHim and activities.
100% My experience supports the validity of this working hypothesis. I followed the TC’s pace chart and sequencing. Students first encountered procedural skills on the computer, where they practiced with immediate feedback and then had the option to take section posttests until they reached mastery. Afterwards, they worked on group activities where they practiced and applied the skills. Despite early problems with PHim in the CML, CAT’s demonstrated that students were learning procedural skills from the computer and had the same predictable areas of difficulty that my students have had in the past. All but a handful of my students really enjoyed working on the computer. Only this time I had more time to investigate and respond to their difficulties because topics were essentially covered twice, first with PHIM and then with greater depth in class. I was surprised that students for the most part did not have trouble learning procedural skills on their own from the computer; however, sections that focused on applications were very difficult for students to tackle without prior introduction in the classroom. Next time, I will either remove these sections from the e-syllabus or have the classroom activity precede the PHim section. I definitely had a lot more time to focus on DE outcomes and conceptual development of ideas than I have had in the past. In the future we need to discuss the relevance of some of the procedural skills learned in algebra and either quit requiring them or work the requisite skills more consistently into meaningful activities.
3. Have you taught Elementary Algebra before? YES NOIf yes, how did your students’ performance this semester compare to previous
semesters? What do you think accounts for the differences?
Yes First, if I were to give our exams to my other algebra classes (Delta, etc.), they would surely do miserably. Those that truly participate in the activities/Phim 2 I think learned a great deal. Whether or not they will retain the info is always questionable. But I do feel that this has been one of my top classes in a while. They’re always anxious to see their next activity! I don’t recall another algebra class that was actually turned on. Regardless of Phim2, the higher expectations placed on the students fostered higher achievement. Even though the exams were fairly hard for nearly the entire class, I was constantly impressed with their aggressiveness in attempting to solve problems.
Yes Depends on what you mean by “performance”. Too many variables --- changes this semester. I don’t feel that performance was better.
Yes More critical thinking. Better prepared to solve real world problem.Yes I have taught elementary algebra 3 times using 3 different books. The students in Math
25AX course seem to be at the same level. My class is small (7). The students with learning disabilities enjoy the group work, but still do not seem to master the basic skills. The advanced students (3) enjoy the group work, but finish very quickly. I feel that they may have been able to realize some of the objectives without the activities. The middle students were a little harder to read. There may have been some understanding gained
72

from doing the group activities.Since I am doing Math 25AX this semester, it is hard for me to compare student performance. My impressions are that my current 25AX students are not performing as well as my previous Math 25 students.
Yes See also #2 [Even with these first-run issues, I believe my current Math 25 students have learned a lot more algebra and are more powerful math students than my previous semesters’ Math 25 students.] There are some skills that my current [Math] 25 students haven’t learned that previous 25 students did. However, the current students are much better problem solvers with a higher degree of sophistication in both their critical thinking skills and their mathematical communication.
Yes I think this is a difficult question for me to answer. Even though the ‘where I want them to be at the end of the semester’ didn’t change, the whole approach on how to get them there did change. Students from previous semesters performed well based on what I was looking for (for them to learn the procedures I was teaching in the classroom). Students from this semester performed well based on what I was looking for (for them to learn the procedures using PHIM and learn to work through the class activities). I don’t know if I’m making much sense…
Yes More drops, especially during the first month. Those who stayed did better. However, overall success was down. I think that many students dropped because of PHim identity problem and the confusion that it generated. Those who remained did more HW than usual, perhaps because PHim helped, or perhaps because all the weak students already dropped.
Yes This semester I had a few more drops before the WX than usual, but more students successfully completed the course and I had a higher success rate. As in most of my developmental classes, I had students with attendance problems. But with CAI, they were able to get instruction outside of the class and keep up with the procedural skill objectives. In the past they would have fallen irretrievably behind and failed. This semester they kept a C. The level of class discussion and substantive interaction in groups far exceeded by previous classes. I think this was because of the quality of the activities and because they had learned skills on the computer that they were interested in sharing with each other.
4. This semester we spent quite a bit of time “designing backwards.” We discussed learning outcomes and content objectives, then wrote homework assignments, group quizzes, and exams to measure those outcomes. We constantly checked to make sure that activities “taught to” the expectations of the exams.
1. Approximately what percentage of the exams did you use?2. Approximately what percentage of the unit homework problems did you use?3. Approximately what percentage of the group quizzes did you use?4. Was this “designing backwards” a new approach for you? YES NO 5. Do you plan to continue this practice? Why or why not?
#1 #2 #3 #4 #5100
67 100
Yes Yes, next semester I’m planning on using all of our material, but on the exams I’m going to put a few strictly procedural problems into each. I’m probably just going to expand a bit on the activities. Since I won’t be using Phim 2 (might be a mistake), I will certainly need to do some procedural lectures, taking time away from the group activities.
100
50 100
No Yes --- it is a good idea.
73
100
50 67 Yes Yes --- because it works.
100
100
0 Yes Possibly, if time permits, I will design backwards because I think this is the best way to teach objectives that are predefined. There is a time factor that will be hard to deal with unless I have the aid of a teaching community.
100
100
100
No
100
100
100
Yes/no
Yes and no. This [designing backwards] has been my strategy but I’ve never been able to implement it as well or as organized as we did this semester. It was great!Definitely [will continue] --- because it makes the most sense pedagogically and for a math program. Teach to the objectives not to the book should be our collective and individual goal. It’s also best for students because objectives and expectations are clearly laid out and they become truly prepared for their next math/science/etc. course.
100
25 100
No Yes. It only makes sense to have a good understanding of where you want your students to be before you plan on how to get them there. It seems pretty obvious that you set the goals first and then design a plan of action. How come I didn’t think of this ?
100
50 0 No Yes. I feel better organized this way.
100
100
100
Yes/no
I have always completed a pace chart at the beginning of the semester tailored to the course outline’s content objectives, but I have never worked backwards from a set of broad learning outcomes. I plan to continue this practice because it keeps me focused on the big goals for the course. I am not as concerned about every nuance in procedural skill and more concerned about a student’s ability to use key concepts in new settings.
5. Rank the following activities on a scale of 1 to 5 with 1 = very helpful, 3 = neutral, 5 = a waste of time.
1411%
2333%
3222%
40
50
Mean1.8
Pre-semester training on Phim2
1111%
2667%
3111%
4111%
50
Mean2.2
Discussion of advising and placement (basic skills assessment, course descriptors and flowchart, advising tips, etc.)
1667%
2222%
3111%
40
50
Mean1.4
Discussion of the unit plans (learning outcomes and objectives for each unit), aligning activities, quizzes and exams with unit plans
1667%
2333%
30
40
50
Mean1.3
Writing exams (discussing “reaction” exams and using common exam questions)
1556%
2333%
3111%
40
50
Mean1.6
Providing feedback to the Math 25 Committee on Course LearningOutcomes and discussion of the common part of the final exam
1778%
2222%
30
40
50
Mean1.2
Writing and discussing class activities
1333%
2444%
3222%
40
50
Mean1.9
DE Outcomes Levels discussion: minimum level of achievement for the C-student at the end of the course
1 2 3 4 5 Mean Discussion of the new course outline for Math 25
74

333%
222%
444%
0 0 2.1
1111%
2333%
3444%
4111%
50
Mean2.6
Discussion of the Effective Learner Outcome (interview project, Resource Assignments, etc.)
1111%
2778%
3111%
40
50
Mean2
Discussion of the Communication Outcome (facilitation techniques, a rubric to communicate criteria to students, ways to improve quality of student work on this outcome)
1444%
2222%
3333%
40
50
Mean1.9
Discussion of criteria and definition of proficiency for five DE criteria
6. Participants in the Teaching Community wrote the following goals at the beginning of the semester. Rate how well the Teaching Community met these goals.
1 = thoroughly met the goal, 3 = satisfactorily met the goal, 5 = did not meet the goal
10
2222%
3444%
4111%
5222%
Develop CAT’s that assess the DE Program Outcomes – quick to give, quick to check
1333%
2444%
3222%
40
50
Smoothly integrate DE Outcomes into class activities (“blending” of DE Outcomes and math content)
1111%
2222%
3444%
4222%
50
Explore the integration of CAI and lecture/discussion (“blending” ofPhim-2 and conceptual work in class)
1222%
2333%
3222%
4222%
5 See if CAI will provide more student contact.
1444%
2222%
3222%
4111%
50
Develop effective and integrated lesson plans and class activitiesrelevant to life and the DE Outcomes.
Fall 2003: Elementary Algebra Student Satisfaction Survey: Summary
Sampling design: Math 25 and Math 25AX instructors who participated in the Elementary Algebra Teaching Community during Fall 2003 were asked to distribute surveys to their students during the last two weeks of the semester. Eight of the nine instructors returned surveys.
Sample size: 99
1. This semester we used a variety of instructional methods in Elementary Algebra. Rate each method on a scale of 1 to 5 where 1 = not important to my learning, 3 = somewhat important to my learning , 5 = very important to my learning, N/A not applicable because not used.
n = 99 for this question
Not
im
porta
tnt
Som
ewha
t im
porta
nt
Ver
y im
porta
nt
mea
n
16%
27%
324%
424%
534%
N/A4%
3.8 Computer-aided instruction: using Phim2 to learn procedural skills
1 2 3 4 5 N/A 4.5 Mastery-based learning: chance to redo Phim2 posttests to reach 85%
75

3% 1% 7% 20% 65% 3%
15%
210%
331%
420%
532%
N/A3%
3.6 Studying the textbook
11%
22%
311%
420%
565%
N/A0%
4.5 Short lectures or presentations by my instructor
10%
23%
39%
421%
565%
N/A0%
4.5 Class discussions of problems and concepts
12%
23%
316%
428%
546%
N/A4%
4.2 Group activity worksheets
15%
20%
313%
427%
549%
N/A5%
4.2 Group quizzes
110%
214%
323%
427%
521%
N/A3%
3.4 Effective Learner Resource Assignments (study skills inventory, etc.)
2. Indicate whether your experience in algebra would be improved by MORE, SAME, or LESS of the following.
n = 92 for this question
More Same Less Computer-aided instruction: using Phim2 to learn procedural skills39% 43% 17%
More Same Less Mastery-based learning: chance to redo Phim2 posttests to reach 85%46% 45% 10%
More Same Less Studying the textbook40% 43% 16%More Same Less Short lectures or presentations by my instructor62% 36% 2%
More Same Less Class discussions of problems and concepts60% 37% 3%
More Same Less Group activity worksheets48% 46% 7%
More Same Less Group quizzes41% 49% 10%
More Same Less Effective Learner Resource Assignments (study skills inventory, etc.)27% 45% 28%
3. Did you attend class regularly and fully participate in group activities? YES NO
If YES, rate the group activity worksheets on a scale of 1 to 5 where 1 = not at all, 3 = somewhat, 5 = very much
n = 94 for this question; responses from students who answered NO were excluded
76

Not
at a
ll
som
ewha
t
Ver
y m
uch
mea
n
10%
23%
323%
436%
537%
4.0 The group activity worksheets stimulated my thinking.
11%
22%
330%
426%
541%
4.0 The group activity worksheets helped me understand how to apply algebra to a variety of settings.
11%
26%
323%
437%
532%
3.9 The group activity worksheets helped me understand the concepts, i.e. helped me see the “why” behind the “how” of algebra.
12%
26%
316%
434%
541%
4.1 The group activity worksheets helped prepare me for the unit exams.
4. Did you attempt the Unit Homework Problems? YES NO If YES, rate the Unit Homework Problems on a scale of 1 to 5 where 1 = not at all, 3 = somewhat, 5 = very much
n = 88 for this question; responses from students who answered NO were excluded
Not
at a
ll
som
ewha
t
Ver
y m
uch
mea
n
11%
20%
322%
439%
539%
4.1 The Unit Homework problems stimulated my thinking.
11%
25%
326%
438%
531%
3.9 The Unit Homework problems helped me understand how to apply algebra to a variety of settings.
11%
25%
318%
435%
541%
4.1 The Unit Homework problems helped prepare me for the unit exams.
5. Rate your learning and development relative to the five outcomes below. Use a scale of 1 to 5 with
1 = no improvement, 3 = some improvement, 5 = a lot of improvement.
n = 96 for this question
No
impr
ovem
ent
Som
e im
prov
emen
t
A lo
t of
impr
ovem
ent
mea
n
12%
24%
334%
439%
521%
3.7 Outcome 1: Students will read, write, listen to, and speak mathematics with understanding.
77

12%
22%
336%
439%
521%
3.7Outcome 2: Students will use mathematical reasoning tosolve problems and a generalized problem solving processto work word problems.
13%
24%
332%
436%
524%
3.7Outcome 3: Students will demonstrate the ability to use verbal, graphical, numerical, and symbolic representations of mathematical ideas.
12%
21%
330%
445%
522%
3.8Outcome 4: Students will recognize and apply math conceptsin a variety of relevant settings and demonstrate the math skillsand knowledge necessary to succeed in subsequent courses.
12%
23%
326%
436%
532%
3.9Outcome 5: Students will demonstrate the characteristics of an effective learner.
78


![Informe Tecnico Sobre Construcciones de Viviendas en El PN Medanos de Coro[1]](https://img.pdfslide.net/doc/110x75/5571fc7d4979599169975b0c/informe-tecnico-sobre-construcciones-de-viviendas-en-el-pn-medanos-de-coro1.jpg)