Embed Size (px)
Citation preview

Journal of Experimental Political Sciencehttp://journals.cambridge.org/XPS
Additional services for Journal of Experimental Political Science:
Email alerts: Click hereSubscriptions: Click hereCommercial reprints: Click hereTerms of use : Click here
Losing Hurts: The Happiness Impact of PartisanElectoral Loss
Lamar Pierce, Todd Rogers and Jason A. Snyder
Journal of Experimental Political Science / FirstView Article / October 2015, pp 1 - 16DOI: 10.1017/XPS.2015.8, Published online: 12 October 2015
Link to this article: http://journals.cambridge.org/abstract_S2052263015000081
How to cite this article:Lamar Pierce, Todd Rogers and Jason A. Snyder Losing Hurts: The HappinessImpact of Partisan Electoral Loss. Journal of Experimental Political Science,Available on CJO 2015 doi:10.1017/XPS.2015.8
Request Permissions : Click here
Downloaded from http://journals.cambridge.org/XPS, IP address: 128.103.193.216 on 13 Oct 2015
Journal of Experimental Political Science, Page 1 of 16doi:10.1017/XPS.2015.8
Losing Hurts: The Happiness Impact ofPartisan Electoral Loss
Lamar Pierce,∗ Todd Rogers† and Jason A. Snyder‡
Abstract
Partisan identity shapes social, mental, economic, and physical life. Using a novel dataset, westudy the consequences of partisan identity by examining the immediate impact of electoralloss and victory on happiness and sadness. Employing a quasi-experimental regressiondiscontinuity model we present two primary findings. First, elections strongly affect theimmediate happiness/sadness of partisan losers, but minimally impact partisan winners.This effect is consistent with psychological research on the good-bad hedonic asymmetry,but appears to dissipate within a week after the election. Second, the immediate happinessconsequences to partisan losers are relatively strong. To illustrate, we show that partisans areaffected two times more by their party losing the 2012 U.S. Presidential Election than bothrespondents with children were to the Newtown shootings and respondents living in Bostonwere to the Boston Marathon bombings. We discuss implications regarding the centrality ofpartisan identity to the self and its well-being.
Keywords: Partisanship, political psychology, happiness, elections, identity, well-being,Obama.
How important is partisan identity to happiness? It might be of considerableimportance to the two-thirds of Americans who identify with a political party, givenits powerful influence on other dimensions of people’s lives. Partisan identity is stableacross people’s lifetimes (Campbell et al. 1960; Green et al. 2002), causally shaping
The authors thank John Dick, Ross McGowan, and Zack Sharek at CivicScience, Inc. for providingthe data, as well as Craig Fox, Francesca Gino, Eitan Hersh, Karim Kassam, Marc Meredith, BrendanNyhan, Mike Norton, Erik Snowberg, and Kathleen Vohs for thoughtful comments and suggestions.Carly Robinson provided excellent research assistance.
Pierce and Snyder are advisors for the data provider for five years and hold small equity stakes. Thedata were provided without conditions and are freely available for replication. Authors contributedequally and are listed alphabetically.∗Olin Business School, Washington University in St. Louis, One Brookings Drive Box 1133, St. Louis,MO 63130, USA, e-mail: [email protected]†Harvard Kennedy School, Mailbox 124, 79 JFK Street, Cambridge, MA 02138, USA‡Anderson School of Management, UCLA, 110 Westwood Plaza, Cornell Hall, Suite D506, Los Angeles,CA 90095, USA
C© The Experimental Research Section of the American Political Science Association 2015

2 The Happiness Impact of Partisan Electoral Loss
political preferences and the factual qualities people associate with policies (Cohen2003). People more frequently live near (Gimpel and Schuknecht 2004; Glaeser andWard 2006) and interact with (Gentzkow and Shapiro 2011) those who share theirpartisan identity than with those who do not. Furthermore, partisan identity tendsto define media consumption (Prior 2007) and other economic behavior (Gerberand Huber 2009), and can bias social perceptions and favoritism (Caruso et al. 2009;Rand et al. 2009). In short, social, mental, economic, and physical life is shaped bypartisan identity.
Given this importance, political outcomes such as the 2012 U.S. PresidentialElection could profoundly impact the happiness of both partisan winners(Democrats) and partisan losers (Republicans). This research uses a novel datasetthat tracks fluctuations in happiness and sadness to address two questions aboutthe importance of partisan identity to well-being. First, are the shocks to happinessfrom winning and losing equivalent? Diverse research suggests they might not be.Bad events cause stronger reactions than comparable good ones (Baumeister et al.2001; Rozin and Royzman 2001), similar to predictions from prospect theory’s valuefunction about the gain-loss asymmetry (Kahneman and Tversky 1979; McDermott2004).
Second, how strong is the shock of partisan loss to happiness? We comparethe well-being consequences of partisan loss to that of two national tragediesthat dominated the national news media for weeks. On December 14, 2012,20 children and 6 adults were fatally shot at Sandy Hook Elementary Schoolin Newtown, Connecticut (“Newtown shootings”). On April 15, 2013, threepeople were killed and 283 injured after terrorists attacked the Boston Marathon(“marathon bombings”). While such tragedies are qualitatively different thanelections, comparing their well-being consequences to that of partisan loss illustratessimply the relative importance of the partisan identity to well-being. Tragedies haveboth political repercussions (Gillis 1996) and elicit emotional, financial, and civicresponses from people not directly affected by the trauma (Preston and De Waal2002; Singer et al. 2004). Consequently, one might sensibly expect the hedonic(happiness-based) impact of partisan loss to pale in comparison.
Using daily responses from CivicScience, Inc., an online polling and dataintelligence company, we employ a quasi-experimental regression discontinuity(RD) design to estimate the happiness shock of specific events. The RD designovercomes many of the sampling bias problems in survey-based studies of happinessby focusing on nearly identical respondents immediately before and after anindependent shock (Imbens and Lemieux 2008; Shadish et al. 2002).
We find that the pain of losing an election is much larger than the joy of winningone, but that this happiness loss is short-lived. Election outcomes strongly affect theshort-term happiness/sadness of partisan losers, with minimal impact on partisanwinners. This result is consistent with studies finding that “bad emotions, badparents, and bad feedback have more impact than good ones . . . bad information isprocessed more thoroughly than good . . . [and] the self is more motivated to avoid

L. Pierce et al. 3
bad self-definitions than to pursue good ones” (Baumeister et al. 2001). Despitethe strength of the loss, happiness appears to recover within a week, consistentwith research on people’s tendency to adapt to bad events more quickly thanexpected (Gilbert et al. 2004). This temporariness suggests partisan loss impairsemotional well-being rather than broader life satisfaction (Kahneman and Deaton2010).
The short-term strength of partisan loss is contrasted with responses to massnational tragedies; partisans are affected twice as much by their candidate losingthe U.S. Presidential Election than both respondents with children were to theNewtown shootings and respondents in Boston were to the marathon bombings.The fact that the pain experienced by partisan losers is stronger than that of peoplefor whom the tragedies were self-relevant benchmarks the centrality of partisanidentity to the self and well-being.
METHOD
Data
CivicScience polls over 300,000 unique individuals daily across the United Stateson over 500 third-party websites. Unpaid volunteers answer three questions inembedded polls. Tracking technology allows the company to identify returningrespondents across all partner websites, thereby collecting a panel of detaileddemographic and attitudinal data for many respondents. One question that israndomly and continuously distributed across all partner websites each day asks“How happy are you today – very happy, happy, so so, unhappy, or very unhappy?” Thisquestion is similar to one used in the Euro-Barometer Survey Series and the UnitedStates General Social Survey––widely used to study happiness in economics (Alesinaet al. 2004; Argyle 2003; Di Tella et al. 2003; Easterlin 2003, 2006). Consistent withthe prior literature, we create an indicator variable “happy” equal to 1 if respondentsreported being happy or very happy.1
CivicScience also collects extensive socio-demographic information (e.g., gender,income, race, age, and partisan identity) in a pre-determined sequence from returnrespondents over multiple visits to partner websites. We had access to data onall respondents who had answered the happiness and sadness questions, butnot all of these respondents answered all socio-demographic, party affiliation,and parental status questions. For example, for the week before and after theelection approximately 67% of respondents with happiness responses and fullsocio-demographic data had answered the partisan identity question; 85% ofsuch respondents from the week before and after Newtown had answered the
1This dichotomized variable is easier to interpret and more meaningful than a 1–5 scale assuming eachunit change is equal. Tables S7A and S7B in the supplementary materials present similar results with thescaled dependent variable.

4 The Happiness Impact of Partisan Electoral Loss
.2.4
.6.8
1P
erce
ntag
e in
dica
ting
that
they
are
hap
py to
day
-7 -6 -5 -4 -3 -2 -1 0 1 2 3 4 5 6Days before and after election
First day after 2012 election
Intervals represent± 1.96 standard errors
DemocratsRepublicans
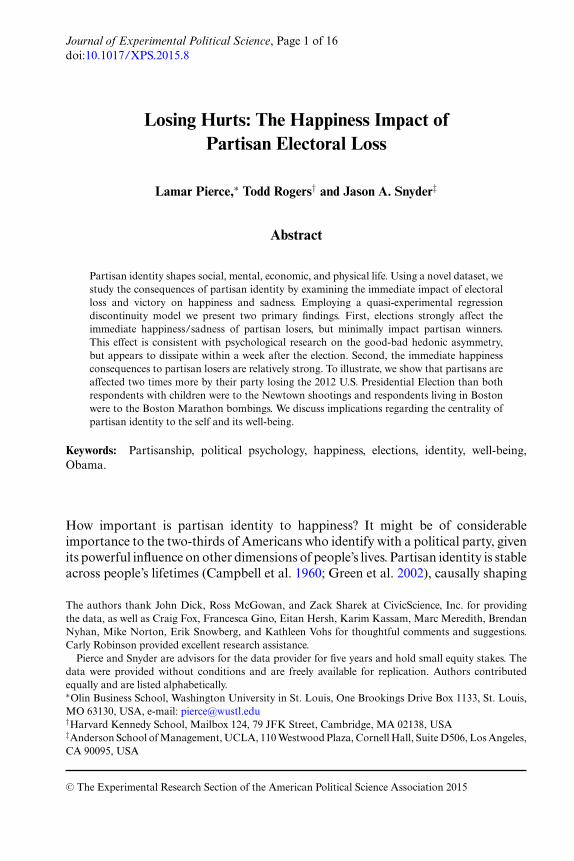
Figure 1Self-Reported Happiness one Week Before and After the Election
parental status question. Missing responses for each question yields a sparse datamatrix, which makes imputing missing data very unreliable. We therefore, restrictthe data for each analysis to the respondents for whom there are no missingobservations.
CivicScience asks “Politically, do you consider yourself more of a: Republican,Democrat, or Independent?” Like all surveys, the sample of these individualsis conditioned on the decision to participate in repeated CivicScience polls.CivicScience respondents were somewhat more Republican than the generalpopulation. We are unable to observe data on which respondents chose not toanswer specific questions. Figure 1 previews our core results. During the two weekssurrounding Election Day, an average of 210 Republicans and 111 Democratsanswered an online happiness question each day. Notice the little change in thelikelihood that Democrats report being happy, while immediately following theelection Republicans’ self-reported happiness drops from approximately 60% to30%. These data are collected with enough frequency that daily shocks can be clearlyidentified, a feature unique to most research on happiness. We note, however, that ourmodels’ key identifying assumption is that the sample is similar before and after theelection. Additionally, given the self-selection and uneven geographic distributionof the sample, one must be careful in extrapolating specific effect magnitudes to thegeneral population. Finally, we note how days are coded. Across all studies, we codedays as being 24-hour periods immediately preceding and following focal events.For instance, the 2012 presidential election was called by the Associated Press atapproximately 11 PM EST on Election Day, so the previous day began at 11 PMEST the day before Election Day.

L. Pierce et al. 5
Model
We use quasi-experimental RD models to test how the happiness levels of Democratsand Republicans discretely change immediately following the presidential election.RD models assign observations to treatment and control groups based on a discretethreshold in a continuous assignment variable, which in our case is time (days).The discrete threshold is the focal event (e.g., Election Day or day of the tragedy).Any response after the focal event threshold is considered “treated,” while priordays are in the “control.” RD models are most commonly used in political science,economics, and psychology (Dal Bo et al. 2009; Gerber et al. 2011; Hersh 2014;Pierce et al. 2013; Snyder 2010), with many examples applying RD models to timeseries data, as we do (Busse et al. 2006; Pierce and Snyder 2012).
RD models assume that observations just above and below the threshold areidentical on all dimensions except the focal treatment. Table S1–S3 provides detailedevidence that respondents one week before and after the three events in our dataare reasonably identical on observable dimensions. Simple t-tests of differences inpre/post means reveal few systematic demographic differences, nor do RD modelsthat replace Happiness with each demographic as the dependent variable in Equation(1) below. Our base specification is as follows at the individual-level respondent:
Happinessi =∝ +β1 ∗ PostEventi + β2 ∗ Linear Time Variablei
+ β3 ∗ PostEventi ∗ Linear Time Variablei + εi (1)
Linear Time Variable runs from −7 to 6, where 0 is the day immediately followingthe focal event. PostEvent is an indicator equal to 1 if the event has already occurred.Figure 2 illustrates this specification for Republican respondents’ happiness inrelation to the election. β1 estimates the discrete jump between the two regressionestimates. β2 is the slope prior to the election and β3 is the slope after the election.This specification therefore estimates the size of the break while controlling for thedifferent time trends before and after the event. Other specifications include socio-demographic characteristics and higher order time polynomials for robustness. Allresults are clustered at the MSA level.
To test the persistence of the happiness effect, a second model relaxes the RDassumption to examine weekly happiness rates for Republicans and Democrats,conditioning on socio-demographic information and location. Although this modelprovides some evidence of effect persistence, we cannot observe the counterfactualtime trend in weeks distant from Election Day. Any inference about effect lengthmust assume that happiness would return to pre-election levels absent the election’seffect.
Happinessi =∝ +β1 ∗ Week Indicatorsi + β2 ∗ Socio Demographic Controls + εi
(2)

6 The Happiness Impact of Partisan Electoral Loss
Table 1(a)Democrat Happiness One Week Surrounding 2012 Election
Dependent variable: Are you happy today?
Independent variables (1) (2) (3) (4) (5)
Post-election 0.039 0.033∗ 0.037 0.049 0.084(0.049) (0.019) (0.047) (0.052) (0.137)
Post-election∗One degreepolynomial of days
No No Yes Yes No
Post-election∗Three degreepolynomial of days
No No No No Yes
Socio - Demographic& MSA Controls
No No No Yes Yes
Sample Democrats Democrats Democrats Democrats DemocratsTime restriction +/− one day +/− one week +/− one week +/− one week +/− one weekObservations 265 1,553 1,553 1,553 1,553
Table 1(b)Republican Happiness One Week Surrounding 2012 Election
Dependent variable: Are you happy today?
Independent variables (1) (2) (3) (4) (6)
Post-election − 0.310∗∗∗ − 0.151∗∗∗ − 0.243∗∗∗ − 0.246∗∗∗ − 0.316∗∗∗(0.040) (0.016) (0.035) (0.039) (0.096)
Post-election∗One degreepolynomial of days
No No Yes Yes No
Post-election∗Three degreepolynomial of days
No No No No Yes
Socio - Demographic& MSA Controls
No No No Yes Yes
Sample Republicans Republicans Republicans Republicans RepublicansTime restriction +/− one day +/− one week +/− one week +/− one week +/− one weekObservations 465 2,934 2,934 2,934 2,934
Note: Samples in Table 1(a) include only Democrats, while those in Table 1(b) include only Republicans.∗ , ∗∗ , and ∗∗∗ indicate significance at the 10%, 5%, and 1% confidence levels, respectively. Standard errors are clustered at the Metropolitanlevel. Socio-demographic controls include gender, age indicators, race indicators, and income indicators. MSA controls included indicatorsfor the metropolitan statistical area.
STUDY 1: 2012 U.S. PRESIDENTIAL ELECTION
Tables 1(a) and (b) report the results for happiness around the election depictedin Figures 1 and 2, splitting the sample by partisan winners (Democrats) andpartisan losers (Republicans). Across specifications there is little robust evidencethat Democrats’ responses changed immediately after the election. The sign acrossspecifications is positive, but the statistical significance is inconsistent acrossspecifications. In contrast, partisan losers experienced significantly larger hedonic

L. Pierce et al. 7
.3.4
.5.6
.7
Perc
enta
ge in
dica
ting
that
they
are
hap
py to
day
-7 -6 -5 -4 -3 -2 -1 0 1 2 3 4 5 6Days before and after election
First day after 2012 election
Figure 2Self-Reported Happiness one Week Before and After the Election for Republicans with
Discontinuity ModelNote: Dashed lines are +/− 1.96 standard errors. The difference between the lines at the first day after the election corresponds to theβ1 in Equation (1). The differences in slopes of the estimated line are the consequence of the interaction between the linear term and thepost-election indicator.
shocks than partisan winners. Table 1(b) shows a strong negative effect on thebaseline level of happiness following the election. The models are robust to includingextensive demographic (race, gender, age, income), geographic (metropolitan areafixed effects defined by IP address), and time control variables. This robustnessacross specifications casts doubt on concerns that results are driven by differencesin the types of respondents before and after the election, as do the nearly identicalrespondent characteristics before and after the election presented in Table S1. Thenegative happiness impact to partisan losers, for example, actually increases from−0.151 to −0.246 after all controls are added. Across each pair of columns fromTables 1(a) and (b), the coefficients are statistically different from each other at the5% confidence level.
Figures 3(a) and (b) depict parameter estimates and confidence intervalsassociated with Equation (2). The weekly differences in happiness are all relative tothe baseline 8th week before the election and condition on the socio-demographiccharacteristics described earlier. Over the 8 weeks before and after the electionhappiness is relatively constant except for Republicans in the week immediatelyfollowing the election. This evidence again shows that Republicans’ well-being dropsafter the event, and also suggests that it recovers quickly.
Alternative Explanations
Three possible alternative explanations stand out. First, the asymmetric hedonicresponse could stem from rational responses to the election’s policy implications

8 The Happiness Impact of Partisan Electoral Loss
-.1
-.05
0.0
5.1
.15
Wee
k C
oeff
icie
nt (
Bas
elin
e is
8th
Wee
k B
efor
e E
lect
ion)
-7 -6 -5 -4 -3 -2 -1 0 1 2 3 4 5 6 7Weeks before and after Election
Regression coefficients on week indicatorfrom Equation (1) for the set of Demo-crats in the dataset. Week 1 is the base-line. Regressions included controls forgender, age indicators, race indicators,and income indicators. MSA controlsincluded indicators for the metropolitanstatistical area clustered at the MSA level.95% confidence intervals show as dashedlines.
Figure 3(a)Self-Reported Happiness for Democrats Eight Weeks Before and After the Election
(Color Online)
-.15
-.1
-.05
0.0
5.1
Wee
k C
oeff
icie
nt (
Bas
elin
e is
8th
Wee
k B
efor
e E
lect
ion)
-7 -6 -5 -4 -3 -2 -1 0 1 2 3 4 5 6 7Weeks before and after Election
Regression coefficents on week indicator fromEquation (1) for the set of Republicans in thedataset. Week 1 is the baseline. Regressionsincluded controls for gender, age indicators,race indicators, and income indicators. MSAcontrols included indicators for the metropoli-tan statistical area. Clustered at the MSA level.95% confidence intervals show as dashed lines.
Drop in happiness for Re-publicans in the first weekpost-election dissipates inthe subsequent weeks.
Figure 3(b)Self-Reported Happiness for Republicans Eight Weeks Before and After the Election
(Color Online)

L. Pierce et al. 9
for Democrats and Republicans (Gerber and Huber 2009). This seems unlikely,however, since Figures 1 and 2 show happiness levels converging within oneweek following the election, becoming statistically indistinguishable within fourweeks.
Second, the asymmetric hedonic response could reflect different outcomeexpectations. Overconfidence among partisan losers is common even in blowoutelections (Granberg and Brent 1983), partly because simply supporting a candidatecauses people to believe that candidate will win (Krizan et al. 2010). In thisalternative explanation, Republicans would be more affected because they expecteda victory and were disappointed, while Democrats, also expecting a victory, wereunsurprised. Supplementary analysis suggests a similar asymmetric shock foronly those respondents expecting their candidate to win, casting doubt on thisexpectations explanation.
Finally Republicans may simply become less happy after an election, regardlessof the outcome. This alternative seems unlikely, but we cannot directly test thishypothesis with these data.
STUDY 2: NEWTOWN SHOOTINGS AND MARATHON BOMBINGS
Two major national tragedies that dominated the media for weeks occurred afterthe election: the Newtown shootings and the Boston Marathon bombings. Manyrespondents answered the happiness/sadness questions in the weeks surroundingthe two tragedies, averaging 445/day for the Newtown shootings and 639/day forthe marathon bombings. These data are analyzed using the same strategy as with theelection data, defining the post-event treatment dummy by whether each responsewas before or after the precise time of the event’s first news coverage. Of course,learning that one’s party lost an election differs in important ways from observing anational tragedy. For example, partisans are personally invested in and occasionallyinvolved in elections, while very few people are personally involved in nationaltragedies. That said, of the 60% of Americans who identify with a political party,only about 0.40% were personally involved in the 2012 election by donating over$200 to a candidate, party, or PAC (Opensecrets.org). Nonetheless, comparing thehedonic impact of these two national tragedies to that of losing an election can beinsightful because they were the most affectively intense events impacting the masspublic during this period. This comparison serves simply to benchmark the hedonicintensity of partisan loss, and cannot account for other psychological impacts suchas anxiety or fear.
Both the Newtown shootings and marathon bombings caused significant negativehedonic shocks, but they are much smaller than those suffered by partisan losers inthe election. Table 2 presents the RD estimates for respondent happiness in relationto the Newtown shootings. Across columns (1)–(5) the results are not consistentlystatistically significant. The fully-controlled model in column 2 estimates a 7.6%happiness decrease immediately following the Newtown shootings––only one-fifth

10T
heH
appinessIm
pactofPartisanE
lectoralLoss
Table 2Self-Reported Happiness Before and After Newtown Shooting
Dependent variable: Are you happy today?
Independent variables (1) (2) (3) (4) (5) (6) (7)
Post-Newtown − 0.063 − 0.014 − 0.076∗∗∗ − 0.062∗∗ − 0.035 0.060 − 0.100∗∗∗(0.039) (0.014) (0.029) (0.029) (0.077) (0.061) (0.034)
Post-Newtown∗One degree polynomial ofdays
No No Yes Yes No Yes Yes
Post-Newtown∗Three degree polynomialof days
No No No No Yes No No
Socio - Demographic & MSAControls
No No No Yes Yes Yes Yes
Time restriction +/− one day +/− one week +/− one week +/− one week +/− one week +/− one week +/− one weekParents & Non-Parents Both Both Both Both Both Non-Parents ParentsObservations 695 5,304 5,304 5,304 5,304 1,216 4,088
Note: ∗ , ∗∗ , and ∗∗∗ indicate significance at the 10%, 5%, and 1% confidence levels, respectively. Standard errors are clustered at the Metropolitan level. Socio-demographic controls include gender, ageindicators, race indicators, and income indicators. MSA controls included indicators for the metropolitan statistical area.

L. Pierce et al. 11
the size of the decrease experienced by partisan losers. Likewise Table 3, column4, shows that happiness decreases following the marathon bombings by only 4.8%.The statistical significance varies across multiple reasonable specifications.
Election outcomes are relevant to partisans’ identities. As such, it may not meanmuch to compare the hedonic impact of partisan loss to that of national tragedies toa broad swath of respondents. We therefore assess the hedonic impact of tragedieson those for whom the tragedies are identity-relevant: the Newtown shootings onself-reported parents and the marathon bombings on respondents using Boston-based IP addresses. The RD models are reported in columns (7) and (8) of Tables 2and 3. As one would predict, these subsamples show larger impacts than the moregeneral sample. However, the effects are still only half those on partisan losers fromthe election (ps < 0.01). The differences between the coefficient on Post-Newtownin columns (7) and (8) of Table 2 is significant at the 5% confidence level, while thedifference between the Boston and Non-Boston region is not statistically significant.
Figure 4 presents the daily happiness and sadness results for all threeevents (Presidential election, Newtown shootings, and marathon bombings) forthe identity-relevant groups (Republicans, parents, and Boston residents). Thevisual comparison, combined with the regression results, strongly suggests thatRepublicans’ hedonic response to the election was larger than either response to thetwo tragedies.
GENERAL DISCUSSION
People’s social, physical, economic, and mental lives are shaped by their partisanidentities––and these social identities are widely and deeply held. The currentresearch vividly shows that these identities also have important consequences topeople’s hedonic lives. Winning an election is fine, but losing one is painful, at leastin the short run. Losing an election appears to dominate the pain caused by nationaltragedies, even among those particularly connected to them. While enhancing ourunderstanding of the centrality of people’s partisanship to their lived experiences,these results also speak to the growing literature in economics, psychology, andother fields on the factors that affect well-being (Kahneman et al. 2003).
In addition to expanding our understanding of the well-being importance ofpartisan identity, this work makes several methodological contributions. First, ittackles a causal political psychology question by employing a research design (RD)that is under-used in other political psychology research (Shadish et al. 2002).Second, it leverages digital technologies that allow large-scale, yet granular, datacollection over time. One will notice in Figure 4 the rapid adaption of partisanlosers to losing an election; of parents to the Newtown shootings; and of Bostonresidents to the marathon bombings. As far as we know, this is the first paper to mapthe contours of hedonic adaptation to societal events at this level of granularity. Thistype of data source provides new opportunities for scholars involved in the study

12T
heH
appinessIm
pactofPartisanE
lectoralLoss
Table 3Self-Reported Happiness Before and After Boston Bombing
Dependent variable: Are you happy today?
Independent variables (1) (2) (3) (4) (5) (7) (8)
Post-Boston − 0.064∗∗ − 0.022∗∗∗ − 0.048∗∗ − 0.050∗∗ − 0.069 − 0.048∗∗ − 0.204(0.039) (0.008) (0.022) (0.023) (0.051) (0.024) (0.144)
Post-Boston∗One degree polynomial ofdays
No No Yes Yes No Yes Yes
Post-Boston ∗Three degree polynomialof days
No No No No Yes No No
Socio - Demographic & MSAControls
No No No Yes Yes Yes Yes
Time restriction +/− one day +/− one week +/− one week +/− one week +/− one week +/− one week +/− one weekBoston Region &
Non-Boston RegionBoth Both Both Both Both Non-Boston Boston
Observations 1,360 8,939 8,939 8,939 8,939 8,763 176
Note: ∗ , ∗∗ , and ∗∗∗ indicate significance at the 10%, 5%, and 1% confidence levels, respectively. Standard errors are clustered at the Metropolitan level. Socio-demographic controls include gender, ageindicators, race indicators, and income indicators. MSA controls included indicators for the metropolitan statistical area.

L. Pierce et al. 13
0.2
.4.6
.81
Per
cent
age
indi
catin
g th
at th
ey a
re h
appy
toda
y
-7 -6 -5 -4 -3 -2 -1 0 1 2 3 4 5 6Days before and after event
Event Date
Intervals represent± 1.96 standard errors
Parents before and after Newtown shootingRepublicans before and after 2012 electionBoston region before and after Boston bombing
Figure 4Comparison of Salient Groups Before and After Event
and measurement of happiness (Kahneman and Krueger 2006). Finally, by usinghedonic reactions to multiple unrelated events that are each associated with distinctidentities, we illustrate an approach to comparing the importance of different beliefs,ideologies, or events to people’s identities with relatively high ecological validity(Settles 2004).
One of our main findings is that the pain of losing the 2012 Presidential Electiondominated the joy of winning it. A challenge to making a general claim is the manyidiosyncrasies to this specific election. First, the impact of losing the election maybe specific to Republicans since partisans appear to have systematic differences inhow they process and respond to information (Jost et al. 2009). Second, it is difficultfor us to disentangle the role of party affiliation from simple candidate preferences.Third, since President Obama was the incumbent, partisan winners might haveperceived retaining the presidency as maintaining the status quo, thereby mutingthe joy of winning. In this scenario, however, partisan losers would have viewedthe status quo as not attaining the presidency (i.e., losing), making this status quoargument inconsistent with the results. It is also inconsistent with the robust findingthat partisans expect their preferred candidates to win, even when the polls showthat winning is unlikely (Granberg and Brent 1983). The current findings should bereplicated in future elections to resolve these questions.
Furthermore, the results appear inconsistent with research suggesting thatprospect theory’s gain-loss asymmetry arises when people forecast their hedonicreactions, but not when people actually experience gains and losses with monetarygambles (Kermer et al. 2006). One possible explanation for this inconsistency might

14 The Happiness Impact of Partisan Electoral Loss
be that partisans expect to win elections (Granberg and Brent 1983; Krizan et al.2010), whereas overconfidence may be more muted for monetary gambles.
Finally, we note that although partisan losers appear to be only temporarilyaffected, such transitive emotional shocks have important personal and socialimplications. Card and Dahl (2011), for example, find that upset losses in footballgames increased local domestic violence reports for a short period following thegame.
In sum, partisan identity is even more central to the self than past researchsuggests. In addition to affecting thinking, preferences, and behavior, it also hassizable hedonic consequences, especially when people experience partisan losses.
SUPPLEMENTARY MATERIALS
To view supplementary material for this article, please visit http://dx.doi.org/10.1017/XPS.2015.8.
REFERENCES
Alesina, A., R. Di Tella, and R. MacCulloch. 2004. “Inequality and Happiness: AreEuropeans and Americans Different?” Journal of Public Economics 88(9): 2009–42.
Argyle, M. 2003. Causes and Correlates of Happiness. Well-Being: The Foundations ofHedonic Psychology, ch. 18, p. 353. New York: Russell Sage Foundation.
Baumeister, R. F., E. Bratslavsky, C. Finkenauer, and K. D. Vohs. 2001. “Bad is Strongerthan Good.” Review of General Psychology 5(4): 323.
Busse, M., J. Silva-Risso, and F. Zettelmeyer. 2006. “$1000 Cash Back: The Pass-Throughof Auto Manufacturer Promotions.” American Economic Review 96(4): 1253–70.
Campbell, A., P. E. Converse, W. E. Miller and, Donald, E. Stokes. 1960. The AmericanVoter. New York: Wiley.
Card, D., and G. Dahl. 2011. “Family Violence and Football: The Effect of UnexpectedEmotional Cues on Violent Behavior.” Quarterly Journal of Economics 126(1): 103–43.
Caruso, E., N. Mead, and E. Balcetis. 2009. “Political Partisanship Influences Perception ofBiracial Candidates’ Skin Tone.” Proceedings of National Academy of Sciences 106(48):20168–73.
Cohen, G. L. 2003. “Party over Policy: The Dominating Impact of Group Influence onPolitical Beliefs.” Journal of Personality and Social Psychology 85(5): 808–22.
Dal Bo, E., P. Dal Bo, and J. Snyder. 2009. “Political Dynasties.” The Review of EconomicStudies 76(1): 115–42.
Di Tella, R. D., R. J. MacCulloch, and A. J. Oswald. 2003. “The Macroeconomics ofHappiness.” Review of Economics and Statistics 85(4): 809–27.
Easterlin, R. A. 2003. “Explaining Happiness.” PNAS: Proceedings of the National Academyof Sciences 100(19): 11176–83.
Easterlin, R. A. 2006. “Life Cycle Happiness and its Sources: Intersections of Psychology,Economics, and Demography.” Journal of Economic Psychology 27(4): 463–82.

L. Pierce et al. 15
Gentzkow, M. and J. M. Shapiro. 2011. “Ideological Segregation Online and Offline.” TheQuarterly Journal of Economics 126(4): 1799–839.
Gerber, A. S. and G. A. Huber. 2009. “Partisanship and Economic Behavior: Do PartisanDifferences in Economic Forecasts Predict Real Economic Behavior?” American PoliticalScience Review 103(3): 407–26.
Gerber, A. S., D. P. Kessler, and M. Meredith. 2011. The Persuasive Effects of DirectMail: A Regression Discontinuity based Approach.” Journal of Politics 73(1):140–55.
Gilbert, D. T., M. D. Lieberman, C. K. Morewedge, and T. D. Wilson. 2004. “The PeculiarLongevity of Things not so Bad.” Psychological Science 15(1): 14–19.
Gillis, J. R. ed. 1996. Commemorations: The Politics of National Identity. Princeton, NJ:Princeton University Press.
Gimpel, J. G. and J. E. Schuknecht. 2004. Patchwork Nation: Sectionalism and PoliticalChange in American Politics. Ann Arbor, MI: University of Michigan Press.
Glaeser, E. L. and B. A. Ward. 2006. “Myths and Realities of American Political Geography.”Journal of Economic Perspectives 20(2): 119–44.
Granberg, D. and E. Brent. 1983. “When Prophecy Bends: The Preference–Expectation Linkin US Presidential Elections, 1952–1980.” Journal of Personality and Social Psychology45(3): 477.
Green, D., B. Palmquist, and E. Schickler. 2002. Partisan Hearts and Minds: Political Partiesand the Social Identities of Voters. New Haven, CT: Yale University Press.
Hersh, E. 2014. “The Long-Term Effect of September 11 on the Political behavior of Victims’Families and Neighbors.” Proceedings of the National Academy of Sciences 110(52):20959–63.
Imbens, G. W. and T. Lemieux. 2008. “Regression Discontinuity Designs: A Guide toPractice.” Journal of Econometrics 142(2): 615–35.
Jost, J. T., C. M. Federico, and J. L. Napier. 2009. “Political Ideology: Its Structure,Functions, and Elective Affinities.” Annual Review of Psychology 60: 307–37.
Kahneman, D. and A. Deaton. 2010. “High Income Improves Evaluation of Life but notEmotional Well-Being.” Proceedings of the National Academy of Sciences 107(38): 16489–93.
Kahneman, D., E. Diener, and N. Schwarz. 2003. Well-Being: The Foundations of HedonicPsychology. New York: Russell Sage Foundation.
Kahneman, D. and A. Krueger. 2006. “Developments in the Measurement of SubjectiveWell-Being.” Journal of Economic Perspectives 20(1): 3–24.
Kahneman, D. and A. Tversky. 1979. “Prospect Theory: An Analysis of Decision underRisk.” Econometrica 47(2): 263–91.
Kermer, D. A., E. Driver-Linn, T. D. Wilson, and D. T. Gilbert. 2006. “Loss Aversion is anAffective Forecasting Error.” Psychological Science 17(8): 649–53.
Krizan, Z., J. C. Miller, and O. Johar. 2010. “Wishful Thinking in the 2008 US PresidentialElection.” Psychological Science 21(1): 140–6.
Langford, D. J., S. E. Crager, Z. Shehzad, S. B. Smith, S. G. Sotocinal, J. S. Levenstadt,M. L. Chanda, D. J. Levitin, and J. S. Mogil. 2006. “Social Modulation of Pain as Evidencefor Empathy in Mice.” Science 312(5782): 1967–70.
McDermott, R. 2004. “Prospect Theory in Political Science: Gains and Losses from the FirstDecade.” Political Psychology 25(2): 289–312.
Pierce, L., M. S. Dahl, and J. Nielsen. 2013. “In Sickness and in Wealth: Psychological andSexual Costs of Income Comparison in Marriage.” Personality and Social PsychologyBulletin 39(3): 359–74.

16 The Happiness Impact of Partisan Electoral Loss
Pierce, L. and J. A. Snyder. 2012. “Discretion and Manipulation by Experts: Evidence froma Vehicle Emissions Policy Change.” B.E. Journal of Economic Analysis & Policy 13(3):1–30.
Preston, S. D. and F. B. De Waal. 2002. “Empathy: Its Ultimate and Proximate bases.”Behavioral and Brain Sciences 25(1): 1–71.
Prior, M. 2007. Post-Broadcast Democracy: How Media Choice Increases Inequality inPolitical Involvement and Polarizes Elections. Cambridge: Cambridge University Press.
Rand, D., T. Pfeiffer, A. Dreber, R. Sheketoff, N. Wernerfelt, and Y. Benkler. 2009. “DynamicRemodeling of In-Group Bias during the 2008 Presidential Election.” Proceedings of theNational Academy of Sciences 106(15): 6187–91.
Rozin, P. and E. B. Royzman. 2001. “Negativity Bias, Negativity Dominance, andContagion.” Personality and Social Psychology Review 5(4): 296–320.
Settles, I. H. 2004. “When Multiple Identities Interfere: The Role of Identity Centrality.”Personality and Social Psychology Bulletin 30(4): 487–500.
Shadish, W. R, T. D. Cook, and D. T. Campbell. 2002. Experimental and Quasi-ExperimentalDesigns for Generalized Causal Inference. Boston: Houghton Mifflin.
Singer, T., B. Seymour, J. O’Doherty, H. Kaube, R. J. Dolan, and C. D. Frith. 2004. “Empathyfor Pain Involves the Affective but not Sensory Components of Pain.” Science 303(5661):1157–62.
Snyder, J. 2010. “Gaming the Liver Transplant Market.” Journal of Law, Economics, andOrganization 26(3): 546–68.
West, S. G. 2009. “Alternatives to Randomized Experiments.” Current Directions inPsychological Science 18(5): 299–304.