Embed Size (px)
DESCRIPTION
DISTRIBUTION LOSS REDUCTION
Citation preview

Feedback Seminar on Energy-efficiency potential in South Africa
Loss Reduction & Reliability yImprovement in Distribution
S tSystemJanuary 2008January 2008
Tokyo Electric Power Company y p y(JICA Study Team)
Koichi HOSHI
Copyright© 2009, Tokyo Electric Power Co, Inc. All rights reserved 1
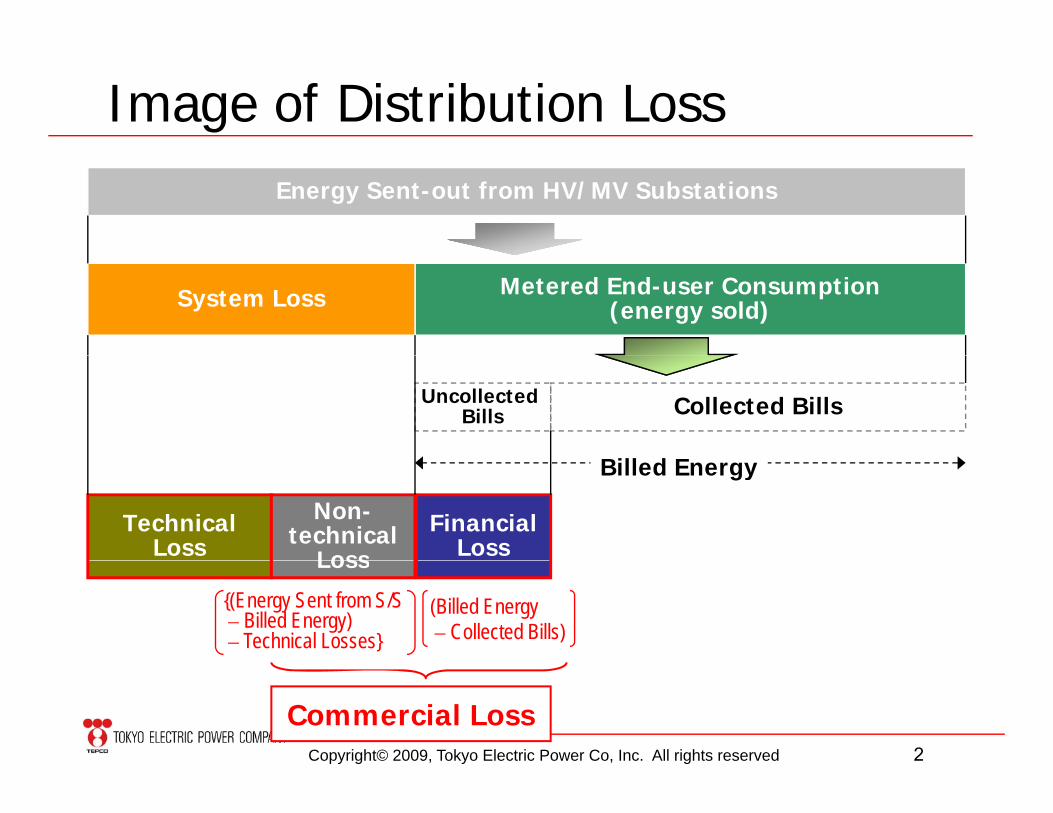
Image of Distribution LossEnergy Sent-out from HV/MV Substations
Metered End-user Consumption(energy sold)System Loss
Collected BillsUncollected Bills
Bill d E
Technical Loss
Non-technical
LossFinancial
Loss
Billed Energy
(Billed Energy– Collected Bills)
{(Energy Sent from S/S – Billed Energy)– Technical Losses}
Loss
Copyright© 2009, Tokyo Electric Power Co, Inc. All rights reserved 2
Commercial Loss
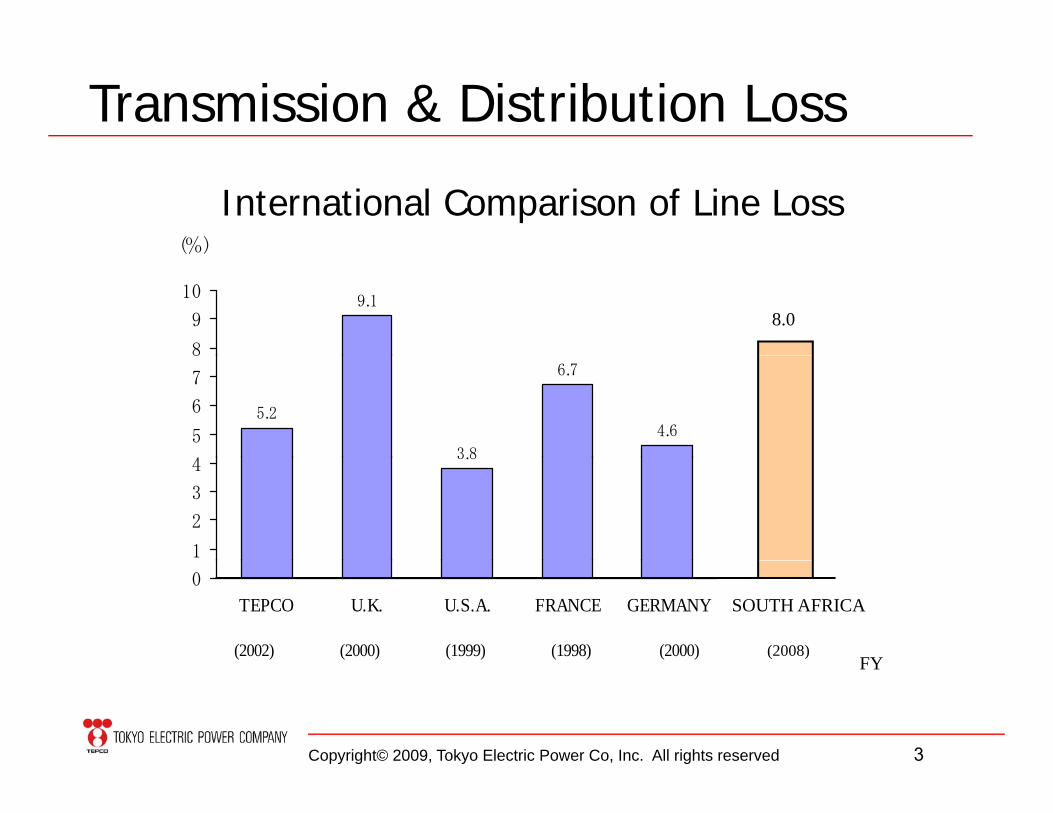
Transmission & Distribution Loss
International Comparison of Line Loss(%)(%)
9.1
8
9
10
8.0
5.2
3.8
6.7
4.6
4
5
6
7
8
3.8
1
2
3
4
FY(2002) (2000) (1999) (1998) (2000)
0
TEPCO U.K. U.S.A. FRANCE GERMANY SOUTH AFRICA
(2008)
Copyright© 2009, Tokyo Electric Power Co, Inc. All rights reserved 3
FY
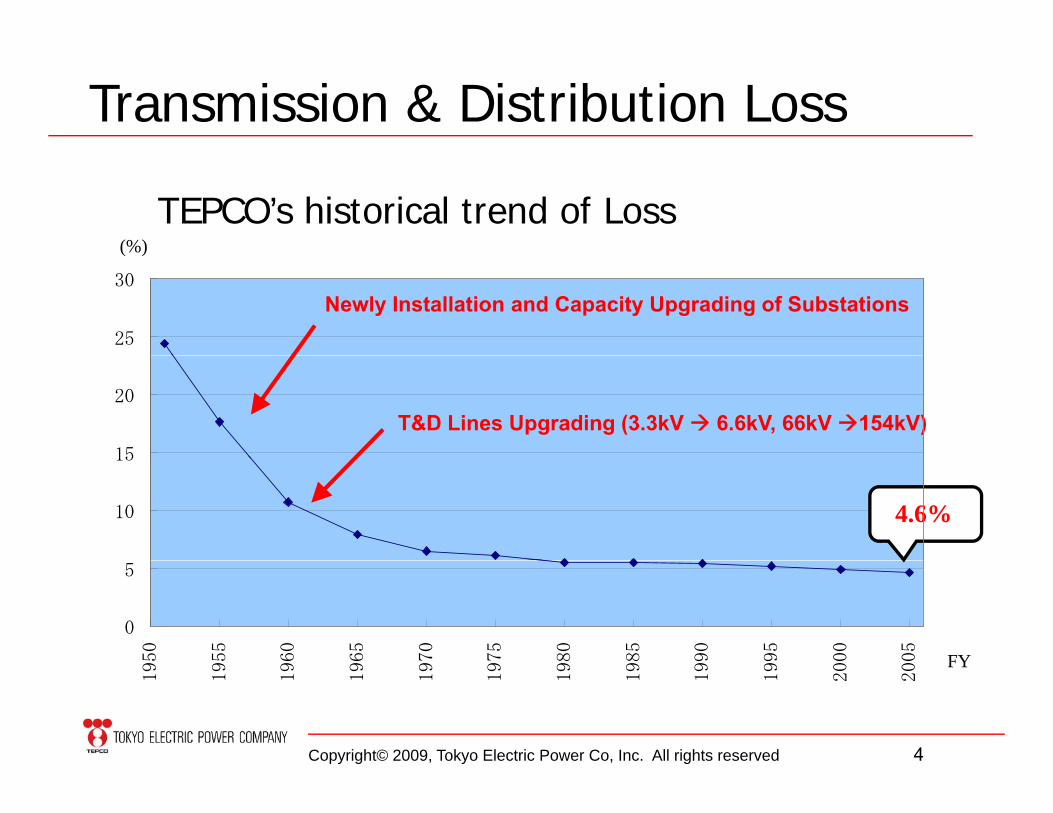
Transmission & Distribution Loss
(%)TEPCO’s historical trend of Loss
25
30
( )
Newly Installation and Capacity Upgrading of Substations
15
20
T&D Lines Upgrading (3.3kV 6.6kV, 66kV 154kV)
10
15
4.6%
0
5
950
955
960
965
970
975
980
985
990
995
000
005
FY
Copyright© 2009, Tokyo Electric Power Co, Inc. All rights reserved 4
19
19
19
19
19
19
19
19
19
19
20
20 FY
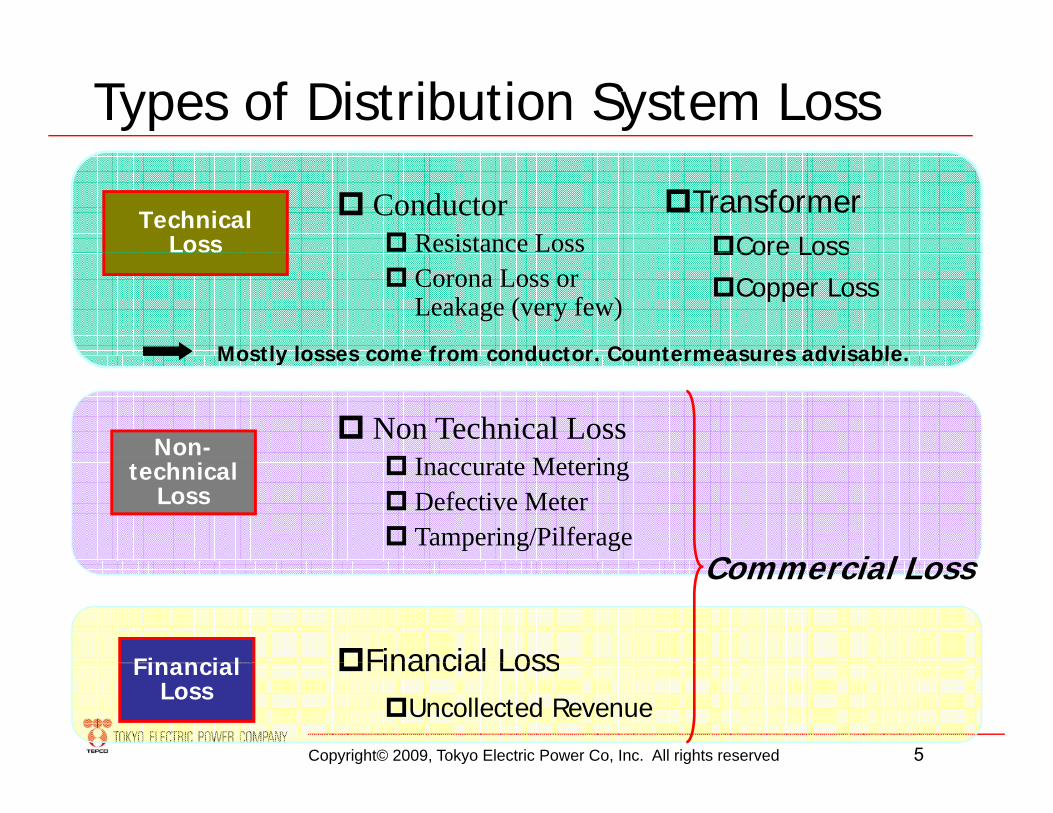
Types of Distribution System Loss
ConductorResistance Loss
Technical Loss
Transformer Core Loss
Corona Loss or Leakage (very few)
Core Loss
Copper Loss
Mostly losses come from conductor Countermeasures advisable
Non Technical LossI M i
Non-
Mostly losses come from conductor. Countermeasures advisable.
Inaccurate MeteringDefective MeterTampering/Pilferage
technical Loss
C i l L
Financial Financial Loss
Commercial Loss
Copyright© 2009, Tokyo Electric Power Co, Inc. All rights reserved 5
Financial Loss
Financial LossUncollected Revenue
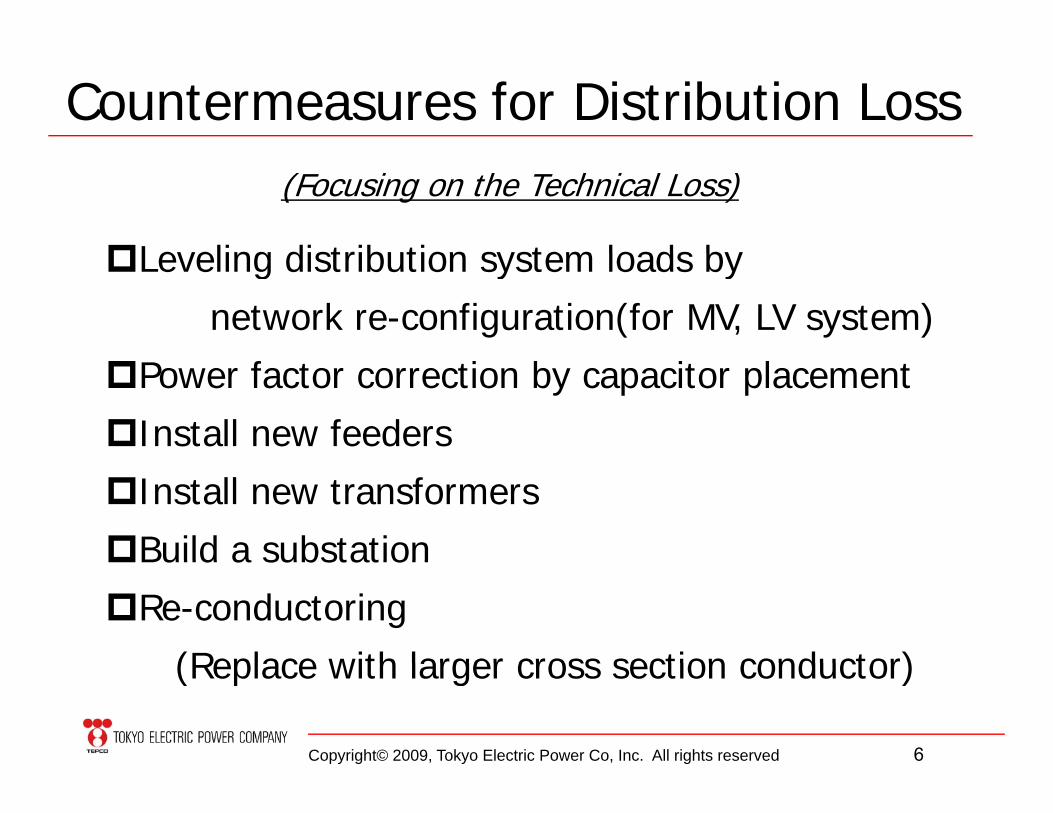
Countermeasures for Distribution Loss(Focusing on the Technical Loss)
Leveling distribution system loads byLeveling distribution system loads by
network re-configuration(for MV, LV system)
Power factor correction by capacitor placement
Install new feeders
Install new transformers
Build a substationBuild a substation
Re-conductoring
(Replace with larger cross section conductor)
Copyright© 2009, Tokyo Electric Power Co, Inc. All rights reserved 6
(Replace with larger cross section conductor)
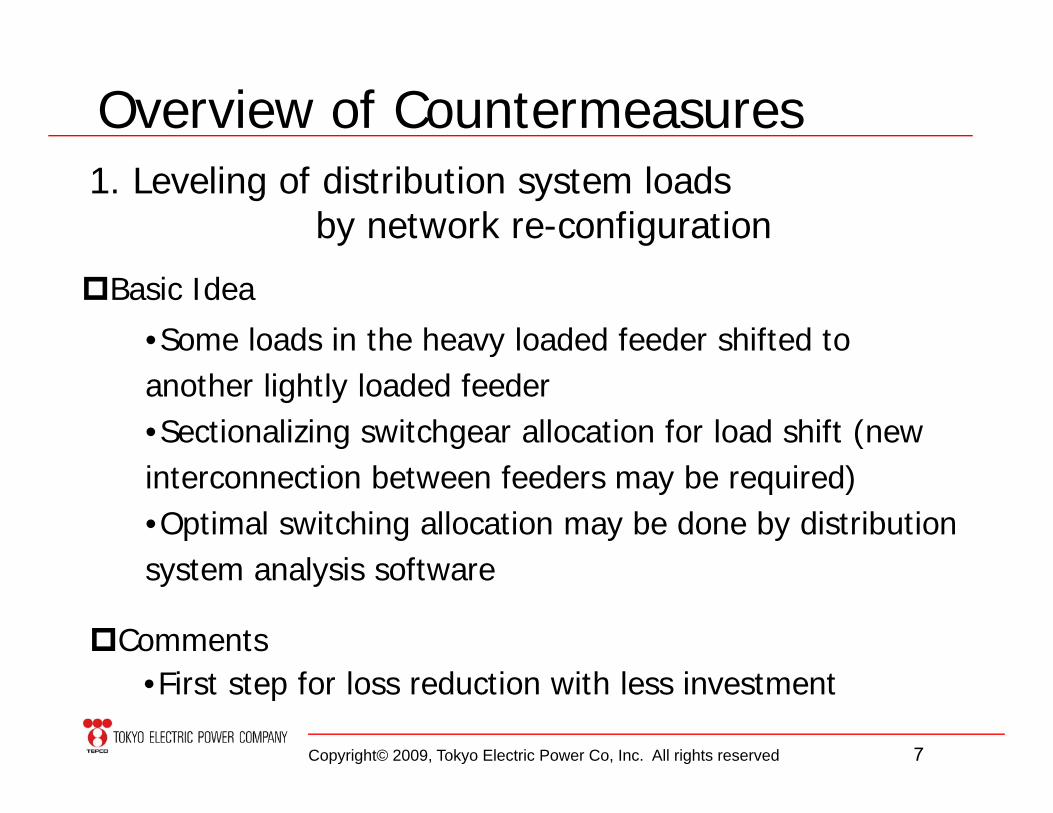
Overview of Countermeasures1. Leveling of distribution system loads
by network re-configuration
•Some loads in the heavy loaded feeder shifted to
Basic Idea
yanother lightly loaded feeder•Sectionalizing switchgear allocation for load shift (new interconnection between feeders may be required)•Optimal switching allocation may be done by distribution
t l i ftsystem analysis software
Comments
Copyright© 2009, Tokyo Electric Power Co, Inc. All rights reserved 7
•First step for loss reduction with less investment
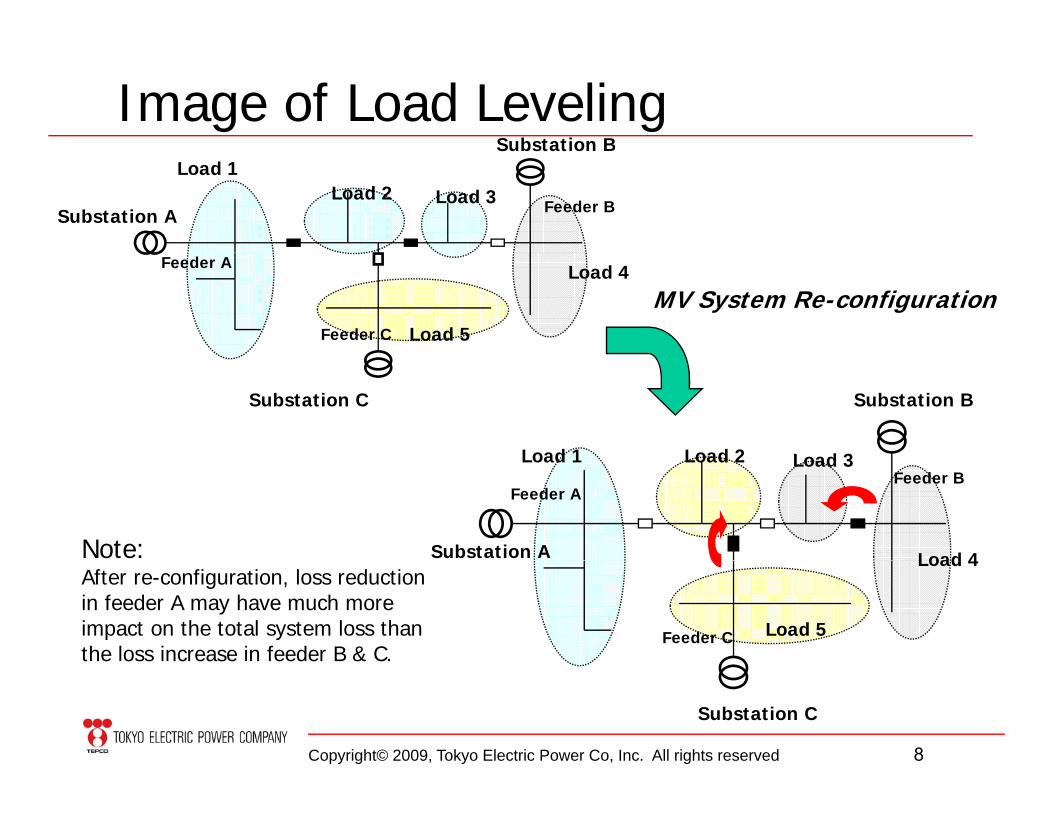
Image of Load LevelingSubstation B
Substation A
Load 1Load 2 Load 3
Substation B
Feeder B
Load 4
Load 5
MV System Re-configurationFeeder A
Feeder C
Substation C
Load 1 Load 2 Load 3
Substation B
Load 1 Load 2 Load 3
Load 4Substation A
Feeder AFeeder B
Note: Load 4
Load 5Feeder C
After re-configuration, loss reductionin feeder A may have much more impact on the total system loss than the loss increase in feeder B & C.
Copyright© 2009, Tokyo Electric Power Co, Inc. All rights reserved 8
Substation C
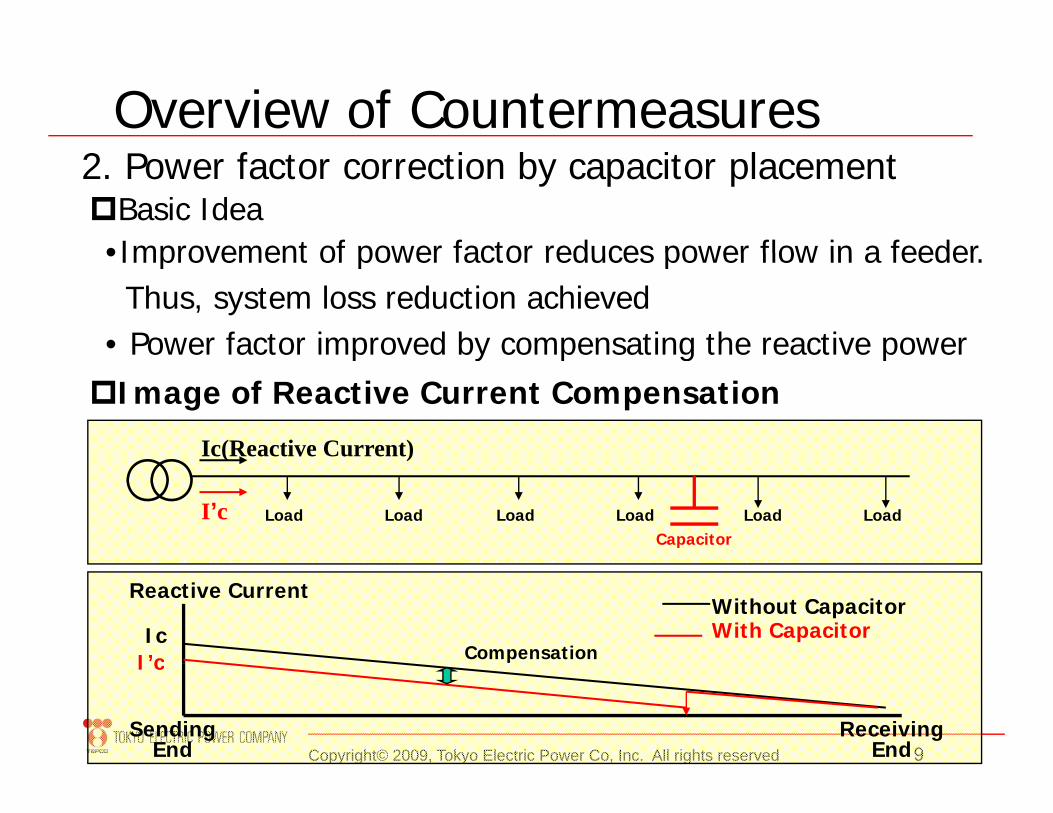
Overview of Countermeasures2. Power factor correction by capacitor placement
•Improvement of power factor reduces power flow in a feederBasic Idea
•Improvement of power factor reduces power flow in a feeder. Thus, system loss reduction achieved
• Power factor improved by compensating the reactive power p y p g p
Ic(Reactive Current)
Image of Reactive Current Compensation
Load
( )
Load Load Load LoadLoadCapacitor
I’c
Reactive Current
IcWithout CapacitorWith Capacitor
I’c Compensation
Copyright© 2009, Tokyo Electric Power Co, Inc. All rights reserved 9Sending
EndReceiving
End
I c

Overview of Countermeasures3 I ll f d / f / b i3. Install new feeders/transformers/substations
Basic IdeaH l d d t b li d b f d th t•Heavy loaded area to be supplied by new feeder so that
existing feeder supplies less loads (for new feeder install,
sometimes ne HV/MV t ansfo me needed)sometimes new HV/MV transformer needed)
•New substation to be built in the center of high load density
area so that existing feeder supplies less loadsarea so that existing feeder supplies less loads
CommentsB ildi f iliti (f d t f b t ti )•Building new facilities(feeders, transformers, substations) requires a certain level of investment. Impact of loss reduction and investment must be carefully considered.
Copyright© 2009, Tokyo Electric Power Co, Inc. All rights reserved 10
reduction and investment must be carefully considered.
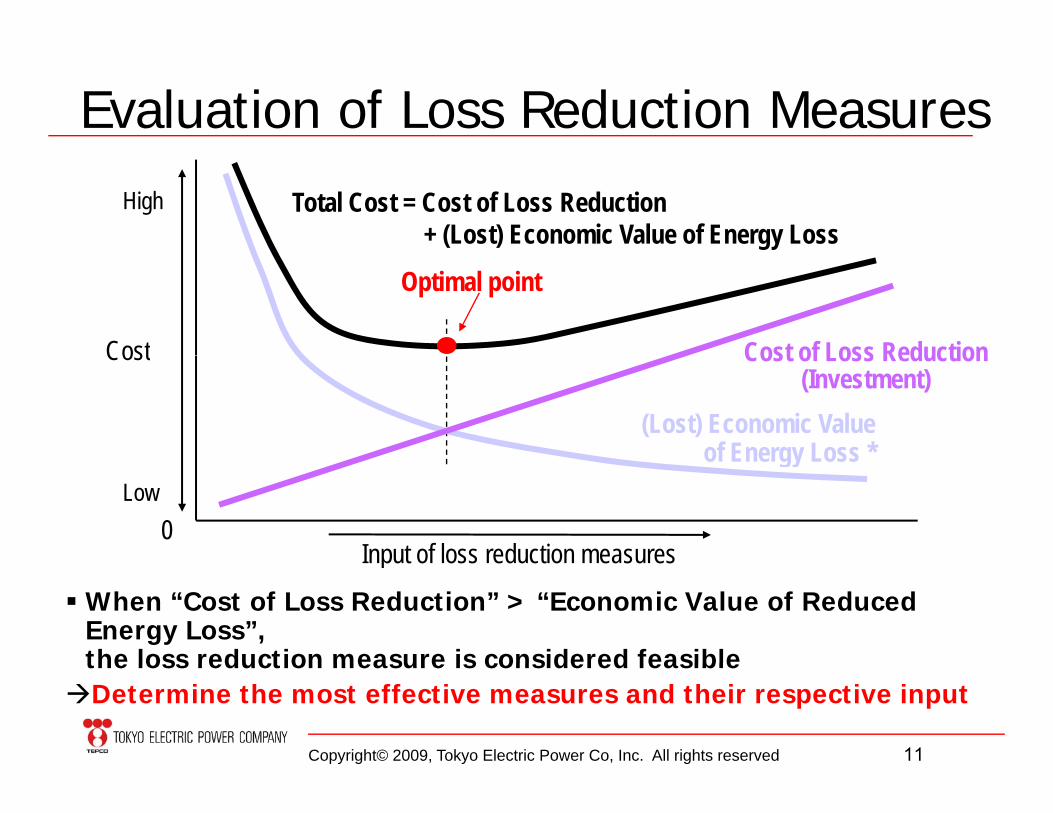
Evaluation of Loss Reduction Measures
Total Cost = Cost of Loss Reduction + (Lost) Economic Value of Energy Loss
High
Cost Cost of Loss Reduction
Optimal point
Cost
(Lost) Economic Value of Energy Loss *
Cost of Loss Reduction(Investment)
0Input of loss reduction measures
of Energy Loss Low
Input of loss reduction measures
When “Cost of Loss Reduction” > “Economic Value of Reduced Energy Loss”, the loss reduction measure is considered feasible
Copyright© 2009, Tokyo Electric Power Co, Inc. All rights reserved 11
the loss reduction measure is considered feasibleDetermine the most effective measures and their respective input
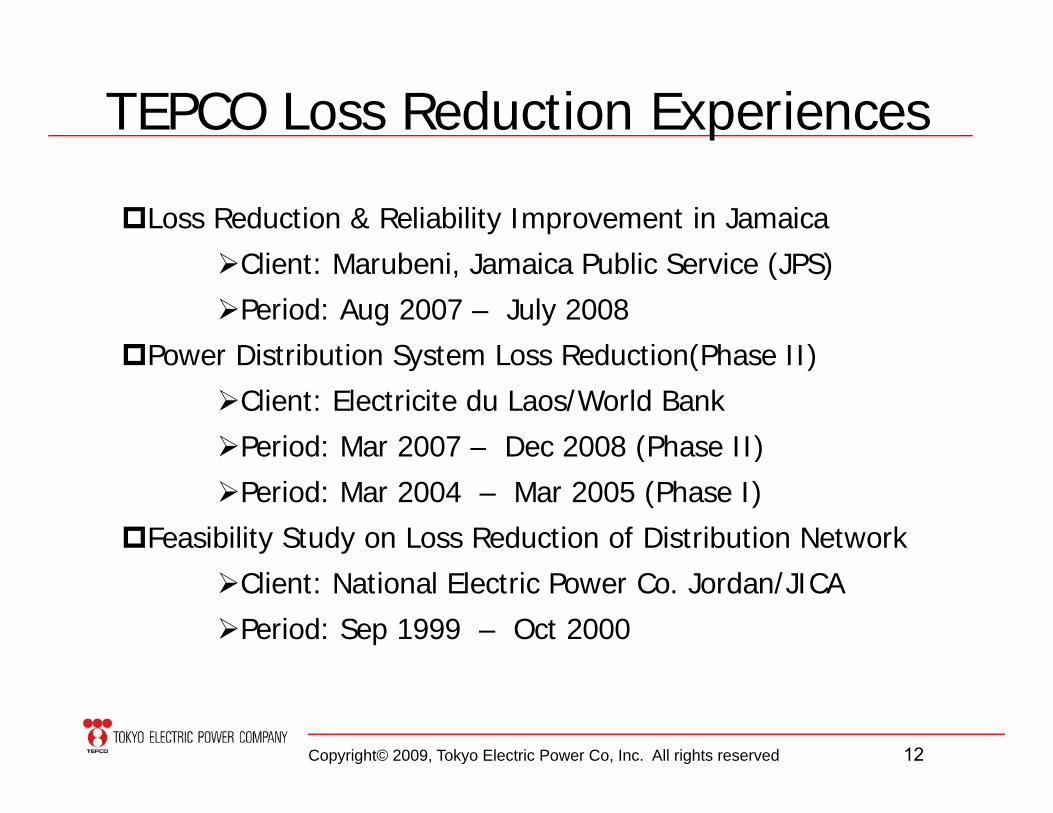
TEPCO Loss Reduction Experiences
Loss Reduction & Reliability Improvement in Jamaica
Cli M b i J i P bli S i (JPS)Client: Marubeni, Jamaica Public Service (JPS)
Period: Aug 2007 – July 2008
Power Distribution System Loss Reduction(Phase II)Power Distribution System Loss Reduction(Phase II)
Client: Electricite du Laos/World Bank
Period: Mar 2007 – Dec 2008 (Phase II)( )
Period: Mar 2004 – Mar 2005 (Phase I)
Feasibility Study on Loss Reduction of Distribution Network
Client: National Electric Power Co. Jordan/JICA
Period: Sep 1999 – Oct 2000
Copyright© 2009, Tokyo Electric Power Co, Inc. All rights reserved 12
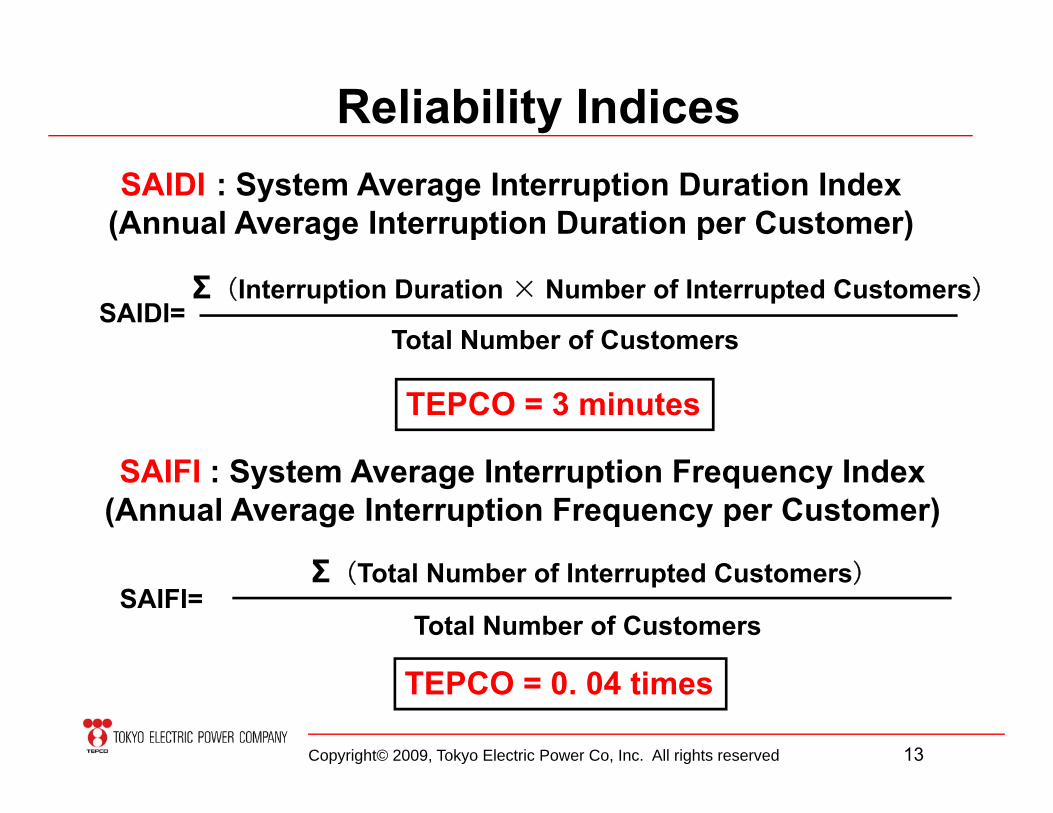
Reliability IndicesSAIDI : System Average Interruption Duration Index
(Annual Average Interruption Duration per Customer)
Σ(Interruption Duration × Number of Interrupted Customers)
Total Number of CustomersSAIDI=
TEPCO = 3 minutes
SAIFI : System Average Interruption Frequency Index (Annual Average Interruption Frequency per Customer)
ΣΣ(Total Number of Interrupted Customers)
Total Number of CustomersSAIFI=
Copyright© 2009, Tokyo Electric Power Co, Inc. All rights reserved 13
TEPCO = 0. 04 times
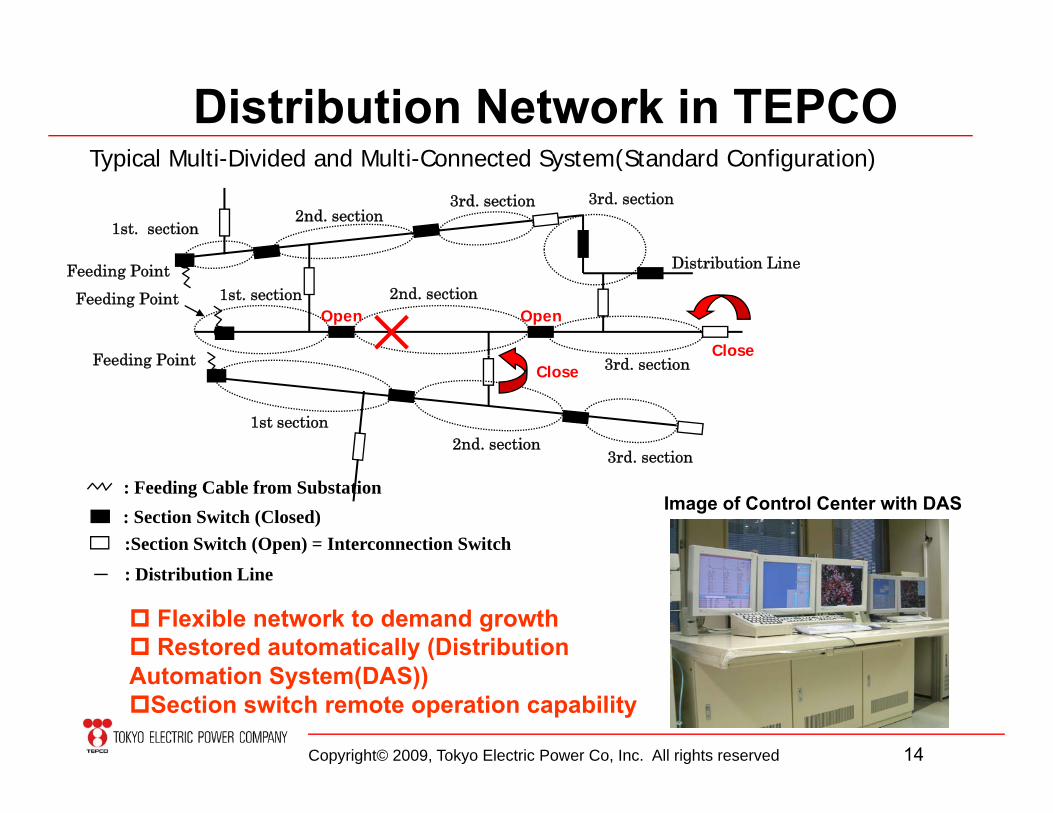
Distribution Network in TEPCOT i l M lti Di id d d M lti C t d S t (St d d C fi ti )Typical Multi-Divided and Multi-Connected System(Standard Configuration)
1st. section2nd. section
3rd. section 3rd. section
Feeding Point 1st. section 2nd. section
F di P i t
Feeding Point Distribution Line
OpenOpen
Close
1st section2nd. section
3rd. section
3rd section
Feeding PointClose
Close
3rd. section
: Feeding Cable from Substation: Section Switch (Closed):Section Switch (Open) = Interconnection Switch
Image of Control Center with DAS
: Distribution Line
Flexible network to demand growthRestored automatically (Distribution
Copyright© 2009, Tokyo Electric Power Co, Inc. All rights reserved 14
Automation System(DAS))Section switch remote operation capability
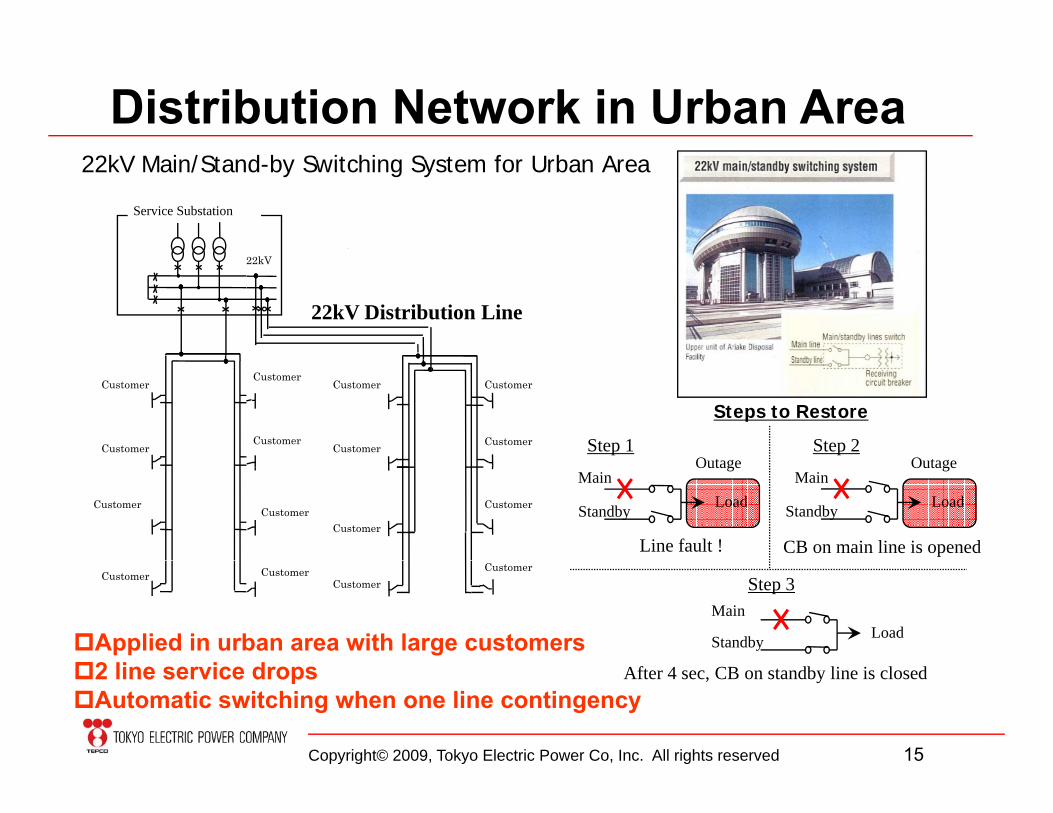
Distribution Network in Urban Area
Service Substation
22kV Main/Stand-by Switching System for Urban Area
22kV
22kV Distribution Line
Customer
Customer
Customer
Customer Customer
Customer
Customer
Customer
Step 1O
Step 2O
Steps to Restore
CustomerCustomer Customer
Customer
Line fault !
Main
Standby Load
OutageMain
Standby Load
CB on main line is opened
Outage
Customer Customer CustomerCustomer
Applied in urban area with large customers2 li i d
Step 3Main
Standby Load
Copyright© 2009, Tokyo Electric Power Co, Inc. All rights reserved 15
2 line service dropsAutomatic switching when one line contingency
After 4 sec, CB on standby line is closed
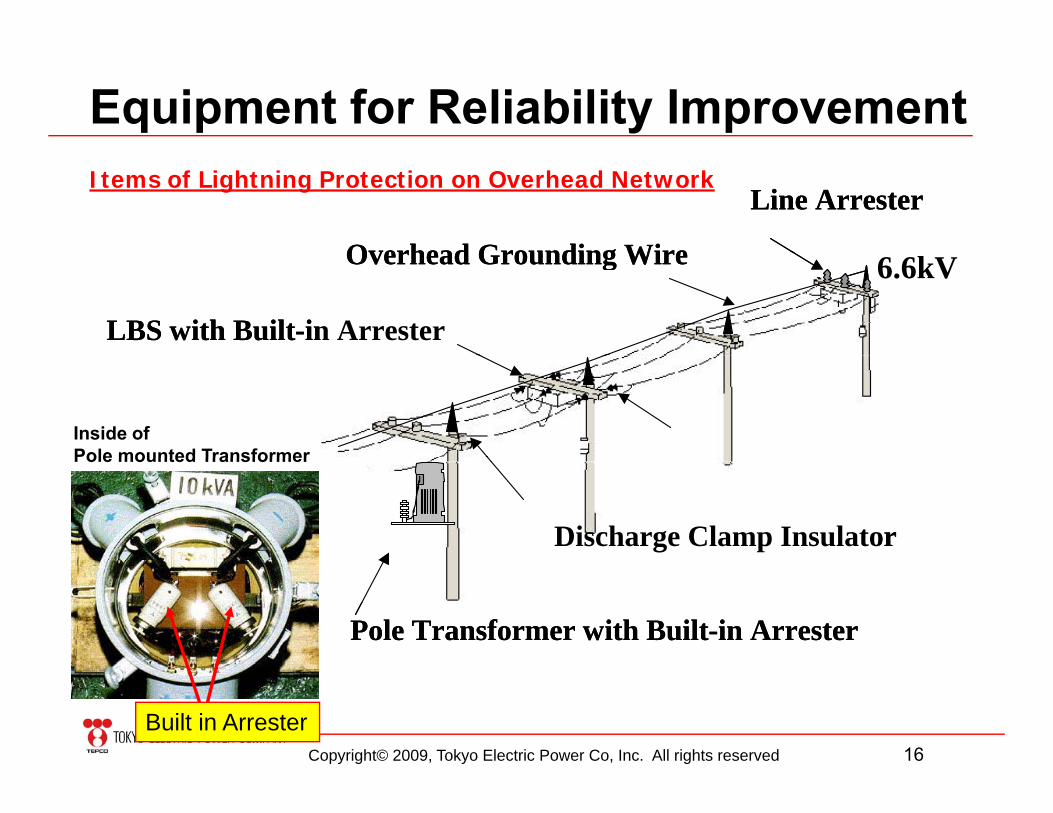
Equipment for Reliability Improvement
Line Arrester
Overhead Grounding Wire
Line Arrester
Overhead Grounding Wire
Items of Lightning Protection on Overhead Network
Overhead Grounding Wire
LBS with Built-in Arrester
Overhead Grounding Wire
LBS with Built-in Arrester
6.6kV
Inside ofPole mounted Transformer
Discharge Clamp InsulatorDischarge Clamp Insulator
Pole mounted Transformer
Pole Transformer with Built-in ArresterPole Transformer with Built-in Arrester
Copyright© 2009, Tokyo Electric Power Co, Inc. All rights reserved 16Built in Arrester
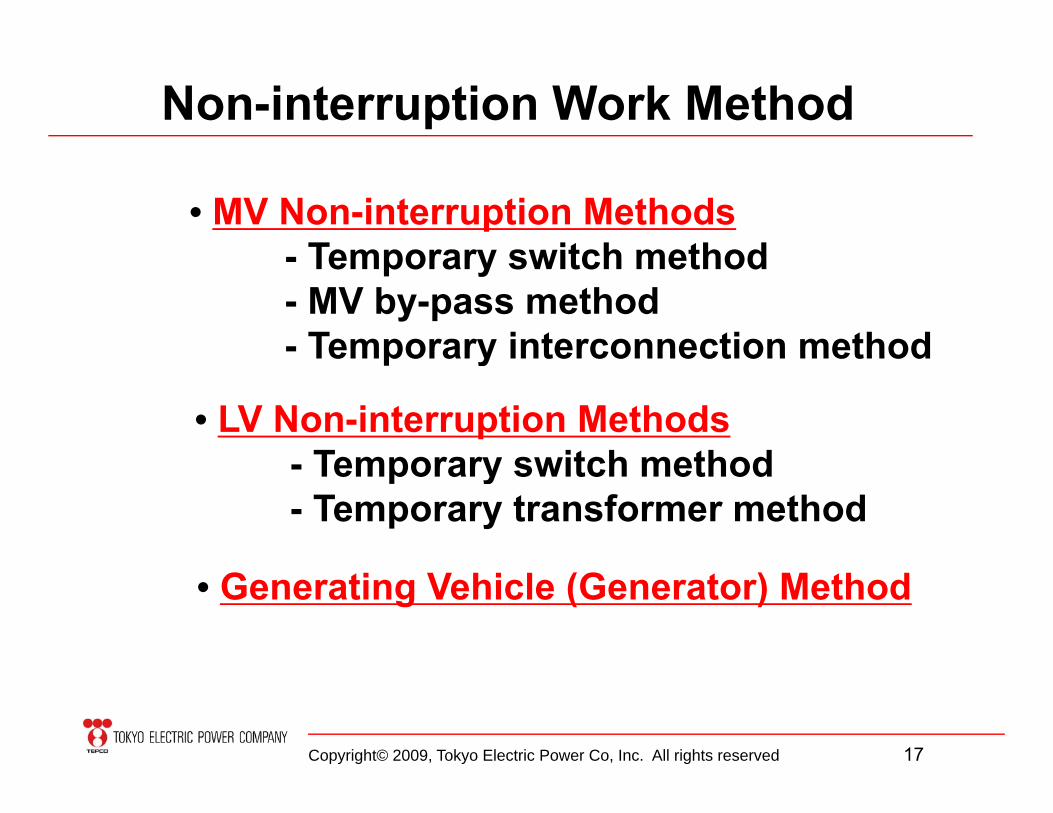
Non-interruption Work Method
• MV Non-interruption MethodsTemporary switch method- Temporary switch method
- MV by-pass method- Temporary interconnection methodTemporary interconnection method
• LV Non-interruption MethodsTemporary switch method- Temporary switch method
- Temporary transformer method
• Generating Vehicle (Generator) Method
Copyright© 2009, Tokyo Electric Power Co, Inc. All rights reserved 17
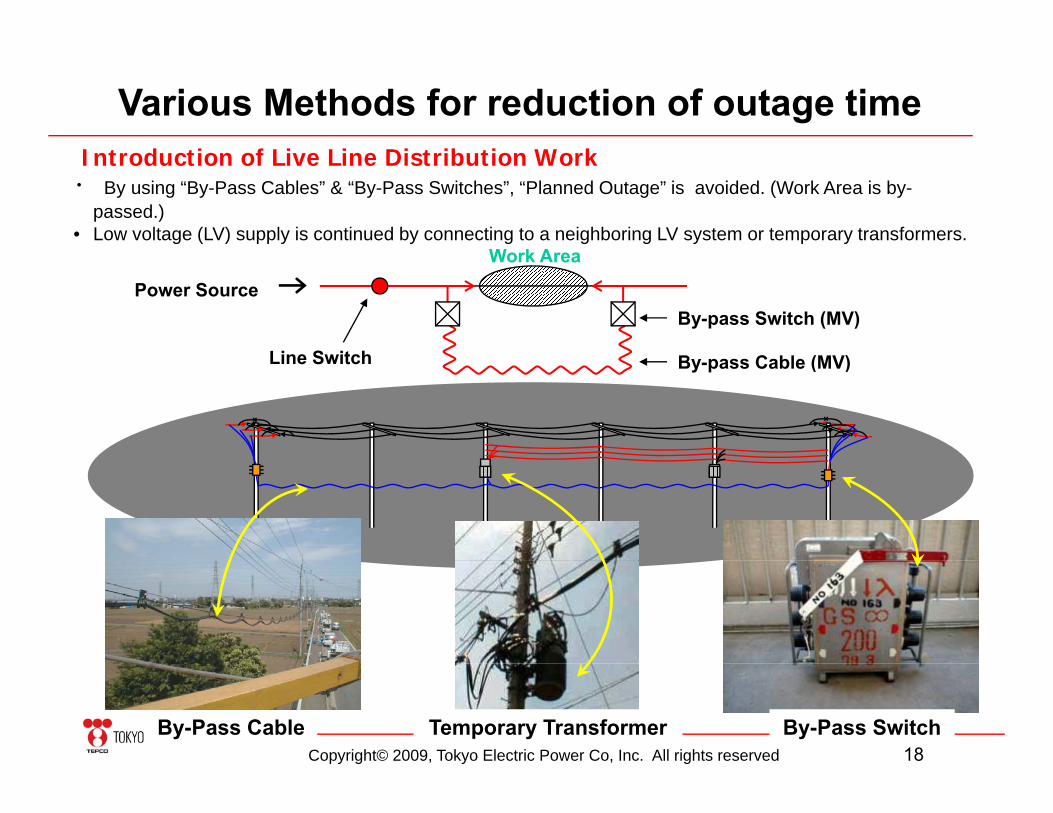
Various Methods for reduction of outage timeI t d ti f Li Li Di t ib ti W kIntroduction of Live Line Distribution Work・ By using “By-Pass Cables” & “By-Pass Switches”, “Planned Outage” is avoided. (Work Area is by-
passed.)• Low voltage (LV) supply is continued by connecting to a neighboring LV system or temporary transformers.
Work Area
Power SourceBy-pass Switch (MV)
Work Area
Line Switch B C bl (MV)Line Switch By-pass Cable (MV)
Copyright© 2009, Tokyo Electric Power Co, Inc. All rights reserved 18By-Pass Cable Temporary Transformer By-Pass Switch
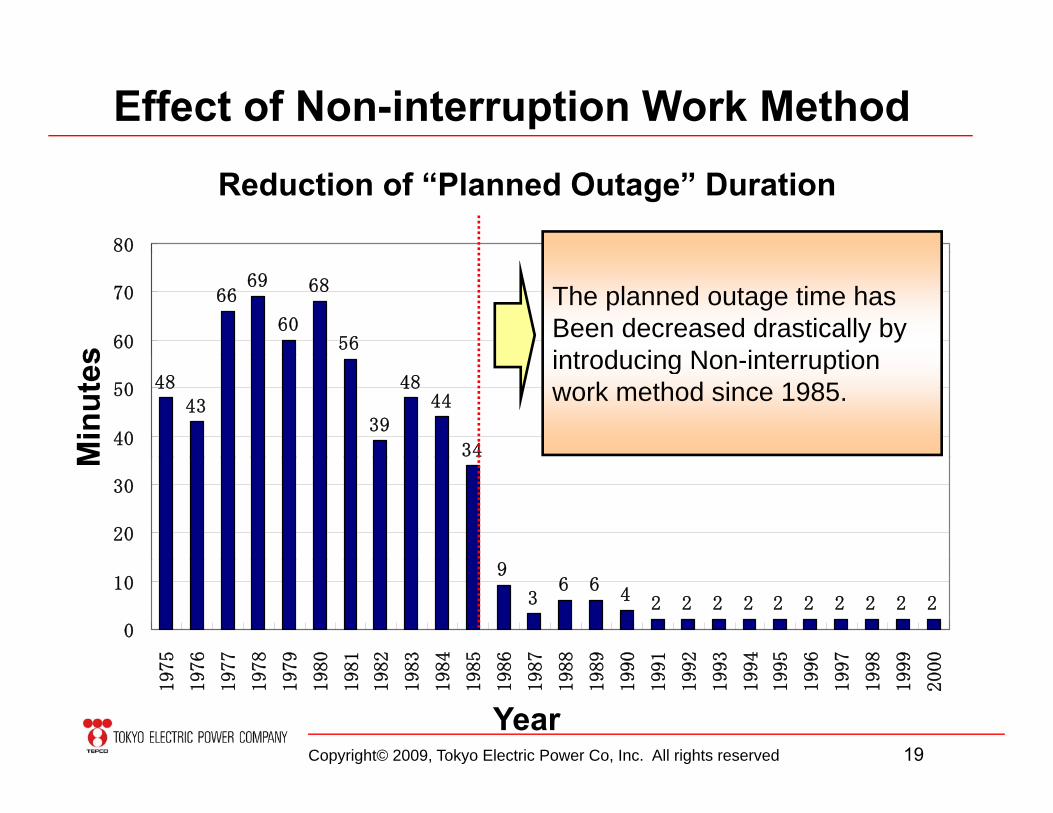
Effect of Non-interruption Work Method
Reduction of “Planned Outage” Duration
80
6669
60
68
5660
70
s
The planned outage time hasBeen decreased drastically byintroducing Non interruption
4843
39
4844
3440
50
Min
utes introducing Non-interruption
work method since 1985.
20
30
M
9
36 6
4 2 2 2 2 2 2 2 2 2 2
0
10
75
76
77
78
79
80
81
82
83
84
85
86
87
88
89
90
91
92
93
94
95
96
97
98
99
00
Copyright© 2009, Tokyo Electric Power Co, Inc. All rights reserved 19
197
197
197
197
197
198
198
198
198
198
198
198
198
198
198
199
199
199
199
199
199
199
199
199
199
200
Year
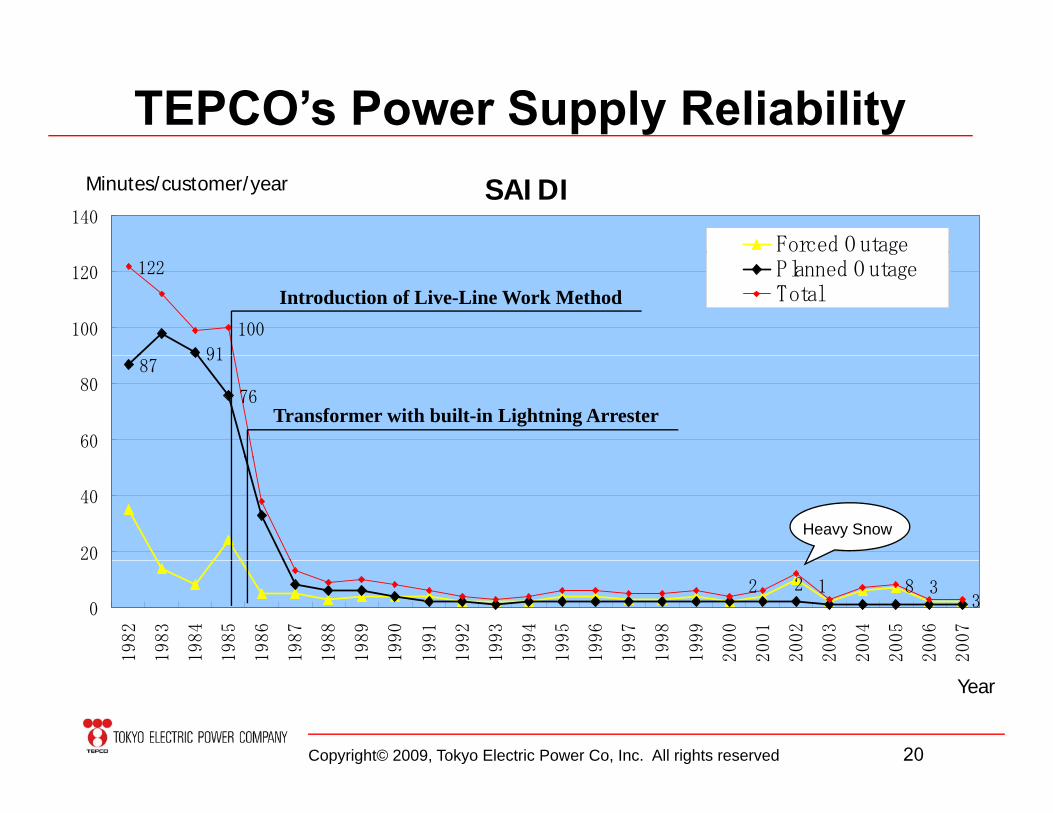
TEPCO’s Power Supply Reliability
140
Forced O utage
SAIDIMinutes/customer/year
91
100
122
100
120
gPlanned O utageTotalIntroduction of Live-Line Work Method
76
9187
60
80
Transformer with built-in Lightning Arrester
20
40
Heavy Snow
122 8 330
1982
1983
1984
1985
1986
1987
1988
1989
1990
1991
1992
1993
1994
1995
1996
1997
1998
1999
2000
2001
2002
2003
2004
2005
2006
2007
Copyright© 2009, Tokyo Electric Power Co, Inc. All rights reserved 20
Year