Embed Size (px)
Citation preview
Lottery Scholarships: Lessons Learned
William R. Doyle
Vanderbilt University
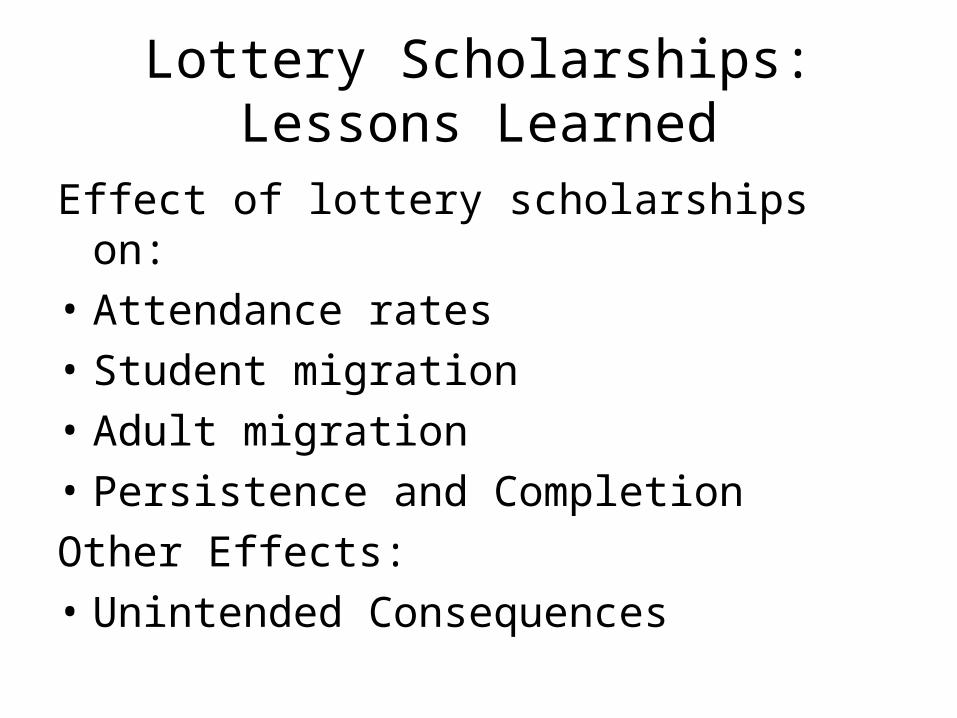
Lottery Scholarships: Lessons Learned
Effect of lottery scholarships on:
• Attendance rates
• Student migration
• Adult migration
• Persistence and Completion
Other Effects:
• Unintended Consequences
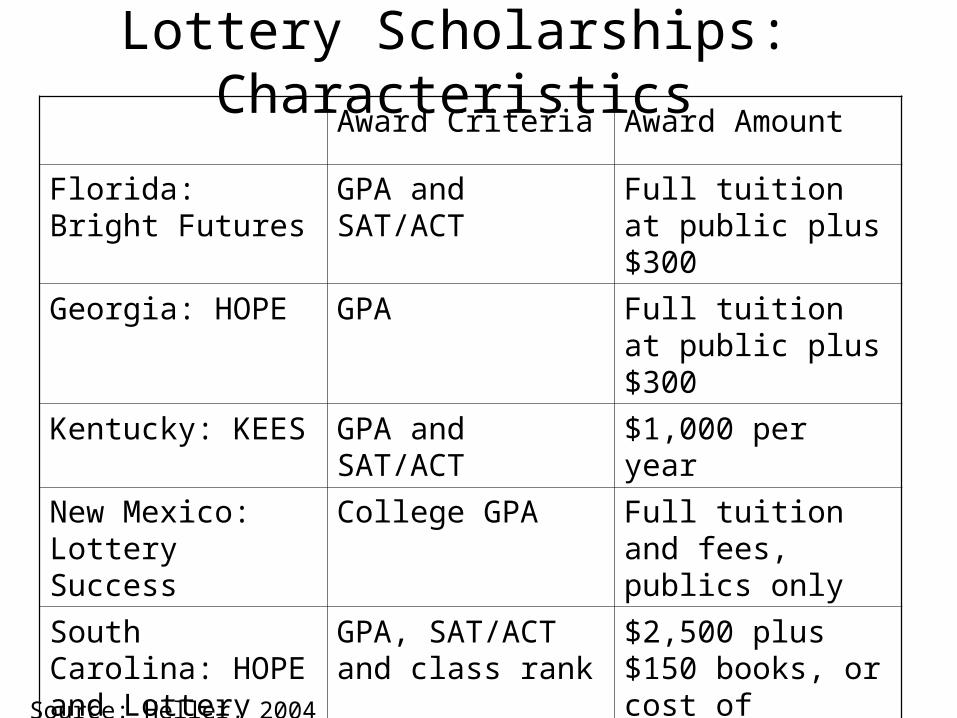
Lottery Scholarships: CharacteristicsAward Criteria Award Amount
Florida: Bright Futures
GPA and SAT/ACT Full tuition at public plus $300
Georgia: HOPE GPA Full tuition at public plus $300
Kentucky: KEES GPA and SAT/ACT $1,000 per year
New Mexico: Lottery Success
College GPA Full tuition and fees, publics only
South Carolina: HOPE and Lottery Tuition Assistance
GPA, SAT/ACT and class rank
$2,500 plus $150 books, or cost of tuition
West Virginia: Promise
GPA and SAT/ACT Full tuition at publics
Source: Heller, 2004
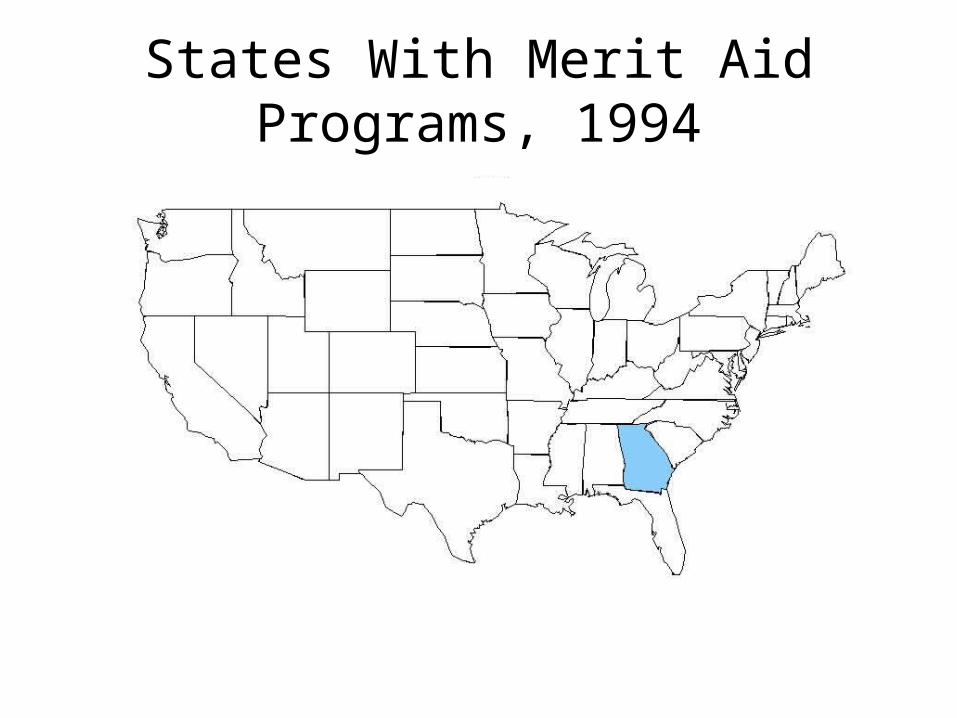
States With Merit Aid Programs, 1994
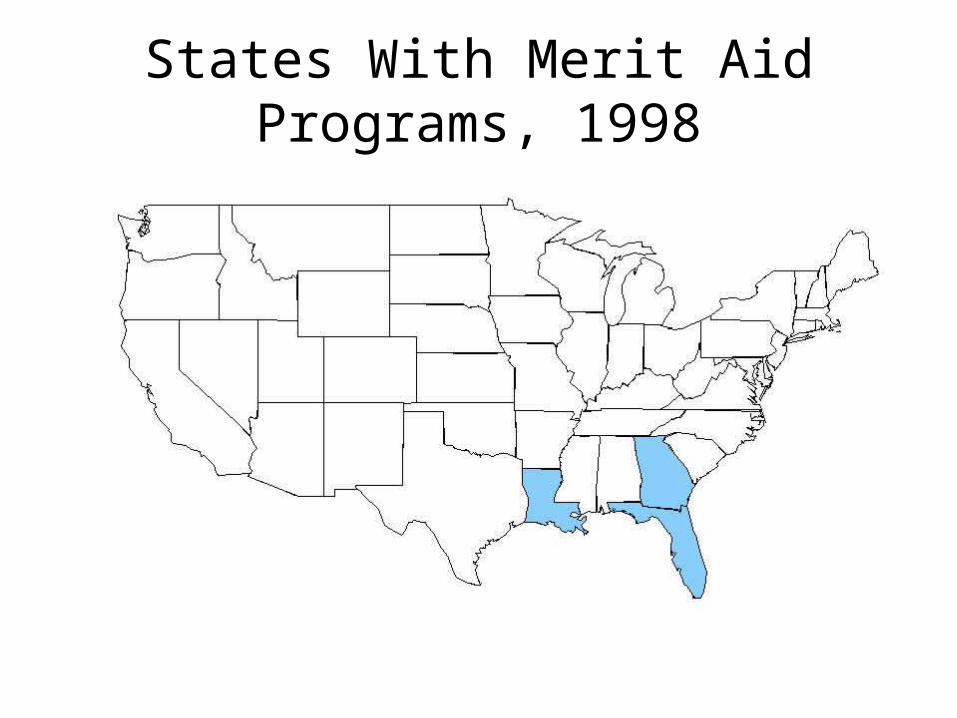
States With Merit Aid Programs, 1998
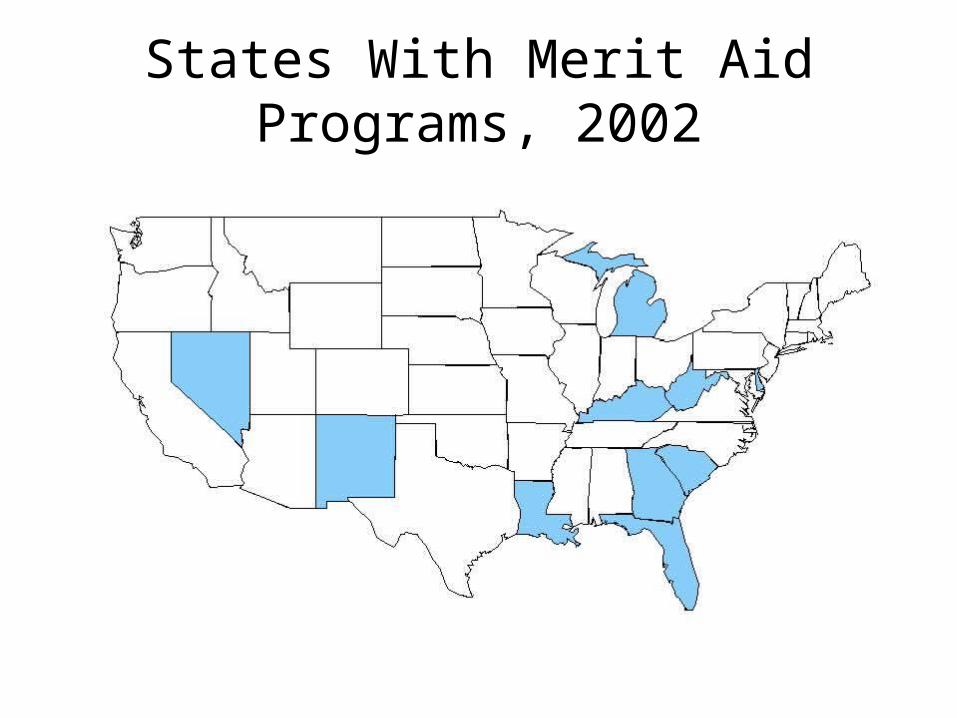
States With Merit Aid Programs, 2002
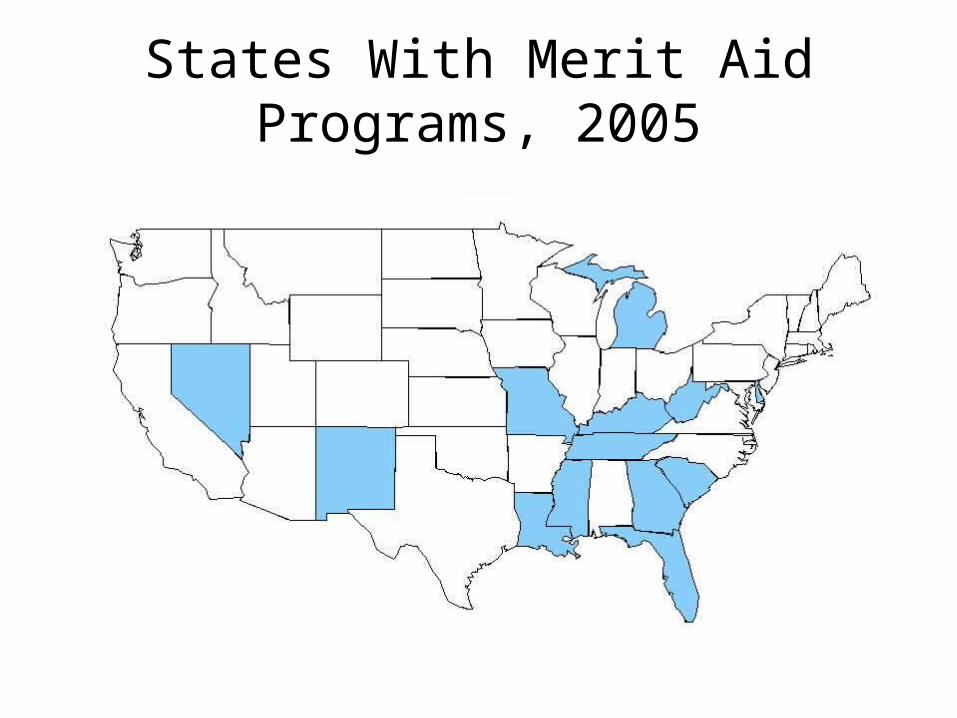
States With Merit Aid Programs, 2005

Shift in State-Based Financial Aid
Effect of Merit Scholarships on Participation
• Dynarski, 2000
• Looked at attendance rates of young people in Georgia and other nearby states before and after implementation of HOPE
• Found that HOPE increased the college participation rate of 18-19 year olds by 7.0 to 7.9 percentage points
Dynarski, 2000:
“Due to key differences between the federal and Georgia programs, these estimates should be treated as a generous upper bound . . .”
Effect of Merit Scholarships on Participation
Dynarski, 2000:
“Further, the evidence suggests that Georgia’s program has widened the gap in college attendance between blacks and whites and between those from low- and high-income families.”
Effect of Merit Scholarships on Participation
Effect of Merit Scholarships on Participation
Cornwell and Mustard 2003
“We estimate that the scholarship increased the overall freshmen enrollment rate by 6.9 percentage points with the gains concentrated in 4-year schools.”
Binder and Ganderton 2002
“Despite its generous terms, NM Success has not increased the overall college enrollment rate among high school graduates.”
Effect of Merit Scholarships on Participation
• Many studies find that students are likely to shift from two-year to four-year institutions
• Effect of lower prices, different incentives are posited to be possible causes
Effect of Merit Scholarships on Participation
Effect of Merit Scholarships on Student Migration
Dynarski 2000
• HOPE decreases the number of Georgia students attending out of state, from 5,000 to 4,500
• Effect is particularly strong at institutions in border states with typically large freshmen enrollments from Georgia
Effect of Merit Scholarships on Student Migration
Cornwell and Mustard 2003
• Utilize a slightly different methodology than Dynarski
• Results are very similar: HOPE has encouraged more students to attend higher education in-state.
Effect of Merit Aid Scholarships on Adult Migration
• No evidence from the literature yet exists on this question
• But:– More highly educated people are more mobile– Mobility among the educated is driven
primarily by job market concerns
Effect of Merit Aid on Persistence and Completion
Henry, Rubenstein and Bugler 2004
• Looked at similar students above and below the “borderline” for HOPE
• Students with HOPE:– Had more credit hours– Had higher GPA’s– Were more likely to graduate
Binder and Ganderton 2002
• Students with Success scholarships (NM) were more likely to drop out
• Students with Success scholarships were also more likely to reduce credit hours and withdraw from courses
Effect of Merit Aid on Persistence and Completion
Merit Aid Programs: Unintended Consequences
• Grade Inflation: Bradbury and Campbell (2003) find that grade inflation did occur in Georgia high schools after HOPE was implemented
• Lexus effect: Substition of scholarship dollars for consumption does occur (Cornwell and Mustard, 2002)
• Tuition, Room and Board: Some evidence that college cost rise as a result of these scholarships (Long, 2003).
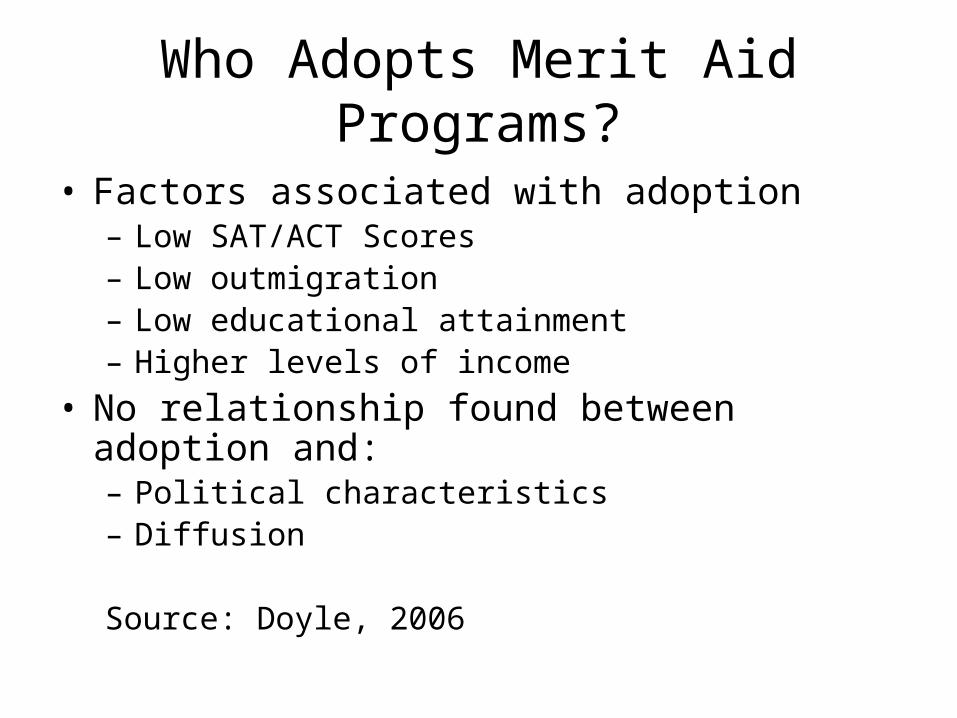
Who Adopts Merit Aid Programs?
• Factors associated with adoption– Low SAT/ACT Scores– Low outmigration– Low educational attainment– Higher levels of income
• No relationship found between adoption and:– Political characteristics– Diffusion
Source: Doyle, 2006
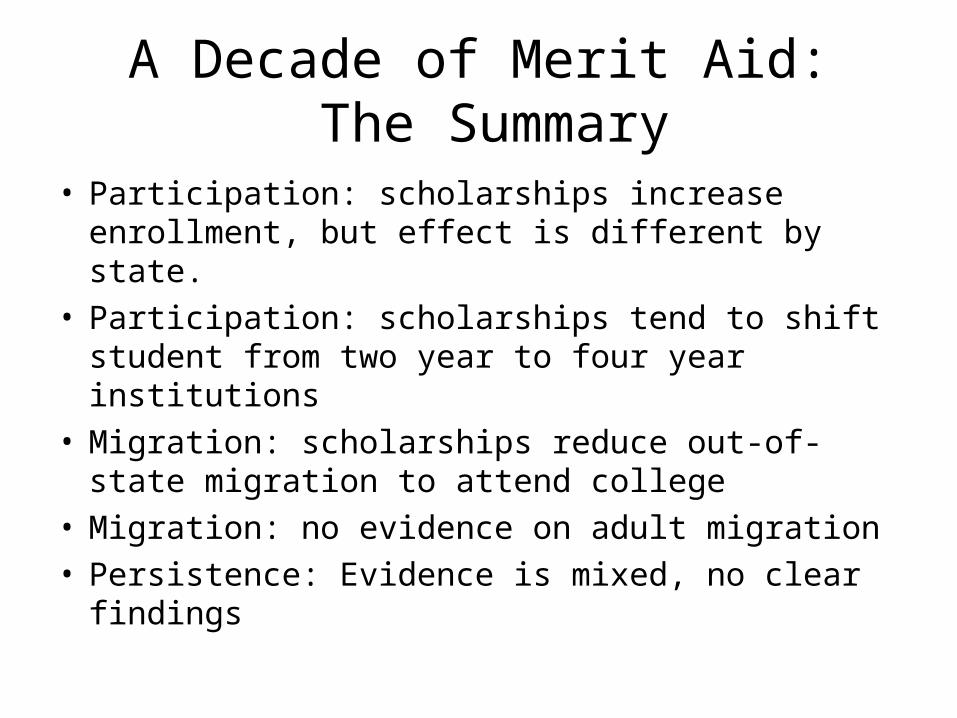
A Decade of Merit Aid: The Summary
• Participation: scholarships increase enrollment, but effect is different by state.
• Participation: scholarships tend to shift student from two year to four year institutions
• Migration: scholarships reduce out-of-state migration to attend college
• Migration: no evidence on adult migration• Persistence: Evidence is mixed, no clear
findings
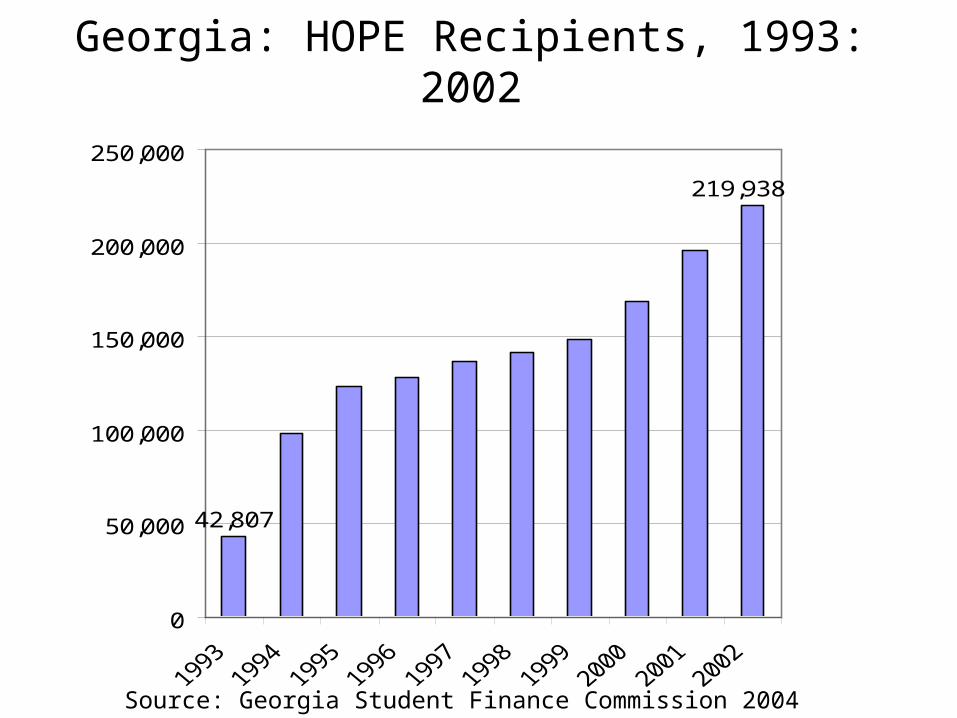
Georgia: HOPE Recipients, 1993: 2002
42,807
219,938
0
50,000
100,000
150,000
200,000
250,000
Source: Georgia Student Finance Commission 2004
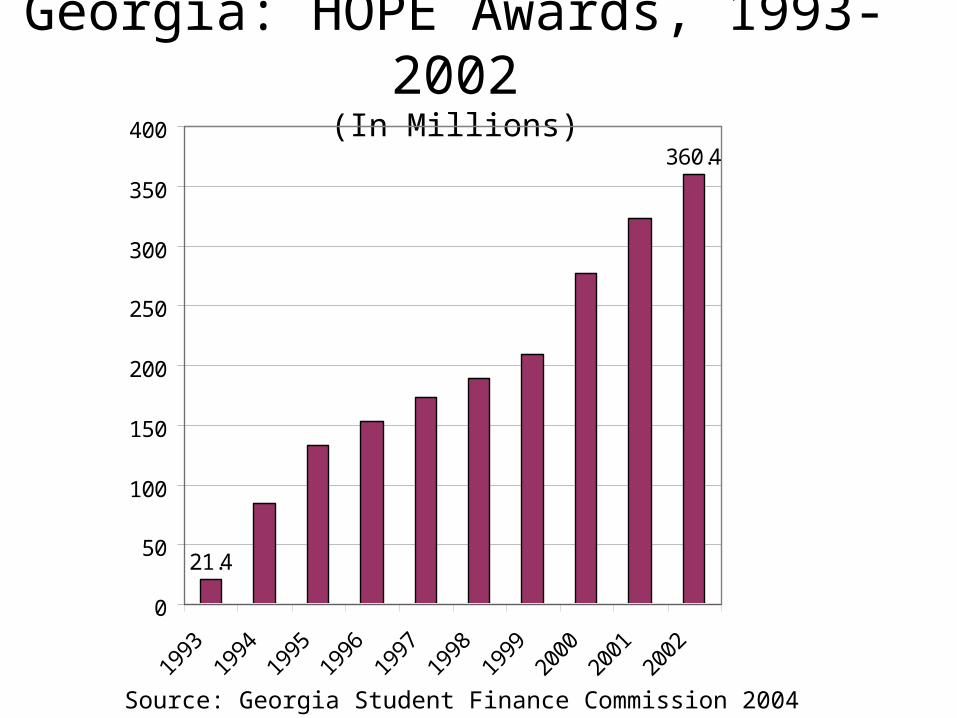
Georgia: HOPE Awards, 1993-2002(In Millions)
21.4
360.4
0
50
100
150
200
250
300
350
400
1993
1994
1995
1996
1997
1998
1999
2000
2001
2002
Source: Georgia Student Finance Commission 2004
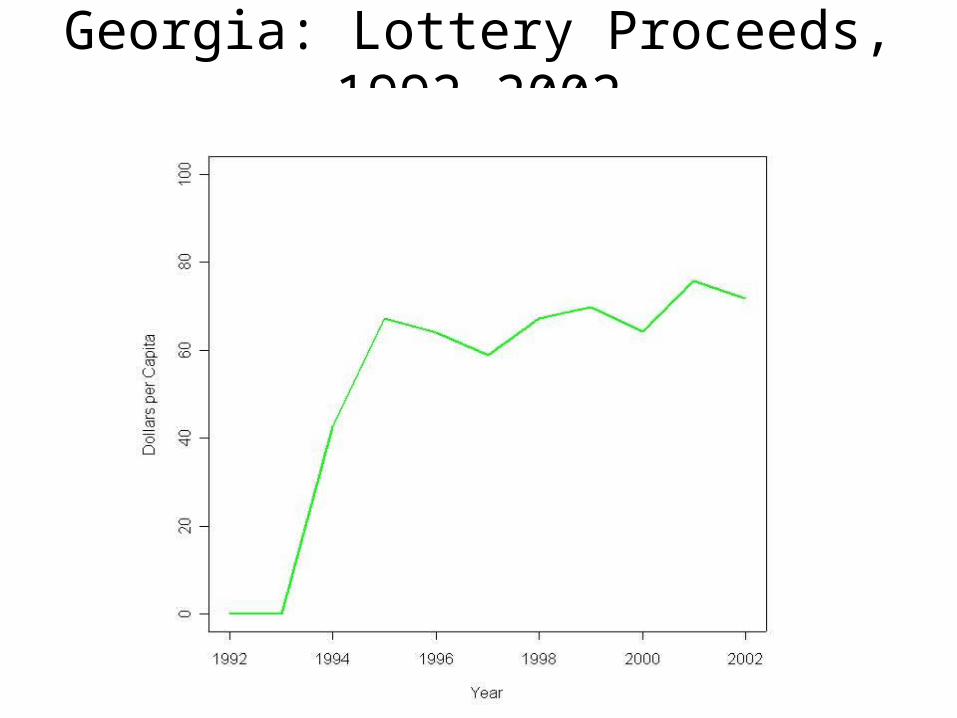
Georgia: Lottery Proceeds, 1992-2002
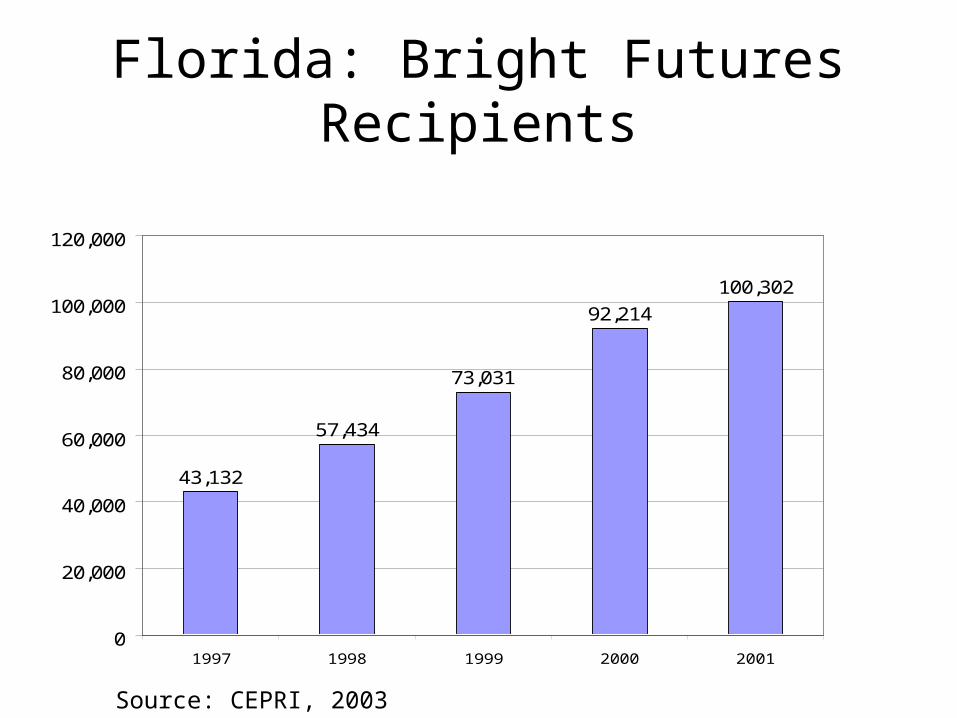
Florida: Bright Futures Recipients
43,132
57,434
73,031
92,214
100,302
0
20,000
40,000
60,000
80,000
100,000
120,000
1997 1998 1999 2000 2001
Source: CEPRI, 2003
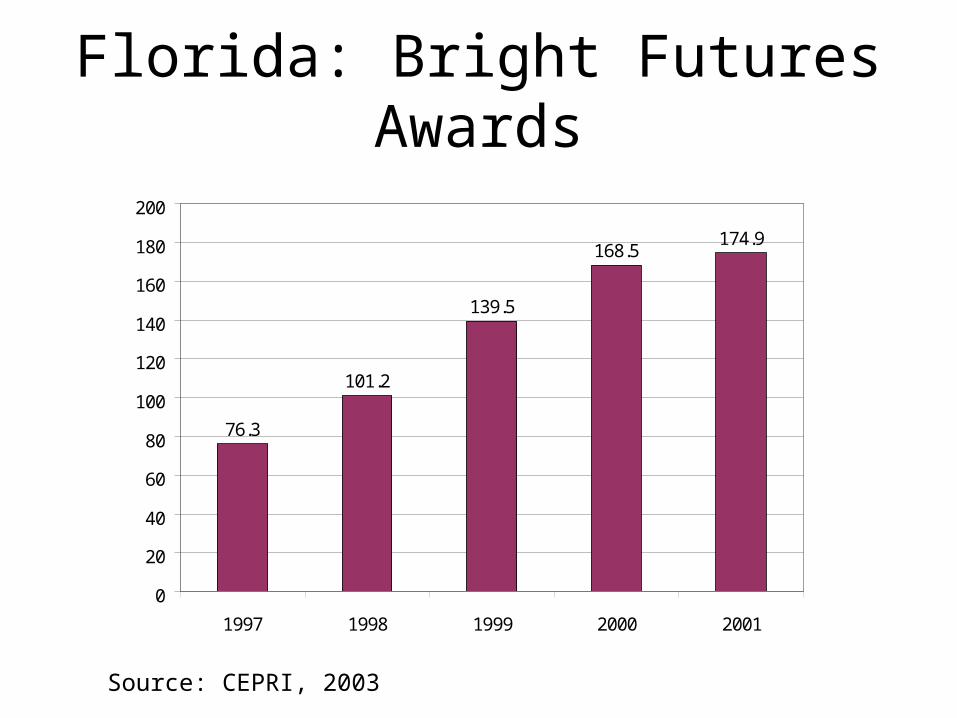
Florida: Bright Futures Awards
76.3
101.2
139.5
168.5174.9
0
20
40
60
80
100
120
140
160
180
200
1997 1998 1999 2000 2001
Source: CEPRI, 2003
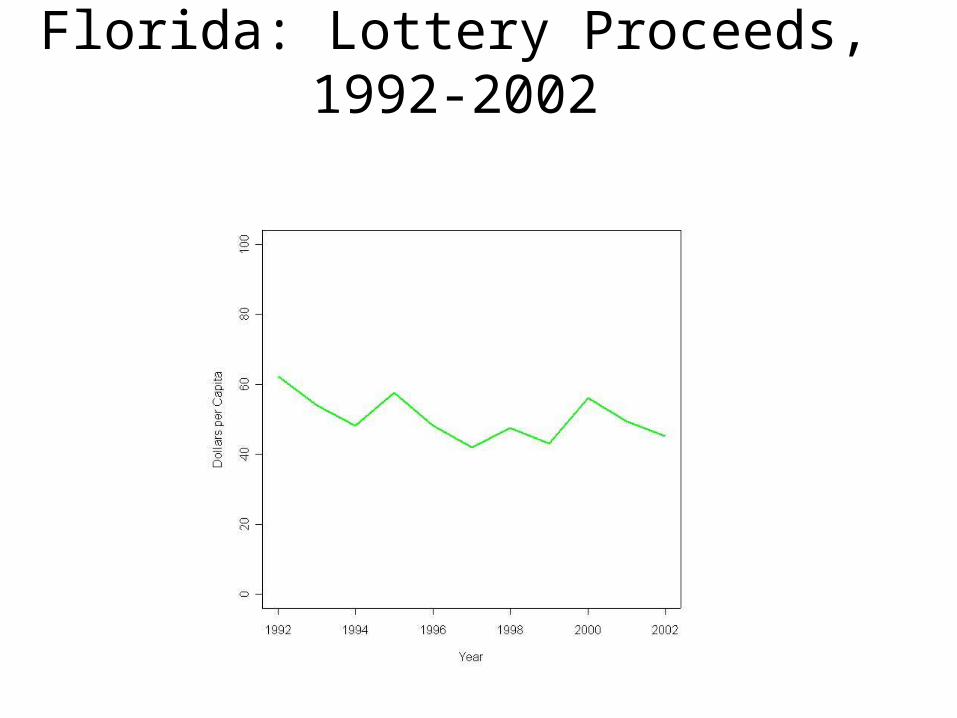
Florida: Lottery Proceeds, 1992-2002
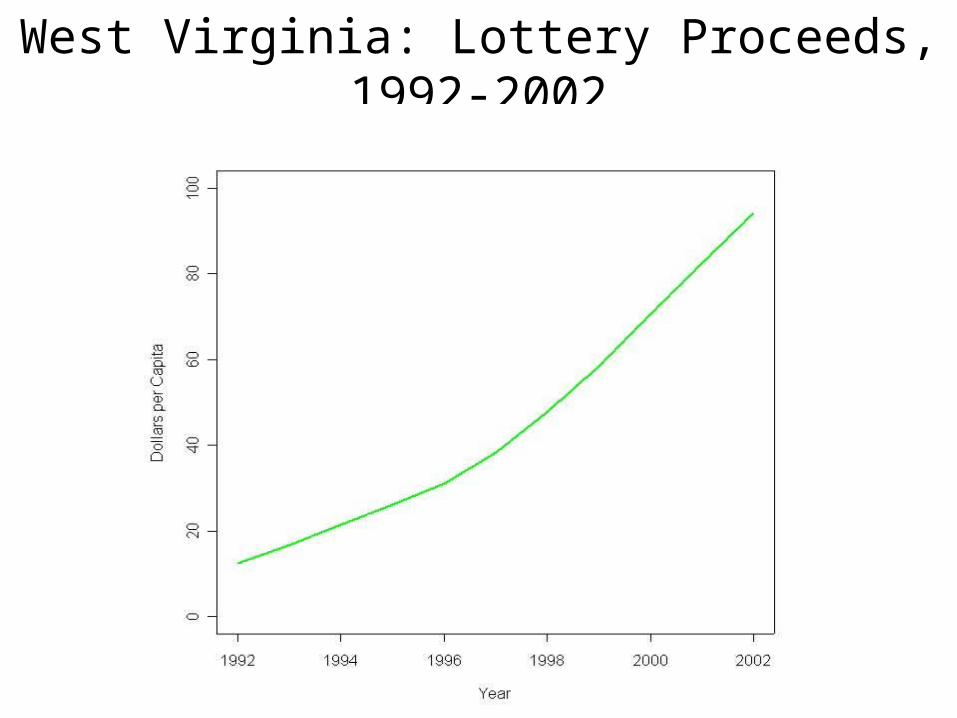
West Virginia: Lottery Proceeds, 1992-2002
Issues for the Future
• Long term academic effects:– Retention/completion– Academic major– High school performance
• Effects on need based aid– Squeezing out of need-based programs– Need within merit/ Merit within need programs