Embed Size (px)
Citation preview
Low beam intensity
(MERIT beam spot size – part II)
Goran Skoro
30 June 2008
Reminder: Idea and Procedure
454 484
TARGET
BEAM
414R
ela
tive
inte
nsit
yDistributions of the ratios
of the Gaussian sigmas
484
454
x
x
484
454
y
y
484
484
y
x
Mean = 1.07
Mean = 1.41
Mean = 1.80
‘Beam optics’ ~ 1
‘Beam optics’ ~ 1.33
Expected value = 5 (?)
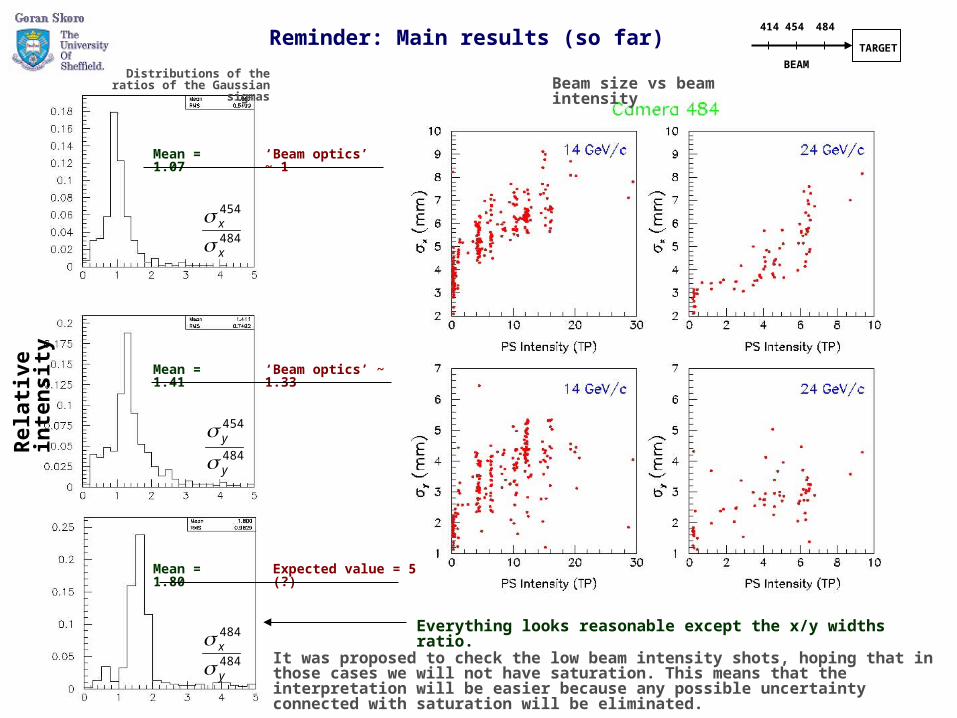
Beam size vs beam intensity
Everything looks reasonable except the x/y widths ratio.
Reminder: Main results (so far)
It was proposed to check the low beam intensity shots, hoping that in those cases we will not have saturation. This means that the interpretation will be easier because any possible uncertainty connected with saturation will be eliminated.
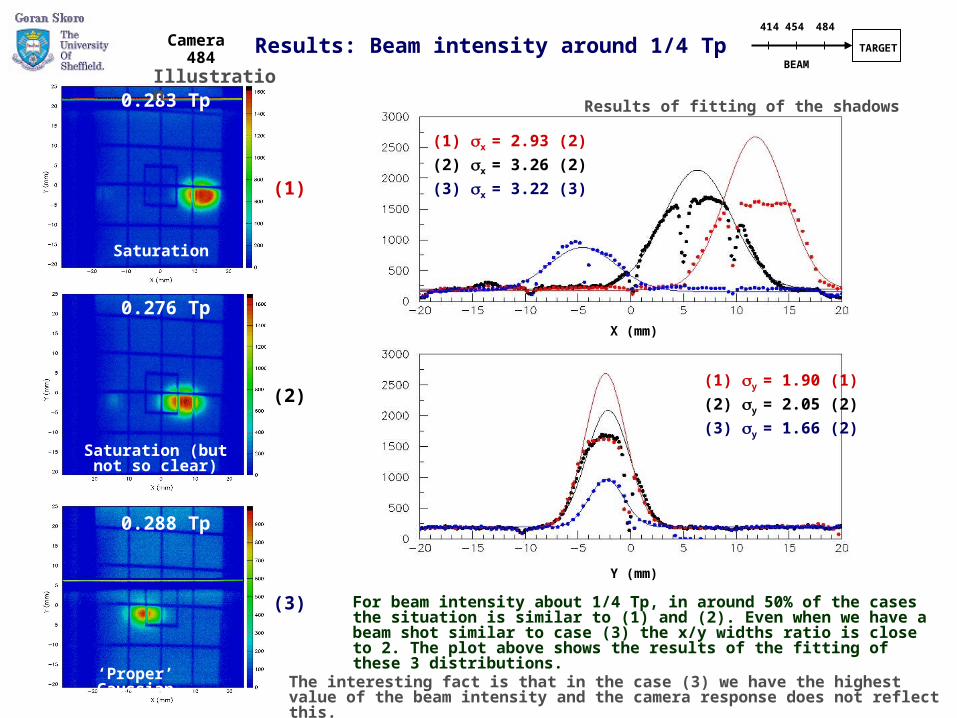
Results of fitting of the shadows
X (mm)
Y (mm)
(1) x = 2.93 (2)
(2) x = 3.26 (2)
(3) x = 3.22 (3)
(1) y = 1.90 (1)
(2) y = 2.05 (2)
(3) y = 1.66 (2)
454 484
TARGET
BEAM
414
Results: Beam intensity around 1/4 Tp
For beam intensity about 1/4 Tp, in around 50% of the cases the situation is similar to (1) and (2). Even when we have a beam shot similar to case (3) the x/y widths ratio is close to 2. The plot above shows the results of the fitting of these 3 distributions.
0.283 Tp
0.276 Tp
0.288 Tp
(1)
(2)
(3)
Illustration
Saturation
Saturation (but not so clear)
‘Proper’ Gaussian
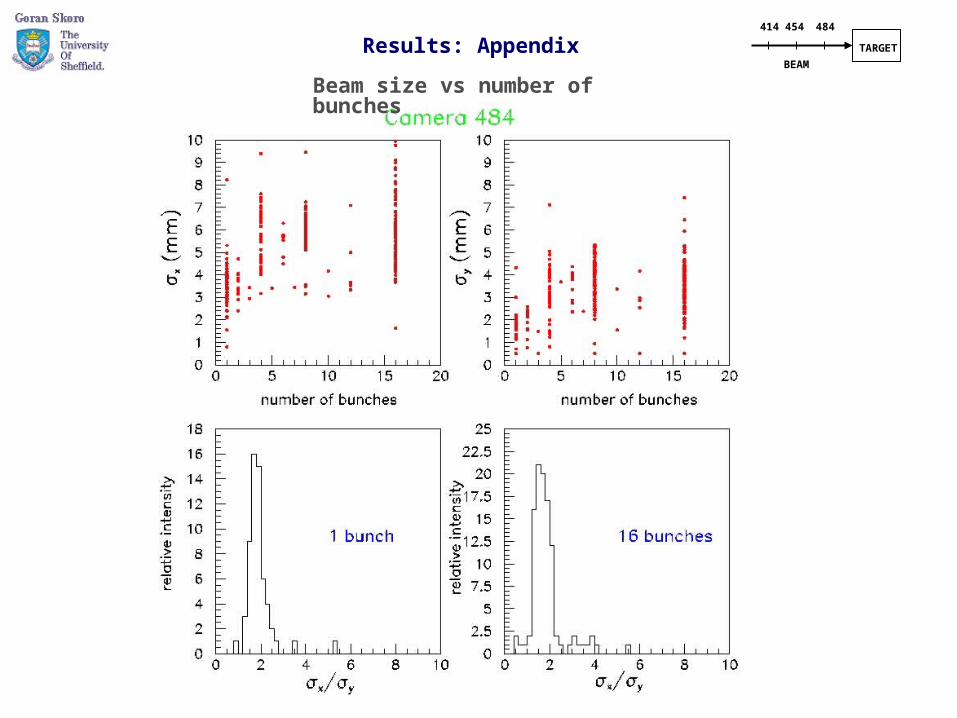
Camera 484
The interesting fact is that in the case (3) we have the highest value of the beam intensity and the camera response does not reflect this.
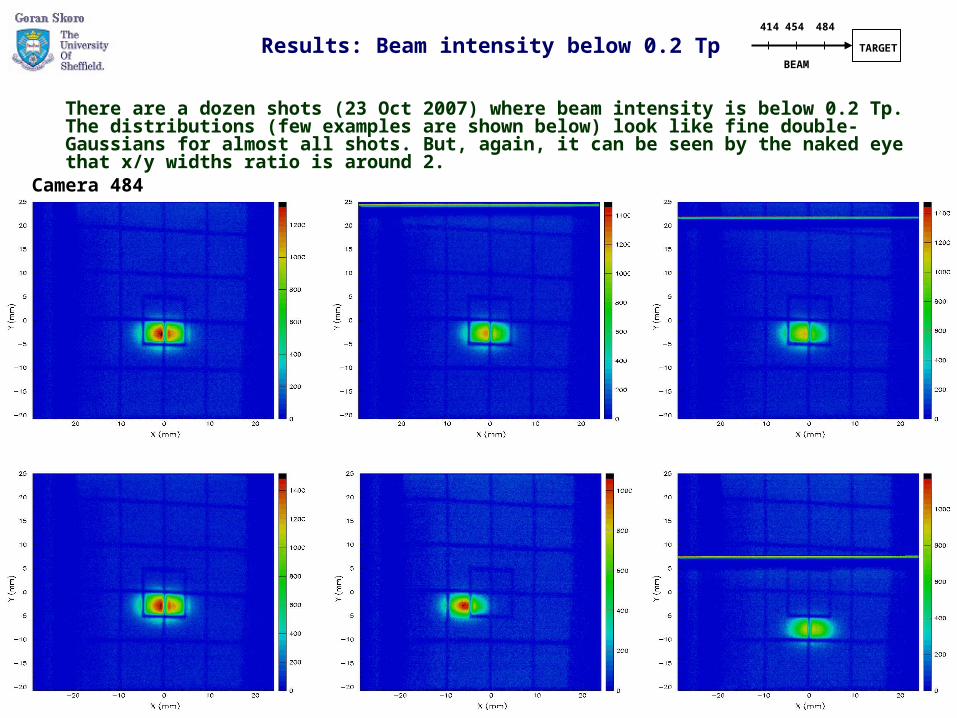
Results: Beam intensity below 0.2 Tp454 484
TARGET
BEAM
414
There are a dozen shots (23 Oct 2007) where beam intensity is below 0.2 Tp. The distributions (few examples are shown below) look like fine double-Gaussians for almost all shots. But, again, it can be seen by the naked eye that x/y widths ratio is around 2.
Camera 484
454 484
TARGET
BEAM
414
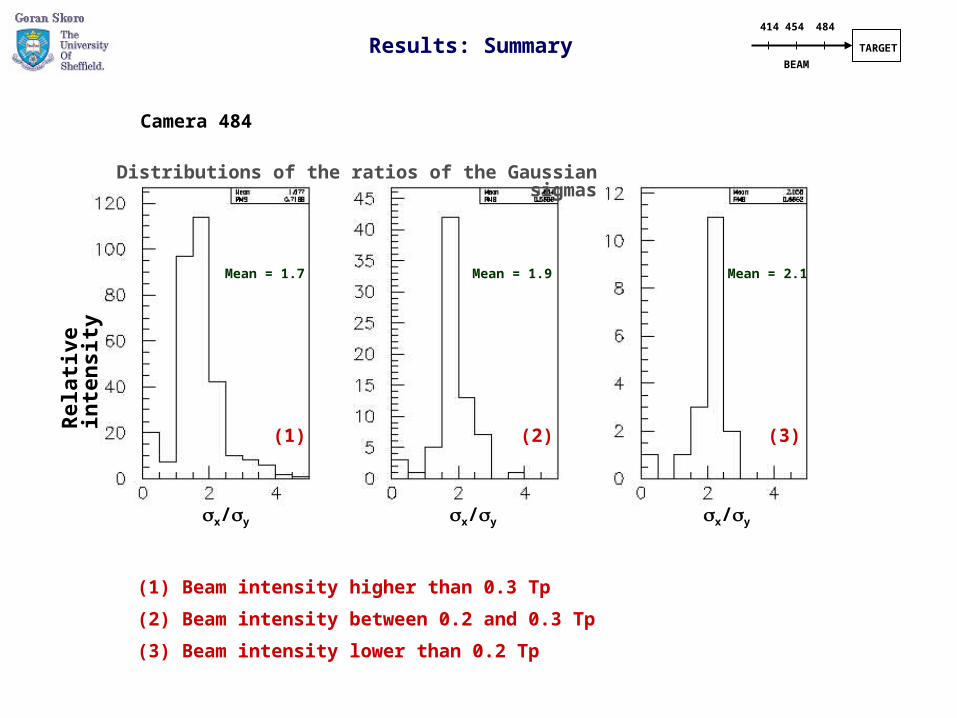
Results: Summary
Camera 484
x/y x/y x/y
Rela
tive
inte
nsit
y
Mean = 1.7 Mean = 1.9 Mean = 2.1
(1) (2) (3)
Distributions of the ratios of the Gaussian sigmas
(1) Beam intensity higher than 0.3 Tp
(2) Beam intensity between 0.2 and 0.3 Tp
(3) Beam intensity lower than 0.2 Tp
454 484
TARGET
BEAM
414
Results: Appendix
Beam size vs number of bunches