Embed Size (px)
Citation preview
Low-carbohydrate diets differing incarbohydrate restriction improvecardiometabolic and anthropometricmarkers in healthy adults: A randomisedclinical trialCliff J. d. C. Harvey1, Grant M. Schofield1, Caryn Zinn1,Simon J. Thornley1, Catherine Crofts1 and Fabrice L. R. Merien2
1 Human Potential Centre, Auckland University of Technology, Auckland, New Zealand2 AUT-Roche Diagnostics Laboratory, School of Science, Auckland University of Technology,Auckland, New Zealand
ABSTRACTBackground: Low-carbohydrate, high-fat (LCHF) diets are useful for treating a rangeof health conditions, but there is little research evaluating the degree of carbohydraterestriction on outcome measures. This study compares anthropometric andcardiometabolic outcomes between differing carbohydrate-restricted diets.Objective: Our hypothesis was that moderate carbohydrate restriction is easier tomaintain and more effective for improving cardiometabolic health markers thangreater restriction.Design: A total of 77 healthy participants were randomised to a verylow-carbohydrate ketogenic diet (VLCKD), low-carbohydrate diet (LCD), ormoderate-low carbohydrate diet (MCD), containing 5%, 15% and 25% total energyfrom carbohydrate, respectively, for 12-weeks. Anthropometric and metabolichealth measures were taken at baseline and at 12 weeks. Using ANOVA, both withinand between-group outcomes were analysed.Results: Of 77 participants, 39 (51%) completed the study. In these completersoverall, significant reductions in weight and body mass index occurred((mean change) 3.7 kg/m2; 95% confidence limits (CL): 3.8, 1.8), along withincreases in high-density lipoprotein cholesterol, low-density lipoproteincholesterol, (0.49 mmol/L; 95% CL; 0.06, 0.92; p = 0.03), and total cholesterolconcentrations (0.11 mmol/L; 95% CL; 0.00, 0.23; p = 0.05). Triglyceride (TG)levels were reduced by 0.12 mmol/L (95% CL; -0.20, 0.02; p = 0.02). No significantchanges occurred between groups. The largest improvements in high densitylipoprotein cholesterol (HDL-c) and TG and anthropometric changes occurredfor the VLCKD group.Conclusions: Low-carbohydrate, high-fat diets have a positive effect on markers ofhealth. Adherence to the allocation of carbohydrate was more easily achievedin MCD, and LCD groups compared to VLCKD and there were comparableimprovements in weight loss and waist circumference and greater improvementsin HDL-c and TG with greater carbohydrate restriction.
How to cite this articleHarvey CJdC, Schofield GM, Zinn C, Thornley SJ, Crofts C, Merien FLR. 2019. Low-carbohydrate diets differing incarbohydrate restriction improve cardiometabolic and anthropometric markers in healthy adults: A randomised clinical trial. PeerJ 7:e6273DOI 10.7717/peerj.6273
Submitted 2 October 2018Accepted 11 December 2018Published 5 February 2019
Corresponding authorCliff J. d. C. Harvey, [email protected]
Academic editorStefano Menini
Additional Information andDeclarations can be found onpage 16
DOI 10.7717/peerj.6273
Copyright2019 Harvey et al.
Distributed underCreative Commons CC-BY 4.0
Subjects Nutrition, Public Health, Metabolic SciencesKeywords Low-carbohydrate, Diet, Nutrition, Ketogenic, Adherence, Carbohydrate restriction,LCHF, Cardiometabolic health
INTRODUCTIONLow-carbohydrate, high-fat (LCHF) and very low-carbohydrate ketogenic diets (VLCKD)are increasingly used for the management of a range of health conditions, includingneurological disorders, obesity, diabetes, metabolic syndrome, and various cancers(Castro et al., 2015; Henderson et al., 2006; Keene, 2006; Kulak & Polotsky, 2013; Lefevre &Aronson, 2000; Levy et al., 2012; Maalouf, Rho & Mattson, 2009; Neal et al., 2008;Paoli et al., 2013; Sumithran & Proietto, 2008; Varshneya et al., 2015). They are also usedwidely in the general population for weight-loss and maintenance, (Bueno et al., 2013) withimproved satiety and control of hunger frequently reported by those who adhere tothese diets (Johnstone et al., 2008; McClernon et al., 2007; Paoli et al., 2015). Despite thepotential offered by LCHF and low-carbohydrate, high-protein diets, there is little evidencefor the superiority of greater carbohydrate restriction compared to moderate.Systematic reviews show that despite greater weight- and fat-loss initially, over longertimeframes, when energy intake is restricted, there is little difference in outcomes forweight-loss, total and low density liproprotein cholesterol (LDL-c) concentrations betweendiets that are higher or lower in carbohydrate (Hernández Alcantara, Jiménez Cruz &Bacardí Gascón, 2015; Huntriss, Campbell & Bedwell, 2017; Naude et al., 2014; Snorgaardet al., 2017; Van Wyk, Davis & Davies, 2016). However, there are greater reductionsin fasted glucose concentrations (Snorgaard et al., 2017), and greater improvements inhigh density lipoprotein cholesterol (HDL-c) and glycated haemoglobin (HbA1c)with greater degrees of carbohydrate restriction (Huntriss, Campbell & Bedwell, 2017).Controversy exists about the nature of low-carbohydrate diets (LCD) and VLCKDs(Wood & Fernandez, 2009), and definitions for LCDs range from 20 to 200 g ofcarbohydrate per day (Last & Wilson, 2006; Westman et al., 2007), or up to 40–45% ofdaily energy from carbohydrate (Hu et al., 2012; Wheeler et al., 2012). Definitions forVLCKDs are similarly vague. The accepted definition for nutritional ketosis (NK) in theclinical nutrition field has become the achievement of �0.5 mmol/L ß- hydroxybutyrate,as the majority of people following a VLCKD achieve this level of blood ketones(Gibson et al., 2015), and this threshold has been used by several studies as an indicator ofentry into NK (Guerci et al., 2003; Harvey et al., 2018). Ketonaemia consistent withNK typically results from diets containing a 3:1–4:1 ratio of lipids to non-lipidmacronutrients, or at least 75% of calories coming from lipids, very low carbohydrates(often less than 50 g) and low-to-moderate amounts of protein (Livingston, Pauli &Pruce, 1977; Livingstone, 1972), or diets containing 60–75% of calories from lipids thatinclude a high proportion of medium chain triglycerides (Huttenlocher, Wilbourn &Signore, 1971; Huttenlocher, 1976). Studies report that adherence is difficult with extremecarbohydrate restriction, that is, <50 g of carbohydrate per day (Huntriss, Campbell &Bedwell, 2017), but insulin-resistant (IR) people may be less likely to adhere to a low-fat,high-carbohydrate diet, compared to those who are more insulin-sensitive (IS).
Harvey et al. (2019), PeerJ, DOI 10.7717/peerj.6273 2/19
Adherence and weight-loss are similar between both IR and IS participants allocated to aless restrictive LCD (McClain et al., 2013).
Few studies directly compare very LCDs with less extreme carbohydrate-restricted diets.Johnstone and colleagues compared the effects of a non-ketogenic LCD (fat 30% oftotal energy (TE); carbohydrate 40% of TE) to a ketogenic, LCD (fat 60% TE; carbohydrate5%TE) in 20 adults over 6 weeks, finding that the diets were equally effective in reducingbody weight and insulin resistance (Johnston et al., 2006).
Our hypothesis was that moderate carbohydrate restriction may be easier to maintain,and thus more effective than greater degrees of carbohydrate restriction. The aim ofthe present study therefore, is to compare anthropometric and cardiometabolic outcomesbetween a VLCKD, LCD, and moderate-low carbohydrate diet (MCD), containing 5%,15%, and 25% TE from carbohydrate, respectively, in healthy adults.
MATERIALS AND METHODSPopulationA total of 77 participants, 25 males, 52 females (mean age: 39 years, range: 25–49; meanbody mass index (BMI) 27 kg/m2, range: 20–39) were recruited between the 7th and 19thof August 2017 and gave written, informed consent to participate in this 12-week,randomised, clinical intervention study. The study took place between 11th September and10th December 2017. Collection of data and analysis was performed at AUT’s HumanPotential Centre, Auckland, New Zealand.
Inclusion and exclusion criteriaParticipants were required to be healthy and between the ages of 25 and 49 years.Exclusion criteria were; underweight (<18.5 BMI kg/m2), diagnosed with diabetes,diagnosed with any serious medical condition, having previously following a ketogenicdiet, or being a current or former client of any of the researchers in clinical practice.
Ethical approvalThe trial was registered by the Australia New Zealand Clinical Trial Registry.(ACTRN12617000421336p). Ethics approval for this study was granted by the SouthernCommittee of the Health and Disability Ethics Committee of New Zealand. 17/STH/60.
Dietary interventions and allocationParticipants completed baseline testing of blood and basic anthropometric measuresand a lead-in dietary recording week to identify habitual calorie intake. Participants wererandomised by the study statistician to one of three LCD plans which advised intakes ofeither 5%, 15%, or 25% of TE from carbohydrate. The randomisation was stratifiedby gender, using a pre-prepared sequence, with investigators blinded to treatmentallocation at baseline and follow-up. Participants were assigned to the next treatmentgroup according to their order of recruitment. The primary researcher responsible forinitial statistical analysis was blinded to the treatment group allocation until thisanalysis had been completed.
Harvey et al. (2019), PeerJ, DOI 10.7717/peerj.6273 3/19
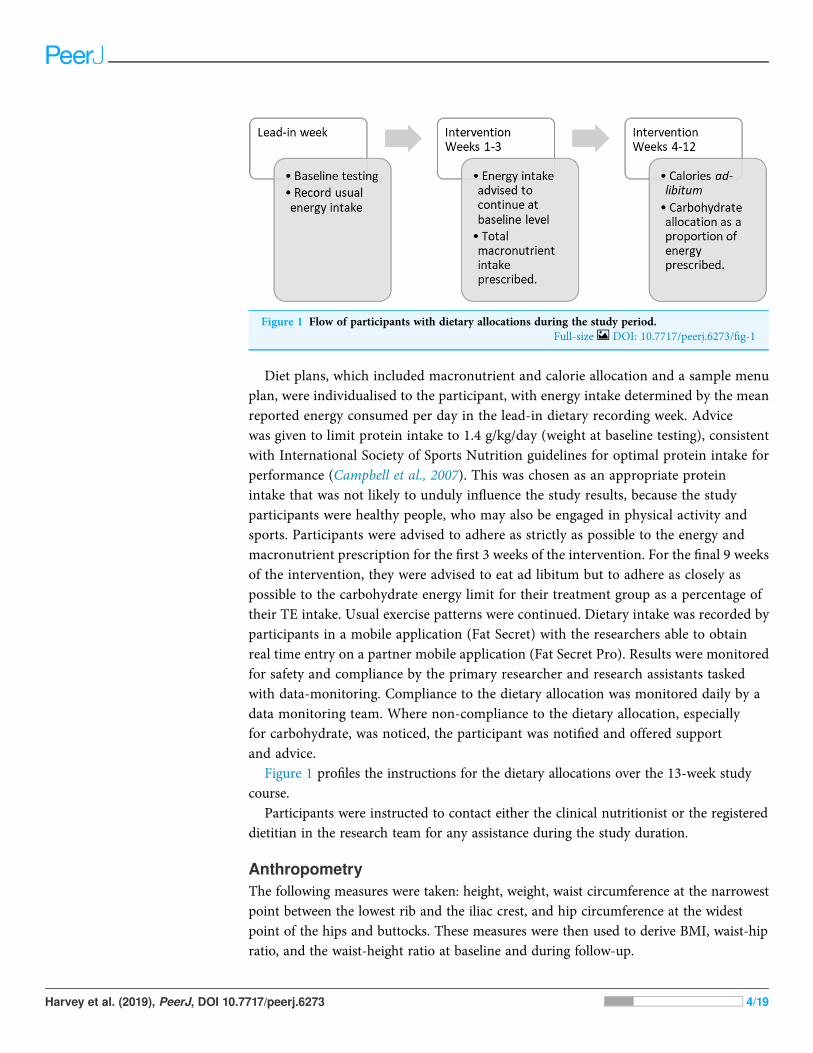
Diet plans, which included macronutrient and calorie allocation and a sample menuplan, were individualised to the participant, with energy intake determined by the meanreported energy consumed per day in the lead-in dietary recording week. Advicewas given to limit protein intake to 1.4 g/kg/day (weight at baseline testing), consistentwith International Society of Sports Nutrition guidelines for optimal protein intake forperformance (Campbell et al., 2007). This was chosen as an appropriate proteinintake that was not likely to unduly influence the study results, because the studyparticipants were healthy people, who may also be engaged in physical activity andsports. Participants were advised to adhere as strictly as possible to the energy andmacronutrient prescription for the first 3 weeks of the intervention. For the final 9 weeksof the intervention, they were advised to eat ad libitum but to adhere as closely aspossible to the carbohydrate energy limit for their treatment group as a percentage oftheir TE intake. Usual exercise patterns were continued. Dietary intake was recorded byparticipants in a mobile application (Fat Secret) with the researchers able to obtainreal time entry on a partner mobile application (Fat Secret Pro). Results were monitoredfor safety and compliance by the primary researcher and research assistants taskedwith data-monitoring. Compliance to the dietary allocation was monitored daily by adata monitoring team. Where non-compliance to the dietary allocation, especiallyfor carbohydrate, was noticed, the participant was notified and offered supportand advice.
Figure 1 profiles the instructions for the dietary allocations over the 13-week studycourse.
Participants were instructed to contact either the clinical nutritionist or the registereddietitian in the research team for any assistance during the study duration.
AnthropometryThe following measures were taken: height, weight, waist circumference at the narrowestpoint between the lowest rib and the iliac crest, and hip circumference at the widestpoint of the hips and buttocks. These measures were then used to derive BMI, waist-hipratio, and the waist-height ratio at baseline and during follow-up.
Figure 1 Flow of participants with dietary allocations during the study period.Full-size DOI: 10.7717/peerj.6273/fig-1
Harvey et al. (2019), PeerJ, DOI 10.7717/peerj.6273 4/19
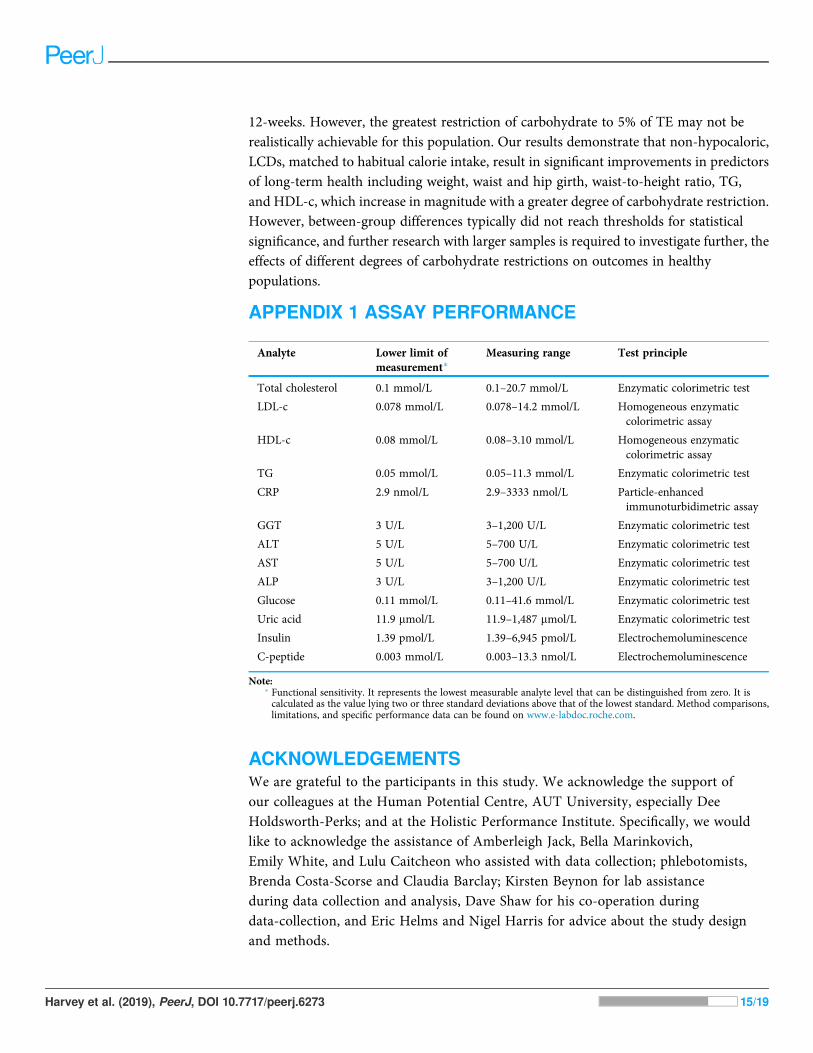
Blood measuresFollowing an overnight fast, blood samples were obtained from participants, before thefirst meal, via venipuncture by a certified phlebotomist from an antecubital vein andcollected into plasma separation tubes (PST) Vacutainer tubes using lithium-heparin asthe anticoagulant (Becton Dickinson, Franklin Lakes, NJ, USA). Within 15 min ofcollection, tubes were centrifuged at 1,500�g revolutions per minute for 10 min at +4 �C,and plasma samples were transferred into clean polypropylene tubes and frozen at -80 �Cuntil analyses were conducted using specific diagnostics assays on a Roche Modularanalyser (P800 and E170). Blood samples were analysed for total cholesterol (Total-c),LDL-c, HDL-c, triglycerides (TG), C-reactive protein (CRP), gamma-glutamyl transferase(GGT), alanine aminotransferase (ALT), aspartate aminotransferase, alkaline phosphatase(ALP), glucose and uric acid on the P800 module. Insulin, and C-peptide concentrationswere measured on the E170 module. All analytical biomarkers were measured at baselineand immediately following the 12-week intervention. The total duration of the assay foreach analyte was less than 20 min based on the electrochemiluminescence principle(ruthenium-conjugated monoclonal antibodies) for the E170 module and specific enzymeassay methods for the P800 module. Quantitative results were determined viainstrument-specific full point calibration curves and validated with specific controls.Additional information for analytes, lower limits of measurement, measuring range,and test principle can be found in Appendix 1.
Statistical analysesEffects of the dietary interventions on outcomes were determined for each participantby calculating the change in the various measures from baseline. The significance of thesewithin-group changes from baseline was determined by a paired t-test. All between-groupvariations were compared using ANOVA. A 5% two-sided alpha level was used todetermine significance. Further comparisons were made by undertaking multiple linearregression with adjustment made for variables recorded at baseline. A sensitivity analysisof the results was carried out using stabilised inverse-probability of completing weightsfor the BMI change outcome to check whether these results were likely to have beendifferent had the whole group returned for followed-up.
RESULTSA total of 283 people were assessed for eligibility with 206 excluded and 77 included forrandomisation to the trial groups (Fig. 2). A total of 10 participants withdrew afterthey were randomised. Two failed to comply with guidelines to submit baseline data andwithdrew from the study (one male, one female), and three females withdrew due tochanges in personal circumstances, including two who became pregnant. A furtherfive withdrew due to challenges arising from following the diets. The reasons forwithdrawals were as follows: two female participants found the dietary allocationof carbohydrate too difficult to sustain (one each in the 5% and 15% allocation groups);one did not want to continue tracking with the food app; one felt that she could notmaintain her sports performance on 15% TE from carbohydrate; and one female in the
Harvey et al. (2019), PeerJ, DOI 10.7717/peerj.6273 5/19
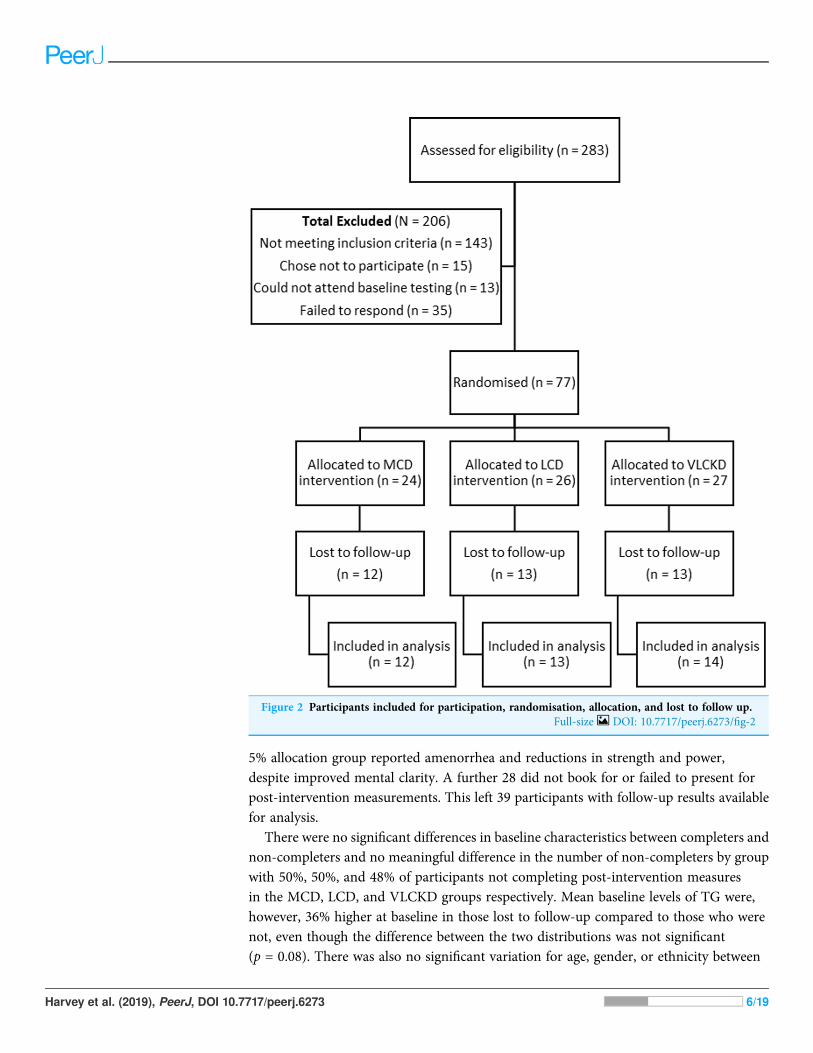
5% allocation group reported amenorrhea and reductions in strength and power,despite improved mental clarity. A further 28 did not book for or failed to present forpost-intervention measurements. This left 39 participants with follow-up results availablefor analysis.
There were no significant differences in baseline characteristics between completers andnon-completers and no meaningful difference in the number of non-completers by groupwith 50%, 50%, and 48% of participants not completing post-intervention measuresin the MCD, LCD, and VLCKD groups respectively. Mean baseline levels of TG were,however, 36% higher at baseline in those lost to follow-up compared to those who werenot, even though the difference between the two distributions was not significant(p = 0.08). There was also no significant variation for age, gender, or ethnicity between
Figure 2 Participants included for participation, randomisation, allocation, and lost to follow up.Full-size DOI: 10.7717/peerj.6273/fig-2
Harvey et al. (2019), PeerJ, DOI 10.7717/peerj.6273 6/19
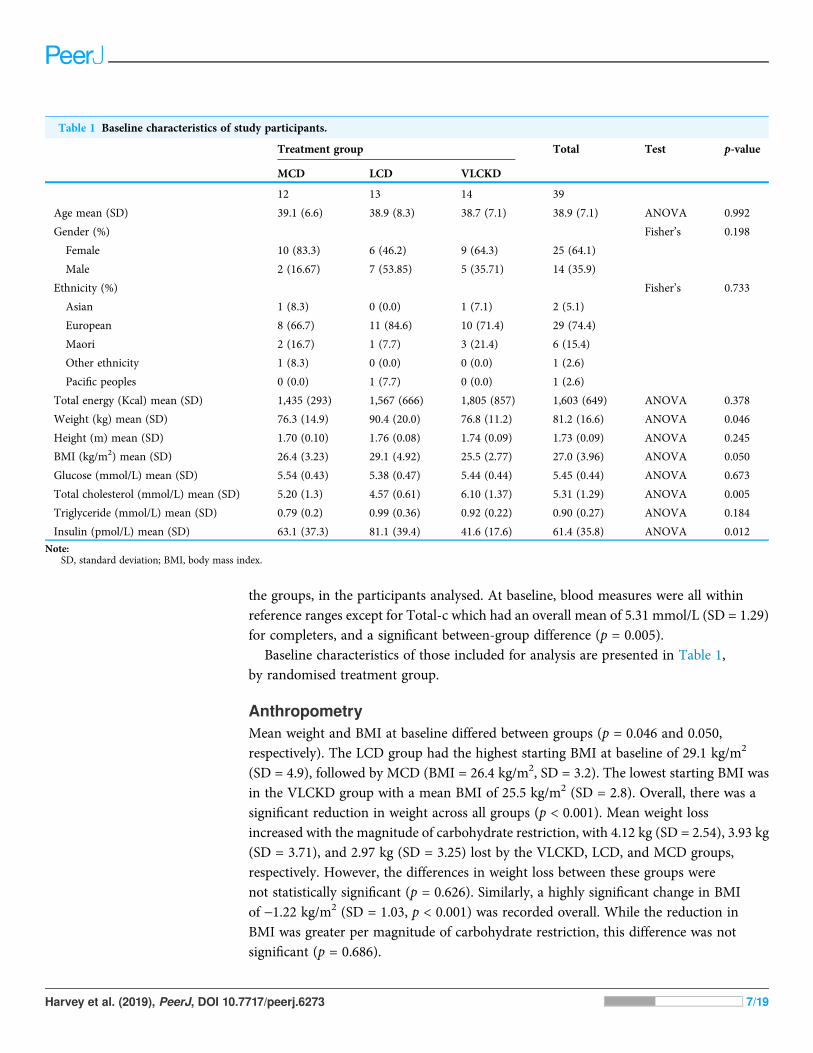
the groups, in the participants analysed. At baseline, blood measures were all withinreference ranges except for Total-c which had an overall mean of 5.31 mmol/L (SD = 1.29)for completers, and a significant between-group difference (p = 0.005).
Baseline characteristics of those included for analysis are presented in Table 1,by randomised treatment group.
AnthropometryMean weight and BMI at baseline differed between groups (p = 0.046 and 0.050,respectively). The LCD group had the highest starting BMI at baseline of 29.1 kg/m2
(SD = 4.9), followed by MCD (BMI = 26.4 kg/m2, SD = 3.2). The lowest starting BMI wasin the VLCKD group with a mean BMI of 25.5 kg/m2 (SD = 2.8). Overall, there was asignificant reduction in weight across all groups (p < 0.001). Mean weight lossincreased with the magnitude of carbohydrate restriction, with 4.12 kg (SD = 2.54), 3.93 kg(SD = 3.71), and 2.97 kg (SD = 3.25) lost by the VLCKD, LCD, and MCD groups,respectively. However, the differences in weight loss between these groups werenot statistically significant (p = 0.626). Similarly, a highly significant change in BMIof -1.22 kg/m2 (SD = 1.03, p < 0.001) was recorded overall. While the reduction inBMI was greater per magnitude of carbohydrate restriction, this difference was notsignificant (p = 0.686).
Table 1 Baseline characteristics of study participants.
Treatment group Total Test p-value
MCD LCD VLCKD
12 13 14 39
Age mean (SD) 39.1 (6.6) 38.9 (8.3) 38.7 (7.1) 38.9 (7.1) ANOVA 0.992
Gender (%) Fisher’s 0.198
Female 10 (83.3) 6 (46.2) 9 (64.3) 25 (64.1)
Male 2 (16.67) 7 (53.85) 5 (35.71) 14 (35.9)
Ethnicity (%) Fisher’s 0.733
Asian 1 (8.3) 0 (0.0) 1 (7.1) 2 (5.1)
European 8 (66.7) 11 (84.6) 10 (71.4) 29 (74.4)
Maori 2 (16.7) 1 (7.7) 3 (21.4) 6 (15.4)
Other ethnicity 1 (8.3) 0 (0.0) 0 (0.0) 1 (2.6)
Pacific peoples 0 (0.0) 1 (7.7) 0 (0.0) 1 (2.6)
Total energy (Kcal) mean (SD) 1,435 (293) 1,567 (666) 1,805 (857) 1,603 (649) ANOVA 0.378
Weight (kg) mean (SD) 76.3 (14.9) 90.4 (20.0) 76.8 (11.2) 81.2 (16.6) ANOVA 0.046
Height (m) mean (SD) 1.70 (0.10) 1.76 (0.08) 1.74 (0.09) 1.73 (0.09) ANOVA 0.245
BMI (kg/m2) mean (SD) 26.4 (3.23) 29.1 (4.92) 25.5 (2.77) 27.0 (3.96) ANOVA 0.050
Glucose (mmol/L) mean (SD) 5.54 (0.43) 5.38 (0.47) 5.44 (0.44) 5.45 (0.44) ANOVA 0.673
Total cholesterol (mmol/L) mean (SD) 5.20 (1.3) 4.57 (0.61) 6.10 (1.37) 5.31 (1.29) ANOVA 0.005
Triglyceride (mmol/L) mean (SD) 0.79 (0.2) 0.99 (0.36) 0.92 (0.22) 0.90 (0.27) ANOVA 0.184
Insulin (pmol/L) mean (SD) 63.1 (37.3) 81.1 (39.4) 41.6 (17.6) 61.4 (35.8) ANOVA 0.012
Note:SD, standard deviation; BMI, body mass index.
Harvey et al. (2019), PeerJ, DOI 10.7717/peerj.6273 7/19
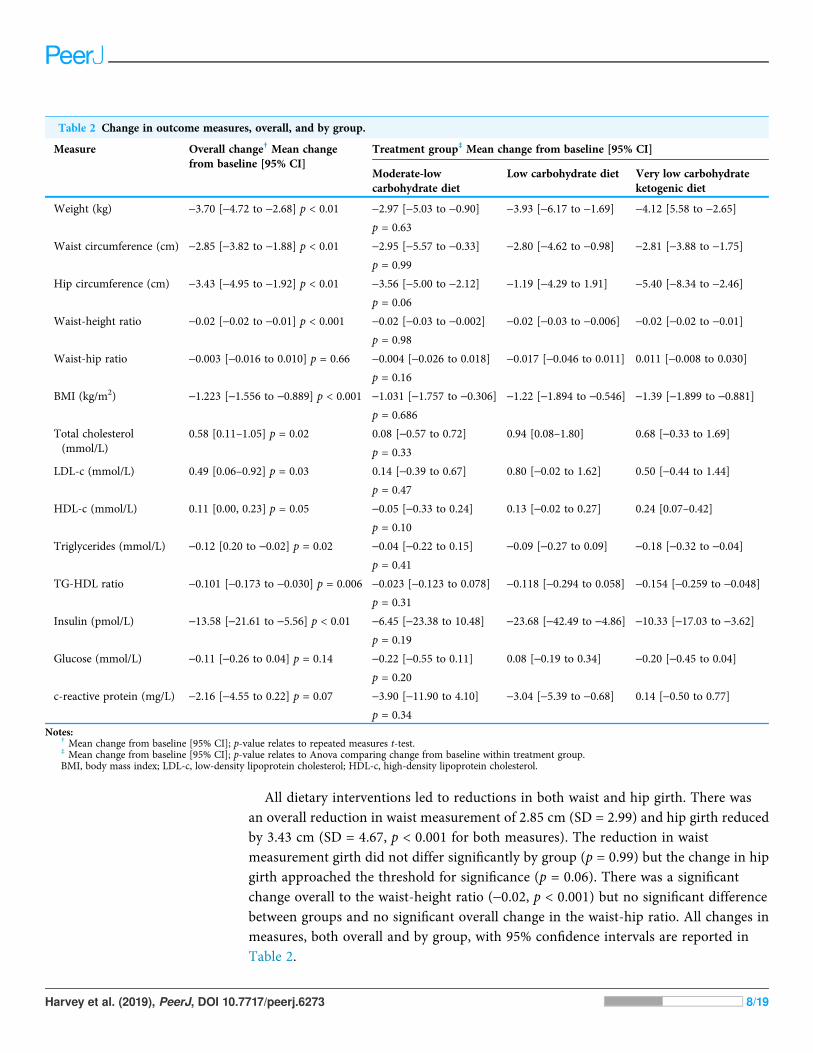
All dietary interventions led to reductions in both waist and hip girth. There wasan overall reduction in waist measurement of 2.85 cm (SD = 2.99) and hip girth reducedby 3.43 cm (SD = 4.67, p < 0.001 for both measures). The reduction in waistmeasurement girth did not differ significantly by group (p = 0.99) but the change in hipgirth approached the threshold for significance (p = 0.06). There was a significantchange overall to the waist-height ratio (-0.02, p < 0.001) but no significant differencebetween groups and no significant overall change in the waist-hip ratio. All changes inmeasures, both overall and by group, with 95% confidence intervals are reported inTable 2.
Table 2 Change in outcome measures, overall, and by group.
Measure Overall change† Mean changefrom baseline [95% CI]
Treatment group‡ Mean change from baseline [95% CI]
Moderate-lowcarbohydrate diet
Low carbohydrate diet Very low carbohydrateketogenic diet
Weight (kg) -3.70 [-4.72 to -2.68] p < 0.01 -2.97 [-5.03 to -0.90] -3.93 [-6.17 to -1.69] -4.12 [5.58 to -2.65]p = 0.63
Waist circumference (cm) -2.85 [-3.82 to -1.88] p < 0.01 -2.95 [-5.57 to -0.33] -2.80 [-4.62 to -0.98] -2.81 [-3.88 to -1.75]p = 0.99
Hip circumference (cm) -3.43 [-4.95 to -1.92] p < 0.01 -3.56 [-5.00 to -2.12] -1.19 [-4.29 to 1.91] -5.40 [-8.34 to -2.46]p = 0.06
Waist-height ratio -0.02 [-0.02 to -0.01] p < 0.001 -0.02 [-0.03 to -0.002] -0.02 [-0.03 to -0.006] -0.02 [-0.02 to -0.01]p = 0.98
Waist-hip ratio -0.003 [-0.016 to 0.010] p = 0.66 -0.004 [-0.026 to 0.018] -0.017 [-0.046 to 0.011] 0.011 [-0.008 to 0.030]
p = 0.16
BMI (kg/m2) -1.223 [-1.556 to -0.889] p < 0.001 -1.031 [-1.757 to -0.306] -1.22 [-1.894 to -0.546] -1.39 [-1.899 to -0.881]p = 0.686
Total cholesterol(mmol/L)
0.58 [0.11–1.05] p = 0.02 0.08 [-0.57 to 0.72] 0.94 [0.08–1.80] 0.68 [-0.33 to 1.69]
p = 0.33
LDL-c (mmol/L) 0.49 [0.06–0.92] p = 0.03 0.14 [-0.39 to 0.67] 0.80 [-0.02 to 1.62] 0.50 [-0.44 to 1.44]
p = 0.47
HDL-c (mmol/L) 0.11 [0.00, 0.23] p = 0.05 -0.05 [-0.33 to 0.24] 0.13 [-0.02 to 0.27] 0.24 [0.07–0.42]
p = 0.10
Triglycerides (mmol/L) -0.12 [0.20 to -0.02] p = 0.02 -0.04 [-0.22 to 0.15] -0.09 [-0.27 to 0.09] -0.18 [-0.32 to -0.04]p = 0.41
TG-HDL ratio -0.101 [-0.173 to -0.030] p = 0.006 -0.023 [-0.123 to 0.078] -0.118 [-0.294 to 0.058] -0.154 [-0.259 to -0.048]p = 0.31
Insulin (pmol/L) -13.58 [-21.61 to -5.56] p < 0.01 -6.45 [-23.38 to 10.48] -23.68 [-42.49 to -4.86] -10.33 [-17.03 to -3.62]p = 0.19
Glucose (mmol/L) -0.11 [-0.26 to 0.04] p = 0.14 -0.22 [-0.55 to 0.11] 0.08 [-0.19 to 0.34] -0.20 [-0.45 to 0.04]
p = 0.20
c-reactive protein (mg/L) -2.16 [-4.55 to 0.22] p = 0.07 -3.90 [-11.90 to 4.10] -3.04 [-5.39 to -0.68] 0.14 [-0.50 to 0.77]
p = 0.34
Notes:† Mean change from baseline [95% CI]; p-value relates to repeated measures t-test.‡ Mean change from baseline [95% CI]; p-value relates to Anova comparing change from baseline within treatment group.BMI, body mass index; LDL-c, low-density lipoprotein cholesterol; HDL-c, high-density lipoprotein cholesterol.
Harvey et al. (2019), PeerJ, DOI 10.7717/peerj.6273 8/19
Blood measuresThis paper focuses on the key cardiometabolic outcome measures of Total-c, LDL-c,HDL-c, TG, CRP, glucose, and insulin. Liver enzymes and uric acid were included in theinitial analysis as they are emerging markers of interest for metabolic syndrome andinsulin resistance (Babio et al., 2015; Ballestri et al., 2016). One participant had GGT levelsabove the reference range upper limit of 60 U/L. This was reduced from baseline tocompletion; 143 to 106 U/L. Another participant had baseline levels of ALT of 79 U/Lwhich normalised to 30 U/L at completion (reference range upper limit, 45 U/L).Overall, there was no meaningful change in liver enzymes or uric acid and the differencesbetween groups were not significant.
The most meaningful changes observed were for CRP and insulin. CRP was reduced inthe MCD and LCD treatment groups overall by -3.90 mg/L (SD = 12.60), and -3.04 mg/L(SD = 3.90), respectively. There was a marginal increase in CRP in the VLCKD groupof 0.14 mg/L (SD = 1.10) which we would not consider to be meaningful. While theoverall change from baseline CRP approached the threshold for significance (p = 0.074),there was no difference between the groups (p = 0.339). While at baseline, no significantdifference for CRP was present between groups (p = 0.346), there were severalreadings for CRP that were above the reference range upper limit of five mg/L.The highest reading of 46.9 mg/L was recorded in the MCD group and there were alsothree readings >5 mg/L in the LCD group, with the highest maximal reading of 13 mg/L.Conversely, the maximal recorded value for CRP in the VLCKD group at baselinewas 2.6 mg/L. On follow-up, all results were <5 mg/L.
Insulin concentration was reduced overall by 13.6 pmol/L (SD = 24.8, p < 0.001).The greatest change occurred in the LCD group, followed by the VLCKD group, with thesmallest change in the MLC group. The difference between groups, however, was notstatistically significant (p = 0.185).
Statistically significant changes, albeit of a relatively small magnitude, occurred forTotal-c, LDL-c, and HDL-c, which were all increased at completion vs baseline, andfor TG which were reduced, with no significant variation between groups. No meaningfulchange from baseline was observed for fasted glucose. There was however, a significantimprovement in the TG-HDL ratio of -0.102 (SD = 0.220, p = 0.006). This improvement wasincreased with greater carbohydrate restriction with changes of -0.023 (SD = 0.158),-0.118 (SD = 0.291) and -0.154 (SD = 0.182), for MCD, LCD, and VLCKD, respectively(p = 0.308).
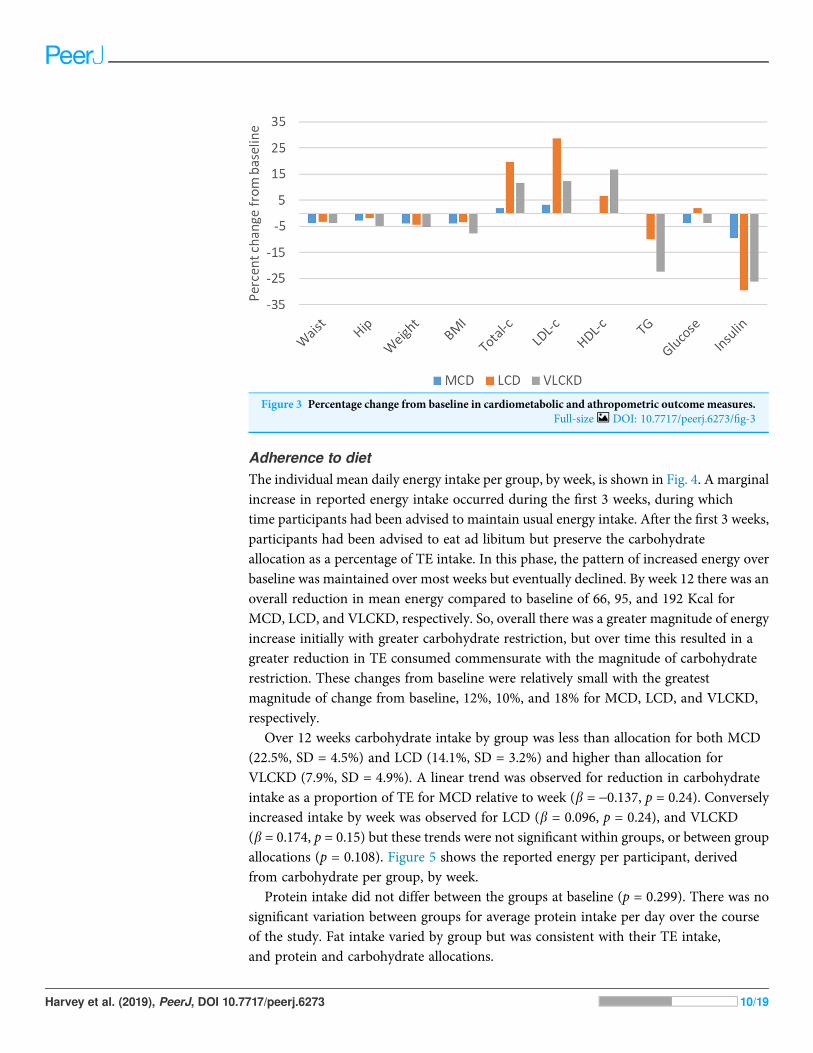
Large proportional changes from baseline occurred for insulin, TG, Total-c, LDL-c, andHDL-c. Proportional increases from baseline for Total-c and LDL-c were greatest forLCD, followed by VLCKD, and MCD. There was no relative change from baseline forboth TG and HDL-c in the MCD group. Improvements in HDL-c and TG occurred for theLCD group, with the greatest proportional change in the VLCKD group. There wererelatively minor proportional changes for the remaining measures. (Fig. 3.) All changes inreported measures, overall and by group, with 95% confidence intervals, are reportedin Table 2.
Harvey et al. (2019), PeerJ, DOI 10.7717/peerj.6273 9/19
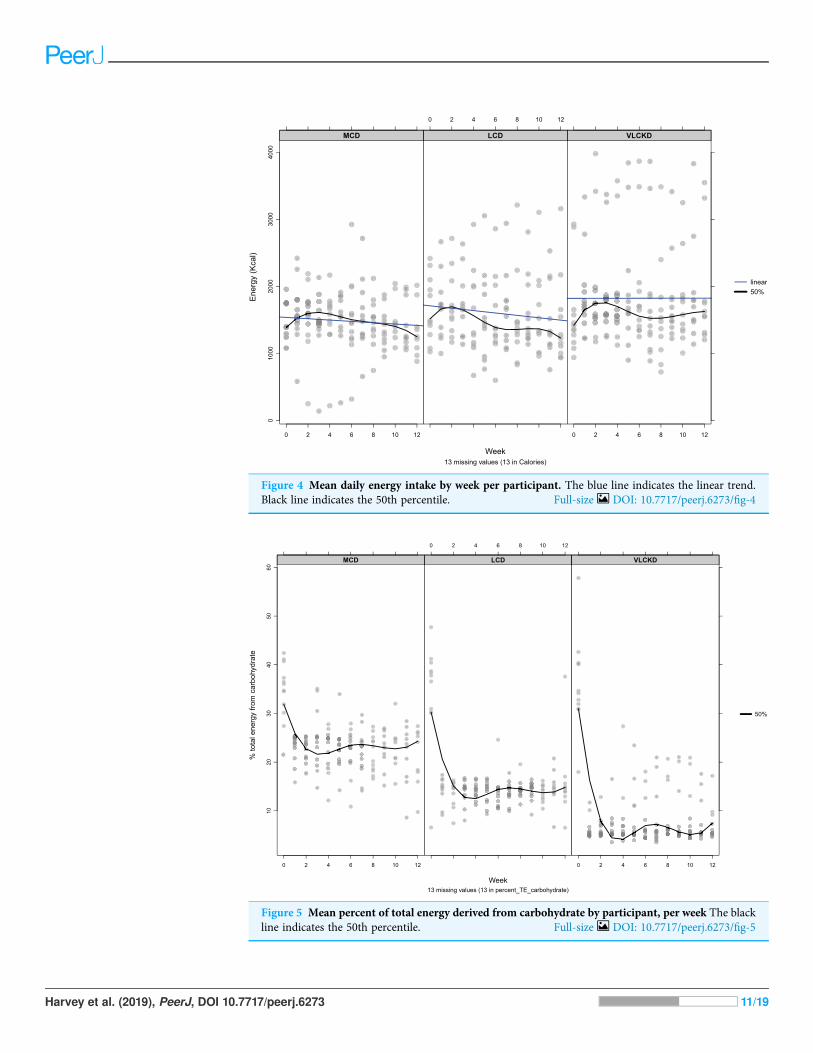
Adherence to dietThe individual mean daily energy intake per group, by week, is shown in Fig. 4. A marginalincrease in reported energy intake occurred during the first 3 weeks, during whichtime participants had been advised to maintain usual energy intake. After the first 3 weeks,participants had been advised to eat ad libitum but preserve the carbohydrateallocation as a percentage of TE intake. In this phase, the pattern of increased energy overbaseline was maintained over most weeks but eventually declined. By week 12 there was anoverall reduction in mean energy compared to baseline of 66, 95, and 192 Kcal forMCD, LCD, and VLCKD, respectively. So, overall there was a greater magnitude of energyincrease initially with greater carbohydrate restriction, but over time this resulted in agreater reduction in TE consumed commensurate with the magnitude of carbohydraterestriction. These changes from baseline were relatively small with the greatestmagnitude of change from baseline, 12%, 10%, and 18% for MCD, LCD, and VLCKD,respectively.
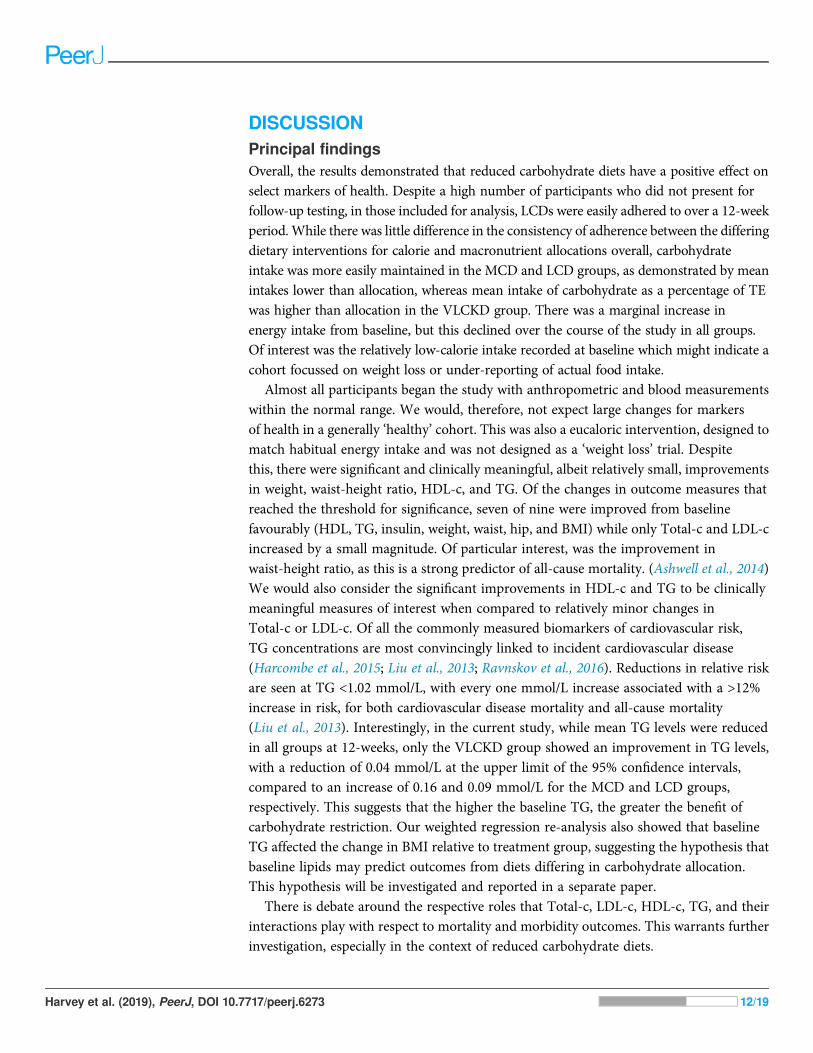
Over 12 weeks carbohydrate intake by group was less than allocation for both MCD(22.5%, SD = 4.5%) and LCD (14.1%, SD = 3.2%) and higher than allocation forVLCKD (7.9%, SD = 4.9%). A linear trend was observed for reduction in carbohydrateintake as a proportion of TE for MCD relative to week (b = -0.137, p = 0.24). Converselyincreased intake by week was observed for LCD (b = 0.096, p = 0.24), and VLCKD(b = 0.174, p = 0.15) but these trends were not significant within groups, or between groupallocations (p = 0.108). Figure 5 shows the reported energy per participant, derivedfrom carbohydrate per group, by week.
Protein intake did not differ between the groups at baseline (p = 0.299). There was nosignificant variation between groups for average protein intake per day over the courseof the study. Fat intake varied by group but was consistent with their TE intake,and protein and carbohydrate allocations.
Figure 3 Percentage change from baseline in cardiometabolic and athropometric outcome measures.Full-size DOI: 10.7717/peerj.6273/fig-3
Harvey et al. (2019), PeerJ, DOI 10.7717/peerj.6273 10/19
Ene
rgy
(Kca
l)
Week
linear50%
13 missing values (13 in Calories)
MCD
0 2 4 6 8 10 12
010
0020
0030
0040
00
LCD
0 2 4 6 8 10 12
VLCKD
0 2 4 6 8 10 12
Figure 4 Mean daily energy intake by week per participant. The blue line indicates the linear trend.Black line indicates the 50th percentile. Full-size DOI: 10.7717/peerj.6273/fig-4
% to
tal e
nerg
y fro
m c
arbo
hydr
ate
Week
50%
13 missing values (13 in percent_TE_carbohydrate)
MCD
0 2 4 6 8 10 12
1020
3040
5060
LCD
0 2 4 6 8 10 12
VLCKD
0 2 4 6 8 10 12
Figure 5 Mean percent of total energy derived from carbohydrate by participant, per week The blackline indicates the 50th percentile. Full-size DOI: 10.7717/peerj.6273/fig-5
Harvey et al. (2019), PeerJ, DOI 10.7717/peerj.6273 11/19
DISCUSSIONPrincipal findingsOverall, the results demonstrated that reduced carbohydrate diets have a positive effect onselect markers of health. Despite a high number of participants who did not present forfollow-up testing, in those included for analysis, LCDs were easily adhered to over a 12-weekperiod.While there was little difference in the consistency of adherence between the differingdietary interventions for calorie and macronutrient allocations overall, carbohydrateintake was more easily maintained in the MCD and LCD groups, as demonstrated by meanintakes lower than allocation, whereas mean intake of carbohydrate as a percentage of TEwas higher than allocation in the VLCKD group. There was a marginal increase inenergy intake from baseline, but this declined over the course of the study in all groups.Of interest was the relatively low-calorie intake recorded at baseline which might indicate acohort focussed on weight loss or under-reporting of actual food intake.
Almost all participants began the study with anthropometric and blood measurementswithin the normal range. We would, therefore, not expect large changes for markersof health in a generally ‘healthy’ cohort. This was also a eucaloric intervention, designed tomatch habitual energy intake and was not designed as a ‘weight loss’ trial. Despitethis, there were significant and clinically meaningful, albeit relatively small, improvementsin weight, waist-height ratio, HDL-c, and TG. Of the changes in outcome measures thatreached the threshold for significance, seven of nine were improved from baselinefavourably (HDL, TG, insulin, weight, waist, hip, and BMI) while only Total-c and LDL-cincreased by a small magnitude. Of particular interest, was the improvement inwaist-height ratio, as this is a strong predictor of all-cause mortality. (Ashwell et al., 2014)We would also consider the significant improvements in HDL-c and TG to be clinicallymeaningful measures of interest when compared to relatively minor changes inTotal-c or LDL-c. Of all the commonly measured biomarkers of cardiovascular risk,TG concentrations are most convincingly linked to incident cardiovascular disease(Harcombe et al., 2015; Liu et al., 2013; Ravnskov et al., 2016). Reductions in relative riskare seen at TG <1.02 mmol/L, with every one mmol/L increase associated with a >12%increase in risk, for both cardiovascular disease mortality and all-cause mortality(Liu et al., 2013). Interestingly, in the current study, while mean TG levels were reducedin all groups at 12-weeks, only the VLCKD group showed an improvement in TG levels,with a reduction of 0.04 mmol/L at the upper limit of the 95% confidence intervals,compared to an increase of 0.16 and 0.09 mmol/L for the MCD and LCD groups,respectively. This suggests that the higher the baseline TG, the greater the benefit ofcarbohydrate restriction. Our weighted regression re-analysis also showed that baselineTG affected the change in BMI relative to treatment group, suggesting the hypothesis thatbaseline lipids may predict outcomes from diets differing in carbohydrate allocation.This hypothesis will be investigated and reported in a separate paper.
There is debate around the respective roles that Total-c, LDL-c, HDL-c, TG, and theirinteractions play with respect to mortality and morbidity outcomes. This warrants furtherinvestigation, especially in the context of reduced carbohydrate diets.
Harvey et al. (2019), PeerJ, DOI 10.7717/peerj.6273 12/19
An additional sensitivity analysis was subsequently carried out which modelled theprobability of completing the study, given baseline values of age, gender, weight, TG,and glucose concentration using a logistic regression model. These values were then usedin a re-analysis of the change in BMI at the end of the study with observations re-weightedby stabilised-inverse probability of treatment from the logistic model. This modelshowed a larger decrease in mean BMI, comparing the VLCKD to the MCD group(mean change from baseline: -0.59 kg/m2; 95% CI [0.21 to -1.39]). This difference fromthe unweighted analysis is likely to be due to different effects of the diets by baselineTG concentration. These changes will be explored further in a future analysis.
Several CRP readings were above the reference range of <5 mg/L. The highest reading of46.9 mg/L, recorded in the MCD group, was found,on subsequent investigation to be due toan unreported flu-like viral infection. At the conclusion of the study, all results for CRPwere <5 mg/L. This suggests a positive effect on systemic inflammation from LCDs overall,but high baseline results may have been due to undisclosed illness or another stressor.
Strengths and weaknesses of the studyThis study is one of the first to compare eucaloric diets differing in the magnitude ofcarbohydrate restriction for anthropometric and cardiometabolic outcomes in healthy people.It was a randomised trial, including food tracking with real-time researcher monitoringand feedback, along with advice and information provided to participants from a competentteam with extensive experience in the prescription of LCDs and VLCKDs. As such, we believeit provides a valuable addition to the literature to help inform clinical practice.
Our study was limited by small sample size and by the failure of 49% of participants toeither complete the intervention or present for follow-up testing. This was expected, as highdropout rates are common in dietary studies. For example, a systematic review ofLCDs vs low-fat, calorie restricted diet interventions showed an overall attrition rate of36%, with a higher rate of attrition in low-fat, high-carbohydrate interventions(Hession et al., 2009). Few participants reported dropping out due to challenges with the dietsand most dropouts were instead due to failure to present for testing rather than failureto adhere to the diet, and these numbers were almost identical between the interventiongroups. Participants who failed to present were asked to provide reasons for (not) doing so.Two participants responded, stating a clash with work and inability to attend due to parentalresponsibilities. It is therefore unclear whether there were other factors, outside ofscheduling or other logistical challenges, that affected participants completing the study.
The final numbers included in our analysis due to attrition, therefore lacked statisticalpower. With larger numbers, greater statistical significance may be detected. This willbe of value to elucidate the impact of differing magnitudes of carbohydrate restriction onimportant markers of cardiometabolic health in which there was a between groupdifference in change from baseline, for example, TG and HDL-c. The small sample size alsohighlights a potential problem of applying parametric tests, that is, whether or not thedata collected fit the probability distributions associated with them. An alternativethat does not rely on such assumptions is a randomisation test. Results from these tests inour study were very similar to those obtained from t-tests, for example, the p-value for
Harvey et al. (2019), PeerJ, DOI 10.7717/peerj.6273 13/19
the between group differences in change from baseline Total-c was p = 0.658 whichwas very similar to the results of the ANOVA, p = 0.686.
The study also did not include a group with a higher carbohydrate allocation consistentwith existing dietary guidelines of 45–75% of energy derived from carbohydrate(Buyken et al., 2018), (i.e. a true control group) and therefore, we cannot discount thathigher-carbohydrate, lower-fat diets with an emphasis on high quality food intake,a reduced preponderance of refined, energy-dense foods, nutrition counselling as availablein this study, and the accountability of being involved in a study, could lead to similarbeneficial results. In the recent dietfits study a higher- and lower-carbohydrateintervention, with nutritional counselling and an emphasis on ‘quality’ nutrition resultedin similar results for weight-loss over 12 months (Gardner et al., 2018). However, in thisstudy there was a non-significant trend towards greater weight loss, and statisticallysignificant improvements in HDL-c and TG in the lower-carbohydrate group. In thepresent study, these were improved in a dose-dependent fashion per carbohydraterestriction. There is already a large body of evidence comparing low- to high-carbohydratediets, and this study helps to instead differentiate between differing lower-carbohydratediets and their benefits.
Meanings and implications of the studyThe consistency of the improvements in important predictors of mortality suggest abeneficial effect of lower carbohydrate interventions overall, and similarly, towardsgreater improvement on the most meaningful markers of health, concomitant tothe magnitude of carbohydrate restriction. This is of particular interest because thedietary interventions were not hypocaloric and were designed to match habitual energyintake. Yet despite matching the calorie intake at baseline to the dietary prescription,meaningful anthropometric and blood measures of cardiometabolic health, wereimproved and trended towards greater (non-significant) improvements withgreater carbohydrate restriction. However, the adherence to the carbohydrateallocation was more likely to be achieved in those on more moderatecarbohydrate-restricted diets.
Unanswered questions and directions for future researchThis study shows positive effects overall from reduced carbohydrate diets on selectmarkers of health and further suggests a potential benefit from a greater magnitudeof carbohydrate restriction, despite this greater carbohydrate restriction beingmore difficult to achieve. Additional research with larger sample sizes is warranted toinvestigate this further. Due to the large numbers that failed to present for follow-uptesting, further investigation is warranted to ascertain factors associated withadherence to the diet.
CONCLUSIONLow-carbohydrate diets are beneficial for the improvement of anthropometric andblood markers of cardiometabolic health in healthy adults and are easily adhered to over
Harvey et al. (2019), PeerJ, DOI 10.7717/peerj.6273 14/19
12-weeks. However, the greatest restriction of carbohydrate to 5% of TE may not berealistically achievable for this population. Our results demonstrate that non-hypocaloric,LCDs, matched to habitual calorie intake, result in significant improvements in predictorsof long-term health including weight, waist and hip girth, waist-to-height ratio, TG,and HDL-c, which increase in magnitude with a greater degree of carbohydrate restriction.However, between-group differences typically did not reach thresholds for statisticalsignificance, and further research with larger samples is required to investigate further, theeffects of different degrees of carbohydrate restrictions on outcomes in healthypopulations.
APPENDIX 1 ASSAY PERFORMANCE
ACKNOWLEDGEMENTSWe are grateful to the participants in this study. We acknowledge the support ofour colleagues at the Human Potential Centre, AUT University, especially DeeHoldsworth-Perks; and at the Holistic Performance Institute. Specifically, we wouldlike to acknowledge the assistance of Amberleigh Jack, Bella Marinkovich,Emily White, and Lulu Caitcheon who assisted with data collection; phlebotomists,Brenda Costa-Scorse and Claudia Barclay; Kirsten Beynon for lab assistanceduring data collection and analysis, Dave Shaw for his co-operation duringdata-collection, and Eric Helms and Nigel Harris for advice about the study designand methods.
Analyte Lower limit ofmeasurement*
Measuring range Test principle
Total cholesterol 0.1 mmol/L 0.1–20.7 mmol/L Enzymatic colorimetric test
LDL-c 0.078 mmol/L 0.078–14.2 mmol/L Homogeneous enzymaticcolorimetric assay
HDL-c 0.08 mmol/L 0.08–3.10 mmol/L Homogeneous enzymaticcolorimetric assay
TG 0.05 mmol/L 0.05–11.3 mmol/L Enzymatic colorimetric test
CRP 2.9 nmol/L 2.9–3333 nmol/L Particle-enhancedimmunoturbidimetric assay
GGT 3 U/L 3–1,200 U/L Enzymatic colorimetric test
ALT 5 U/L 5–700 U/L Enzymatic colorimetric test
AST 5 U/L 5–700 U/L Enzymatic colorimetric test
ALP 3 U/L 3–1,200 U/L Enzymatic colorimetric test
Glucose 0.11 mmol/L 0.11–41.6 mmol/L Enzymatic colorimetric test
Uric acid 11.9 mmol/L 11.9–1,487 mmol/L Enzymatic colorimetric test
Insulin 1.39 pmol/L 1.39–6,945 pmol/L Electrochemoluminescence
C-peptide 0.003 mmol/L 0.003–13.3 nmol/L Electrochemoluminescence
Note:* Functional sensitivity. It represents the lowest measurable analyte level that can be distinguished from zero. It iscalculated as the value lying two or three standard deviations above that of the lowest standard. Method comparisons,limitations, and specific performance data can be found on www.e-labdoc.roche.com.
Harvey et al. (2019), PeerJ, DOI 10.7717/peerj.6273 15/19
ADDITIONAL INFORMATION AND DECLARATIONS
FundingAll funding was provided by the Human Potential Centre, Auckland University ofTechnology. The funders had no role in study design, data collection and analysis, decisionto publish, or preparation of the manuscript.
Grant DisclosureThe following grant information was disclosed by the authors:Human Potential Centre, Auckland University of Technology.
Competing InterestsThe authors declare that they have no competing interests.
Author Contributions� Cliff J. d. C. Harvey conceived and designed the experiments, performed theexperiments, analysed the data, prepared figures and/or tables, authored or revieweddrafts of the paper, approved the final draft.
� Grant M. Schofield conceived and designed the experiments, prepared figures and/ortables, authored or reviewed drafts of the paper, approved the final draft.
� Caryn Zinn conceived and designed the experiments, prepared figures and/or tables,authored or reviewed drafts of the paper, approved the final draft.
� Simon J. Thornley conceived and designed the experiments, analysed the data, preparedfigures and/or tables, authored or reviewed drafts of the paper, approved the final draft.
� Catherine Crofts conceived and designed the experiments, performed theexperiments, authored or reviewed drafts of the paper, approved the final draft.
� Fabrice L. R. Merien performed the experiments, analysed the data, contributedreagents/materials/analysis tools, authored or reviewed drafts of the paper, approved thefinal draft.
Human EthicsThe following information was supplied relating to ethical approvals (i.e. approving bodyand any reference numbers):
Ethics approval for this study was granted by the Southern Committee of the Health andDisability Ethics Committee of New Zealand (17/STH/60).
Data AvailabilityThe following information was supplied regarding data availability:
Raw data for baseline and outcome measures is available in the Supplementary Dataset.
Clinical Trial RegistrationThe following information was supplied regarding Clinical Trial registration:
The trial was registered by the Australia New Zealand Clinical Trial Registry.(ACTRN12617000421336p).
Harvey et al. (2019), PeerJ, DOI 10.7717/peerj.6273 16/19
Supplemental InformationSupplemental information for this article can be found online at http://dx.doi.org/10.7717/peerj.6273#supplemental-information.
REFERENCESAshwell M, Mayhew L, Richardson J, Rickayzen B. 2014.Waist-to-height ratio is more predictive
of years of life lost than body mass index. PLOS ONE 9(9):e103483DOI 10.1371/journal.pone.0103483.
Babio N, Martínez-González MA, Estruch R, Wärnberg J, Recondo J, Ortega-Calvo M,Serra-Majem L, Corella D, Fitó M, Ros E, Becerra-Tomás N, Basora J, Salas-Salvadó J. 2015.Associations between serum uric acid concentrations and metabolic syndrome and itscomponents in the PREDIMED study. Nutrition, Metabolism and Cardiovascular Diseases25(2):173–180 DOI 10.1016/j.numecd.2014.10.006.
Ballestri S, Zona S, Targher G, Romagnoli D, Baldelli E, Nascimbeni F, Roverato A, Guaraldi G,Lonardo A. 2016. Nonalcoholic fatty liver disease is associated with an almost twofoldincreased risk of incident type 2 diabetes and metabolic syndrome. Evidence from a systematicreview and meta-analysis. Journal of Gastroenterology and Hepatology 31(5):936–944DOI 10.1111/jgh.13264.
Bueno NB, De Melo ISV, De Oliveira SL, Da Rocha Ataide T. 2013. Very-low-carbohydrateketogenic diet v. low-fat diet for long-term weight loss: a meta-analysis of randomised controlledtrials. British Journal of Nutrition 110(7):1178–1187 DOI 10.1017/S0007114513000548.
Buyken AE, Mela DJ, Dussort P, Johnson IT, MacDonald IA, Stowell JD, Brouns FJ. 2018.Dietary carbohydrates: A review of international recommendations and the methods used toderive them. European Journal of Clinical Nutrition 72(12):1625–1643DOI 10.1038/s41430-017-0035-4.
Campbell B, Kreider RB, Ziegenfuss T, La Bounty P, Roberts M, Burke D, Landis J, Lopez H,Antonio J. 2007. International society of sports nutrition position stand: protein and exercise.Journal of the International Society of Sports Nutrition 4(1):8 DOI 10.1186/1550-2783-4-8.
Castro K, Faccioli LS, Baronio D, Gottfried C, Perry IS, Dos Santos Riesgo R. 2015. Effect of aketogenic diet on autism spectrum disorder: a systematic review. Research in AutismSpectrum Disorders 20:31–38 DOI 10.1016/j.rasd.2015.08.005.
Gardner CD, Trepanowski JF, Del Gobbo LC, Hauser ME, Rigdon J, Ionnidis JPA,Desai M, King AC. 2018. Effect of low-fat vs low-carbohydrate diet on 12-month weight lossin overweight adults and the association with genotype pattern or insulin secretion: the dietfitsrandomized clinical trial. JAMA 319(7):667–679 DOI 10.1001/jama.2018.0245.
Gibson AA, Seimon RV, Lee CMY, Ayre J, Franklin J, Markovic TP, Caterson ID, Sainsbury A.2015. Do ketogenic diets really suppress appetite? A systematic review and meta-analysis.Obesity Reviews 16(1):64–76 DOI 10.1111/obr.12230.
Guerci B, Benichou M, Floriot M, Bohme P, Fougnot S, Franck P, Drouin P. 2003. Accuracyof an electrochemical sensor for measuring capillary blood ketones by fingerstick samplesduring metabolic deterioration after continuous subcutaneous insulin infusioninterruption in type 1 diabetic patients. Diabetes Care 26(4):1137–1141DOI 10.2337/diacare.26.4.1137.
Harcombe Z, Baker JS, Cooper SM, Davies B, Sculthorpe N, DiNicolantonio JJ, Grace F. 2015.Evidence from randomised controlled trials did not support the introduction of dietary fatguidelines in 1977 and 1983: a systematic review and meta-analysis. Open Heart 2(1):e000196DOI 10.1136/openhrt-2014-000196.
Harvey et al. (2019), PeerJ, DOI 10.7717/peerj.6273 17/19
Harvey CJdC, Schofield GM, Williden M, McQuillan JA. 2018. The effect of medium chaintriglycerides on time to nutritional ketosis and symptoms of keto-induction in healthy adults:a randomised controlled clinical trial. Journal of Nutrition and Metabolism 2018:1–9DOI 10.1155/2018/2630565.
Henderson CB, Filloux FM, Alder SC, Lyon JL, Caplin DA. 2006. Efficacy of the ketogenic diet asa treatment option for epilepsy: meta-analysis. Journal of Child Neurology 21:193–198.
Hernández Alcantara G, Jiménez Cruz A, Bacardí Gascón M. 2015. Effect of low carbohydratediets on weight loss and glycosilated hemoglobin in people with type 2 diabetes: systematicreview. Nutricion hospitalaria 32(5):1960–1966 DOI 10.3305/nh.2015.32.5.9695.
Hession M, Rolland C, Kulkarni U, Wise A, Broom J. 2009. Systematic review ofrandomized controlled trials of low-carbohydrate vs. low-fat/low-calorie diets in themanagement of obesity and its comorbidities. Obesity Reviews 10(1):36–50DOI 10.1111/j.1467-789X.2008.00518.x.
Hu T, Mills KT, Yao L, Demanelis K, Eloustaz M, YancyWS, Kelly TN, He J, Bazzano LA. 2012.Effects of low-carbohydrate diets versus low-fat diets on metabolic risk factors:a meta-analysis of randomized controlled clinical trials. American Journal of Epidemiology176(Suppl_7):S44–S54 DOI 10.1093/aje/kws264.
Huntriss R, Campbell M, Bedwell C. 2017. The interpretation and effect of a low-carbohydratediet in the management of type 2 diabetes: a systematic review and meta-analysis of randomisedcontrolled trials. European Journal of Clinical Nutrition 72(3):311–325DOI 10.1038/s41430-017-0019-4.
Huttenlocher PR. 1976. Ketonemia and seizures: metabolic and anticonvulsant effects of twoketogenic diets in childhood epilepsy. Pediatric Research 10(5):536–540DOI 10.1203/00006450-197605000-00006.
Huttenlocher PR, Wilbourn AJ, Signore JM. 1971. Medium-chain triglycerides as a therapy forintractable childhood epilepsy. Neurology 21(11):1097–1097 DOI 10.1212/wnl.21.11.1097.
Johnston CS, Tjonn SL, Swan PD, White A, Hutchins H, Sears B. 2006. Ketogeniclow-carbohydrate diets have no metabolic advantage over nonketogenic low-carbohydrate diets.American Journal of Clinical Nutrition 83(5):1055–1061 DOI 10.1093/ajcn/83.5.1055.
Johnstone AM, Horgan GW, Murison SD, Bremner DM, Lobley GE. 2008. Effects of ahigh-protein ketogenic diet on hunger, appetite, and weight loss in obese men feeding ad libitum.American Journal of Clinical Nutrition 87(41):44–55 DOI 10.1093/ajcn/87.1.44.
Keene DL. 2006. A systematic review of the use of the ketogenic diet in childhood epilepsy.Pediatric Neurology 35(1):1–5 DOI 10.1016/j.pediatrneurol.2006.01.005.
Kulak D, Polotsky AJ. 2013. Should the ketogenic diet be considered for enhancing fertility?Maturitas 74(1):10–13 DOI 10.1016/j.maturitas.2012.10.003.
Last AR, Wilson SA. 2006. Low-carbohydrate diets. American Family Physician 73:1951–1958.
Lefevre F, Aronson N. 2000. Ketogenic diet for the treatment of refractory epilepsy in children:a systematic review of efficacy. Pediatrics 105(4):e46 DOI 10.1542/peds.105.4.e46.
Levy RG, Cooper PN, Giri P,Weston J. 2012.Ketogenic diet and other dietary treatments for epilepsy.Cochrane database of systematic reviews 2:CD001903 DOI 10.1002/14651858.CD001903.pub3.
Liu J, Zeng F-F, Liu Z-M, Zhang C-X, Ling W-h, Chen Y-M. 2013. Effects of bloodtriglycerides on cardiovascular and all-cause mortality: a systematic review and meta-analysisof 61 prospective studies. Lipids in Health and Disease 12(1):159DOI 10.1186/1476-511X-12-159.
Livingston S, Pauli LL, Pruce I. 1977. Ketogenic diet in treatment of childhood epilepsy.Developmental Medicine and Child Neurology 19:833–834.
Harvey et al. (2019), PeerJ, DOI 10.7717/peerj.6273 18/19
Livingstone S. 1972. Comprehensive management of epilepsy in infancy, childhood andadolescence. Archives of Disease in Childhood 47(255):842 DOI 10.1136/adc.47.255.842.
Maalouf M, Rho JM, Mattson MP. 2009. The neuroprotective properties of calorie restriction, theketogenic diet, and ketone bodies. Brain Research Reviews 59(2):293–315DOI 10.1016/j.brainresrev.2008.09.002.
McClain AD, Otten JJ, Hekler EB, Gardner CD. 2013. Adherence to a low-fat vs.low-carbohydrate diet differs by insulin resistance status. Diabetes, Obesity and Metabolism15(1):87–90 DOI 10.1111/j.1463-1326.2012.01668.x.
McClernon FJ, Yancy WS Jr, Eberstein JA, Atkins RC, Westman EC. 2007. The effects of alow-carbohydrate ketogenic diet and a low-fat diet on mood, hunger, and other self-reportedsymptoms�. Obesity (Silver Spring) 15(1):182 DOI 10.1038/oby.2007.516.
Naude CE, Schoonees A, Senekal M, Young T, Garner P, Volmink J. 2014. Low carbohydrateversus isoenergetic balanced diets for reducing weight and cardiovascular risk: a systematicreview and meta-analysis. PLOS ONE 9(7):e100652 DOI 10.1371/journal.pone.0100652.
Neal EG, Chaffe H, Schwartz RH, Lawson MS, Edwards N, Fitzsimmons G, Whitney A,Cross JH. 2008. The ketogenic diet for the treatment of childhood epilepsy: a randomisedcontrolled trial. Lancet Neurology 7(6):500–506 DOI 10.1016/S1474-4422(08)70092-9.
Paoli A, Bosco G, Camporesi E, Mangar D. 2015. Ketosis, ketogenic diet and food intake control:a complex relationship. Frontiers in Psychology 6:27 DOI 10.3389/fpsyg.2015.00027.
Paoli A, Rubini A, Volek J, Grimaldi K. 2013. Beyond weight loss: a review of the therapeuticuses of very-low-carbohydrate (ketogenic) diets. European Journal of Clinical Nutrition67(8):789–796 DOI 10.1038/ejcn.2013.116.
Ravnskov U, Diamond DM, Hama R, Hamazaki T, Hammarskjold B, Hynes N, Kendrick M,Langsjoen PH, Malhotra A, Mascitelli L, McCully KS, Ogushi Y, Okuyama H, Rosch PJ,Schersten T, Sultan S, Sundberg R. 2016. Lack of an association or an inverse association betweenlow-density-lipoprotein cholesterol and mortality in the elderly: a systematic review. BMJ Open6(6):e010401 DOI 10.1136/bmjopen-2015-010401.
Snorgaard O, Poulsen GM, Andersen HK, Astrup A. 2017. Systematic review and meta-analysisof dietary carbohydrate restriction in patients with type 2 diabetes. BMJ Open DiabetesResearch & Care 5(1):e000354 DOI 10.1136/bmjdrc-2016-000354.
Sumithran P, Proietto J. 2008. Ketogenic diets for weight loss: a review of their principles, safetyand efficacy. Obesity Research & Clinical Practice 2(1):1–13 DOI 10.1016/j.orcp.2007.11.003.
Van Wyk HJ, Davis RE, Davies JS. 2016. A critical review of low-carbohydrate diets inpeople with Type 2 diabetes. Diabetic Medicine 33(2):148–157 DOI 10.1111/dme.12964.
Varshneya K, Carico C, Ortega A, Patil CG. 2015. The efficacy of ketogenic diet and associatedhypoglycemia as an adjuvant therapy for high-grade gliomas: a review of the literature. Cureus7:e251 DOI 10.7759/cureus.251.
Westman EC, Feinman RD, Mavropoulos JC, Vernon MC, Volek JS, Wortman JA, Yancy WS,Phinney SD. 2007. Low-carbohydrate nutrition and metabolism. American Journal ofClinical Nutrition 86:276–284.
Wheeler ML, Dunbar SA, Jaacks LM, Karmally W, Mayer-Davis EJ, Wylie-Rosett J,Yancy WS. 2012. Macronutrients, food groups, and eating patterns in the management ofdiabetes: a systematic review of the literature, 2010. Diabetes Care 35(2):434–445DOI 10.2337/dc11-2216.
Wood RJ, Fernandez ML. 2009. Carbohydrate-restricted versus low-glycemic-index diets for thetreatment of insulin resistance and metabolic syndrome. Nutrition Reviews 67(3):179–183DOI 10.1111/j.1753-4887.2009.00186.x.
Harvey et al. (2019), PeerJ, DOI 10.7717/peerj.6273 19/19