Embed Size (px)
Citation preview
Low Carbon Footprint Electric Lawn Mower
Final Report
Kraig Kamp
David Sharpe
Jamin Williams
Advisors:
Dr. Huggins
Mr. Gutschlag
May 16, 2008

2
Abstract
Environmental air pollution and carbon emissions are becoming significant
problems. A contributor to this pollution is the use of gasoline-powered lawn mowers.
Our overall project goal is to design a battery powered lawn mower and photovoltaic
charging system that will diminish emissions. The project consists of two separate
systems: a battery-powered lawn mower and a photovoltaic system to charge the battery.
The mower will use a microcontroller to control the speed of the cutting blade and
display the charge status of the battery. The charger will use the UC3909 battery
charging chip to control the charging algorithm for the battery. The system will be
designed to be competitive in function and cost versus benefits with gasoline powered
lawn mowers.
3
Table of Contents
I. Introduction 4
II. Functional Description and Block Diagrams 4-7
a. Mower Functional Description 4
b. Charger Functional Description 5
III. Functional Specifications and System Requirements 8-10
a. Mower Specifications 8
b. Charger Specifications 10
IV. Design and Analysis 11-29
a. Battery 11
b. DC Motor Modeling 12
c. Snubber Circuit 15
d. Heat Sink 16
e. PSPICE Simulation 18
f. Mower System Circuit 20
g. Solar Panel Calculations 21
h. Charging Algorithm 22
i. Buck Converter 24
j. UC3909 Equations 26
k. Measuring State of Charge 28
l. Measuring Battery Voltage 28
m. Determining Throttle setting 29
V. Implementation and Results 30
VI. Recommendations for Future Work 31
VII. Applicable Standards and Patents 33
VIII. Equipment List 36
IX. Bill of Materials 36
X. References 37
Appendix A: UC3909 Design Equations 38-44
Appendix B: Charger Circuit Components 45-47
Appendix C: Software Flowcharts 48-55
4
I. Introduction
This report describes the design, implementation and testing of the Low Carbon
Footprint Electric Lawn Mower. A top down design approach is followed with
functionality first described at the system level including detailed block diagram is
developed. Next the design equations are discussed to illustrate more specifically each
part of the system, followed by simulations, and final system testing. The report
concludes with a parts list, references and final conclusions.
II. Functional Description and Block Diagrams
The low carbon footprint electric lawn mower consists of two separate systems: a
mower block and a charger block, which are shown in figs. 1 and 2. The lawn mower is
powered using batteries, and the charger uses a photovoltaic array to recharge the battery.
A. Mower Functional Description
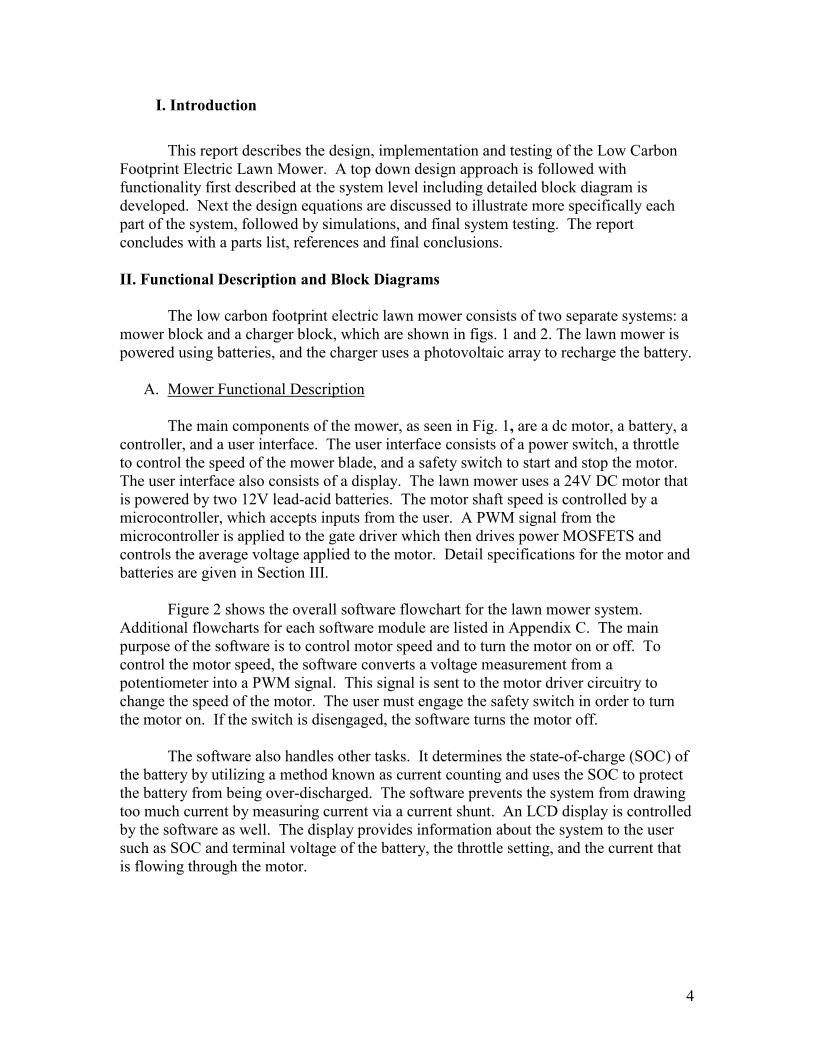
The main components of the mower, as seen in Fig. 1, are a dc motor, a battery, a
controller, and a user interface. The user interface consists of a power switch, a throttle
to control the speed of the mower blade, and a safety switch to start and stop the motor.
The user interface also consists of a display. The lawn mower uses a 24V DC motor that
is powered by two 12V lead-acid batteries. The motor shaft speed is controlled by a
microcontroller, which accepts inputs from the user. A PWM signal from the
microcontroller is applied to the gate driver which then drives power MOSFETS and
controls the average voltage applied to the motor. Detail specifications for the motor and
batteries are given in Section III.
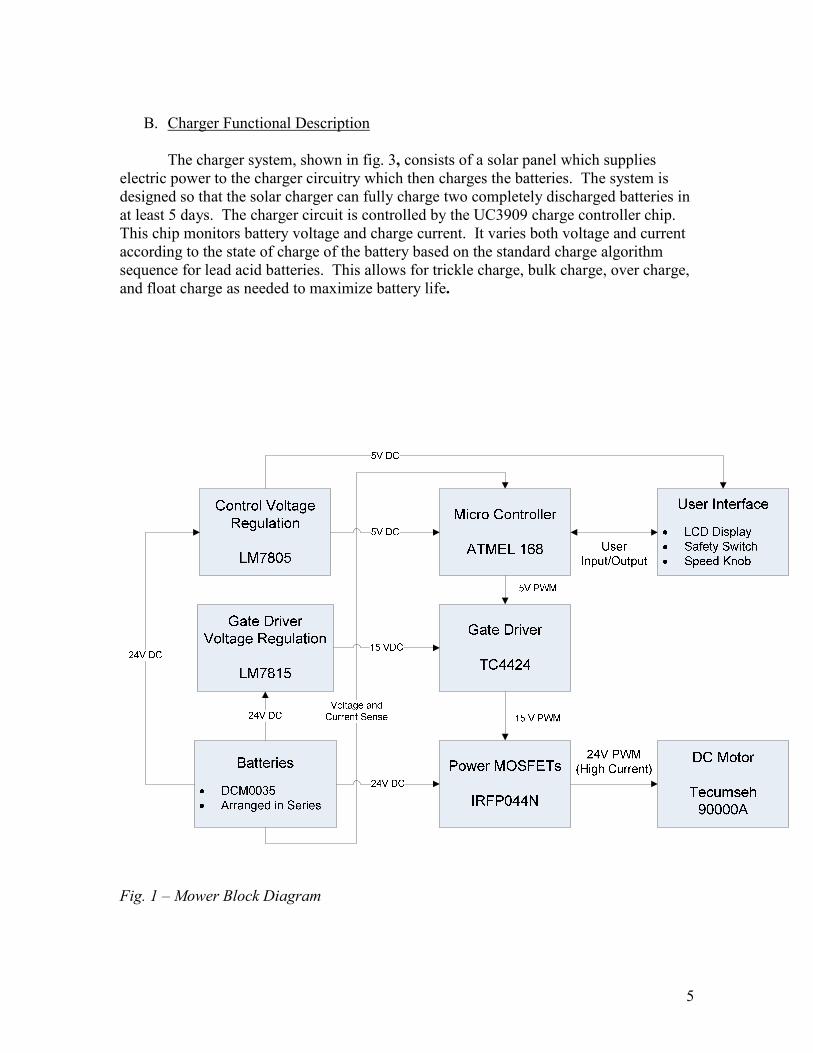
Figure 2 shows the overall software flowchart for the lawn mower system.
Additional flowcharts for each software module are listed in Appendix C. The main
purpose of the software is to control motor speed and to turn the motor on or off. To
control the motor speed, the software converts a voltage measurement from a
potentiometer into a PWM signal. This signal is sent to the motor driver circuitry to
change the speed of the motor. The user must engage the safety switch in order to turn
the motor on. If the switch is disengaged, the software turns the motor off.
The software also handles other tasks. It determines the state-of-charge (SOC) of
the battery by utilizing a method known as current counting and uses the SOC to protect
the battery from being over-discharged. The software prevents the system from drawing
too much current by measuring current via a current shunt. An LCD display is controlled
by the software as well. The display provides information about the system to the user
such as SOC and terminal voltage of the battery, the throttle setting, and the current that
is flowing through the motor.
5
B. Charger Functional Description
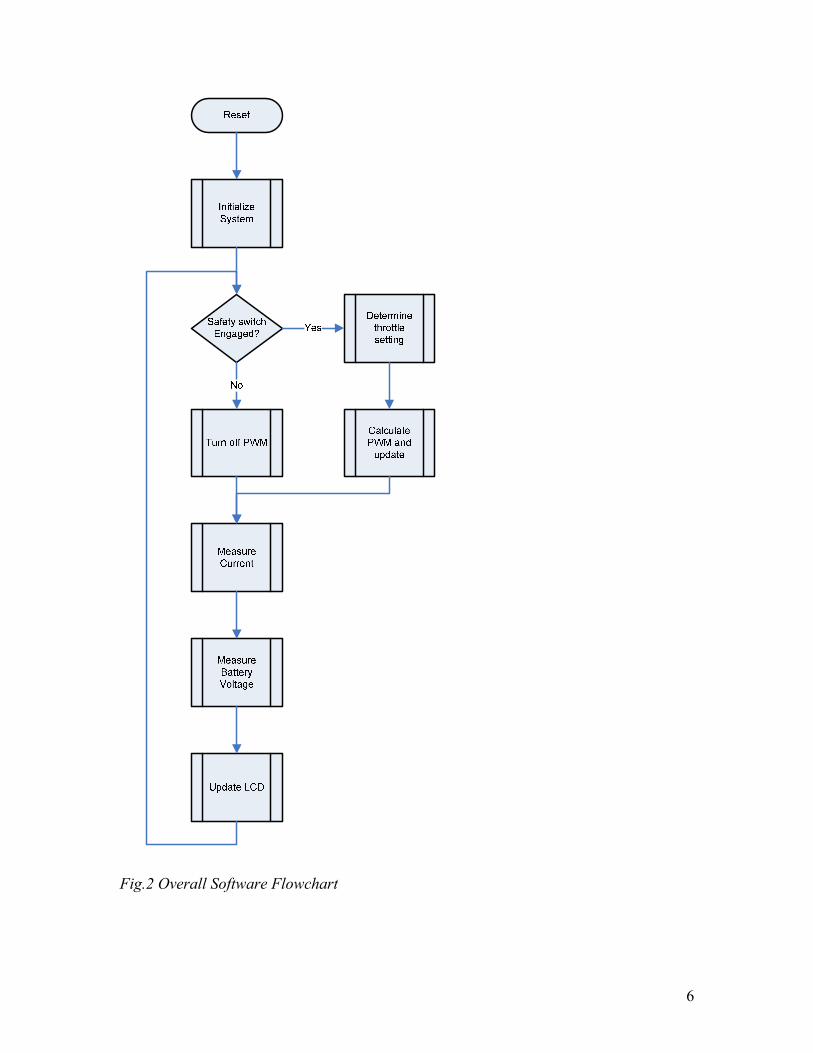
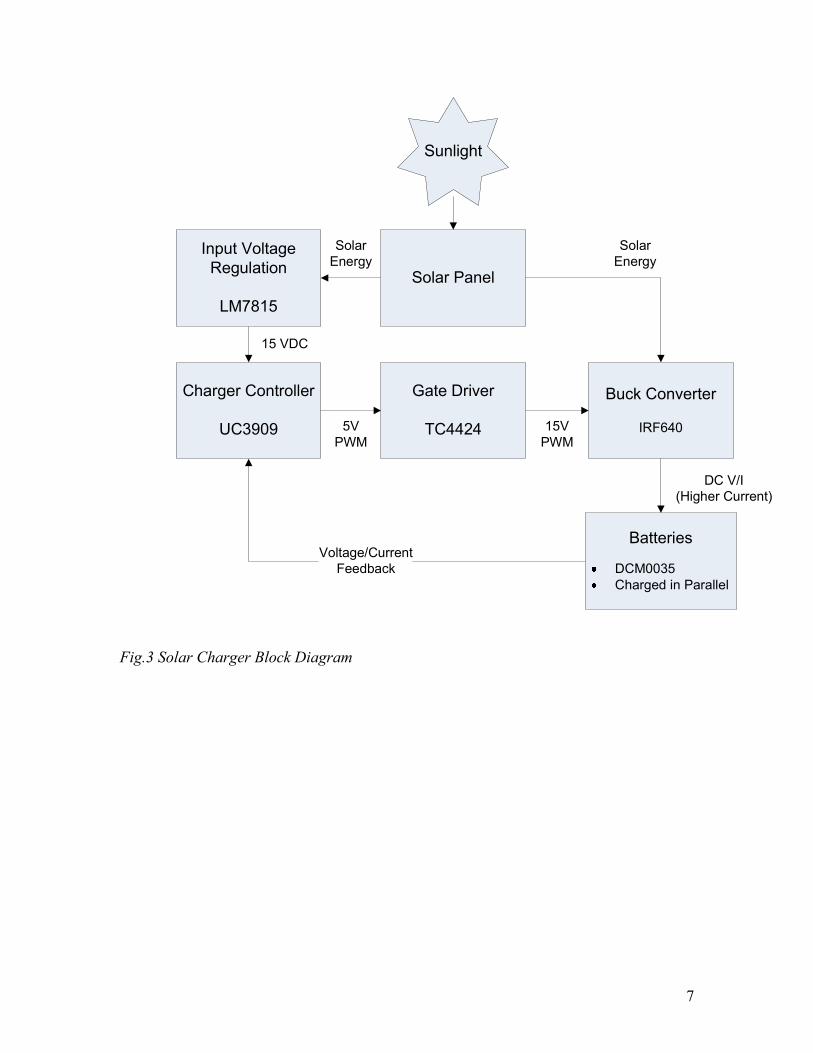
The charger system, shown in fig. 3, consists of a solar panel which supplies
electric power to the charger circuitry which then charges the batteries. The system is
designed so that the solar charger can fully charge two completely discharged batteries in
at least 5 days. The charger circuit is controlled by the UC3909 charge controller chip.
This chip monitors battery voltage and charge current. It varies both voltage and current
according to the state of charge of the battery based on the standard charge algorithm
sequence for lead acid batteries. This allows for trickle charge, bulk charge, over charge,
and float charge as needed to maximize battery life.
Fig. 1 – Mower Block Diagram
6
Fig.2 Overall Software Flowchart
7
Solar Panel
Buck Converter
IRF640
Gate Driver
TC4424 15VPWM
Charger Controller
UC3909 5VPWM
Input Voltage Regulation
LM7815
15 VDC
SolarEnergy
Batteries
DCM0035Charged in Parallel
SolarEnergy
Voltage/CurrentFeedback
DC V/I(Higher Current)
Sunlight
Fig.3 Solar Charger Block Diagram
8
III. Functional Specifications and Requirements
Section II presented a qualitative discussion of general functionality of the mower
and solar charger systems. In this section, the various subsystems are described in more
detailed including quantitative specifications and functional requirements.
A. Mower Specifications
The lawnmower is a push-type mower with an electric motor rotating an 18 inch
blade to remove 1 ½ to 2 in. off the height of average density grass at a walking speed of
approximately 2.66 ft/s. The mower weighs no more than 90 lbs. The motor is powered
by batteries with enough capacity to mow a 10,000 sq. ft lawn in one hour. The mower
has a power button to power up the controls on the handle and a separate start button to
start the electric motor. The circuitry includes over current protection along with a safety
switch that must be held down in order to keep the motor running. The batteries that
power the mower can be removed from the mower deck but is not necessary while being
recharged.
Battery: The battery power needed for our application is provided by two 12 volt
batteries connected in a series to make 24 volts. The capacity of each battery is 35 Amp-
Hours (AH) so that the mower has enough power to mow a 10,000 sq. ft. yard in one
hour. The chemistry make-up of the battery is deep discharge sealed lead acid with a
combined weight of approximately 50 lbs.
DC Voltage Regulators: The DC voltage regulators convert the variable battery voltage
(12-24V) to either 5V or 15V. The 5V regulator is used to power the microprocessor
and display and the 15V voltage regulator is used with the gate driver.
Controller: The controller is used to start and stop the motor, control the speed of the
motor, and control the display. The controller utilizes open-loop methods with a throttle
control so the user can set the speed of the motor shaft. The signal that is output to the
MOSFET’s is a PWM signal with a frequency of 4 kHz. The controller also monitors the
current draw of the motor for over-current protection. The maximum continuous current
is 40A for 5 seconds.
User Inputs: The user inputs consist of a power button to turn the controller on/off, a
start button to start the mower. This button also acts as a safety switch and must be held
down in order to keep the blade rotating. A throttle control to vary the speed of the
mower blade is also an input.
9
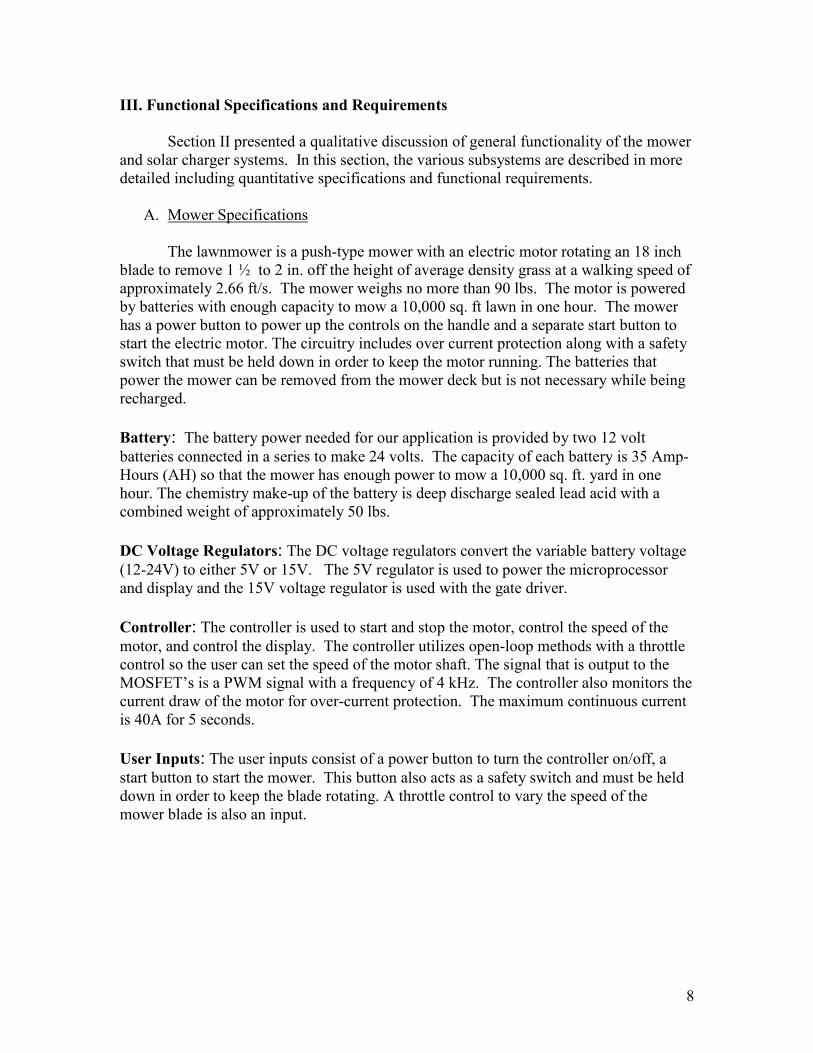
Display: The Optrex 24X2 LCD is the operating display, which is shown in Fig. 4. The
display has a battery symbol indicating the charge left on the battery and a speed bar
graphic to show the user the relative RPM at which the blade is rotating. In addition, the
display also shows the terminal voltage of the batteries and the current flowing through
the motor.
Fig. 4 LCD Operating Display
Power MOSFETS: The MOSFETS used to drive the motor are two HEXFET IRF044N
power MOSFETs wired together in a parallel configuration. The gate of the MOSFET
receives a PWM input signal at a frequency of 4 kHz. The MOSFETs are protected with
a snubber circuit that keeps voltages under the dsV rating of 55V.
Heat Sinks: Two Wakefield 657-15AEPN heat sinks are attached to the MOSFETs and
one Wakefield 287-1ABE heat sink is attached to the free wheeling diode in the snubber
circuit. These heat sinks maintain safe thermal operating temperatures for these
components.
Gate driver chip: The TC4424 takes a 0-5 Volt signal from the microcontroller and
outputs a 0-15 Volt PWM signal to drive the gate of the MOSFET at a switching rate of 4
kHz.
Motor: The motor rotating the blade is the Tecumseh 90000A permanent magnet
reversible motor with an input voltage of 24 VDC and generates 1.54 HP at 3200 RPM.
These specifications provide the power to rotate an 18 inch blade at a sufficient velocity
to cut 1 ½ to 2 inches off the top of average density grass.
Over current Protection: A 40 amp circuit breaker is used for over current protection on
the battery for testing and a 30 amp inline fuse is placed between the positive terminal of
the battery and the positive terminal of the Tecumseh 90000A DC motor.
Disconnect Switch: A disconnect switch is essential in the circuitry. In the case that a
MOSFET fails while mowing and acts as a short circuit, the motor still runs and cannot
be turned off by normal procedures. This manual disconnect switch is mounted by the
handle and breaks the circuit so the blade stops spinning.
10
B. Charger Specifications
The charger uses energy collected by a solar panel and directly transfers the
energy to the battery. The system charges a maximum of two 12 Volt batteries at one
time, wired in a parallel configuration. The charger needs 5 days at 530 kJ/day of solar
energy to charge the two batteries to full capacity. The charger utilizes the Texas
Instruments UC3909 lead-acid battery charger chip to control the charging process.
15V Voltage Regulator: The DC regulator for charger electronics regulates the DC
power input from the solar panel. This regulator powers the UC3909 and the buck
converter gate drive chip
Gate driver chip: The Charger system utilizes the same gate drive chip as mentioned in
the Mower specifications because it is a dual input chip. The gate driver takes the PWM
input from the UC3909 and converts it to 15V for the gate of the buck converter
MOSFET.
Solar Power: The solar power is collected with a BP350 50W panel with an open-circuit
voltage of 21.8 V and a short circuit current of 3.17 A. The panel can collect at least 530
kJ of energy per day to charge the two fully discharge 12V batteries to maximum
capacity in 5 days.
Charger Chip: The Solar Charger System is controlled by the UC3909 Switch mode
lead acid battery charger chip. This chip is used in conjunction with the buck converter
in the charger circuit. This method and the charge algorithm is further discussed in
section IV, part G.
Buck Converter: Because the charger controller chip uses a PWM signal to vary
voltage and current applied to the batteries, a buck converter is necessary to ensure that
voltage and current is constant even though the input is switching. This is further
discussed in Section IV, part H.
Batteries: The battery block consists of two 12V, 35 AH batteries, as discussed in the
lawnmower subsystem breakdown but is wired in parallel for charging.
11
IV. Design and Analysis
Section III talked about the detailed subsystems of the mower and charger. This next
section describes the design and analysis of several subsystems and how they were
implemented into the project.
A. Battery
To meet the specification of mowing a 10,000 square foot yard in 1 hour, the
batteries must be able to power the motor at full speed for the entire time. To size the
batteries appropriately, tests were carried out. This testing revealed that the average
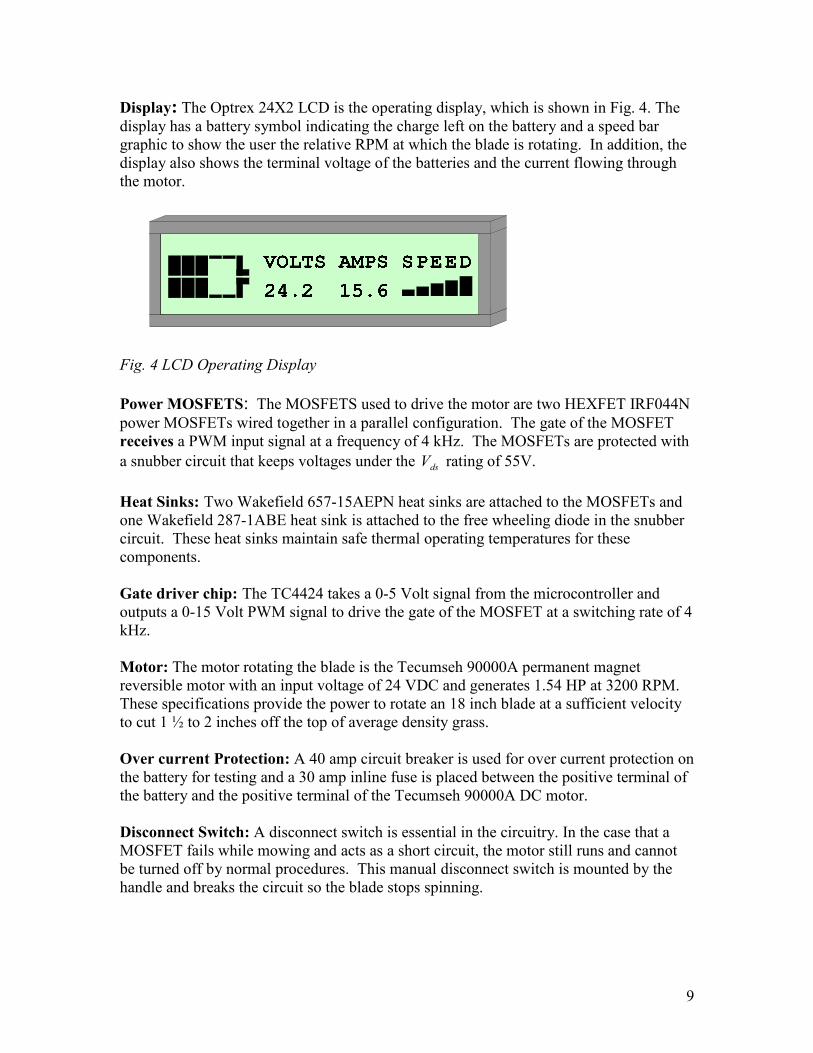
running current of the mower system was approximately 18A. According to Fig. 5, at a
discharge rate of about 20A, a 35Ahr battery will last about an hour. After that, the
terminal voltage drops off abruptly, indicating a fully discharged battery.
It is important to note that because the mower uses a 24V DC motor, it is
necessary to use two 12V batteries in series, to obtain this voltage. Because the batteries
are in series, the current through them will be the same, thus both batteries must have the
35Ah (18Ah @ 20A rate) capacity rating to provide enough energy.
Fig. 5 – 12V, 35Ahr Lead Acid Battery Discharge Characteristics
12
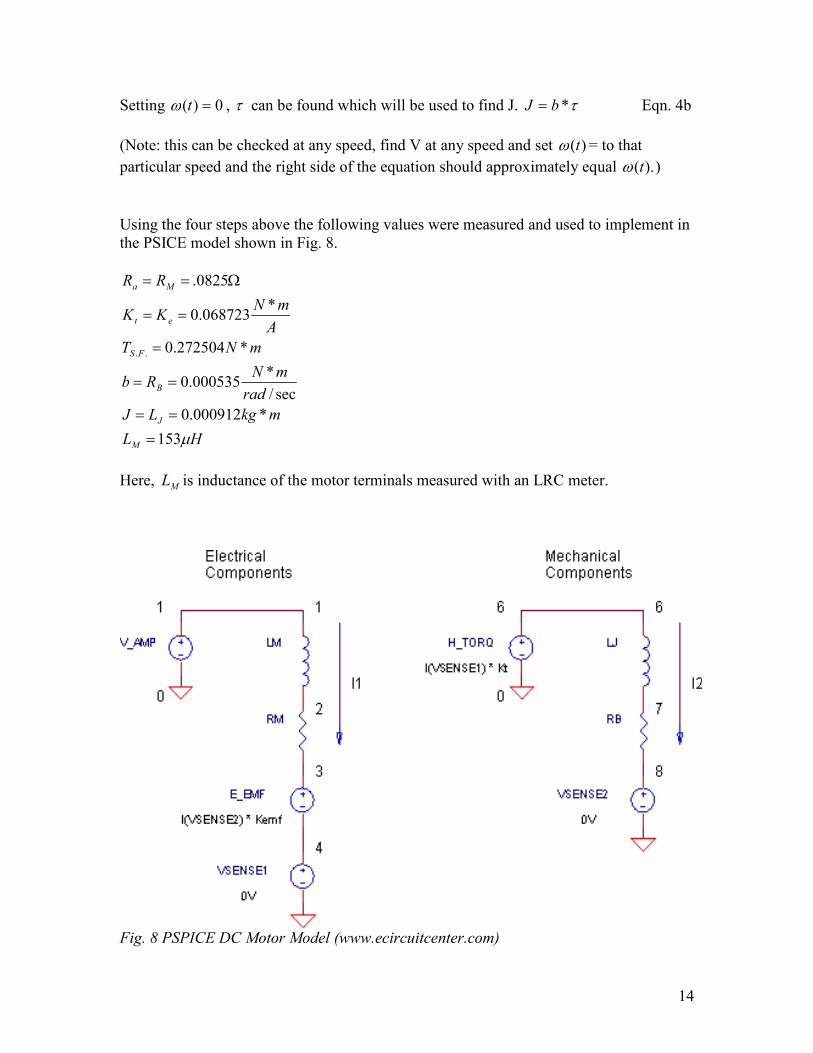
B. DC Motor Modeling
In order to draw a schematic of the power electronics and the Tecumseh 90000A
in PSPICE, certain motor parameters must be determined. These parameters are the
resistance in the windings, the motor torque constant, the viscous and static friction
coefficients, and the mass moment of inertia. These mechanical parameters can be
simulated as electrical circuits in PSPICE as shown in Fig. 8.
The mass moment of inertia is modeled as an inductance in the model and the
friction coefficients are modeled as a resistance. Torque can be modeled as a current-
dependent voltage source. It is proportional to the current flowing through the motor.
The following are steps taken to measure these parameters:
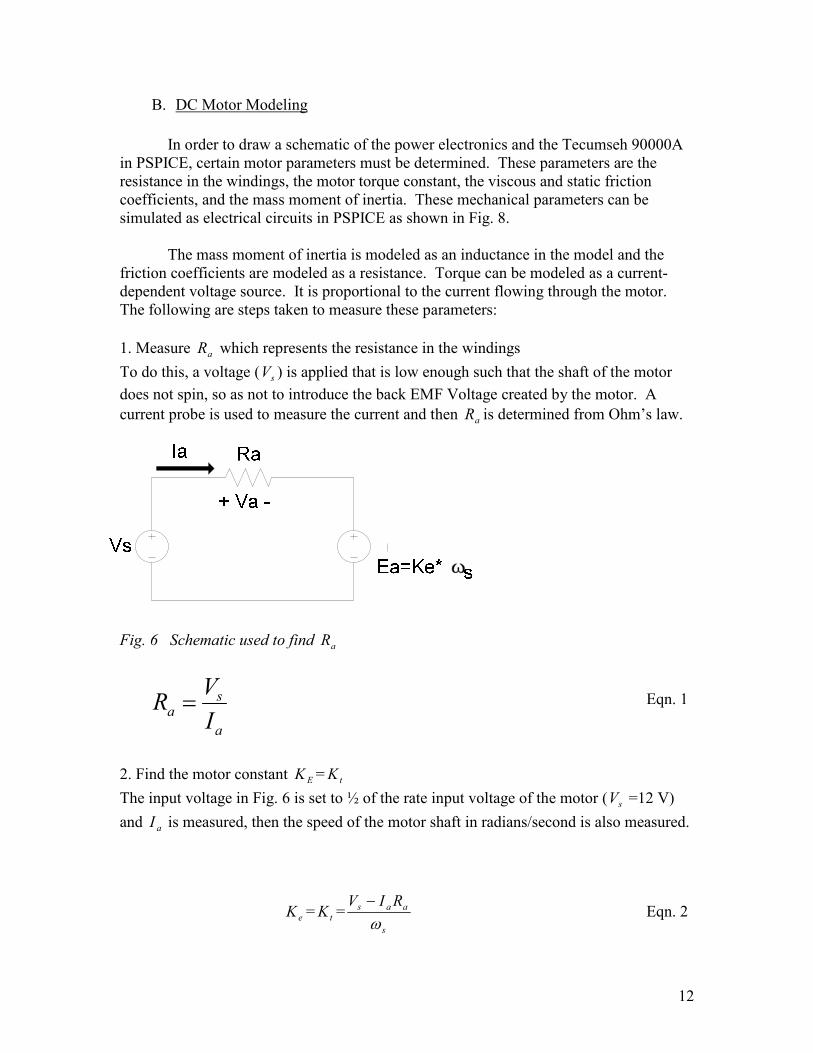
1. Measure aR which represents the resistance in the windings
To do this, a voltage ( sV ) is applied that is low enough such that the shaft of the motor
does not spin, so as not to introduce the back EMF Voltage created by the motor. A
current probe is used to measure the current and then aR is determined from Ohm’s law.
Fig. 6 Schematic used to find aR
Eqn. 1
2. Find the motor constant EK = tK
The input voltage in Fig. 6 is set to ½ of the rate input voltage of the motor ( sV =12 V)
and aI is measured, then the speed of the motor shaft in radians/second is also measured.
eK = tK =s
aas RIV
ω
− Eqn. 2
a
sa
I
VR =
13
3. Find the static friction coefficient, ..FST and the viscous friction coefficient b.
sV is first set to 8 volts and then 16 volts and sω and aI are measured at each voltage.
Then, the following equation is used to find both unknowns.
Eqn. 3
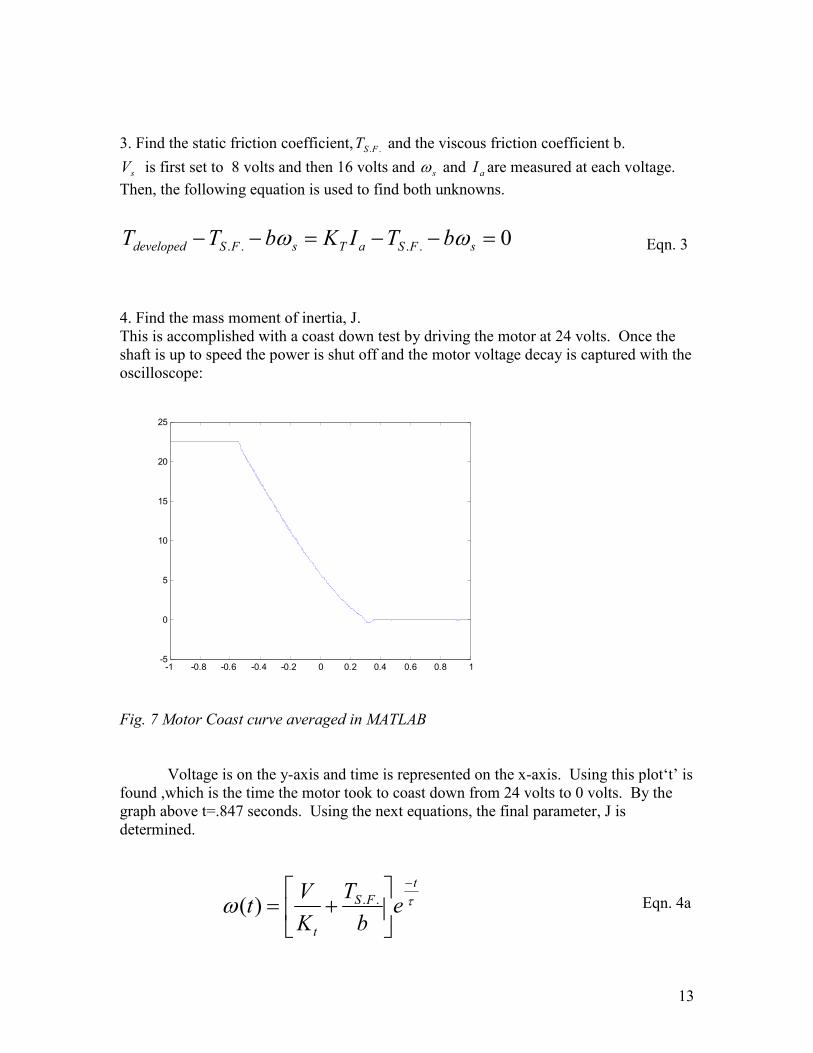
4. Find the mass moment of inertia, J.
This is accomplished with a coast down test by driving the motor at 24 volts. Once the
shaft is up to speed the power is shut off and the motor voltage decay is captured with the
oscilloscope:
Fig. 7 Motor Coast curve averaged in MATLAB
Voltage is on the y-axis and time is represented on the x-axis. Using this plot‘t’ is
found ,which is the time the motor took to coast down from 24 volts to 0 volts. By the
graph above t=.847 seconds. Using the next equations, the final parameter, J is
determined.
Eqn. 4a
-1 -0.8 -0.6 -0.4 -0.2 0 0.2 0.4 0.6 0.8 1-5
0
5
10
15
20
25
0.... =−−=−− sFSaTsFSdeveloped bTIKbTT ωω
τωt
FS
t
eb
T
K
Vt
−
+= ..)(
14
Setting 0)( =tω , τ can be found which will be used to find J. τ*bJ = Eqn. 4b
(Note: this can be checked at any speed, find V at any speed and set )(tω = to that
particular speed and the right side of the equation should approximately equal ).(tω )
Using the four steps above the following values were measured and used to implement in
the PSICE model shown in Fig. 8.
HL
mkgLJ
rad
mNRb
mNT
A
mNKK
RR
M
J
B
FS
et
Ma
µ153
*000912.0
sec/
*000535.0
*272504.0
*068723.0
0825.
..
=
==
==
=
==
Ω==
Here, ML is inductance of the motor terminals measured with an LRC meter.
Fig. 8 PSPICE DC Motor Model (www.ecircuitcenter.com)
15
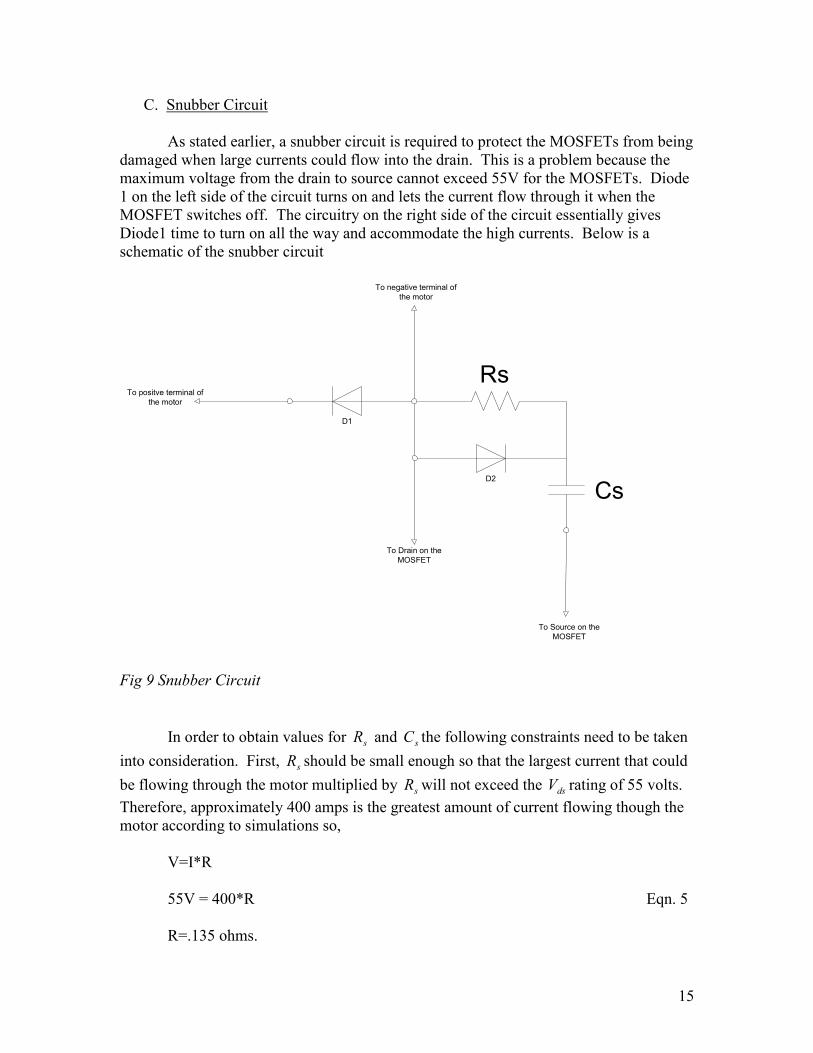
C. Snubber Circuit
As stated earlier, a snubber circuit is required to protect the MOSFETs from being
damaged when large currents could flow into the drain. This is a problem because the
maximum voltage from the drain to source cannot exceed 55V for the MOSFETs. Diode
1 on the left side of the circuit turns on and lets the current flow through it when the
MOSFET switches off. The circuitry on the right side of the circuit essentially gives
Diode1 time to turn on all the way and accommodate the high currents. Below is a
schematic of the snubber circuit
D1
D2
To positve terminal of the motor
To Drain on the MOSFET
Cs
Rs
To negative terminal of the motor
To Source on the MOSFET
Fig 9 Snubber Circuit
In order to obtain values for sR and sC the following constraints need to be taken
into consideration. First, sR should be small enough so that the largest current that could
be flowing through the motor multiplied by sR will not exceed the dsV rating of 55 volts.
Therefore, approximately 400 amps is the greatest amount of current flowing though the
motor according to simulations so,
V=I*R
55V = 400*R Eqn. 5
R=.135 ohms.

16
In addition, Cs is determined using Eqn. 6 as follows.
off
fDo
sV
tIC
*12
*= Eqn. 6
Where DoI is the max current of 400 amps, ft is the switching frequency of the
MOSFETs (4 kHz), and
offV = onDs VV 1+ or 24 V+.4512 V=24.4512V. Eqn. 7
(Note: onDV 1 is the voltage drop across the diode)
D. Heat Sink
While making initial tests in the motor driver circuit it was noticed that the
IRFP044N power MOSFETS were becoming extremely hot. Looking into the problem
these calculations were made to find out the junction temperature of the MOSFETS.
Using the IRFP044N data sheets the following data was obtained.
W
CR
W
CR
W
CR
AI
R
VV
JA
CS
JC
D
onDS
DSS
°=
°=
°=
=
Ω=
=
40
24.0
3.1
55
020.0
55
)(
θ
ϑ
θ
Also, datasheet supplies a Normalized On-Resistance Chart at a junction
temperature of 100 C° which yields Ω= 5.1)(onDSR . This is normalized so this value needs
to be multiplied by the )(onDSR of 0.020Ω to get .03Ω .
Next, the power dissipation needs to be calculated, and the average drain current
must be known. The mower system will have a worst case scenario of 40 amps flowing
through the drain at normal operating procedures and since there are 2 MOSFETS in
parallel the current will be evenly distributed through the both of them. So the drain
current is 20 Amps, therefore:
WRIP onDSDD 123.0*20* 2
)(
2 === Eqn. 8
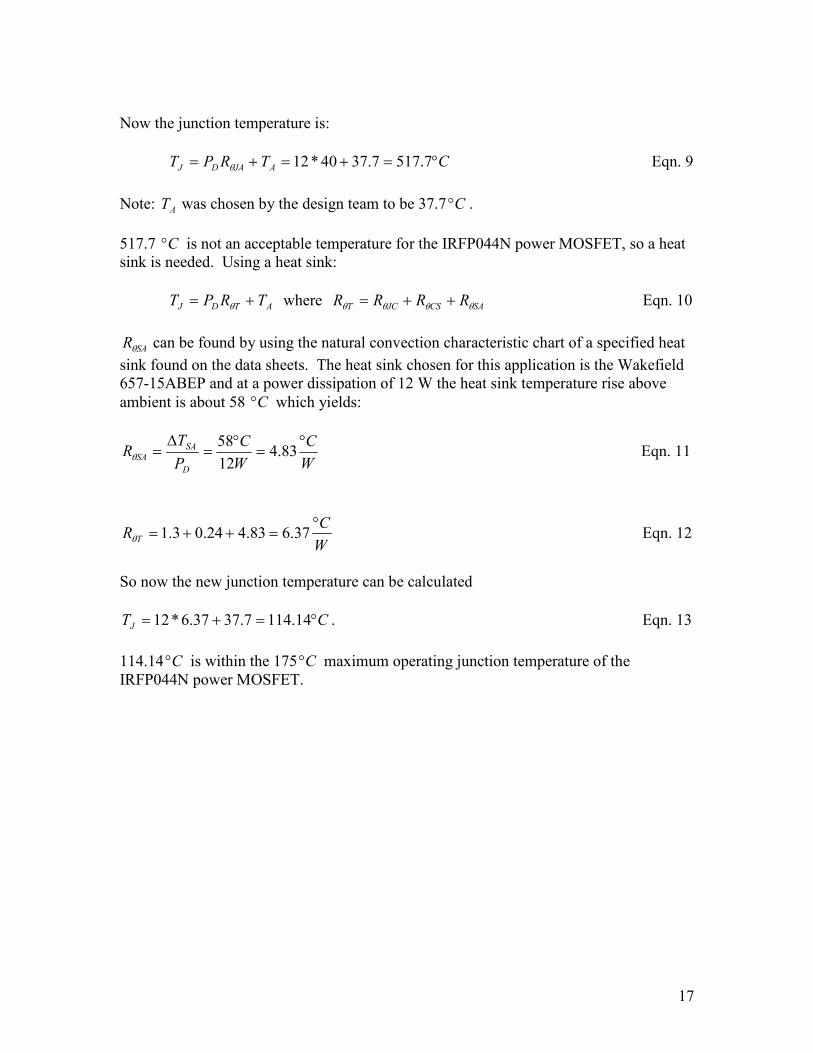
17
Now the junction temperature is:
CTRPT AJADJ °=+=+= 7.5177.3740*12θ Eqn. 9
Note: AT was chosen by the design team to be 37.7 C° .
517.7 C° is not an acceptable temperature for the IRFP044N power MOSFET, so a heat
sink is needed. Using a heat sink:
ATDJ TRPT += θ where SACSJCT RRRR θθθθ ++= Eqn. 10
SARθ can be found by using the natural convection characteristic chart of a specified heat
sink found on the data sheets. The heat sink chosen for this application is the Wakefield
657-15ABEP and at a power dissipation of 12 W the heat sink temperature rise above
ambient is about 58 C° which yields:
W
C
W
C
P
TR
D
SA
SA
°=
°=
∆= 83.4
12
58θ Eqn. 11
W
CR T
°=++= 37.683.424.03.1θ Eqn. 12
So now the new junction temperature can be calculated
CTJ °=+= 14.1147.3737.6*12 . Eqn. 13
114.14 C° is within the 175 C° maximum operating junction temperature of the
IRFP044N power MOSFET.
18
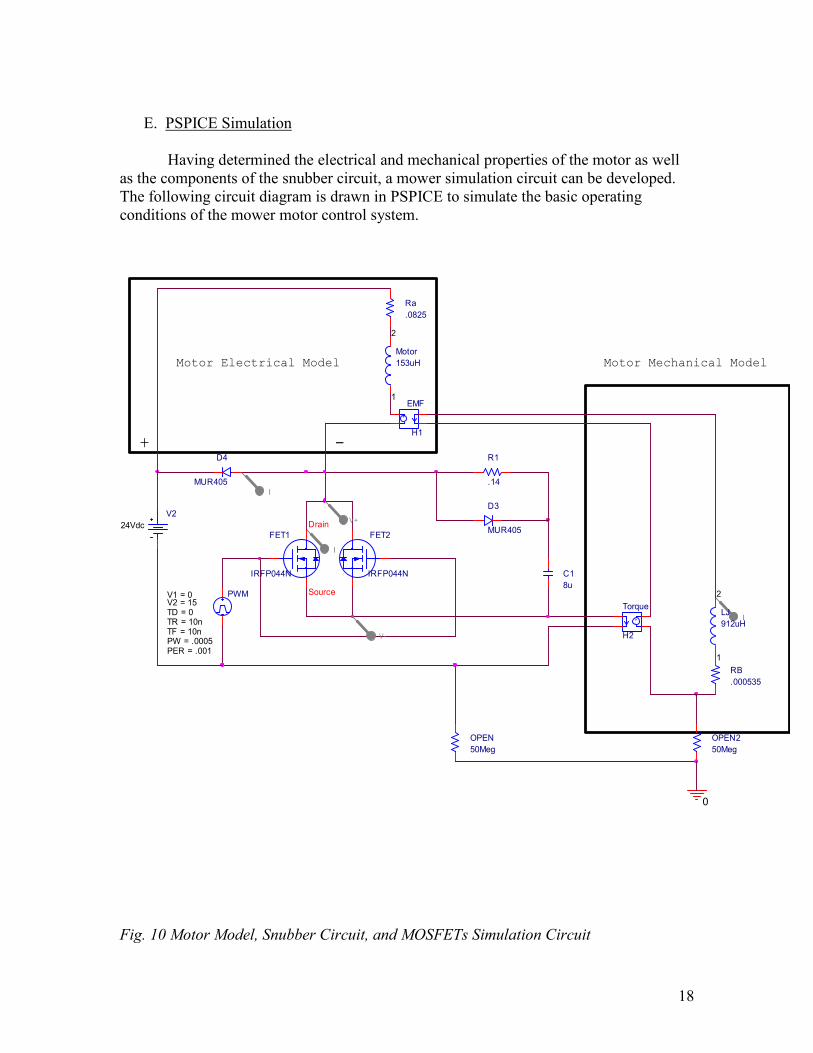
E. PSPICE Simulation
Having determined the electrical and mechanical properties of the motor as well
as the components of the snubber circuit, a mower simulation circuit can be developed.
The following circuit diagram is drawn in PSPICE to simulate the basic operating
conditions of the mower motor control system.
Fig. 10 Motor Model, Snubber Circuit, and MOSFETs Simulation Circuit
Source
FET2
IRFP044N
+
Motor Electrical Model
-
Motor Mechanical Model
C1
8u
R1
.14
D3
MUR405
I
V-
V+
I
I
D4
MUR405
FET1
IRFP044N
Motor
153uH
1
2
LJ
912uH
1
2
RB
.000535
+-
EMF
H1
+-
Torque
H2
Ra
.0825
PWM
TD = 0
TF = 10nPW = .0005PER = .001
V1 = 0
TR = 10n
V2 = 15
OPEN
50Meg
0
OPEN2
50Meg
V2
24Vdc Drain
19
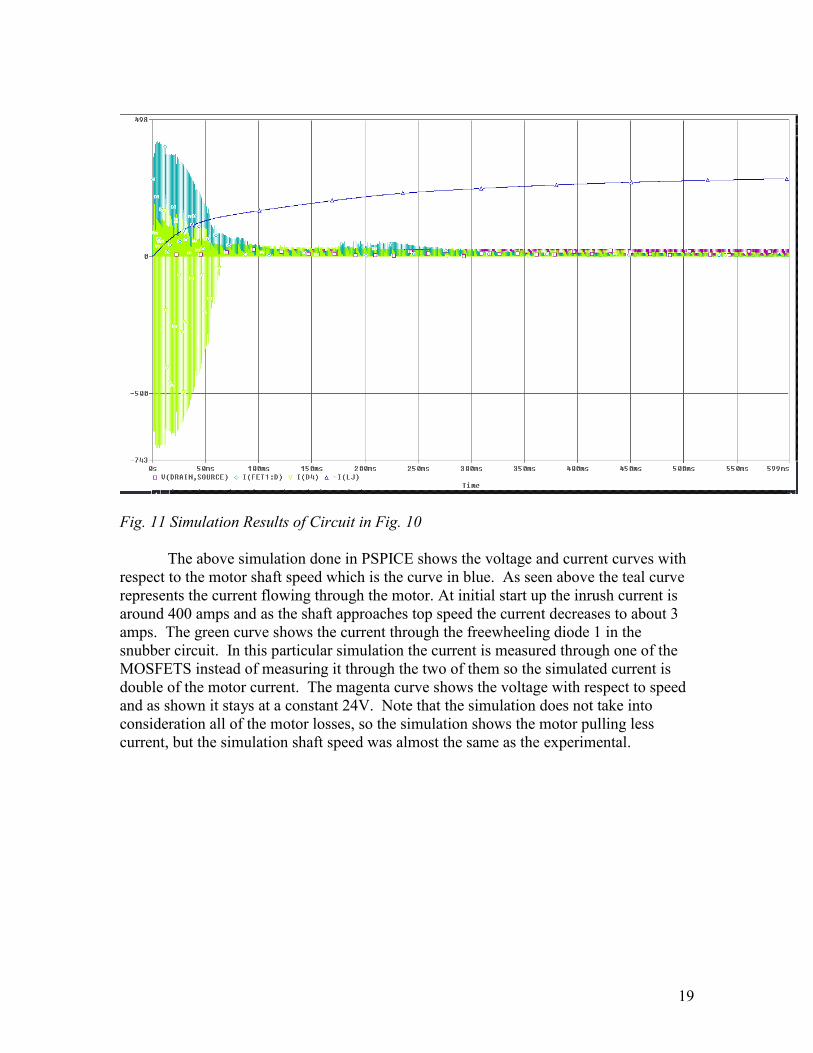
Fig. 11 Simulation Results of Circuit in Fig. 10
The above simulation done in PSPICE shows the voltage and current curves with
respect to the motor shaft speed which is the curve in blue. As seen above the teal curve
represents the current flowing through the motor. At initial start up the inrush current is
around 400 amps and as the shaft approaches top speed the current decreases to about 3
amps. The green curve shows the current through the freewheeling diode 1 in the
snubber circuit. In this particular simulation the current is measured through one of the
MOSFETS instead of measuring it through the two of them so the simulated current is
double of the motor current. The magenta curve shows the voltage with respect to speed
and as shown it stays at a constant 24V. Note that the simulation does not take into
consideration all of the motor losses, so the simulation shows the motor pulling less
current, but the simulation shaft speed was almost the same as the experimental.
20
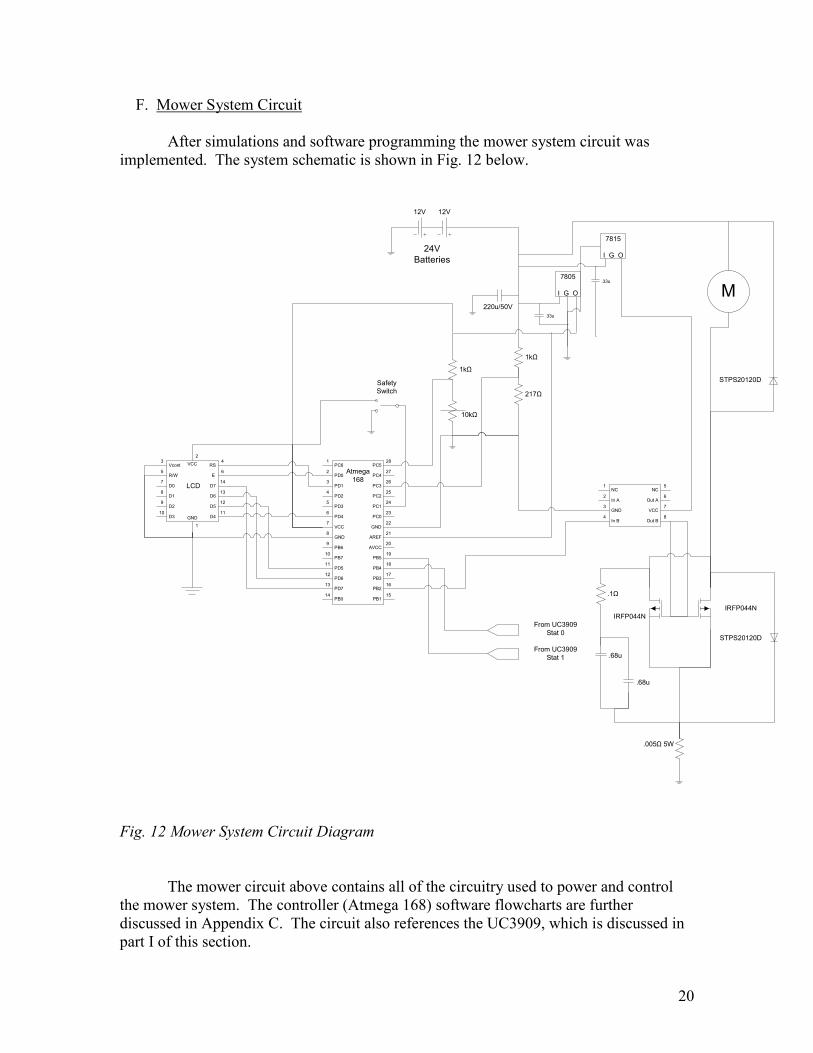
F. Mower System Circuit
After simulations and software programming the mower system circuit was
implemented. The system schematic is shown in Fig. 12 below.
Vcont3
R/W5
7D0
8D1
RS
E
D7
D6
4
6
14
13
VCC
2
D29
D512
D310
D411
GND
1
LCD
PC61
PD02
3PD1
4PD2
PC5
PC4
PC3
PC2
28
27
26
25
PD35
PD46
7VCC
8GND
PC1
PC0
GND
AREF
24
23
22
21
PB69
AVCC20
PD511
PD612
13PD7
14PB0
PB4
PB3
PB2
PB1
18
17
16
15
PB710
PB519
Atmega168
SafetySwitch
M
.005Ω 5W
10kΩ
1kΩ
217Ω
1kΩ
NC1
In A2
3GND
4In B
NC
Out A
VCC
Out B
5
6
7
8
7815
I G O
220u/50V
.33u
.33u
7805
I G O
IRFP044NIRFP044N
STPS20120D
STPS20120D
.1Ω
.68u
.68u
From UC3909Stat 0
From UC3909Stat 1
12V 12V
24VBatteries
Fig. 12 Mower System Circuit Diagram
The mower circuit above contains all of the circuitry used to power and control
the mower system. The controller (Atmega 168) software flowcharts are further
discussed in Appendix C. The circuit also references the UC3909, which is discussed in
part I of this section.

21
G. Solar Panel Calculations
The charger system is powered by a photovoltaic panel. This component is the
most expensive part of the entire project, so the smallest size that can charge the batteries
in 5 days must be used. The solar panel must be able to supply enough voltage and
current to charge the two 12V batteries, as well as collect enough energy in 5 days to do
this. A 50W solar panel, the BP350, was the most appropriate solar panel to meet the
requirements. It is important to note that in the solar charger system, the batteries are
charged in parallel, so that they can be charged at 12V, because to charge at 24V, it
would require a much larger solar panel. The solar panel is selected based on the
minimum solar energy the U.S receives in places that can still grow grass. According to
Fig. 13 from the National Renewable Energy Laboratory website, the upper parts of the
country receive the least amount of solar energy, and therefore this number should be
used when calculating the amount of solar energy the panel can collect.
Fig. 13 Minimum Daily Solar Radiation Per Month (NREL.gov)
The efficiency of the BP350 is 10%, which means 10% of the solar radiation
energy incident on the panel collected is converted to electric energy. Taking into
account this efficiency combined with the panel area and minimum radiation of 3.5
KWh/m2/day yields the energy collected per day by the panel.
22
( ) dayMJhr
s
W
sJ
KW
W
daym
KWh
ft
mft /4682.0%10
1
3600/1
1
1000
/
5.3
1
092903.4
22
22 =
Eqn. 14
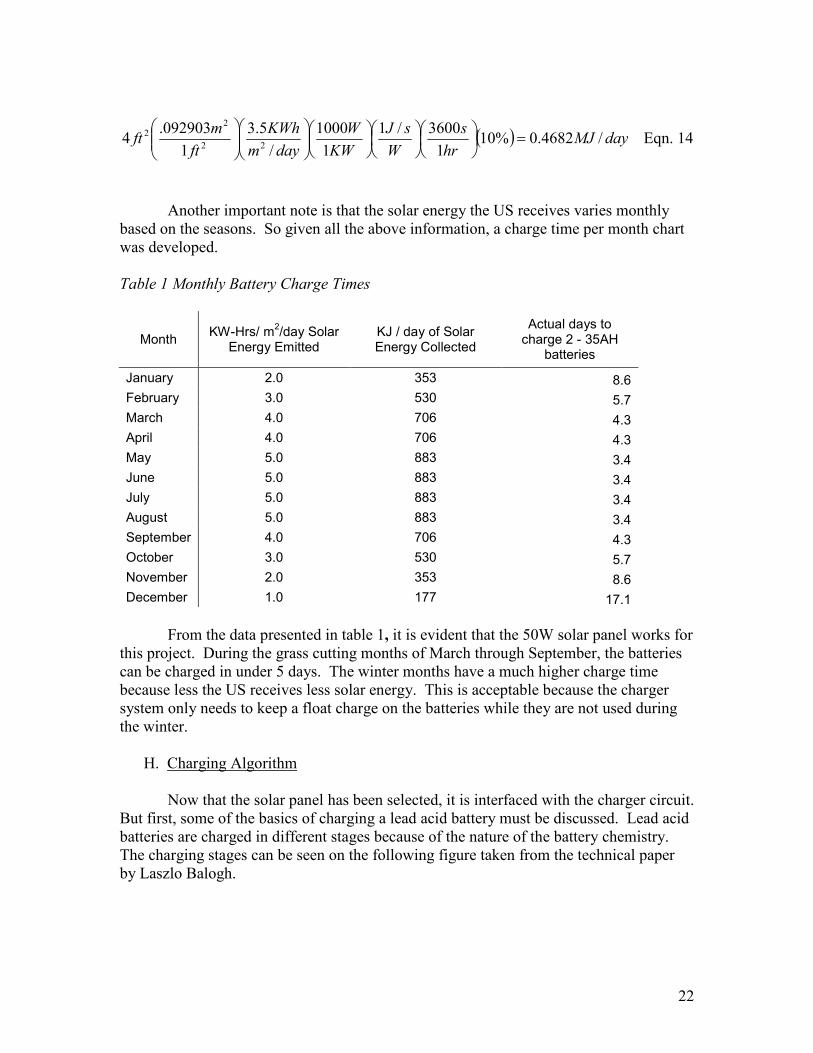
Another important note is that the solar energy the US receives varies monthly
based on the seasons. So given all the above information, a charge time per month chart
was developed.
Table 1 Monthly Battery Charge Times
Month KW-Hrs/ m2
/day Solar Energy Emitted
KJ / day of Solar Energy Collected
Actual days to charge 2 - 35AH
batteries
January 2.0 353 8.6
February 3.0 530 5.7
March 4.0 706 4.3
April 4.0 706 4.3
May 5.0 883 3.4
June 5.0 883 3.4
July 5.0 883 3.4
August 5.0 883 3.4
September 4.0 706 4.3
October 3.0 530 5.7
November 2.0 353 8.6
December 1.0 177 17.1
From the data presented in table 1, it is evident that the 50W solar panel works for
this project. During the grass cutting months of March through September, the batteries
can be charged in under 5 days. The winter months have a much higher charge time
because less the US receives less solar energy. This is acceptable because the charger
system only needs to keep a float charge on the batteries while they are not used during
the winter.
H. Charging Algorithm
Now that the solar panel has been selected, it is interfaced with the charger circuit.
But first, some of the basics of charging a lead acid battery must be discussed. Lead acid
batteries are charged in different stages because of the nature of the battery chemistry.
The charging stages can be seen on the following figure taken from the technical paper
by Laszlo Balogh.
23
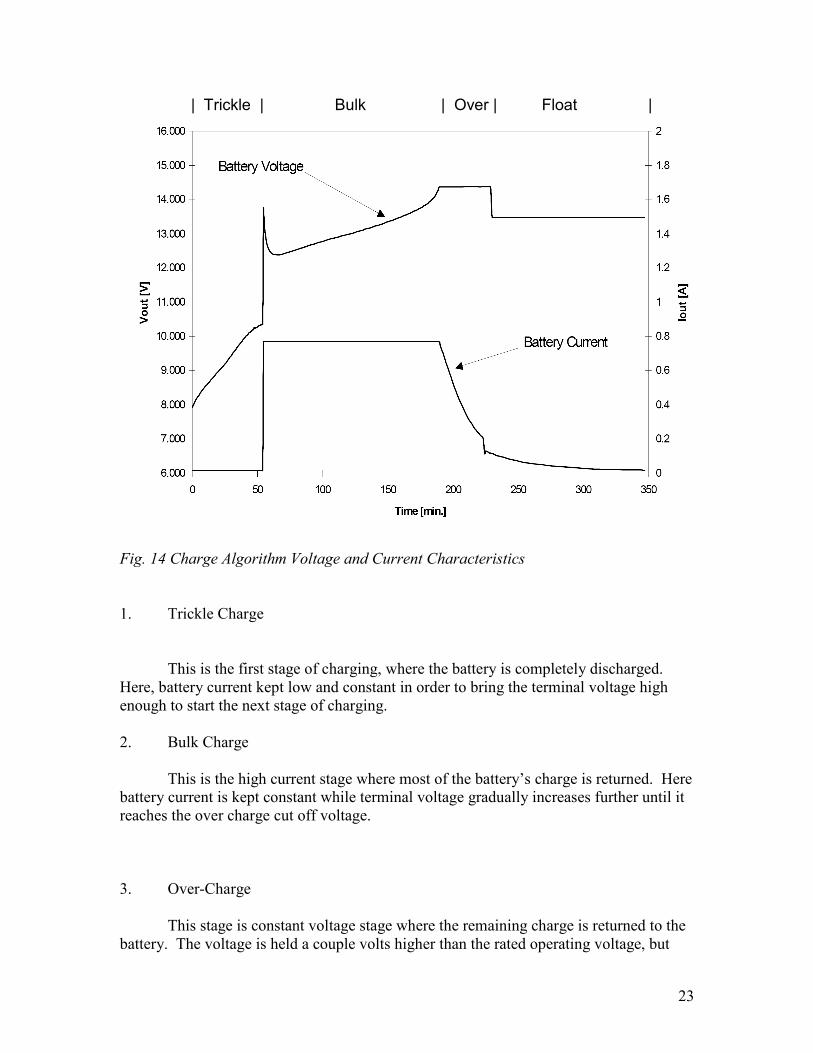
| Trickle | Bulk | Over | Float |
Fig. 14 Charge Algorithm Voltage and Current Characteristics
1. Trickle Charge
This is the first stage of charging, where the battery is completely discharged.
Here, battery current kept low and constant in order to bring the terminal voltage high
enough to start the next stage of charging.
2. Bulk Charge
This is the high current stage where most of the battery’s charge is returned. Here
battery current is kept constant while terminal voltage gradually increases further until it
reaches the over charge cut off voltage.
3. Over-Charge
This stage is constant voltage stage where the remaining charge is returned to the
battery. The voltage is held a couple volts higher than the rated operating voltage, but
24
only for a short period of time. Again, the charge algorithm is based on the internal
chemistry characteristics of lead acid batteries.
4. Float Charge
This is the final stage of the battery charge algorithm. Once the charger reaches
this stage, the battery is fully charged. This is a constant voltage stage just slightly over
the operating terminal voltage. This stage just maintains the battery so it is ready for use
by charging at the same rate the battery naturally self-discharges.
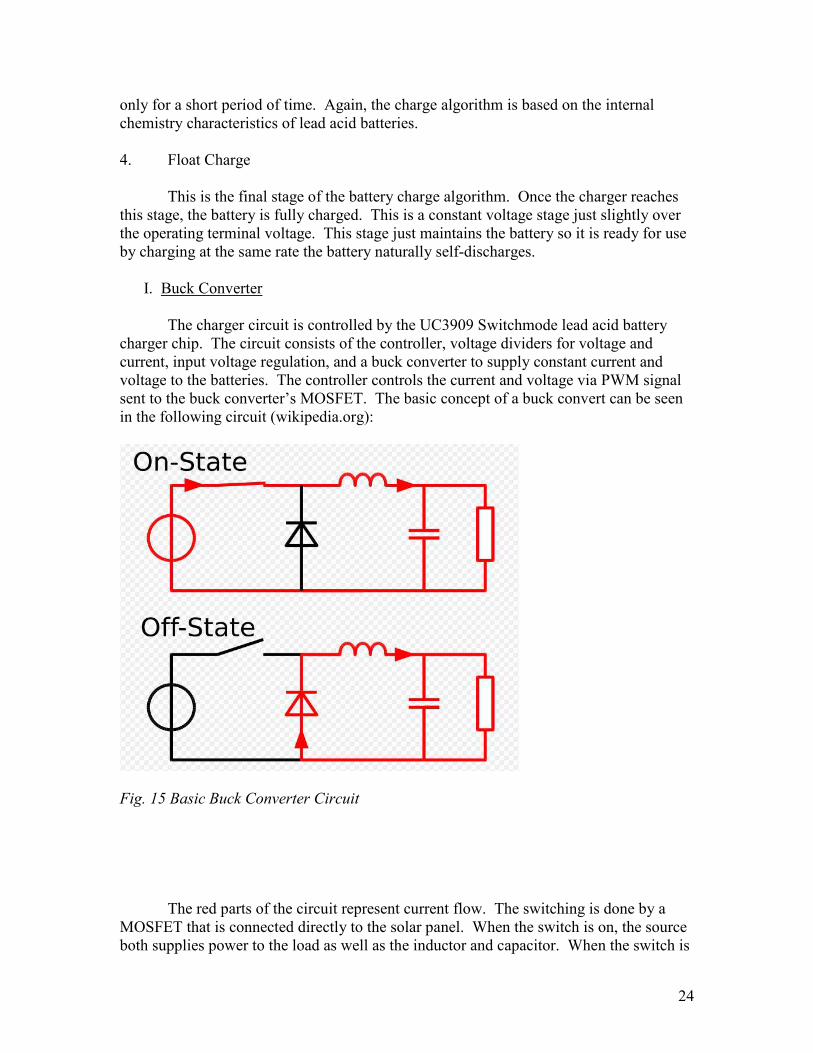
I. Buck Converter
The charger circuit is controlled by the UC3909 Switchmode lead acid battery
charger chip. The circuit consists of the controller, voltage dividers for voltage and
current, input voltage regulation, and a buck converter to supply constant current and
voltage to the batteries. The controller controls the current and voltage via PWM signal
sent to the buck converter’s MOSFET. The basic concept of a buck convert can be seen
in the following circuit (wikipedia.org):
Fig. 15 Basic Buck Converter Circuit
The red parts of the circuit represent current flow. The switching is done by a
MOSFET that is connected directly to the solar panel. When the switch is on, the source
both supplies power to the load as well as the inductor and capacitor. When the switch is
25
off, the diode conducts to complete the circuit, and the energy stored in the inductor and
capacitor is then supplied to the source. This effectively provides constant current and
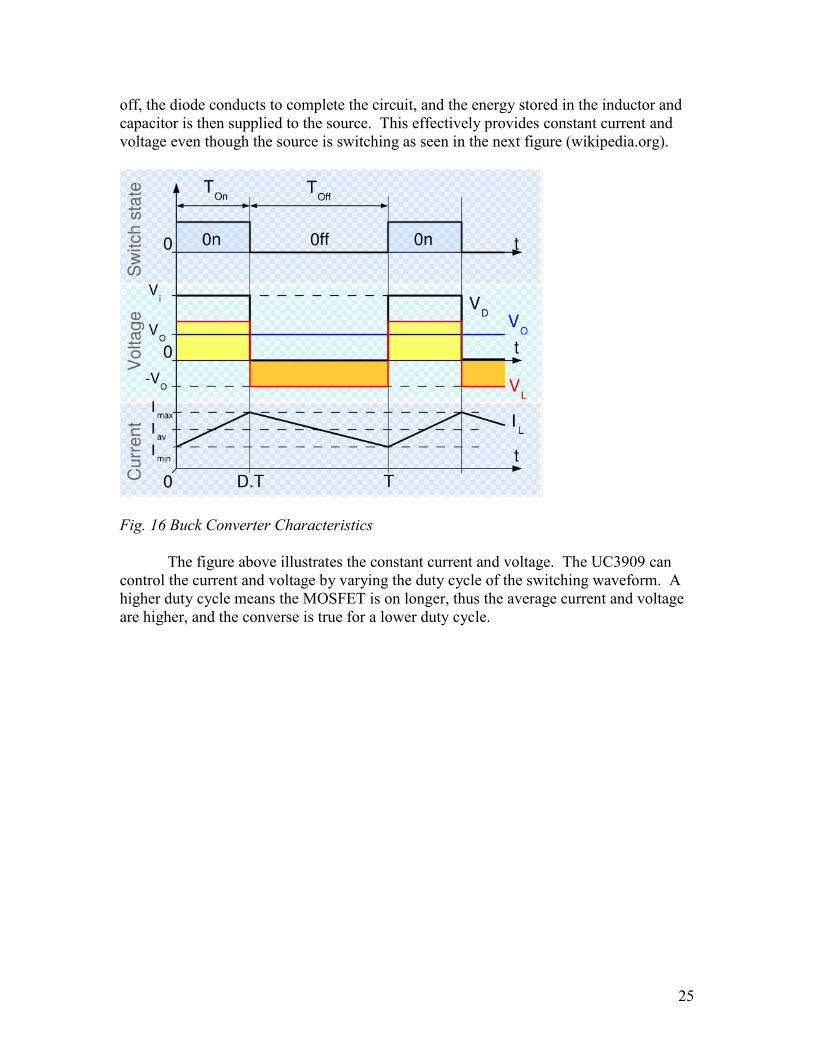
voltage even though the source is switching as seen in the next figure (wikipedia.org).
Fig. 16 Buck Converter Characteristics
The figure above illustrates the constant current and voltage. The UC3909 can
control the current and voltage by varying the duty cycle of the switching waveform. A
higher duty cycle means the MOSFET is on longer, thus the average current and voltage
are higher, and the converse is true for a lower duty cycle.

26
J. UC3909 Circuit Equations
Now that the basics of the buck converter operation have been discussed, it is
necessary show how the UC3909 charger circuit works. The controller measures the
battery terminal voltage as well as the current through a current sense resistor. The
controller also must know what voltage and current cutoff points are in order to change to
the next stage of the charging algorithm previously mentioned. It does this by various
resistor and capacitor networks. The formulas for calculating these values and the rest of
the components in the charger circuit are provided in a technical paper published by the
chip’s manufacturer (Balogh). See the UC3909 Battery Charger Appendix A for the
formulas required to design the charger circuit.
All the charger circuit equations are based on the parameters inherent to the
battery. Again, it is important to note that because the batteries are charged in parallel,
the voltage is the same at 12V, but the capacity must be doubled to obtain the correct
charging currents. Using the characteristics of the batteries selected for this project, the
DCM0035 by Interstate, the component values were calculated using the extensive design
equations given in Appendix A. The components are connected as shown to the UC3909
as shown in Fig. 17, which is the complete charger circuit.
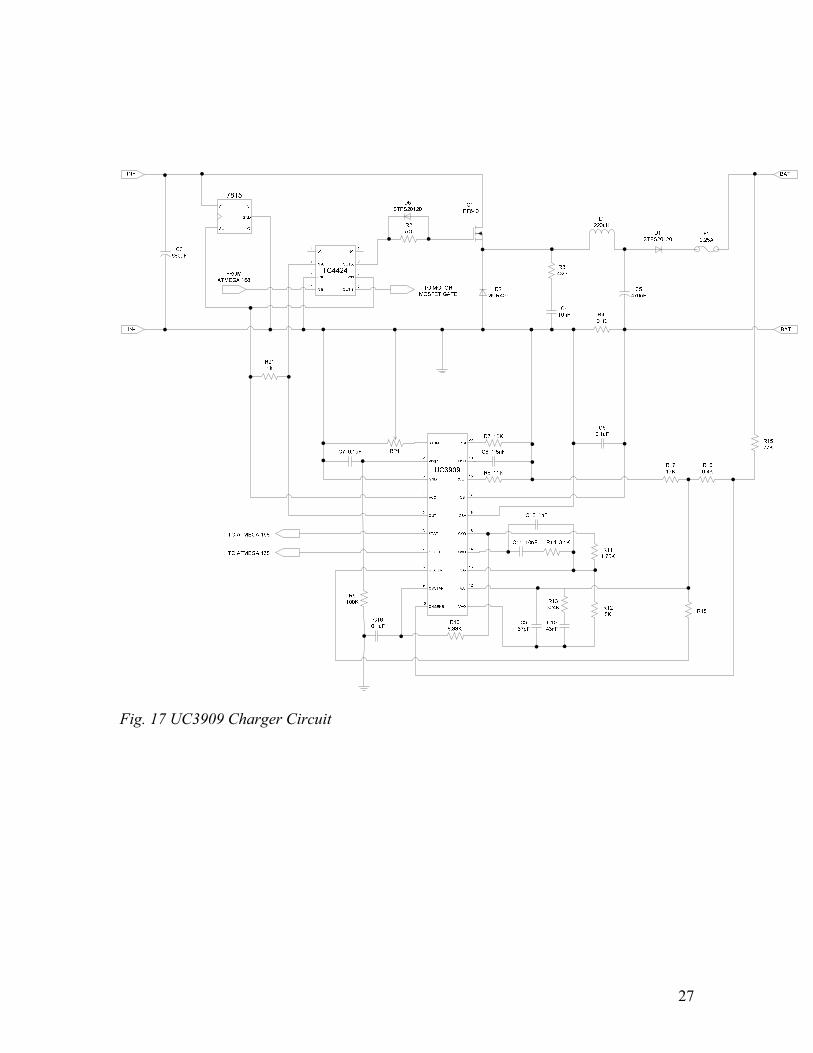
27
Fig. 17 UC3909 Charger Circuit
28
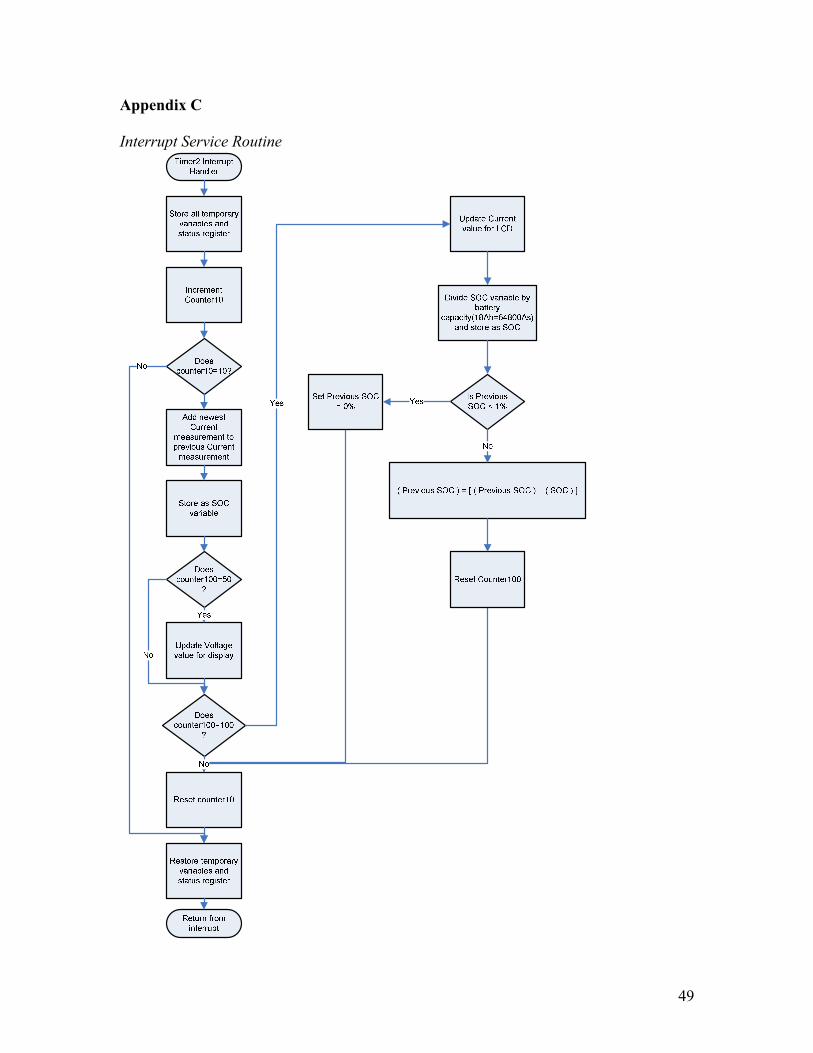
K. Measuring State of Charge (SOC)
As discussed in the Functional Description section, the microcontroller on the
mower displays the state of charge of the battery. This requires that the State of Charge
(SOC) be measured. Of all the methods researched, current counting (Zhu), as given in
Eqn. 15, is implemented on mower controller to determine the SOC.
∗±= ∫ IdtCapacity
SOCSOC1
0 Eqn. 15
SOC is the calculated state-of-charge of the battery, SOC0 is the initial state-of-charge of
the battery, Capacity is given by the battery manufacturer, and current (I) is measured.
Current is measured using a current sense resistor. These are typically resistors
that are very small and accurate. A current sense resistor is placed in the ground path of
the circuit and the voltage drop was measured across it. Using a .005Ω resistor made it
possible to omit a conversion step to determine the actual current because the A/D
register was very close to the actual current.
sensesense RIV ∗= Eqn. 16
Imeasured
AREF
sense
V
V 1024∗= Eqn. 17
Ex.
I=30A
Rsense=.005Ω
VAREF=5Vdc
Vsense=30*.005=.15 Eqn. 18
Imeasured=30.72
L. Measuring Battery Voltage
The microcontroller on the mower also displays the terminal voltage of the
batteries which requires measurement of the voltage. The maximum voltage of each
battery at full charge is approximately 14Vdc. Since the batteries are in a series
configuration, the maximum total battery voltage is 28Vdc. Since the A/D channels on
the microcontroller can only measure 0-5Vdc, a voltage divider circuit must be used. The
maximum output voltage of the divider circuit needs to be 5Vdc. This corresponds to
28Vdc as well as the maximum value that the A/D register can store (210
-1=1023 = 5V
when VAREF=5V).
29
21
2
28
5
RR
R
Vdc
Vdc
+= Eqn. 19
A 1kΩ was selected for R1 to limit current at the microcontroller. This yields a value of
217Ω for R2.
V batt(Register Value)
AREF
batt
V
V 102
2171000
217∗
+
∗= Eqn. 20
If Vbatt = 28Vdc and VAREF = 5Vdc, then V batt(Register Value) is1022. V batt(Register Value) is
divided by the actual voltage to determine how they are related.
5.3628
1022= Eqn. 21
Eqn. 20 is used to convert V batt(Register Value) to the actual voltage on the
microcontroller. The microcontroller can only divide by whole numbers. To fix this, it is
multiplied by 10 then divided by 10*36.5=365.
=∗
365
10 V Value)ter batt(RegisV batt(actual). Eqn. 22
M. Determining the Throttle Setting
A voltage divider with a 10kΩ potentiometer is used as the user input for the
throttle. The input voltage to the divider is 5Vdc. The output voltage will be between 0
and 5Vdc. 0Vdc will correspond to a 50% speed setting, and 5Vdc will correspond to a
100% speed setting. Timer1 on the microcontroller controls the PWM signal. A counter
is incremented until it equals 2046 and then resets to 0. Every time the counter is
incremented, the count is compared to a compare register. If they are equal, a pin is
toggled. This creates the PWM signal. For example, if the compare register had 1023
stored, this would result in a 50% duty cycle. In order to have 0Vdc correspond to a 50%
duty cycle, 1023 should be added to the A/D register value and then stored in the
compare register.
Compare Register 10231024
+∗
=AREF
out
V
V Eqn. 23
30
V. Implementation and Results
Mower System Results
The various subsystems of the mower system and charger system, discussed in
Section IV, were implemented and tested. In case of the motor control subsystem, the
microcontroller PWM signal with throttle control input, voltage regulators, gate driver
and power MOSFETs were successfully implemented. The motor control subsystem was
first tested in the lab using a PWM signal supplied by a function generator and system
operation was verified. Next the microcontroller was interfaced to the gate driver and
speed control of the motor using the throttle input to the microcontroller was verified.
With these successful tests, the complete motor control subsystem was finally mounted
on the mower platform with the Tecumseh motor with blade and tested by mowing grass.
The test was carried out by mowing dense wet grass and cutting 1 ½ inches off the top of
the grass. The pace at which the mower was pushed was at a walking speed of
approximately 2.66 ft/s. The mower ran for almost an hour and a half and mowed
approximately 13,000 sq. ft, before the batteries were completely discharged. This
mowing test exceeded the requirement to mow a 10,000 sq. ft yard in one hour. As far
as the weight expectation, the final mower system weighed 91 pounds as a prototype.
The 90 pound specification certainly could be met by improved mower deck design,
optimizing battery size and weight and using a brushless DC motor. Furthermore, the
speed control worked correctly. When the throttle knob was adjusted, the motor RPM
would decrease or increase as the microcontroller varied the PWM signal accordingly.
This change in speed was also displayed correctly. Unfortunately the current and state of
charge were not measured or displayed correctly due to problems with the current sense
resistor. Though the SOC algorithm was correct, the current measurement was wrong
precluding a correct SOC calculation. The problem with the current measurement was
noise due to the small current sense resistor. The problem with the voltage display is due
to the battery voltage divider not working correctly.
Solar Charger System Results
The solar charger system was implemented as shown in figure 17. The solar
panel input was simulated by the Agilent power supply, and the battery was simulated as
a load resister. First, the UC3909 chip operation was verified by supplying an input
voltage similar to the solar panel output at peak power, about 19V. Then the PWM signal
was measured with the oscilloscope along with the timing capacitor for the switching
frequency. Once they were verified, the output of the UC3909 was interfaced to the buck
converter which was loaded by the resistor. Then, voltage and current measurements
were made on the load. The input voltage was slowly increased until peak power to
simulate how the sun moves from dawn to the peak power point. The Chip turned on
around 8V, and the load voltage increased to about 10.5V, and current was about 150 mA
when the input voltage was at 19V. Once the load voltage reached this level, the charger
system regulated it there for further increases of the input voltage up to the power supply
limit of 26V. This indicates the charger system was functioning, but not within the
specifications necessary to charge two 12V batteries. This is most likely due to the

31
tolerance of the components calculated in appendices A and B. These components are
used to set the voltage and current levels for the charge algorithm. Another issue may be
noise. Because the UC3909 is analog, it is more susceptible to noise issues, and most of
the measurements made were fairly noisy. Similar to the current sense issue mentioned
for the mower system, the charger system also uses a low value resistor for current
sensing.
VI. Recommendations for Future Work
In conclusion, the mower exceeded most of the initial specifications and the
charger system remained out of the initial specifications. This project is interesting and
offers the opportunity for future work as follows.
Mower System Recommendations
• Design the mower with a brushless DC motor. This would dramatically increase
efficiency and therefore battery sizing and other parts of the power electronics
may have to be redesigned
• Add a self propelling functionality, because of the increased weight of the
batteries. This change would also need further design considerations for the
battery size and power usage.
• Utilize a Hall Effect sensor for measuring motor current. This would increase the
accuracy of sensing current for the SOC algorithm.
• Implement the AC power back up. This was included in the original
specifications to allow for quick charging and cases of prolonged cloudy weather,
but it was omitted to reduce the scope of the project
• Obtain a sturdier mower deck. This project used a plastic deck that was not
designed to work with the motor and batteries in the system, so it was awkward to
push around.

32
Charger System Recommendations
• Redesign and simulate the charger circuit. Because the circuit displayed correct
functionality in the laboratory, it appears the problem is with the choice of
components. It is recommend that new component values computed and
simulated. However this will require a model for a lead acid battery.
• Interface the redesigned charger circuit to the solar panel.
• Develop a digital charging system. A digital system would be much less
susceptible to noise, and it could be implemented on the same microcontroller
used in the mower system. This may turn out to be a project in itself because it
will most likely need a closed loop feedback controls design to integrate the
charge algorithm.
33
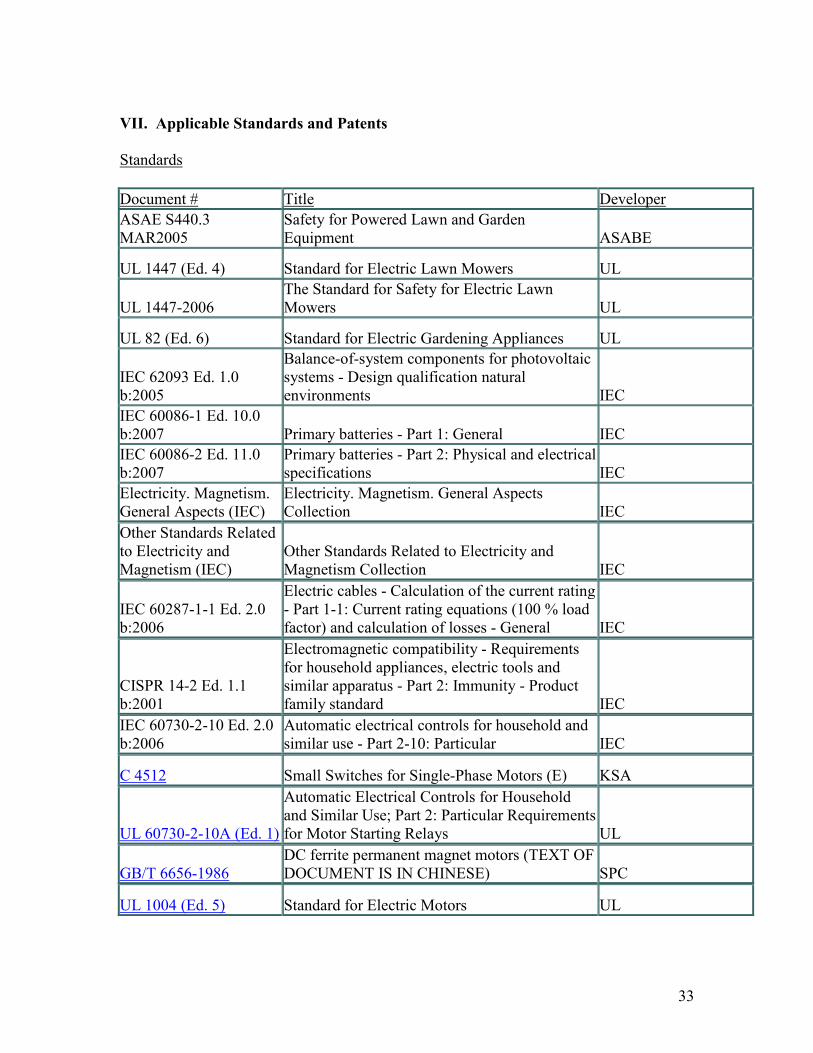
VII. Applicable Standards and Patents
Standards
Document # Title Developer
ASAE S440.3
MAR2005
Safety for Powered Lawn and Garden
Equipment ASABE
UL 1447 (Ed. 4) Standard for Electric Lawn Mowers UL
UL 1447-2006
The Standard for Safety for Electric Lawn
Mowers UL
UL 82 (Ed. 6) Standard for Electric Gardening Appliances UL
IEC 62093 Ed. 1.0
b:2005
Balance-of-system components for photovoltaic
systems - Design qualification natural
environments IEC
IEC 60086-1 Ed. 10.0
b:2007 Primary batteries - Part 1: General IEC
IEC 60086-2 Ed. 11.0
b:2007
Primary batteries - Part 2: Physical and electrical
specifications IEC
Electricity. Magnetism.
General Aspects (IEC)
Electricity. Magnetism. General Aspects
Collection IEC
Other Standards Related
to Electricity and
Magnetism (IEC)
Other Standards Related to Electricity and
Magnetism Collection IEC
IEC 60287-1-1 Ed. 2.0
b:2006
Electric cables - Calculation of the current rating
- Part 1-1: Current rating equations (100 % load
factor) and calculation of losses - General IEC
CISPR 14-2 Ed. 1.1
b:2001
Electromagnetic compatibility - Requirements
for household appliances, electric tools and
similar apparatus - Part 2: Immunity - Product
family standard IEC
IEC 60730-2-10 Ed. 2.0
b:2006
Automatic electrical controls for household and
similar use - Part 2-10: Particular IEC
C 4512 Small Switches for Single-Phase Motors (E) KSA
UL 60730-2-10A (Ed. 1)
Automatic Electrical Controls for Household
and Similar Use; Part 2: Particular Requirements
for Motor Starting Relays UL
GB/T 6656-1986
DC ferrite permanent magnet motors (TEXT OF
DOCUMENT IS IN CHINESE) SPC
UL 1004 (Ed. 5) Standard for Electric Motors UL
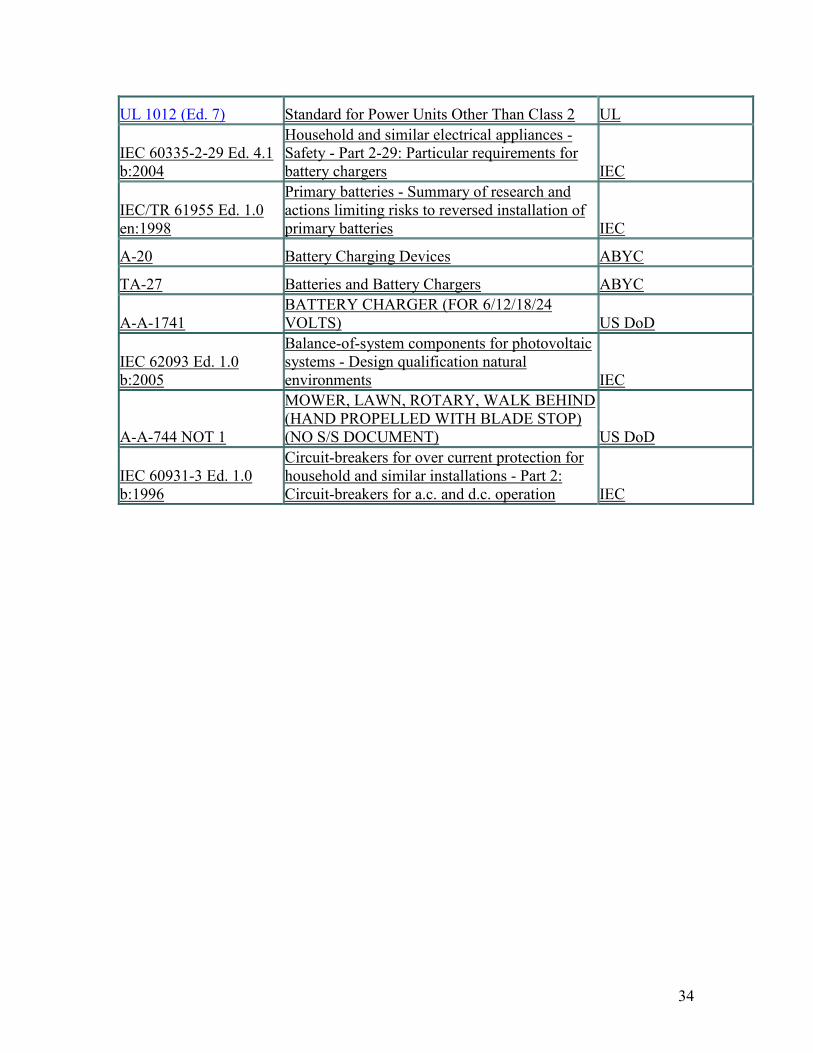
34
UL 1012 (Ed. 7) Standard for Power Units Other Than Class 2 UL
IEC 60335-2-29 Ed. 4.1
b:2004
Household and similar electrical appliances -
Safety - Part 2-29: Particular requirements for
battery chargers IEC
IEC/TR 61955 Ed. 1.0
en:1998
Primary batteries - Summary of research and
actions limiting risks to reversed installation of
primary batteries IEC
A-20 Battery Charging Devices ABYC
TA-27 Batteries and Battery Chargers ABYC
A-A-1741
BATTERY CHARGER (FOR 6/12/18/24
VOLTS) US DoD
IEC 62093 Ed. 1.0
b:2005
Balance-of-system components for photovoltaic
systems - Design qualification natural
environments IEC
A-A-744 NOT 1
MOWER, LAWN, ROTARY, WALK BEHIND
(HAND PROPELLED WITH BLADE STOP)
(NO S/S DOCUMENT) US DoD
IEC 60931-3 Ed. 1.0
b:1996
Circuit-breakers for over current protection for
household and similar installations - Part 2:
Circuit-breakers for a.c. and d.c. operation IEC
35
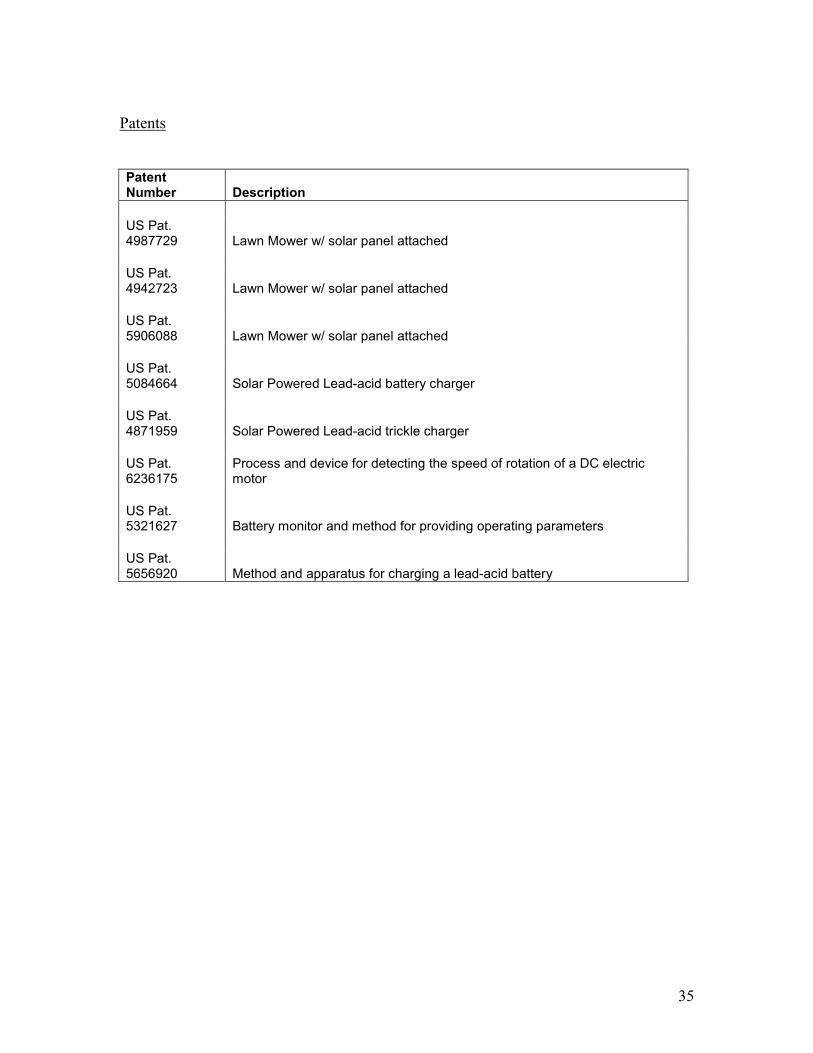
Patents
Patent Number Description
US Pat. 4987729 Lawn Mower w/ solar panel attached
US Pat. 4942723 Lawn Mower w/ solar panel attached
US Pat. 5906088 Lawn Mower w/ solar panel attached
US Pat. 5084664 Solar Powered Lead-acid battery charger
US Pat. 4871959 Solar Powered Lead-acid trickle charger
US Pat. 6236175
Process and device for detecting the speed of rotation of a DC electric motor
US Pat. 5321627 Battery monitor and method for providing operating parameters
US Pat. 5656920 Method and apparatus for charging a lead-acid battery
36
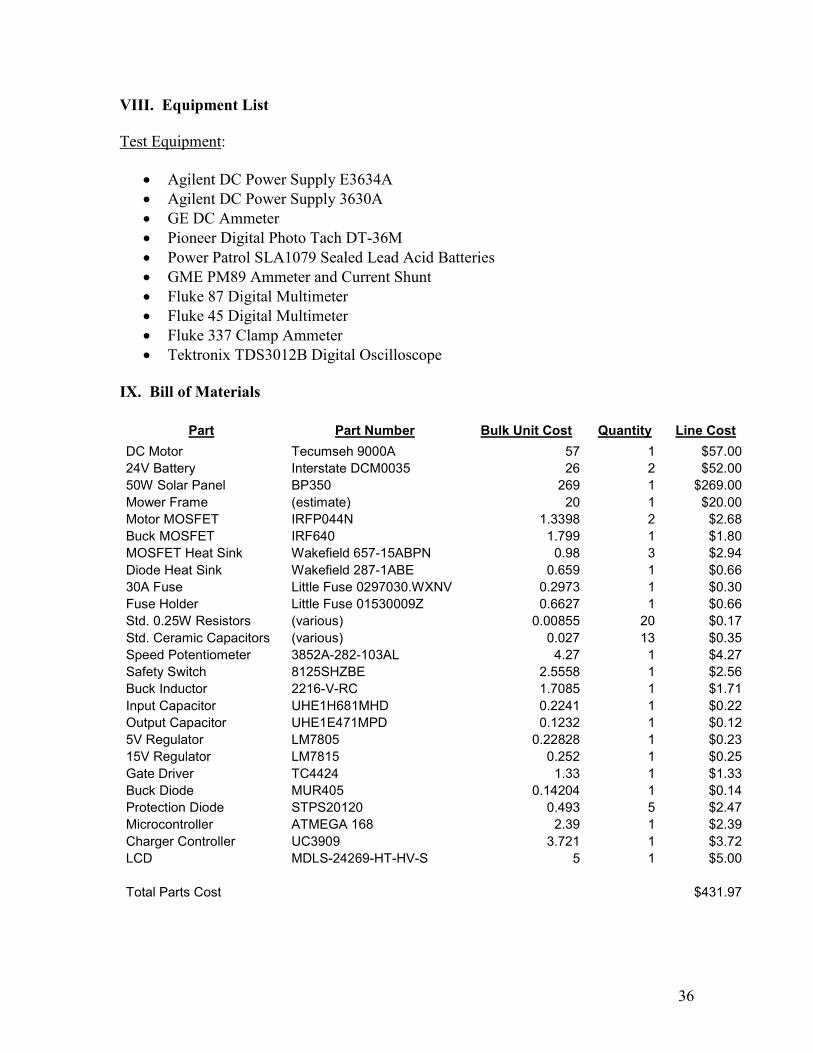
VIII. Equipment List
Test Equipment:
• Agilent DC Power Supply E3634A
• Agilent DC Power Supply 3630A
• GE DC Ammeter
• Pioneer Digital Photo Tach DT-36M
• Power Patrol SLA1079 Sealed Lead Acid Batteries
• GME PM89 Ammeter and Current Shunt
• Fluke 87 Digital Multimeter
• Fluke 45 Digital Multimeter
• Fluke 337 Clamp Ammeter
• Tektronix TDS3012B Digital Oscilloscope
IX. Bill of Materials
Part Part Number Bulk Unit Cost Quantity Line Cost
DC Motor Tecumseh 9000A 57 1 $57.00
24V Battery Interstate DCM0035 26 2 $52.00
50W Solar Panel BP350 269 1 $269.00
Mower Frame (estimate) 20 1 $20.00
Motor MOSFET IRFP044N 1.3398 2 $2.68
Buck MOSFET IRF640 1.799 1 $1.80
MOSFET Heat Sink Wakefield 657-15ABPN 0.98 3 $2.94
Diode Heat Sink Wakefield 287-1ABE 0.659 1 $0.66
30A Fuse Little Fuse 0297030.WXNV 0.2973 1 $0.30
Fuse Holder Little Fuse 01530009Z 0.6627 1 $0.66
Std. 0.25W Resistors (various) 0.00855 20 $0.17
Std. Ceramic Capacitors (various) 0.027 13 $0.35
Speed Potentiometer 3852A-282-103AL 4.27 1 $4.27
Safety Switch 8125SHZBE 2.5558 1 $2.56
Buck Inductor 2216-V-RC 1.7085 1 $1.71
Input Capacitor UHE1H681MHD 0.2241 1 $0.22
Output Capacitor UHE1E471MPD 0.1232 1 $0.12
5V Regulator LM7805 0.22828 1 $0.23
15V Regulator LM7815 0.252 1 $0.25
Gate Driver TC4424 1.33 1 $1.33
Buck Diode MUR405 0.14204 1 $0.14
Protection Diode STPS20120 0.493 5 $2.47
Microcontroller ATMEGA 168 2.39 1 $2.39
Charger Controller UC3909 3.721 1 $3.72
LCD MDLS-24269-HT-HV-S 5 1 $5.00
Total Parts Cost $431.97
37
X. References
http://www.ecircuitcenter.com
http://www.mindfully.org
http://www.batteryuniversity.com
http://www.wikipedia.org
http://NREL.gov
Balogh, Laszlo. “Implementing Multi-State Charge Algorithm with the UC3909
Swichmode Lead Acid Battery Charger Controller.” (Unitrode) Texas
Instruments. 1999.
Zhu, C.B.; Coleman, M.; Hurley, W.G. “State of Charge Determination in a Lead-acid
battery: combined EMF estimation and Ah-balance approach” Power Electronics
Specialists Conference, 2004, PESC 04. 2004 IEEE 35th
Annual vol.3,20-25 June
2004 pp.1908 – 1914
38
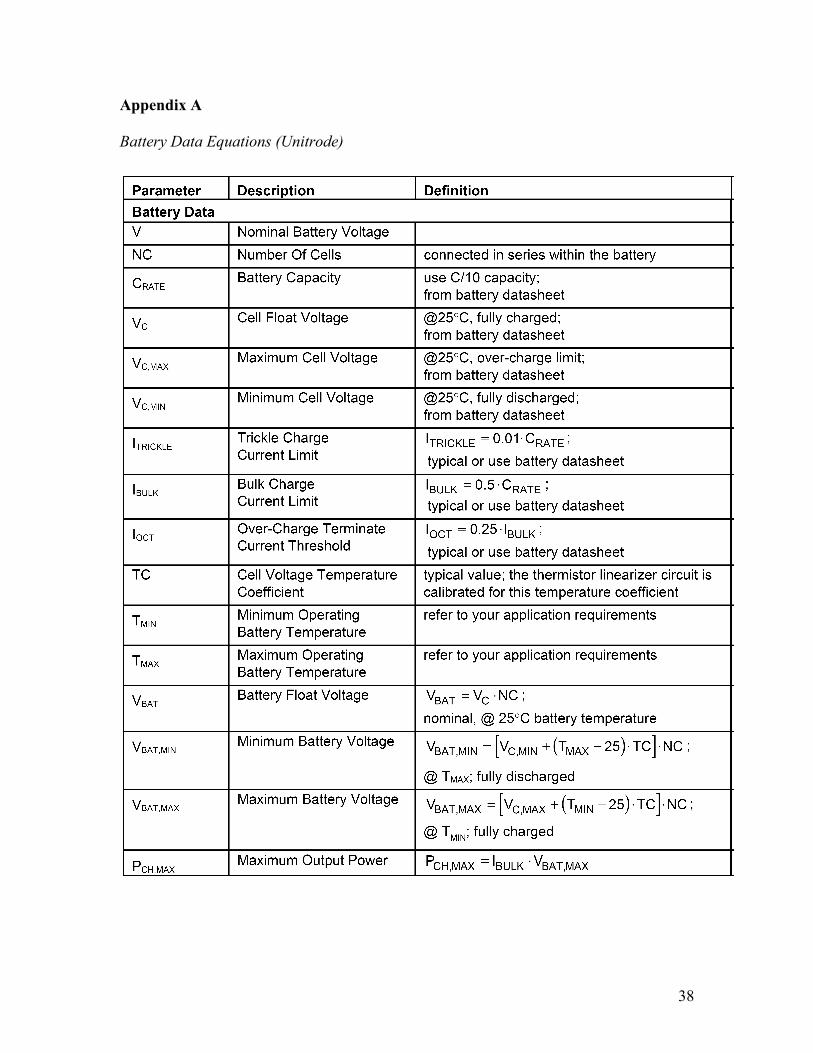
Appendix A
Battery Data Equations (Unitrode)
39
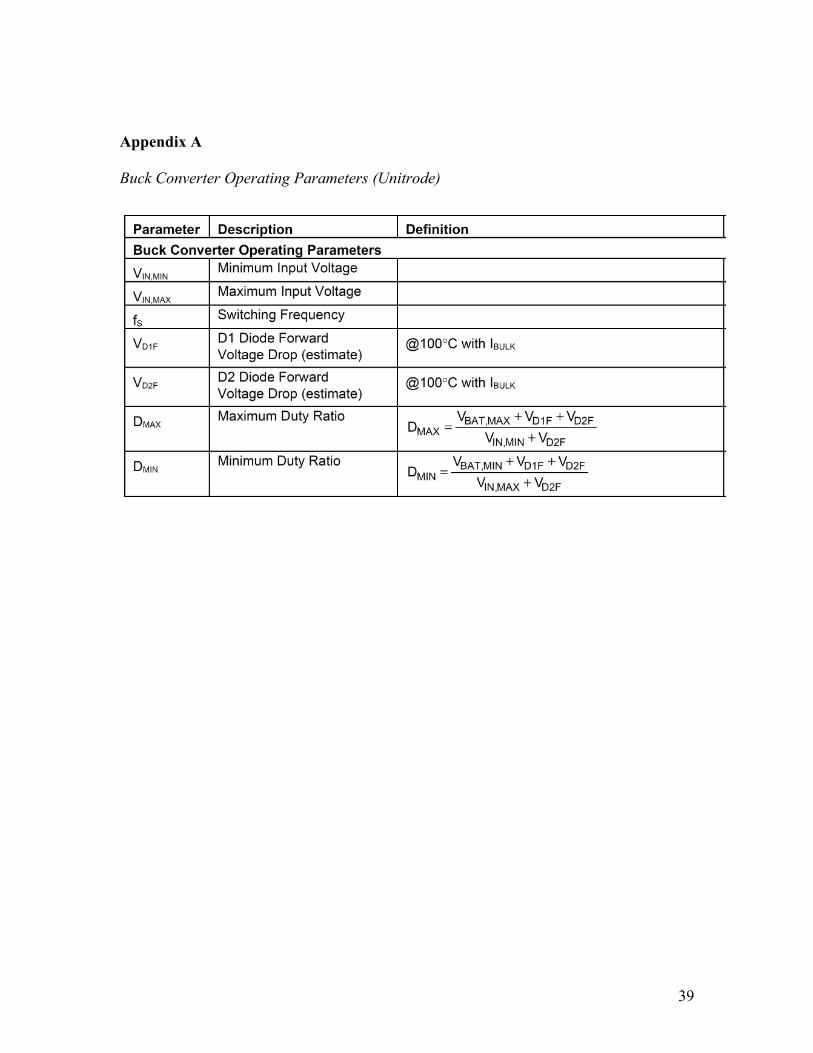
Appendix A
Buck Converter Operating Parameters (Unitrode)
40
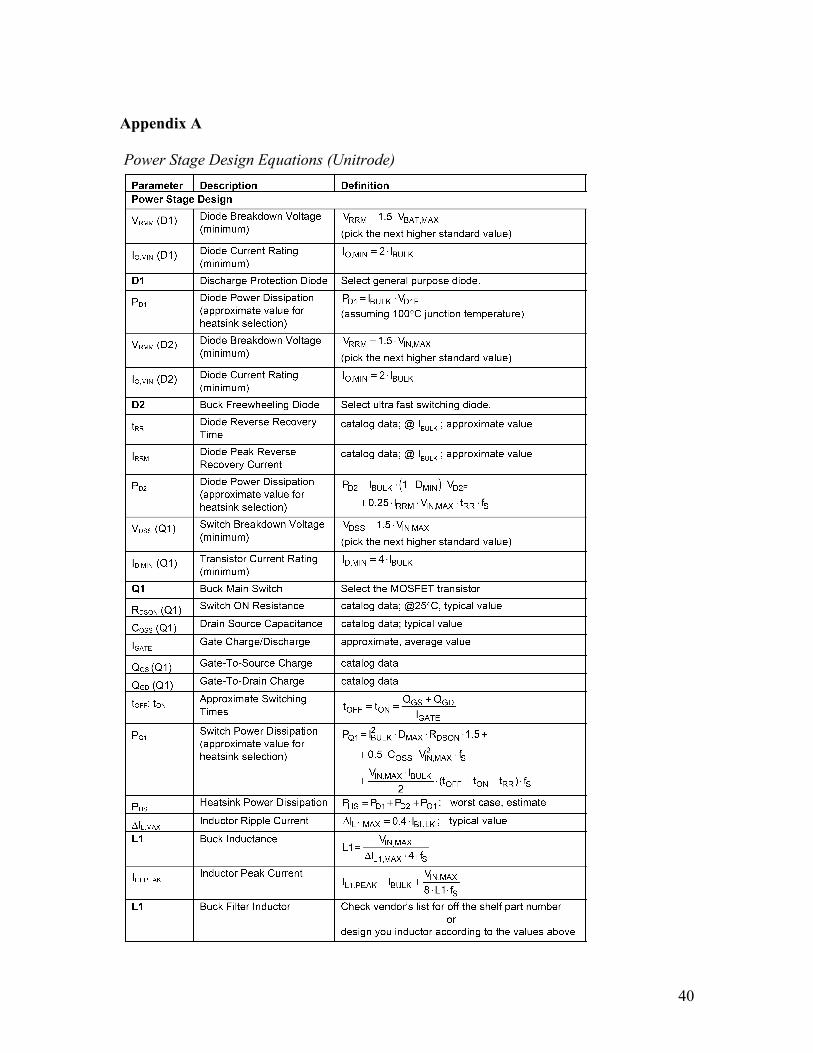
Appendix A
Power Stage Design Equations (Unitrode)
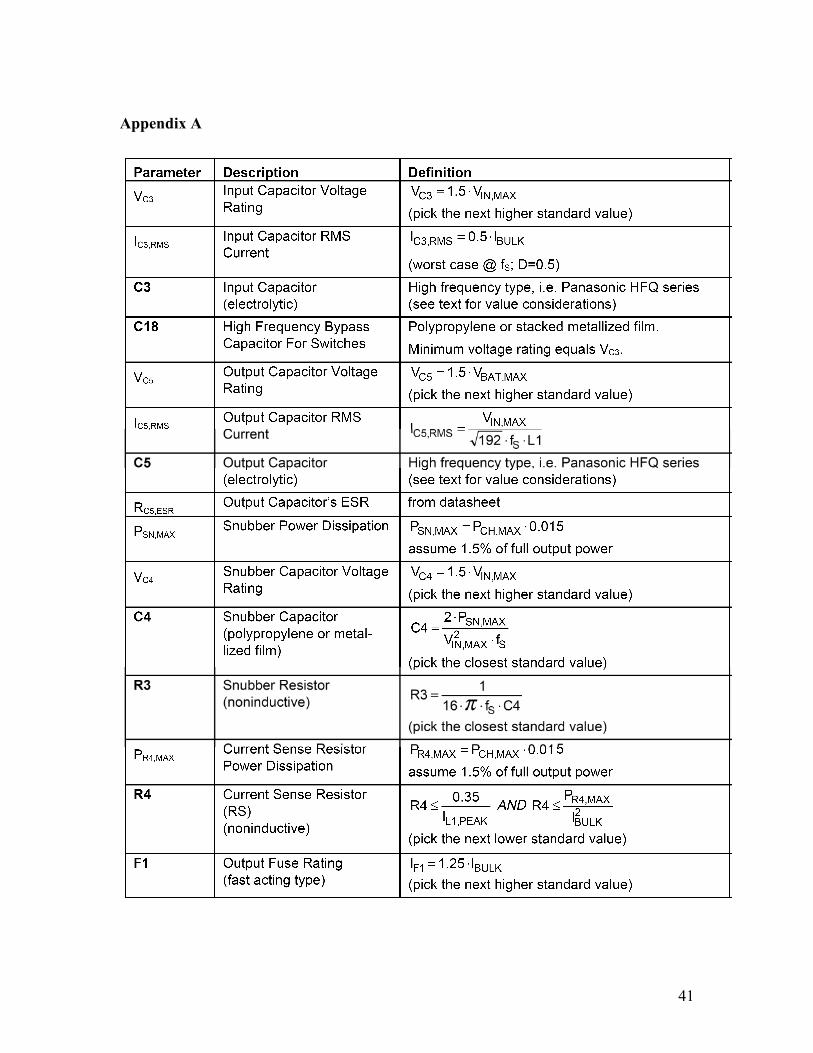
41
Appendix A
42
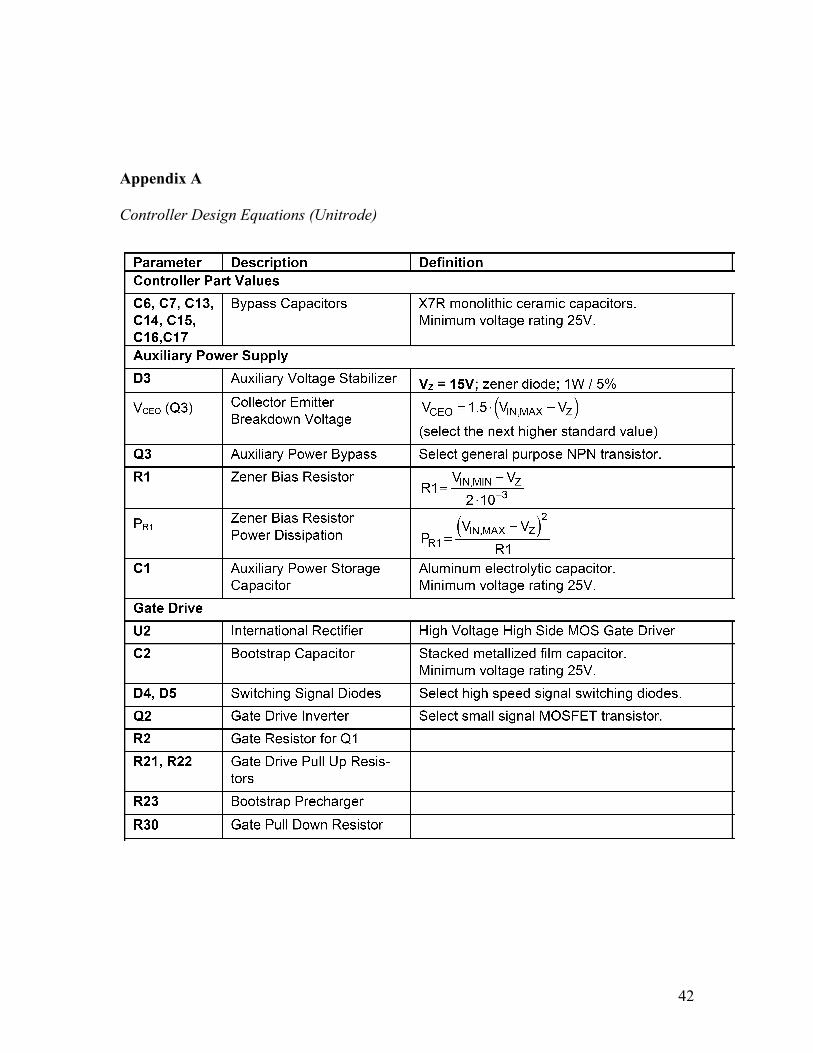
Appendix A
Controller Design Equations (Unitrode)
43
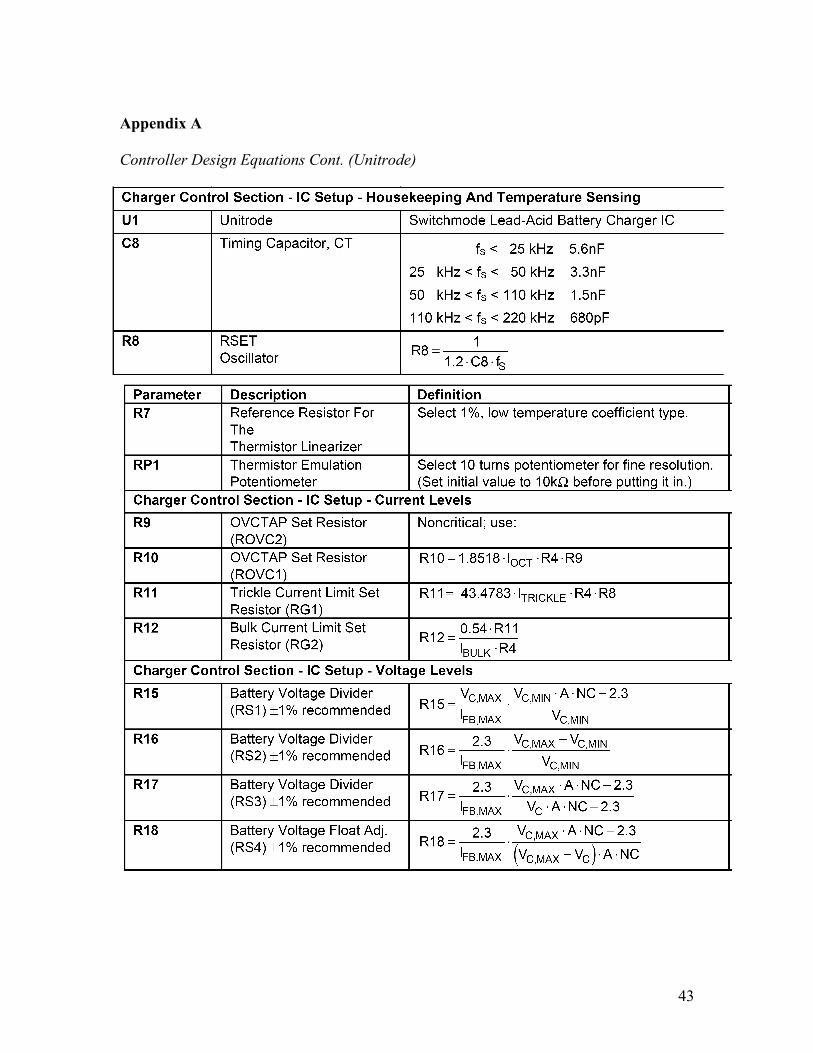
Appendix A
Controller Design Equations Cont. (Unitrode)
44
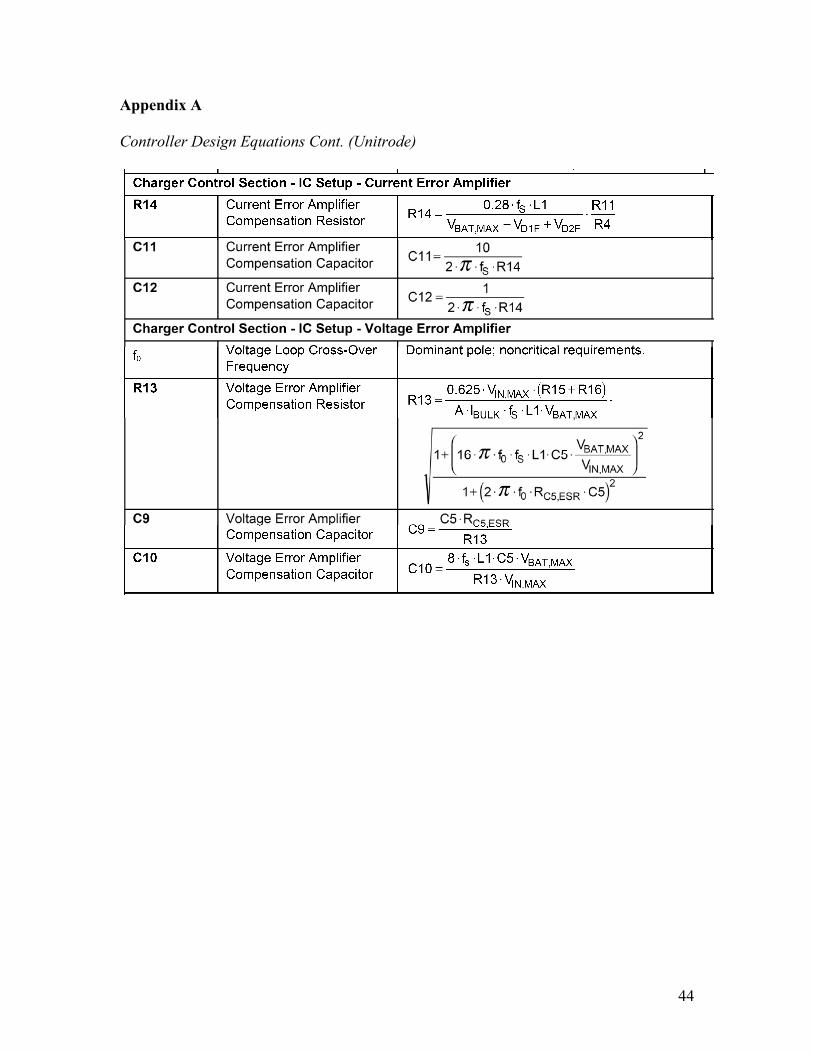
Appendix A
Controller Design Equations Cont. (Unitrode)
45
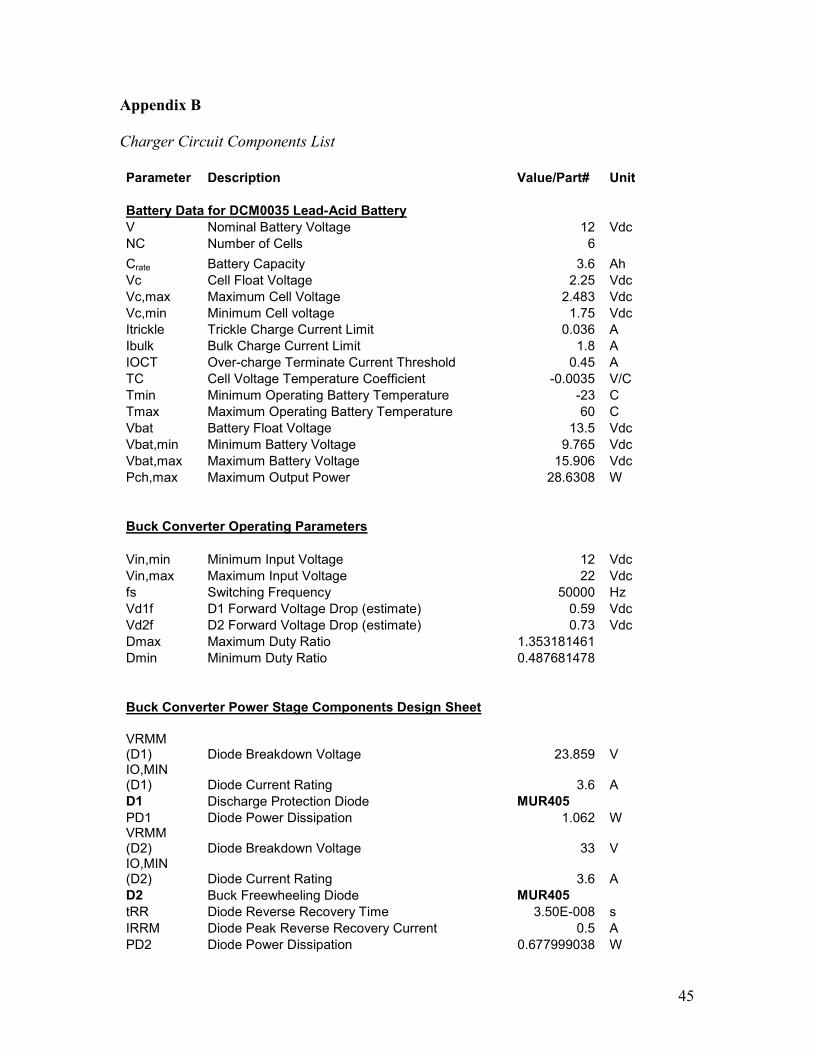
Appendix B
Charger Circuit Components List
Parameter Description Value/Part# Unit
Battery Data for DCM0035 Lead-Acid Battery
V Nominal Battery Voltage 12 Vdc
NC Number of Cells 6
Crate Battery Capacity 3.6 Ah
Vc Cell Float Voltage 2.25 Vdc
Vc,max Maximum Cell Voltage 2.483 Vdc
Vc,min Minimum Cell voltage 1.75 Vdc Itrickle Trickle Charge Current Limit 0.036 A
Ibulk Bulk Charge Current Limit 1.8 A
IOCT Over-charge Terminate Current Threshold 0.45 A
TC Cell Voltage Temperature Coefficient -0.0035 V/C
Tmin Minimum Operating Battery Temperature -23 C
Tmax Maximum Operating Battery Temperature 60 C
Vbat Battery Float Voltage 13.5 Vdc
Vbat,min Minimum Battery Voltage 9.765 Vdc
Vbat,max Maximum Battery Voltage 15.906 Vdc
Pch,max Maximum Output Power 28.6308 W
Buck Converter Operating Parameters
Vin,min Minimum Input Voltage 12 Vdc
Vin,max Maximum Input Voltage 22 Vdc
fs Switching Frequency 50000 Hz
Vd1f D1 Forward Voltage Drop (estimate) 0.59 Vdc
Vd2f D2 Forward Voltage Drop (estimate) 0.73 Vdc
Dmax Maximum Duty Ratio 1.353181461
Dmin Minimum Duty Ratio 0.487681478
Buck Converter Power Stage Components Design Sheet VRMM (D1) Diode Breakdown Voltage 23.859 V IO,MIN (D1) Diode Current Rating 3.6 A D1 Discharge Protection Diode MUR405
PD1 Diode Power Dissipation 1.062 W VRMM (D2) Diode Breakdown Voltage 33 V IO,MIN (D2) Diode Current Rating 3.6 A D2 Buck Freewheeling Diode MUR405
tRR Diode Reverse Recovery Time 3.50E-008 s
IRRM Diode Peak Reverse Recovery Current 0.5 A
PD2 Diode Power Dissipation 0.677999038 W
46
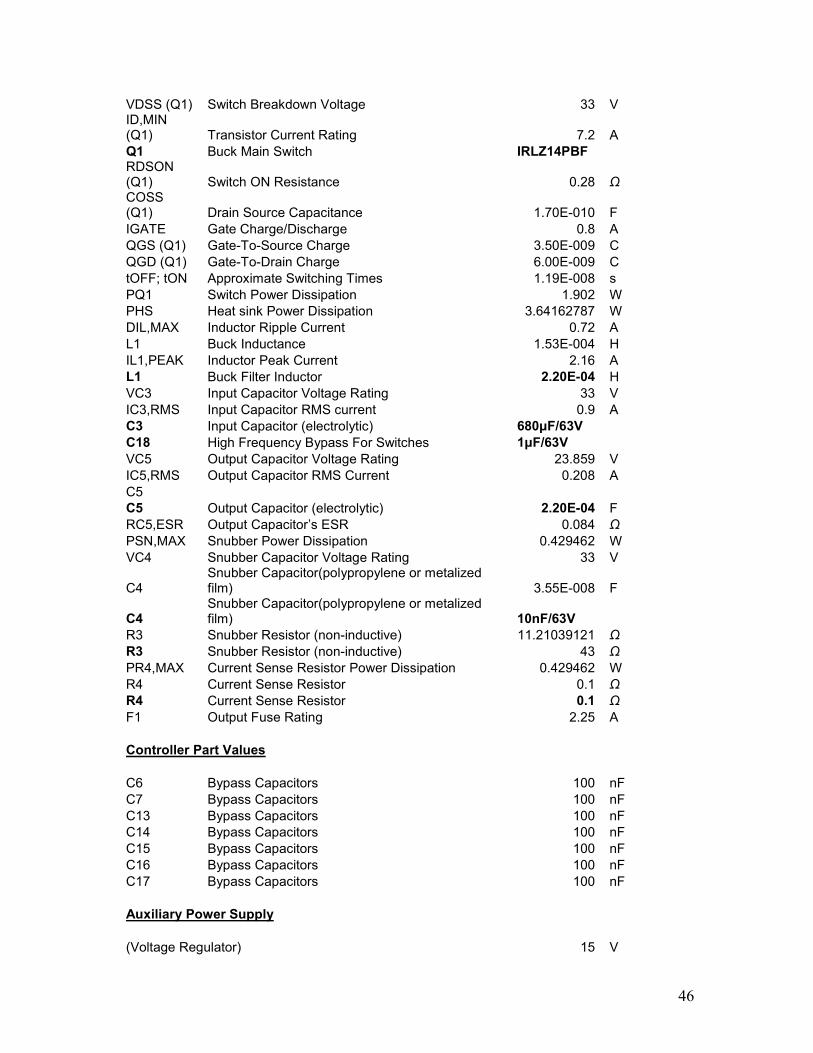
VDSS (Q1) Switch Breakdown Voltage 33 V ID,MIN (Q1) Transistor Current Rating 7.2 A Q1 Buck Main Switch IRLZ14PBF RDSON (Q1) Switch ON Resistance 0.28 Ω
COSS (Q1) Drain Source Capacitance 1.70E-010 F
IGATE Gate Charge/Discharge 0.8 A
QGS (Q1) Gate-To-Source Charge 3.50E-009 C
QGD (Q1) Gate-To-Drain Charge 6.00E-009 C
tOFF; tON Approximate Switching Times 1.19E-008 s
PQ1 Switch Power Dissipation 1.902 W PHS Heat sink Power Dissipation 3.64162787 W
DIL,MAX Inductor Ripple Current 0.72 A
L1 Buck Inductance 1.53E-004 H
IL1,PEAK Inductor Peak Current 2.16 A L1 Buck Filter Inductor 2.20E-04 H
VC3 Input Capacitor Voltage Rating 33 V
IC3,RMS Input Capacitor RMS current 0.9 A C3 Input Capacitor (electrolytic) 680µF/63V C18 High Frequency Bypass For Switches 1µF/63V
VC5 Output Capacitor Voltage Rating 23.859 V
IC5,RMS Output Capacitor RMS Current 0.208 A
C5 C5 Output Capacitor (electrolytic) 2.20E-04 F
RC5,ESR Output Capacitor’s ESR 0.084 Ω
PSN,MAX Snubber Power Dissipation 0.429462 W
VC4 Snubber Capacitor Voltage Rating 33 V
C4 Snubber Capacitor(polypropylene or metalized film) 3.55E-008 F
C4 Snubber Capacitor(polypropylene or metalized film) 10nF/63V
R3 Snubber Resistor (non-inductive) 11.21039121 Ω
R3 Snubber Resistor (non-inductive) 43 Ω
PR4,MAX Current Sense Resistor Power Dissipation 0.429462 W
R4 Current Sense Resistor 0.1 Ω
R4 Current Sense Resistor 0.1 Ω
F1 Output Fuse Rating 2.25 A
Controller Part Values
C6 Bypass Capacitors 100 nF
C7 Bypass Capacitors 100 nF
C13 Bypass Capacitors 100 nF C14 Bypass Capacitors 100 nF
C15 Bypass Capacitors 100 nF
C16 Bypass Capacitors 100 nF
C17 Bypass Capacitors 100 nF
Auxiliary Power Supply
(Voltage Regulator) 15 V
47
Gate Drive
(Dual Channel Gate Driver from the motor driver circuit)
Differential Voltage Sense
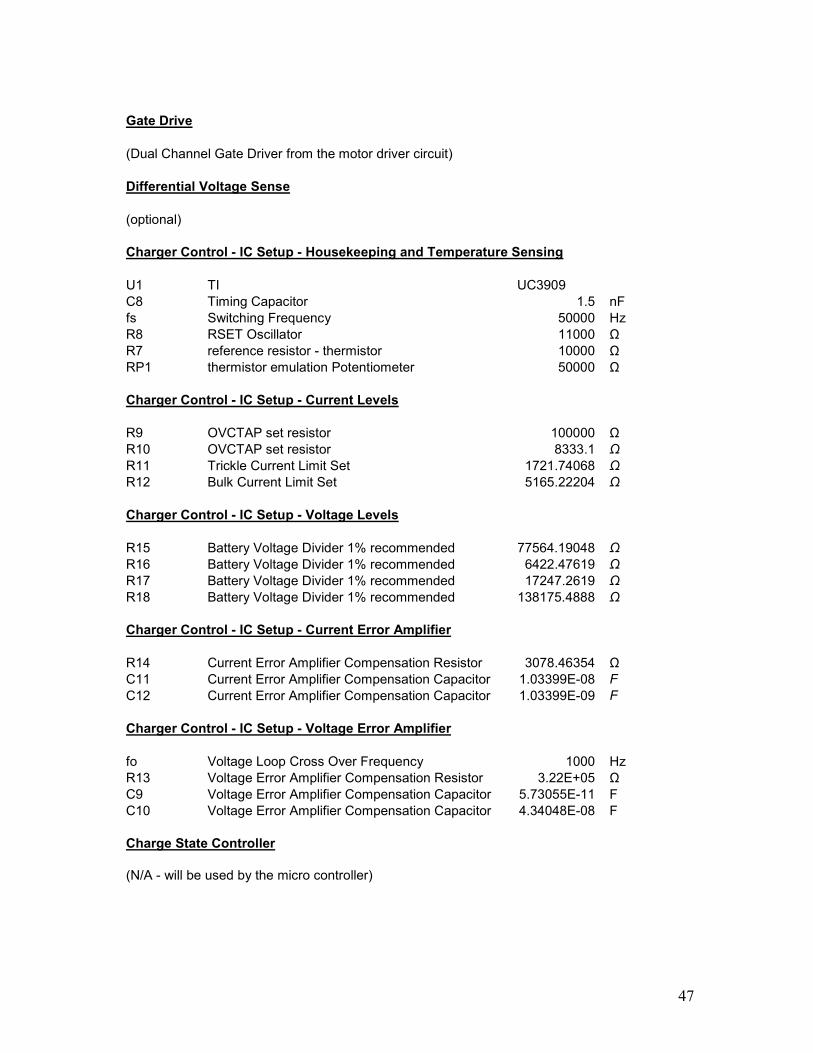
(optional) Charger Control - IC Setup - Housekeeping and Temperature Sensing
U1 TI UC3909
C8 Timing Capacitor 1.5 nF
fs Switching Frequency 50000 Hz
R8 RSET Oscillator 11000 Ω
R7 reference resistor - thermistor 10000 Ω
RP1 thermistor emulation Potentiometer 50000 Ω
Charger Control - IC Setup - Current Levels
R9 OVCTAP set resistor 100000 Ω
R10 OVCTAP set resistor 8333.1 Ω
R11 Trickle Current Limit Set 1721.74068 Ω
R12 Bulk Current Limit Set 5165.22204 Ω
Charger Control - IC Setup - Voltage Levels
R15 Battery Voltage Divider 1% recommended 77564.19048 Ω
R16 Battery Voltage Divider 1% recommended 6422.47619 Ω
R17 Battery Voltage Divider 1% recommended 17247.2619 Ω
R18 Battery Voltage Divider 1% recommended 138175.4888 Ω
Charger Control - IC Setup - Current Error Amplifier
R14 Current Error Amplifier Compensation Resistor 3078.46354 Ω
C11 Current Error Amplifier Compensation Capacitor 1.03399E-08 F
C12 Current Error Amplifier Compensation Capacitor 1.03399E-09 F
Charger Control - IC Setup - Voltage Error Amplifier
fo Voltage Loop Cross Over Frequency 1000 Hz
R13 Voltage Error Amplifier Compensation Resistor 3.22E+05 Ω
C9 Voltage Error Amplifier Compensation Capacitor 5.73055E-11 F
C10 Voltage Error Amplifier Compensation Capacitor 4.34048E-08 F Charge State Controller
(N/A - will be used by the micro controller)
48
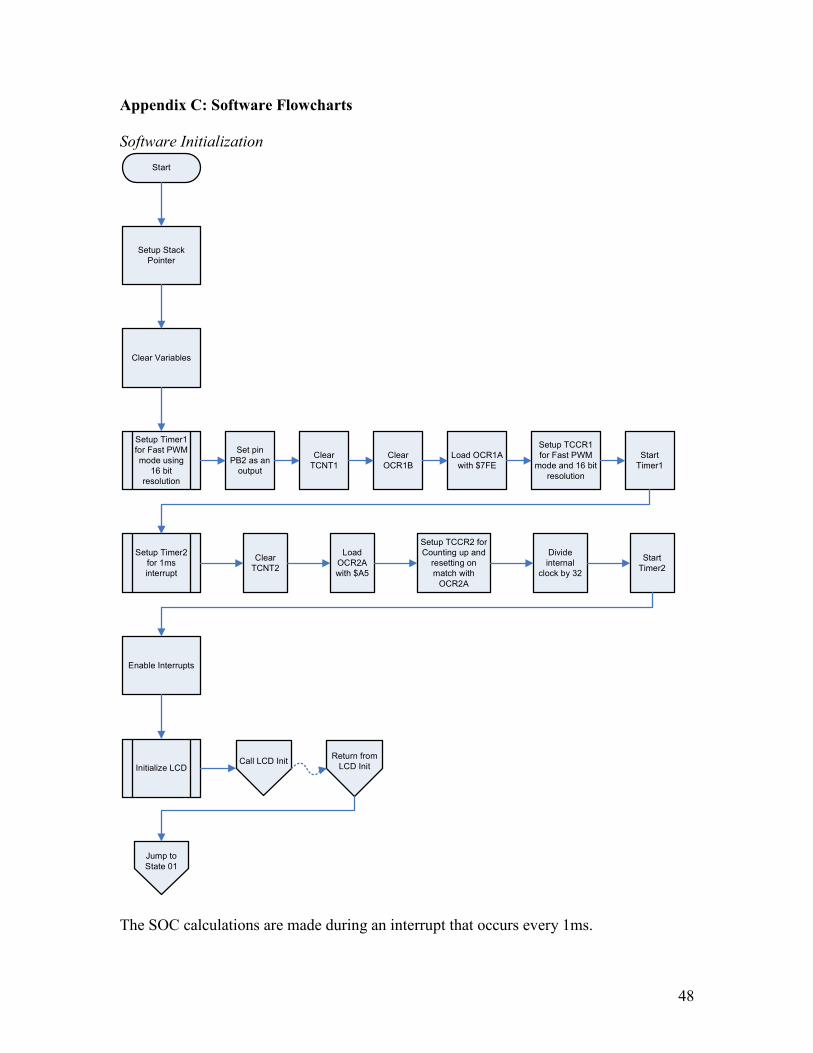
Appendix C: Software Flowcharts
Software Initialization
Start
Setup Stack Pointer
Clear Variables
Setup Timer1 for Fast PWM mode using
16 bit resolution
Setup Timer2 for 1ms interrupt
Enable Interrupts
Initialize LCD
Set pin PB2 as an
output
Clear TCNT1
Clear OCR1B
Load OCR1A with $7FE
Setup TCCR1 for Fast PWM
mode and 16 bit resolution
Start Timer1
Divide internal
clock by 32
Clear TCNT2
Load OCR2A with $A5
Setup TCCR2 for Counting up and
resetting on match with
OCR2A
Start Timer2
Call LCD InitReturn from
LCD Init
Jump to State 01
The SOC calculations are made during an interrupt that occurs every 1ms.
49
Appendix C
Interrupt Service Routine
50
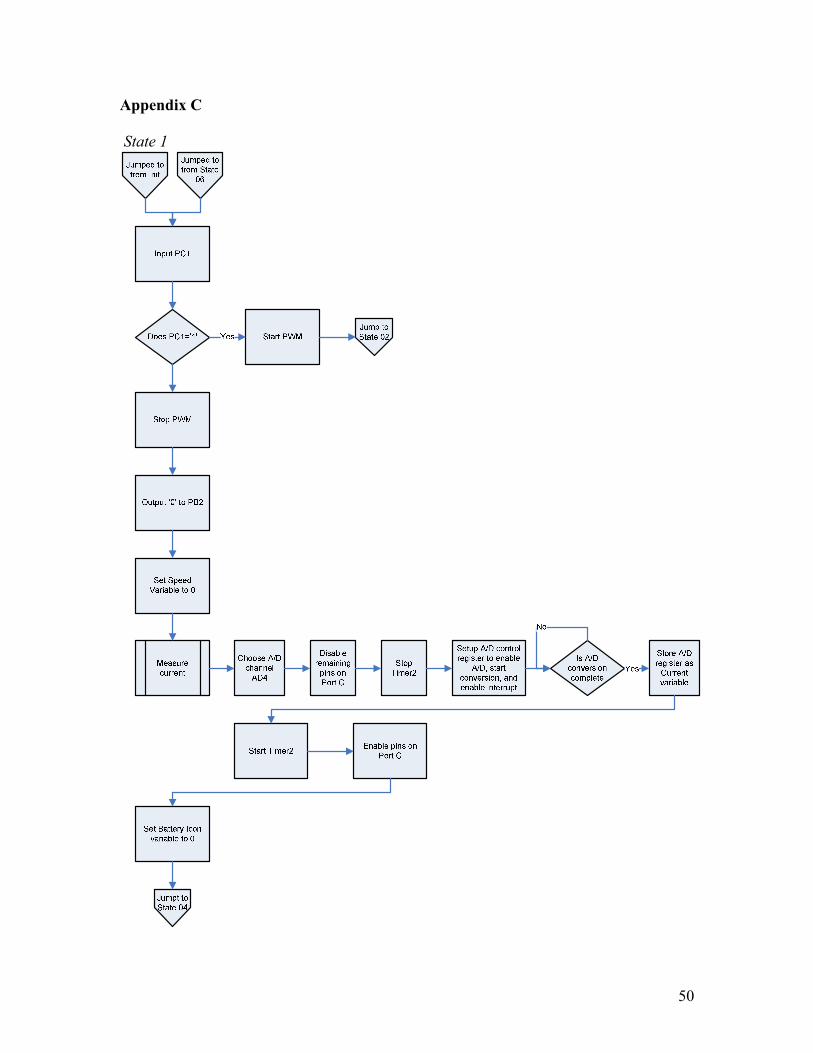
Appendix C
State 1
51
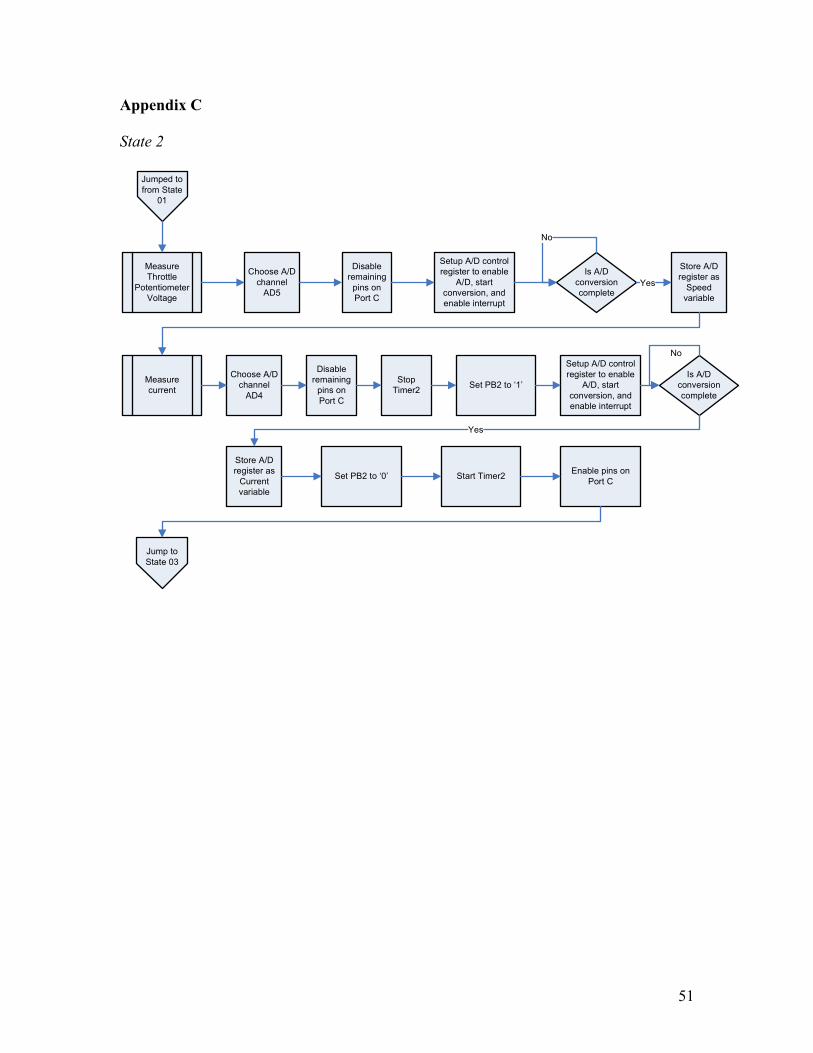
Appendix C
State 2
Jumped to from State
01
Measure Throttle
Potentiometer Voltage
Setup A/D control register to enable
A/D, start conversion, and enable interrupt
Choose A/D channel
AD5
Disable remaining
pins on Port C
Is A/D conversion complete
Store A/D register as
Speed variable
Yes
No
Measure current
Setup A/D control register to enable
A/D, start conversion, and enable interrupt
Choose A/D channel
AD4
Disable remaining
pins on Port C
Stop Timer2
Is A/D conversion complete
Store A/D register as
Current variable
Start Timer2Enable pins on
Port C
Set PB2 to ‘1’
Set PB2 to ‘0’
Jump to State 03
Yes
No
52
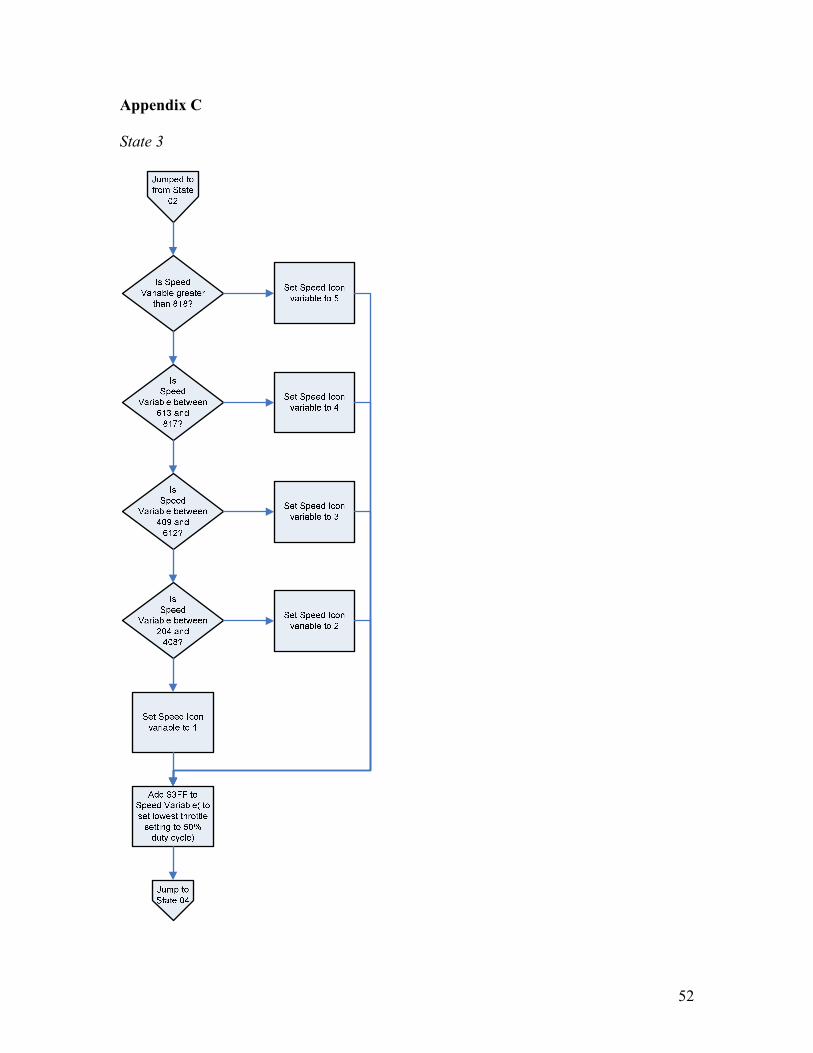
Appendix C
State 3
53
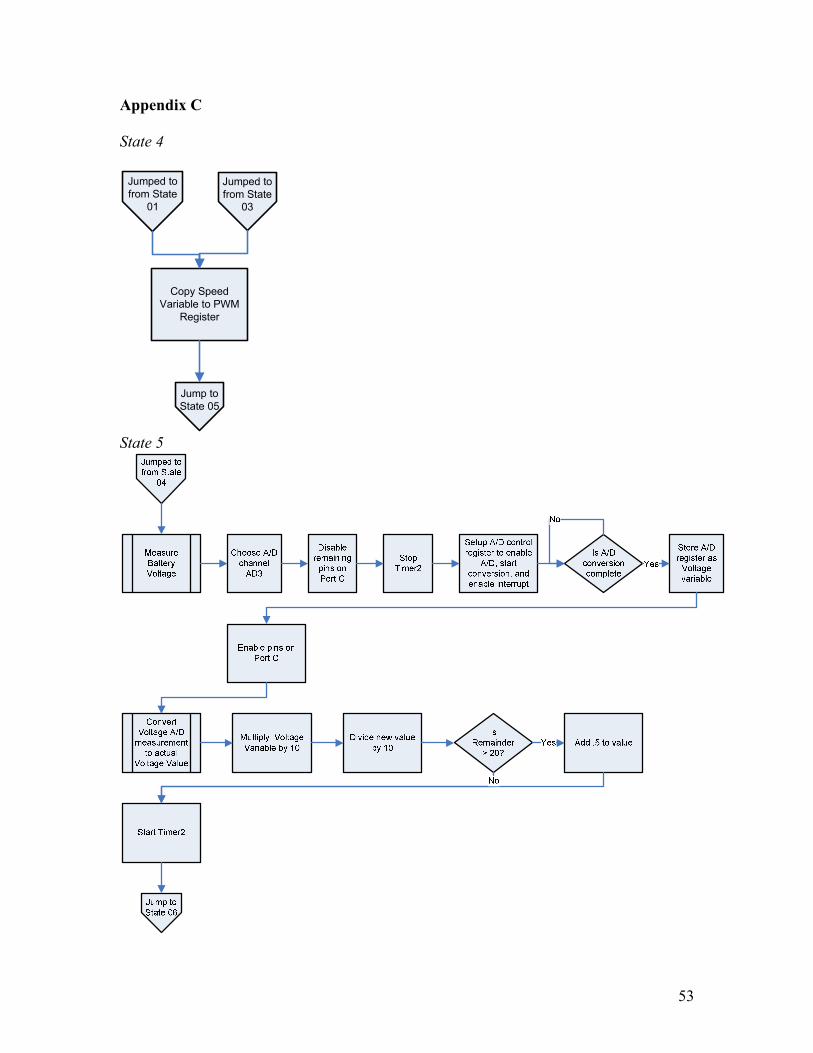
Appendix C
State 4
Jumped to from State
01
Jumped to from State
03
Copy Speed Variable to PWM
Register
Jump to State 05
State 5
54
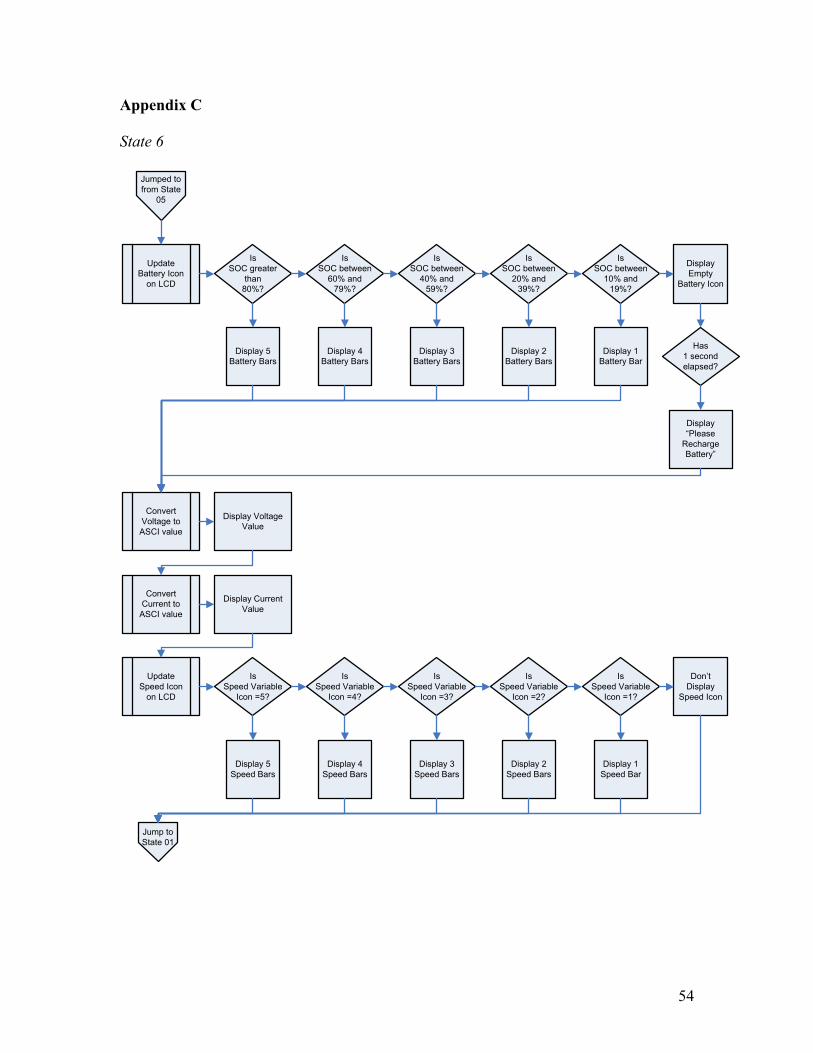
Appendix C
State 6
Jumped to from State
05
Update Battery Icon
on LCD
Convert Current to
ASCI value
Update Speed Icon
on LCD
IsSOC greater
than80%?
IsSOC between
60% and79%?
IsSOC between
40% and59%?
IsSOC between
20% and39%?
IsSOC between
10% and19%?
Display 5 Battery Bars
Display 4 Battery Bars
Display 3 Battery Bars
Display 2 Battery Bars
Display 1 Battery Bar
Display “Please
Recharge Battery”
Has1 second elapsed?
Display Empty
Battery Icon
Convert Voltage to ASCI value
Display Voltage Value
Display Current Value
IsSpeed Variable
Icon =5?
Display 5 Speed Bars
Display 4 Speed Bars
Display 3 Speed Bars
Display 2 Speed Bars
Display 1 Speed Bar
Don’t Display
Speed Icon
IsSpeed Variable
Icon =4?
IsSpeed Variable
Icon =3?
IsSpeed Variable
Icon =2?
IsSpeed Variable
Icon =1?
Jump to State 01
55
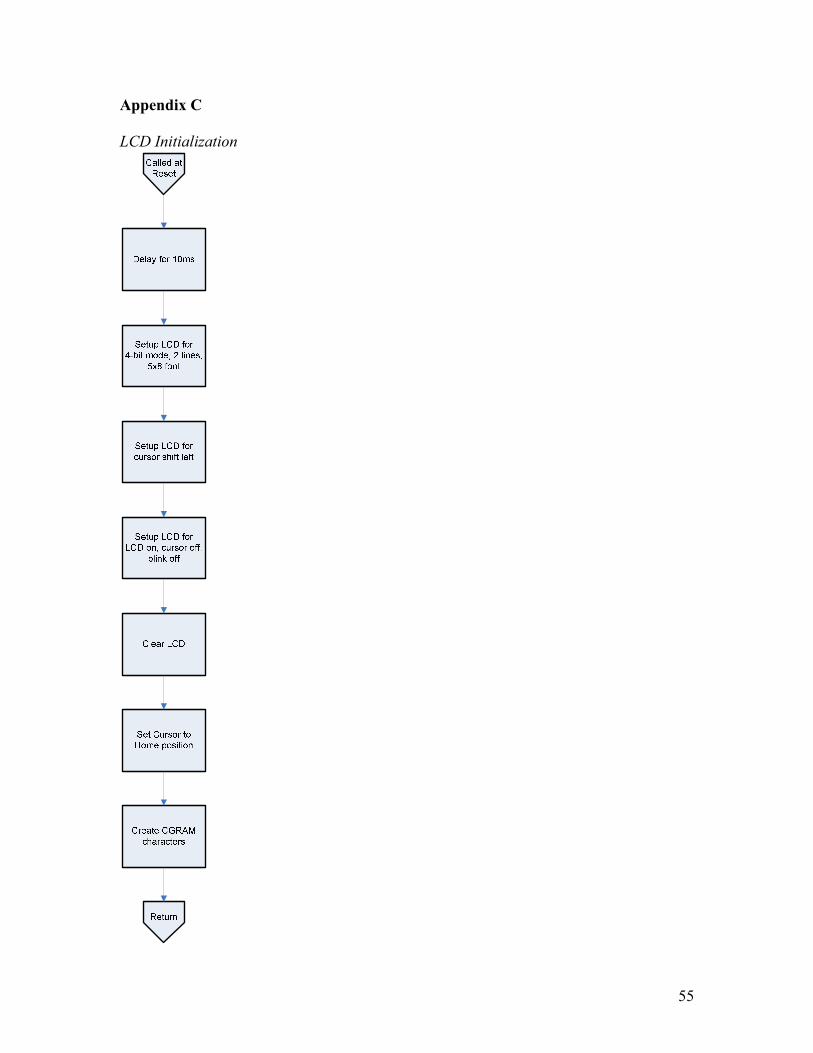
Appendix C
LCD Initialization