Embed Size (px)
Citation preview

1
Presentation for NPPD Board Retreat
March 10th, 2021
Low CO2 Study
2
• Founded in 2002 with 50 employees in Boulder, Oakland and Bozeman• Seven integrated software products for operations, portfolio analytics, and planning• Consulting and custom analytical solutions
Proven and Broadly Adopted Differentiated Value for Enhanced Decision Analysis
• Portfolio management
• Generation asset management
• Hydro and renewable asset modeling
• Retail management & pricing
• Energy purchases and sales
• CFaR, GMaR, EaR
• Optimal short-term dispatch
• Determine operating strategies from position and financial exposure
• Track realized customer revenue and costs to settled day ahead and real time price
• Optimize financial exposure between day ahead and real time prices
• Asset valuation
• Resource Planning
• Capacity Expansion Planning
• Reliability Analysis
• Renewable Integration
• Long-term Price Forecasting
PowerSimm OPSOPERATIONAL STRATEGY
PowerSimm Portfolio ManagerPORTFOLIO MANAGEMENT
PowerSimm PlannerVALUATION & PLANNING
BatterySimm ValuationSTORAGE VALUATION
BatterySimm OperationsSTORAGE OPTIMIZATION
• Optimal siting and sizing
• Captures realistic revenues given imperfect foresight
• Battery cycle analysis
• Optimal offers to ISO
• Continuous adjust ISO offers
• Forecast probabilities of price spikes
• Renewables plus storage
CurveDeveloper
• Complete set of forward curves and forecast curves for 30 years
• ISO settlement data
• Incorporate broker projections
Ascend Analytics
3
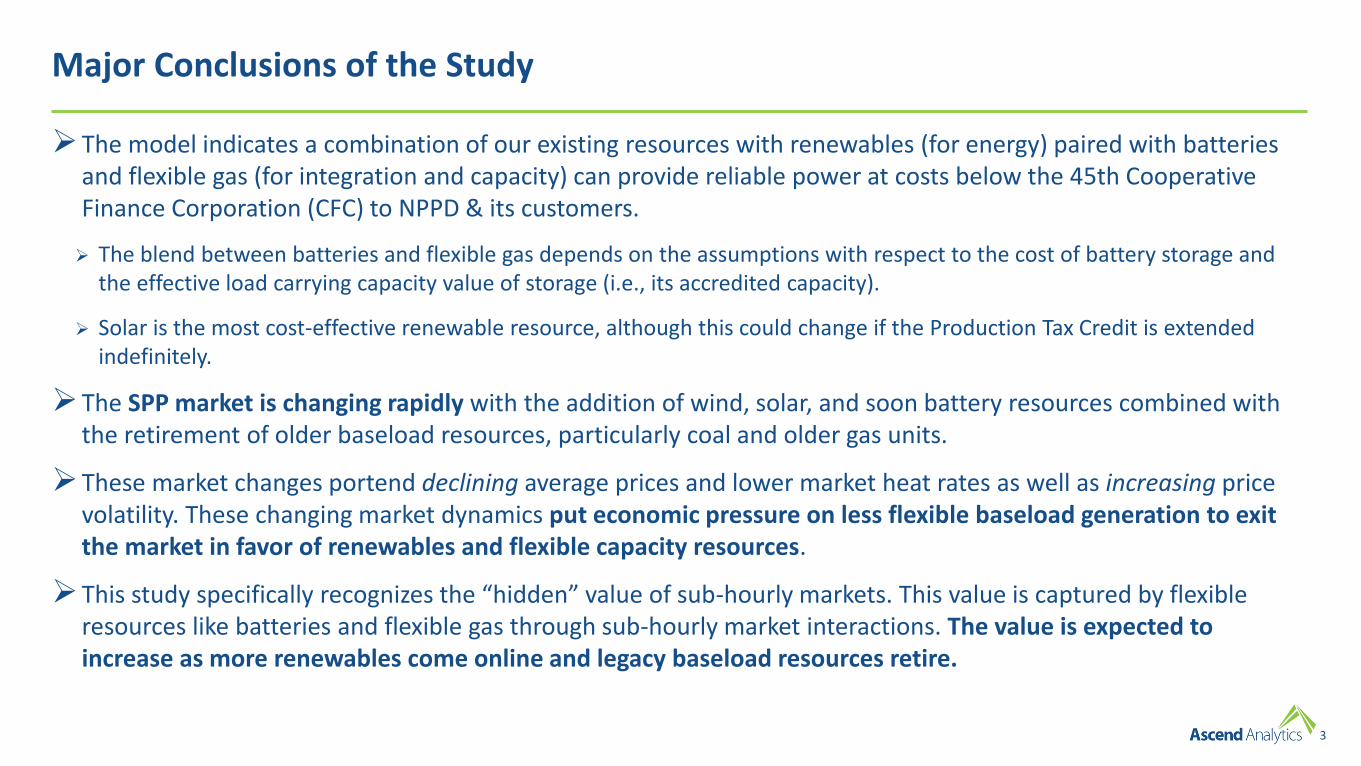
Major Conclusions of the Study
➢The model indicates a combination of our existing resources with renewables (for energy) paired with batteries and flexible gas (for integration and capacity) can provide reliable power at costs below the 45th Cooperative Finance Corporation (CFC) to NPPD & its customers.
➢ The blend between batteries and flexible gas depends on the assumptions with respect to the cost of battery storage and the effective load carrying capacity value of storage (i.e., its accredited capacity).
➢ Solar is the most cost-effective renewable resource, although this could change if the Production Tax Credit is extended indefinitely.
➢The SPP market is changing rapidly with the addition of wind, solar, and soon battery resources combined with the retirement of older baseload resources, particularly coal and older gas units.
➢These market changes portend declining average prices and lower market heat rates as well as increasing price volatility. These changing market dynamics put economic pressure on less flexible baseload generation to exit the market in favor of renewables and flexible capacity resources.
➢This study specifically recognizes the “hidden” value of sub-hourly markets. This value is captured by flexible resources like batteries and flexible gas through sub-hourly market interactions. The value is expected to increase as more renewables come online and legacy baseload resources retire.
4
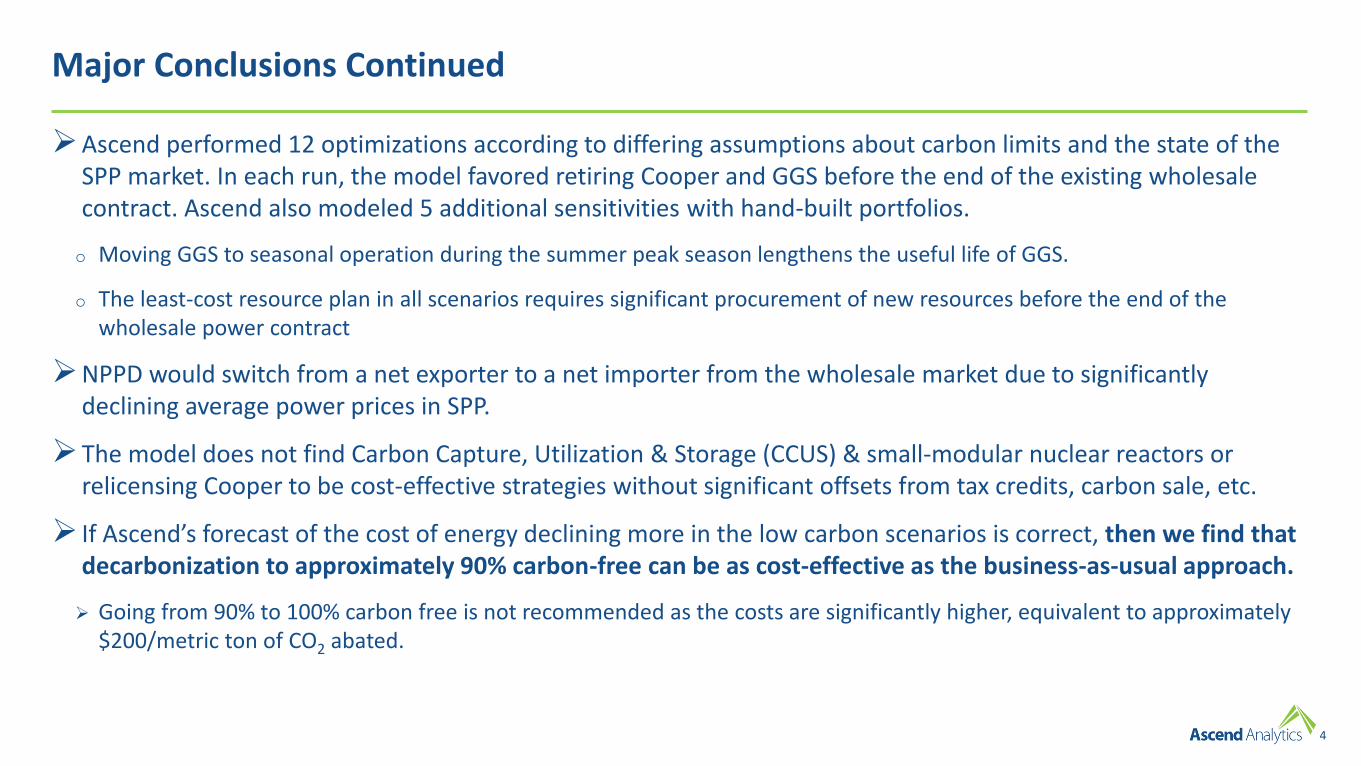
Major Conclusions Continued
➢Ascend performed 12 optimizations according to differing assumptions about carbon limits and the state of the SPP market. In each run, the model favored retiring Cooper and GGS before the end of the existing wholesale contract. Ascend also modeled 5 additional sensitivities with hand-built portfolios.
o Moving GGS to seasonal operation during the summer peak season lengthens the useful life of GGS.
o The least-cost resource plan in all scenarios requires significant procurement of new resources before the end of the wholesale power contract
➢NPPD would switch from a net exporter to a net importer from the wholesale market due to significantly declining average power prices in SPP.
➢The model does not find Carbon Capture, Utilization & Storage (CCUS) & small-modular nuclear reactors or relicensing Cooper to be cost-effective strategies without significant offsets from tax credits, carbon sale, etc.
➢ If Ascend’s forecast of the cost of energy declining more in the low carbon scenarios is correct, then we find that decarbonization to approximately 90% carbon-free can be as cost-effective as the business-as-usual approach.
➢ Going from 90% to 100% carbon free is not recommended as the costs are significantly higher, equivalent to approximately $200/metric ton of CO2 abated.
5
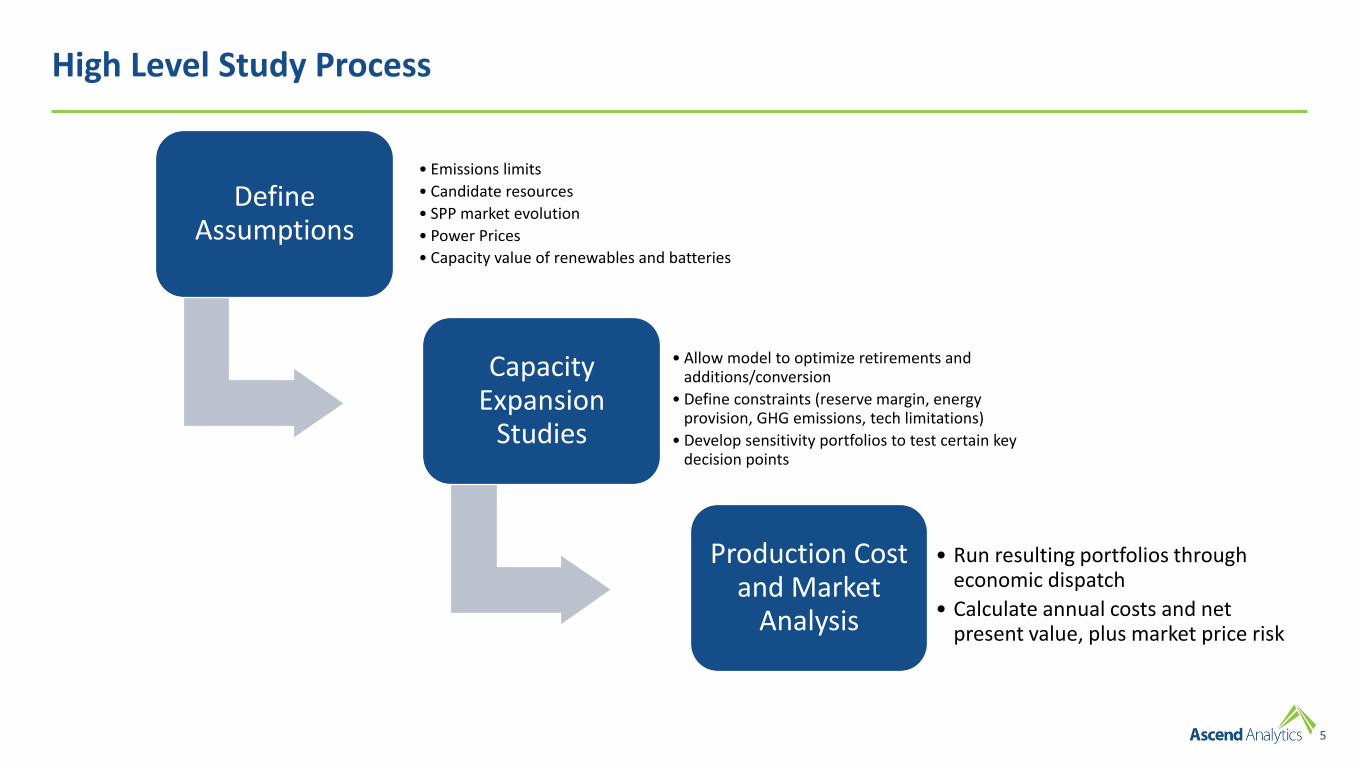
High Level Study Process
Define Assumptions
• Emissions limits
• Candidate resources
• SPP market evolution
• Power Prices
• Capacity value of renewables and batteries
Capacity Expansion
Studies
• Allow model to optimize retirements and additions/conversion
• Define constraints (reserve margin, energy provision, GHG emissions, tech limitations)
• Develop sensitivity portfolios to test certain key decision points
Production Cost and Market
Analysis
• Run resulting portfolios through economic dispatch
• Calculate annual costs and net present value, plus market price risk
Preliminary
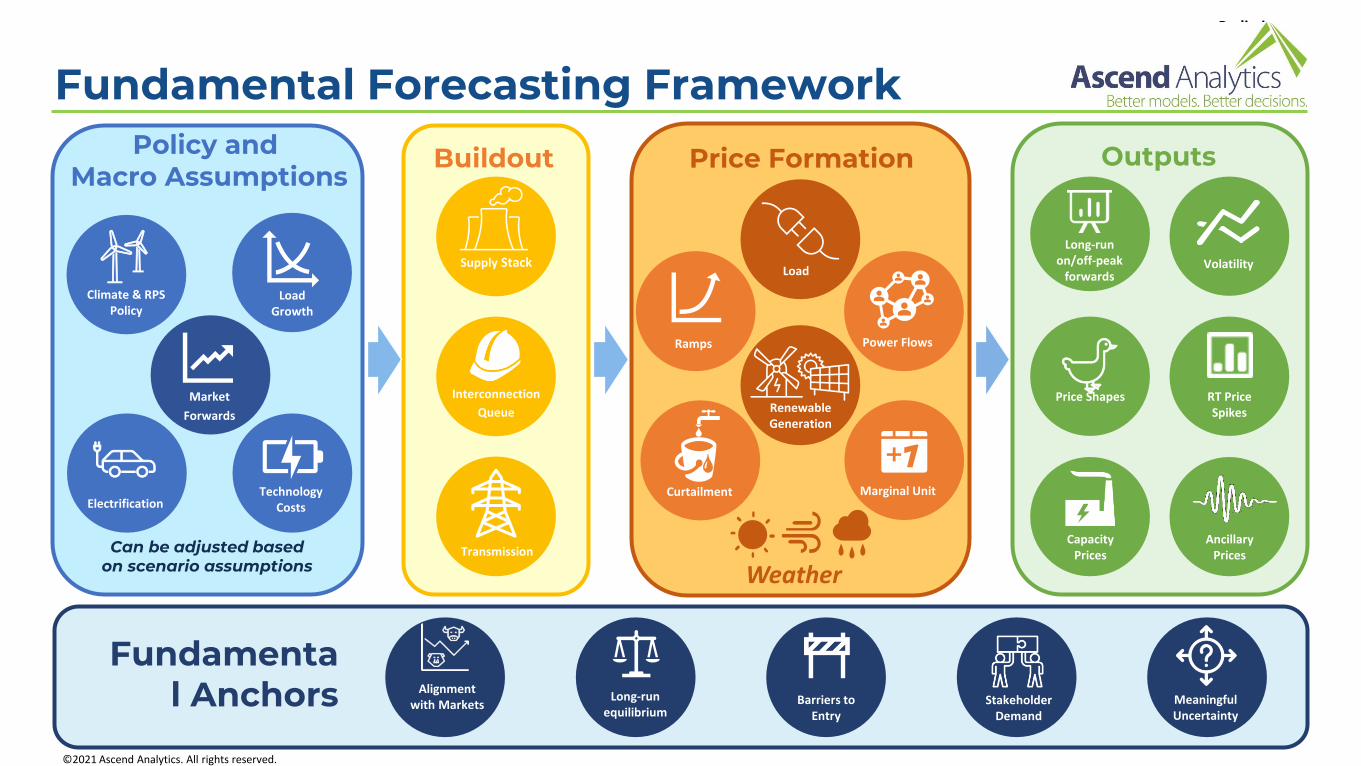
Fundamental Forecasting Framework
Power FlowsRamps
Marginal UnitCurtailment
Price Formation
Load
Renewable Generation
Weather
Fundamental Anchors Long-run
equilibrium
Alignment with Markets Meaningful
UncertaintyBarriers to
Entry
Climate & RPS Policy
Electrification
Load Growth
Technology Costs
Policy and Macro Assumptions
Can be adjusted based on scenario assumptions
Market
Forwards
Supply Stack
Transmission
Buildout
Interconnection
Queue
Stakeholder Demand
RT Price Spikes
Volatility
Long-runon/off-peak
forwards
Price Shapes
Outputs
Capacity Prices
Ancillary Prices
©2021 Ascend Analytics. All rights reserved.
7
Preliminary
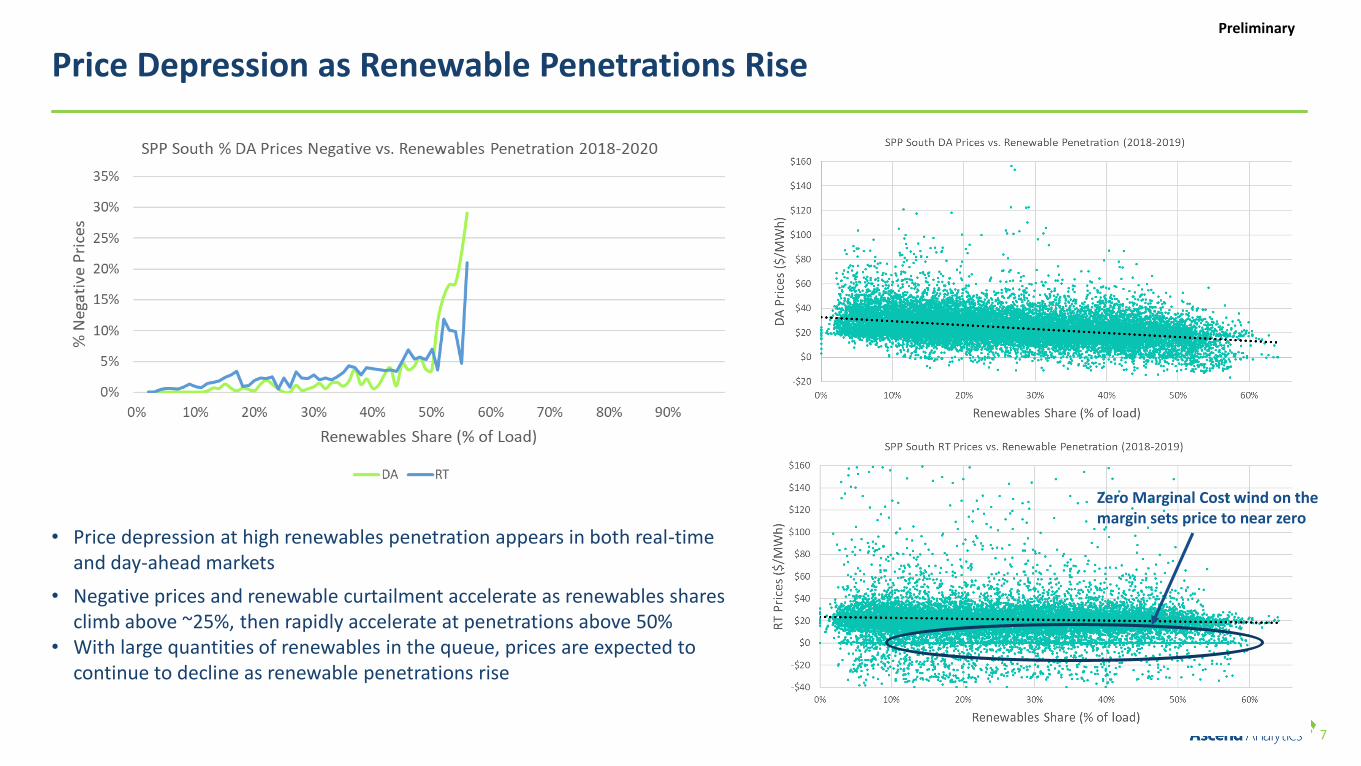
Price Depression as Renewable Penetrations Rise
• Price depression at high renewables penetration appears in both real-time and day-ahead markets
• Negative prices and renewable curtailment accelerate as renewables shares climb above ~25%, then rapidly accelerate at penetrations above 50%
• With large quantities of renewables in the queue, prices are expected to continue to decline as renewable penetrations rise
Zero Marginal Cost wind on the margin sets price to near zero
8
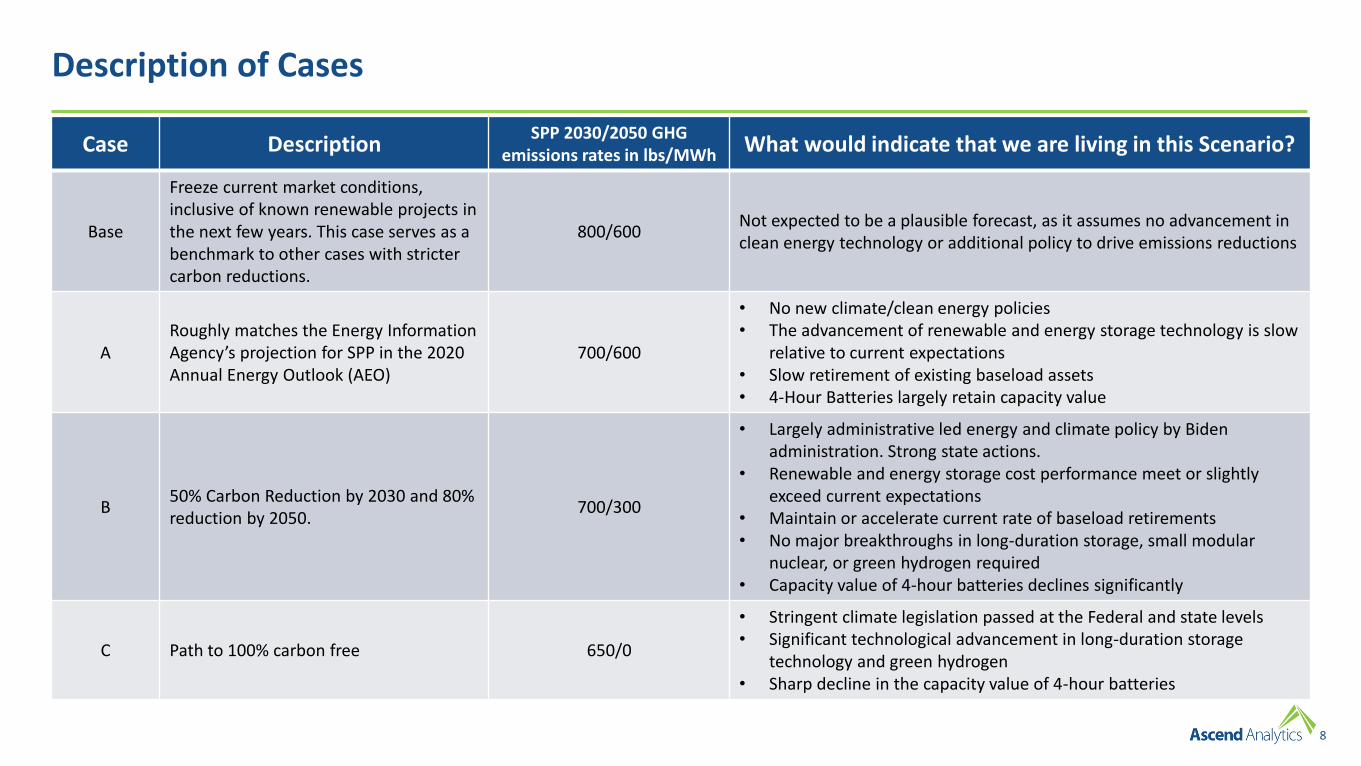
Description of Cases
Case DescriptionSPP 2030/2050 GHG
emissions rates in lbs/MWhWhat would indicate that we are living in this Scenario?
Base
Freeze current market conditions, inclusive of known renewable projects in the next few years. This case serves as a benchmark to other cases with stricter carbon reductions.
800/600Not expected to be a plausible forecast, as it assumes no advancement in clean energy technology or additional policy to drive emissions reductions
ARoughly matches the Energy Information Agency’s projection for SPP in the 2020 Annual Energy Outlook (AEO)
700/600
• No new climate/clean energy policies• The advancement of renewable and energy storage technology is slow
relative to current expectations • Slow retirement of existing baseload assets• 4-Hour Batteries largely retain capacity value
B50% Carbon Reduction by 2030 and 80% reduction by 2050.
700/300
• Largely administrative led energy and climate policy by Biden administration. Strong state actions.
• Renewable and energy storage cost performance meet or slightly exceed current expectations
• Maintain or accelerate current rate of baseload retirements• No major breakthroughs in long-duration storage, small modular
nuclear, or green hydrogen required • Capacity value of 4-hour batteries declines significantly
C Path to 100% carbon free 650/0
• Stringent climate legislation passed at the Federal and state levels• Significant technological advancement in long-duration storage
technology and green hydrogen• Sharp decline in the capacity value of 4-hour batteries
9
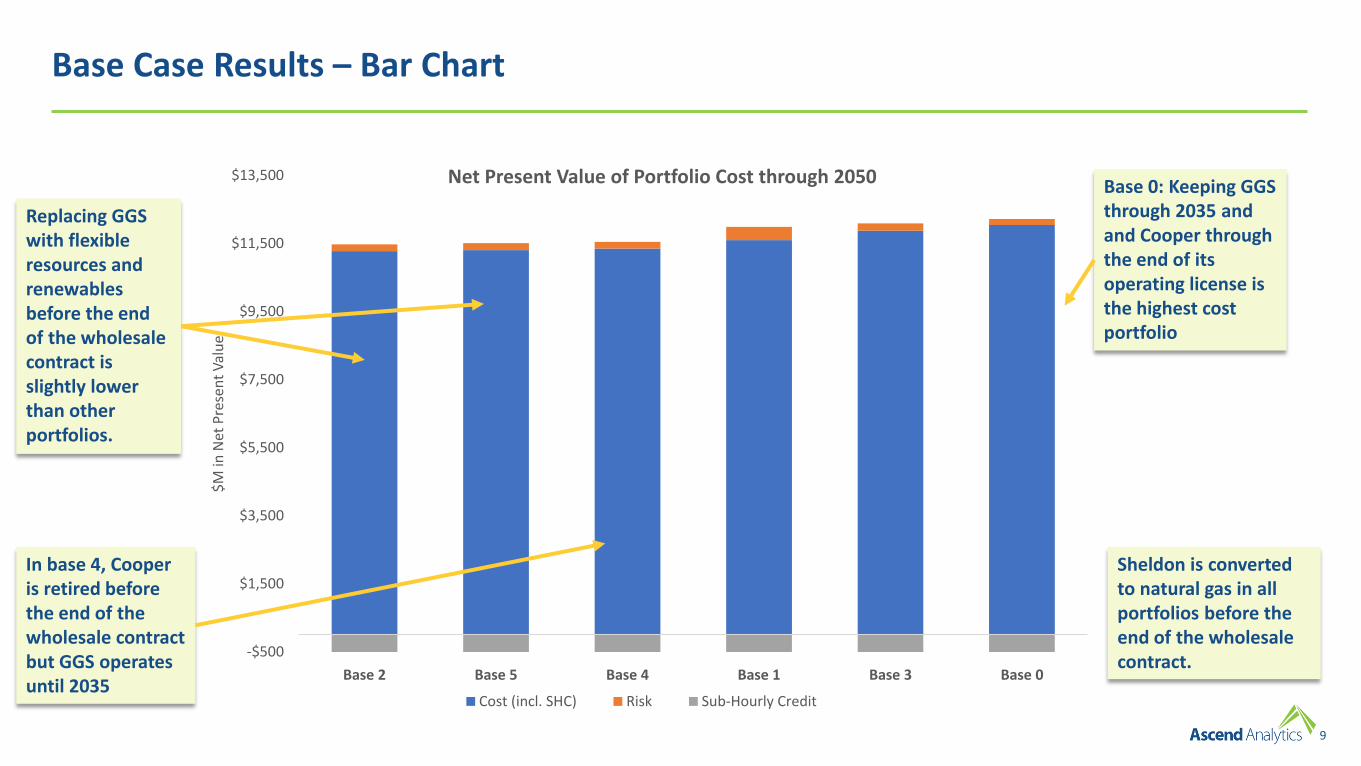
Base Case Results – Bar Chart
-$500
$1,500
$3,500
$5,500
$7,500
$9,500
$11,500
$13,500
Base 2 Base 5 Base 4 Base 1 Base 3 Base 0
$M
in N
et P
rese
nt
Val
ue
Net Present Value of Portfolio Cost through 2050
Cost (incl. SHC) Risk Sub-Hourly Credit
Base 0: Keeping GGS through 2035 and and Cooper through the end of its operating license is the highest cost portfolio
Replacing GGS with flexible resources and renewables before the end of the wholesale contract is slightly lower than other portfolios.
In base 4, Cooper is retired before the end of the wholesale contract but GGS operates until 2035
Sheldon is converted to natural gas in all portfolios before the end of the wholesale contract.

10
A & B Case Results – Bar Chart
-$500
$1,500
$3,500
$5,500
$7,500
$9,500
$11,500
$13,500
B1a B1b A1 B2
$M
in N
et P
rese
nt
Val
ue
Net Present Value of Portfolio Cost by Scenario through 2050
Cost (incl. SHC) Risk Sub-Hourly Credit
Adding CCUS is the most expensive option in A&B cases.
Using GGS seasonally (i.e. in the summer) is a good strategy to maximize its usefulness
B1a relies mostly on solar, storage, and a small amount of flexible gas to replace GGS and Cooper before the end of the wholesale contract
Sheldon retires or is converted to natural gas in all portfolios before the end of the wholesale contract.
11
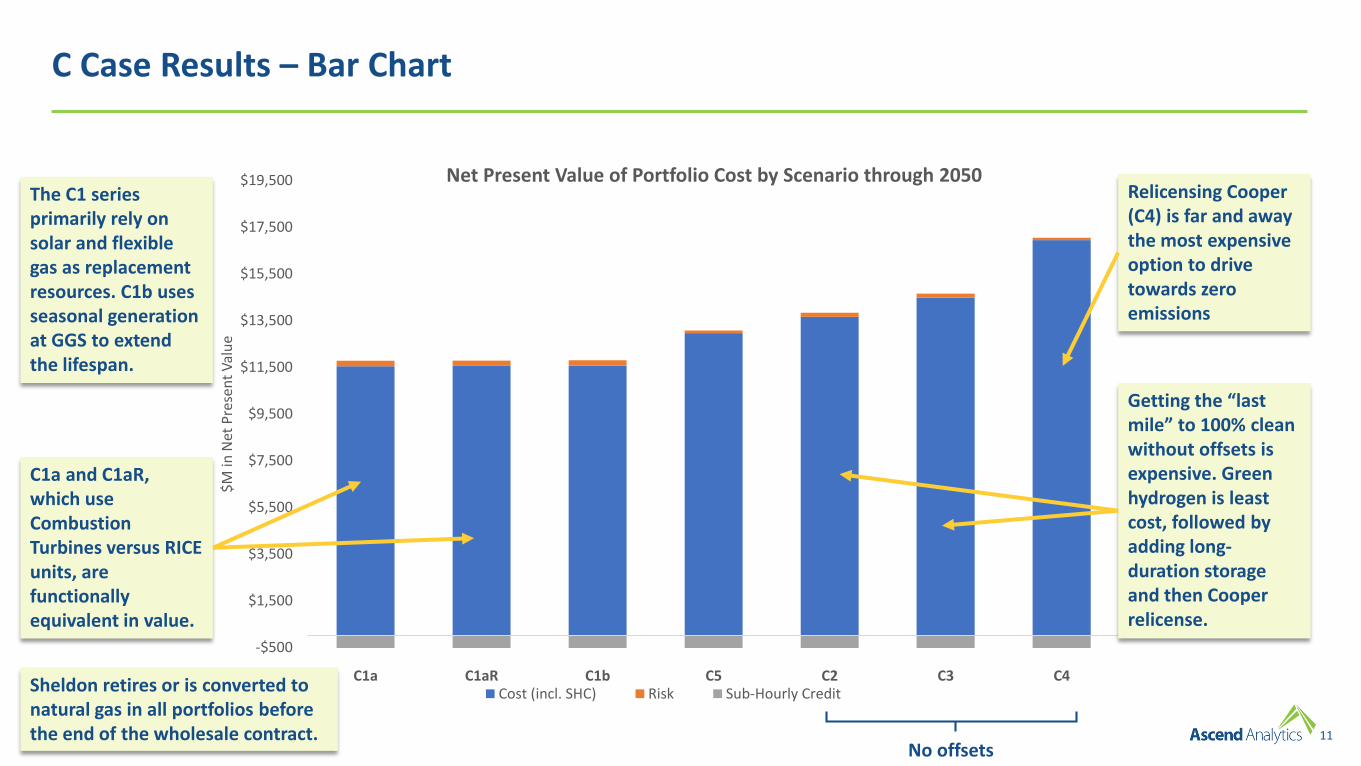
C Case Results – Bar Chart
-$500
$1,500
$3,500
$5,500
$7,500
$9,500
$11,500
$13,500
$15,500
$17,500
$19,500
C1a C1aR C1b C5 C2 C3 C4
$M
in N
et P
rese
nt
Val
ue
Net Present Value of Portfolio Cost by Scenario through 2050
Cost (incl. SHC) Risk Sub-Hourly Credit
Relicensing Cooper (C4) is far and away the most expensive option to drive towards zero emissions
No offsets
The C1 series primarily rely on solar and flexible gas as replacement resources. C1b uses seasonal generation at GGS to extend the lifespan.
C1a and C1aR, which use Combustion Turbines versus RICE units, are functionally equivalent in value.
Getting the “last mile” to 100% clean without offsets is expensive. Green hydrogen is least cost, followed by adding long-duration storage and then Cooper relicense.
Sheldon retires or is converted to natural gas in all portfolios before the end of the wholesale contract.
12
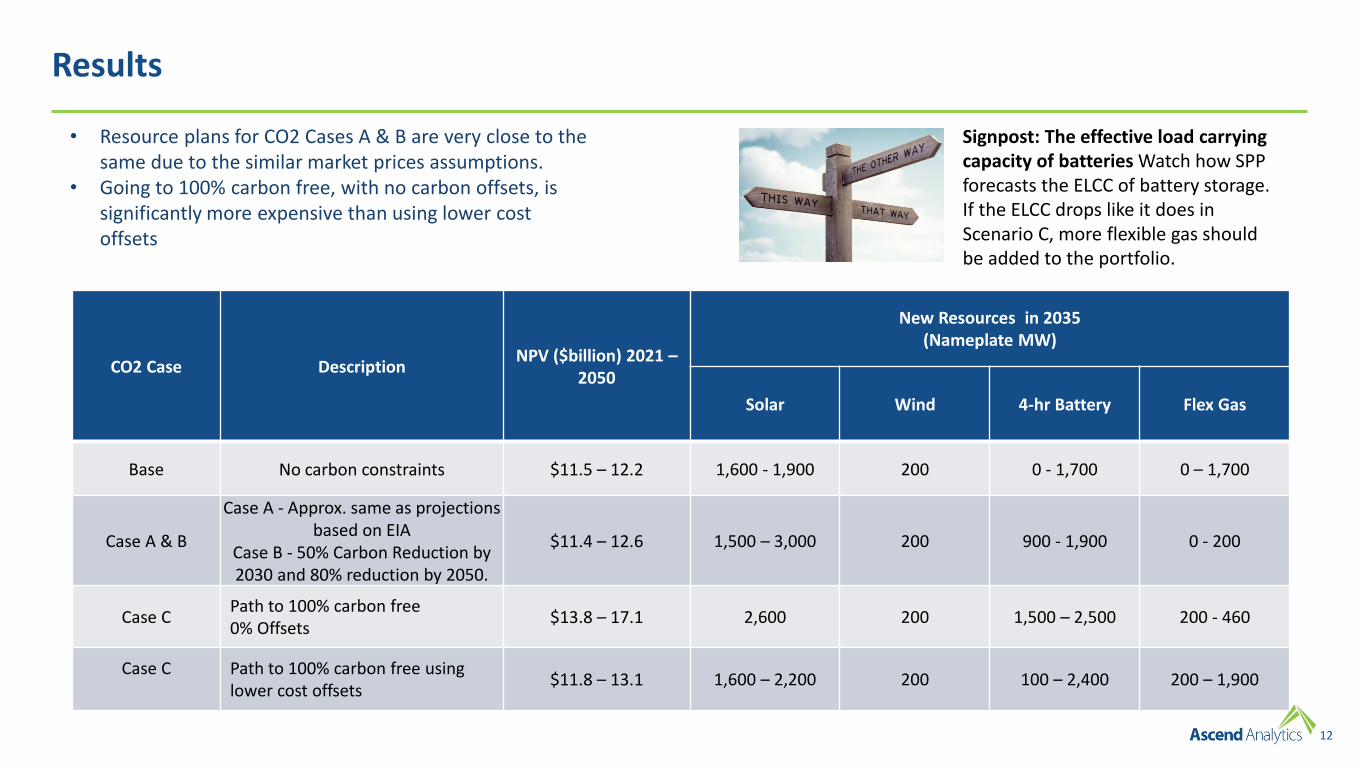
Results
CO2 Case DescriptionNPV ($billion) 2021 –
2050
New Resources in 2035(Nameplate MW)
Solar Wind 4-hr Battery Flex Gas
Base No carbon constraints $11.5 – 12.2 1,600 - 1,900 200 0 - 1,700 0 – 1,700
Case A & B
Case A - Approx. same as projections based on EIA
Case B - 50% Carbon Reduction by 2030 and 80% reduction by 2050.
$11.4 – 12.6 1,500 – 3,000 200 900 - 1,900 0 - 200
Case CPath to 100% carbon free0% Offsets
$13.8 – 17.1 2,600 200 1,500 – 2,500 200 - 460
Case C Path to 100% carbon free using lower cost offsets
$11.8 – 13.1 1,600 – 2,200 200 100 – 2,400 200 – 1,900
• Resource plans for CO2 Cases A & B are very close to the same due to the similar market prices assumptions.
• Going to 100% carbon free, with no carbon offsets, is significantly more expensive than using lower cost offsets
Signpost: The effective load carrying capacity of batteries Watch how SPP forecasts the ELCC of battery storage. If the ELCC drops like it does in Scenario C, more flexible gas should be added to the portfolio.

13
Carbon Dioxide Emissions (lbs/MWh)
• NPPD Carbon Intensity in 2005 was approximately 1,650 lbs/MWh
• 2017/18 Average carbon intensity was 1,100 lbs/MWh
• All resource portfolios were at or below the carbon intensity limits for each Carbon Case.
• Business as usual carbon intensity for most years was 1,000 – 1100 lbs/MWh
• “A” cases are 600 lbs/MWh by 2030, dropping to 500 lbs/MWh by 2050.
• “B” cases are 600 lbs/MWh by 2030, dropping to 330 lbs/MWh by 2050.
• “C” cases all drive to zero, with some assuming approximately 10% of emissions reductions coming through carbon offsets in other sectors.
Key Take-Aways
14
Net Energy Position
• NPPD typically becomes a net annual purchaser of energy when our existing baseload generation retires.
o NPPD is typically buying the maximum amount allowable by the model.
o The maximum amount is 50% of native load energy
• Market purchases are generally the least-cost energy as renewables flood the SPP system, even in the base case
Key Take-Aways
15
B1a
Base 5
A1
C1a
C1aR
B1b
Base 4
Base 1
Base 2
C1b
B2
C2C3
Base 3
C4
Base 0
C5
$0
$50
$100
$150
$200
$250
$300
$350
$400
$450
$10,500 $11,500 $12,500 $13,500 $14,500 $15,500 $16,500
$M
of
Ris
k
$M of Cost
Net Present Value of Cost Versus RiskAll Portfolios All Years
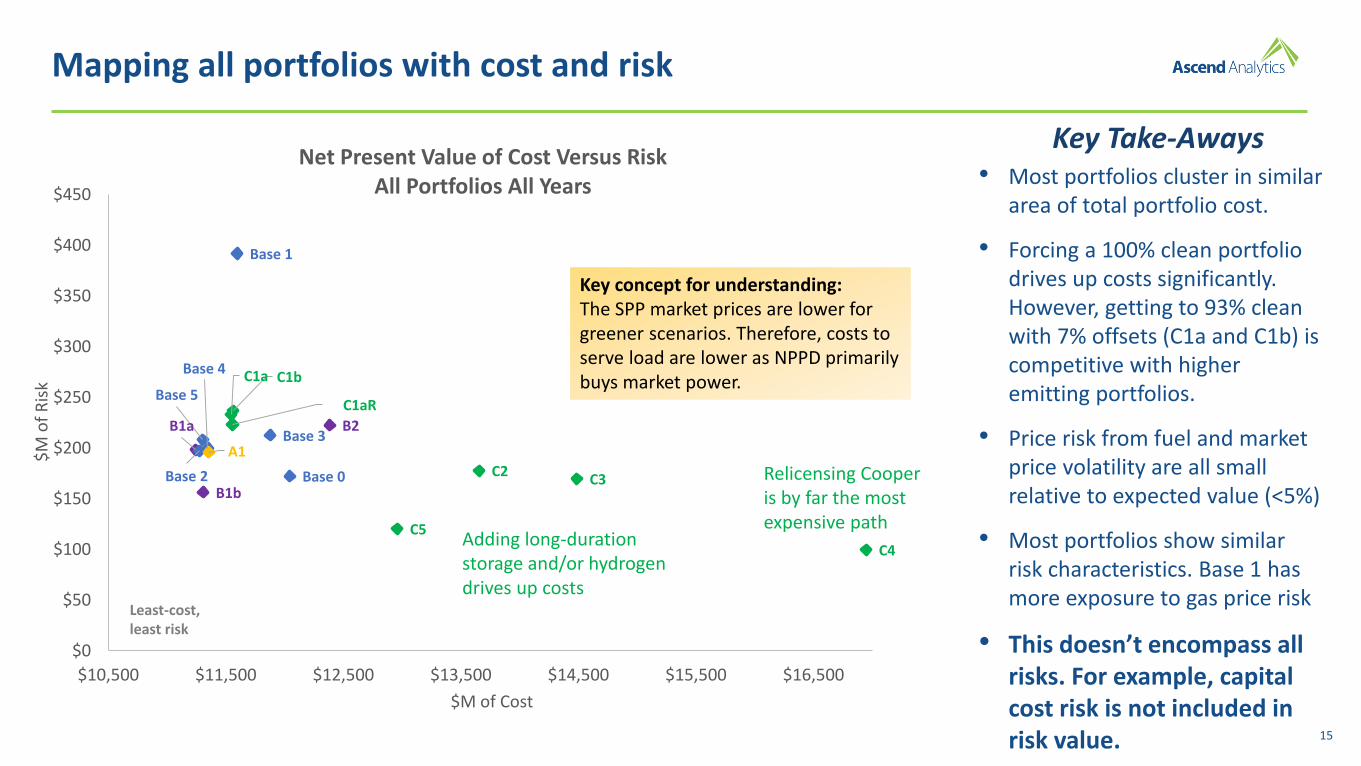
Mapping all portfolios with cost and risk
• Most portfolios cluster in similar area of total portfolio cost.
• Forcing a 100% clean portfolio drives up costs significantly. However, getting to 93% clean with 7% offsets (C1a and C1b) is competitive with higher emitting portfolios.
• Price risk from fuel and market price volatility are all small relative to expected value (<5%)
• Most portfolios show similar risk characteristics. Base 1 has more exposure to gas price risk
• This doesn’t encompass all risks. For example, capital cost risk is not included in risk value.
Key Take-Aways
Relicensing Cooper is by far the most expensive path
Key concept for understanding: The SPP market prices are lower for greener scenarios. Therefore, costs to serve load are lower as NPPD primarily buys market power.
Adding long-duration storage and/or hydrogen drives up costs
Least-cost, least risk
16
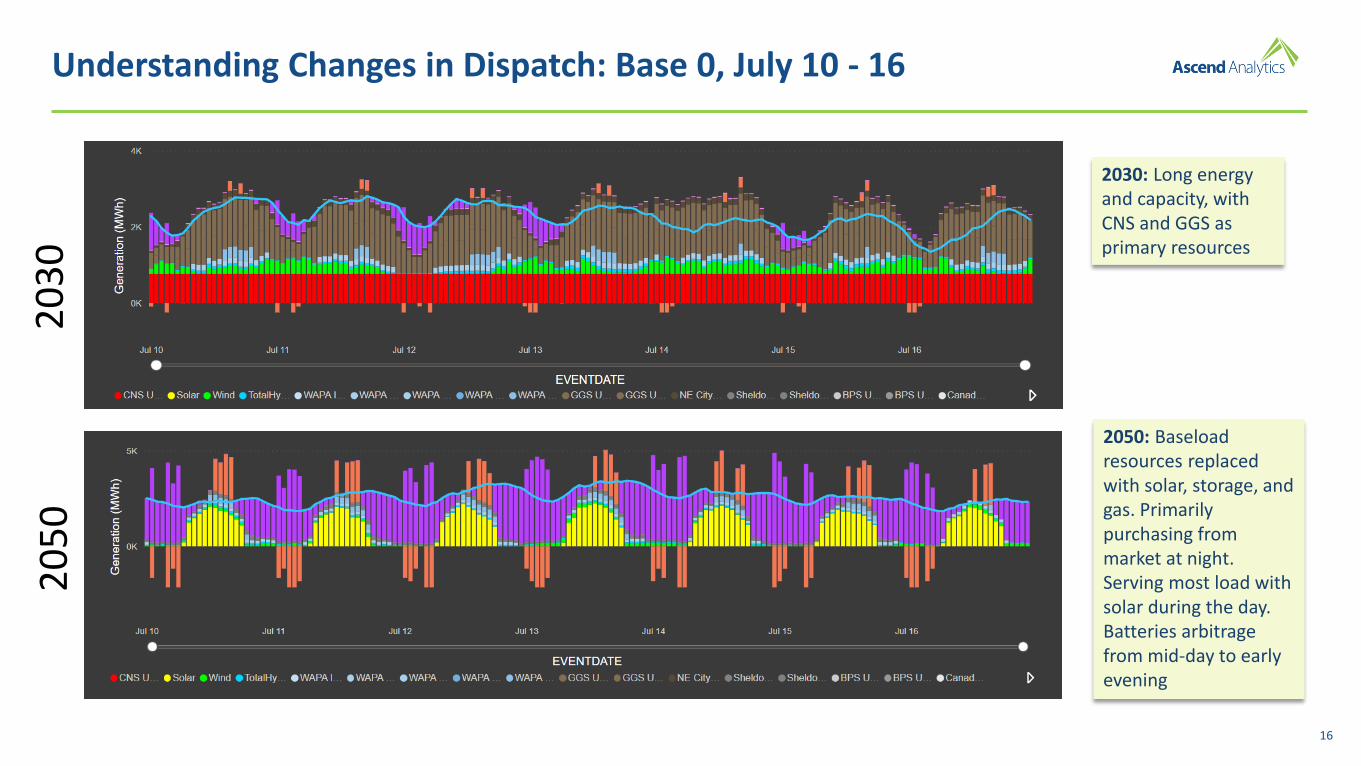
Understanding Changes in Dispatch: Base 0, July 10 - 162
03
02
05
0
2030: Long energy and capacity, with CNS and GGS as primary resources
2050: Baseload resources replaced with solar, storage, and gas. Primarily purchasing from market at night. Serving most load with solar during the day. Batteries arbitrage from mid-day to early evening
17
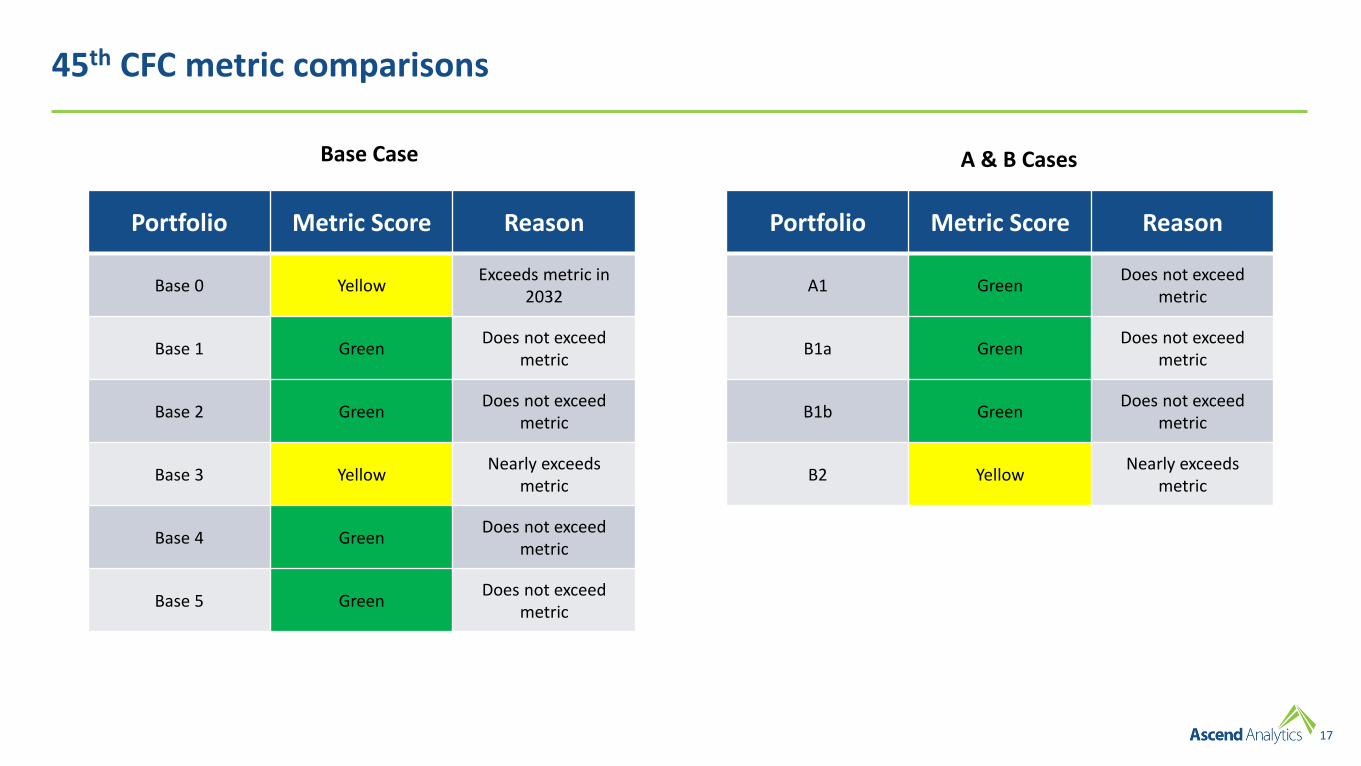
45th CFC metric comparisons
Portfolio Metric Score Reason
Base 0 YellowExceeds metric in
2032
Base 1 GreenDoes not exceed
metric
Base 2 GreenDoes not exceed
metric
Base 3 YellowNearly exceeds
metric
Base 4 GreenDoes not exceed
metric
Base 5 GreenDoes not exceed
metric
Portfolio Metric Score Reason
A1 GreenDoes not exceed
metric
B1a GreenDoes not exceed
metric
B1b GreenDoes not exceed
metric
B2 YellowNearly exceeds
metric
Base Case A & B Cases
18
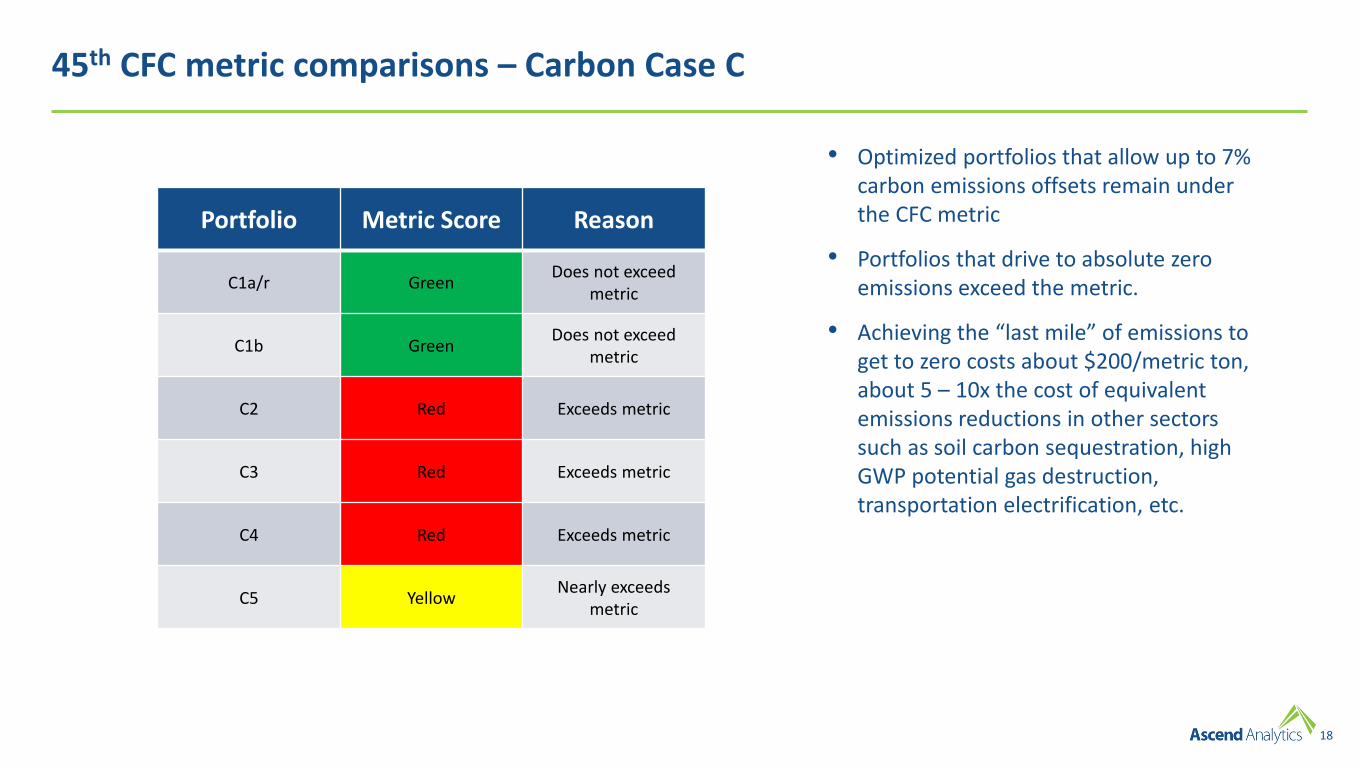
45th CFC metric comparisons – Carbon Case C
Portfolio Metric Score Reason
C1a/r GreenDoes not exceed
metric
C1b GreenDoes not exceed
metric
C2 Red Exceeds metric
C3 Red Exceeds metric
C4 Red Exceeds metric
C5 YellowNearly exceeds
metric
• Optimized portfolios that allow up to 7% carbon emissions offsets remain under the CFC metric
• Portfolios that drive to absolute zero emissions exceed the metric.
• Achieving the “last mile” of emissions to get to zero costs about $200/metric ton, about 5 – 10x the cost of equivalent emissions reductions in other sectors such as soil carbon sequestration, high GWP potential gas destruction, transportation electrification, etc.
19
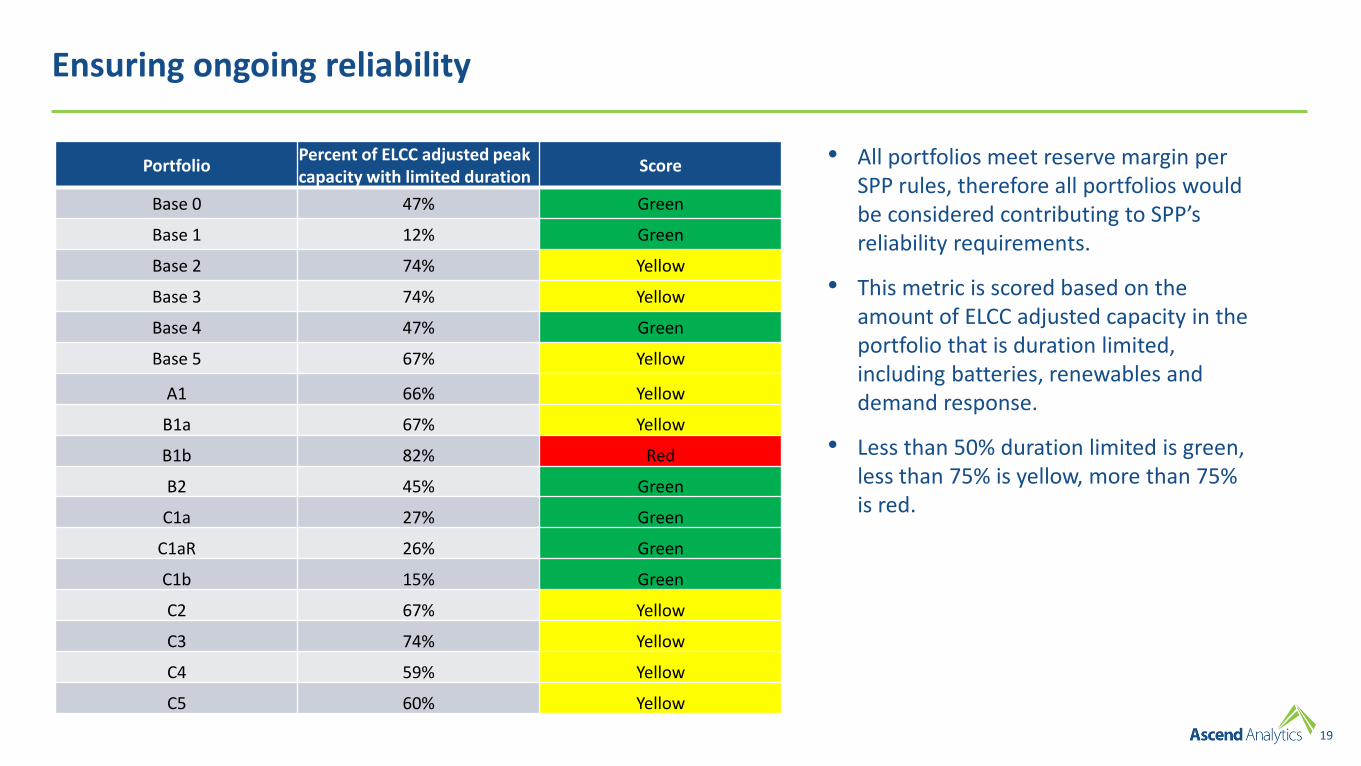
Ensuring ongoing reliability
PortfolioPercent of ELCC adjusted peak capacity with limited duration
Score
Base 0 47% Green
Base 1 12% Green
Base 2 74% Yellow
Base 3 74% Yellow
Base 4 47% Green
Base 5 67% Yellow
A1 66% Yellow
B1a 67% Yellow
B1b 82% Red
B2 45% Green
C1a 27% Green
C1aR 26% Green
C1b 15% Green
C2 67% Yellow
C3 74% Yellow
C4 59% Yellow
C5 60% Yellow
• All portfolios meet reserve margin per SPP rules, therefore all portfolios would be considered contributing to SPP’s reliability requirements.
• This metric is scored based on the amount of ELCC adjusted capacity in the portfolio that is duration limited, including batteries, renewables and demand response.
• Less than 50% duration limited is green, less than 75% is yellow, more than 75% is red.

20
Planning for extreme events
• Understanding the difference between resource adequacy and resiliency
o Resource adequacy is making sure enough electric generation capacity is available to meet demand most of the time.
▪ Having a 100% resource adequate system would be too expensive.
o Resiliency is making sure power systems are adequately hardened for extreme weather events.
▪ Insulation, de-icing procedures, dual-fuel, redundancy in transmission and distribution systems, undergrounding, etc.
• Resource planning should consider extreme “black swan” events but should not necessarily plan to build a system to be able to withstand them. Cost over the long-run must be weighed.
o Robust power systems have a diversity of resources in a wide footprint.
o Diversity = both supply side and demand side options, technology diversity, fuel diversity, and geographic diversity.
o Distributed systems are more resilient than large concentrated systems.
21
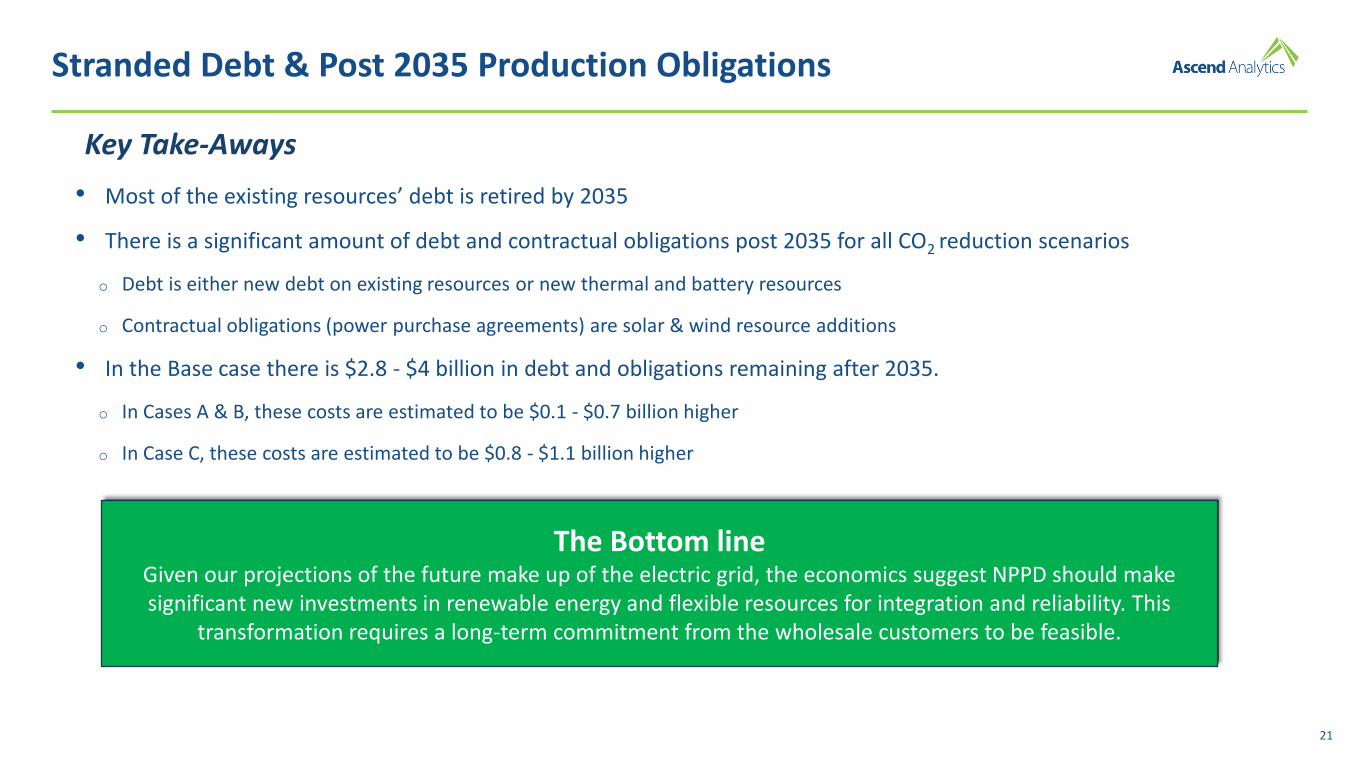
Stranded Debt & Post 2035 Production Obligations
• Most of the existing resources’ debt is retired by 2035
• There is a significant amount of debt and contractual obligations post 2035 for all CO2 reduction scenarios
o Debt is either new debt on existing resources or new thermal and battery resources
o Contractual obligations (power purchase agreements) are solar & wind resource additions
• In the Base case there is $2.8 - $4 billion in debt and obligations remaining after 2035.
o In Cases A & B, these costs are estimated to be $0.1 - $0.7 billion higher
o In Case C, these costs are estimated to be $0.8 - $1.1 billion higher
Key Take-Aways
The Bottom lineGiven our projections of the future make up of the electric grid, the economics suggest NPPD should make significant new investments in renewable energy and flexible resources for integration and reliability. This
transformation requires a long-term commitment from the wholesale customers to be feasible.
22
Signpost Summary
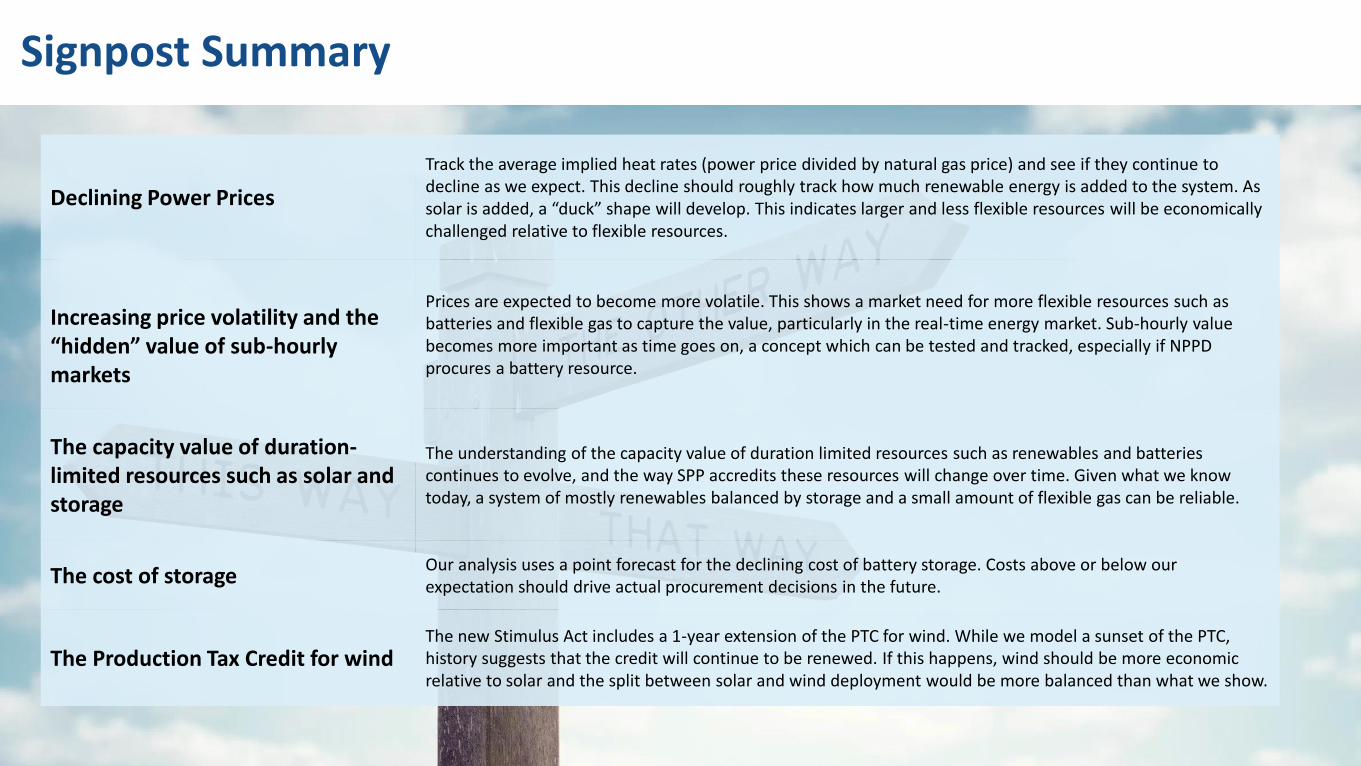
Declining Power Prices
Track the average implied heat rates (power price divided by natural gas price) and see if they continue to decline as we expect. This decline should roughly track how much renewable energy is added to the system. As solar is added, a “duck” shape will develop. This indicates larger and less flexible resources will be economically challenged relative to flexible resources.
Increasing price volatility and the “hidden” value of sub-hourly markets
Prices are expected to become more volatile. This shows a market need for more flexible resources such as batteries and flexible gas to capture the value, particularly in the real-time energy market. Sub-hourly value becomes more important as time goes on, a concept which can be tested and tracked, especially if NPPD procures a battery resource.
The capacity value of duration-limited resources such as solar and storage
The understanding of the capacity value of duration limited resources such as renewables and batteries continues to evolve, and the way SPP accredits these resources will change over time. Given what we know today, a system of mostly renewables balanced by storage and a small amount of flexible gas can be reliable.
The cost of storageOur analysis uses a point forecast for the declining cost of battery storage. Costs above or below our expectation should drive actual procurement decisions in the future.
The Production Tax Credit for windThe new Stimulus Act includes a 1-year extension of the PTC for wind. While we model a sunset of the PTC, history suggests that the credit will continue to be renewed. If this happens, wind should be more economic relative to solar and the split between solar and wind deployment would be more balanced than what we show.

23
1877 Broadway Street | Suite 706 | Boulder, CO 80302 | (303) 415 1400
David MillarDirector, Resource Planning [email protected]