Embed Size (px)
Citation preview
International Journal of Fatigue 22 (2000) 217–228www.elsevier.com/locate/ijfatigue
Low cycle fatigue analysis of temperature and frequency effects ineutectic solder alloy
X.Q. Shi a,*, H.L.J. Pangb, W. Zhou b, Z.P. Wanga
a Gintic Institute of Manufacturing Technology, Nanyang Drive, Singapore 638075, Singaporeb School of Mechanical and Production Engineering, Nanyang Technological University, Singapore 639798, Singapore
Received 23 August 1999; received in revised form 19 November 1999; accepted 19 November 1999
Abstract
Low cycle isothermal mechanical fatigue testing of a eutectic alloy 63Sn/37Pb was carried out in a systematic manner over awide range of frequencies (1024–1 Hz) and temperatures (240 to 150°C) with the total strain set at different values (1–50%). Thelow cycle fatigue behavior of the eutectic solder was found to be strongly dependent on test temperature and frequency. If theCoffin–Manson model is used to describe such fatigue behavior, the fatigue exponentm and ductility coefficientC in the modelare found to be a function of temperature and frequency rather than numerical constants. The plastic flow law was employed toexplain the temperature and frequency dependence. The frequency-modified Coffin–Manson model was tried and found to be ableto eliminate the frequency dependence of the numerical “constants” but not the temperature dependence. To have a full descriptionof the temperature- and frequency-dependent fatigue behavior, a set of empirical formulae was derived based on the frequency-modified Coffin–Manson model. 2000 Elsevier Science Ltd. All rights reserved.
Keywords:Low cycle fatigue; Eutectic solder; Temperature and frequency dependent; Plastic flow law; Frequency-modified Coffin–Manson
1. Introduction
Eutectic solder alloys are commonly used in surfacemount technology (SMT) soldering processes to formsolder interconnections which serve as electrical andmechanical connections between the electronic compo-nent and the printed circuit board (PCB). During serviceload conditions, the coefficient of thermal expansionmismatch between the component and the board, causedby power and environmental temperature changes, gen-erates thermally induced strains in the solder joints lead-ing to thermal fatigue failures. Low cycle fatigue failureof solder joints due to the thermal mismatch strain isrecognized as a major cause of failure in surfacemounted electronic devices. Therefore, it is important tounderstand the low cycle fatigue behavior of solder alloyin order to improve the long-term reliability of SMTsolder joints in PCBs.
Thermal fatigue experiments are difficult to study
* Corresponding author. Tel.:+65-790-5514; fax:+65-791-1859.E-mail address:[email protected] (H.L.J. Pang).
0142-1123/00/$ - see front matter 2000 Elsevier Science Ltd. All rights reserved.PII: S0142-1123 (99)00124-3
because they are time-consuming and require specialthermal cycling equipment and test facilities. Further-more, the studies are made difficult due to the changingmaterial properties of solder as the temperature changesduring thermal fatigue loading [1]. An approach to thisproblem is to investigate the fatigue behavior of solderjoints using isothermal mechanical fatigue tests. This hasled to considerable research efforts in trying to modelthe fatigue behavior of low cycle fatigue life predictionmodels for solder joints.
In general, three types of specimens have been usedto study the fatigue behavior of solder and they areactual SMT solder joint specimens, simplified shearspecimens, and bulk solder test samples. Much work hasbeen done on actual SMT solder joint specimens, rang-ing from leaded chip carrier printed circuit boards [2–4]to leadless chip carrier printed circuit boards [5,6]. Thisapproach has the advantage of testing the solder jointsof actual electronic components, but the main disadvan-tage is that the results are specific to the componentsused and are not easily applied to other applications.Simplified shear specimens are usually fabricated fromtwo pieces of metal plates joined by solder. Different
218 X.Q. Shi et al. / International Journal of Fatigue 22 (2000) 217–228
types of simplified shear specimens have been used indifferent laboratories [7–12]. Some examples are the sin-gle shear specimen, double shear specimen, lap-shearspecimen, and ring-pin specimen. These investigationsmake good contributions to the understanding of solderjoint fatigue reliability. However, since the stress–straindistribution in these SMT solder joint specimens andsimplified shear specimens gives rise to a complex multi-axial stress–strain state, the reported test results shouldbe used with caution. The reported test results may rep-resent the fatigue behavior of the structure or test speci-men rather than that of the solder material itself [13]. Inbulk solder sample tests, a pure tension or pure shearstress–strain state is preferred. Therefore, fatigue data ofbulk solder samples are needed to provide a firm basisfor fundamental low cycle fatigue studies and to providefurther understanding of the fatigue failure behavior overa wide range of test temperatures and test frequencies.For example, Jiang [14] gave the fatigue data of60Sn/40Pb solder alloy at room temperature for a certainstrain rate (3.3×10²³ s21). Hence more low fatigue testdata at different temperatures and frequencies isrequired.
Service temperature changes seldom ramp up and thenramp down as rapidly as is found in thermal cyclingtests. Rather, the temperature is held constant for a per-iod of time before changing. In the case of real servicejoints this hold time may be a matter of hours, a day,or even longer. Eutectic solder is a low-melting pointalloy (183°C for 63Sn/37Pb); the environmental tem-perature often simulated in accelerated thermal cyclingtests can vary from240 to 125°C and is about 0.5–0.85timesTm (melting point) of the eutectic solder alloy. Atsuch high homologous temperatures, the thermal fatigueprocess must be accompanied with creep. The creep con-tribution to fatigue failure changes as the hold time orcyclic frequency is changed during service loads or dur-ing reliability tests. Obviously, low cycle fatigue dataused for solder joint reliability assessments must accountfor the cyclic frequency effects at different service loador reliability test load conditions. Isothermal mechanicalfatigue tests are often used instead of thermal cyclingfatigue tests to study the low cycle fatigue behavior ofsolder at different test temperatures and frequencies. Inthis paper, a low cycle fatigue test program for63Sn/37Pb eutectic solder alloy was carried out in a sys-tematic manner over a wide range of test frequencies of1024–1 Hz, and test temperatures from240 to 150°C,under total strain control conditions set at differentvalues of a 1–50% total strain range. The test resultsdeveloped were analysed using low cycle fatigue modelswhere the effects of temperature and frequency havebeen accounted for in a frequency-modified Coffin–Manson model with temperature-dependent constants.
2. Experimental details and procedures
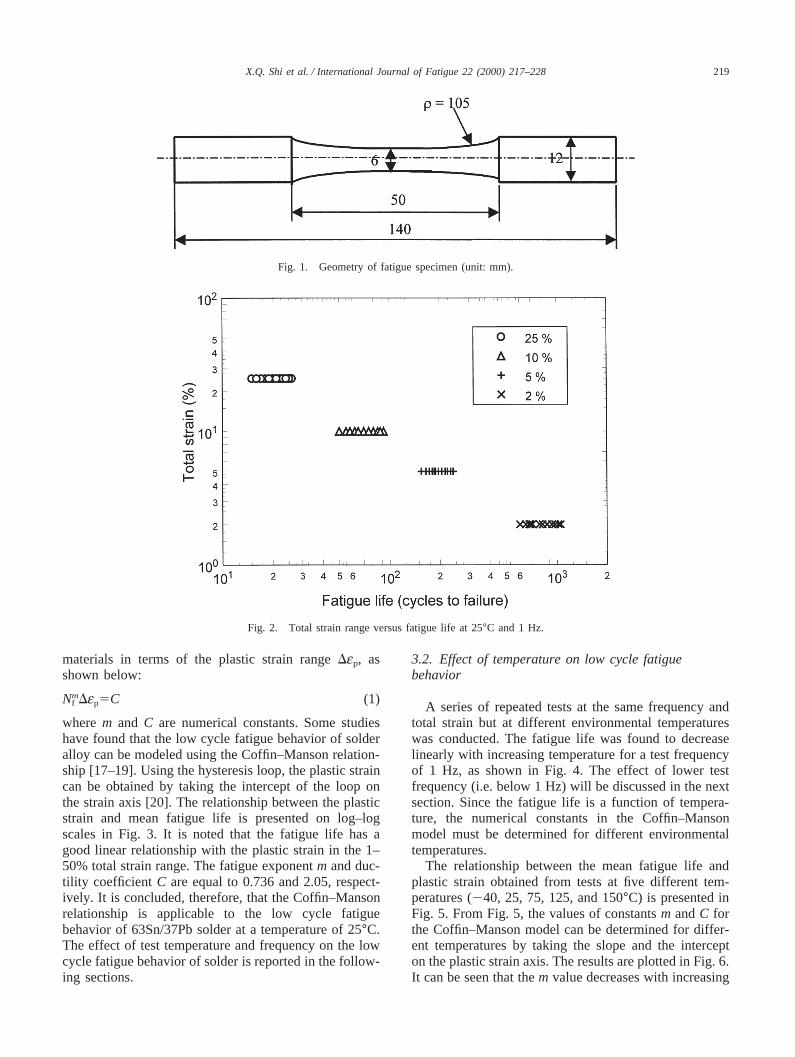
The fatigue specimens used in the tests were cylindri-cal specimens with a gauge length of 50 mm and a cen-tral diameter of 6 mm, as shown in Fig. 1. A large radiusof curvature of 105 mm was made in the gauge sectionto prevent any stress concentration due to sharp corners.The specimens were machined from high purity63Sn/37Pb solder bars in the as-cast condition. Thesolder contained 63wt% Sn and 37wt% Pb. After mach-ining, the gauge section of each specimen was carefullyground on fine SiC paper and polished using 1µm dia-mond paste. Afterwards, the fatigue specimens wereannealed at 60°C for 24 h in a N2 atmosphere to elimin-ate the residual stresses.
The fatigue tests were conducted on a servo-valve-controlled electro-hydraulic testing machine from MTS(model 810). The gripping device of the machine wasdesigned in such a way that only a small gripping loadwas required to grip the soft solder specimens. Themachine has the capacity to produce very low fre-quencies in the wide range 1024–1 Hz. The tests wererun under a symmetrical uniaxial tension–compressionloading with total strain control. The triangular wav-eform was employed for all the fatigue tests. The totalstrain was measured using a dynamic extensometerwhich was attached to the specimen within the gaugelength. The testing was carried out at five different fre-quencies (1024, 1023, 1022, 1021, and 1 Hz) and at fivedifferent temperatures (240, 25, 75, 125, and 150°C)with total strain set at six different values (1, 2, 5, 10,25, and 50%). For each test condition at least six speci-mens were used. The number of cycles to failure foreach of the specimens was recorded as the fatigue life.
3. Low cycle fatigue test results
3.1. Effect of plastic strain range on low cycle fatigue
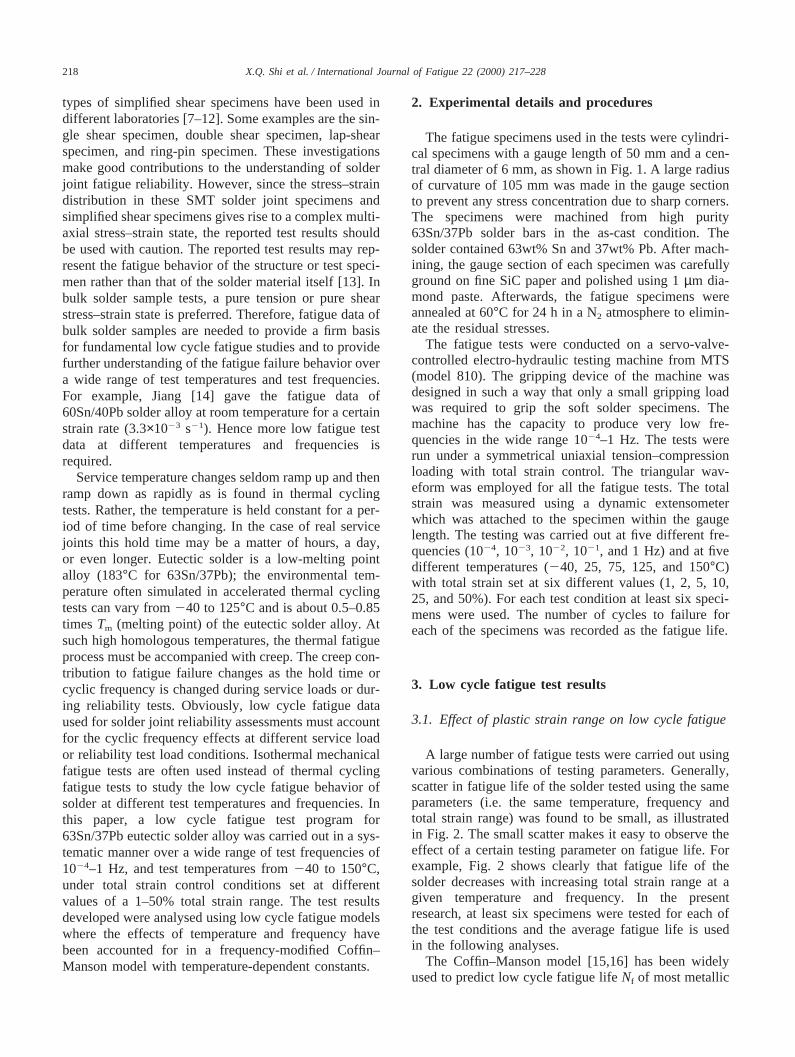
A large number of fatigue tests were carried out usingvarious combinations of testing parameters. Generally,scatter in fatigue life of the solder tested using the sameparameters (i.e. the same temperature, frequency andtotal strain range) was found to be small, as illustratedin Fig. 2. The small scatter makes it easy to observe theeffect of a certain testing parameter on fatigue life. Forexample, Fig. 2 shows clearly that fatigue life of thesolder decreases with increasing total strain range at agiven temperature and frequency. In the presentresearch, at least six specimens were tested for each ofthe test conditions and the average fatigue life is usedin the following analyses.
The Coffin–Manson model [15,16] has been widelyused to predict low cycle fatigue lifeNf of most metallic
219X.Q. Shi et al. / International Journal of Fatigue 22 (2000) 217–228
Fig. 1. Geometry of fatigue specimen (unit: mm).
Fig. 2. Total strain range versus fatigue life at 25°C and 1 Hz.
materials in terms of the plastic strain rangeDep, asshown below:
Nmf Dep5C (1)
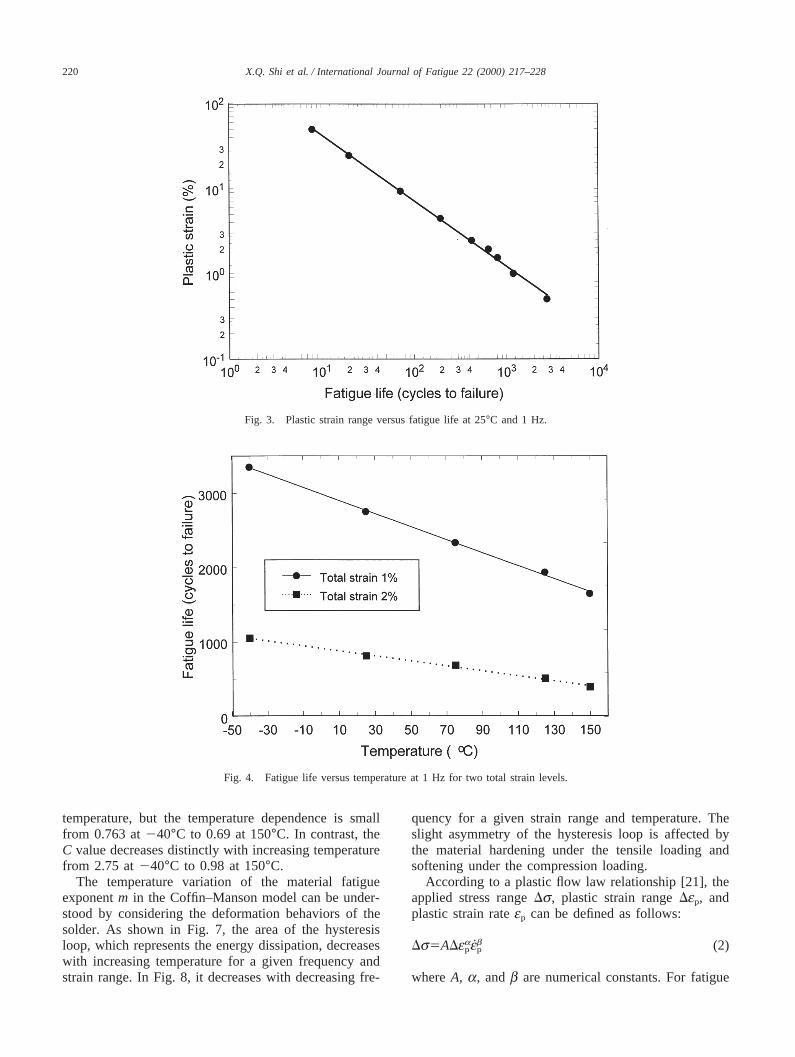
wherem and C are numerical constants. Some studieshave found that the low cycle fatigue behavior of solderalloy can be modeled using the Coffin–Manson relation-ship [17–19]. Using the hysteresis loop, the plastic straincan be obtained by taking the intercept of the loop onthe strain axis [20]. The relationship between the plasticstrain and mean fatigue life is presented on log–logscales in Fig. 3. It is noted that the fatigue life has agood linear relationship with the plastic strain in the 1–50% total strain range. The fatigue exponentm and duc-tility coefficient C are equal to 0.736 and 2.05, respect-ively. It is concluded, therefore, that the Coffin–Mansonrelationship is applicable to the low cycle fatiguebehavior of 63Sn/37Pb solder at a temperature of 25°C.The effect of test temperature and frequency on the lowcycle fatigue behavior of solder is reported in the follow-ing sections.
3.2. Effect of temperature on low cycle fatiguebehavior
A series of repeated tests at the same frequency andtotal strain but at different environmental temperatureswas conducted. The fatigue life was found to decreaselinearly with increasing temperature for a test frequencyof 1 Hz, as shown in Fig. 4. The effect of lower testfrequency (i.e. below 1 Hz) will be discussed in the nextsection. Since the fatigue life is a function of tempera-ture, the numerical constants in the Coffin–Mansonmodel must be determined for different environmentaltemperatures.
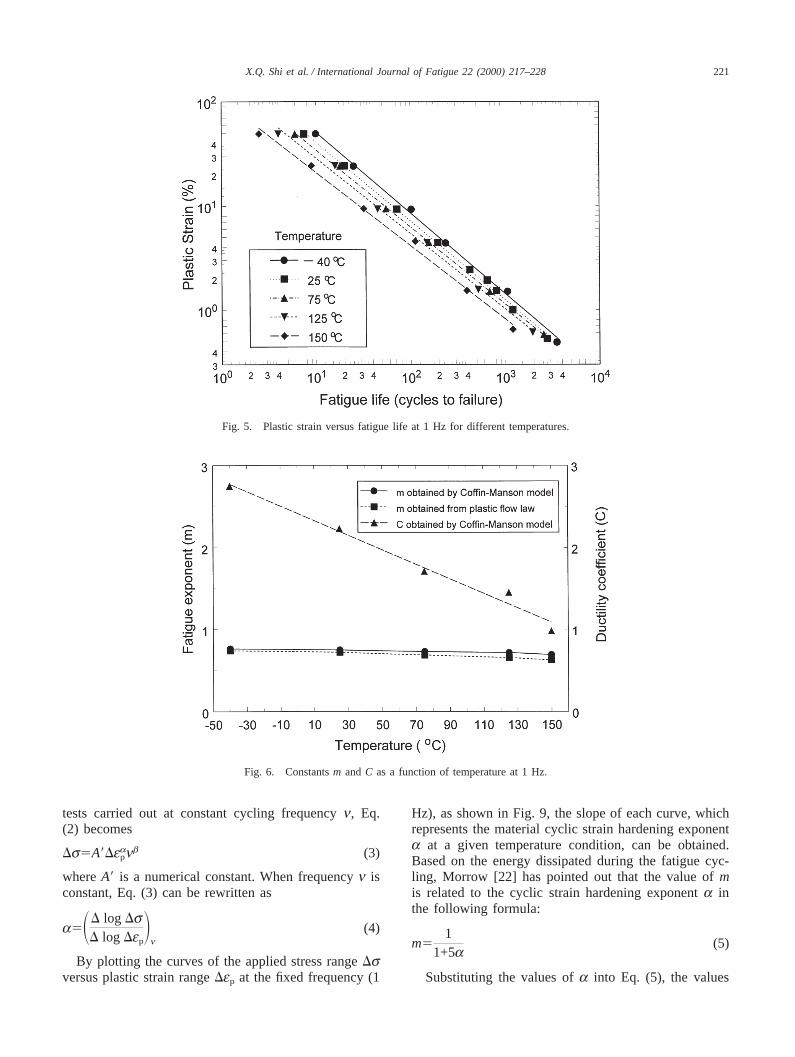
The relationship between the mean fatigue life andplastic strain obtained from tests at five different tem-peratures (240, 25, 75, 125, and 150°C) is presented inFig. 5. From Fig. 5, the values of constantsm andC forthe Coffin–Manson model can be determined for differ-ent temperatures by taking the slope and the intercepton the plastic strain axis. The results are plotted in Fig. 6.It can be seen that them value decreases with increasing
220 X.Q. Shi et al. / International Journal of Fatigue 22 (2000) 217–228
Fig. 3. Plastic strain range versus fatigue life at 25°C and 1 Hz.
Fig. 4. Fatigue life versus temperature at 1 Hz for two total strain levels.
temperature, but the temperature dependence is smallfrom 0.763 at240°C to 0.69 at 150°C. In contrast, theC value decreases distinctly with increasing temperaturefrom 2.75 at240°C to 0.98 at 150°C.
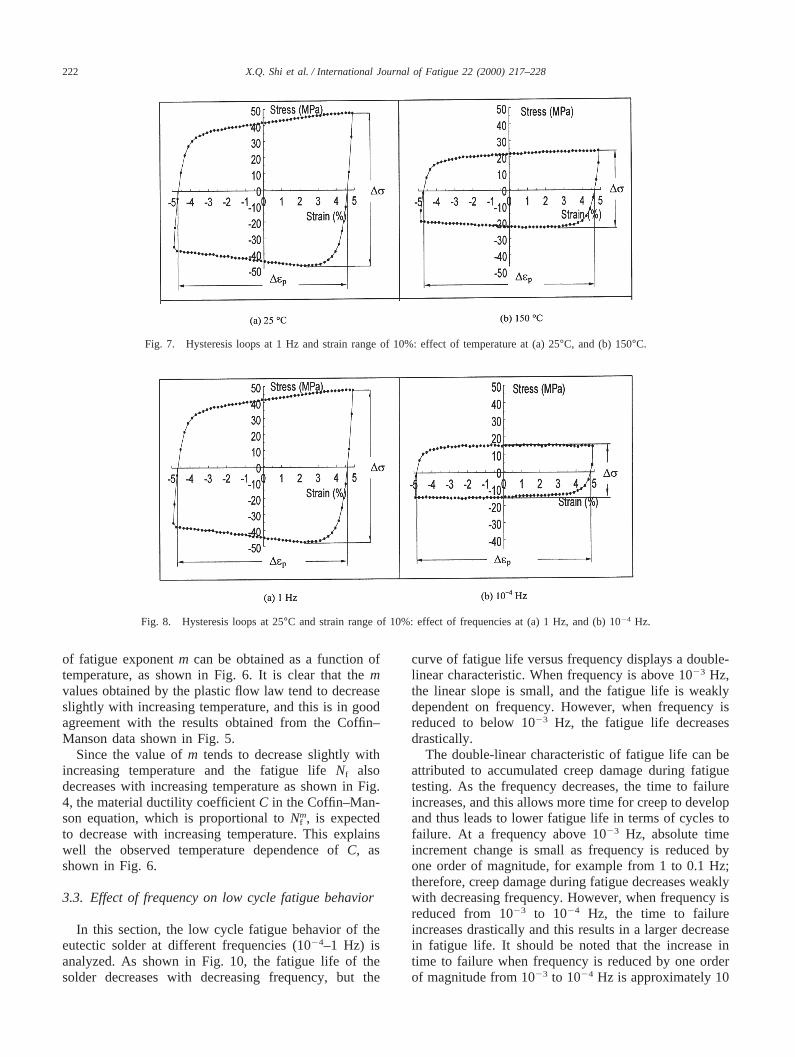
The temperature variation of the material fatigueexponentm in the Coffin–Manson model can be under-stood by considering the deformation behaviors of thesolder. As shown in Fig. 7, the area of the hysteresisloop, which represents the energy dissipation, decreaseswith increasing temperature for a given frequency andstrain range. In Fig. 8, it decreases with decreasing fre-
quency for a given strain range and temperature. Theslight asymmetry of the hysteresis loop is affected bythe material hardening under the tensile loading andsoftening under the compression loading.
According to a plastic flow law relationship [21], theapplied stress rangeDs, plastic strain rangeDep, andplastic strain rateep can be defined as follows:
Ds5ADeapebp (2)
whereA, a, andb are numerical constants. For fatigue
221X.Q. Shi et al. / International Journal of Fatigue 22 (2000) 217–228
Fig. 5. Plastic strain versus fatigue life at 1 Hz for different temperatures.
Fig. 6. Constantsm andC as a function of temperature at 1 Hz.
tests carried out at constant cycling frequencyn, Eq.(2) becomes
Ds5A9Deapnb (3)
whereA9 is a numerical constant. When frequencyn isconstant, Eq. (3) can be rewritten as
a5SD log DsD log Dep
Dn
(4)
By plotting the curves of the applied stress rangeDsversus plastic strain rangeDep at the fixed frequency (1
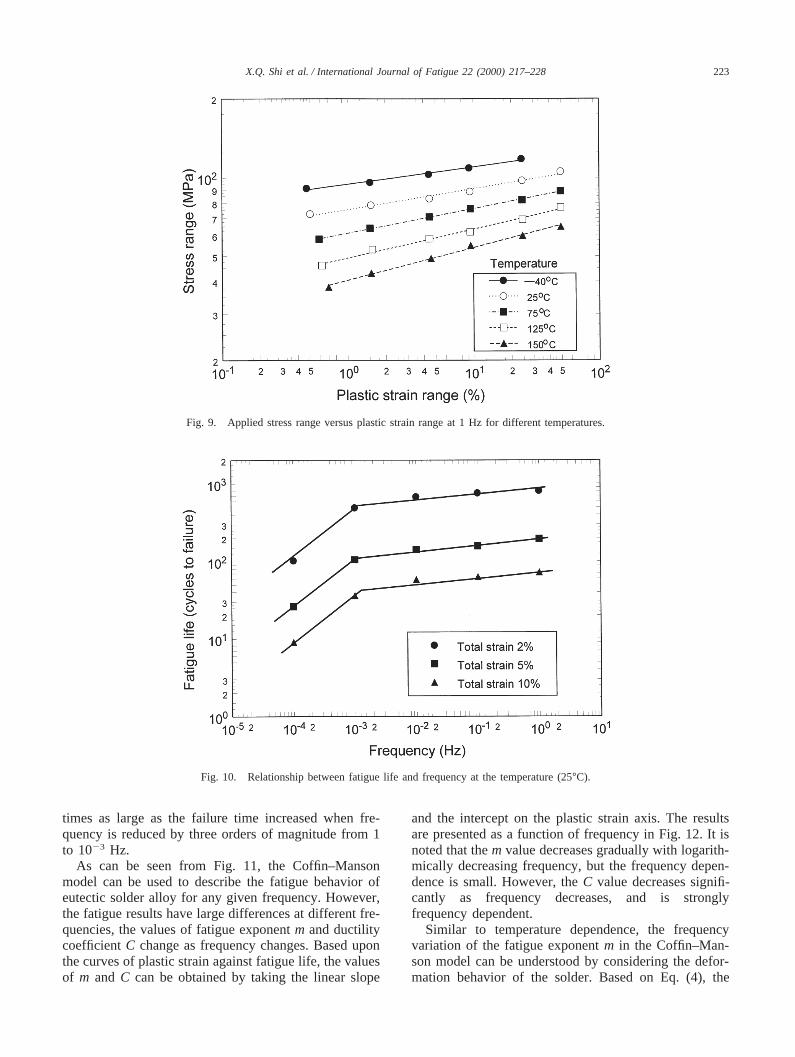
Hz), as shown in Fig. 9, the slope of each curve, whichrepresents the material cyclic strain hardening exponenta at a given temperature condition, can be obtained.Based on the energy dissipated during the fatigue cyc-ling, Morrow [22] has pointed out that the value ofmis related to the cyclic strain hardening exponenta inthe following formula:
m51
1+5a(5)
Substituting the values ofa into Eq. (5), the values
222 X.Q. Shi et al. / International Journal of Fatigue 22 (2000) 217–228
Fig. 7. Hysteresis loops at 1 Hz and strain range of 10%: effect of temperature at (a) 25°C, and (b) 150°C.
Fig. 8. Hysteresis loops at 25°C and strain range of 10%: effect of frequencies at (a) 1 Hz, and (b) 1024 Hz.
of fatigue exponentm can be obtained as a function oftemperature, as shown in Fig. 6. It is clear that themvalues obtained by the plastic flow law tend to decreaseslightly with increasing temperature, and this is in goodagreement with the results obtained from the Coffin–Manson data shown in Fig. 5.
Since the value ofm tends to decrease slightly withincreasing temperature and the fatigue lifeNf alsodecreases with increasing temperature as shown in Fig.4, the material ductility coefficientC in the Coffin–Man-son equation, which is proportional toNm
f , is expectedto decrease with increasing temperature. This explainswell the observed temperature dependence ofC, asshown in Fig. 6.
3.3. Effect of frequency on low cycle fatigue behavior
In this section, the low cycle fatigue behavior of theeutectic solder at different frequencies (1024–1 Hz) isanalyzed. As shown in Fig. 10, the fatigue life of thesolder decreases with decreasing frequency, but the
curve of fatigue life versus frequency displays a double-linear characteristic. When frequency is above 1023 Hz,the linear slope is small, and the fatigue life is weaklydependent on frequency. However, when frequency isreduced to below 1023 Hz, the fatigue life decreasesdrastically.
The double-linear characteristic of fatigue life can beattributed to accumulated creep damage during fatiguetesting. As the frequency decreases, the time to failureincreases, and this allows more time for creep to developand thus leads to lower fatigue life in terms of cycles tofailure. At a frequency above 1023 Hz, absolute timeincrement change is small as frequency is reduced byone order of magnitude, for example from 1 to 0.1 Hz;therefore, creep damage during fatigue decreases weaklywith decreasing frequency. However, when frequency isreduced from 1023 to 1024 Hz, the time to failureincreases drastically and this results in a larger decreasein fatigue life. It should be noted that the increase intime to failure when frequency is reduced by one orderof magnitude from 1023 to 1024 Hz is approximately 10
223X.Q. Shi et al. / International Journal of Fatigue 22 (2000) 217–228
Fig. 9. Applied stress range versus plastic strain range at 1 Hz for different temperatures.
Fig. 10. Relationship between fatigue life and frequency at the temperature (25°C).
times as large as the failure time increased when fre-quency is reduced by three orders of magnitude from 1to 1023 Hz.
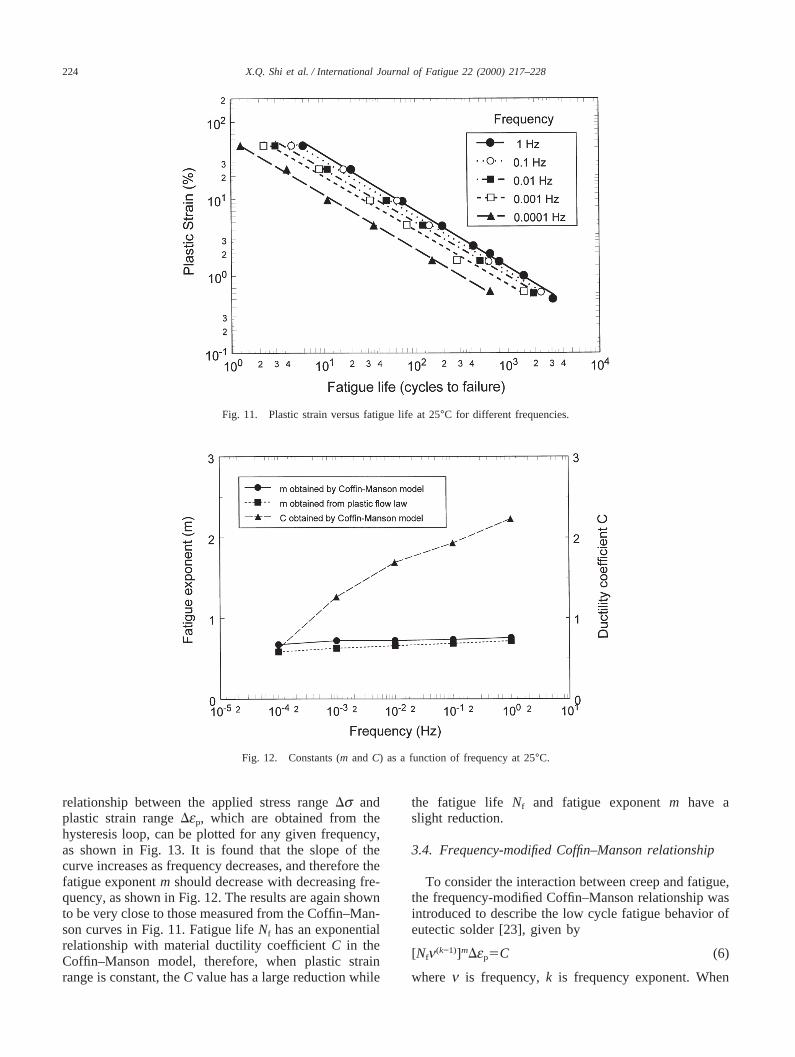
As can be seen from Fig. 11, the Coffin–Mansonmodel can be used to describe the fatigue behavior ofeutectic solder alloy for any given frequency. However,the fatigue results have large differences at different fre-quencies, the values of fatigue exponentm and ductilitycoefficientC change as frequency changes. Based uponthe curves of plastic strain against fatigue life, the valuesof m and C can be obtained by taking the linear slope
and the intercept on the plastic strain axis. The resultsare presented as a function of frequency in Fig. 12. It isnoted that them value decreases gradually with logarith-mically decreasing frequency, but the frequency depen-dence is small. However, theC value decreases signifi-cantly as frequency decreases, and is stronglyfrequency dependent.
Similar to temperature dependence, the frequencyvariation of the fatigue exponentm in the Coffin–Man-son model can be understood by considering the defor-mation behavior of the solder. Based on Eq. (4), the
224 X.Q. Shi et al. / International Journal of Fatigue 22 (2000) 217–228
Fig. 11. Plastic strain versus fatigue life at 25°C for different frequencies.
Fig. 12. Constants (m andC) as a function of frequency at 25°C.
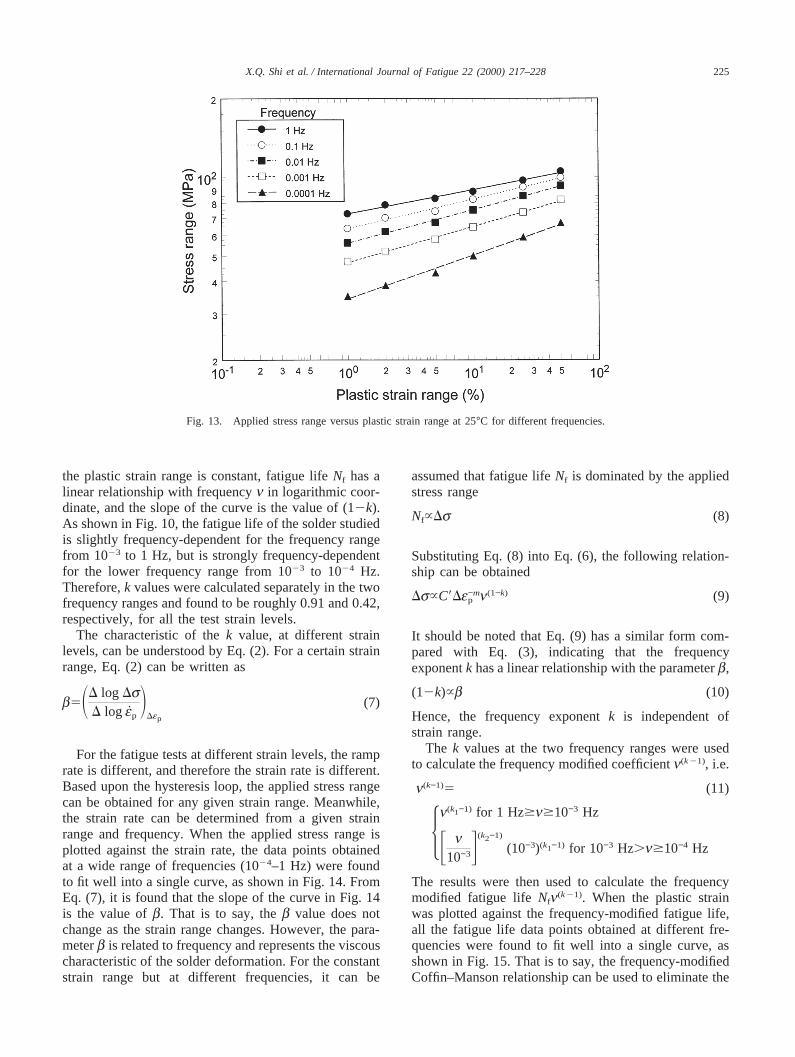
relationship between the applied stress rangeDs andplastic strain rangeDep, which are obtained from thehysteresis loop, can be plotted for any given frequency,as shown in Fig. 13. It is found that the slope of thecurve increases as frequency decreases, and therefore thefatigue exponentm should decrease with decreasing fre-quency, as shown in Fig. 12. The results are again shownto be very close to those measured from the Coffin–Man-son curves in Fig. 11. Fatigue lifeNf has an exponentialrelationship with material ductility coefficientC in theCoffin–Manson model, therefore, when plastic strainrange is constant, theC value has a large reduction while
the fatigue life Nf and fatigue exponentm have aslight reduction.
3.4. Frequency-modified Coffin–Manson relationship
To consider the interaction between creep and fatigue,the frequency-modified Coffin–Manson relationship wasintroduced to describe the low cycle fatigue behavior ofeutectic solder [23], given by
[Nfn(k−1)]mDep5C (6)
where n is frequency,k is frequency exponent. When
225X.Q. Shi et al. / International Journal of Fatigue 22 (2000) 217–228
Fig. 13. Applied stress range versus plastic strain range at 25°C for different frequencies.
the plastic strain range is constant, fatigue lifeNf has alinear relationship with frequencyn in logarithmic coor-dinate, and the slope of the curve is the value of (12k).As shown in Fig. 10, the fatigue life of the solder studiedis slightly frequency-dependent for the frequency rangefrom 1023 to 1 Hz, but is strongly frequency-dependentfor the lower frequency range from 1023 to 1024 Hz.Therefore,k values were calculated separately in the twofrequency ranges and found to be roughly 0.91 and 0.42,respectively, for all the test strain levels.
The characteristic of thek value, at different strainlevels, can be understood by Eq. (2). For a certain strainrange, Eq. (2) can be written as
b5SD log DsD log ep
DDep
(7)
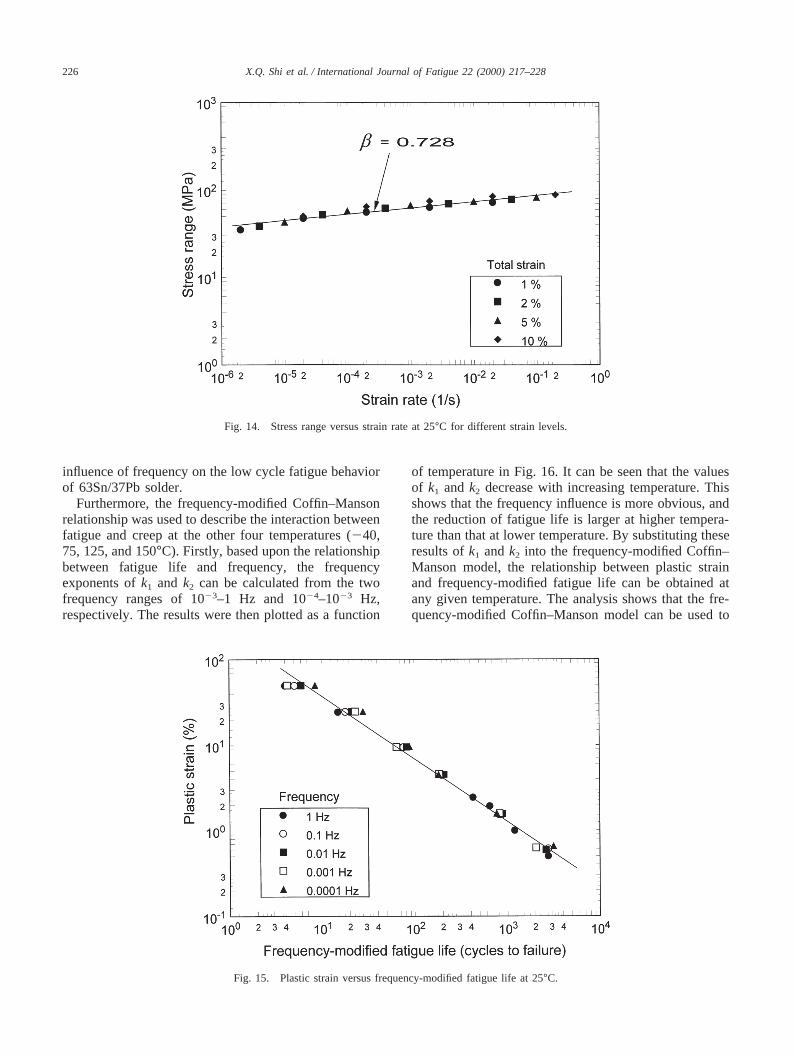
For the fatigue tests at different strain levels, the ramprate is different, and therefore the strain rate is different.Based upon the hysteresis loop, the applied stress rangecan be obtained for any given strain range. Meanwhile,the strain rate can be determined from a given strainrange and frequency. When the applied stress range isplotted against the strain rate, the data points obtainedat a wide range of frequencies (1024–1 Hz) were foundto fit well into a single curve, as shown in Fig. 14. FromEq. (7), it is found that the slope of the curve in Fig. 14is the value ofb. That is to say, theb value does notchange as the strain range changes. However, the para-meterb is related to frequency and represents the viscouscharacteristic of the solder deformation. For the constantstrain range but at different frequencies, it can be
assumed that fatigue lifeNf is dominated by the appliedstress range
Nf~Ds (8)
Substituting Eq. (8) into Eq. (6), the following relation-ship can be obtained
Ds~C9De−mp n(1−k) (9)
It should be noted that Eq. (9) has a similar form com-pared with Eq. (3), indicating that the frequencyexponentk has a linear relationship with the parameterb,
(12k)~b (10)
Hence, the frequency exponentk is independent ofstrain range.
The k values at the two frequency ranges were usedto calculate the frequency modified coefficientn(k21), i.e.
n(k−1)5 (11)
5n(k1−1) for 1 Hz$n$10−3 Hz
F n10−3G(k2−1)
(10−3)(k1−1) for 10−3 Hz.n$10−4 Hz
The results were then used to calculate the frequencymodified fatigue lifeNfn(k21). When the plastic strainwas plotted against the frequency-modified fatigue life,all the fatigue life data points obtained at different fre-quencies were found to fit well into a single curve, asshown in Fig. 15. That is to say, the frequency-modifiedCoffin–Manson relationship can be used to eliminate the
226 X.Q. Shi et al. / International Journal of Fatigue 22 (2000) 217–228
Fig. 14. Stress range versus strain rate at 25°C for different strain levels.
influence of frequency on the low cycle fatigue behaviorof 63Sn/37Pb solder.
Furthermore, the frequency-modified Coffin–Mansonrelationship was used to describe the interaction betweenfatigue and creep at the other four temperatures (240,75, 125, and 150°C). Firstly, based upon the relationshipbetween fatigue life and frequency, the frequencyexponents ofk1 and k2 can be calculated from the twofrequency ranges of 1023–1 Hz and 1024–1023 Hz,respectively. The results were then plotted as a function
Fig. 15. Plastic strain versus frequency-modified fatigue life at 25°C.
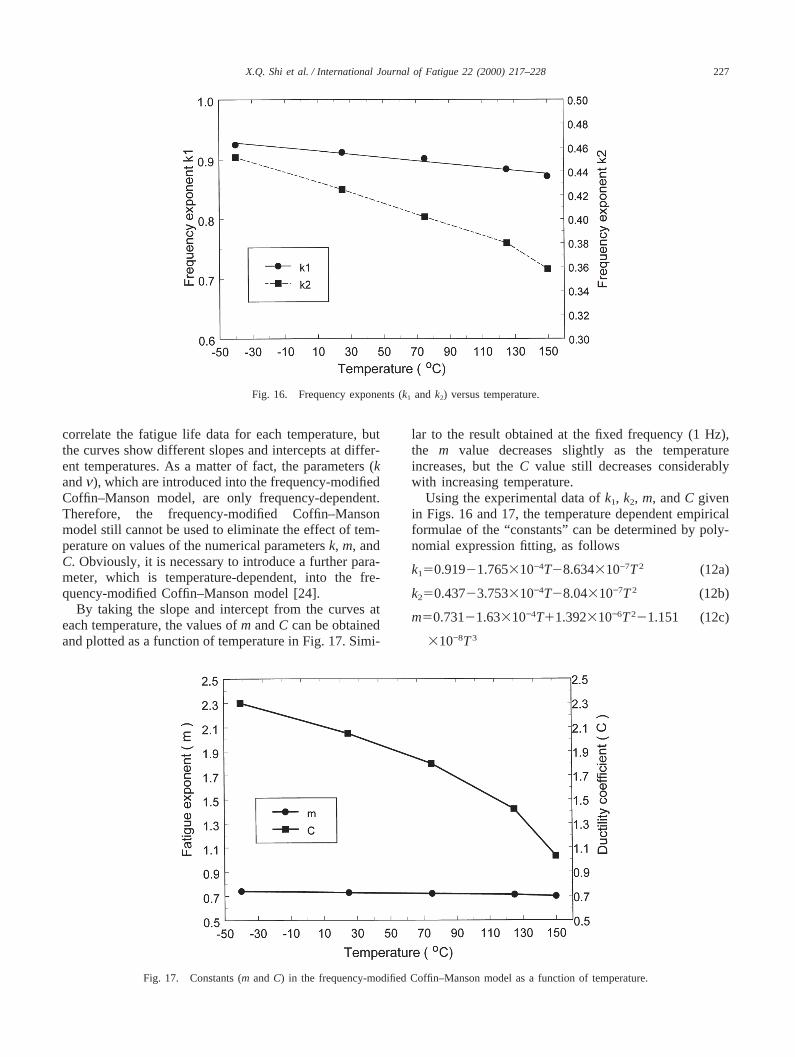
of temperature in Fig. 16. It can be seen that the valuesof k1 andk2 decrease with increasing temperature. Thisshows that the frequency influence is more obvious, andthe reduction of fatigue life is larger at higher tempera-ture than that at lower temperature. By substituting theseresults ofk1 andk2 into the frequency-modified Coffin–Manson model, the relationship between plastic strainand frequency-modified fatigue life can be obtained atany given temperature. The analysis shows that the fre-quency-modified Coffin–Manson model can be used to
227X.Q. Shi et al. / International Journal of Fatigue 22 (2000) 217–228
Fig. 16. Frequency exponents (k1 and k2) versus temperature.
correlate the fatigue life data for each temperature, butthe curves show different slopes and intercepts at differ-ent temperatures. As a matter of fact, the parameters (kandn), which are introduced into the frequency-modifiedCoffin–Manson model, are only frequency-dependent.Therefore, the frequency-modified Coffin–Mansonmodel still cannot be used to eliminate the effect of tem-perature on values of the numerical parametersk, m, andC. Obviously, it is necessary to introduce a further para-meter, which is temperature-dependent, into the fre-quency-modified Coffin–Manson model [24].
By taking the slope and intercept from the curves ateach temperature, the values ofm andC can be obtainedand plotted as a function of temperature in Fig. 17. Simi-
Fig. 17. Constants (m andC) in the frequency-modified Coffin–Manson model as a function of temperature.
lar to the result obtained at the fixed frequency (1 Hz),the m value decreases slightly as the temperatureincreases, but theC value still decreases considerablywith increasing temperature.
Using the experimental data ofk1, k2, m, andC givenin Figs. 16 and 17, the temperature dependent empiricalformulae of the “constants” can be determined by poly-nomial expression fitting, as follows
k150.91921.765310−4T28.634310−7T2 (12a)
k250.43723.753310−4T28.04310−7T2 (12b)
m50.73121.63310−4T11.392310−6T221.151 (12c)
310−8T3
228 X.Q. Shi et al. / International Journal of Fatigue 22 (2000) 217–228
C52.12223.57310−3T11.329310−5T222.502 (12d)
310−7T3
The correlation coefficient is used to measure the good-ness of curve fitting in the polynomial expression. A cor-relation coefficient value of 1.0 represents a “perfect” fit.For the empirical formulae ofk1, k2, m, and C, fourvalues of 0.99628, 0.99364, 0.99505, and 0.99855 areobtained, respectively. Therefore, the formulae do rep-resent the data accurately.
4. Conclusions
Based on the low cycle fatigue test results and analy-ses, the following conclusions can be made.
1. Low cycle fatigue life of eutectic solder was foundto be temperature- and frequency-dependent over therange of test temperatures (from240 to 150°C) andtest frequencies (1024–1 Hz). As temperatureincreases, the fatigue life decreases linearly on a log–log plot. The decrease in fatigue life is small whenfrequency decreases from 1 to 1023 Hz but becomeslarge when frequency reduces further from 1023 to1024 Hz.
2. When the Coffin–Manson model is used to describethe low cycle fatigue behavior of 63Sn/37Pb eutecticsolder alloy, the fatigue exponentm and ductilitycoefficientC in the model are not constant but depen-dent on temperature and frequency. The generalizedplastic flow law was employed successfully to explainthe dependence of fatigue life on temperature and fre-quency.
3. The frequency-modified Coffin–Manson model canbe used to describe the frequency effects on thefatigue behavior of 63Sn/37Pb eutectic solder. Themodel given in Eq. (6) can account for the effect oftest frequency on the values of the fatigue model para-metersk, m, andC. However, the values of these para-meters are still dependent upon test temperature. Thefatigue test program conducted made it possible toderive the empirical relationship between the modelparameters (k1, k2, m, andC) given in Equations 12a–d. This empirical formulae can be used together withthe frequency-modified Coffin–Manson model given
in Eq. (6) to predict the fatigue life of eutectic soldertested over the wide range of temperatures and fre-quencies reported in this paper.
Acknowledgements
The work reported here was carried out with the fin-ancial and technical support of Gintic Institute of Manu-facturing Technology under the Upstream Project: U96-P-169. This project was done in cooperation with theSchool of Mechanical and Production Engineering, atNanyang Technological University. H.L.J. Pang grate-fully acknowledges the project funding and support pro-vided through the Gintic/NTU Upstream Research pro-gram.
References
[1] Solomon HD. IEEE Trans CHMT 1986;9(4):423.[2] Xie DJ, Chan YC, Lai JK. IEEE Trans CPMT—Part A
1996;19:669.[3] Frear DR. IEEE Trans CHMT 1989;12:492.[4] Solomon HD. J Electron Packag 1993;115:173.[5] Wen LC, Ross RG. J Electron Packag 1995;117:109.[6] Engelmaier W, Attarawala AI. IEEE Trans CHMT 1989;12:284.[7] Guo Q, Cutiongco EC, Keer LM, Fine ME. J Electron Packag
1992;114:145.[8] Pao YH, Govila R, Badgley S, Jih E. J Electron Packag
1993;115:1.[9] Mei Z, Morris JW. J Electron Packag 1992;114:104.
[10] Ma YQ, Tang XY, Ma JS. J Electron Packag 1993;115:961.[11] Guo ZF, Sprecher AF, Jung DY, Conrad H. IEEE Trans
CHMT 1991;14(4):833.[12] Sandstrom R, Osterberg JO, Nylen M. Mater Sci Technol
1993;9:811.[13] Hong BZ, Yuan TD, Burrell L. Sensing Modeling and Simulation
in Emerging Electronic Packaging 1996;17:39.[14] Jiang H, Hermann R, Plumbridge WJ. J Mater Sci 1996;31:6455.[15] Coffin LF. ASME Trans 1954;76:931.[16] Manson SS. Exp Mech 1965;5:193.[17] Solomon HD. ASTM-STP 1988;942:342.[18] Engberg G, Larsson LE, Nylen M, Steen H. Brazing and Solder-
ing 1986;11:62.[19] Vaynman S, Fine ME, Jeannotte DA. Metall Trans
1988;19A:1051.[20] Guo Z, Conrad H. J Electron Packag 1993;115:159.[21] Solomon HD. Brazing and Soldering 1986;11:45.[22] Morrow JD. ASTM-STP 1965;378:45.[23] Coffin LF. ASTM-STP 1973;520:5.[24] Shi XQ, Pang HLJ, Zhou W, Wang ZP. Scripta Mater
1999;41:289.