Embed Size (px)
Citation preview

LOW CYCLE RESPONSE OF
DENTED PIPELINES
SUBJECT TO CYCLIC AXIAL AND BENDING LOADS
By
Mohamad Azadeh
Submitted in partial fulfillment of the requirements
for the degree of Doctor of Philosophy
Dalhousie University
Halifax, Nova Scotia
November 2017
© Copyright by Mohamad Azadeh, 2017

ii
Table of Contents
List of Tables……………………………...……………………………………..……….vi
List of Figures………………...………………………………………………………....vii
Abstract……………………………..………………………………………………….....x
List of Abbreviations and Symbols Used……………………...…...……………xii
Acknowledgements.…………………….………………………………………….......xvi
Chapter 1 Introduction 1
1.1 Background…………………….……………………………….…...……...……1
1.2 Dent as a Form Mechanical Damage………………………………..……...……1
1.3 Research Motivations………………………….…………...…..……………...…2
1.4 Objectives of the Present Work…………………………………………....……..2
1.5 Layout of Thesis……………………...………….....………......……...………….3
Chapter 2 Literature Review 5
2.1 Summary…………………………………...……...……….…..…...…….………5
2.2 Dent Characteristics, Simulation and Fatigue Life…………………........….……6
2.2.1 Dent Terminology in Pipelines………………………….........……..……6
2.2.2 Load-Deflection Curve for Pipe Indentation…………………….........….8
2.2.3 Industry Guidance and Recommendations………………..…………….10
2.2.3.1 Level 1 Method…………...……………………………………11
2.2.3.2 Level 2 Method………………………………………………...12
2.2.3.3 Level 3 Method………………………………………………...16
2.2.4 Finite Element Simulation of a Dent…….………….....…………..……16

iii
2.2.5 Fatigue Life of Pipelines containing Plain Dent………………….…..…18
2.3 Straight Pipe Response to Cyclic Axial and Bending Loads………….…..….…25
2.3.1 Fatigue Ratcheting…………..……………….………………....….....…25
2.3.2 Experimental Investigations - Cyclic Axial Loads…............................…28
2.3.3 Experimental Investigations - Cyclic Bending Loads………...….….….29
2.3.4 Finite Element Simulation………………........................………...….…33
2.3.4.1 Material Model Tuning Efforts…………...…….....…….……34
2.3.4.2 FE Models of Straight Pipelines………...……….…...………36
Chapter 3 An Experimental Study on the Response of Dented Pipes undergoing
Pure Monotonic and Quasi-Static Cyclic Axial Loading 38
3.1 Summary…………………………………...…………….......……………….…38
3.2 Features of Axial Plastic Buckling…………............……………………...……49
3.3 Experiment Layout and Procedures………………………..….……………..…41
3.3.1 Specimen Specifications……………..………..……..……………....….41
3.3.2 Indentation Procedures………………..………...……………………....43
3.3.3 The Cyclic and Monotonic Test Set-up and Procedures…………….......43
3.4 Results and Discussion……………………..…………..……………………….45
3.4.1 Representative Indentation……………………….....…………………..47
3.4.2 Representative Monotonic Loading……………….…...……………….49
3.4.3 Representative Cyclic Loading……………..……………......…………50
3.5 Conclusions……………………………………………..….………….….…...57
Chapter 4 Numerical Analysis of the Response of Dented Pipes Undergoing Pure
Monotonic and Quasi-Static Cyclic Axial Loading 59

iv
4.1 Summary………………………………………..……………………..….....…59
4.2 Material Model………………………………....……………………..……..…60
4.2.1 Theoretical Framework of Cyclic Plasticity………………....…………60
4.2.2 Nonlinear Kinematic Hardening Model...……………..…….…………62
4.2.3 Isotropic Hardening Model…………..……………………..….………65
4.2.4 Nonlinear Kinematic/Isotropic Hardening Model…....………………...66
4.3 Finite Element Modeling Framework…………..………………....……………70
4.3.1 Simulation of the Indention….…………………………….….………..72
4.3.2 Simulation of the Monotonic Loading……..……...………….………..75
4.3.3 Simulation of the Cyclic Loading…...……………………....…………77
4.4 Parametric Studies……………….….………………..……………...…………80
4.4.1 Influence of Indentation Depth……..……………..……….…………...81
4.4.2 Influence of the Cyclic Load Regime………….……………...……….82
4.4.3 Influence of the Mean Stress and Stress Amplitude….……..................84
4.4.4 Influence of the Hardening Model Parameters……..……….................85
4.5 Concluding Remarks…………….….……………………...…………...……...87
Chapter 5 Life Estimation of Dented Pipes undergoing Low Cycles of Large
Reverse Bending Moments 89
5.1 Summary…………..…...……………………………………….……….……..89
5.2 Experiment Layout and Procedures………..…………...……………...............90
5.3 Experimental Set-up………………..…………………..…..…………………..90
5.4 Experimental Results and Discussion…………………...…………..................94
5.5 Curvature versus Number of Cycles to Failure…….…………….…………....100

v
5.6 Ovalization versus Number of Cycles to Failure…………….……………….104
5.7 Concluding Remarks…………………………….……………………………106
Chapter 6 Conclusion 109
5.1 Summary…………………...…………………………………………………109
5.2 Conclusions……………………………………………..…………………….110
5.3 Recommendations for Future Work………………………….……………….111
Bibliography 113

vi
List of Tables
Table 3.1 Material properties obtained by standard tensile tests …………………... 42
Table 3.2 Summary of results from cyclic loading experiments …………..……..... 45
Table 3.3 Summary of specimens’ geometry and indentation results ……………... 48
Table 4.1 Material properties obtained by standard tensile tests ……………………. 70
Table 4.2 Summary of specimens’ geometry and indentation results……………….. 73
Table 4.3 Indentation force and residual dent depth, experiment versus simulation… 75
Table 4.4 Ratcheting strain data for intact tubes under cyclic loading......................... 79
Table 4.5 Cyclic load regime effect for CL12………………...………………..…… 83
Table 4.6 Influence of cyclic axial mean stress and stress amplitude for CL12……... 85
Table 4.7 Effect of different material hardening parameters for CL14-1……………. 86
Table 5.1 Material properties obtained by standard tensile tests ……………………. 94

vii
List of Figures
Figure 2.1 Dimensions of a dent …………….…………...….…………………......... 7
Figure 2.2 Variation of the denting force versus depth of a dent ………………......... 9
Figure 2.3 Geometric parameter of a dent ………………………….……………...... 13
Figure 2.4 Sketch of the apparatus for testing of straight pipe subject to: (a) Axial
loading; (b) Four-point bending; (c) Pure bending …………………….....
27
Figure 3.1 Stress-shortening responses expected in a compression test of a pipe……. 39
Figure 3.2 (a) Carbon steel tube that developed axisymmetric concertina folding; (b)
mode 2 folding (c) mode 3 folding……………………………………….
40
Figure 3.3 Geometry of a typical specimen (Not to scale – all dimensions in mm).... 42
Figure 3.4 Test set up used for generating the indention……………………………... 43
Figure 3.5 The monotonic and cyclic loading test set up……………………………... 44
Figure 3.6 (a) The stress-strain response of a 14% indented pipe tested under
monotonic loading condition; (b) Typical stress-history used in cyclic
testing……………………………………………………………………... 46
Figure 3.7 Denting force versus depth of the dent……………………………………. 49
Figure 3.8 Average stress-strain response of the specimens having three different
indentation depths, tested under monotonic loading……………………....
50
Figure 3.9 Average stress–strain response of specimen CL14-1……………………... 51
Figure 3.10 Peak average axial strain versus number of cycles for specimen CL14-1... 52
Figure 3.11 Variation in the half gauge-length profile of specimen CL14-1………….. 53
Figure 3.12 Gauge length’s profile (a) immediately after denting (b) after the
application of the initial strain (c) at the collapsed stage………………….
54
Figure 3.13 Variation of the peak average axial strain as a function of applied loading
cycles for specimens with three different indentation depths……………..
55
viii
Figure 3.14 Influence of the applied load amplitude (σa) on the peak axial strain as a
function of applied loading cycles for the specimens with 14% indentation
depth……………………………………………………………………… 56
Figure 4.1 Kinematic versus isotropic hardening model…………………………….. 62
Figure 4.2 Material properties of API 5L-B to calibrate the hardening parameters….. 68
Figure 4.3 Parts’ orientation and mesh configuration of the 3D finite element model.. 71
Figure 4.4 FE simulation of the indentation process (a) during, and (b) after indenter
removed…………………………………………………………………...
73
Figure 4.5 Variation of the denting force versus depth of dent……………………….. 74
Figure 4.6 Comparison of the simulation and experiment results for the monotonic
loading…………………………………………………………………….
76
Figure 4.7 Deformed shapes of a typical indented pipe subjected to monotonic axial
load at specific axial strain values (left) the numerical simulation results
at 4% strain; (right) experiment at 3.8% strain……………………………. 77
Figure 4.8 Plot of the average peak axial strain versus number of cycles…………….. 78
Figure 4.9 Effect of indentation depth on ratcheting response of dented pipes………. 82
Figure 4.10 Effect of loading regime on ratcheting response of dented pipes…………. 83
Figure 5.1 Test set up for ovalization measurement under cyclic four-point bending
load – the dent is located on the upper surface…………………………….
91
Figure 5.2 Longitudinal deformation developed between the two ends of the pipe
under pure bending………………………………………………………..
93
Figure 5.3 Variations in cross-section ovalization versus number of cycles of a pipe
with δ Do⁄ = 20% subjected to curvature controlled (κc/κo= 0.3088)…..
95
Figure 5.4 Moment-curvature hystereses of the curvature controlled κc κo⁄ = 0.3005)
experiments for pipes with δ/Do of (a) 12.5%, (b) 15%, (c) 17.5%, and (d)
20%........................................................................................................ 97
Figure 5.5 Variation in cross-section ovalization of pipes subjected to curvature
controlled (κc κo⁄ = 0.3005) loading scenario with δ/Do of (a) 12.5%, (b)
15%, (c) 17.5%, and (d) 20%....................................................................... 98

ix
Figure 5.6 Plot of cross-section ovalization, ∆D0 − ∆D0,initial D0⁄ , versus number of
loading cycles, N, for pipes with δ Do⁄ of (a) 12.5%, (b) 15%, (c) 17.5%,
and (d) 20%................................................................................................. 99
Figure 5.7 Variation of cross-section ovalization versus curvature for pipes tested
under curvature controlled ( κc κo⁄ = 0.3005) loading…………………….
101
Figure 5.8 Variation of cross-section ovalization as a function of number of applied
loading cycles for pipes tested under curvature controlled (κc/κo= 0.3005)
loading…………………………………………………………................. 102
Figure 5.9 Variation of material parameter A as a function of (δ Do⁄ ) ratio………….. 103
Figure 5.10 Final shapes of the pipes tested under symmetric cyclic bending loads…... 103
Figure 5.11 Variation of the material parameter B as a function of (δ Do⁄ )…………… 105
Figure 5.12 Comparison of the results obtained using the proposed equation and the
experimental data for pipes with δ Do⁄ of (a) 12.5%, (b) 15%, (c) 17.5%,
and (d) 20%.................................................................................................. 106

x
Abstract
In the present thesis, the ratcheting and low cycle fatigue responses of dented pipes
undergoing quasi-static cyclic loads are investigated through a series of experiments
conducted on small-scale pipe samples, and performing detailed nonlinear FE analysis. The
investigation addresses the response, and in-service life estimation of dented pipes
undergoing inelastic cycles of axial and bending loads.
Development of ratcheting strain in small-scale dented steel pipes subject to cyclic
axial loads is investigated experimentally. It is observed that regardless of the nature of the
applied loads, collapse of pipes loaded monotonically or cyclically would essentially occur
at the same average strain level. The experimental results reveal that larger dent depths
significantly affect the total number of cycles to failure; the number of cycles prior to
collapse dramatically decreases by as much as 75% when the dent depth was increased by
2%.
Moreover, a nonlinear FEA framework is developed as an alternative and feasible
approach for testing load-bearing capacity of dented pipes under cyclic axial loads. A set
of parametric FE analyses is performed to investigate the influence of mean stress, stress
amplitude, loading regime and hardening-related parameters. It is concluded that the
application of larger stress amplitudes (while maintaining the same maximum stress)
contributed to pipes earlier failure in comparison to the condition when pipes were
subjected to a higher mean stress. It is also observed that the combined non-linear
kinematic/isotropic hardening model is extremely sensitive to the material parameters used
in describing the model.
xi
Finally, the influence of dent depth on the evolution of pipe cross-section ovalization
under a low number of curvature-controlled symmetric bending loads is investigated. Two
empirical equations are proposed to estimate the remaining in-service life of dented pipes.
The first equation estimates the number of cycles causing the local instability of pipe’s
cross-section and consequently, initiation of fatigue cracks. The second equation predicts
the variation of ovalization as a function of the applied loading cycles.

xii
List of Abbreviations and Symbols Used
Abbreviations
AF Armstrong Frederick
AGA American Gas Association
API American Petroleum Institute
ASME American Society of Mechanical Engineers
BS British Standards
BKH bilinear kinematic hardening
CANMET Canada Centre for Mineral and Energy Technology
CL cyclically loaded
CSA Canadian Standards Association
DAQ data acquisition
DNA Det Norske Veritas
EPRG European Pipeline Research Group
FE finite element
FEA finite element analysis
LVDT linear variable differential transformer
MKIN multi-linear kinematic hardening
ML monotonically loaded
PDAM Pipeline Defect Assessment Manual
PRCI Pipeline Research Council International
SMYS specified minimum yield strength
UTS ultimate tensile strength

xiii
Romans
a back-stress tensor
b isotropic hardening material property
C initial kinematic hardening modulus
d𝐚 incremental back-stress tensor
d dent depth
D, Do pipe outside diameter
∆Do change in pipe outside diameter
∆Do,initial permanent change of pipe outside diameter after indentation
E modulus of elasticity
f yield function for time independent plasticity in Equation (4.8)
Fmax maximum indentation force
H plastic modulus
h hardening modulus
J2 von Mises distance in the deviatoric stress space
k initial size of yield surface
L axial pipe gauge length
M applied bending load to pipe
M0 reference bending load of pipe
MP0.2 0.2% curvature offset plastic bending load
N number of loading cycles
Nf number of loading cycles at failure
𝐧 normal matrix to yield surface

xiv
Q isotropic hardening material property
Ro radius of curvature of intact pipe surface subject to bending
R1 external surface radii of curvature in the transverse planes through the dent
(see Figure 2.3)
R2 external surface radii of curvature in the longitudinal planes through the
dent (see Figure 2.3)
Sm minimum of 2/3 of yield strength or 1/3 of ultimate strength of material
t pipe wall thickness
𝐗 back-stress tensor
𝐗′ deviatoric back-stress tensor
X0 initial value back stress
Y radius of yield surface
Greeks
ε1 bending strain in circumferential direction
ε2 bending strain in longitudinal direction
ε3 membrane strain in longitudinal direction
εi critical strain acting on the inside pipe surfaces
εo critical strain acting on the outside pipe surfaces
ε̅C average critical axial strain
ε̅L average limit axial strain
ε̅x,initial applied initial average limit axial strain
εp0 initial value of the plastic strain

xv
σo 0.2% strain offset yield stress
σx.max maximum axial stress
σm mean axial stress
σa axial stress amplitude
σy yield stress
𝛔 Stress tensor
𝛔𝐝𝐞𝐯, 𝛔′ deviatoric stress tensor
δ initial dent depth
δresidual dent depth after rebound
δx average axial strain
δxp average peak axial strain
δij Kronecker’s delta
ρ radius of curvature
κo reference curvature of pipe
κ𝑐 applied curvature to pipe
d𝛜𝐞 incremental elastic strain tensor
d𝛜𝐩 incremental plastic strain tensor
dεije elastic strain incremental component
d𝛔𝐝𝐞𝐯 incremental deviatoric stress tensor
λ, μ Lamè constants
γ rate of kinematic hardening decrease

xvi
Acknowledgements
First of all, I would like to thank my parents and my beloved brother. I cannot imagine
having been able to finish my studies, without their unreserved love and encouragement.
I would also like to express my deepest gratitude to Dr. Farid Taheri. His wise,
professional, and patient supervision enabled me to liberally pursue my research interests.
Without his guidance and constant support in every aspect, attainment of this degree would
have been impossible. I also like to thank my committee members, Dr. Gordon Fenton and
Dr. Shawn Kenny.
My thanks also go to all my friends and colleagues at Dalhousie University, especially
Nikzad Nourpanah, Morteza Mehrzadi, Shiva Eslami, Babak Ahamadi, Zohreh Asaee and
David De Cicco. I cherish all the good times and beautiful memories.
I am very thankful to the skillful technicians of our department, Misters Brian Kennedy,
Blair Nickerson and Jesse Keane for their assistance and technical support throughout my
experimental works.
Last but not least, my sincere gratitude goes to all the people who shared parts of their
life story with me that helped to shape, hopefully, a more realistic view of our human
nature.

1
Chapter 1
Introduction
1.1 Background
Oil and gas transmission pipelines have had a reasonably good safety record (Hill, 1991).
This is due to a combination of good design practice, use of more refined materials, and
controlled operating practices. However, like any engineering structure, pipelines do
occasionally fail. The most common causes of damage causing failure in onshore and
offshore oil and gas transmission pipelines in the Western Europe and North America are
mechanical damage and corrosion.
1.2 Dent as a Form of Mechanical Damage
Damage in the form of dents is of one the most common forms of pipeline mechanical
damage (Cosham and Hopkins, 2002), which in turn may lead to loss of integrity, affect
the load-bearing capacity and operating life of the pipeline. Mechanical damage can also
cause changes to the geometry of the pipeline’s cross section, and wall thickness, and
causes local changes in material properties. Dents in pipelines are usually defined as a
change in pipe curvature, but without reduction in wall thickness. This type of mechanical
damage causes gross distortion of pipe’s cross-section, and can occur due to impact by
excavation equipment, or by any other heavy objects hitting them during their
transportation, installation and trenching, and in service.
During operation, oil and gas pipelines undergo cyclic loadings caused by repetitive
start-up/shutdown, fluid pressure fluctuation, temperature changes, seismic loads and in

2
the case of offshore pipelines, by the action of currents. Due to the common exposure of
oil and gas pipelines to the mentioned operational loads, cyclic response of pipeline
becomes an important concern, especially in dented pipelines. The life assessment of
dented pipelines under cyclic loads can avoid overly conservative assessments and
unnecessary maintenance. The increased knowledge with respect to performance of dented
pipes would prevent unnecessary replacement costs, thus saving money without causing
catastrophic failure and environmental damage.
1.3 Research Motivations
The experimental and numerical background to the effect of dent undergoing monotonic
and cyclic pressure is well understood and documented. The current codes, such as CSA
Z662 (CSA, 2015) and ASME B31.4 (ASME, 2012) recognize the work undertaken to
date, in that dents are allowed to remain in service, provided they satisfy certain criteria.
However, the same does not hold true for pipelines undergoing low cycles of axial and
bending loads. Life assessment of dented pipelines under such cyclic loads is still a young
and evolving subject, with several unexplained issues and unanswered questions.
1.4 Objectives of the Present Work
The main objective of the thesis is to understand and analyze the performance of pipelines
containing dents, subjected to cyclic axial and bending loads via experimental and
numerical investigations. The research also examines the remaining life of oil and gas
dented pipelines subjected to repeated loading by investigating the number of cycles to
failure. When applicable (i.e. under cyclic bending loads), the thesis will also discuss the
development of ovalization in the dented region during the loading and provide the details

3
of an empirical relationship developed to relate the number of applied loadings cycles
causing failure, as a function of dent depths.
Moreover, a FEA framework is presented as an alternative and feasible approach for
testing load-bearing capacity of dented pipes under cyclic axial loads. Throughout the
thesis, all the finite element analyses (FEA) are performed using ABAQUS software
package.
1.5 Layout of Thesis
This thesis is structured within six chapters, including the present one. Three of the chapters
(Chapters 3 to 5) are the main body of original research articles that resulted from the work
carried out, and are published in peer-reviewed journals (Azadeh and Taheri, 2014, 2015,
2016).
The second chapter of the thesis presents a thorough literature review of the subject,
structured in two sections. The effect of a dent on load-bearing capacity of pipelines is
introduced in the first part of the literature review. Subsequently, the relevant experimental
and numerical investigations related to straight pipes, subjected to cyclic axial and bending
loads are reviewed.
In chapter 3, development of the ratcheting strain in a small-scale dented steel pipe
subject to cyclic axial loads is investigated experimentally, and its life cycle is traced. In
this part of the investigation, the pipes’ dents were formed by a cylindrical indenter. The
work also investigates the effect of applied mean stress and stress amplitude on ratcheting.
Chapter 4 builds on the FEA framework of the previous chapter and presents a
comprehensive parametric study on various features of a dented pipeline. In this chapter, a
nonlinear finite element framework is developed to simulate the low cycle fatigue response

4
of dented pipes undergoing monotonic and cyclic axial loads. A combined non-linear
isotropic/kinematic hardening material model is utilized to capture the cyclic response of
the dented pipes.
In chapter 5, the influence of dent depth on the evolution of pipe cross-section
ovalization under a low number of curvature-controlled symmetric bending is investigated.
Moreover, two empirical formulas are proposed to estimate the remaining in-service life
of dented pipes. The first formula estimates the number of cycles causing the local
instability of pipe’s cross-section and consequently, initiation of fatigue cracks. The second
equation predicts the growth of ovalization as a function of the applied loading cycles.
The main conclusions drawn from the present research are summarized and outlined in
chapter 6 of this thesis, along with some recommendations for future research in this field.

5
Chapter 2
Literature Review
2.1 Summary
In this chapter, a review of the literature is conducted to study how the current guidelines
and previous research works address the significance of a dent in pipelines performance. It
is found that the dent depth (measured as a percentage of outer diameter of the pipe) is
most commonly used by different codes, standards, and manuals for determining the
severity of a dent. A majority of the research works on the subject of pipeline containing
a dent has been conducted to establish the pipeline’s burst strength and fatigue life.
However, investigation of fatigue life of the dent was limited to studies that considered
cycles of internal pressure. To maintain and improve safety record of pipelines, emphasis
is being placed on the significance of a dent and its influence on fatigue life of pipes that
are subjected to low cycles of axial and bending loads.
Over the past 50 years, research associated with dents in pipelines have included full-
scale pipe testing programs, laboratory testing of pipe ring samples containing dents, and
finite element analysis based studies. The goal of the efforts has been to provide the
necessary knowledge and background to allow for the development of guidelines for
determining what dents levels could be left in service, and which ones should be removed
to ensure the continued safe operation of the pipeline.
The works cited in the following review are organized in two sections. The first section
introduces the fundamentals of dents as a mechanical damage. Then, state-of-the-art
methodologies of indentation simulation and also recommendations in code of practices

6
are reviewed. A brief review of the historical dented pipeline research is also presented.
This section, finally addresses literature related to the effect of dents on pipes response in
terms of both the burst pressure and the fatigue life of the pipeline.
In the second section, the fatigue ratcheting phenomenon is introduced and a brief
literature review on the evolution of material models that have been developed for plastic
strain accumulation is presented. Available literature covering the subject of straight
pipelines undergoing cyclic axial and bending loads is also reviewed. The chapter will be
concluded with review of the works that describe methodologies that have been developed
for finite element simulation of straight pipes under such loading scenarios and discussion
of their results.
2.2 Dent Characteristics, Simulation and Fatigue Life
The following section summarizes a variety of articles, which examine the effect of a dent
on pipeline integrity. The terminologies that are commonly used to characterize a dent are
noted, followed by the main body of works regarding FEA simulation of indentation. The
focus of this section is on reporting studies that investigate the fatigue life of dented
pipelines. It should be noted that in such studies, the pipes would be subjected to cyclic
pressures, which would ultimately cause pipe’s failure.
2.2.1 Dent Terminology in Pipelines
A dent in pipes is identified as a gross disturbance of the cross-section of the pipe, caused
by the impact or forcing of a foreign body, resulting in plastic deformation of the pipe wall.
A dent can be categorized as:

7
• Smooth or Plain Dent: A dent, which causes a smooth change in the cross-section
of the pipe, does not contain a stress concentrator or wall thinning, and does not
change the curvature of an adjacent girth or seam welds.
• Unconstrained Dent: A dent that is free to rebound elastically (spring- back) when
the indenter is removed, and is free to re-bound as the internal pressure varies.
• Constrained Dent: A dent that is not free to re-bound, because the indenter is not
removed. A rock induced dent is an example of a constrained dent.
• Complex Dent: Any dent with a gouge, groove, scratch, stress riser, or other
secondary defect, or a dent that affects the curvature of a nearby weld.
The depth of a dent is defined by the depth which results in the maximum reduction of pipe
diameter, as identified by “H” in Figure 2.1.
Figure 2.1 Dimensions of a dent (Hopkins and Leis, 2003)

8
The depth of a dent depends on the force caused by the indenting object, the diameter
and wall thickness of the pipe, internal pressure, material properties, and any constraint in
pipe’s deformation. Pipes of larger diameter and lower wall thickness deform more
elastically under an applied force. However, if the pipeline is constrained by stiff soil, then
the damage may be greater.
Clearly, a pipe with lower yield strength will plastically deform sooner under an applied
force. If a pipeline is internally pressurized during the damage process, then the effective
stiffening will act against the applied force and possibly reduce dent depth. These
parameters affect the resulting depth of indent and, thus affecting, the pipeline’s structural
integrity.
2.2.2 Load-Deflection Curve for Pipe Indentation
Figure 2.2 shows a typical load-deflection curve during and after denting an unpressurized
pipe by an excavator. The deformation can be characterized by six phases, as follows:
Phase I. When the radial load is first applied, pipe deforms linearly up to the point of
first yield. Yielding initially occurs under the corners of the excavator tooth,
in location of contact with pipe wall surface only.
Phase II. As indentation continues, yielding extends through wall thickness of the pipe.
As it might be expected, there would be no great deal of variation between
this region and the fully elastic region that precedes it. At the end of this
phase, the pipe wall would have reached its plastic capacity in the
longitudinal direction.
Phase III. The onset of plastic straining in the circumferential direction marks a major
reduction in the stiffness of the pipe. The plastic capacity is consumed

9
rapidly in the circumferential direction, resulting in a plateau type region
in the load deflection curve.
Phase IV. As the deflection of the pipe becomes larger, membrane straining starts to
dominate the response, resulting in an apparent increase in stiffness. Plastic
membrane yielding occurs in a broad region, extending in the longitudinal
direction only. Strain hardening begins to have an effect during this phase.
Phase V. Unloading of the excavator tooth results initially in elastic recovery of the
dent. The slope of the load-deflection curve in this region matches that of
phase I.
Phase VI. When the indenter load is lowered, the dented region tends to re-round
elastically. The reversal of plastic straining occurs principally in the
circumferential direction.
Figure 2.2 Variation of the denting force versus depth of a dent (Brooker, 2004)

10
2.2.3 Industry Guidance and Recommendations
Three levels of analysis can be identified in the current industry guidelines and
recommendations, categorized based on the level of analytical complexity and the amount
of supporting information necessary for the assessment:
• Level 1: This level is an acceptance/rejection criterion that is linked to
characterization of the damage and a simple severity parameter such as damage
depth. It is based on linear elastic fracture mechanics.
• Level 2: This level is a screening assessment that ranks damage severity; for
example, those based on estimated strains calculated from local radii of curvature
and those incorporating geometric parameters (D and t), material parameters
(SMYS, UTS) and/or operational parameters (pressure, load cycling duty). This
level is based on the R-curve and is used when failure is likely to occur. This level
considers the effect of plasticity.
• Level 3: This level is a fitness-for-purpose engineering critical assessment that
uses specified or actual material properties, finite element modeling, and fracture
mechanics to predict pressure and/or remaining life of the damaged pipe. It is
based on the J-integral, which accounts for crack arrest.
2.2.3.1 Level 1 Method (Depth Only)
The work reviewed by Fowler et al. (1994) and that undertaken by Rosenfeld et al. (2002)
forms the basis of many of the recommendations and guidelines adopted by ASME B31.8
(ASME, 2012) and API 1156 (2000). The guidance is based on allowable dent depth, or an
estimated dent strain that takes into account the dent profile and wall thickness. Plain dents
or dents with metal-loss corrosion are characterized by a six percent depth or strain safety

11
threshold below which they are not considered to be at risk of bursting or delayed failure,
providing that the pipeline does not experience unusually severe pressure cycling. The
depth threshold for dents on girth or the weld in not compromised. The depth threshold for
dents that have undergone grind repairs (to remove shallow gouges and/or surface
cracking), is four percent.
The Canadian Standard CSA-Z662 (CSA, 2015) states that “the following dents are
considered to be defects that impact pipeline integrity unless determined by an engineering
assessment to be acceptable:
• Dents that contain stress concentrators (gouges, grooves, arc burns, or cracks).
• Dents that are located on the pipe body and exceed a depth of 6 mm and 101.6
mm in Do or smaller than 6% of the outside diameter in pipes that are larger than
101.6 mm Do.
• Dents that are located on a mill or field weld and exceed a depth of 6 mm in pipe
323.9 mm Do or smaller or 2% of the outside diameter in pipe larger than 323.9
mm Do.
• Dents that contain corroded areas with a depth greater than 40% of the nominal
wall thickness of the pipe.
• Dents that contain corroded areas having depth of greater than 10 percent and up
40% of the nominal wall thickness of the pipe corrosion, and a depth and length
that exceed the maximum allowable longitudinal extent determined in accordance
with ASME B31G.
The European Pipeline Research Group (EPRG) (Bood et al., 1999) has developed a
series of rule-of-thumb methods for determining the burst and fatigue failure of various

12
types of damage. EPRG concludes that plain and smooth dents up to seven percent depth
(measured in pressurized pipe) will not fail at pressures up to 72% of SMYS. The guidance
is applicable to pipes with 168-190 mm (6 to 7.5 inches) diameter and 5.6-12.7 mm (0.22
to 0.50 inches) wall thickness.
2.2.3.2 Level 2 Method
Recent editions of ASME B31.8 contain guidelines on assessing strain fields around dents.
Acceptance is established by comparing an estimated strain with a suitable strain criterion
(Equations 2.1 to 2.5). ASME has adopted six percent depth ratio as the acceptance
criterion for plain dents, and four percent for dents at welds. The approach allows a more
meaningful estimation of dent severity than dent depth alone.
According to the ASME B31.8 the estimation of the total critical strain in a dent
requires the following strain components.
• Bending strain in circumferential direction, ε1.
• Bending strain in longitudinal direction, ε2.
• Membrane strain in longitudinal direction, ε3.
The strain components are then combined by assuming that each of the components
occurs coincidently at the dent apex (Noronha et al., 2010). The equations for calculation
of different strain components are as follows.
ε1 = (t
2) (
1
Ro−
1
R1) (2.1)
ε2 = − (t
2) (
1
R2) (2.2)

13
ε3 =1
2(
d
L)
2
(2.3)
where, Ro is the radius of curvature of intact pipe surface (half the nominal pipe outside
diameter) and t, d, L correspond to the wall thickness, dent depth and dent length in
longitudinal direction, respectively. R1 and R2 are the external surface radii of curvature in
the transverse and longitudinal planes through the dent, respectively (Figure 2.3).
Figure 2.3 Geometric parameter of a dent (ASME B31-8, 2012)
All the strain components are combined according to the following equations to
calculate the critical strain acting on the inside and outside pipe surfaces. These are εi and
εo, respectively.
εi = √ε12 − ε1(ε2 + ε3) + (ε2 + ε3)2 (2.4)
εo = √ε12 + ε1(−ε2 + ε3) + (−ε2 + ε3)2
(2.5)
The dent is considered acceptable when the larger of the values εi and εo is lower than
the allowable strain limits, which is taken as 6%. It should be noted that ASME B31-8
assumes that the membrane strain in the circumferential direction is negligible. It is,

14
presuming that this 6% limit is recommended to ensure safety of a dent under static and
cyclic fatigue loads.
To determine the burst pressure of dents and gouges, the European Pipeline Research
Group (EPRG) (Bood et al., 1999) has developed a best-correlation model that equates the
failure pressure of a pipe to a function that includes the pipe material strength and
toughness and geometry, and its dent or gouge depth. To overcome the complexity of the
model, a series of diagrammatic methods has been developed linking defect depth, wall
thickness, and operating pressure.
EPRG has also developed a set of guidelines that incorporates an additional factor of
safety to simplify application of the equation. The approach is applicable to dents and
gouges up to 10% deep in pipes with 168-1220 mm (6 to 48 inches) diameter and 3-18.6
mm (0.11 to 0.73 inches) wall thickness.
In the early 2000s, a need for “usable guidelines” for the assessment of damaged pipes
persuaded 15 oil and gas companies to sponsor a project to produce the pipeline defect
assessment manual. In this manual, Cosham and Hopkins (2002) performed a
comprehensive study on the Pipeline Defect Assessment Manual (PDAM) to provide
guidance to pipeline operators as to the best methods available to assess failure of pipeline
defects that included corrosion, gouges, dents, cracks, weld defects, and combinations of
these. In this manual, they compared the various ASME, API, BS and EPRG
recommendations and selected what they consider to be the best Level 1 and Level 2
methods for assessing pipe burst conditions. To analyze plain dents (Level 1), they
recommended simple empirical thresholds proposed by Rosenfeld et al. (2002), EPRG
(Bood et al., 1999) and Fowler et al. (1994). However, it should be noted that Cosham and

15
Hopkins (2002) allowed a higher depth threshold (i.e., 10%), irrespective of whether the
depth is measured with or without internal pressure. In summary, however, they conclude
that there are no reliable methods for predicting the burst strength of dents at welds or at
kinks. Moreover, to assess the influence of combined dents and gouges, they recommend
using the Dent Fracture Model, but with incorporation of an appropriate correction factor,
so that model’s uncertainty could be accounted for.
The Pipeline Defect Assessment Manual (PDAM) also contains recommendations for
assessing the fatigue life of dents and gouges. To analyze plain dents, Cosham and Hopkins
(2002) recommend use of the original EPRG plain dent fatigue model, but including a
modification that would account for uncertainty. Moreover, they suggested use of the most
applicable EPRG dent-gouge fatigue models to evaluate combined dents and gouges. They
also acknowledged that the results revealed considerable scatter, and that a correction
factor must be applied to account for the significant influence of uncertainty.
According to DNV-OS-F101 (DNV-OS-F101, 2013), for dents without notches and
sharp bottom gouges, the length in any direction should be less than or equal to 0.5D, where
D is the nominal diameter of the pipe. The depth shall not exceed 6.4 mm.
2.2.3.3 Level 3 Methods
Engineering critical analysis, or fitness-for-purpose assessments, are explicitly included in
the Canadian Standard CSA-Z662 (CSA, 2015) as an alternative to Level 1 or Level 2
assessment methods. Other standards and guidance are less explicit, but in several
instances, they recommend seeking expert advice if such an approach is contemplated.
Engineering critical analysis of mechanical damage usually includes as much detail as
is available concerning the geometry of the pipe, the character and geometry of the damage,

16
the relevant material properties, and pipeline operating conditions. The analysis likely will
also be based on the most-recent versions of the Level 2 methods, customized if necessary
to suit the specific situation.
There are no formal standards for conducting an engineering critical analysis.
Regulatory authorities require the operator to demonstrate that satisfactory analysis has
been undertaken in accordance with the prevailing best engineering practice.
2.2.4 Finite Element Simulation of a Dent
Numerical studies of deformation and re-rounding behavior of dent in pipes commenced
in the 1980s. The nonlinear deformation model predictions were compared against
experimental data, showing generally good agreement (Lancaster and Palmer, 1996). The
results were used to model the relationship between the initial and residual dent depths and
to study residual strains near the dent. Similar analyses indicated that strains and
deformation characteristics are determined by the shape of the indenter, the way the
indenter is applied, and the material properties of the pipe (Cosham et al., 2004). The
resulting strain distribution also depends on the strain hardening of the pipe and on the
friction forces between the pipe and the indenter.
Fowler et al. (1992) undertook finite element analyses to study the fatigue response of
offshore pipelines, hosting plain dents, under cyclic pressure. They used an elastic-plastic
material model, discretizing half-symmetry of the geometry with 3-D shell elements, and
rigid element was used for modeling the indenter. A longitudinal wedge-shaped denting
tool was used to create a dent on 12ʺ diameter steel pipes, with dent depths ranging between
5% - 20% of the pipe’s diameter. The models were loaded using the same sequence as the

17
experimental tests and then fatigued to failure. These results were used to develop dent
stress concentration factors that could later be used to predict the life of a dented pipe.
Leis et al. (1998) investigated the effect of dents on a pressurized pipe with a quarter
model using 8-noded shell elements. The indenter and pipe supports were modelled as rigid
bodies. Additional analysis using a shell-to-solid approach was also conducted. This
analysis involved 20-node solid brick elements, which were used to model the indented
region, while shell elements were used to model the region away from the dented area. The
results obtained from the FE analysis in terms of a load displacement curve were reasonable
when compared against experimental data.
The investigation of the effect of localized geometric imperfections on the stress
response of pipelines was carried out by Rinehart (2004). The work covers a wide range of
topics including 3D finite element analysis and 2D elastic semi-analytical analysis of
dented cylindrical shells for a wide variety of dent shapes, with the aim of estimating stress
concentration factors associated with dent shapes.
An experimental and numerical study on pipes having dents and gouges was carried
out by Błachut and Iflefel (2008). A set of experiments were carefully designed to stablish
a reliable reference for further numerical investigations. They reported the best practice
available in the literature regarding FE simulation of indentation. They investigated the
main factors dominating the response of pressurized dented pipes subjected to monotonic
bending, including the change in length, width and shape of the dent, and contact
mechanisms related issues between the indenter and pipe’s surface and that between the
pipe and its supports. The developed FE model accurately simulated the experimental load-
deflection curve. However, due to the large strains developed in simulation of bending

18
effect, the accuracy of the results was not comparable with the results obtained from
indentation simulation.
Hyde et al. (2009) investigated long radial indenting of pressurized pipes by finite
element analysis and analytical methods. Several scenarios were considered such as
different pressure levels, different support conditions, different material properties and
different geometry of the pipes.
2.2.5 Fatigue Life of Pipelines containing Plain Dent
One of the earlier papers on dented pipelines was presented by Kiefner (1969) at the 4th
American Gas Association Symposium on Pipeline Research. This paper summarized the
results from the Fracture Initiation phase of the NG-18 research committee. It goes through
a general description of how defects resulted in leaks and/or rupture, and presents a
relationship between flaw size and failure stress. Strain gauge readings during
pressurization indicated that “the principal effect of plain dents is to introduce highly
localized longitudinal and circumferential bending stresses in the pipe wall”. It is also
mentioned that “without a sharp stress concentrator in the dent, yielding occurs over large
enough areas that no high stress gradients are present”.
In a paper summarizing pipeline failures spanning a period of 20 years, Eiber (1979)
noted that failures in the base metal of pipelines were usually associated with a gouge or a
dent. It was noted that there was typically a cold worked region at the base of the dent that
had shallow surface cracks in the gouge and dent features examined. The internal pressure
would attempt to re-round the pipe to its original shape, but this in turn resulted in cyclic
bending stresses in the deformed region. The presence of a crack and cyclic stresses could
lead to fatigue crack growth and failure of the pipeline. Eiber suggested that it was
19
impossible to estimate the severity of mechanical damage defects on the appearance alone.
The author noted that dents often contained some levels of mechanical damage from which
a failure would be initiated.
In the early 1980s, CANMET began a systematic series of studies to examine the
behavior of dents under typical pipeline loading conditions. The first report included eight
tests, where four different round indenters were used to hydraulically form plain dents to a
depth of 6% of the pipe Do (Wang and Smith, 1982). In the experiments, the dents either
simulated construction damage (i.e. dented and then hydrostatically tested), or in-service
damage (i.e. formed after the hydrotest and then fatigue tested up to 12000 cycles at
pressures corresponding to the hoop stress as high as 80% SMYS). Cracks were observed
in only one specimen, near the ends of a long dent, where re-rounding was restricted; a
repeat of the test failed to produce cracks. No cracking was observed in any of the other
tests, either.
CSA conducted a study on experimental works and Nova’s operational experience to
review the current guidelines regarding plain dents and dents with gouges. The data
included dents with welds and dents with gouges, using some of the work completed at the
British Gas (Jones, 1982). It was determined that plain dents up to 10% of the Do in depth
could remain in service without an adverse effect on pipeline integrity, and it was
recommended that the 6% criterion be adopted for plain dents in gas pipelines.
A study sponsored by the United States Department of Transportation by Keating and
Hoffman (1997) involved experimental investigation and finite element modeling of dents
in pipelines. Damage included dents due to rocks, dents formed with backhoe teeth, and
short longitudinal dents with gouges. The investigation included the effect of dent restraints

20
and their rebound behavior. Their review of existing data included a study by Urednicek
(1986) on a pipe that was statically pressurized to failure. The author concluded that:
• The fatigue behavior of long, plain dents had been adequately studied
experimentally by AGA.
• Short dents and dents that were restrained against elastic rebound needed to be
further studied.
• Dent residual stresses were influenced by the denting process and the elastic-
plastic dent rebound.
• Dent stiffness, which influences the denting process and rebound behavior, was
a three-dimensional phenomenon, and 2-D modeling could not accurately
represent dent’s behavior.
In the early 1990s, Stress Engineering Services undertook several studies of dented
pipes for the American Gas Association (Fowler et al., 1994). The results showed that
neither the dent type, nor the dent length was important in terms of reducing the fatigue
life, but the dent depth, D/t ratio, and weld type were influencing factors. In order to
produce a dent with a given final depth, it was necessary to indent the pipes to about twice
the desired depth. Their studies indicated that smooth dents less than 5% of the pipe Do
should not pose a significant threat to the integrity of a pipeline, unless it is subjected to
severe pressure cycling.
Rosenfeld (1997) and Rosenfeld et al. (1997) completed studies for the American Gas
Association to develop a theoretical model to describe the re-rounding of a dent in
pressurized pipes. The dent was assumed to be long, so that only the cross-sectional shape
needed to be considered, and the analysis used a cyclic flow strength to account for the
21
Baushinger effect and strain hardening. The mechanics of dent re-rounding were described
to show that it takes several cycles of pressure for the dent to become completely re-
rounded. Other equations were presented to calculate the rebounded dent depth using the
pipe dimensions, initial dent depth, width of the dent at half of the maximum dent depth,
and pressure in the pipe. Formulas for calculating the bending strains at the apex of the
dent and the re-rounded dent width were provided and were used to determine the fatigue
life of the dents, based on the number of cycles for fatigue crack initiation. One of the
primary reasons for undertaking this study was the general feeling that fatigue life may be
a more rational basis for rating the severity of a dent than the existing criteria that rely
solely on dent depths with a maximum depth of 6% of the pipe diameter. It has been
suggested by Rosenfeld that in some cases, deeper dents might be permitted to remain in
service, while in other cases, shallower dents should be repaired.
A study, examining the effects of dents and mechanical damage on pipeline integrity,
was carried out by Stress Engineering Services under the API sponsorship (Alexander and
Kiefner, 1997). The first of the two reports summarizes the results of tests completed on
NPS 12 pipes, with a few tests using NPS 24 and NPS 32 pipes. The results are
comprehensive in that they include the indented shapes of the pipe, the total number of
cycles to failure in fatigue tests, and details of any cracks in each of the tests. Overall, API
1156 looked at several variables, which included dent depth, indenter type, pipe diameter,
pipe wall thickness, smooth and sharp dents, both constrained and unconstrained, stress
concentrations (corrosion, weld seams, and girth welds), and the effect of hydrostatic
testing. Most dents were made without the pipe being pressurized; some tests were made

22
with pressurized pipe, others were tested straight to failure by puncturing, and the
remainder were fatigue tested. The main findings included the following:
• The pressure carrying capacity of the pipe was not affected by smooth dents
without stress concentrators.
• The dents re-rounded elastically up to 67% of the maximum depth upon removing
the indenter, and re-rounded up to 88% upon pressurization to 65% SMYS.
• For unconstrained smooth dents, the fatigue life was shorter for deeper dents.
• Minor stress concentrators, such as girth welds, reduced the fatigue life
somewhat.
• Partially overlapping smooth dents exhibited shorter fatigue lives than individual
dents.
• Hydrostatic testing had a beneficial effect on fatigue life due to re-rounding of
the dent.
• Smooth dents failed by leaks in all cases; the dents were oriented longitudinally,
and initiated on the Do surface. In most cases the cracks were located on the
sloping transition on the pipe-dent interface region. For constrained dents, the
leaks were oriented transversely to the pipe’s axis, and had initiated on the pipe
internal surfaces. All failures were ductile in nature.
Alexander and Connelly (1998) performed a coherent body of experimental and
analytical work on dented pipes. The tests were carried out on X52 steel grade pipes. The
denting process for all cases was achieved under zero internal pressure. The author used
two types of indenters to generate denting; a dome cap and a long bar. The maximum depth
of the dent to the pipe diameter was 18%. Forty-four different dent configurations were

23
used during the course of testing. While the primary thrust of the work was experimental,
numerical efforts were expended to examine dent mechanics, using first-order quadrilateral
shell elements. Soil stiffness was modelled using spring elements with a trial-and-error
approach. Alexander (1999) also reviewed the existing experimental and numerical data
on dented pipes. The principal aim was to assess defect severity in terms of future behavior
involving both static and cyclic pressure conditions. In his review, the consideration of a
maximum allowable dent size of 10% of the outer diameter was proposed for pipelines
under cyclic internal pressure.
Battelle Memorial Institute reported on the results of the first year of a Pipeline
Research Council International (PRCI) sponsored project (Leis and Francini, 2000),
looking at developing an improved criterion to assist in serviceability decisions for
pipelines with dents and/or gouges. The intent was to extend the concepts of the ductile
flaw growth model that was shown to accurately predict the behavior of axial flaws in
pipelines. The project included experimental examination and validation of influence of
the following parameters: pipeline support conditions, indenter considerations, pressure
stiffening of the pipeline, re-rounding, residual dent size, pipeline grade and the effect of
time and cycle dependent deformation.
A parametric study was carried out by Rinehart and Keating (2002) to quantify the
influence of dents that fall into the transition region between short and long dents. Their
analysis was based on the existing full-scale experimental data and finite element analysis
results. The study showed that the unrestrained longer dents experienced center cracking,
re-rounding, and relatively short fatigue lives. The shorter dents experienced cracking, little

24
re-rounding, and relatively short fatigue lives. Similar finding was also reported by Beller
et al. (1991), who incorporated 3D finite element analysis in their investigation.
Gaz de France investigated damage to pipelines using both experimental and numerical
means (Hertz, 2006). One finite element model was constructed to consider static denting,
and another one was used to address dynamic puncture, and they considered non-
linearities, including large displacements and strains, elastic-plastic material properties,
contact between indenter and pipe, and the rupture process. Details were provided
describing the mesh size selection and failure models, with failure models describing
ductile rupture mechanisms such as softening and cavity growth.
2.3 Straight Pipe Response to Cyclic Axial and Bending Loads
2.3.1 Fatigue Ratcheting
In materials or structures subjected to cyclic stressing with non-zero mean stress, a cyclic
accumulation of the inelastic deformation would occur, if the peak applied stress exceeds
the material’s yield limit. This phenomenon is referred to as ratcheting. Fatigue ratcheting
is a phenomenon that leads to reduction in fatigue life of a structural component by loss of
ductility due to cycle-by-cycle accumulation of plastic strain. One real-life example of a
situation with fatigue ratcheting possibility is piping of power plants subjected to internal
pressure (primary load) and cyclic bending (secondary load).
Ratcheting phenomenon can be categorized either as material ratcheting or as structural
ratcheting. Material ratcheting occurs only in some materials and occurs in the absence of
structural effects, only if the stress is distributed homogeneously in a structure. Material
ratcheting depends on several factors such as the mean stress, stress amplitude, loading
frequency, loading history and micro-structural characteristics (Blanchard et al., 2011). On

25
the other hand, structural ratcheting, coined by Hübel (1996), could occur in any metal.
This type of ratcheting is produced by the inhomogeneity of the state of stress in a structure.
Pressurized pipelines, which constitute the main structures in the oil, gas, nuclear and
petrochemical industries, are frequently subjected to variable mechanical and thermal loads
over the course of their service lives. The variation in these loads is often cyclic in nature.
In 1990s, it was found that the ratcheting behavior of a pressurized straight pipe subjected
to seismic excitation could result in the reduction of the fatigue life of the piping
components.
Consider a simple straight pipe that is under constant and uniform pressure. Such a pipe
is subjected to a primary load in the axial and circumferential directions. A secondary
cyclic axial stress could then be exerted on the pipe as a result of start-up and shut-down
cycles over the pipe’s lifespan. If the resulting cyclic loads are effectively large, such to
cause the material to yield, the resulting plastic deformation may accumulate, cycle by
cycle, until the plastic collapse of the structure occurs.
Similar to other common damage mechanisms (e.g., those due to fatigue and creep),
ratcheting is considered as a governing criterion by many codes of practice when designing
engineering components and structures. The ratcheting criterion requires structures to
remain below the defined ratcheting limit, where the elastic or plastic shakedown would
occur (Abdel-Karim, 2005). The ASME Boiler and Pressure Vessel Code, Section III
incorporated provisions for reversed dynamic loading and ratcheting in the Code. The
allowable primary stress in the piping components, subjected to level D service loads
recommended in this code is three times Sm, where value of Sm is the minimum of 2/3 of
yield strength or 1/3 of ultimate strength of the material.

26
However, the current methods that establish ratcheting limits are either too
conservative or non-conservative. It is thus crucial to investigate the ratcheting response of
pipelines in order to predict their response in a reasonably accurate manner.
The ratcheting behaviors of various pressurized piping structures of different materials
have been extensively studied in the last several decades. These structures include straight
and elbow pipes as the typical ones, as well as other geometries such as tees and lateral
nozzles. Internal pressure has been the common constant load considered in design of these
structures. Cyclic loadings in two control modes, that is, displacement-controlled and
load-controlled have been incorporated in the related experimental studies.
The experimental set-ups to apply cyclic loads to pressurized straight pipes have mainly
been done by axial loading (Jiao and Kyriakides, 2011), four-point bending (Gao et al.,
2006), and pure bending (Rahman, 2006). Three commonly-used setups for these modes
are shown in Figure 2.4.

27
(a)
(b)
(c)
Figure 2.4 Sketch of the apparatus for testing of straight pipe subject to: (a) Axial loading
(Jiao and Kyriakides, 2011); (b) Four-point bending (Gao et al., 2006); (c) Pure bending
(Rahman, 2006).
In searching for the relevant literature regarding types of pipelines undergoing cyclic loads,
three different groups of cyclic loading apparatus were found to have been studied. It was
also noted that the subject of pipelines ratcheting response to cyclic pressure was
comprehensively studied and well-treated in codes of practice. However, a scarcity of
research works was observed when the problem of a dented pipe subjected to cyclic axial
and bending loads was of interest. The purpose of the following subsections is, therefore,
to provide a clear view of the available experimental and numerical methodologies in
reference to straight pipes subjected to such loadings.

28
2.3.2 Experimental Investigations - Cyclic Axial Loads
Yoshida et al. (1984) performed one of the earliest investigations regarding ratcheting
response of pipes subjected to cyclic axial loads. They studied mechanical ratcheting in a
carbon steel pipe under combined cyclic axial load and constant internal pressure. The
results showed that the biaxial strain accumulation in the pipe was influenced by maximum
effective stress, stress ratio and steady stress.
Steel pipes that undergo axial compression loading beyond their yield limit often
experience small amplitude wrinkles. If the pipe is subsequently loaded cyclically with a
non-zero mean stress, the structure may collapse due to accumulation of compressive strain
(Klever et al., 1994; DiVito et al., 2010). Pipelines are usually considered as axially
restrained structures. Because of this inherent condition, a pipeline resting on the seabed
can undergo plastic deformation due to a temperature change caused by the passage of hot
hydrocarbons. In some cases, initiation of axial wrinkling becomes inevitable (Paquette
and Kyriakides, 2006).
Jiao and Kyriakides (2009) analyzed inelastic buckling of pipelines that were subject
to axial cyclic loading, which subsequently yielded to the accumulation of plastic strain
and their final collapse. The problem was investigated experimentally using SAF 2507
super-duplex steel tubes with D/t of 28.5. The pipes were first compressed to strain levels
high enough to cause mild wrinkles to form; then they were cycled axially under
stress-controlled state about a compressive mean stress. It was reported that the pipe
average strain initially grew nearly linearly with respect to the number of cycles, but as a
critical value of wrinkle amplitude was approached, wrinkling localized, and then the rate
of ratcheting grew exponentially, and the tube collapsed.
29
Jiao and Kyriakides (2011) extended their previous study to also consider the effect of
internal pressure. Their results showed that the rate of ratcheting and the number of cycles
to collapse depended on magnitudes of the initial compressive pre-strain, the internal
pressure, and the stress cycle parameters, all of which were varied sufficiently to generate
an adequate database. Moreover, in all cases, collapse was found to occur when the
accumulated average strain reached the value at which the tube would develop wrinkles
under a monotonic compressive load.
2.3.3 Experimental Investigations - Cyclic Bending Loads
The ovalization of a pipe’s cross-section (i.e., change in the outside diameter to the original
outside diameter, ∆Do Do⁄ , after application of loading), could occur due to bending loads.
Reversal cycles (i.e., tension-compression) of bending loads result in a gradual increase in
the ovalization. The increase in ovalization would in turn degrade the bending rigidity of
the pipe. Once a critical magnitude of ovalization is reached, the pipe would then locally
buckle. Therefore, understanding the variation in ovalization of pipes subjected to cyclic
bending load is critical and of paramount importance in most industrial applications.
The response of pipes under monotonic or cyclic bending loads (with or without
external pressure) have been extensively investigated by Kyriakides and coworkers. For
instance, Kyriakides and Shaw (1982) studied the response and stability of elastoplastic
pipes under combined bending and external pressure conditions. They reported the
maximum moment capacity and curvature as a function of the material parameters,
geometric features, and applied external pressure.
The inelastic behavior of pipes with respect to cyclic bending was studied by Shaw and
Kyriakides (1985). They reported that reverse bending and any repeated cyclic bending
30
would result in a gradual growth of ovalization of the cross-section. Further, they extended
their analysis to characterize the stability of circular tubes under cyclic bending (Kyriakides
and Shaw, 1987). They observed that a tube would progressively ovalize to a critical value
when subjected to a curvature-symmetrical loading, and would finally buckle. The critical
ovalization value of a pipe was observed to be approximately equal to the value of
ovalization observed just prior to the onset of buckling in the pipe under monotonic
bending loading state.
Corona and Kyriakides (1988) analyzed the stability of circular tubes under combined
bending and external pressure. In their study, the curvature-pressure interaction collapse
scenarios were generated for two different loading paths involving bending, followed by
application of external pressure and subsequent bending. Also, the specimens' response
was observed to be strongly affected by the loading path. Corona and Kyriakides (1991)
also investigated the degradation and buckling of circular tubes subjected to cyclic bending
and external pressure. In that study, the effects of the cyclic bending and external pressure
on the rate of accumulation of ovalization and the onset of instability were investigated.
According to the reported experimental studies, some engineering materials, such as
304 stainless steel, 316 stainless steel and high-strength titanium alloys are classified as
rate dependent. As a result, the response and failure modes of tubes made of such materials
would be different when subjected to cyclic bending at different curvature rates. Pan and
co-workers analyzed the influence of curvature-rate on the response and failure mode of
tubes made of different alloys subjected to cycling bending loads. In their studies, tubes
made of 304 stainless steel (Pan and Her, 1998), titanium alloy (Lee and Pan, 2001) and
316L stainless steel (Chang et al., 2005) were considered. The effects of the curvature rate

31
at the preloading stage on the subsequent creep (i.e. while pipes were subjected to a
constant bending moment for a period of time) and curvature's relaxation were investigated
by Pan and Fan (1998). They used thin-walled 304 stainless steel tubes, and found that
under the application of pure bending, the curvature rate at the preloading stage strongly
influenced the subsequent creep or relaxation behavior. Moreover, the response and
stability of 304 stainless steel tubes subjected to cyclic bending with different curvature
rates was also studied by Pan and Her (1998). They found that the degree of hardening of
the metal tubes increased when the applied loading rate increased. Moreover, they observed
that by increasing the applied curvature rate, the ovalization of cross-section increased
accordingly.
A series of tests using mild and stainless-steel pipe specimens was conducted by
Moreton et al. (1994). These specimens were pressurized and subjected to fully reverse
cyclic bending moments at a frequency of approximately 5 Hz. It was observed that
ratcheting strain of the mild steel specimens was larger than that of the stainless-steel
specimens.
The influence of diameter-to-thickness ratio 𝐷 t⁄ on the response and stability of
circular tubes subjected to cyclic bending was studied by Lee et al. (2001). Having
maintained the inside diameter of their SUS 304 stainless steel tubes constant, they
machined the outside surface of the tubes to obtain the required 𝐷 t⁄ ratio in order to
highlight the influence of 𝐷 t⁄ ratio on their pipes' response. Their work was therefore
restricted to investigating varying 𝐷 t⁄ ratios (i.e. 30, 40, 50, and 60) with a fixed inside
diameter. They observed that the specimens with smaller outside diameters endured less
number of cycles before the onset of buckling than those with larger outside diameters.
32
Vishnuvardhan et al. (2010) conducted an experimental investigation on the fatigue
ratcheting response of TP304 LN stainless steel straight pipes, subjected to a constant
internal pressure and four-point cyclic bending. The load, load-line displacement, and
deflections at three locations along the pipe were continually monitored during each test;
as well, the number of cycles corresponding to development of through-thickness cracks
and final failure of the components were recorded. Pipes’ ratcheting response included
local bulging (by 13% to 19% with respect to the original diameter along the gauge length
portion), which caused thickness thinning of 8% to 16%, as well as ovalization of the pipe
cross-section. While continuous ratcheting was observed on pipes’ mid-section, no
shakedown was evident during the experiments.
To evaluate the low cycle fatigue life of pipes with local wall thinning subjected to
cyclic bending loads, Miyazaki et al. (2002) conducted low cycle fatigue tests on 100A
carbon steel pipes that had local wall thinning. Ratcheting deformation was observed on
these pipes under load-controlled tests, and the fatigue endurance became less than that
observed for cracked pipes. The investigated pipes had a 100 mm long eroded section along
the axial direction, and 0.5 mm in-depth eroded section. Under the displacement-controlled
tests, the fatigue strength of these pipes was almost equal to that obtained by the design
fatigue curves in ASME B&PV Code (2007) Sec. III. It was concluded that the low cycle
fatigue curves can be used to conservatively estimate the low cycle fatigue life of an eroded
pipe, and that the validity of estimated results could be confirmed experimentally.
Wang et al. (2014) studied the quasi-static three-point cyclic bending of pressurized
straight pipes under load-controlled and displacement-controlled states. The experiment
results showed that the ratcheting strain occurred mainly in the hoop direction, while there

33
was less ratcheting strain in the axial direction. The characteristics of the bending
ratcheting behavior of the pipes were derived and compared under load-controlled and
displacement-controlled states. It was reported that combined cyclic bending loads and the
internal pressure affected the ratcheting behavior of the pressurized straight pipe
significantly when tested under load-controlled state. In the meantime, the ratcheting
characteristics were also highly associated with the cyclic displacement and the internal
pressure under displacement-controlled condition. Not only did all these factors affect the
saturation of the ratcheting strain, but the ratcheting strain rate was also affected.
2.3.4 Finite Element Simulation
As discussed in aforementioned section, the ratcheting behavior of pressurized pipes has
been investigated experimentally by several investigators, and valuable results have been
obtained to assist us to understand the general rules of ratcheting deformation and fatigue.
However, it is noted that the structural dimensions and their type, and the loading
conditions that had been considered in these studies are somewhat limited. To overcome
the shortfalls, one can utilize the finite element approach. The approach can be used to
predict the ratcheting response of pressurized pipes using appropriate constitutive models
under various loading conditions. One can also examine the effect of geometric parameters
(e.g., D/t) on the response in an effective and efficient manner. However, it has been
demonstrated that the choice of the constitutive material model can significantly influence
the outcome of such computational simulations. Therefore, in the following subsections,
the progresses made in the development of constitutive material models for simulation and
prediction of ratcheting in straight pipelines are reviewed.

34
2.3.4.1 Material Model Tuning Efforts
Ohno (1990, 1997) reviewed the investigations that had considered strain accumulation,
and the related constitutive models developed up to 1997. After 1997, the focus appears to
have been in tuning the models, so that the influence of the ratcheting phenomenon could
be modeled more accurately. Since then, new features of ratcheting have been observed
and many cyclic constitutive models have been proposed.
The first and foremost important kinematic hardening rule was presented by Prager.
Prager's model, which assumes a linear relation between the back-stress tensor and the
plastic strain increment, was inspired by Hooke's law, applicable to linear isotropic
material. However, since the shape of the yield surface under this hardening rule has been
assumed to remain unchanged under forward and reverse loadings, the use of this model
would produce a closed-loop hysteresis, and thus, cannot model the ratcheting
phenomenon. To account for this drawback, Armstrong and Frederick (1966) proposed a
nonlinear kinematic hardening rule, which resulted in overestimation of the ratcheting
strain. Due to this drawback, a number of studies have since been carried out to modify the
Armstrong-Frederick hardening rule, so to establish a better estimation of the ratcheting
strain. For instance, Chaboche (1989) modified the Armstrong-Frederick hardening rule to
improve its capability to predict the ratcheting strain. Another modification to the
Armstrong-Frederick hardening rule was presented by Bower and Johnson (1989), who
introduced a new kinematic variable to decrease the overestimated prediction of the
ratcheting strain by Armstrong-Frederick model.
Later, Ohno and Wang (1993) introduced a kinematic hardening rule by decomposing
the backstress components. To activate the dynamic recovery terms, these components

35
require meeting a critical state. Bari and Hassan (2002) reported that when a sufficient
number of decomposed components are used in the Ohno-Wang model, the model could
provide a closer agreement between the predicted ratcheting strains and those obtained
experimentally. To further improve accuracy in predicting the ratcheting strains,
McDowell (1994) and Jiang and Sehitoglu (1996) modified exponents of the Ohno-Wang’s
model. Similar approach to Bari and Hassan’s was also later adopted by Chen et al. (2005)
in the framework of the Ohno-Wang model. The aim of the modification was to include
shakedown and over-prediction in ratcheting strains within a larger number of stress cycles.
Over the past two decades, several scholars have investigated the parameters that
influence ratcheting of materials and structures. For a comprehensive review of literature
related to material tuning with respect to ratcheting, the reader is referred to the work of
Abdel-Karim (2005). The review includes assessment of various approaches regarding
shakedown problems in various structures, including beams, rotating discs, thin infinite
plates, infinite plates with a central hole, and pipes under internal pressure and variable
temperature.
There are currently several hardening models available in some of the commercially
available finite element programs for simulating the ratcheting behavior of structures. The
bilinear kinematic hardening (BKH), the multi-linear kinematic hardening (MKIN), the
nonlinear kinematic hardening model and combined nonlinear kinematic/isotropic models
are some of the commonly used available models.
Gau (1990) verified the integrity of the modified BKH model in ANSYS and the
unmodified version of the model available in ANSYS and ABAQUS codes, against three
sets of experimental results obtained on a straight pipe. The modified BKH model of

36
ANSYS produced results with significant improvement over those obtained based on the
unmodified BKH of ANSYS and ABAQUS codes. It was found that the unmodified BKH
models generated lower elastic-plastic modulus, which in turn, over-predicted the
ratcheting strain rate significantly.
2.3.4.2 FE Models of Straight Pipelines
Another notable study is that conducted by Rahman et al. (2008) who investigated the
experimental ratcheting response of straight pipes subjected to cyclic bending and constant
internal pressure. In their study, the response of the pipes was also simulated numerically
using ANSYS finite element code, incorporating several well-known cyclic plasticity
models. However, none of the models could simultaneously simulate the variations in the
moment-rotation, diameter change ratcheting, and circumferential strain ratcheting
responses accurately. They then incorporated some of the more sophisticated cyclic
plasticity models (i.e., the modified Chaboche, Ohno and Wang, Abdel Karim and Ohno,
and modified Ohno–Wang models). Nonetheless, they discovered that even these
sophisticated models could not produce results with acceptable accuracy.
In another study, Zakavi and Nourbakhsh (2014) investigated the ratcheting behavior
of four pairs of stainless steel elbows using the finite element method in which Armstrong
and Frederick’s nonlinear kinematic hardening model was considered. To calibrate the
model and obtain the hardening coefficients, they conducted uniaxial plasticity tests on
several cylindrical bars (up to the necking stage), under a symmetric strain-controlled
scheme with different strains. They compared their numerical results with the experimental
results reported by Yahiaoui et al. (1996). Their FE models included the same loading
conditions investigated experimentally (i.e., subjecting the elbows to two different constant

37
internal pressures, followed by dynamic conditions that induced out-of-plane external
moments applied at typical seismic excitation frequencies). The ratcheting rate in their
study was observed to depend significantly on the magnitude of the internal pressure, the
dynamic bending moment and the constant parameters used in their nonlinear kinematic
hardening model. Although the strain ratcheting rates obtained by their FE model agreed
well with the experimental results, their FE model overestimated the other ratcheting
results.
Kulkarni et al. (2003; 2004) predicted the ratcheting strain of a straight pipe under
three-point and four-point bending modes with the use of Chaboche model in ANSYS. The
results showed that the ratcheting strain only occurred in the circumferential direction, and
no strain accumulation was observed in the longitudinal direction.
Zakavi et al. (2010) studied the ratcheting behavior of pressurized carbon steel
(BS4360-43A) and stainless steel (304L) straight pipes subjected to the seismic bending
moment with the combined nonlinear hardening model available in ABAQUS finite
element code. The finite element results were compared with those obtained from the
experiments to evaluate the capability of the proposed modified AF model, which was used
within an isotropic/kinematic hardening rule to predict the cyclic loading behavior of a
straight pipe. The results showed that the hoop-ratcheting strain predicted by their FE
analysis was close to that found experimentally in all cases with M/MP0.2≤1, where MP0.2
is the 0.2% curvature offset plastic moment; otherwise, their FE analysis overestimated the
experimental values.

38
Chapter 3
An Experimental Study on the Response of Dented Pipes undergoing
Pure Monotonic and Quasi-Static Cyclic Axial Loading
3.1 Summary
When long cylindrical tubes and pipes undergo axial compression loading, they behave as
beam-columns, and usually deform with a curvature and may even buckle. Shell-type
localized buckling occurs mainly when the structure is restrained from lateral movement.
This, for example, is the case for a pipeline buried in a trench or resting on a deformable
foundation. Such a pipe may experience compressive loading due to passage of hot
hydrocarbons carried from the well to a central gathering point by buried flowlines in
offshore operations. Support motion caused by fault movement, landslides, ground
subsidence, permafrost melting, or soil liquefication can also result in development of
significant compressive load in such pipes. Both loading scenarios can impose large
compressive strains, resulting in shell-type buckling of the system. Temperature also
changes and repetitive start-up/shutdown in offshore pipelines generate cycles of axial
compression and relaxation. Under the application of repeated loading, pipes can undergo
ratcheting. Pipelines can also be subject to damage in the form of dents. This form of
damage has a profound effect on a pipe’s ratcheting response when it undergoes cyclic
loading.
Previous studies investigating the topic of cyclically loaded pipes have shown that in
the absence of a pre-existing damage in a structure, the governing parameters that control
the response of pipes are the initial strain, the mean stress and the stress amplitude. In this

39
chapter, the influence of a mechanical damage in the form of a dent, stress amplitude and
mean stress in pipes subjected to monotonic and cyclic axial loads is investigated.
3.2 Features of Axial Plastic Buckling
Unlike elastic shell buckling in which collapse is sudden and catastrophic, plastic buckling
failure is preceded by a cascade of events, where the first instability (wrinkle) and collapse
can be separated by average strains of 1-5%. The behavior is summarized by the axial
stress-shortening response of a long pipe shown in Figure 3.1.
Figure 3.1 Stress-shortening responses expected in a compression test of a pipe.
Shown are the onset of wrinkling (A) (Kyriakides and Corona, 2007)
Initially, the tube deforms uniformly (OA). At some strain level indicated by “↓” on the
response, axisymmetric wrinkling takes over. The wrinkles, initially small in amplitude,
gradually grow to visible levels as load increases (AB). During the process, the axial
rigidity of the tube is reduced. For thicker shells, this eventually leads to a limit load
instability (indicated by “^”) that can be considered the ultimate limit state of the structure.
Under displacement-controlled loading, deformation localizes with a decrease in load

40
carrying capacity (BC) in Figure 3.1. The localized deformation can be in the form of an
axisymmetric lobe that keeps growing until its folded walls come into contact. The process
can subsequently be repeated, resulting in concertina folding, as illustrated in Figure 3.2.
(a) (b) (c)
Figure 3.2 (a) Carbon steel tube that developed axisymmetric concertina folding; (b)
mode 2 folding (c) mode 3 folding, taken from (Kyriakides and Corona, 2007)
Alternatively, a non-axisymmetric mode with two, three or more circumferential waves
could develop in the zone of localization. In thinner shells, the non-axisymmetric mode
develops before reaching the limit load that is associated with the purely axisymmetric
deformation. This results in an earlier softening of the response, causing a lower limit load.
For intact pipes, the material stress-strain response and D t⁄ determine which of the two
paths a given cylinder would undergo.
Axial plastic buckling is influenced by geometric imperfections, as well as by stress
concentration such as those generated by clamped or other end constraints. In addition, a
full development of the progression of events described above requires that the specimen
be of sufficient length. For example, in the experiment of Lee, conducted on a soft

41
aluminum pipe (AL-3003-0), clamped edges resulted in the early development of edge
bulges. Such bulging masked the onset of axisymmetric wrinkling (Lee, 1962).
Particular care was taken when designing the following experiment, so as to limit the
influence of both edge effect and pipe size on response of the pipe specimens. As a result,
the investigation could focus on examination of the effect of a dent (as a form of surface
imperfection) on the response of pipes undergoing axial cyclic loads. The results would
therefore be representative of the actual behavior of in-service pipelines.
3.3 Experiment Layout and Procedures
The pipes were laterally indented with a cylindrical indenter to three initial dent depths.
The depths were 10%, 12% and 14% of the outer pipe diameter. Subsequently, the dented
pipes were subjected to monotonic axial compression displacement in order to initiate
small amplitude wrinkles in the gauge section. Finally, the tests were concluded by
performing axial cyclic tests.
3.3.1 Specimen Specifications
The dimensions of the specimens were chosen similar to those utilized in the cyclic tests
conducted by Limam et al. (2010) and Jiao and Kyriakides (2009). The specimens were
machined from API-5L grade B carbon steel seamless tube stock (with 60.3 mm OD and
3.91 mm wall thickness). A typical specimen and its dimensions are shown in Figure 3.3.

42
Figure 3.3 Geometry of a typical specimen (Not to scale – all dimensions in mm)
The overall specimen length was 342 mm, with some variations in the thickness as
follows. Pipes’ ends had thicker wall-thickness to accept the Ringfeders that connected the
pipes to the test fixture. These sections were connected to the gauge section, located in the
middle of the specimen, by two linearly tapering regions. The length of the tapered sections
was established by utilizing the finite element method in such a way to facilitate a
reasonably uniform transfer of stress from the thicker section to the gauge section. The
established overall geometry facilitated the growth of wrinkling in the presence of the dent,
thereby mimicking the stress variation of actual long dented pipes. The overall length of
the test specimens was 342 mm.
The experimental investigation was conducted on low carbon steel pipes (API 5L grade
B) with 𝐷 t > 35⁄ indented by a cylindrical indenter. Table 3.1 provides a summary of the
material properties.
Table 3.1
Material properties obtained by standard tensile tests
Material type Yield stress (MPa) Ultimate stress (MPa) Strain at failure
API 5L-B 290 415 3.8%

43
3.3.2 Indentation Procedure
During the indentation process, each pipe was supported by a structural steel flat plate with
length of 114 mm and thickness of 10 mm, forming the denting bed. To indent the pipe, a
solid cylindrical indenter, with a diameter of 9.47 mm, made from mild steel was positioned
at the middle of the gauge section, perpendicular to pipe’s longitudinal axis. To hold both
ends of the pipe without fully restraining the ends, a fixture shown in Figure 3.4 was used.
The indenter was then forced into the pipe at a constant speed of 0.1 mm/min to generate
a quasi-static deformation. The indenter was removed after reaching the prescribed depth
of dent, so to leave an unconstrained dent impression.
Figure 3.4 Test set up used for generating the indention
3.3.3 The cyclic and monotonic test set-up and procedures
In the next stage of the experiment, each dented pipe underwent both monotonic and cyclic
axial loadings. A 200 kN servo-hydraulic Instron testing machine controlled by 8500+
electronics was utilized that could be operated in displacement- or load-control manner.
The test set up is shown in Figure 3.5.

44
Figure 3.5 The monotonic and cyclic loading test set up
To fix the horizontal movement of the pipe and assure the concentricity of pipe’s ends,
each thicker end portion of the pipe was gripped by applying circumferential pressure using
a Ringfeder locking assembly, attached to the testing machine. Solid inserts were placed
inside the thicker ends of the specimens to support the applied pressure exerted by the
Ringfeder. A laser extensometer that could scan the gauge section was used to measure the
change within the gauge length. A linear variable differential transformer (LVDT),
attached to a special rail that allowed the axial movement of the LVDT, was used to scan
the dented section and to accurately measure the variation in its shape. During the cyclic
experiments, the tests were periodically interrupted for a few seconds in order to perform
an axial scan. The pipe was scanned in three stages: (i) at the zero-load; (ii) after applying
the initial strain; (iii) and, during the cyclic loading, at every 50 cycles.
The initial monotonic loading was conducted at a strain rate of approximately 2x10⁻⁵
(s-1), while the subsequent cycles had a period of 2 min (Jiao and Kyriakides, 2009). The

45
tests data, including those from the signals generated by the laser extensometer, the load
cell and the displacement transducer were all captured through a computer operated data
acquisition (DAQ) system that recorded the data concurrently.
3.4 Results and Discussion
The results from three monotonic loading experiments and ten cyclic loading experiments
are reported and discussed in this section. The detailed cyclic experiments’ results are
reported in Table 3.2. In this table, δxp
is the average peak axial strain and Nf is the number
of cycles at failure.
In the reported results, CL and ML stands for the cyclically loaded and monotonically
loaded test specimens, respectively. The first number, refers to the initial dent depth. The
number after the dash denotes the experiment number identifier at each dent depth ratio.
Table 3.2
Summary of results from cyclic loading experiments
Identifier σx.max (MPa) σm (MPa) σa (MPa) δxp (%) Nf
CL10-1 294.40 143.61 150.79 3.21 1108
CL10-2 290.73 154.45 136.28 3.69 1089
CL10-3 279.52 148.95 130.56 4.07 2740
CL12-1 292.55 155.42 137.13 3.66 452
CL12-2 290.73 154.45 136.28 3.52 542
CL12-3 283.52 145.39 138.12 3.84 456
CL14-1 289.94 153.50 136.44 3.62 251
CL14-2 278.26 145.33 132.93 3.57 456
CL14-3 279.09 149.02 130.07 3.72 607
CL14-4 277.92 142.62 135.30 3.41 552

46
Essentially two parameters determine the choice of the initial strain that should be used
to initiate the simulation of the actual load that pipelines experience in service. These are
the critical strain, εC, at which the wrinkling initiates, and the limit strain, εL. Figure 3.6a
pictorially shows these two critical average strain values measured for specimen ML-14.
As observed in the experiments performed in this study, the wrinkling initiated at a strain
of about 0.95%, followed by the pipe collapsing at an average strain of approximately
3.05% (the exact value is influenced by the small geometric imperfections, as well as the
inherent anisotropy of the material).
(a) (b)
Figure 3.6 (a) The stress-strain response of a 14% indented pipe tested under
monotonic loading condition; (b) Typical stress-history used in cyclic testing
In the cyclic tests, the specimens were initially loaded to a compressive strain of εC <
εx,initial < εL (see Figure 3.6a), so that small wrinkles would be generated on their surface;
subsequently, the pipes were cyclically loaded. The axial stress history shown in Figure
3.6b was applied with an amplitude of σa measured with respect to a compressive mean

47
stress of σm. The previous investigations have shown that the stress amplitude and mean
stress govern the rate of material’s ratcheting. However, to the best of our knowledge, the
effect of denting on structural ratcheting has not been previously investigated.
3.4.1 Representative Indentation
As presented in Table 3.3, the unpressurized pipes were initially dented to three amplitudes,
equivalent to 10%, 12%, and 14% of the outer diameter. It should be noted that δ is the
initial dent depth and δresidual is dent’s depth after rebound. After attaining the prescribed
dent depth, the indenter was slowly removed. Due to the elastic rebound of the dented area
after removing the indenter, the residual dent depth to the outer diameter ratio decreased to
actual amplitudes of 6.7%, 8.2% and, 9.8% of the outer diameter.
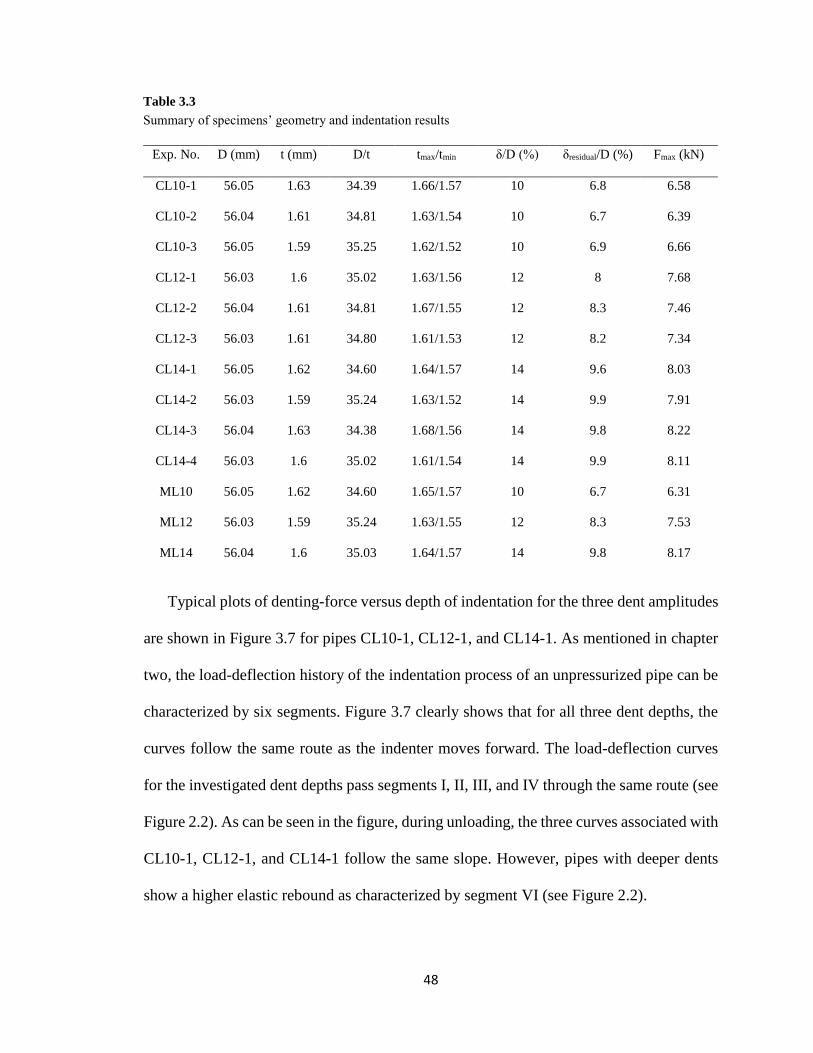
48
Typical plots of denting-force versus depth of indentation for the three dent amplitudes
are shown in Figure 3.7 for pipes CL10-1, CL12-1, and CL14-1. As mentioned in chapter
two, the load-deflection history of the indentation process of an unpressurized pipe can be
characterized by six segments. Figure 3.7 clearly shows that for all three dent depths, the
curves follow the same route as the indenter moves forward. The load-deflection curves
for the investigated dent depths pass segments I, II, III, and IV through the same route (see
Figure 2.2). As can be seen in the figure, during unloading, the three curves associated with
CL10-1, CL12-1, and CL14-1 follow the same slope. However, pipes with deeper dents
show a higher elastic rebound as characterized by segment VI (see Figure 2.2).
Table 3.3
Summary of specimens’ geometry and indentation results
Exp. No. D (mm) t (mm) D/t tmax/tmin δ/D (%) δresidual/D (%) Fmax (kN)
CL10-1 56.05 1.63 34.39 1.66/1.57 10 6.8 6.58
CL10-2 56.04 1.61 34.81 1.63/1.54 10 6.7 6.39
CL10-3 56.05 1.59 35.25 1.62/1.52 10 6.9 6.66
CL12-1 56.03 1.6 35.02 1.63/1.56 12 8 7.68
CL12-2 56.04 1.61 34.81 1.67/1.55 12 8.3 7.46
CL12-3 56.03 1.61 34.80 1.61/1.53 12 8.2 7.34
CL14-1 56.05 1.62 34.60 1.64/1.57 14 9.6 8.03
CL14-2 56.03 1.59 35.24 1.63/1.52 14 9.9 7.91
CL14-3 56.04 1.63 34.38 1.68/1.56 14 9.8 8.22
CL14-4 56.03 1.6 35.02 1.61/1.54 14 9.9 8.11
ML10 56.05 1.62 34.60 1.65/1.57 10 6.7 6.31
ML12 56.03 1.59 35.24 1.63/1.55 12 8.3 7.53
ML14 56.04 1.6 35.03 1.64/1.57 14 9.8 8.17

49
Figure 3.7 Denting force versus depth of the dent
3.4.2 Representative Monotonic Loading
Figure 3.8 shows representative average stress-strain responses of specimens with the three
indentation depths subjected to monotonic loading. Instability at a limit load corresponding
to strain of δx L = 3.05%⁄ could be seen in all tested specimens. The main influence of
the dent depth in specimens subject to the monotonic loading is observable by considering
the curves segment between the limit and final failure loads. Moreover, higher dent depth
caused a significant decrease in the load-bearing capacity of the components.
0
2
4
6
8
0 0.02 0.04 0.06 0.08 0.1 0.12 0.14 0.16
Inden
tati
on f
orc
e (k
N)
δ/D
CI14-2
CI12-2
CI10-3
10
1412

50
Figure 3.8 Average stress-strain response of the specimens having three different
indentation depths, tested under monotonic loading
At an average strain of δx L = 4.6%⁄ , the load capacity of the dented pipes at denting
depths of 10%, 12% and 14% are 286 MPa, 254 MPa, and 231 MPa, respectively. In other
words, at the mentioned strain, the load-bearing capacity of the component decreased from
21.9% to 12% when the denting depth changed from 10% to 14%. The other effect of dent
depth, though relatively much less insignificant, is the minute decrease of approximately 1
MPa in the axial load-bearing capacity of the pipe corresponding to every 2% increases in
the denting depth.
3.4.3 Representative Cyclic Loading
The pipe was initially compressed to a strain (ε̅x,initial ) of 2.04% (causing an axial stress
of, σx,max = 289.94 MPa), and was subsequently unloaded. Upon reaching this initial strain,
five wrinkles developed in the gauge section upon. Two pairs of wrinkles were located
0
50
100
150
200
250
300
350
0 1 2 3 4 5
Ave
rage
axi
al s
tres
s (M
Pa)
δx/L (%)
ML10
ML12
ML14

51
symmetrically about the middle of the gauge length, near pipes’ ends. An asymmetric
wrinkle was also observed in the midsection, opposite to the indented region. The pipe was
then loaded cyclically under an axial compressive load with a mean stress of σm = 136.44
MPa and an amplitude σa = 153.50 MPa. In this way, the maximum stress in each cycle
was similar to that applied under the monotonic loading. Under the loading, the specimen
immediately started to ratchet axially, as can be observed through the response illustrated
in Figures 3.9 and 3.10. The ratcheting eventually grew exponentially in the neighborhood
of 189th cycle (corresponds to an average strain of about 2.34%).
Figure 3.9 Average stress–strain response of specimen CL14-1
Figure 3.9 shows the variation in the average stress–strain response of specimen CL14-
1 that was tested under the cyclic loading. An axial scan of the pipe was carried out prior
to the application of the initial strain (see Figure 3.11). Three observations can be made by
-50
0
50
100
150
200
250
300
0 1 2 3 4
Ave
rage
axi
al s
tres
s (M
Pa)
δx/L(%)
σm: 136.44 MPaσa: 153.50 MPaεx,initial: 2.04%
SPECIEMN CL14-1

52
2
2.5
3
3.5
4
0 50 100 150 200 250
Ave
rage
pea
k ax
ial s
trai
n (
%)
Number of cycles
Speciemen CL14-1D/t=34.60σm: 136.44 MPaσa: 153.50 MPa
ε̅L
examining Figure 3.9. Firstly, as one approaches the failure cycle, the width of the stress
loops increases progressively. In the meantime, the peaks of the cycles become rounder.
Finally, the failure occurs after the stress reaches to its cyclic peak in the 251st cycle.
Figure 3.10 Peak average axial strain versus number of cycles for specimen CL14-1
Due to the structural damage caused firstly by the indentation and then by the resulting
shortening of the dented section due to the growth of the amplitudes of the symmetric and
axisymmetric wrinkles, the observed ratcheting (in δxP) is believed to have been originated
from both material and geometric responses. In other words, no local deformation in the
gauge length was observed during the first 30 cycles (which can be viewed as the transient
part of the cyclic history); therefore, it is postulated that material induced ratcheting was
the main contributor in this regime. On the other hand, during the exponential growth of
δxP, the wrinkles amplitude grew and the indentation section deepened; thus, one could
conclude that geometric induced ratcheting governs in this regime of the loading.

53
Figure 3.11 shows the variation in the indentation depth within half gauge-length
obtained by scanning the region after application of various numbers of loading cycles
(noted by “N” in the graph) of specimen CL14-1. As can be seen, and as noted earlier, the
maximum residual dented depth with respect to the outer diameter at the beginning of the
tests is 9.6%.
Figure 3.11 Variation in the half gauge-length profile of specimen CL14-1
After initially compressing the pipe, this value increased suddenly to 18.2%. As seen
in the figure, an increase of 2% in the value of the normalized dented depth was generated
after the application of the last loading cycle. As it is also evident, the effect of initial
compression on increasing the dent depth is considerably more than that caused by cyclic
loading. At some stage in the process, possibly before approaching the limit load, the
deformation in the neighborhood of the dent completely reverted to a non-axisymmetric
0
5
10
15
20
25
0 10 20 30 40 50 60 70
Ind
enta
tio
n d
epth
/ou
ter
dia
met
er (
%)
Half-gauge Length (mm)
immediately after denting
N
250200150100
Speciemn CL14-1

54
buckling mode. Continued loading led to progressive concertina folding, with two faces of
the dent contacting each other. Figure 3.12 illustrate the geometry of the specimen at
various loading stages.
(a) (b) (c)
Figure 3.12 Gauge length’s profile (a) immediately after denting (b) after the
application of the initial strain (c) at the collapsed stage
The comparison of the ratcheting responses obtained through the tests conducted of
specimens (CL14-1, CL12-1, and CL10-2) with three different indentation depths are
illustrated in Figure 3.13.

55
Figure 3.13 Variation of the peak average axial strain as a function of applied loading
cycles for specimens with three different indentation depths
The results are extracted from the experiments having similar stress amplitudes and the
same initial axial strain. All three specimens exhibited similar creep-like response (i.e. a
transient response during the first few cycles, followed by a linear response, and finally an
exponential response).
The main observation is that the specimens with lower dent depth exhibited elongated
linear response with a lower variation (i.e., slope). The total number of cycles to failure
decreased dramatically when the indentation depth changes from 10% to 14%. For
instance, specimen CL10-2 collapsed after 1,089 cycles while CL14-1 reached the critical
state after only 251 cycles.
The second important observation is that the rate of ratcheting is seen to accelerate
when the accumulated deformation approaches the strain limit. This trend is observed again
in Figure 3.14. The figure shows the ratcheting of pipes that had the same dent depth, but
were subject to different stress amplitudes. The observed trend is in concert with
2
2.5
3
3.5
4
0 200 400 600 800 1000 1200
Ave
rage
pea
k ax
ial s
trai
n (
%)
Number of cycles
CL14-1 CL12-1 CL10-2
ε̅L

56
Kyriakides and Shaw’s observation (1987), regardless of the existence of a dent. They
observed that under cyclic loading, tubular specimens tend to collapse at an average strain
level similar to the collapse strain experienced under monotonic loading.
Figure 3.14 Influence of the applied load amplitude (σa) on the peak axial strain as a
function of applied loading cycles for the specimens with 14% indentation depth (CL14)
The influence of the stress amplitude, σa, that also affects the rate of ratcheting, was
further evaluated. The rate of ratcheting recorded as represented by the average peak axial
strain per cycle is reported and compared in Figure 3.14. In this figure, the ratcheting results
obtained from tests conducted on three specimens, having 14% depth of indentation, are
compared. These specimens were subjected to approximately the same initial compressive
strain (ε̅x,initial) of 2%, but then subjected to different cyclic stress amplitudes (σa). As
expected, all responses present a creep-like characteristic. The effect of σa on the rate of
ratcheting, which is represented by the slope of the nearly linear part of the curves is quite
2
2.5
3
3.5
4
0 100 200 300 400 500 600
Ave
rage
Pea
k ax
ial s
trai
n (
%)
Number of cycles
CL14-1 CL14-2CL14-3
ε̅L

57
significant. Furthermore, in all cases, at some point, the rate of growth of the plastic strain,
δxP L⁄ , starts to accelerate exponentially. All specimens were cycled up to collapse.
3.5 Conclusions
In consideration of cyclically loaded pipes, previous studies have shown that, in the
absence of a pre-existing damage in the given pipe, the parameters that govern the collapse
of such a pipe are the initial strain, the mean stress and the stress amplitude. However,
limited information is available regarding the ratcheting response of dented pipes. In this
chapter, the effect a mechanical damage (in the form of a dent) on the ratcheting response
and collapse of axially loaded pipes was investigated. The work also included the
investigation of the applied stress amplitude. The following results and observations were
obtained from the experimental investigation:
(i) Significant variation in pipes response was observed for the investigated dent
depth. The numbers of cycles prior to collapse dramatically decreased by as much
as 75% when the indentation depth was increased by only 4%.
(ii) Comparison of the average strain at the onset of collapse in pipes loaded
monotonically or cyclically indicated that collapse would essentially occur at the
same strain level, regardless of the nature of the applied loads.
(iii) The effect of cyclic load on increasing the dent depth was observed to be marginal
as compared with that observed after the initial compressive load was applied.
Prior to collapse, the cyclic axial load generated a maximum increase of 2% in
the value of the normalized dented depth in all the performed tests.

58
(iv) In the case of monotonic loaded pipes, the presence of a dent reduced the load-
bearing capacity (i.e., the load corresponding to the limit strain) of the pipes. For
the specimens investigated in this study, the observed reductions were from
21.9% to 12% corresponding to the normalized indentation depth of 10% and
14%, respectively.
(v) The results of cyclic tests indicated that as the number of cycles increased, the
increase in the dent depth shortened the linear portion of the average peak axial
strain response curve. The outcome was significant in the total number of cycles
to failure.

59
Chapter 4
Numerical Analysis of the Response of Dented Pipes Undergoing Pure
Monotonic and Quasi-Static Cyclic Axial Loading
4.1 Summary
To expand understanding of the ratcheting behavior of dented pipes, the details of a 3D
finite element (FE) modeling framework, developed using the commercial software
ABAQUS, are presented in this chapter. The numerical results are verified against the
experimental results presented in chapter 3. The FE model considered in this study is
capable of capturing several nonlinear phenomena associated with the problem, including
the plastic deformation of the steel, large deformation, contact stresses, and material non-
linearity.
The dented pipes were initially subjected to a monotonic axial compression load, which
causes the initiation of small amplitude wrinkles, and were subsequently subjected to an
axial cyclic loading regime. A non-linear material model, using a combined hardening
model, was adopted to model the response of the material during the entire loading regime.
The parameters required by the material model were obtained from cyclic tests conducted
on representative coupon specimens.
The developed FE framework was subsequently used to perform a parametric study to
assess the effect of each influencing parameter on the dented pipe’s response. The
influence of the loading condition including initial strain level, stress amplitude, mean
stress, and loading regime were investigated. As well, the influence of material hardening
properties of the material model were considered.

60
4.2 Material Model
4.2.1 Theoretical Framework of Cyclic Plasticity
Basic elements of cyclic plasticity incorporate the yield criterion, elastic constitutive rule
(i.e., Hook's law), and the plastic constitutive rule called flow rule which relates the
incremental plastic strain to the stress increment. The strain increment consists of the
elastic and plastic strain components, represented by:
d𝛜 = d𝛜𝐞 + d𝛜𝐩 (4.1)
The elastic strain incremental component dεije is obtained through Hook's constitutive
law as:
dϵije =
1
2μdσij
e −λ
2μ(2μ + 3λ)dσkk
e (4.2)
in which λ = νE (1 + ν)(1 − 2ν)⁄ and μ = E 2(1 + ν)⁄ are the two Lamè constants for an
isotropic linear elastic solid expressed in terms of the Young's modulus (E) and the
Poisson’s ratio (ν), and i, j, k are the Levi-Civita tensor indices, taking values of 1 and 2
for plane stress case. The plastic strain d𝛜𝐩 is obtained from the flow rule as:
d𝛜𝐩 =1
H(d𝛔dev. 𝐧)𝐧 (4.3)
where H is the plastic modulus and 𝐧 denotes the normal to the yield surface.
𝐧 =𝛔dev − 𝐚
|𝛔dev − 𝐚| (4.4)
in which d𝛔𝐝𝐞𝐯 is the incremental deviatoric stress tensor and a is the back-stress tensor.
The yield surface translates without any change in its orientation, meaning that such surface

61
does not have rotation. As a basic assumption, the shape of the yield surface does not
change during the cyclic plastic loading. Further, among the various yield criteria, the von-
Mises yield criterion is expressed by:
(σijdev − 𝐚) ∙ (σij
dev − 𝐚) =2
3 Y2 (4.5)
in which 𝛔𝐝𝐞𝐯 denotes the deviatoric stress tensor and is obtained by
σijdev = σij −
1
3σkkδij (4.6)
While the elastic-plastic deformation is happening, the consistency condition of the
yield surface must be satisfied. Such condition stipulates that the projection of the back-
stress tensor a on the unit normal n, and that of the increment of the deviatoric stress tensor
𝛔𝐝𝐞𝐯 increments on the unit normal n remains the same during the loading. In other words,
d𝐚 ∙ 𝐧 = d𝛔dev ∙ 𝐧 (4.7)
The plastic modulus H can be derived using the flow rule (Equation 4.6), the
consistency condition of the yield surface (Equation 4.7), and a kinematic hardening rule.
The hardening rule defines the motion of the yield surface in the stress space and its
possible expansion during the inelastic deformation (Jiang, 1993).
To simulate the inelastic response of materials under cyclic loading, one may use the
isotropic and kinematic hardening model. However, materials modeled by plasticity
material models that include isotropic hardening, continue to harden under the application
of cyclic loading. Thus, the isotropic hardening model is generally not recommended for
modeling cyclic plasticity, unless the aim is to predict the shakedown behavior.
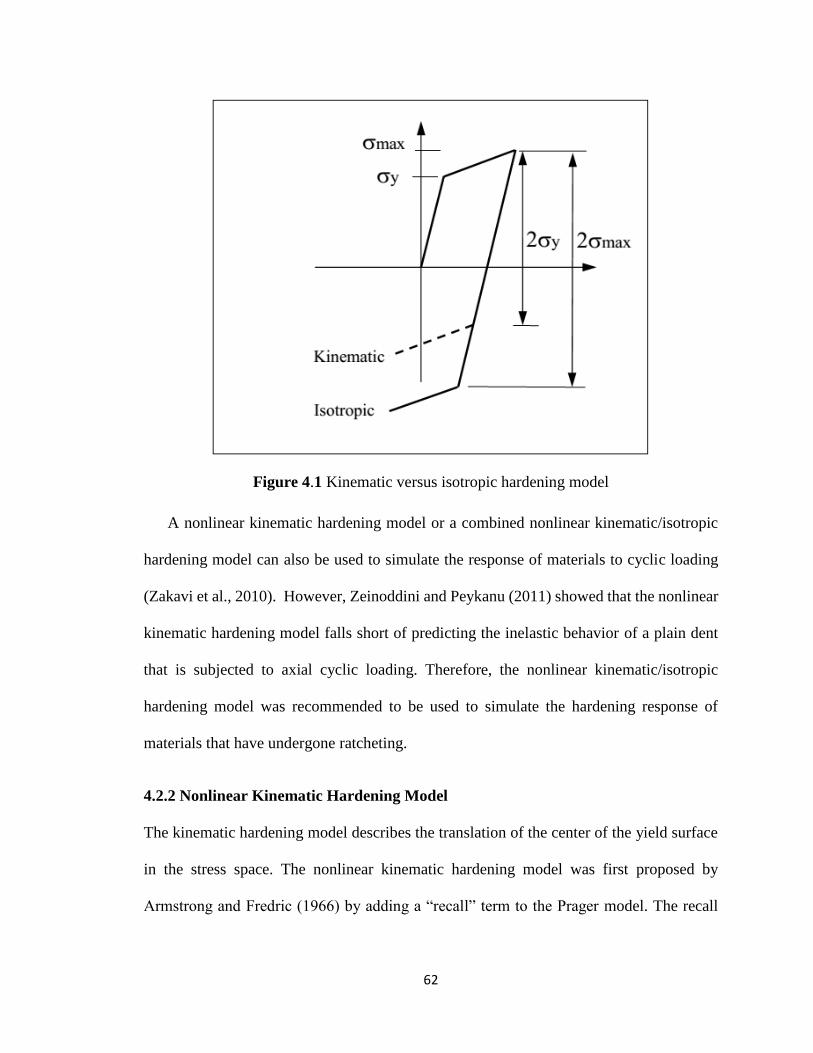
62
Figure 4.1 Kinematic versus isotropic hardening model
A nonlinear kinematic hardening model or a combined nonlinear kinematic/isotropic
hardening model can also be used to simulate the response of materials to cyclic loading
(Zakavi et al., 2010). However, Zeinoddini and Peykanu (2011) showed that the nonlinear
kinematic hardening model falls short of predicting the inelastic behavior of a plain dent
that is subjected to axial cyclic loading. Therefore, the nonlinear kinematic/isotropic
hardening model was recommended to be used to simulate the hardening response of
materials that have undergone ratcheting.
4.2.2 Nonlinear Kinematic Hardening Model
The kinematic hardening model describes the translation of the center of the yield surface
in the stress space. The nonlinear kinematic hardening model was first proposed by
Armstrong and Fredric (1966) by adding a “recall” term to the Prager model. The recall

63
term assumes different hardening moduli for loading and unloading stages, so that the
transformation of stress would be different during loading and unloading.
Lemaitre and Chaboche (1994) expressed the yield function for time independent
plasticity by employing the von Mises yield criterion, as:
f = J2(𝛔 − 𝐗) − k (4.8)
where 𝛔 and 𝐗 are stress and back stress tensors, respectively, k is the initial size of the
yield surface, and J2 is the von Mises distance in the deviatoric stress space, which can be
mathematically expressed by:
J2(𝛔 − 𝐗) = [3
2(𝛔′ − 𝐗′): (𝛔′ − 𝐗′)]1/2 (4.9)
In which 𝛔′ and 𝐗′ are the stress and back stress deviatoric tensors in the stress space,
respectively.
Armstrong and Frederick also introduced nonlinearities to the Prager model by adding
a recall term, as shown below:
d𝐗 =2
3Cd𝛆𝐩 − γ𝐗d𝛆𝐩 (4.10)
where d𝛆𝐩 is the equivalent plastic strain rate, and C and γ are material-dependent
coefficients. The linear kinematic law is reached when γ is set to zero.
The normality hypothesis and the consistency condition, df = 0, provide an expression for
the plastic strain rate, as follows (Lemaitre and Chaboche, 1994):

64
d𝛆𝐩 = dλ∂f
∂σ=
H(f)
h⟨
∂f
∂σ∶ d𝛔⟩
∂f
∂σ (4.11)
where H is the Heaviside step function: H(f) will be zero if f < 0, and H(f) will becomes
equal to 1 if f ≥ 0 . The symbol ⟨⟩ is the MacCauley bracket, such that ⟨v⟩ = (v + |v|)/2.
The hardening modulus h can be evaluated by the following equation:
h = C −3
2γ𝐗 ∶
𝛔′ − 𝐗′
k (4.12)
In tension-compression loading scenarios, the flow and hardening can be expressed in the
following forms:
f = |𝛔 − 𝐗| − k = 0 (4.13)
d𝛆𝐩 =1
h⟨𝛔 − 𝐗
kd𝛔⟩
𝛔 − 𝐗
k=
d𝛔
h (4.14)
d𝐗 = Cd𝛆𝐩 − γ𝐗|d𝛆𝐩| (4.15)
h = C − γ𝐗 Sgn(𝛔 − 𝐗) (4.16)
Lemaitre and Chaboche (1994) analytically derived the equation of hardening and
presented it as:
X = υC
γ+ (X0 − υ
C
γ) exp[ −υγ(εp − εp0
)] (4.17)
where υ = ±1 accounts for the direction of flow, and εp0 and X0 are the initial values of
the plastic strain and back stress, respectively. Moreover, C is the initial kinematic
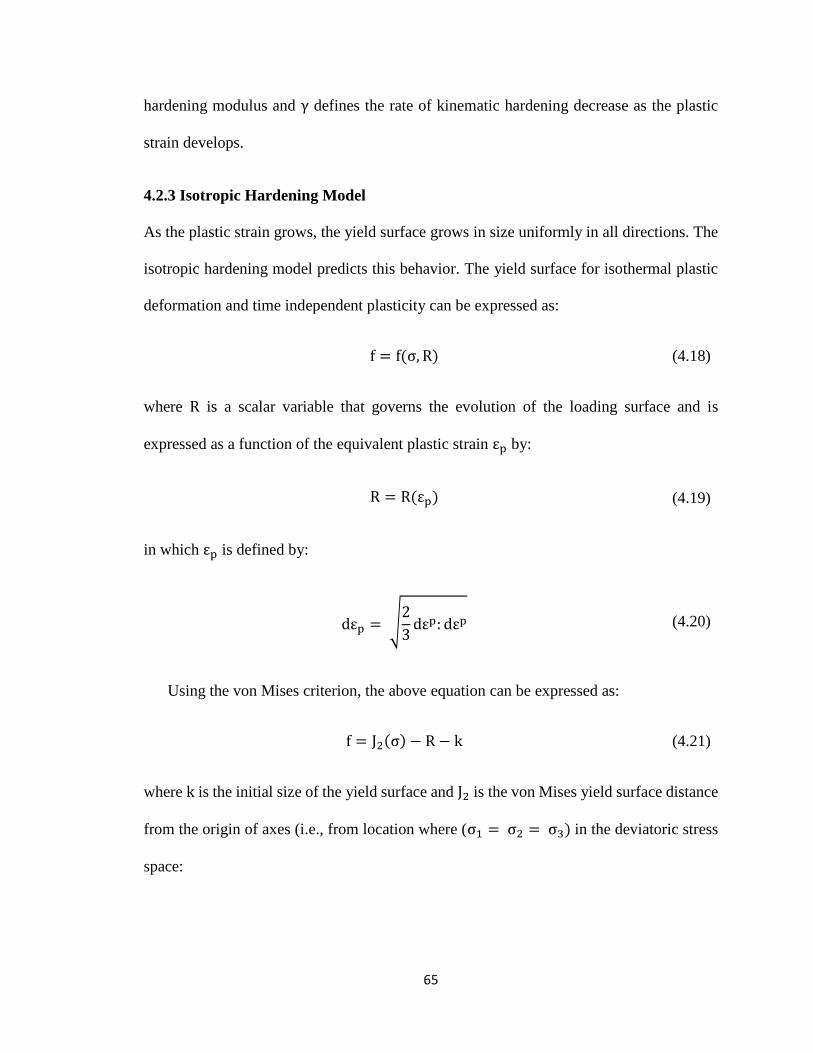
65
hardening modulus and γ defines the rate of kinematic hardening decrease as the plastic
strain develops.
4.2.3 Isotropic Hardening Model
As the plastic strain grows, the yield surface grows in size uniformly in all directions. The
isotropic hardening model predicts this behavior. The yield surface for isothermal plastic
deformation and time independent plasticity can be expressed as:
f = f(σ, R) (4.18)
where R is a scalar variable that governs the evolution of the loading surface and is
expressed as a function of the equivalent plastic strain εp by:
R = R(εp) (4.19)
in which εp is defined by:
dεp = √2
3dεp: dεp (4.20)
Using the von Mises criterion, the above equation can be expressed as:
f = J2(σ) − R − k (4.21)
where k is the initial size of the yield surface and J2 is the von Mises yield surface distance
from the origin of axes (i.e., from location where (σ1 = σ2 = σ3) in the deviatoric stress
space:
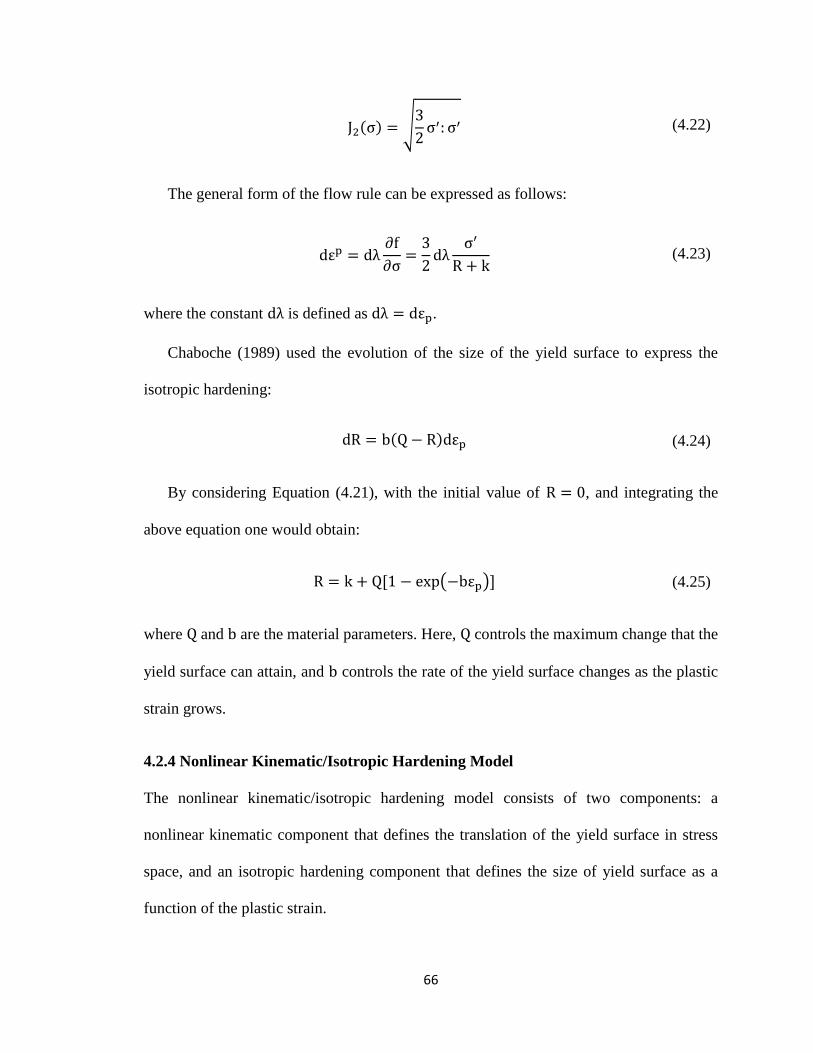
66
J2(σ) = √3
2σ′: σ′ (4.22)
The general form of the flow rule can be expressed as follows:
dεp = dλ∂f
∂σ=
3
2dλ
σ′
R + k (4.23)
where the constant dλ is defined as dλ = dεp.
Chaboche (1989) used the evolution of the size of the yield surface to express the
isotropic hardening:
dR = b(Q − R)dεp (4.24)
By considering Equation (4.21), with the initial value of R = 0, and integrating the
above equation one would obtain:
R = k + Q[1 − exp(−bεp)] (4.25)
where Q and b are the material parameters. Here, Q controls the maximum change that the
yield surface can attain, and b controls the rate of the yield surface changes as the plastic
strain grows.
4.2.4 Nonlinear Kinematic/Isotropic Hardening Model
The nonlinear kinematic/isotropic hardening model consists of two components: a
nonlinear kinematic component that defines the translation of the yield surface in stress
space, and an isotropic hardening component that defines the size of yield surface as a
function of the plastic strain.

67
To accurately obtain the nonlinear kinematic/isotropic hardening parameters, it has
been recommended that the hardening model be calibrated against experimental data within
a loading regime and a strain close to those that are expected to occur in the actual
application (Zakavi et al., 2010).
The calibration procedure, therefore, consisted of testing of five bars. In one test, the
material was subjected to monotonic tensile load until necking occurred, which led to
evaluation of the isotropic hardening component. In the other tests, the test coupons were
subjected to a set of symmetric strain-controlled loading cycles with different strain levels,
to establish the values of kinematic hardening’s components. During these calibration tests,
the stress state remained essentially uniaxial. There are three different ways to provide data
for the kinematic hardening component of the plasticity model used in this study: (i) by
using a half-cycle test data; (ii) by using a single stabilized cycle data; and (iii) by using
the test data obtained from several stabilized cycles. The stress–strain data can be readily
obtained from several stabilized cycles of test specimens that are subjected to symmetric
strain cycles. The third approach has been commonly used during recent years; therefore,
it was utilized in this study.
When conducting symmetric strain-controlled experiments, the equivalent plastic strain
equals the summation of the absolute value of the change in the longitudinal strains; that
is:
ε̅p = ∑|∆εp(i)| = ∑|∆εi − ∆σ̅exp/E|
i
(4.26)
where εi is the total strain, σ̅exp is the measured stress and E is the elastic moduli. The
equivalent back stress, X̅, equals one-half of the difference in the yield stress obtained at

68
the end of tensile loading and the first yield occurring at the subsequent compressive
loading.
The resulting data pairs (X̅, ε̅p), are plotted in Figure 4.2b. The kinematic hardening
parameters, C and γ, could now be estimated by correlating Equation (4.17) to the coupon
test data as illustrated in Figure 4.2b.
(a) Stress-strain curve (b) Curve fit data from cyclic tests
Figure 4.2 Material properties of API 5L-B to calibrate the hardening parameters
As briefly stated, the data for the equivalent stress versus equivalent plastic strains up
to the point of necking was extracted from the monotonic tension tests. An empirical
equation was obtained by fitting a nonlinear least-square curve to the data to establish the
equivalent stress at arbitrarily high values of equivalent strains. Using the experimental
data corresponding to one-half of the necking strain shown in Figure 4.2a, and fitting a
0
100
200
300
400
500
0 0.01 0.02 0.03 0.04
Stre
ss (
MP
a)
Strain (mm/mm)
0
50
100
150
200
0 0.05 0.1 0.15
X (
MP
a)
𝜀𝑝
Experimental data
Log. (Experimentaldata)Trend Line
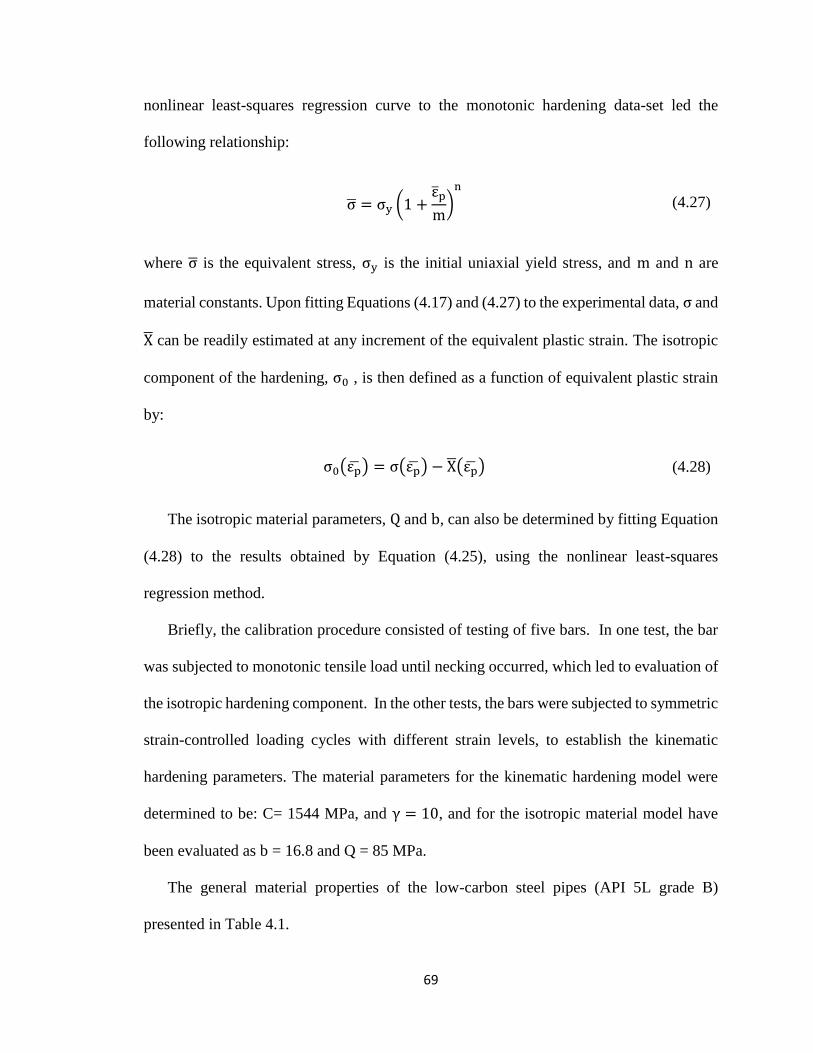
69
nonlinear least-squares regression curve to the monotonic hardening data-set led the
following relationship:
σ̅ = σy (1 +ε̅p
m)
n
(4.27)
where σ̅ is the equivalent stress, σy is the initial uniaxial yield stress, and m and n are
material constants. Upon fitting Equations (4.17) and (4.27) to the experimental data, σ and
X̅ can be readily estimated at any increment of the equivalent plastic strain. The isotropic
component of the hardening, σ0 , is then defined as a function of equivalent plastic strain
by:
σ0(εp̅) = σ(εp̅) − X̅(εp̅) (4.28)
The isotropic material parameters, Q and b, can also be determined by fitting Equation
(4.28) to the results obtained by Equation (4.25), using the nonlinear least-squares
regression method.
Briefly, the calibration procedure consisted of testing of five bars. In one test, the bar
was subjected to monotonic tensile load until necking occurred, which led to evaluation of
the isotropic hardening component. In the other tests, the bars were subjected to symmetric
strain-controlled loading cycles with different strain levels, to establish the kinematic
hardening parameters. The material parameters for the kinematic hardening model were
determined to be: C= 1544 MPa, and γ = 10, and for the isotropic material model have
been evaluated as b = 16.8 and Q = 85 MPa.
The general material properties of the low-carbon steel pipes (API 5L grade B)
presented in Table 4.1.

70
Table 4.1
Material properties obtained by standard tensile tests
Material type
Module of elasticity
(GPa)
Yield stress
(MPa)
Ultimate stress (MPa) Strain at failure
API 5L-B 198 290 415 3.8%
4.3 Finite Element Modeling Framework
In this phase of the study, the commercial software ABAQUS was used to develop a FE
framework to simulate the ratcheting response of dented steel pipes under cyclic loadings.
To verify the validity of the framework, firstly, the developed FE model reproduced the
three stages of the experimental test procedure described in previous chapter, including
indentation, monotonic and cyclic loading. The obtained results were then compared
against the results of the experimental study.
Eight-node, solid elements type C3D8R, with hourglass control and reduced integration
options were used to model the specimens. To reproduce the specimens’ boundary
conditions imposed during the experiments, the two lateral translational degrees of freedom
of the external nodes of the numerical model (at both ends) that fall within the Ringfeders
were constrained. The longitudinal degree of freedom at the bottom end nodes was
constrained but let free on the nodes located on the opposite end of the pipe. Moreover, a
finer mesh was used to model the region along the mid-region of the pipe. Mesh
configuration and orientation of model’s parts are presented in Figure 4.2.

71
Figure 4.3 Parts’ orientation and mesh configuration of the 3D finite element model
The modeling trials’ results indicated that to simulate the response of the material
within the indentation region with a reasonable accuracy, one should model the region with
at least three layers of elements (through the pipe’s thickness direction). Although
increasing the number of layers of elements through-the-thickness within the indentation
zone would produce more accurate results; however, it would require considerably longer
running time in simulating the cyclic loading effect. As a result, a compromise was made
to adopt a mesh with three layers of elements through the thickness, which produced a set
of reasonably accurate results within a practical time frame.
The element size and mesh refinement were established following Jiao and
Kyriakides’s experimental results (2009). They reported formation of approximately seven
wrinkles along the mid-region of their specimens, with an average wave length of
approximately 10 mm. With this in mind, that portion of the specimen was modeled by
discretizing the region by 100 rows of elements (along the axial direction of the specimen),
ensuring that the formation of wrinkles could be captured in the simulation.

72
As was done in the experiment, the cylindrical indenter was first pressed into the pipe
at the mid-span of the pipe, perpendicular to the pipe’s longitudinal axis. Then, the axial
loading was introduced to the model in two stages. First, to attain the desired axial strain
(developed in the gauge section), the model was axially compressed by applying prescribed
displacement to the nodes forming the end portions of the model. The resulting strain value
was comparable to the actual initial non-linear strain measured during the experiments. The
second loading stage involved application of pressure loading to the end portions of the.
4.3.1 Simulation of the Indention
Appropriate boundary conditions were applied to mimic the indention process. The
computational results indicated that it was sufficient to use three layers of 3D brick
elements through the wall thickness.
The indenter and the saddle were both surface hardened in the experimental phase of
the study. This allowed the indenter to be modelled as a 3D analytical rigid surface, which
comes into contact with the pipe outer surface. The coefficient of friction between
contacting surfaces was assumed to be 0.3 (Blachut and Iflefel, 2008). An analytical rigid
flat surface simulated the saddle which in contact with the lower end of the pipe reacted
the indentation force. The contact between the pipe and two rigid surfaces (indenter and
flat surface) was modeled by using the master-slave approach as described in ABAQUS
user’s manual. The advantage of using the analytical rigid surface option in ABAQUS is
the lower required computational effort in comparison to using rigid elements. More details
of the FE modeling procedure of pipes with defects can be found in (Blachut and Iflefel,
2008). Similar to the experiment, the dents were perpendicular to the pipe longitudinal axis
and located at the mid-span of the pipe.

73
Table 4.2, presents specimens’ geometric properties and the resulting indentation
produced by the FE simulation. It was tried to select test samples from the experimental
study that share similar geometry. This will help to focus the comparative study,
experiment versus simulation, only on the effect of the dent depth.
Table 4.2
Summary of specimens’ geometry and indentation results
Model No. D (mm) t (mm) D/t tmax/tmin* δ/D (%) δresidual/D (%) Fmax
** (kN)
CL10-2 56.04 1.61 34.81 1.63/1.54 10 6.7 6.39
CL12-2 56.04 1.61 34.81 1.67/1.55 12 8.3 7.46
CL14-1 56.05 1.62 34.60 1.64/1.57 14 9.6 8.03
* Maximum and minimum thickness through the pipe length
** Maximum indentation force
Figure 4.3 depicts a closer view of the model of specimen CL12-2 at various stages of
indentation.
(a) At the maximum depth (b) At the residual depth
Figure 4.4 FE simulation of the indentation process (a) during, and (b) after indenter removed

74
Denting was achieved by applying incremental vertical displacement to the rigid
indenter, as it was done during the experiment. The calculated indentation force is plotted
against the indentation depth ratio for both simulation and experiment in Figure 4.4. The
results are seen to follow the corresponding measured response very closely. The pipe was
unloaded incrementally essentially at the same point as in the experiment. Interestingly,
the unloading part of the response was also reproduced with less than 23% error.
However, there are two visible discrepancies apparent in the results. Firstly, the
maximum indentation load for simulation is slightly higher than the experimental value (by
0.51 kN). Secondly, the residual dent depth in the simulation is 11.4% of the pipe’s outer
diameter while the recorded value for the experiment is at 9.6%.
Figure 4.5 Variation of the denting force versus depth of dent
It should be emphasized that in order to accurately simulate the contact interaction
between indenter and pipe, several layers (at least 10 layers) of elements should be used to
model the pipe through the thickness (Blachut and Iflefel, 2008). The numerical trials that
0
1
2
3
4
5
6
7
8
9
10
0 0.05 0.1 0.15
Ind
enta
tio
n fo
rce
(kN
)
Indentation depth to pipe's outer diameter ratio
Experiment
Simulation
Model No.CL14-1

75
were carried out in this study validated the suggestion as well. For instance, one trial results
revealed that the residual dent depth could be reduced from 11.4% to 11% by incorporating
four layers of elements through pipe’s thickness (instead of three layers of elements).
However, this increase in the number of elements increased the run-time significantly,
especially when simulating a material’s response during a cyclic loading. Consequently, it
was concluded that the selected mesh produces reasonably accurate results. The reminder
of the numerical investigation was carried with the original mesh configuration. Table 4.3
compares results for dent depths of 10%, 12% and 14%.
4.3.2 Simulation of the Monotonic Loading
Figure 4.5 illustrates the numerical and experimental axial stress-strain results obtained for
a dented pipe subject to a monotonic axial loading condition. These results comprise the
second FE model’s verification. These results show a reasonable agreement between the
experimental and the numerical stress-strain results.
Table 4.3
Indentation force and residual dent depth, experiment versus simulation
Model No. δ/D (%)
δresidual/D (%) Fmax (KN)
Experiment Simulation Experiment Simulation
CL10-2 10 6.7 8.6 6.39 7.08
CL12-2 12 8.3 10.1 7.46 7.68
CL14-1 14 9.6 11.4 8.03 8.54

76
Figure 4.6 Comparison of the simulation and experiment results for the
monotonic loading
The deformed geometry of a representative dented pipe tested experimentally, and that
obtained through the numerical analysis are shown in Figure 4.6. As can be seen, an
axisymmetric wrinkle has been generated in the middle portion of the model, which
matches the shape and location of that in the actual article. It should be noted that, whereas
the wrinkle has a small and constant amplitude in the radial direction in the beginning stage
of loading, a further increase in the axial load causes the wrinkle’s amplitude to grow. The
radial amplification of the wrinkles, in turn lead to the degradation of the axial rigidity. As
in the actual case, the first wrinkle was observed to initiate in the dented region and then
the other wrinkles were subsequently developed and gradually propagated in the gauge
section along the pipe.
0
50
100
150
200
250
300
350
0 0.01 0.02 0.03 0.04
Ave
rage
no
rmal
str
ess
(MP
a)
Normal strain (mm/mm)
Simulation
Experiment

77
Figure 4.7 Deformed shapes of a typical indented pipe subjected to monotonic axial
load at specific axial strain values (left) the numerical simulation results at 4% strain;
(right) experiment at 3.8% strain
4.3.3 Simulation of the Cyclic Loading
Accurate simulation of the ratcheting behavior of specimens subjected to cyclic loadings
requires the selection of a suitable isotropic/kinematic hardening model and an evaluation
of the associated parameters. For this phase of the simulation, the values of the required
parameters were obtained through testing coupons of the same steel alloy used in the
experiments. The same loading regime used in the experiments (i.e., the same initial axial
non-linear strains, stress cycle amplitude and mean stress), was adopted in the numerical
model. It should be noted that in simulating the response of the material to cyclic load, the
failure cycle is assumed to be the cycle at which an element experiences a critical
equivalent plastic strain of 3.7%.
Results of the third and final FE model’s verification is presented in Figure 4.7 and
Table 4.4. The numerical predictions and experimental results for a dented specimen
subjected to axial cyclic loading are shown in Figure 4.7. The figure presents the variation

78
of axial strain against the mean axial stress over the middle section of the pipe. The cyclic
load was initiated at an initial gross axial strain of 2%. The numerical and experimental
results for dented pipes under different cyclic loadings are also summarized in Table 4.4.
Figure 4.8 Plot of the average peak axial strain versus number of cycles
In Figure 4.8, three subdivisions can be noted for the ratcheting behavior of the dented
pipe. In the first zone, the peak axial strain follows a non-linear decelerating trend (zone I)
and then shows a nearly linear response (zone II). At the final stage, the ratcheting strain
path again changes to be non-linear, following an exponential path (zone III). These three
zones are reported throughout the literature as being the three subdivisions of territory
ratcheting behavior (Zhang, 2005).
2
2.2
2.4
2.6
2.8
3
3.2
3.4
3.6
3.8
4
0 50 100 150 200 250
Ave
rage
Pea
k N
orm
al s
trai
n (
%)
Number of cycles
Experiment
Simulation
Model no. CL14-1
σm = 137.04 MPa
σa = 155.31 MPa
Zone II
Zone I
Zone III

79
In comparing the results shown in Figure 4.8 with the results of the available studies
on the ratcheting response of intact pipes under pure axial loading (Jiao and Kyriakides,
2009), one can see that the main difference lies within the transition region from zone-II to
zone-III. The curves’ slopes are very similar until the end of stage-II. However, a dented
pipe shows greater acceleration in ratcheting within the third stage. One reason for this
phenomenon is the formation of a so-called “hinge” around the dent when the ratcheting
path is approaching failure. The more cycles applied to the pipe, the more the semi-wrinkle
around the dent works as a hinge, and the more rapidly the average strain grows.
At this juncture, it should also be noted that the available discrepancy between the
experimental and actual results seen in Figure 4.7 is believed to be associated with the
followings:
• Discrepancy in simulation of the actual restrains.
• The imposed limitation on selecting fewer layers of elements through the
thickness of the pipe in the FE model.
• Untraceable misalignments of the experimental dents.
• The actual variation in pipe thickness along the test gauge of the pipe, which
could not be incorporated in the simulation.
Table 4.4
Ratcheting strain data for intact tubes under cyclic loading
Model no.
Number of loading cycles Initial
axial
strain
Peak strain before failure
Simulation Experiment Simulation Experiment
CL12-2 552 542 2% 3.58 3.52
CL14-1 226 251 2% 3.67 3.62

80
To elaborate on the role of the first factor, it should be noted that although the pipe is
perceived to be simply supported, the supports (i.e., the Ringfeders) apply a state of restrain
that is somewhat complex for actual and exact modeling. The simulation results are
extremely sensitive to the way the restraints are implemented in the FE models. This
becomes even more critical in the case of slender components undergoing an axial impact
event (i.e., a pulse-buckling event). It suffices to state that if one applies a simply supported
condition to the nodes forming the end of the pipes consider in this study, one would then
obtain a discrepancy with much larger value than the one seen in Figure 4.7. On the other
hand, the application of an appropriate contact algorithm in modeling the restraints
provided by the Ringfeders, one could further improve the accuracy of the simulation
result, but in the expense of extremely length run-times. Similar argument can be made for
selecting more number of layers through the pipes thickness in order to obtain more
accurate results. Since the main objective of the numerical investigation is to gain a better
understanding of the influence of the parameters that affect the ratcheting response of
dented pipes, it was concluded that the selected mesh and modeling technique could
produce results with accurate results.
4.4 Parametric Studies
The numerical model, as reported in the previous section, provided acceptable simulations
on the response of steel pipes under indentation, monotonic and cyclic axial loads. The
model was subsequently used for a parametric study on the behavior of the dented pipes.
The geometrical and material properties for the parametric study remained the same to
sample No. CL14-1. Effects of the following parameters were examined:

81
• Indentation depth
• Cyclic loading regime
• Cyclic mean stress and stress amplitude
• Hardening model parameters
The utilized model in the following sessions underwent a certain indentation depth,
after which it was subjected to an initial axial strain, and finally a cyclic load was applied.
4.4.1 Influence of Indentation Depth
In this section, the effect of dent depth on the ratcheting response of pipes was investigated.
For this, four initial dent depths were applied to steel pipes preceded by initial axial
monotonic compression to attain an initial axial strain of
ε̅x,initial ≈ 2%. The models were then subjected to cyclic loads with σm = 137.04 MPa
and σa = 155.31 MPa.
Figure 4.9 depicts the effects of indentation depth on a pipe’s tertiary ratcheting
response with respect to the zones depicted in Figure 4.8. The trend exhibits a similar trend
for Zone-I ratcheting for all indentation depth ratios. However, the increasing indentation
depth ratio had two effects on the linear part (or Zone-II) of ratcheting response: (i) the
slope of zone II increased, and (ii) it took fewer number of cycles to reach the third stage
of ratcheting. Comparatively, the indentation depth has a more profound effect on zone-
III; in other words, the slope of this region significantly increases, and its length elongated
as the indentation depth ratio increases.

82
Figure 4.9 Effect of indentation depth on ratcheting response of dented pipes
In summary, as can be seen in Figure 4.9, increasing the indentation depth ratio from
11% to 14% decreases the number of cycles from 867 to 226.
4.4.2 Influence of the Cyclic Load Regime
In this part of the parametric study, the effect of the cyclic load regime on the ratcheting
behavior of 12% dented pipes was investigated. The three studied load regimes were: i)
compression-compression, ii) compression-zero, and iii) compression-tension. To better
study the effect of each load regime, the peak compressive stress in all models was kept
constant, slightly above the material’s yield strength (i.e., at 296 MPa). Table 4.5 shows
the applied stresses and the number of cycles to failure in the models.
2
2.2
2.4
2.6
2.8
3
3.2
3.4
3.6
3.8
0 200 400 600 800 1000
Ave
rage
Pea
k ax
ial s
trai
n (
%)
Number of cycles
11%
12%
13%
14%
σm = 137.04 MPa
σa = 155.31 MPa
δ/D

83
Figure 4.10 depicts the average peak axial strains against the number of cycles. As can
be seen, the load regime has substantially shortened the length of the linear trajectory and
increased the slope of zone III of the pipe’s tertiary ratcheting response by changing from
compression-tension to compression-zero and then to compression-compression
conditions.
Figure 4.10 Effect of loading regime on ratcheting response of dented pipes
2
2.2
2.4
2.6
2.8
3
3.2
3.4
3.6
3.8
0 50 100 150 200 250 300
Ave
rage
pea
k ax
ial s
trai
n (
%)
Number of cycles
Compression-Compression
Compression-Zero
Compression-Tension
Table 4.5
Cyclic load regime effect for specimen CL12
Loading regime Mean stress
(MPa)
Stress amplitude
(MPa)
Maximum stress
(MPa)
Number
of cycles
to failure
Compression-compression I 155.31 140.69 296 258
Compression-compression II 151.65 144.35 296 190
Compression-zero 148 148 296 148
Compression-tension II 144.35 151.65 296 122
Compression-tension I 140.69 155.31 296 102

84
4.4.3 Influence of the Mean Stress and Stress Amplitude
To investigate the effect of axial mean stress and stress amplitude on the ratcheting
response dented pipes, a total of five scenarios is investigated. All the models were initially
indented up to 12% the pipe’s outer diameter. Then, they were subjected to monotonic axial
compression to attain an initial axial strain of
ε̅x,initial ≈ 2%. To study the stress amplitude effect, the subsequent cyclic axial loads
oscillated around a constant mean value for models No. 2 and 3. Whereas, the stress
amplitude remained constant and the mean stress was changed to investigate the mean
stress amplitude in models No. 4 and 5.
Table 4.6 provides a summary of the applied stresses and results. The number of cycles
to failure decrease considerably by increasing the axial mean stress and stress amplitude.
Another observation that can be made from this table is the greater impact of stress
amplitude over mean stress. Comparison of scenarios 2 and 4 or 3 and 5 shows that when
the maximum stress is kept constant, the pipe subjected to higher stress amplitude fails
sooner than one under higher mean stress. The maximum stress for scenarios 2 and 4 is
294.17 MPa. As stated earlier, due to the higher stress amplitude, pipe of scenario 4 failed
after 404 cycles, whereas the number of cycles to failure for scenario 2 was 508.
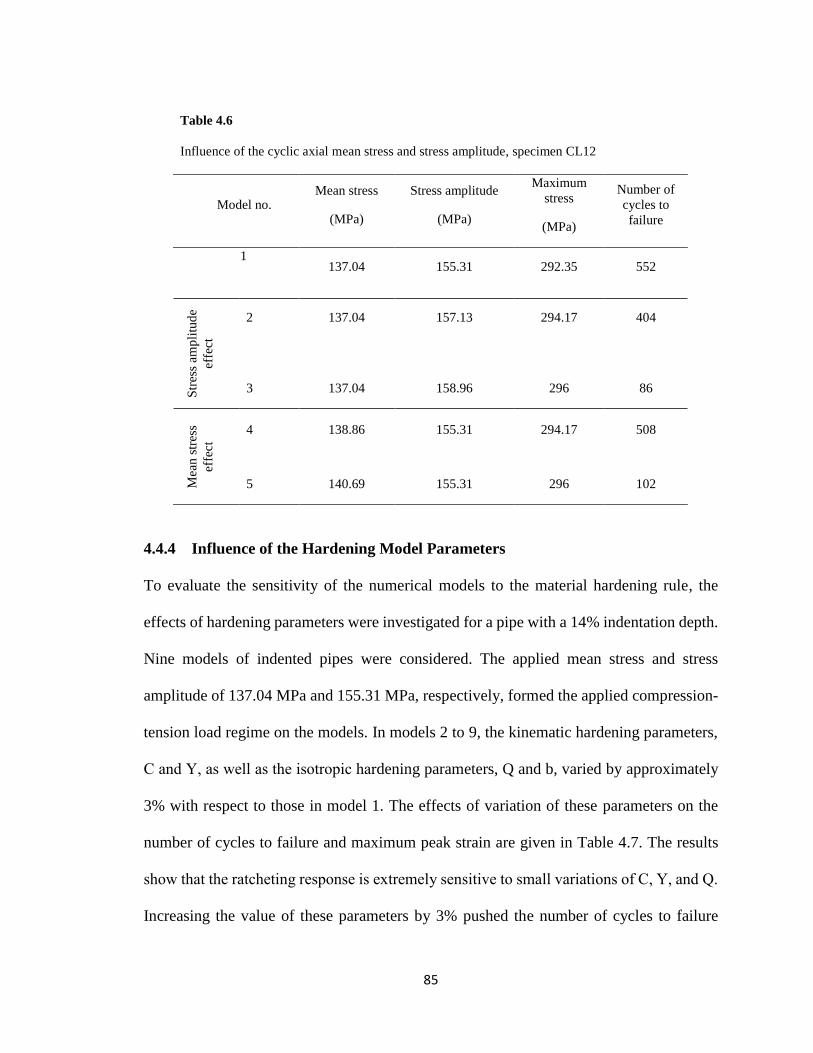
85
4.4.4 Influence of the Hardening Model Parameters
To evaluate the sensitivity of the numerical models to the material hardening rule, the
effects of hardening parameters were investigated for a pipe with a 14% indentation depth.
Nine models of indented pipes were considered. The applied mean stress and stress
amplitude of 137.04 MPa and 155.31 MPa, respectively, formed the applied compression-
tension load regime on the models. In models 2 to 9, the kinematic hardening parameters,
C and Υ, as well as the isotropic hardening parameters, Q and b, varied by approximately
3% with respect to those in model 1. The effects of variation of these parameters on the
number of cycles to failure and maximum peak strain are given in Table 4.7. The results
show that the ratcheting response is extremely sensitive to small variations of C, Υ, and Q.
Increasing the value of these parameters by 3% pushed the number of cycles to failure
Table 4.6
Influence of the cyclic axial mean stress and stress amplitude, specimen CL12
Model no. Mean stress
(MPa)
Stress amplitude
(MPa)
Maximum
stress
(MPa)
Number of
cycles to
failure
1 137.04 155.31 292.35 552
Str
ess
amp
litu
de
effe
ct
2 137.04 157.13 294.17 404
3 137.04 158.96 296 86
Mea
n s
tres
s
effe
ct
4 138.86 155.31 294.17 508
5 140.69 155.31 296 102

86
beyond 1,000 cycles. Furthermore, decreasing the values of these three parameters did not
change the number of cycles to failure markedly.
Table 4.7.
Effect of different material hardening parameters, specimen CL14-1
Model
no.
Mean
Stress
(MPa)
Stress
amplitude
(MPa)
C (MPa) Υ Q (MPa) b
Number of
cycles to
failure
Max
peak
strain
(%)
1 137.04 155.31 1544 10 85 16.8 226 3.67
2 1544 9.7 85 16.8 310 3.68
3 1544 10.3 85 16.8 226 3.62
4 1498 10 85 16.8 84 3.50
5 1590 10 85 16.8 >1000 3.14
6 1544 10 82.5 16.8 72 3.48
7 1544 10 87.5 16.8 >1000 3.57
8 1544 10 85 16.3 106 3.54
9 1544 10 85 17.3 >1000 3.53
Decreasing the values of C, Υ, and Q by the same amount lowered the number of cycles
to failure to 84, 72 and 106, respectively. On the other hand, the results show that the
ratcheting response is less sensitive to changes in parameter b. With a variation of around
±3% in the value of b, the number of cycles to failure changed from 226 (model no. 1) to
a maximum of 310 (model no. 2) and remain the same 226 cycles, but with a lower peak
strain in model no. 3.

87
4.5 Concluding Remarks
In this chapter, the low cycle fatigue response of dented pipes undergoing monotonic and
cyclic axial loads was numerically simulated. A combined non-linear isotropic/kinematic
hardening material model was utilized to capture the cyclic response of the dented pipes.
Moreover, the results were compared with the experimental tests data carried in the
previous chapter. The experimental and numerical results showed a reasonable degree of
agreement. The effects of loading conditions and hardening model parameters were also
investigated. The following contribution and observations were obtained from this phase
of the study investigation:
(i) The pipe indentation, monotonic and cyclic loading were simulated using solid
finite element models. Similar to the experiment, it was observed that the
indentation depth significantly shortened the ratcheting life-cycles of dented
pipes compared to their life-cycles observed under monotonic loading
condition.
(ii) It was shown that the ratcheting response of dented pipes was governed by the
maximum stress, stress amplitude and mean stress. The results reported in Table
4.6 indicated that the ratcheting response of the pipes was mainly controlled by
the magnitude of the maximum applied stress, i.e. σm + σa, in each cycle.
However, by maintaining the same maximum stress, higher stress amplitude
contributed to the ratcheting response more than the mean stress. This agrees
with the empirical findings of the previous chapter which addressed the axial
ratcheting behavior of dented pipes.
88
(iii) It was shown that necessary requirements for success of the model are correct
modeling of material hardening parameters. The applied stress, σmax, caused
the pipe to fail after a certain number of cycles for the calibrated hardening
parameters used in the material model. However, it was observed that a minor
change in the value of each of the variables resulted in a noticeable change in
the relative difference between the maximum applied stress, σx,max, and the
ultimate stress used in defining the material model; this, in turn, affected the
ratcheting response in a dramatic fashion. It was concluded that the simulation
of the ratcheting response of dented pipes was extremely sensitive to the
parameters used to define the non-linear isotropic/kinematic hardening material
parameters. Thus, choosing accurate values for these parameters is essential for
obtaining a proper simulation of the strain ratcheting response of dented pipes.

89
Chapter 5
Life Estimation of Dented Pipes undergoing Low Cycles of Large Reverse
Bending Moments
5.1 Summary
As noted, the response of dented pipes undergoing pure cyclic axial loads was investigated
experimentally and numerically as presented in chapters 3 and 4, respectively. In this part
of the thesis, the attention is shifted towards the influence of pure cyclic bending loads on
the flexural rigidity of the dented pipes.
Bending of pipes leads to ovalization of the pipe cross-section (change of the outside
diameter/original outside diameter, ∆Do/Do). Reverse bending and subsequent repeated
cyclic bending may cause a gradual growth of ovalization. The increasing ovalization
causes a progressive reduction in the bending rigidity of the pipe. In the presence of a dent,
the final stage of local instability of the pipe cross-section is accompanied by initiation of
fatigue cracks. Under cyclic loads, the cycle at which fatigue cracks initiate is considered
as the failure cycle.
In this phase of the study, the influence of dent depth in the flexural rigidity of pipes
and evolution of ovalization under low cycles of curvature-controlled symmetric cyclic
bending is investigated. Moreover, two empirical formulas are proposed to estimate the
remaining in-service life of dented pipes. The first formula estimates the number of cycles
until local instability of pipe’s cross-section and consequently, initiation of fatigue cracks.
The second equation predicts the variation of ovalization as a function of the applied
loading cycles.

90
5.2 Experiment Layout and Procedures
The pipes are laterally indented using a spherical indenter to four initial dent depth-to-outer
diameter ratios of 12.5%, 15%, 17.5% and 20%. The indenter was removed to form an
unconstrained dent for the next phases of the experiment. The pipes were subsequently
subjected to symmetric bending cycles under a curvature-controlled scheme until fatigue
cracking was observed within the dented region.
5.3 Experimental Set-up
To carry out the quasi-static cyclic bending tests on the dented pipes, the specimens were
first dented using a 10-mm diameter spherical indenter1. Each pipe was supported by a 114
mm x 60 mm flat steel plate during the denting procedure. A solid spherical indenter made
of high-strength steel with a diameter of 10 mm, was used throughout.
Four different initial indentation depth ratios (δ/Do) of 12.5%, 15%, 17.5%, and 20%
were considered to study the effect of cyclic symmetric bending loads of different
magnitudes. The rate of applied displacement used to create the dents was kept at 0.1
mm/min. The indenter was removed once the prescribed depth of dent was obtained. The
final recorded (after rebound) depths of indentation of the pipes were 5.33%, 7.21%, 8.4%,
and 10.03%.
The pipes were subsequently subjected to symmetric tension-compression bending
cycles under a curvature-controlled scheme until fatigue cracking was observed within the
dented region.
1 To avoid any minor misalignment of a cylindrical indenter on pipe, as experienced in
chapter 3, a spherical indenter is utilized in this phase.

91
A four-point bending fixture was used for conducting the experiments. The test set up,
as shown in Figure 5.1, is composed of six main components, including a cross head, a
lower section, roller bearings, extension limbs, an ovalization measurement device, and a
digital inclinometer.
(a) Opening bending moment (b) Closing bending moment
(c) Schematic design of the set up
Figure 5.1 Test set up for ovalization measurement under cyclic four-point bending
load – the dent is located on the upper surface

92
In the arrangement shown in Figure 5.1, the test specimen, with the dent side up, is
mounted within roller bearing supports through the extension limbs, within an Instron servo
hydraulic testing machine model 8500+, equipped with digital controller. Within the
Instron, the cross-head remains stationary, to which a 250 kN load cell is bolted on. The
movement of the actuator in the lower portion of the machine applies curvature onto the
specimens. The actual magnitudes of the curvature, and bending moment are then
extrapolated (Chang and Pan, 2009).
The moment, curvature, and ovalization data were normalized with respect to M0(=
σoDo2t), κo(= t Do
2)⁄ and Do, respectively, where σo is the 0.2% strain offset yield stress.
Each specimen is hinged to two stiff tubular rods (the extension limbs), with surface
hardened steel pins. The length and the diameter of these extensions are 25” (635 mm) and
1.25” (31.75 mm), respectively. Furthermore, the material is high-strength steel, with the
measured yield strength of 735 MPa. The two ends of the extension limbs are connected to
the crosshead vertical beam through the roller bearings, thus subjecting the specimen to a
four-point bending loading scheme. Once the lower actuator moves, the reaction forces are
developed at the limbs’ ends, thereby subjecting the specimen to a pure bending state. It
should be noted that with this arrangement, the localized strains developed at the contact
region between the limbs and the inner pipe wall would not be generating any local
deformation in the pipe.
An ovalization measuring apparatus, similar to the one designed and reported by
Kyriakides and Shaw (1987), was used to record the pipe's cross-section deformation. The
device consists of an LVDT displacement transducer that is mounted on the dented cross-

93
section of the pipe, which monitors the change in the diameter of pipe’s cross section during
cyclic loading.
The curvature measuring device is an inclinometer (TURCK Co., B2N45H-Q20L60-
2LU3-H1151). The inclinometer is bonded to the top end surface of the pipe (see Figure
5.2), to monitor the tilt angle during loading.
Figure 5.2 Longitudinal deformation developed between the two ends of the pipe
under pure bending
In Figure 5.2, the change in angle detected by the inclinometer is denoted as θ. The
value of Lo is determined by the following relationship:
L0 = 2ρθ (5.1)
where ρ is the radius of curvature. The curvature of the tube, κ𝑐, is then evaluated by the
following equation.
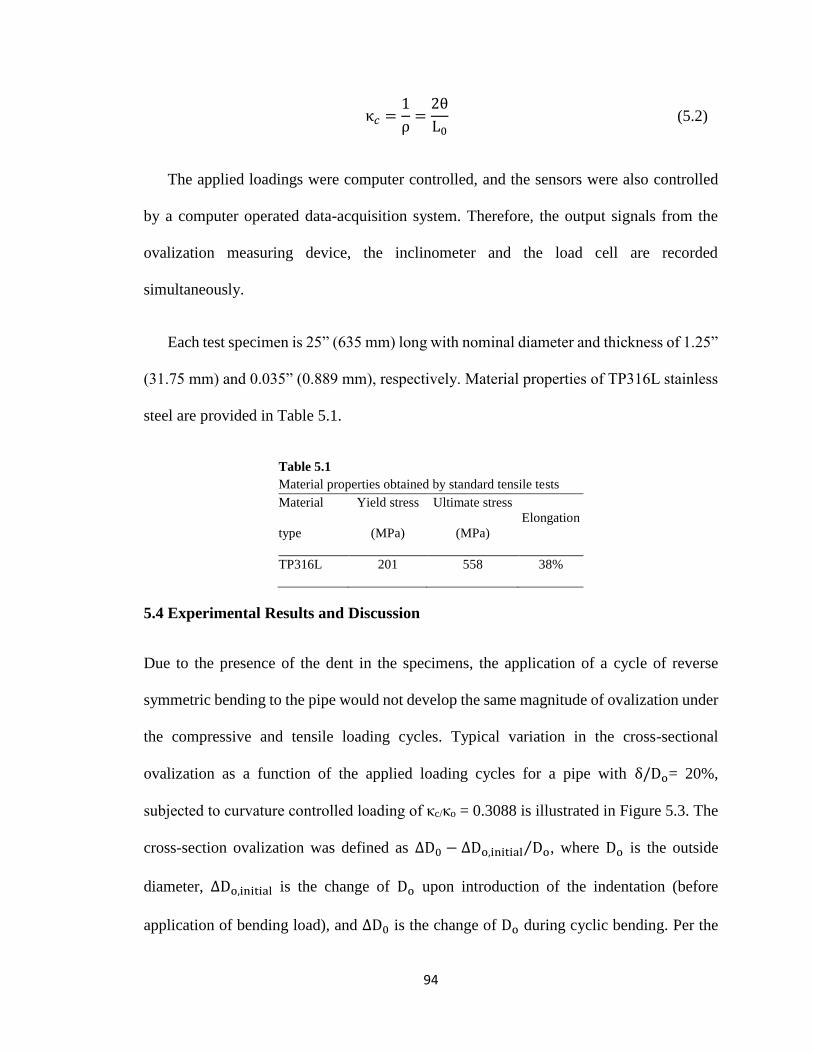
94
κ𝑐 =1
ρ=
2θ
L0 (5.2)
The applied loadings were computer controlled, and the sensors were also controlled
by a computer operated data-acquisition system. Therefore, the output signals from the
ovalization measuring device, the inclinometer and the load cell are recorded
simultaneously.
Each test specimen is 25” (635 mm) long with nominal diameter and thickness of 1.25”
(31.75 mm) and 0.035” (0.889 mm), respectively. Material properties of TP316L stainless
steel are provided in Table 5.1.
Table 5.1
Material properties obtained by standard tensile tests
Material
type
Yield stress
(MPa)
Ultimate stress
(MPa)
Elongation
TP316L 201 558 38%
5.4 Experimental Results and Discussion
Due to the presence of the dent in the specimens, the application of a cycle of reverse
symmetric bending to the pipe would not develop the same magnitude of ovalization under
the compressive and tensile loading cycles. Typical variation in the cross-sectional
ovalization as a function of the applied loading cycles for a pipe with δ/Do= 20%,
subjected to curvature controlled loading of κc/κo = 0.3088 is illustrated in Figure 5.3. The
cross-section ovalization was defined as ∆D0 − ∆Do,initial Do⁄ , where Do is the outside
diameter, ∆Do,initial is the change of Do upon introduction of the indentation (before
application of bending load), and ∆D0 is the change of Do during cyclic bending. Per the

95
illustrated results, the application of the so-called closing moment, by which the dented
region becomes subjected to a compressive loading state, generated a larger ovalization
growth than that developed under the opening moment (tensile loading cycle). Moreover,
as the dented region became subjected to more tensile (opening) loading cycles, after a
certain number of cycles, a crack developed in the dented region. The initiation and
propagation of the resulting cracks in the dented region of the pipe were found to cause
fatigue failure, augmented by the progressive accumulation of the cross-section ovalization
during the cyclic loading.
Thus, the corresponding cycle at which the size of the ovalization region started to
decrease in the opening moment was referred to as the fatigue failure cycle (Nf).
Figure 5.3 Variations in cross-section ovalization versus number of cycles of a pipe
with δ Do⁄ = 20% subjected to curvature controlled (κc/κo= 0.3088)
Figure 5.4 presents the experimental results in the form of moment–curvature
hysteresis for TP316L stainless steel pipes with δ/Do ratios of 12.5%, 15%, 17.5%, and

96
20%, respectively. As can be seen, the moment-curvature loops for all δ/Do ratios became
gradually steady after a few cycles. This would indicate that the TP316L stainless steel
pipes indeed hardened upon the application of the symmetrical curvature cyclic loadings.
It can, therefore, be expected that under such a loading condition, a relatively lower
magnitude of bending moment would cause deformation of the pipe into the desired
curvature, since a larger plastically deformed region would be developed in pipes with
greater δ/Do ratios. However, the process also resulted in an unnoticeable decrease in the
recorded bending moments for pipes with larger δ/Do ratios. In other words, when the
width of the loops decreased (which occurs at higher δ/Do ratios), the effect of δ/Do ratio
on the moment-curvature curves became greater.
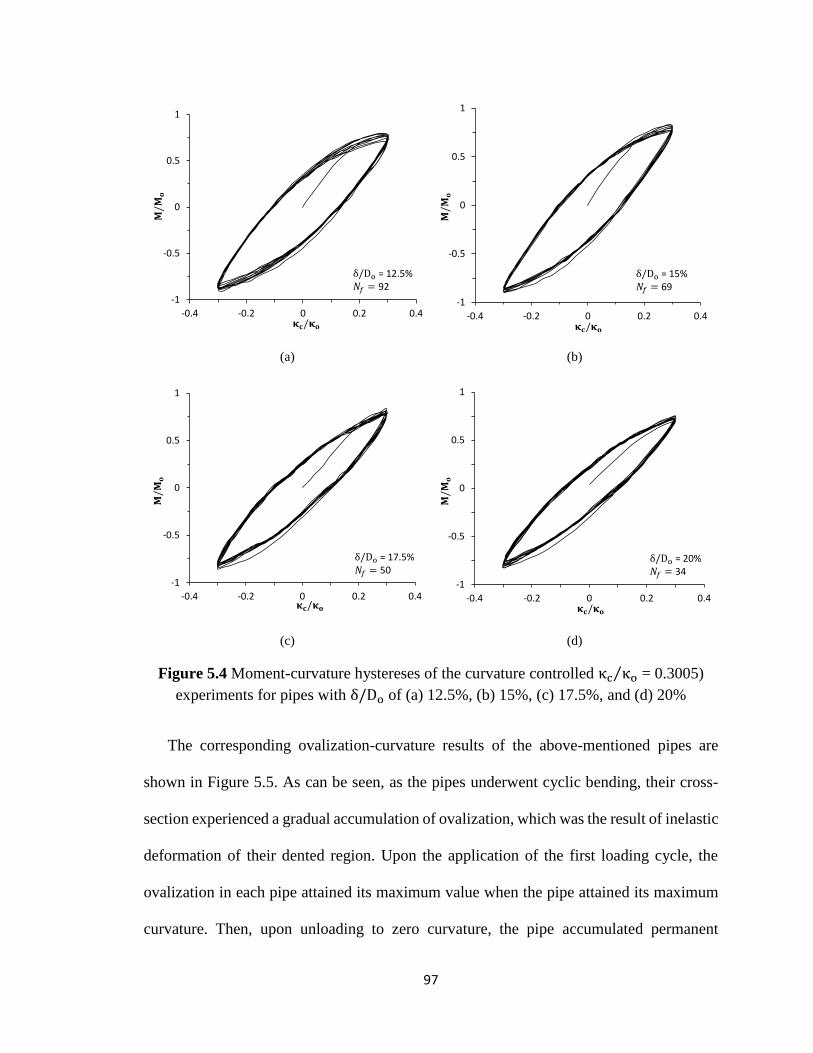
97
(a) (b)
(c) (d)
Figure 5.4 Moment-curvature hystereses of the curvature controlled κc κo⁄ = 0.3005)
experiments for pipes with δ/Do of (a) 12.5%, (b) 15%, (c) 17.5%, and (d) 20%
The corresponding ovalization-curvature results of the above-mentioned pipes are
shown in Figure 5.5. As can be seen, as the pipes underwent cyclic bending, their cross-
section experienced a gradual accumulation of ovalization, which was the result of inelastic
deformation of their dented region. Upon the application of the first loading cycle, the
ovalization in each pipe attained its maximum value when the pipe attained its maximum
curvature. Then, upon unloading to zero curvature, the pipe accumulated permanent
-1
-0.5
0
0.5
1
-0.4 -0.2 0 0.2 0.4𝛋𝐜/𝛋𝐨
𝐌/𝐌
𝐨
δ/Do = 12.5%𝑁𝑓 = 92
-1
-0.5
0
0.5
1
-0.4 -0.2 0 0.2 0.4𝛋𝐜/𝛋𝐨
𝐌/𝐌
𝐨
δ/Do = 15%𝑁𝑓 = 69
-1
-0.5
0
0.5
1
-0.4 -0.2 0 0.2 0.4
δ/Do = 17.5%𝑁𝑓 = 50
𝛋𝐜/𝛋𝐨
𝐌/𝐌
𝐨
-1
-0.5
0
0.5
1
-0.4 -0.2 0 0.2 0.4𝛋𝐜/𝛋𝐨
𝐌/𝐌
𝐨
δ/Do = 20%𝑁𝑓 = 34

98
deformation in its cross-section. The ovalization subsequently further increased as the pipe
underwent the reverse bending that forced the pipe to attain its minimum curvature. Cycle
by cycle, the ovalization continued evolving to a point that it reached a certain critical value
and a fatigue crack developed in the dented region. It was also observed that the ovalization
grew in a faster rate when the applied δ/Do ratio was higher.
(a) (b)
(c) (d)
Figure 5.5 Variation in cross-section ovalization of pipes subjected to curvature
controlled (κc κo⁄ = 0.3005) loading scenario with δ/Do of (a) 12.5%, (b) 15%, (c)
17.5%, and (d) 20%
-0.02
-0.01
0
0.01
0.02
0.03
0.04
-0.4 -0.2 0 0.2 0.4
(ΔD
o-Δ
Do
,init
ial)/
Do
𝛋𝐜/𝛋𝐨
δ/Do = 12.5%Nf = 92
-0.02
-0.01
0
0.01
0.02
0.03
0.04
-0.4 -0.2 0 0.2 0.4
(ΔD
o-Δ
Do
,init
ial)/
Do
δ/Do = 15%Nf = 69
𝛋𝐜/𝛋𝐨
-0.04
-0.02
0
0.02
0.04
0.06
0.08
0.1
-0.4 -0.2 0 0.2 0.4
(ΔD
o-Δ
Do
,init
ial)/
Do
κc/κo
δ/Do = 17.5%Nf = 50
-0.04
-0.02
0
0.02
0.04
0.06
0.08
0.1
-0.4 -0.2 0 0.2 0.4
(ΔD
o-Δ
Do
,init
ial)/
Do
𝛋𝐜/𝛋𝐨
δ/Do = 20%Nf = 34

99
Figure 5.6 illustrates the variation in the average ovalization per cycle as a function of
the number of loading cycles (N), for pipes tested at a constant curvature. As seen from the
above figures, the number of cycles causing fatigue failure became significantly low as the
cross-section ovalization increases rapidly in pipes with larger dent ratios. It can also be
stated that a higher curvature values caused greater ovalization growth rates (i.e., greater
∆D0 − ∆D0,initial D0⁄ ).
(a) (b)
(c) (d)
Figure 5.6 Plot of cross-section ovalization, ∆D0 − ∆D0,initial D0⁄ , versus number of
loading cycles, N, for pipes with δ Do⁄ of (a) 12.5%, (b) 15%, (c) 17.5%, and (d) 20%
0
0.01
0.02
0.03
0.04
0.05
0.06
0 20 40 60 80 100
(ΔD
o-Δ
Do
,init
ial)/
Do
N
0.3088
0.3005
0.2921
0.2838
0.2754
ΔDo,initial/Do=0.053
κc/κo
0
0.01
0.02
0.03
0.04
0.05
0.06
0.07
0.08
0 50 100
(ΔD
o-Δ
Do
,init
ial)/
Do
N
0.3088
0.3005
0.2921
0.2838
0.2754
ΔDo,initial/Do=0.072
κc/κo
0
0.01
0.02
0.03
0.04
0.05
0.06
0.07
0.08
0 20 40 60 80 100
(ΔD
o-Δ
Do
,init
ial)/
Do
N
0.2671
0.27540.2838
0.2921
0.3005 κc/κo
ΔDo,initial/Do=0.084
0
0.01
0.02
0.03
0.04
0.05
0.06
0 20 40 60 80 100
(ΔD
o-Δ
Do
,init
ial)/
Do
N
ΔDo,initial/Do=0.100
0.2671
0.27540.2838
0.3088 0.2921κc/κo

100
It should be noted that the onset of crack initiation in each pipe’s dented region occurred
at the cycle number that corresponds to the end of each curve shown in Figure 5.6.
Moreover, the graphs show two relatively distinct response stages (the initial and secondary
stages). In the initial stage, once cyclic bending is initiated, the magnitude of ovalization
increases; it is, therefore, clear that a great portion of the ovalization occurs during the
initial stage. The ovalization growth enters the secondary stage when the rate of ovalization
gradually decreases; nevertheless, the ovalization increases steadily as a function of the
applied loading cycles within this stage, finalized by the fatigue failure of the pipe.
5.5 Curvature versus Number of Cycles to Failure
Figure 5.7 illustrates variation in the curvature as a function of number of cycle to failure,
Nf, for pipes with δ/Do ratios of 12.5%, 15%, 17.5%, and 20%. As seen, at a given
curvature, as the value of δ/Do ratio increases, the value of ovalization increases as well,
and the pipe fails at lower number of cycles. Similar trend was observed when 6061-T6
aluminum and 1018 steel pipes were tested by Kiriakides and Shaw (1987), and also by
Lee et al. (2001), when they examined SUS 304 stainless steel pipes.

101
Figure 5.7 Variation of cross-section ovalization versus curvature for pipes tested
under curvature controlled ( κc κo⁄ = 0.3005) loading
Kyriakides and Shaw (1987) proposed an empirical equation, relating κc κo⁄ and Nf
with the following mathematical form:
Kc Ko⁄ = A(Nb)−α (5.3)
where A and are material related parameters. The parameter A corresponds to the
controlled cyclic curvature magnitude at the first bending cycle (i.e., Nb = 1), and α is the
slope of the line constructed by plotting the data illustrated in Figure 5.7 in a log-log scale.
Equation (5.3) has been widely used for simulating curvature-controlled cyclic bending
tests.
The log-log plot of the normalized curvature versus number of cycle to failure, Nf, of
the data presented in Figure 5.7 is illustrated in Figure 5.8. The dashed lines are constructed
by the least-square fitting of the data. As can be seen, the data corresponding to each tested
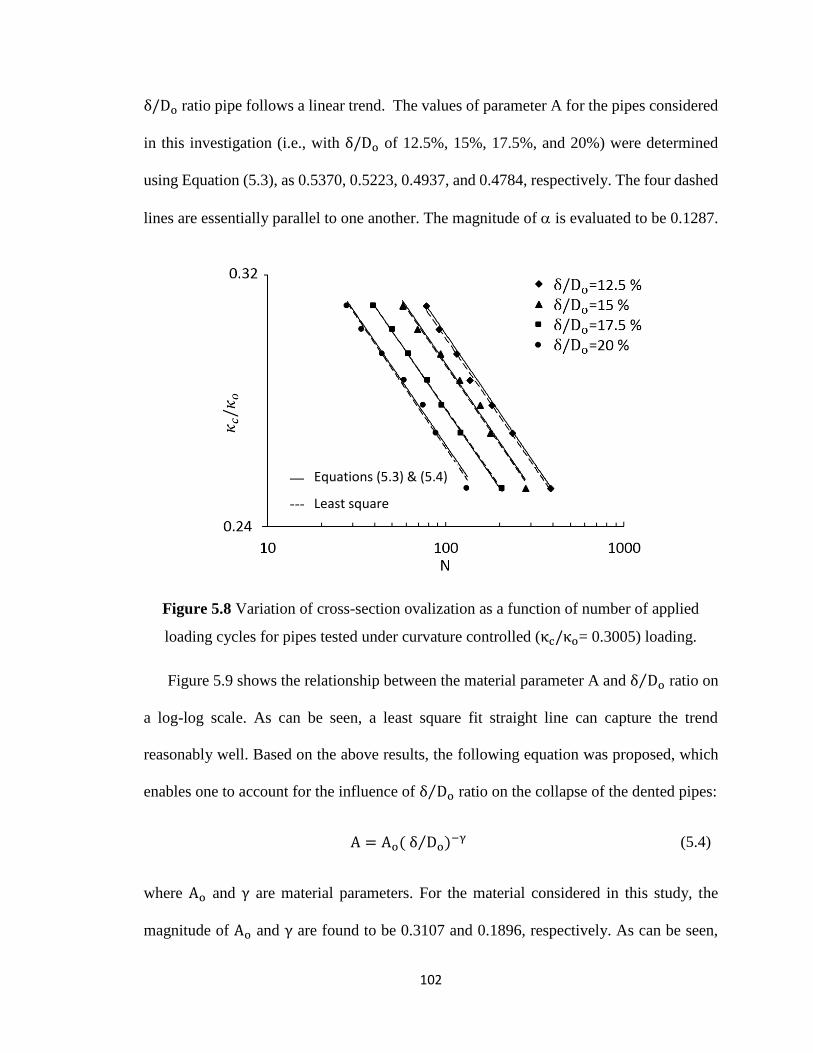
102
δ/Do ratio pipe follows a linear trend. The values of parameter A for the pipes considered
in this investigation (i.e., with δ/Do of 12.5%, 15%, 17.5%, and 20%) were determined
using Equation (5.3), as 0.5370, 0.5223, 0.4937, and 0.4784, respectively. The four dashed
lines are essentially parallel to one another. The magnitude of is evaluated to be 0.1287.
Figure 5.8 Variation of cross-section ovalization as a function of number of applied
loading cycles for pipes tested under curvature controlled (κc/κo= 0.3005) loading.
Figure 5.9 shows the relationship between the material parameter A and δ Do⁄ ratio on
a log-log scale. As can be seen, a least square fit straight line can capture the trend
reasonably well. Based on the above results, the following equation was proposed, which
enables one to account for the influence of δ Do⁄ ratio on the collapse of the dented pipes:
A = Ao( δ Do⁄ )−γ (5.4)
where Ao and γ are material parameters. For the material considered in this study, the
magnitude of Ao and γ are found to be 0.3107 and 0.1896, respectively. As can be seen,
Equations (5.3) & (5.4)
Least square

103
the variation follows a linear trend, thus, the relationship can be represented by a linear
least square fit, as illustrated. The final shape of the tested pipes are illustrated in Figure
5.10.
Figure 5.9 Variation of material parameter A as a function of (δ Do⁄ ) ratio
Figure 5.10 Final shapes of the pipes tested under symmetric cyclic bending loads
Experiment
Equations (5.4)

104
5.6 Ovalization versus Number of Cycles to Failure
The variation of cross-section ovalization as a function of the applied loading cycles
illustrated in Figure 5.6, closely resembles the creep response (strain–time curve) of a
metallic alloy when subject to uniaxial loading (Chang and Pan, 2009).
At this juncture, therefore, the applicability of a modified version of the Bailey–Norton
law, for characterization of the ovalization response in dented pipes, is considered.
The Bailey–Norton law, which was originally developed for characterizing uniaxial
creep in metals is mathematically represented as follows:
εc = B(σ)m(t)n (5.5)
Here, εc is the creep strain, σ is the hold uniaxial creep stress, t is the Newtonian time, and
B, m and n are material related constants. Following a similar structure, the following
mathematical relationship is proposed by the author to relate the ovalization to the rate of
curvature and number of loading cycles by:
∆D0 − ∆D0,initial D0⁄ = B(κc κo⁄ )mNn (5.6)
where m and n are material constants and B is a function of the δ Do⁄ ratio. Following the
above relationship, the magnitudes of m and n are determined to be 13.066 and 0.3753,
respectively, for the steel alloy used in this study. Based on the experimental data, the
values of parameter B are 5,270, 74,225, 111,528, and 151,783 for the pipes with (δ Do)⁄
ratios of 12.5%, 15%, 17.5%, and 20%, respectively. Furthermore, the following
relationship is also proposed for establishing the value of parameter B.

105
Figure 5.11 Variation of the material parameter B as a function of (δ Do⁄ )
B = Bo( δ Do⁄ )−γ (5.7)
where Bo and γ are material constants. Based on the results presented in Figure 5.11, the
magnitudes of Bo and γ are evaluated to be 8.1x10⁶ and 1.738, respectively. The
comparison of the results obtained using Equation (5.6) and the experimental data are
shown in Figure 5.12. As can be seen, the predicted results corroborate with the
experimental data quite well, thereby validating the integrity of the proposed equation.

106
(a) (b)
(c) (d)
Figure 5.12 Comparison of the results obtained using the proposed equation and the
experimental data for pipes with δ Do⁄ of (a) 12.5%, (b) 15%, (c) 17.5%, and (d) 20%
5.7 Concluding Remarks
Evaluation of the safe in-service life of a dented pipeline is an important and a critical task
in a fitness-for-purpose assessment process. However, to the best of author’ knowledge, no
study has investigated the effect of cyclic bending load on the life-cycle of metallic dented
pipes. The work presented in this chapter attempted to address the void in the literature
0
0.01
0.02
0.03
0.04
0.05
0.06
0 20 40 60 80 100
(ΔD
o-Δ
Do
,init
ial)/
Do
N
0.3088
0.3005
0.2921
0.2838
0.2754
ΔDo,initial/Do=0.0533
𝜅𝑐/𝜅𝑜
0
0.01
0.02
0.03
0.04
0.05
0.06
0.07
0.08
0 20 40 60 80 100
(ΔD
o-Δ
Do
,init
ial)/
Do
N
0.3088
0.3005
0.2921
0.2838
0.2754
ΔDo,initial/Do=0.0721
𝜅𝑐/𝜅𝑜
0
0.01
0.02
0.03
0.04
0.05
0.06
0 20 40 60 80 100
(ΔD
o-Δ
Do
,init
ial)/
Do
N
ΔDo,initial/Do=0.0840
0.2671
0.2754
0.2838
0.3088 0.2921 𝜅𝑐/𝜅𝑜
0
0.01
0.02
0.03
0.04
0.05
0.06
0 20 40 60 80 100
(ΔD
o-Δ
Do
,init
ial)/
Do
N
ΔDo,initial/Do=0.1003
0.2671
0.2754
0.2838
0.3088 0.2921 𝜅𝑐/𝜅𝑜
---- Experiment Equation (5.6)
---- Experiment Equation (5.6)
---- Experiment Equation (5.6)
---- Experiment Equation (5.6)

107
today. In doing so, the response of dented pipes made of TP316L stainless steel, in the form
of growth in their cross-section ovalization, as a result of applied symmetric cyclic loads,
was investigated experimentally. The experimental results provided a better understanding
of the resultant crack initiation response of dented pipes when subject to low frequency
cyclic bending. It is believed that the results presented in this study could be used as a
preliminary guideline for developing a comprehensive criterion that could be used for
assessing the response of dented pipes made of different materials, subject to cyclic
loadings. The following conclusions were drawn based on the findings of this study:
1. Behavior of dented pipes under an applied bending moment becomes
significantly influenced by the location of a dent (i.e., whether the dent is on
the compression side or tension side of the pipe. Such dented pipes respond in
a stronger manner when the dent is located on the surface that undergoes a
tensile loading.
2. The number of loading cycles causing failure of the dented pipes was found to
be inversely proportional to the indentation depth.
3. A linear trend could be observed when the graphs of pipe curvature versus the
number of cycles causing failure were plotted on a log-log scale.
4. Observation of the change in the moment-curvature of the pipes as a function
of the applied loading cycle revealed that such pipe exhibited a stiffer response
as the number of cycles was increased. The response reached a steady state
after a certain number of applied loading cycles.
5. An empirical relationship was developed for estimating the loading cycle
corresponding to the onset of crack initiation in dented pipes. Comparison of

108
the results produced by the suggested equation and those obtained
experimentally validated the accuracy of the proposed equation.
6. The variation in the pipes’ cross-section ovalization followed a trend that could
be described by the well-known Bailey–Norton model. The second proposed
empirical equation was obtained by modifying the Baily-Norton’s equation.
This formula proved to be accurate in simulating the pipe’s cross-section
ovalization as a function of the applied loading cycles and curvature.

109
Chapter 6
Conclusion
6.1 Summary
In this thesis, the ratcheting and low cycle fatigue response of dented pipes undergoing
quasi-static cyclic loads were investigated through a series of experiments conducted on
small-scale pipe samples, and performing detailed nonlinear FE analysis. The investigation
addressed the response, and in-service life estimation of dented pipes undergoing inelastic
cycles of axial, and flexural loads. The research was carried out within three phases. The
resulting collection forms a complimentary body of works, providing a better
understanding of the response of dented pipes. The three-part investigation outlined in this
thesis consisted of the following:
(i) Experimental investigation of strain-ratcheting response of dented pipes
undergoing cyclic axial loading (outlined in Chapter 3).
(ii) Development and calibration of a robust FE framework for modeling the
ratcheting response of dented pipes subjected to cyclic axial loading (outlined
in Chapter 4). The chapter also outlined details of a parametric FE study, by
which the influence of various parameters that affect the response of dented
pipes was comprehensively examined.
(iii) Life cycle estimation of dented pipes undergoing low cycles of large reversing
bending moments was outlined in Chapter 5. The chapter also introduced a
practical empirical equation for estimating life-cycle of the pipes.

110
Parts (i) and (ii) complement one another in the sense that part (ii) provides an alternative
robust and cost-effective FE approach for estimation of in-service life of dented pipes
undergoing cyclic axial loading. The highlight of part (iii) is the development of an
empirical equation by which practicing engineers can estimate the in-service life of dented
pipes subjected to pure bending cyclic loads.
6.2 Conclusions
While the conclusions of each chapter have been given at the end of the respective chapter,
only the most salient findings are outlined here:
• The contribution of dent depth in pipes subject to monotonic loading was observed
to be insignificant up to the limit load, whereas it noticeably affected the failure load
carrying capacity of the pipes. It was also observed that regardless of the nature of
the applied loads, collapse of pipes loaded monotonically or cyclically would
essentially occurs at the same average strain level. The experimental results revealed
that larger dent depths shortened the linear portion of the respective strain versus the
number of cycle curve and significantly affected the total number of cycles to failure;
the number of cycles prior to collapse dramatically decreased by as much as 75%
when the dent depth was increased by 2%.
• A FE model was developed as an alternative approach for estimation life cycle of
dented pipes undergoing cyclic axial loading. The model was successfully calibrated
by the results obtained from the experimental parts of the study. A set of parametric
FE analyses was performed to investigate the influence of mean stress, stress
amplitude, loading regime and hardening-related parameters. It was concluded that

111
the application of larger stress amplitudes (while maintaining the same maximum
stress) contributed to pipes earlier failure in comparison to the condition when pipes
were subjected to a higher mean stress. It was also observed that the combined non-
linear kinematic/isotropic hardening model was extremely sensitive to the material
parameters used in describing the model. It was therefore concluded that the lack of
an established standardized procedure for establishing the parameters used in the
model has limited the real-life applications of such computational approaches.
• An experimental framework was designed to investigate the ovalization growth of
dented pipes undergoing quasi-static cyclic bending. Based on the results, two
empirical formulas were developed and proposed to estimate the remaining in-
service life of dented pipes. The first empirical formula predicts the number of
loading cycles causing the local instability of a dented pipe’s cross-section, which
in turn would initiate a fatigue crack. The second empirical equation, derived based
on modification of the Bailey–Norton creep relationship, can be used to establish
the variation of cross-section ovalization as a function of the applied loading cycles.
6.3 Recommendations for Future Work
A stated, a comprehensive set of experimental and numerical investigations were carried
to increase understanding of the performance of dented pipes subject to cyclic axial and
bending loads. The objectives also included development of accurate and practical
equations for estimating the life cycle of the dented pipes. While the goals of the study
have been fulfilled, the following recommendations would complement the work presented
herein, and will enhance understanding of the complex mechanisms associated with the
performance of dented pipes subject to cyclic loads.

112
• The investigations undertaken in this thesis covered the influence of depth of a dent.
It would be very useful to also investigate the influence of
o shape of the dent (smooth or kinked)
o size of the dent (i.e., width and length ratios)
o whether the dent is on or near a girth weld
o and whether the dent contains any other defects (a gouge or a crack).
• Due to the experimental limitations, the influence of internal pressure, which is
considered as a primary load in pipelines, could not be included in the investigation.
The next practical step would be enhancement of the experiments and FE model by
including the internal pressure.
• The proposed empirical equations developed in this study presented interesting
insights. The proposed equations are based on simple frameworks and require a
fewer number of coefficients, thus are robust for use by practicing engineers.
However, the limitations of the equations should be established by investigating the
influence of various grades of steel and other materials.
• Less work-intensive (material properties intensive) hardening rule can be
implemented in the numerical simulation (Ahmadzadeh, 2013).
• The established FE framework presented in Chapter 4 could simulated the pipes’
performance satisfactorily. With further CPU power and parallel computation, it
should be feasible to consider the influence of existence of a fatigue crack and its
propagation (especially within the domain of the dent).

113
Bibliography
• Abdel-Karim, M. (2005). Shakedown of complex structures according to various hardening rules. International
Journal of Pressure Vessels and Piping, 82(6), 427-458.
• Abdel-Karim, M. (2005). Shakedown of complex structures according to various hardening rules. International
Journal of Pressure Vessels and Piping, 82(6), 427-458.
• Ahmadzadeh, G. R., & Varvani‐Farahani, A. (2013). Ratcheting assessment of materials based on the modified
Armstrong–Frederick hardening rule at various uniaxial stress levels. Fatigue & Fracture of Engineering
Materials & Structures, 36(12), 1232-1245.
• Alexander, C. R. (1999). Review of experimental and analytical investigations of dented pipelines. ASME
publications-PVP, 395, 197-210.
• Alexander, C. R., and Connelly, L. M. (1998). Analytical recreation of a dent profile considering varied soil,
operating, and boundary conditions (No. CONF-980213-). American Society of Mechanical Engineers, New
York, NY, USA.
• Alexander, C. R., and Kiefner, J. F. (1997). Effects of smooth and rock dents on liquid petroleum pipelines. In
1999 API Pipeline Conference, Dallas, TX, USA.
• API. (2000). Recommended practice for fitness-for-service (API RP579). American Petroleum Institute:
Washington, DC, USA.
• Armstrong, P. J., and Frederick, C. O. (1966). A mathematical representation of the multiaxial Bauschinger
effect. Central Electricity Generating Board and Berkeley Nuclear Laboratories, Research and Development
Department.
• ASME Boiler and Pressure Vessel Code (2007). Section VIII division I, appendix 2. American Society of
Mechanical Engineers, New York, NY, USA.
• ASME. (2012). Pipeline transportation systems for liquids and slurries (B31.4). New York, United States:
American Society of Mechanical Engineers.
• ASME. (2012). Gas transmission and distribution piping system (B31.8). New York, United States: American
Society of Mechanical Engineers.
• Azadeh, M., and Taheri, F. (2016). On the response of dented stainless-steel pipes subject to cyclic bending
moments and its prediction. Thin-Walled Structures, 99, 12-20.
• Azadeh, M., and Taheri, F. (2015). Computational simulation of ratcheting in dented pipes due to monotonic
and cyclic axial loading. The Journal of Strain Analysis for Engineering Design, 50(3), 163-174.
• Azadeh, M., and Taheri, F. (2014). Ratcheting response of dented pipes under monotonic and cyclic axial
loadings. The Journal of Strain Analysis for Engineering Design, 49(2), 122-132.
• Bari, S., and Hassan, T. (2002). An advancement in cyclic plasticity modeling for multiaxial ratcheting
simulation. International Journal of Plasticity, 18(7), 873-894.

114
• Beller, M. et al. (1991). Stress concentrations in pipelines due to the presence of dents. In proceedings of the
1st International Offshore and Polar Engineering Conference. International Society of Offshore and Polar
Engineers, Edinburgh, The United Kingdom.
• Błachut, J., and Iflefel, I. B. (2008). Experimental and numerical investigation of plain and gouged dents in
steel pipes subjected to pressure and moment loading. Journal of Pressure Vessel Technology, 130(2), paper
no. 021203, 1-9.
• Blanchard, J. P. et al. (2011). Ratcheting models for fusion component design. Fusion Science and Technology,
60(1), 313-317.
• Bood, R. et al. (1999). EPRG methods for assessing the tolerance and resistance of pipelines to external damage
(Part2), 3RInternational, 806-811.
• Bower, A. F., and Johnson, K. L. (1989). The influence of strain hardening on cumulative plastic deformation
in rolling and sliding line contact. Journal of the Mechanics and Physics of Solids, 37(4), 471-493.
• Brooker D. C. (2004). Denting of pressurized pipeline under localized radial loading. International Journal of
Mechanical Science, 46, 1783–1805.
• BS. (2005). Guide to methods for assessing the acceptability of flaws in metallic structures. (BS 7910) British
Standards Institution: London, UK.
• Chaboche, J. L. (1989). Constitutive equations for cyclic plasticity and cyclic viscoplasticity. International
Journal of Plasticity, 5(3), 247-302.
• Chang, K. H., and Pan, W. F. (2009). Buckling life estimation of circular tubes under cyclic
bending. International Journal of Solids and Structures, 46(2), 254-270.
• Chang, K. H. et al. (2005). Viscoplastic response and collapse of 316L stainless steel tubes under cyclic
bending. Steel and Composite Structures, 5(5), 359-374.
• Chen, X, et al. (2005). On the Ohno–Wang kinematic hardening rules for multiaxial ratcheting modeling of
medium carbon steel. International Journal of Plasticity, 21(1), 161-184.
• Corona, E., and Kyriakides, S. (1988). On the collapse of inelastic tubes under combined bending and pressure.
International Journal of Solids and Structures, 24(5), 505-535.
• Corona, E., and Kyriakides, S. (1991). An experimental investigation of the degradation and buckling of
circular tubes under cyclic bending and external pressure. Thin-Walled Structures, 12(3), 229-263.
• Cosham, A., and Hopkins, P. (2002). The pipeline defect assessment manual. In the proceedings of 4th
International Pipeline Conference (pp. 1565-1581). American Society of Mechanical Engineers, New York,
NY, United States.
• Cosham, A. et al. (2004). An experimental and numerical study of the effect of pre-strain on the fracture
toughness of line pipe steel. In the proceedings of International Pipeline Conference (pp. 1635-1652).
American Society of Mechanical Engineers, New York, NY, United States.
• CSA. (2015). Oil and gas pipeline systems (CAN/CSA-Z662-15). Canadian Standards Association, Toronto,
Canada.

115
• DiVito, L. et al. (2010). Ultra heavy wall line pipe X65: Ratcheting in severe cyclic straining. In the
proceedings of 29th International Conference on Ocean, Offshore and Arctic Engineering (pp. 899-910).
American Society of Mechanical Engineers, New York, NY, United States.
• DNV-OS-F101 (2013). Submarine pipeline systems, Det Norkse Veritas.
• Eiber, R. J. (1979). Causes of pipeline failures probed. Oil and Gas Journal, 77(52), 80-88.
• Fowler, J. R. et al. (1994). Cyclic pressure fatigue life of pipelines with plain dents, dents with gouges, and
dents with welds (Report No. AGA--94015627). American Gas Association, Inc., Arlington, VA, United
States.
• Fowler, J. R. et al. (1992). Criteria for dent acceptability of offshore pipelines (Report No. AGA-93007051).
American Gas Association, Inc., Arlington, VA, United States. Pipeline Research Committee; Stress
Engineering Services, Inc., Houston, TX, United States.
• Gao, B. et al. (2006). Ratchetting and ratchetting boundary study of pressurized straight low carbon steel pipe
under reversed bending. International Journal of Pressure Vessels and Piping, 83(2), 96-106
• Gau, J. S. (1990). Elastic-plastic behavior of pressurized pipe, Doctoral dissertation. University of Akron,
OH, United States.
• Hertz-Clémens, S. (2006). Experimental and numerical modelling of pipeline denting. In 2006 International
Pipeline Conference (pp. 171-179). American Society of Mechanical Engineers, New York, NY, United
States.
• Hill, R. T. (1991). Pipeline Risk Analysis, I ChemE Symposium Series No. 130.
• Hopkins, P., and Leis B. N. (2003). Mechanical damage gaps analysis. Design, Materials and Construction
Committee Final Report to PRCI, Report No PR-003-0277.Columbus, OH, United States: Battelle Corp.
• Hübel, H. (1996). Basic conditions for material and structural ratcheting. Nuclear Engineering and Design,
162(1), 55-65.
• Hyde, T. H. et al. (2009). Analysis of stresses in pipes indented by long external indentations and subsequent
stress variations due to pressure fluctuations. International Journal of Pressure Vessels and Piping, 86(7),
428-434.
• Jiang, Y. (1993). Cyclic plasticity with an emphasis on ratcheting, Doctoral dissertation. University of Illinois
at Urbana-Champaign, IL, United States.
• Jiang, Y., and Sehitoglu, H. (1996). Modeling of cyclic ratchetting plasticity, part I: development of
constitutive relations. Journal of Applied Mechanics, 63(3), 720-725.
• Jiang, Y., and Sehitoglu, H. (1996). Modeling of cyclic ratchetting plasticity, part II: comparison of model
simulations with experiments. Journal of Applied Mechanics, 63(3), 726-733.
• Jiao, R., and Kyriakides, S. (2009). Ratcheting, wrinkling and collapse of tubes under axial cycling.
International Journal of Solids and Structures, 46(14), 2856-2870.
• Jiao, R., and Kyriakides, S. (2011). Ratcheting and wrinkling of tubes due to axial cycling under internal
pressure: Part I experiments. International Journal of Solids and Structures, 48(20), 2814-2826.

116
• Jiao, R., and Kyriakides, S. (2011). Ratcheting and wrinkling of tubes due to axial cycling under internal
pressure: Part I experiments. International Journal of Solids and Structures, 48(20), 2814-2826.
• Jones, D. G. (1982). The significance of mechanical damage in pipelines. 3R International, 21(7), 347-354.
• Keating, P., and Hoffmann, R. (1997). Fatigue behavior of dented petroleum pipelines. Texas AandM
University Final Report to US Department of Transportation.
• Kiefner, J. F. (1969). Fracture initiation. In the proceedings of the 4th Symposium on Line Pipe Research,
Pipeline Research Committee of the American Gas Association, Dallas, Texas, United States.
• Klever, F. J. et al. (1994). Limit-state design of high-temperature pipelines. American Society of Mechanical
Engineers, New York, NY, United States.
• Kulkarni, S. C. et al. (2003). Uniaxial and biaxial ratchetting study of SA333 Gr. 6 steel at room temperature.
International Journal of Pressure Vessels and Piping, 80(3), 179-185.
• Kulkarni, S. C. et al. (2004). Uniaxial and biaxial ratchetting in piping materials—experiments and analysis.
International Journal of Pressure Vessels and Piping, 81(7), 609-617.
• Kyriakides, S., and Corona, E. (2007). Mechanics of offshore pipelines: volume 1 buckling and collapse (Vol.
1). Elsevier.
• Kyriakides, S., and Shaw, P. K. (1982). Response and stability of elastoplastic circular pipes under combined
bending and external pressure. International Journal of Solids and Structures, 18(11), 957-973.
• Kyriakides, S., and Shaw, P. K. (1987). Inelastic buckling of tubes under cyclic bending. Journal of Pressure
Vessel Technology, 109(2), 169-178.
• Lancaster, E. R., and Palmer, S. C. (1996). Strain concentrations in pressurized dented pipes. Proceedings of
the Institution of Mechanical Engineers, Part E: Journal of Process Mechanical Engineering, 210(1), 29-38.
• Lee, K. L., and Pan, W. F. (2001). Viscoplastic collapse of titanium alloy tubes under cyclic bending.
Structural Engineering and Mechanics, 11(3), 315-324.
• Lee, K. L. et al. (2001). The influence of the diameter-to-thickness ratio on the stability of circular tubes under
cyclic bending. International Journal of Solids and Structures, 38(14), 2401-2413.
• Lee, L. H. (1962). Inelastic buckling of initially imperfect cylindrical shells subject to axial
compression. Journal of the Aerospace Sciences, 29(2), 87-95.
• Leis, B. N., and Francini, R. B. (2000). Line pipe resistance to outside force–volume two: assessing
serviceability of mechanical damage. Battelle Final Report to PRCI, Report No PR-3-9305-Volume, 2.
Battelle, Columbus, OH, United States.
• Leis, B. et al. (1998). Pressure-displacement behavior of transmission pipelines under outside forces: Towards
a serviceability criterion for mechanical damage. In the proceedings of the 8th International Offshore and
Polar Engineering Conference (Vol. 2, pp. 60-67). Mountain view, CA, United States: International Society
of Offshore and Polar Engineers.
• Lemaitre, J., and Chaboche, J. L. (1994) Mechanics of solid materials. Cambridge, United Kingdom:
Cambridge university press.

117
• Limam, A. et al. (2010). Inelastic wrinkling and collapse of tubes under combined bending and internal
pressure. International Journal of Mechanical Sciences, 52(5), 637-647.
• McDowell, D. L. (1994). Description of nonproportional cyclic ratchetting behavior. European Journal of
Mechanics. A. Solids, 13(5), 593-604.
• Miyazaki, K., et al. (2002). Fracture strength and behavior of carbon steel pipes with local wall thinning
subjected to cyclic bending load. Nuclear Engineering and Design, 214(1), 127-136.
• Moreton, D. N. et al. (1994). The behaviour of pressurised plain pipework subjected to simulated seismic
loading. Strain, 30(2), 63-72.
• Noronha, D. B. et al. (2010). Procedures for the strain based assessment of pipeline dents. International
Journal of Pressure Vessels and Piping, 87(5), 254-265.
• Ohno, N. (1990). Recent topics in constitutive modeling of cyclic plasticity and viscoplasticity. Applied
Mechanics Reviews, 43(11), 283-295.
• Ohno, N. (1997). Recent progress in constitutive modeling for ratcheting. Journal of Material Science
International, 3, 1–9.
• Ohno, N., and Wang, J. D. (1993). Kinematic hardening rules with critical state of dynamic recovery, part I:
formulation and basic features for ratchetting behavior. International Journal of Plasticity, 9(3), 375-390.
• Ohno, N., and Wang, J. D. (1993). Kinematic hardening rules with critical state of dynamic recovery. II:
Application to experiments of ratchetting behavior. International Journal of Plasticity, 9(3), 391-403.
• Pan, W. F., and Fan, C. H. (1998). An experimental study on the effect of curvature-rate at preloading stage
on subsequent creep or relaxation of thin-walled tubes under pure bending. Journal of Solid Mechanics and
Material Engineering, 41(4), 525-531.
• Pan, W. F., and Her, Y. S. (1998). Viscoplastic collapse of thin-walled tubes under cyclic bending. Journal
of Engineering Materials and Technology, 120(4), 287-290.
• Paquette, J. A., and Kyriakides, S. (2006). Plastic buckling of tubes under axial compression and internal
pressure. International Journal of Mechanical Sciences, 48(8), 855-867.
• Rahman, S. M. (2006). Finite element analysis and related numerical schemes for ratcheting simulation
(Doctoral dissertation). North Carolina State University, Raleigh, NC, USA.
• Rahman, S. M. et al. (2008). Evaluation of cyclic plasticity models in ratcheting simulation of straight pipes
under cyclic bending and steady internal pressure. International Journal of Plasticity, 24(10), 1756-1791.
• Rinehart, A. J. (2004). Effects of localized geometric imperfections on the stress behavior of pressurized
cylindrical shells (Doctoral dissertation). Texas AandM University, College Station, TX, United States.
• Rinehart, A. J., and Keating, P. B. (2002, January). Length effects on fatigue behavior of longitudinal pipeline
dents. In the proceedings of 4th International Pipeline Conference (pp. 1849-1858). American Society of
Mechanical Engineers, New York, NY, United States.
• Roovers, P. et al., (2000). EPRG methods for assessing the tolerance and resistance of pipelines to external
damage. Pipeline Technology, 2, 405-425.
118
• Rosenfeld, M. J. et al. (2002). Basis of the new criteria in ASME B31.8 for prioritization and repair of
mechanical damage. Paper 27122 presented at 4th International Conference on Pipeline Technology, Calgary,
Canada.
• Rosenfeld, M. J. (1997). Development of a model for fatigue rating shallow unrestrained dents. AGA Catalog,
(L51741).
• Rosenfeld, M. J. et al. (1997). Toward an acceptance criterion for shallow dents affecting girth welds in gas
transmission pipelines. American Society of Mechanical Engineers, Pressure Vessels and Piping
Division(Publication) PVP, 353, 373-383.
• Shaw, P. K., and Kyriakides, S. (1985). Inelastic analysis of thin-walled tubes 4under cyclic bending.
International Journal of Solids and Structures, 21(11), 1073-1100.
• ABAQUS. (2010). ABAQUS Theory Manual Version 6.10-1. Simulia Corp., Providence, RI, United States.
• Urednicek, M. (1986). Effects of dents on failures of gas transmission pipelines. Report No 14032. Materials
Engineering Services to Nova Corporation, Calgary, AB, Canada.
• Vishnuvardhan, S. et al. (2010). Fatigue ratcheting studies on TP304 LN stainless steel straight pipes.
Procedia Engineering, 2(1), 2209-2218.
• Wang, K. C., and Smith, E. D. (1982). The effect of mechanical damage on fracture initiation in line pipe,
part i: dents. Energy, Mines and Resources Canada, Canada Centre for Mineral and Energy Technology.
• Wang, L. et al. (2014). Bending ratcheting behavior of pressurized straight Z2CND18. 12N stainless steel
pipe. Structural Engineering Mechanics, 52, 1135-1156.
• Yahiaoui, K. et al. (1996). Response and cyclic strain accumulation of pressurized piping elbows under
dynamic in-plane bending. The Journal of Strain Analysis for Engineering Design, 31(2), 135-151.
• Yoshida, F. et al. (1984). Mechanical ratcheting behaviors of a steel pipe under combined cyclic axial load
and internal pressure. Society of Materials Science Proc. of the 27 th Japan Congr. on Mater. Res. p 13-24
(SEE N 85-34180 23-23).
• Zakavi, S. J., and Nourbakhsh, M. (2014). The ratcheting behaviour of stainless steel pressurized piping
elbows Subjected to dynamic out-of-plane Moments. Modern Mechanical Engineering, 2014.
• Zakavi, S. J, et al. (2010). The ratchetting behavior of pressurized plain pipework subjected to cyclic bending
moment with the combined hardening model. Nuclear Engineering and Design, 240(4), 726-737.
• Zarea, M. F. et al. (1996). Numerical models for static denting and dynamic puncture of gas transmission line
pipe and their validation. In the proceedings of 1st International Pipeline Conference (pp. 777-784).
American Society of Mechanical Engineers, New York, NY, United States.
• Zeinoddini, M., and Peykanu, M. (2011). Strain ratcheting of steel tubulars with a rectangular defect under
axial cycling: a numerical modeling. Journal of Constructional Steel Research, 67(12), 1872-1883.
• Zhang, G. K. Q. K. J. (2005). Experimental study on the uniaxial cyclic deformation of 25CDV4. 11 steel.
Journal of Materials Science and Technology, 21(1), 5-9.