Embed Size (px)
Citation preview

49
札幌医学雑誌 87(1 - 6)49 ~ 61(2018) doi:10.15114/smj.87.49
ORIGINAL
1 Introduction
CD4+CD25+Foxp3+ regulatory T cells (Tregs) play an important role in the maintenance of self-tolerance and immune homeostasis. Treg deficiency contributes to the development of autoimmune diseases and graft-versus-host disease (GVHD) after allogeneic hematopoietic stem cell transplantation (HSCT) 1-6). CD4 Tregs and conventional CD4 T cells (Tcons) are derived from lymphocyte progenitor cells that differentiate into distinct functional subsets in the thymus before export to the peripheral circulation. As T cells differentiate and expand in the periphery, each T cell subset is differentially regulated and subjected to distinct homeostatic signals. For example, interleukin-2 (IL-2) is a critical regulator of Treg development, expansion and survival and the lack of IL-2 results in selective Treg deficiency 7-10). Tregs constitutively express higher levels of CD25 than Tcons, and which forms a high-affinity receptor for
IL-2. Since Tregs cannot produce IL-2, these cells need exogenous sources, such as activated effector Tcons, for this critical homeostatic factor 7). Furthermore, as previously reported, Tregs can respond to lower concentrations of IL-2 than Tcons 11). The daily administration of low-dose IL-2 in patients with active chronic GVHD results in the sustained expansion of Tregs without a significant increase in Tcons; a clinical improvement in more than 50% of patients with chronic GVHD also occurs 12-15). Added to this, the selective effect of low-dose IL-2 therapy has been reported in healthy volunteers 16), patients with hepatitis C virus-induced vasculitis 17), type 1 diabetes 18, 19), alopecia areata 20), and systemic lupus erythematosus 21). Previously we also reported the mechanism responsible for increased Treg susceptibility to apoptosis through the intrinsic pathway in chronic (c)GVHD 22). The intrinsic pathway involves a complex set of mitochondrial-associated death signaling molecules. Activation of the intrinsic pathway results in mitochondrial
Low-dose interleukin-2 induces BCL2 expression and resistance to apoptosis in CD4 regulatory T Cells
Teppei MATSUNO1)*, Kazuyuki MURASE1,2)*, Kohichi TAKADA1,2), Yutaka KAWANO1),Masahiro HIRAKAWA1), Koji MIYANISHI1), Masayoshi KOBUNE2) and Junji KATO1)
1) Department of Medical Oncology, Sapporo Medical University School of Medicine, Sapporo, Japan2) Department of Hematology, Sapporo Medical University School of Medicine, Sapporo, Japan
ABSTRACT Regulatory T cells (Tregs) play an important role in the maintenance of self-tolerance and immune homeostasis. Interleukin-2 (IL-2) is critical for Treg expansion, activity and survival. Previous studies have demonstrated that low-dose IL-2 resulted in the selective expansion of Tregs and the clinical improvement of auto-immune disease. To examine the mechanisms whereby IL-2 affects Treg apoptosis through the intrinsic pathway, we used BH3 profiling, and quantitated mitochondrial apoptotic priming. This pattern suggests that Tregs were more primed than conventional CD4 T cells (Tcons) in a BCL2-dependent manner. Tregs expressed lower levels of BCL2 than Tcons. To examine the functional effects of IL-2, sorted Tregs and Tcons were cultured with different concentrations of IL-2. Low-dose IL-2 (10 IU/mL) lowered priming and increased BCL2 expression in Tregs. However, higher concentrations of IL-2 (>100 IU/mL) were required to increase BCL2 expression and decrease priming in Tcons. Apoptosis assays also revealed that low-dose IL-2 reduced susceptibility to apoptosis only in Tregs. ABT-199, a selective BCL2 inhibitor, enhanced the priming and apoptosis of both Tcells. IL-2 reversed the effects of ABT-199 for Tregs only. This provides further evidence that the inhibition of intrinsic pathway apoptosis mediated by IL-2 in Tregs is dependent on BCL2.
(Accepted October 31, 2018)Key words: IL-2, BCL2, Treg

50 Teppei Matsuno et al.
outer membrane permeabilization (MOMP) and the release of cytochrome c 23-25). This pathway is regulated by interactions between a large number of BCL2 family proteins, which include anti-apoptotic, pro-apoptotic and effector proteins 26). Apoptosis via the intrinsic pathway is a threshold event, with some cells starting closer than others to the threshold. Proximity to the threshold of apoptosis, or apoptotic “priming”, can be measured using BH3 profiling 27-30). In this assay, mitochondria are exposed to peptides derived from the BH3 (BCL2 homology 3) domains of pro-death BCL2 family proteins. BH3 profiling provides an assessment of mitochondrial susceptibility to MOMP that integrates the functional activity of all of the BCL2 family proteins that regulate the intrinsic apoptosis pathway in individual cells. This method also allows us to simultaneously compare BH3 peptide-induced mitochondrial membrane depolarization ( “priming”) in Tregs and Tcons. In the present study, we examined the mechanisms whereby IL-2 affects susceptibility of Tregs to apoptosis through the intrinsic pathway. Low-dose IL-2 (10 IU/mL) lowered BH3 priming and increased BCL2 expression in Tregs specifically. Similar effects were observed in Tcons, but higher concentrations of IL-2 (>100 IU/mL) were required to increase BCL2 expression and decrease BH3 priming in Tcons. Staurosporine- (STS) induced apoptosis assays revealed that low-dose IL-2 reduced susceptibility to apoptosis only in Tregs. To confirm the effects of low-dose IL-2 on Treg priming were mediated by BCL2, we examined the effect of ABT-199, a selective BCL2 inhibitor, on BH3 priming in Tregs and Tcons. ABT-199 enhanced priming and the spontaneous apoptosis of both Tregs and Tcons. IL-2 had no effect on ABT-199-induced priming or apoptosis in Tcons. In contrast, IL-2 reversed the effects of ABT-199 on Treg priming and apoptosis providing further evidence that the inhibition of intrinsic pathway apoptosis mediated by IL-2 in Tregs is dependent on BCL2.
2 Material and methods
2・1 Cells and cell culture Human peripheral blood mononuclear cells (PBMCs) were obtained from the blood of healthy donors by density gradient centrifugation (Ficoll-Paque; GE Healthcare, Little Chalfont, UK) and cryopreserved in aliquots until needed for cell sorting, flow cytometric analysis, and functional assays. Cells were cultured using media (DMEM supplemented with 10% fetal
bovine serum [FBS], L-glutamine, 100 IU/mL penicillin and 100 µg/mL streptomycin) in the presence of IL-2 (BD Biosciences, San Jose, CA, USA; 0.001 - 10000 IU/mL).
2・2 Flow cytometric analysis of Foxp3 PBMCs were first incubated with anti-CD3 APC (clone SK7; eBioscience, San Diego, CA, USA), anti-CD4 BV570 (clone RPA-T4; BioLegend, San Diego, CA, USA), anti-CD25 PE-Cy7 (clone M-A251; BD Biosciences), and anti-CD127 BV650 (clone A019D5; BioLegend). Two different T-cell subsets were defined by antigen expression patterns as follows: conventional T cells (Tcons) as CD3+CD4+CD25neg-lowCD127med-hi, and Tregs as CD3+CD4+CD25med-hiCD127low, respectively. To detect intracellular Foxp3 in each subset, surface-stained PBMCs were suspended in fixation and permeabilization buffer (eBioscience), and then incubated with anti-Foxp3 FITC (clone 236A/E7; eBioscience) or isotype-matched IgG-FITC (eBioscience) for 30 minutes at 4 ℃. After incubation and washing, stained cells were analyzed on a BD LSRFortessa cell analyzer using FlowJo 7.6.1 software 31).
2・3 Cell sorting and Treg suppression assay Whole bloods were incubated with Tcell enrichment RosetteSep (STEMCELL Technologies, Vancouver Canada; 50 µL/mL of whole blood) for 20 min. Purified T cells were obtained by density gradient centrifugation. Purified T cells were incubated with the following three antibodies for 20 minutes at room temperature: anti-CD4 Pacific Blue (clone RPA-T4; BD Biosciences), anti-CD25 PE-Cy7 (clone M-A251; BD Biosciences), and anti-CD127 APC-eFluor 780 (clone eBioRDR5; eBioscience). After incubation, cells were washed and isolated by cell sorting using a BD f luorescence-activated cell sorting (FACS) Aria II Cell Sorter (BD Biosciences) into Tcons and Tregs. Sorted cell populations were confirmed to be more than 95% pure. These sorted Tcons and Tregs were used for a Treg suppression assay. Treg suppression was assessed using a BD FastImmune Human Regulatory T-Cell Function Kit (BD Biosciences) according to the manufacturer's instructions. Tcons (2 ×10⁴) were cultured with Tregs in ratios of 1:1, 1:0.5, and 1:0.25. Cultures of Tcons alone or with Tregs were used as controls. Cells were activated for 7 hours using Dynabeads Human

51Low dose IL-2 reduce apoptosis in Treg
T-Activator CD3/CD28 (Life Technologies, Carlsbad, CA, USA) in the presence of CD154 APC. Cells were surface stained with kit reagents: anti-CD4 FITC, anti-CD25 PE, anti-CD3 PerCP-Cy5.5, and anti-CD69 PE-Cy7. The expressions of CD154 APC and CD69 PE-Cy7 were measured using a BD LSRFortessa and analyzed with FACS Diva software (BD Biosciences). This assay was performed in triplicate.
2・4 Tetramethylrhodamine, Ethyl Ester, Perchlorate FACS-based BH3 profiling
The sequences and method of synthesis of BH3-only peptides were previously described by Certo et al. 32). PBMC were profiled by using a plate-based BH3 profiling assay previously described by Ryan et al. 27). First, PBMCs or sorted cells were first stained with anti-CD4 Pacific Blue, anti-CD25 PE-Cy7 and anti-CD127 APC eFluor780 in the dark at 4 ℃ for 20 min. After incubation, 2.4 × 10⁶ cells were washed in 2% FBS/PBS and suspended in T-EB Buffer (300 mM trehalose, 10 mM HEPES, 80 mM potassium chloride, 1 mM EGTA, 1 mM EDTA, 0.1% BSA and 5 mM succinic acid in distilled water at pH 7.4). Cell suspension (50 µL) was added to 50 µL of T-EB Buffer containing 0.002% digitonin, 10 µg/mL oligomycin and 0.03 - 10 µM BH3 peptides (BIM 10 µM, BIM 0.03 µM, BID-Y 10 µM, BAD 10 µM, NOXA 10 µM, BAD 5 µM + NOXA 5 µM, PUMA 10 µM, BMF 10 µM, HRK 10 µM) for 30 minutes at room temperature. After incubation, 12.5 µL of 22.5 µM tertamethylrhodamine, ethyl ester (TMRE; Invitrogen, Carslbad, CA, USA) was added and the cell mixture incubated for 30 min. After incubation, stained cells were analyzed for each T cell subset (Tcon and Treg) on a BD LSRFortessa cell analyzer using FACS Diva software (BD Biosciences). The percentage mitochondrial depolarization was calculated using the median TMRE intensity of the total population, with a Phycoerythrin (PE) channel signal intensity of Carbonyl cyanide-p-trifluoromethoxyphenylhydrazone (FCCP) treated cells serving as 100% depolarization, and that of dimethyl sulphoxide (DMSO) treated cells as 0% depolarization. The following equation was used to calculated the percentage depolarization for each peptide: % Depolarization by peptide = 100 × [(Median PE of DMSO)- (Median PE of peptide)]/[(Median PE of DMSO) - (Median PE of FCCP)].
2・5 Flow cytometric analysis of BCL2, BCLXL and
MCL1 To detect intracellular BCL2, PBMCs or sorted cells were first incubated with anti-CD4 Pacific Blue, anti-CD25 PE-Cy7, and anti-CD127 APC eFluor780. For BCL2 staining, cells were then washed twice in PBS, suspended in 100 µL of fixation/permeabilization solution (BD Biosciences) and incubated for 20 minutes at 4 ℃. After fixation, cells were washed and incubated with anti-BCL2 PE (clone BCL2/100; BD Biosciences) or isotype-matched IgG-PE (clone MOPC-21; BD Biosciences) for 30 minutes at 4 ℃. After incubation and washing, stained cells were analyzed on a FACSCanto II flow cytometer using FACS Diva software (BD Biosciences). Cell debris and doublets were excluded on the basis of side versus forward scatter. Relative BCL2 expression in each subset was calculated by dividing the mean fluorescence intensity (MFI) for BCL2-PE by the MFI for the isotype matched IgG. To detect intracellular BCLXL and MCL1, PBMCs or sorted cells were first incubated with anti-CD3 APC, anti-CD4 BV570, anti-CD8 BV421 (clone RPA-T8; BioLegend), anti-CD25 PE-Cy7, and anti-CD127 BV650. For BCLXL and MCL1 staining, cells were then washed twice in PBS and suspended in 100 µL of fixation/permeabilization solution and incubated for 20 minutes at 4 ℃. After fixation, cells were washed and incubated with rabbit anti-BCLXL Alexa Fluor 488 (clone 54H6; Cell Signaling Technology, Danvers, MA, USA), rabbit IgG Isotype Control Alexa Fluor 488 (Cell Signaling Technology) or unconjugated rabbit anti-MCL1 (clone Y37; EPITOMICS) for 30 minutes at 4 ℃. Cells stained with unconjugated antibodies were subsequently stained with an anti-rabbit IgG Fab2 Alexa Fluor 488 (Cell Signaling Technology). After incubation and washing, stained cells were analyzed on a BD LSRFortessa cell analyzer using FACS Diva software (BD Biosciences). The relative BCLXL and MCL1 expression in each subset was calculated by dividing the MFI by the median value of the MFI for the isotype matched IgG.
2・6 Staurosporine-induced apoptosis assay T cell subsets were cultured separately with 0.5 µM staurosporine (STS) 23) or medium only in 96-well round-bottom plates at a concentration of 1 × 10⁵ PBMCs or sorted cells per well. Apoptosis induction was measured 6 hours after the addition of STS. Cell death was assessed by annexin V/7-AAD co-

52 Teppei Matsuno et al.
staining and forward to side scatter profiles. STS-specific cell death was calculated as follows: (percentage experimental cell death - percentage spontaneous cell death)/(100% - percentage spontaneous cell death) × 100.
3 Results
3・1 Treg phenotype and immune regulatory function To further characterize the phenotype and suppressive function of CD4 Tregs and Tcons in healthy donor samples, CD4+CD25med-hiCD127low Treg and CD4+CD25lowCD127hi Tcon populations were purified by cell sorting using the gates shown in Figure 1A. As shown in a representative example (Figure 1B), intracellular Foxp3 expression was examined in each population by flow cytometry and was found to be expressed at high levels only in the Treg subset. In vitro suppression assays were also performed with purified Tcons and Tregs using a FastImmune Human Regulatory T-Cell Function Kit (BD Biosciences). The BD FastImmuneTM kit measures expression of the activation markers CD154 33)
and CD69 34) on Tcons. Reduced expression of these markers in the presence of Tregs can indicate Treg suppressive capacity. As shown in a representative FACS profile of CD3/CD28 stimulated Tcons only
Figure 1. Phenotype of Tregs and Tcons, and suppressive activity of Tregs. (A) Representative contour plot showing expression of CD4 in the lymphocyte gate, and expression of CD25 and CD127
in the CD4 lymphocyte gate. PBMCs were stained with anti-CD4, -CD25, and -CD127 antibodies. CD4 lymphocytes were isolated into CD25neg-lowCD127med-high Tcons, and CD25med-highCD127low Tregs.
(B) Expression of Foxp3 in Tregs and Tcons. Surface-stained peripheral blood monuclear cells (PBMCs) were stained with intracellular anti-Foxp3 antibody or isotype IgG (filled histograms). Foxp3 expression was measured in Tcons (dotted line) and Tregs (solid line).
(C-D) Functional capacity of isolated Tregs. Tcons and Tregs were purified by flow cytometric cell sorting. Expression of the activation markers CD154 and CD69 on effector T cells. (C) Representative fluorescence-activated cell sorting (FACS) profile of CD3/CD28 stimulated Tcons (D) Stimulated Tcons in the presence of Tregs (ratio 1:1). This assay was performed in triplicate.
Supplemental Figure 1. Apoptosis Pathways in T cell subsets - Healthy Donors (n=20)
BH3 profiling - Mitochondrial membrane depolarization after challenge with BH3 peptides in each T cell subset (Tcons: light gray, Tregs: dark gray). The percentage depolarization was determined after challenge with individual peptides as indicated on the X-axis.

53Low dose IL-2 reduce apoptosis in Treg
(Figure 1C) and stimulated Tcons in the presence of Tregs (ratio 1:1). Tcon activation was inhibited by coculturing with autologous Tregs, indicating that purified Tregs maintain expected levels of suppressive function.
3・2 Apoptosis pathways in Tcons and Tregs BH3 profiling was used to compare apoptotic priming of Tregs and Tcons to intrinsic pathway apoptosis in 20 healthy donors (Figure 2A and Supplemental). Tregs were more primed than Tcons when challenged with PUMA and BMF peptides (p = 0.00012, and p = 0.0009, respectively). We also directly measured the expression of anti-apoptotic proteins (MCL1, BCL2 and BCLXL) in Tcons and Tregs by flow cytometry (Figure 2B). When compared to Tcons, Tregs had lower levels of BCL2 (p = 0.0081). Consistent with the results of BH3 profiling and the differential expression of apoptotic proteins, STS-induced apoptosis of Tregs was significantly greater than that in Tcons (Fig. 2C; p < 0.0001). However, significant differences in BH3 profiling with NOXA and HRK (Figure 2A)
were not observed, together with the expression of MCL1 and BCLXL. These results indicate that Tregs are more primed than Tcons and that the relevant apoptotic pathway mainly depended on BCL2.
3・3 Apoptosis pathways in T cell subsets with different IL-2 concentrations
To examine the effect of IL-2 on human Tcons and Tregs, we studied the time course of BH3 profiling with PUMA in sorted Tcons and Tregs using three different IL-2 concentrations (10, 100, 1000 IU/mL; Figure 3A). Basically IL-2 decreased BH3 priming in both Tregs and Tcons. In Tcons, low-dose IL-2 (10 IU/mL) showed slightly lower priming than medium only, while high dose IL-2 (100 and 1000 IU/mL) decreased BH3 priming compared with low-dose IL-2. In Tregs, all concentrations of IL-2 decreased BH3 priming to the same level. IL-2 mainly affected Tregs on day 3 and Tcons on day 5. We also examined BCL2 expression in each T cell subset (Figure 3B). In Tcons, IL-2 increased BCL2 expression in a dose-dependent manner. In Tregs, 10 IU/mL IL-2 was sufficient to increase
Figure 2. Apoptosis Pathways in T cell subsets - Healthy Donors (n=20) (A) BH3 profiling - Mitochondrial membrane depolarization after challenge with BH3 peptides in each T cell subset (Tcons:
light gray, Tregs: dark gray). The percentage depolarization was determined after challenge with individual peptides as indicated on the X-axis.
(B) Expression of anti-apoptotic proteins in each T cell subset. Protein expression was measured by flow cytometry. Relative levels of MCL1, BCL2 and BCLXL were calculated by dividing the median mean fluorescence intensity (MFI) for each protein by the median MFI of the isotype control IgG.
(C) Apoptosis induction after in vitro stimulation with anti-staurosporine (STS) monoclonal antibody. *p < 0.05, **p < 0.01, ***p < 0.001, ****p < 0.0001

54 Teppei Matsuno et al.
Supplemental Figure 2. Apoptosis pathways in T cell subsets with different IL-2 concentrations (A) Time course of BH3 profiling: Mitochondrial membrane depolarization after challenge with BH3 peptide (NOXA) and
expression of anti-apoptotic protein (MCL1) in Tcons. To establish the functional effects of IL-2, Tregs and Tcons were purified by cell sorting and cultured for 5 days with different concentrations of IL-2 (10, 100, 1000 IU/mL).
(B) Time course of BH3 profiling: Mitochondrial membrane depolarization after challenge with BH3 peptide (NOXA) and expression of anti-apoptotic protein (MCL1) in Tregs. These assays were performed in triplicate and show representative data.
Figure 3. Apoptosis pathways in T cell subsets with different IL-2 concentrations (A) Time course of BH3 profiling: Mitochondrial membrane depolarization after challenge with BH3 peptide (PUMA) in
Tcons and Tregs. To establish the functional effects of IL-2, Tregs and Tcons were purified by cell sorting and cultured for 5 days with different concentrations of IL-2 (10, 100, 1000 IU/mL).
(B) Time course of expression of anti-apoptotic protein (BCL2). Mean fluorescence intensity (MFI) (C) Time course of apoptosis induction after in vitro stimulation with staurosporine (STS) monoclonal antibody. (D) BH3 profiling and BCL2 expression using different concentrations of IL-2 (0.001 - 10000 IU/mL) at day 3. These
assays were performed in triplicate and show representative data.

55Low dose IL-2 reduce apoptosis in Treg
BCL2 expression. The peak of the IL-2 effect was around day 3. Consistent with the results of BH3 profiling and the expression of apoptotic proteins, IL-2 induced a different effect in each T cell subset by STS-induced apoptosis assay (Figure 3C). IL-2 had an anti-apoptotic effect on Tcons while low-dose IL-2 decreased Treg apoptosis around day 3. To confirm the optimal IL-2 concentration, we also investigated BH3 profiling and BCL2 using various concentrations of IL-2 on day 3 (Figure 3D). A high concentration IL-2 (100 to 10000 IU/mL) decreased BH3 priming in both T cell subsets. However, lower concentrations of IL-2 (0.01 to 10 IU/mL) decreased BH3 priming only in Tregs. BCL2 expression showed similar data. A high concentration of IL-2 (100 to 10000 IU/mL) increased BCL2 expression in both T cell subsets while a lower concentration of IL-2 (0.01 to 10 IU/mL) increased BCL2 expression only in Tregs. The greatest difference between Tcons and Tregs was observed using 10 IU/mL IL-2 (Figure 3D).
3・4 BH3 priming and % apoptosis with low-dose IL-2 and BCL2 inhibitor
To confirm the effect of BCL2 with low-dose
IL-2 (10 IU/mL), we used ABT-199, which is a potent and selective BCL2 inhibitor for BH3 profiling, and apoptosis assays (Figure 4A and 4B). In order to see the difference between Tcons and Tregs, we used only low-dose IL-2 (10 IU/mL). For BH3 profiling in Tcons (Figure 4A), low-dose IL-2 did not have an effect while BCL2 inhibitor and BCL2 inhibitor + IL-2 induced higher BH3 priming than medium only. For BH3 profiling in Tregs, low-dose IL-2 decreased BH3 priming and the BCL2 inhibitor increased BH3 priming. In addition, BCL2 inhibitor + IL-2 showed the same level of priming as medium only but less BH3 priming than BCL2 inhibitor only. A similar pattern was observed for the apoptosis assay (Figure 4B). In Tcons, the BCL2 inhibitor increased apoptosis; low-dose IL-2 did not reverse the effect of the BCL2 inhibitor. However, low-dose IL-2 decreased the increase in apoptosis induced by the BCL2 inhibitor on Tregs. IL-2 had no effect on ABT-199-induced priming or apoptosis in Tcons. In contrast, IL-2 reversed the effects of ABT-199 on Treg priming and apoptosis.
4 Discussion
IL-2 has a wide spectrum of effects on the immune
Supplemental Figure 3. Apoptosis pathways in T cell subsets with different IL-2 concentrations (A) Time course of BH3 profiling: Mitochondrial membrane depolarization after challenge with BH3 peptide (HRK) and
expression of anti-apoptotic protein (BCLXL) in Tcons. To establish the functional effects of IL-2, Tregs and Tcons were purified by cell sorting and cultured for 5 days with different concentrations of IL-2 (10, 100, 1000 IU/mL).
(B) Time course of BH3 profiling: Mitochondrial membrane depolarization after challenge with BH3 peptide (HRK) and expression of anti-apoptotic protein (BCLXL) in Tregs. These assays were performed in triplicate and show representative data.
56 Teppei Matsuno et al.
Figure 4. BH3 priming and apoptosis % with low-dose IL-2 (10 IU/mL) and BCL2 inhibitor (A) BH3 profiling with BH3 peptide (PUMA) in Tcons and Tregs. To establish the functional effects of low-dose IL-2,
Tregs and Tcons were purified by cell sorting and cultured for 3 days with IL-2 and/or Bcl2 inhibitor. (B) Apoptosis assay with anti-staurosporine (STS) in Tregs and Tcons with the same setting as above. These assays
were performed in triplicate and show representative data.
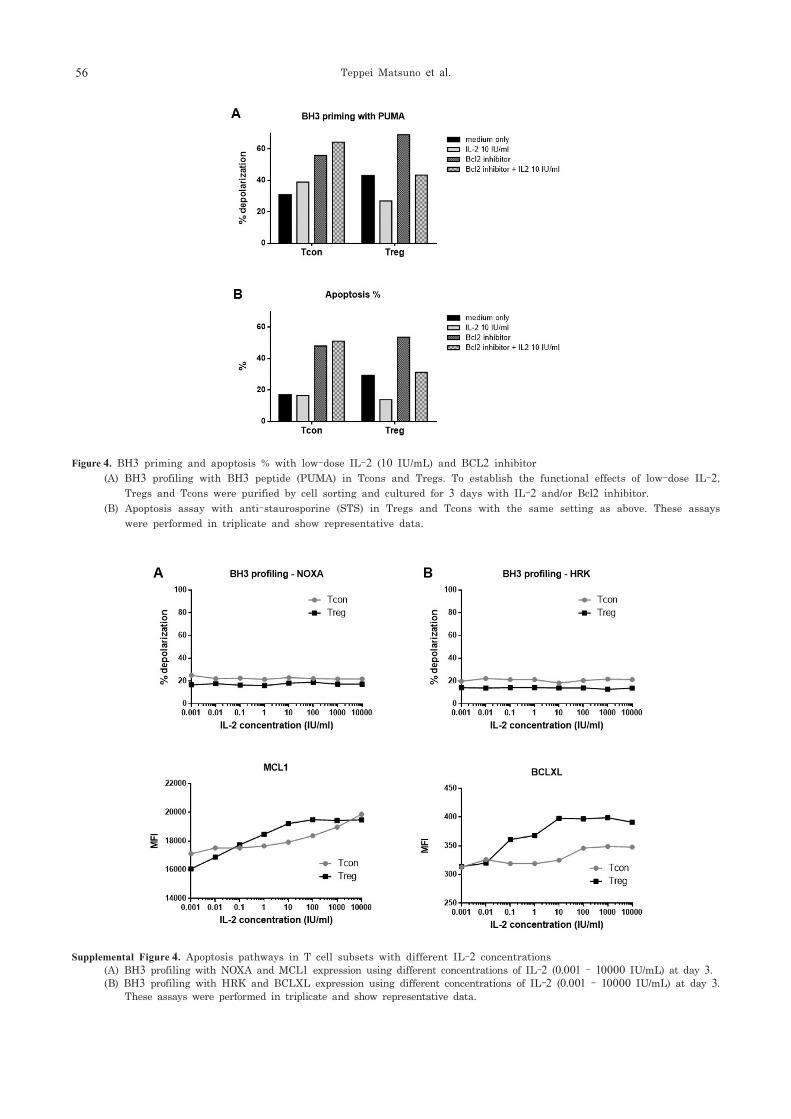
Supplemental Figure 4. Apoptosis pathways in T cell subsets with different IL-2 concentrations (A) BH3 profiling with NOXA and MCL1 expression using different concentrations of IL-2 (0.001 - 10000 IU/mL) at day 3. (B) BH3 profiling with HRK and BCLXL expression using different concentrations of IL-2 (0.001 - 10000 IU/mL) at day 3.
These assays were performed in triplicate and show representative data.

57Low dose IL-2 reduce apoptosis in Treg
system, and plays critical roles in regulating both immune activation and homeostasis 35). In a clinical setting, low-dose IL-2 therapy induces immune tolerance and improves various diseases 12, 17-20, 36). These therapeutic mechanisms of low-dose IL-2 can be explained by the function of the IL-2 receptor. The IL-2 receptor consists of three distinct components: IL-2Rα (CD25), IL-2Rβ (CD122) and IL-2Rγ (CD132) 37). These are constitutively expressed on all T cells and the intracellular domains of these components are responsible for all receptor-mediated signaling activity. IL-2Rβ and IL-2Rγ have low affinity for IL-2 and when expressed together exhibit moderate binding affinity for IL-2. IL-2Rα expression is higher on Tregs than Tcons. IL-2Rα has no signaling function, but expression of IL-2Rα with IL-2Rβ and IL-2Rγ creates a high-affinity trimeric receptor that is able to respond to low concentrations of IL-2 37). In this study, we showed that Tregs responded to low-dose IL-2 (10 IU/mL) while Tcons needed a higher concentration of IL-2 to affect their BH3 profile, BCL2 expression and apoptosis. Such data are compatible with our previous study 13, 14). Our studies are novel in that we used BH3 profiling for investigating the mechanisms between Tregs and low-dose IL-2. In the clinic, low-dose IL-2 treatment expanded Tregs and induced immune tolerance 12-14). This paper sought to examine the anti-apoptotic effect of low-dose IL-2 on Tregs. Mammalian hematopoietic cells may die either following ligation and multimerization of cell surface death receptors (extrinsic pathway of apoptosis) or via a pathway regulated by the BCL2 protein family that is initiated in response to many stress stimuli (intrinsic pathway of apoptosis). These pathways converge to activate effector caspases that function to destroy the cell 38). Previous studies examined the extrinsic pathway of apoptosis in Tregs and Tcons 14, 39). However, the susceptibility of Tregs to apoptosis through the intrinsic pathway has not been thoroughly examined. The intrinsic pathway is equivalent to the mitochondrial pathway in that both respond to cellular damage that is regulated by BCL2 family proteins. Such proteins control MOMP that is considered the point of no return for apoptosis. This permeabilization allows the release of soluble proteins such as cytochrome c from the mitochondrial intermembrane space into the cytosol. Cytochrome c binds to apoptotic protease activating factor 1 and caspase-9 to form the apoptosome, which activates
downstream effector caspases and triggers apoptosis 40). To identify mechanisms that regulate Treg susceptibility to apoptosis through the intrinsic pathway, we used BH3 profiling, a functional assay that measures mitochondrial membrane depolarization after challenge with a panel of BH3 peptides 27, 41, 42). For example, BIM and BID BH3 peptides interact with all endogenous anti-apoptotic proteins, can activate the effectors BAX and BAK, and are used as a measure of overall apoptotic priming. In contrast, NOXA, PUMA and HRK bind with anti-apoptotic proteins but cannot activate BAX or BAK. Interestingly, certain BH3 peptides interact selectively with anti-apoptotic BCL2 family proteins. For instance, NOXA BH3 peptides interact selectively with MCL1 43), the HRK BH3 peptide that interacts selectively with BCLXL 32). In this assay, an in vitro challenge with BH3 peptides is used to stimulate the intrinsic pathway. This approach provides a method for measuring sensitivity to apoptotic signals at the mitochondrial level, termed “priming”. In this study, Tregs are more primed than Tcons when challenged with PUMA only. When challenged with NOXA and HRK, significant differences between Tregs and Tcons were not observed (Supplemental). These results indicate that the priming of Tregs and Tcons are not dependent on the expression of MCL1 and BCLXL. We also checked the expression of MCL1, BCLXL and BCL2. Anti-apoptotic protein expression also showed that the priming of T cells was mainly dependent on BCL2. In addition, we measured functional apoptosis by STS that induces the intrinsic pathway of apoptosis. Collectively, such data indicate that Tregs are more primed than Tcons through the intrinsic pathway and this is dependent on BCL2 expression. We further examined whether the dose of IL-2 influenced the level of T-cell priming. In Figure 3, we can see that IL-2 decreased BH3 priming in both T cell subsets; low-dose IL-2 (10 IU/mL) affected especially Tregs while high-dose IL-2 (100 to 1000 IU/mL) also reduced Tcon priming. A difference between low-dose and high-dose IL-2 in BH3 priming was observed. Similar patterns were also observed in BCL2 and apoptosis assays with STS. All data indicated that low-dose IL-2 could distinguish Tcon and Treg responses but had an anti-apoptotic effect only in Tregs. An ultra-low-dose of IL-2 (0.01 to 1 IU/mL) also increased BCL2 expression and reduced

58 Teppei Matsuno et al.
priming only in Tregs. However, 0.01 and 0.1 IU/mL showed an inadequate effect, while 1 and 10 IU/mL IL-2 were needed to discern Tregs and Tcons in an in vitro setting. In the clinic, low-dose IL-2 treatment can expand Tregs selectively and improve several autoimmune diseases, however such clinical trials usually determine the maximum tolerated dose (0.33 to 3 million IU/m2 IL-2 were used in previous reports 12, 17-20, 36)) in order to study the safety, dosage levels, and response to a new treatment. The minimum effective dose needs to be determined because high-dose IL-2 shows enough of an effect in both a T cell setting and in expanding Tcons that could worsen autoimmune disease. However, an ultra-low-dose of IL-2 can expand and allow Tregs to survive selectively. In this study, we also investigated the BCL2 dependency of Treg survival by using ABT-199 (venetoclax), a potent and selective BCL2 inhibitor 44). ABT-199 disrupted BCL2-BIM but not BCLXL-BCLXS complexes. ABT-199 selectively inhibited BCL2 and induced cytochrome c release, caspase activation, and apoptosis. ABT-199 caused tumor lysis syndrome in some CLL patients, with an 80% response rate and manageable secondary effects 45). Greater BH3 priming and apoptosis was observed with the BCL2 inhibitor than medium only (Figure 4). In order to observe the difference between Tcons and Tregs, we used only 10 IU/mL of IL-2. BH3 profiling in Tcons, BCL2 inhibitor and BCL2 inhibitor + IL-2 induced greater BH3 priming. But in Tregs, IL -2 decreased BH3 priming, and the BCL2 inhibitor increased BH3 priming. In addition, BCL2 inhibitor + IL-2 showed less BH3 priming than BCL2 inhibitor only. A similar pattern was also observed in the apoptosis assay. Overall, these data suggest that low-dose IL-2 can selectively inhibit priming and apoptosis through the intrinsic pathway in Tregs. In addition, the inhibition of apoptosis by IL-2 was actually dependent on BCL2. In contrast, we can activate the immune response and induce an anti-tumor effect by decreasing Tregs if we could selectively administer ABT-199 to Tregs. In this study, mitochondrial membrane depolarization by BH3 profiling was studied. However, as is well known, many proteins and protein complexes are related to the apoptosis pathway. A previous study has also shown that the expression of programmed cell death protein 1 regulates IL-2-induced Treg proliferation and prolongs Treg survival 46). Further study is required
to identify factors that promote the function and survival of Tregs for translational research.
Acknowledgments The authors thank Yukie Nakamura for her excellent technical assistance.
CONFLICTS OF INTEREST The authors declare no competing financial interests.
References
1) Sakaguchi S, Yamaguchi T, Nomura T, Ono M. Regulatory T cells and immune tolerance. Cell 2008; 133: 775-787.
2) Wing K, Sakaguchi S. Regulatory T cells exert checks and balances on self tolerance and autoimmunity. Nat Immunol 2010; 11: 7-13.
3) Hoffmann P, Ermann J, Edinger M, Fathman CG, Strober S. Donor-type CD4(+)CD25(+) regulatory T cells suppress lethal acute graft-versus-host disease after allogeneic bone marrow transplantation. J Exp Med 2002; 196: 389-399.
4) Edinger M, Hoffmann P, Ermann J, Drago K, Fathman CG, Strober S, Negrin RS. CD4+CD25+ regulatory T cells preserve graft-versus-tumor activity while inhibiting graft-versus-host disease after bone marrow transplantation. Nat Med 2003; 9: 1144-1150.
5) Bluestone JA. The yin and yang of interleukin-2-mediated immunotherapy. N Engl J Med 2011; 365: 2129-2131.
6) Malek TR, Castro I. Interleukin-2 receptor signaling: at the interface between tolerance and immunity. Immunity 2010; 33: 153-165.
7) Yu A, Malek TR. Selective availability of IL-2 is a major determinant controlling the production of CD4+CD25+Foxp3+ T regulatory cells. J Immunol 2006; 177: 5115-5121.
8) Boyman O, Sprent J. The role of interleukin-2 during homeostasis and activation of the immune system. Nat Rev Immunol 2012; 12: 180-190.
9) Weist BM, Kurd N, Boussier J, Chan SW, Robey EA. Thymic regulatory T cell niche size is dictated by limiting IL-2 from antigen-bearing dendritic cells and feedback competition. Nat Immunol 2015; 16: 635-641.
10) Liao W, Lin JX, Leonard WJ. Interleukin-2 at the crossroads of effector responses, tolerance, and immunotherapy. Immunity 2013; 38: 13-25.
11) Amado IF, Berges J, Luther RJ, Mailhé MP, Garcia S, Bandeira A, Weaver C, Liston A, Freitas A A. IL-2 coordinates IL-2-producing and regulatory T cell interplay. J Exp Med 2013; 210: 2707-2720.
12) Koreth J, Matsuoka K, Kim HT, McDonough SM, Bindra B, Alyea EP, Armand P, Cutler C, Ho VT, Treister NS, BienfangDC, Prasad S, Tzachanis D, Joyce RM, Avigan DE, Antin JH, Ritz J, Soiffer RJ. Interleukin-2 and regulatory T cells in graft-versus-host disease. N Engl J Med 2011;

59Low dose IL-2 reduce apoptosis in Treg
365: 2055-2066.13) Matsuoka K, Koreth J, Kim HT, Bascug G, McDonough S,
Kawano Y, Murase K, Cutler C, Ho VT, Alyea EP, Armand P, Blazar BR, Antin JH, Soiffer RJ, Ritz J. Low-dose interleukin-2 therapy restores regulatory T cell homeostasis in patients with chronic graft-versus-host disease. Sci Transl Med 2013; 5: 179ra43. doi: 10.1126/scitranslmed. 3005265.
14) Hirakawa M, Matos TR, Liu H, Koreth J, Kim HT, Paul NE, Murase K, Whangbo J, Alho AC, Nikiforow S, Cutler C, Ho VT, Armand P, Alyea EP, Antin JH, Blazar BR, Lacerda JF, Soiffer RJ, Ritz J. Low-dose IL-2 selectively activates subsets of CD4+ Tregs and NK cells. JCI Insight 2016; 1: e89278. doi: 10.1172/jci.insight.89278.
15) Koreth J, Kim HT, Jones KT, Lange PB, Reynolds CG, Chammas MJ, Dusenbury K, Whangbo J, Nikiforow S, Alyea EP 3rd, Armand P, Cutler CS, Ho VT, Chen YB, Avigan D, Blazar BR, Antin JH, Ritz J, Soiffer RJ. Efficacy, durability, and response predictors of low-dose interleukin-2 therapy for chronic graft-versus-host disease. Blood 2016; 128: 130-137.
16) Ito S, Bollard CM, Carlsten M, Melenhorst JJ, Biancotto A, Wang E, Chen J, Kotliarov Y, Cheung F, Xie Z, Marincola F, Tanimoto K, Battiwalla M, Olnes MJ, Perl S, Schum P, Hughes TE, Keyvanfar K, Hensel N, Muranski P, Young NS, Barrett AJ. Ultra-low dose interleukin-2 promotes immune-modulating function of regulatory T cells and natural killer cells in healthy volunteers. Mol Ther 2014; 22: 1388-1395.
17) Saadoun D, Rosenzwajg M, Joly F, Six A, Carrat F, Thibault V, Sene D, Cacoub P, Klatzmann D. Regulatory T-cell responses to low-dose interleukin-2 in HCV-induced vasculitis. N Engl J Med 2011 ; 365: 2067-2077.
18) Hartemann A, Bensimon G, Payan CA, Jacqueminet S, Bourron O, Nicolas N, Fonfrede M, Rosenzwajg M, Bernard C, Klatzmann D. Low-dose interleukin 2 in patients with type 1 diabetes: a phase 1/2 randomised, double-blind, placebo-controlled trial. Lancet Diabetes Endocrinol 2013; 1: 295-305.
19) Yu A, Snowhite I, Vendrame F, Rosenzwajg M, Klatzmann D, Pugliese A, Malek TR. Selective IL-2 responsiveness of regulatory T cells through multiple intrinsic mechanisms supports the use of low-dose IL-2 therapy in type 1 diabetes. Diabetes 2015; 64: 2172-2183.
20) Castela E, Le Duff F, Butori C, Ticchioni M, Hofman P, Bahadoran P, Lacour JP, Passeron T. Effects of low-dose recombinant interleukin 2 to promote T-regulatory cells in alopecia areata. JAMA Dermatol 2014; 150: 748-751.
21) von Spee-Mayer C, Siegert E, Abdirama D, Rose A, Klaus A, Alexander T, Enghard P, Sawitzki B, Hiepe F, Radbruch A, Burmester GR, Riemekasten G, Humrich JY. Low-dose interleukin-2 selectively corrects regulatory T cell defects in patients with systemic lupus erythematosus. Ann Rheum Dis 2016; 75: 1407-1415.
22) Murase K, Kim HT, Bascug OR, Kawano Y, Ryan J, Matsuoka
K, Davids MS, Koreth J, Ho VT, Cutler C, Armand P, Alyea EP, Blazar BR, Antin JH, Soiffer RJ, Letai A, Ritz J. Increased mitochondrial apoptotic priming of human regulatory T cells after allogeneic hematopoietic stem cell transplantation. Haematologica 2014; 99: 1499-1508.
23) Wei MC, Zong WX, Cheng EH, Lindsten T, Panoutsakopoulou V, Ross AJ, Roth KA, MacGregor GR, Thompson CB, Korsmeyer SJ. Proapoptotic BAX and BAK: a requisite gateway to mitochondrial dysfunction and death. Science 2001; 292: 727-730.
24) Danial NN, Korsmeyer SJ. Cell death: critical control points. Cell 2004; 116: 205-219.
25) van Delft MF, Smith DP, Lahoud MH, Huang DC, Adams JM. Apoptosis and non-inflammatory phagocytosis can be induced by mitochondrial damage without caspases. Cell Death Differ 2010; 17: 821-832.
26) Chipuk JE, Moldoveanu T, Llambi F, Parsons MJ, Green DR. The BCL-2 family reunion. Mol Cell 2010; 37: 299-310.
27) Ryan JA, Brunelle JK, Letai A. Heightened mitochondrial priming is the basis for apoptotic hypersensitivity of CD4+ CD8+ thymocytes. Proc Natl Acad Sci U S A 2010; 107: 12895-12900.
28) Ni Chonghaile T, Sarosiek KA, Vo TT, Ryan JA, Tammareddi A, Moore VeG, Deng J, Anderson KC, Richardson P, Tai YT, Mitsiades CS, Matulonis UA, Drapkin R, Stone R, Deangelo DJ, McConkey DJ, Sallan SE, Silverman L, Hirsch MS, Carrasco DR, Letai A. Pretreatment mitochondrial priming correlates with clinical response to cytotoxic chemotherapy. Science 2011; 334: 1129-1133.
29) Kubo T, Kawano Y, Himuro N, Sugita S, Sato Y, Ishikawa K, Takada K, Murase K, Miyanishi K, Sato T, Takimoto R, Kobune M, Nobuoka T, Hirata K, Takayama T, Mori M, Hasegawa T, Kato J. BAK is a predictive and prognostic biomarker for the therapeutic effect of docetaxel treatment in patients with advanced gastric cancer. Gastric Cancer 2016; 19: 827-838.
30) Montero J, Letai A. Why do BCL-2 inhibitors work and where should we use them in the clinic? Cell Death Differ 2018; 25: 56-64.
31) Kawano Y, Kim HT, Matsuoka K, Bascug G, McDonough S, Ho VT, Cutler C, Koreth J, Alyea EP, Antin JH, Soiffer RJ, Ritz J. Low telomerase activity in CD4+ regulatory T cells in patients with severe chronic GVHD after hematopoietic stem cell transplantation. Blood 2011; 118: 5021-5030.
32) Certo M, Del Gaizo Moore V, Nishino M, Wei G, Korsmeyer S, Armstrong SA, Armstrong SA, Letai A. Mitochondria primed by death signals determine cellular addiction to antiapoptotic BCL-2 family members. Cancer Cell 2006; 9: 351-365.
33) Frentsch M, Arbach O, Kirchhoff D, Moewes B, Worm M, Rothe M, Scheffold A, Thiel A. Direct access to CD4+ T cells specific for defined antigens according to CD154 expression. Nat Med 2005; 11: 1118-1124.
34) Chattopadhyay PK, Yu J, Roederer M. A live-cell assay to detect antigen-specific CD4+ T cells with diverse cytokine
60 Teppei Matsuno et al.
profiles. Nat Med 2005; 11: 1113-1117.35) Gaffen SL, Liu KD. Overview of interleukin-2 function,
production and clinical applications. Cytokine 2004; 28: 109-123.
36) Zhang J, Ruan Y, Xu X, Wang H, Tao Q, Lu J, Xia L, Zhang Q, Wang J, Wang Y, Zhai Z. Therapeutic potential of low-dose IL-2 in immune thrombocytopenia: An analysis of 3 cases. Cytometry B Clin Cytom 2018; 94: 428-433.
37) Stauber DJ, Debler EW, Horton PA, Smith KA, Wilson IA. Crystal structure of the IL-2 signaling complex: paradigm for a heterotrimeric cytokine receptor. Proc Natl Acad Sci U S A 2006; 103: 2788-2793.
38) Marsden VS, Strasser A. Control of apoptosis in the immune system: Bcl-2, BH3-only proteins and more. Annu Rev Immunol 2003; 21: 71-105.
39) Matsuoka K, Kim HT, McDonough S, Bascug G, Warshauer B, Koreth J, Cutler C, Ho VT, Alyea EP, Antin JH, Soiffer RJ, Ritz J. Altered regulatory T cell homeostasis in patients with CD4+ lymphopenia following allogeneic hematopoietic stem cell transplantation. J Clin Invest 2010; 120: 1479-1493.
40) Zou H, Li Y, Liu X, Wang X. An APAF-1.cytochrome c multimeric complex is a functional apoptosome that activates procaspase-9. J Biol Chem 1999; 274: 11549-11556.
41) Ryan J, Montero J, Rocco J, Letai A. iBH3: simple, fixable BH3 profiling to determine apoptotic priming in primary tissue by flow cytometry. Biol Chem 2016; 397: 671-678.
42) Letai A, Bassik MC, Walensky LD, Sorcinelli MD, Weiler S, Korsmeyer SJ. Distinct BH3 domains either sensitize or activate mitochondrial apoptosis, serving as prototype cancer therapeutics. Cancer Cell 2002; 2: 183-192.
43) Foight GW, Ryan JA, Gullá SV, Letai A, Keating AE. Designed BH3 peptides with high affinity and specificity for targeting Mcl-1 in cells. ACS Chem Biol 2014; 9: 1962-
1968.44) Souers AJ, Leverson JD, Boghaert ER, Ackler SL, Catron
ND, Chen J, Dayton BD, Ding H, Enschede SH, Fairbrother WJ, Huang DC, Hymowitz SG, Jin S, Khaw SL, Kovar PJ, Lam LT, Lee J, Maecker HL, Marsh KC, Mason KD, Mitten MJ, Nimmer PM, Oleksijew A, Park CH, Park CM, Phillips DC, Roberts AW, Sampath D, Seymour JF, Smith ML, Sullivan GM, Tahir SK, Tse C, Wendt MD, Xiao Y, Xue JC, Zhang H, Humerickhouse RA, Rosenberg SH, Elmore SW. ABT-199, a potent and selective BCL-2 inhibitor, achieves antitumor activity while sparing platelets. Nat Med 2013; 19: 202-208.
45) Roberts AW, Davids MS, Pagel JM, Kahl BS, Puvvada SD, Gerecitano JF, Kipps TJ, Anderson MA, Brown JR, Gressick L, Wong S, Dunbar M, Zhu M, Desai MB, Cerri E, Heitner Enschede S, Humerickhouse RA, Wierda WG, Seymour JF. Targeting BCL2 with Venetoclax in Relapsed Chronic Lymphocytic Leukemia. N Engl J Med 2016; 374: 311-322.
46) Asano T, Meguri Y, Yoshioka T, Kishi Y, Iwamoto M, Nakamura M, Sando Y, Yagita H, Koreth J, Kim HT, Alyea EP, Armand P, Cutler CS, Ho VT, Antin JH, Soiffer RJ, Maeda Y, Tanimoto M, Ritz J, Matsuoka KI. PD-1 modulates regulatory T-cell homeostasis during low-dose interleukin-2 therapy. Blood 2017; 129: 2186-2197.
別刷請求先:小船 雅義
〒 060-8556 札幌市中央区南 1 条西 16 丁目
札幌医科大学医学部腫瘍内科学講座
TEL:011-611-2111(内線 32540) FAX:011-621-7987 E-mail:[email protected]

61Low dose IL-2 reduce apoptosis in Treg
低用量 IL2 は BCL2 の発現を誘導することでCD4 制御性 T細胞のアポトーシスを抑制する
松 野 鉄 平1),村 瀬 和 幸1,2),高 田 弘 一1,2),河 野 豊1,2),平 川 昌 宏1),宮 西 浩 嗣1),小 船 雅 義2),加 藤 淳 二1,2)
1) 札幌医科大学 腫瘍内科学講座2) 札幌医科大学 血液内科学
制御性 T 細胞(Treg)は自己免疫寛容や恒常性の
維持に重要な役割を果たしている.インターロイキン
2(IL-2)は Treg の増加,活動,生存に非常に重要
である.既報では低用量 IL-2 は Treg の増加に選択
的に作用し,自己免疫疾患の臨床症状を改善させると
報告されている.IL-2 が Treg の内因性アポトーシ
スにどのように作用するのかを調べるために,我々は
BH3 プロファイリングを用い,ミトコンドリアのア
ポトーシスプライミングを定量的に測定した.BH3ペプチドパターンでは Treg のプライミングが Tconより多く,それがBCL2に依存していることを示した.
実際に,TregではTconよりもBCL2の発現が低かっ
た.IL-2の作用を調べるために,TregとTconに分け,
異なった用量の IL-2 で培養した.Treg では低用量
の IL-2(10 IIU/ml)でプライミングは低下し BCL2発現は増加したが,Tcon ではプライミングの低下と
BCL2 発現の増加には高用量の IL-2(>100 IIU/ml)が必要であった.また,低用量 IL-2 は Treg におい
てのみアポトーシスへの感受性を減らすことがアポ
トーシスアッセイによって判明した.ABT-199 とい
う BCL2 選択的阻害剤は Treg と Tcon 両者のプライ
ミンブとアポトーシスを増加させる.IL2 は Treg に
おいてのみこの ABT-199 の効果を打ち消した.この
ことから Treg における IL2 による内因性アポトーシ
スの阻害が BCL2 に依存していることが判明した.


![Original Article Interleukin-1β induces metabolic and ...excessive apoptosis of disc cells is also pivotal in DDD, which frequently contributes to neck or low back pain [11]. Numerous](https://img.pdfslide.net/doc/110x75/5e8e95c68742d36e0b68f874/original-article-interleukin-1-induces-metabolic-and-excessive-apoptosis-of.jpg)


![HISTOSEMINAIRE CARREFOUR PATHOLOGIE 2011 « PIEGES ET ... · [2] Masir N, Campbell LJ, Jones M, Mason DY. Pseudonegative BCL2 protein expression in Pseudonegative BCL2 protein expression](https://img.pdfslide.net/doc/110x75/5e12b339c8a2e1206c7dfe98/histoseminaire-carrefour-pathologie-2011-pieges-et-2-masir-n-campbell.jpg)