Embed Size (px)
Citation preview

ARL-TR-7525 ● NOV 2015
US Army Research Laboratory
Low Illumination Light (LIL) Solar Cells: Indoor and Monochromatic Light Harvesting
by Johnny A Russo, William Ray, Marc S Litz, and Charlie Wu Approved for public release; distribution unlimited.

NOTICES
Disclaimers The findings in this report are not to be construed as an official Department of the Army position unless so designated by other authorized documents.
Citation of manufacturer’s or trade names does not constitute an official endorsement or approval of the use thereof.
Destroy this report when it is no longer needed. Do not return it to the originator.

ARL-TR-7525 ● NOV 2015
US Army Research Laboratory
Low Illumination Light (LIL) Solar Cells: Indoor and Monochromatic Light Harvesting
by Johnny A Russo, William Ray, Marc S Litz, and Charlie Wu Sensors and Electron Devices Directorate, ARL Approved for public release; distribution unlimited.

ii
REPORT DOCUMENTATION PAGE Form Approved OMB No. 0704-0188
Public reporting burden for this collection of information is estimated to average 1 hour per response, including the time for reviewing instructions, searching existing data sources, gathering and maintaining the data needed, and completing and reviewing the collection information. Send comments regarding this burden estimate or any other aspect of this collection of information, including suggestions for reducing the burden, to Department of Defense, Washington Headquarters Services, Directorate for Information Operations and Reports (0704-0188), 1215 Jefferson Davis Highway, Suite 1204, Arlington, VA 22202-4302. Respondents should be aware that notwithstanding any other provision of law, no person shall be subject to any penalty for failing to comply with a collection of information if it does not display a currently valid OMB control number. PLEASE DO NOT RETURN YOUR FORM TO THE ABOVE ADDRESS.
1. REPORT DATE (DD-MM-YYYY)
November 2015 2. REPORT TYPE
Final 3. DATES COVERED (From - To)
4. TITLE AND SUBTITLE
Low Illumination Light (LIL) Solar Cells: Indoor and Monochromatic Light Harvesting
5a. CONTRACT NUMBER
5b. GRANT NUMBER
5c. PROGRAM ELEMENT NUMBER
6. AUTHOR(S)
Johnny A Russo, William Ray, Marc S Litz, and Charlie Wu 5d. PROJECT NUMBER
5e. TASK NUMBER
5f. WORK UNIT NUMBER
7. PERFORMING ORGANIZATION NAME(S) AND ADDRESS(ES)
US Army Research Laboratory ATTN: RDRL-SED-E 2800 Powder Mill Road Adelphi, MD 20783-1138
8. PERFORMING ORGANIZATION REPORT NUMBER
ARL-TR-7525
9. SPONSORING/MONITORING AGENCY NAME(S) AND ADDRESS(ES)
10. SPONSOR/MONITOR'S ACRONYM(S)
11. SPONSOR/MONITOR'S REPORT NUMBER(S)
12. DISTRIBUTION/AVAILABILITY STATEMENT
Approved for public release; distribution unlimited. 13. SUPPLEMENTARY NOTES 14. ABSTRACT
Low and indoor light energy harvesting is needed to meet the demands of zero net energy (ZNE) building, Internet of Things (IoT), and indirect energy conversion isotope battery (IDEC iBAT) systems. Characterizing photovoltaic (PV) solar cells under low intensity and narrow light spectrum conditions has not been clearly examined. PV operating values under 1 sun illumination do not scale linearly under low intensity and monochromatic light conditions (efficiency drops from 30% to 3% at 1 μWopt/cm2). However, limited energy conversion efficiencies and metrics can be improved by choosing a PV whose band gap matches the light source. By quantifying losses on single-junction semiconductors, we can determine the theoretical maximum efficiency of a PV material for different light sources. We measure single-junction solar cells’ parameters under 3 different white light (indoor light) and near monochromatic light spectrum sources with light intensities ranging from 0.5 to 100 µWopt/cm2. Measurements show that indium gallium phosphide (InGaP) has the highest surface power density and conversion efficiency (29% under 1 μWopt/cm2 at 523 nm for 470-nm, 523-nm, and white light). The results will aid the US Army’s decision on selecting the best PV type for the IDEC iBAT and other energy harvesting systems. 15. SUBJECT TERMS
solar cell, light-emitting diode, LED, indoor energy harvesting
16. SECURITY CLASSIFICATION OF: 17. LIMITATION OF ABSTRACT
UU
18. NUMBER OF PAGES
60
19a. NAME OF RESPONSIBLE PERSON
Johnny A Russo a. REPORT
Unclassified b. ABSTRACT
Unclassified c. THIS PAGE
Unclassified 19b. TELEPHONE NUMBER (Include area code)
301-394-5530 Standard Form 298 (Rev. 8/98) Prescribed by ANSI Std. Z39.18

iii
Contents
List of Figures v
List of Tables vii
1. Motivation 1
2. Introduction 1
3. PV Fundamental Losses under Low-Light Conditions 5
4. Experiment Setup 9
4.1 Materials 9
4.1.1 Light Sources and Spectra 9
4.1.2 PV Solar Cells 15
4.2 Methods 16
4.2.1 LED Illumination 16
4.2.2 Monochromator Illumination 17
5. Results 18
5.1 Highest Conversion Efficiency PV using Low-Light LED Illumination 18
5.2 Minimize Thermalization Loss/Maximize Quantum Efficiency 20
5.3 Optimized Energy Conversion 22
6. Conclusion 25
7. Further Evaluation 26
8. References and Notes 27
Appendix A. Specifications of the Newport 818-UV Radiometer 33
Appendix B. Specifications of LED and Phosphor Components Used in Report 37

iv
Appendix C. Quantum Efficiency Measurements of Single-Junction Solar Cells 41
Appendix D. Photovoltaic Solar Cell Conversion Efficiencies and Fill Factor as Function of Light Intensities 43
List of Symbols, Abbreviations, and Acronyms 48
Distribution List 50

v
List of Figures
Fig. 1 Power levels for portable electronic devices and energy harvesting capablities to power a certain area of these devices8 .............................3
Fig. 2 Energy sources and their respective transducers for powering WSNs and the IoT initiative9.............................................................................3
Fig. 3 Energy consumption pie chart for commercial buildings adapted from http://www.mjinc.com/newsArticle2012_Mar15.html ..........................4
Fig. 4 Three energy and power densities ranges for PV solar cells, corresponding to outdoor, indoor, and isotope power source levels......5
Fig. 5 Illustration of these unvoidable, fundamental losses: (left) thermailization loss occurs when an incoming photon’s energy is higher than the absorber’s bandgap16 and (right) below bandgap (Eg) photon energy transmits right through the device without being converted into usable energy.15 Photon energy much lower than the bandgap does not contribute to solar cell power output. This is ignoring/not recognizing phonon-assisted absorption.17 .......................6
Fig. 6 Illustration of solar cell FF calculation. The more area shaded under the I-V curve gives a higher FF.20 ..........................................................7
Fig. 7 Symbolic schematic of a PV device showing the different parasitic resistances of the device: shunt resistance Rsh and series resistance Rs
26 .........................................................................................................8
Fig. 8 Rs and Rsh effects on FF and conversion efficiency under low-light intensities shown in a typical I-V curve of a device. Increasing Rs and decreasing Rsh decrease FF and the energy conversion efficiency of the device.29 .................................................................................................9
Fig. 9 A plot of a typical dark current I-V and how to calculate the shunt and series resistance from the slopes of the leakage curve30 ........................9
Fig. 10 Spectral intensity/irradiance as a function of the incident photon wavelength comparing the cool white LED at an RPD of 0.01 and 0.001 mW/cm2 to the 10–3 sun global AM 1.5G solar spectrum at 0.088 mWopt/cm2. Bandwidth for the bandpass filters is ±25 nm (y-axis). The error for cool white LED at 0.01 and 0.001 mWopt/cm2 is 3% and 1.5%, which includes the calibration uncertainty of the Newport photodetector 818-UV model (x-axis). .................................10
Fig. 11 Spectral irradiance of typical artificial light sources, including white LEDs11..................................................................................................11

vi
Fig. 12 Experimental setup showing a radiometer inside the light-tight enclosure. Bandpass filters are placed on the top of the radiometer silicon (Si) detector head to bin the incident light for the cool white LED. Six measurements were taken for each bandpass filter, which covered the entire white LED spectrum range. For each measurement, the radiometer set wavelength was changed to the central wavelength of the bandpass filter. ...........................................................................12
Fig. 13 A 1-cm2 phosphor platelet filled with isotropic point-source emitters is located above a 1-cm2 optical detector; 5% of the total light output is measured in the detector located 1 cm from the source .......................13
Fig. 14 Relative intensity as a function of wavelength for green and blue LEDs compared to the phosphor RL emission from mb-microtec36 ..............14
Fig. 15 EQE as a function of wavelength of selected PVs is shown.11,38,41–43 Both InGaP PVs show a maximum EQE at 540 nm (2.29 eV). This differs from InGaP bandgap edge at 1.9 eV (650 nm). ........................16
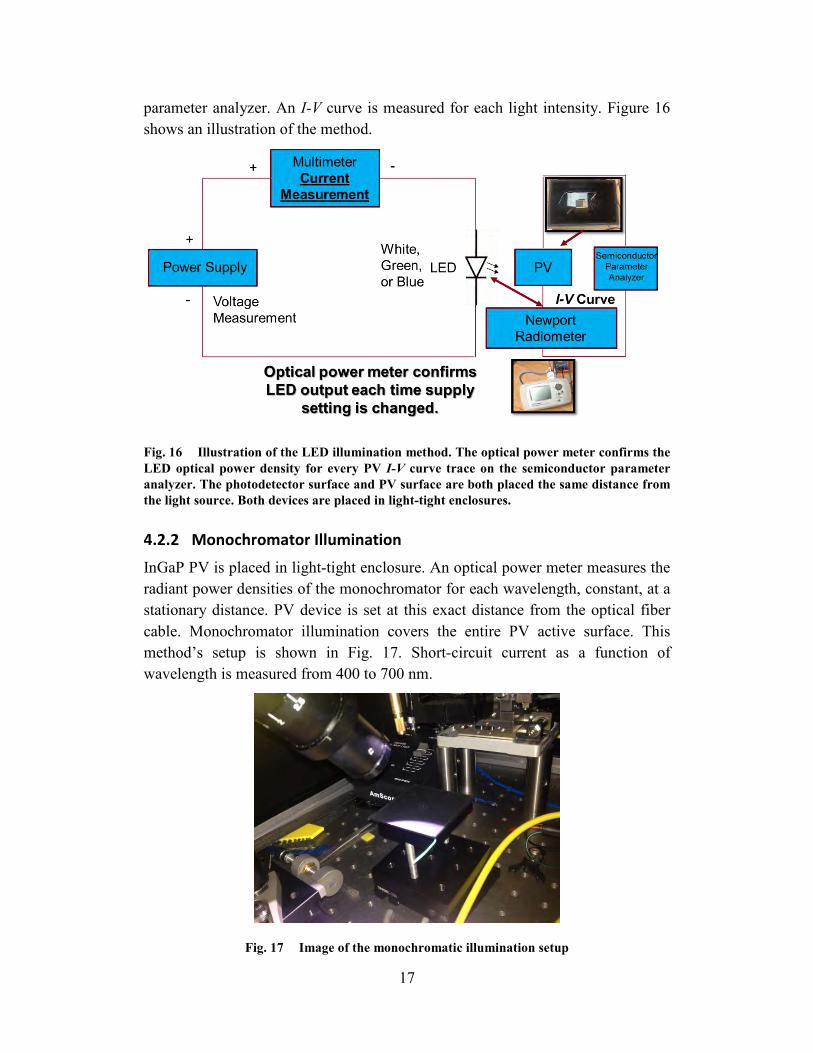
Fig. 16 Illustration of the LED illumination method. The optical power meter confirms the LED optical power density for every PV I-V curve trace on the semiconductor parameter analyzer. The photodetector surface and PV surface are both placed the same distance from the light source. Both devices are placed in light-tight enclosures. ...................17
Fig. 17 Image of the monochromatic illumination setup .................................17
Fig. 18 Spectral intensity as a function of wavelength of illumination sources is shown. All light sources have RPD of 0.1 mWopt/cm2. ....................19
Fig. 19 I-V curves of InGaP and GaAs under phosphor-lined tritium platelets at 528 nm. The red dashed line highlights where the maximum power points/surface power densities are for InGaP (0.0524 µWe/cm2) and GaAs (0.03 µWe/cm2) under 528 nm at a RPD of 1 µWopt/cm2. .........21
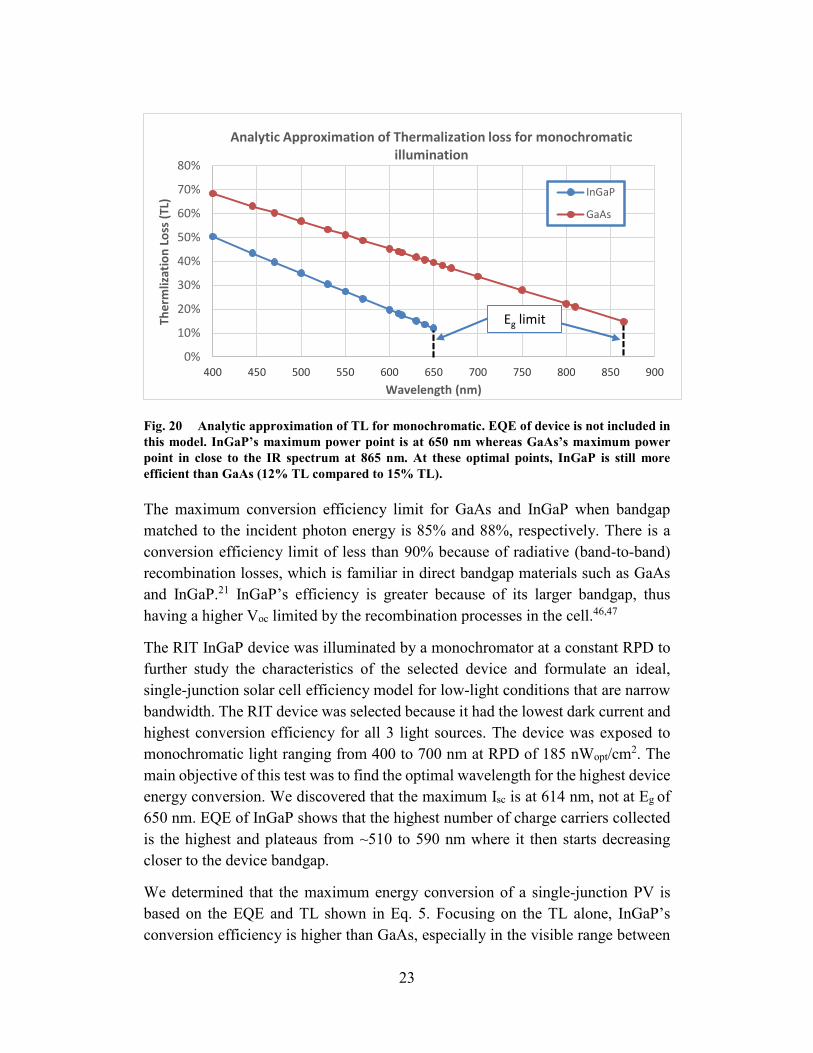
Fig. 20 Analytic approximation of TL for monochromatic. EQE of device is not included in this model. InGaP’s maximum power point is at 650 nm whereas GaAs’s maximum power point in close to the IR spectrum at 865 nm. At these optimal points, InGaP is still more efficient than GaAs (12% TL compared to 15% TL). .........................23
Fig. 21 Experimental results qualitatively match the modified model of the device conversion efficiency under monochromatic illumination for low-light conditions. The optimal photon wavelength is 614 nm for InGaP even through the photon bandgap match is at 650 nm. This shows that the maximum conversion efficiency is dependent on device EQE and TL, not one or the other. .......................................................24
Fig. 22 Monochromatic efficiency vs. the wavelength of the laser at 20 Wopt/cm2. The curves are simulation results. Different PV single-junction devices were illuminated by the laser. The efficiency values shown as symbols were from the measured I-V curves. The stars mark the efficiencies from an 810-nm laser. The highest efficiency for InGaP was seen at 610 nm with 47.2%, and for GaAs, it is around 820 nm.48 ..............................................................................................25

vii
Fig. A-1 Spectral response of the Newport optical meter ..................................35
Fig. A-2 Schematic of the 818 Newport optical power meter with dimensions1 ..........................................................................................35
Fig. B-1 Absolute intensity vs. emission spectrum of an ice-blue phosphor and green phosphor platelet excited by tritium decay ................................38
Fig. B-2 HLMP colored LEDs’ relative intensity as function of wavelength for green and blue32 ...................................................................................39
Fig. B-3 Cree cool white LEDs relative intensity as a function of wavelength. All 3 white LEDs have the same visible range, but different relative intensities at certain wavelengths such as 450, 550, 575, and 600 nm. All have the same relative intensities between 470 to 500 nm. ...........39
Fig. C-1 QE measurements of single-junction PV solar cells. EQE = QE since IQE is equal to 100% through wavelength spectrum...........................42
Fig. D-1 Photovoltaic (PV) device FF as function of light intensity for cool white LED ............................................................................................44
Fig. D-2 PV device conversion efficiency as function of light intensity for cool white LED ............................................................................................45
Fig. D-3 PV device FF as function of light intensity for blue LED ...................45
Fig. D-4 PV device conversion efficiency as a function of light intensity for blue LED ..............................................................................................46
Fig. D-5 PV device conversion efficiency as a function of light intensity for green LED ............................................................................................46
Fig. D-6 PV device FF as a function of light intensity for green LED ..............47
List of Tables
Table 1 An overview of PVs used in this study with STC characteristics and some material properties that include dark level parameters ...............15
Table 2 PV conversion efficiency and FF for the 3 experimental light sources performed at the same RPD. The highest efficiency measured is for the InGaP PV under 523-nm irradiation. ...................................................20
Table 3 TLs for the 2 PV (InGaP and GaAs) and 2 phosphors (528 and 455 nm). The PV-phosphor combination with the lowest TL is the InGaP PV with the 528-nm zinc selenide (ZnS):copper (Cu) phosphor. ........21

INTENTIONALLY LEFT BLANK.

1
1. Motivation
The objective of this project is to measure photovoltaic (PV) solar cells characteristics under low-light and narrow spectrum conditions. “Low light” refers to an optical power density that is 10–6 to 10–3 orders of magnitude lower than 1 sun (global AM 1.5G spectrum standard test conditions [STC] with intensities of 84.4 mWopt/cm2).1 “Narrow” spectrum refers to visible wavelength range from 400 to 700 nm, simulating room light (100 to 1000 μWopt/cm2)2 and fluorescence phosphors (500 to 5 μWopt/cm2). The benefits of these measurements allow us to select the highest efficient PV to be implemented in micro/macro indoor/low-light energy harvesting systems and beta-PV (β-PV) cells for powering long-lived autonomous sensors.
We evaluated the spectral characteristics of emitters, and the spectral response, and the efficiency of PV solar cells of interest. The most efficient energy conversion of indoor light is measured with indium gallium phosphide (InGaP). The most efficient phosphor matching combination is with a 523-nm peak emission and InGaP. A simplified model, modified from other valid models, was created to identify the optimal wavelength for the highest energy conversion. The model yields a result in accord with experimental observations for InGaP at a 614-nm light source.
2. Introduction
Over the past decade, autonomous sensors have been rapidly increasing in use and importance for commercial, military, and residential applications, from battlefield awareness and finished products monitoring to indoor applications such as patient monitoring in healthcare facilities and grid-independent motion sensing. This influx and the popularity of independent, wireless sensors have led to rise of the popular phrase, Internet of Things (IoT).3 IoT is, simply, an embedded network of individual nodes that are connected wirelessly, and dutifully communicate with each other to efficiently complete tasks and increase longevity and reliability of a much larger system. They are embedded in everyday things from home appliances to tollbooths, outdoor weather stations, and remote monitoring system of physical characteristics and events. Sensor arrays that can be distributed in space, include data acquisition and radio frequency (RF) communications, and provide remote monitoring capabilities are defined as wireless sensor networks (WSNs).4–6 These systems are used in almost every technical field including healthcare, environmental monitoring (urban and remote), and aerospace.

2
Autonomous sensors have not reached their full potential because of 1 major limiting factor, a continuously, available long-term energy source. Energy storage is limited by the current chemical battery technology. This is due to extensive infrastructure development over half a century and wide availability of components and materials in the commercial market. They can easily power portable electronic devices for short time periods. They have high power densities but cannot support energy storage for more than a decade. The current battery technology has several drawbacks, such as charge leakage, temperature and environment sensitivity, and finite charge cycles.
Presently, to increase sensor lifetime and independence from the primary grid, most have standby/sleep modes at low power consumption ranging from 1 µWe to 1 mWe (Fig. 1) and shift into dynamic/wakeup mode from an external environmental stimulus or remote user command. The sensor would than measure, process, and transmit or receive data from other sensors or a central hub waiting further instructions.7 Yet, this does not solve the portable energy crisis for long operation (>10 years). Most WSNs for outdoor and, especially, indoor applications use chemical batteries. Commercial chemical batteries have storage lifetimes less than a decade when stored at standard temperature and pressure (STP) conditions and unused. In order for IoT to be more successful and progress on a faster track, thousands of these unattended, embedded sensors would need to be spread everywhere: indoor and outdoor environments, remote and urban, terrestrial and aquatic. They can be located in the harshest and most remote locations, which can be complex and difficult, generating unnecessary logistic tails and large labor costs. In the end, it would outweigh the cost of the sensor and entire system. Looking at it from an environmental perspective, if the IoT system is widespread, battery waste would increase, which should be minimized as much as possible. Lastly, battery technology is only marginally improving in energy density, size, and stability, which is not the case for Moore’s Law, so something must change or meet the technology ongoing demands without jeopardizing our environment.

3
Fig. 1 Power levels for portable electronic devices and energy harvesting capablities to power a certain area of these devices8
If autonomous sensors were able to harvest ambient energy, the WSN operation lifetime could possibly last beyond the infrastructure lifespan or be limited by the ambient energy source time period. Thomas et al.9 and Gasulla et al.2 mentioned using 5 major types of ambient energy sources to power small unattended electronic systems: radiant, mechanical, thermal, magnetic, and biochemical. Figure 2 shows an ambient energy source, transducers, and energy storages used to power autonomous sensors.
Fig. 2 Energy sources and their respective transducers for powering WSNs and the IoT initiative9

4
Indoor and other low-light energy harvesting using PVs can power autonomous sensors similar to outdoor systems. Artificial lighting is constantly radiating during daily facility operation at a constant peak intensity unlike outdoor solar lighting. Indoor light energy harvesting could meet and satisfy demands of net zero building systems.10 This would be beneficial for power recycling programs since indoor lighting is 25% of facility power consumption (Fig. 3). It would be a good starting place to harvest this constant energy source that we use for visibility. The electrical energy used to power all of the lighting systems for commercial, government, university, and residential facilities could be recycled or use typical solar cells. The recycled power could be stored for later use or locally power other smaller systems such as autonomous sensors. This has already been demonstrated in existing PV indoor low power applications.11,12 Unfortunately, these existing systems are not as efficient as possible because of inaccurate PV assumptions. All PV cells are rated under global AM 1.5G spectrum STC ranging from 280 to 4000 nm at 84.4 mWopt/cm2.1 This is sufficient cause for comparing different PVs under outdoor conditions, but not indoor conditions. As the light intensity is reduced from STC, the PV conversion efficiencies are reduced, affected by the PV type, which has not been completely understood. Because of the overall systems’ weak performance, material and system cost, lack of effective development and applications, and indoor lighting standards, the indoor PV market has not grown as rapidly as outdoor PV markets.
Fig. 3 Energy consumption pie chart for commercial buildings adapted from http://www.mjinc.com/newsArticle2012_Mar15.html
We focus on identifying the fundamental losses of PVs under low, narrow light spectrum conditions along with the influences of specific light sources on several PV types. We limit our investigation to 1) indoor light intensity and 2) narrow

5
spectral emission from phosphor radioluminescence (RL). Figure 4 compares our operating ranges to the typical solar cell operating range corresponding to power and energy density. For outdoor light harvesting, there are typically approximately 5 h of peak solar activity for 300+ days on average in most environments with an energy density of 1.8 kJ/cm2 for 1 sun.13 The RL phosphors operate 24 h per day, indoor lighting operational time is typically 14 h per day. We evaluate each selected solar cell under 3 light sources: cool white, blue, and green light-emitting diodes (LEDs). Our measurements result in identifying which PV-phosphor combination is most efficient for low-light energy harvesting. Furthermore, we identify the PV cell type optimized for the beta-PV power source prototype isotope battery (iBAT) system.14
Fig. 4 Three energy and power densities ranges for PV solar cells, corresponding to outdoor, indoor, and isotope power source levels
3. PV Fundamental Losses under Low-Light Conditions
This report considers only single-junction PVs discussing the quantifying losses for PVs under low and narrow light spectra illumination. These quantifying losses ignore reflection and intrinsic device losses that are theoretically avoidable and do not contribute to the fundamental limiting efficiency. For quantifying losses of low-light conditions, we disregard thermodynamic and etendue losses. We consider quantum efficiency (used to calculate the spectral response of the absorber shown in Eq. 1), thermalization losses, and below bandgap (Eg) losses of incoming light.15,16,12 Also, we do not include the radiative recombination in the junction, which determines the theoretical saturation current of the device (refer to Section 5.3 Optimized Energy Conversion). Figure 5 shows illustrations of these different losses. External quantum efficiency (EQE) is recognized as the overall quantum

6
efficiency, since we are not specifically measuring photon reflection and transmission. We reference PV EQE from product datasheets and other creditable research work.
𝑆𝑆𝑆𝑆(𝜆𝜆) = 𝑄𝑄𝑄𝑄(𝜆𝜆)∙𝑞𝑞ℎ∙𝑐𝑐
�𝐴𝐴𝑊𝑊� (1)
where SR is the spectral response of PV [A/W] at the corresponding wavelengths. SR is calculated from the quantum efficiency (QE). c is the speed of light (2.999E-8 m/s), q is the elementary charge (1.602×10⁻¹⁹ coulombs), and h is Planck’s constant (6.626E-34 J*s).
Fig. 5 Illustration of these unvoidable, fundamental losses: (left) thermailization loss occurs when an incoming photon’s energy is higher than the absorber’s bandgap16 and (right) below bandgap (Eg) photon energy transmits right through the device without being converted into usable energy.15 Photon energy much lower than the bandgap does not contribute to solar cell power output. This is ignoring/not recognizing phonon-assisted absorption.17
We are setting the EQE equal to the quantum efficiency (EQE = QE), since we are not directly accounting for measuring reflection and transmission factors. We are assuming the internal quantum efficiency is equal to 1 for the visible range from 400 to 700 nm. EQE is the ratio of the number of charge carriers absorbed by the PV to the number of photons at that photon energy irradiating the device.
We then compare experimental PV efficiencies with the fundamental efficiency limits. Experimental inefficiencies include fundamental and avoidable losses caused by intrinsic material defects; material properties like doping levels, diffusion, and recombination caused by fabrication/manufacturing processes; and pre- and post-packaging errors.15,18 The fill factor (FF) is the ratio of the maximum power point over the product of the Voc and Isc.19 It is directly affected by the device material property leading to losses. Figure 6 shows how to measure FF through the “squareness” of the device’s current-voltage (I-V) curve.

7
Fig. 6 Illustration of solar cell FF calculation. The more area shaded under the I-V curve gives a higher FF.20
In all photosensitive devices, there is a current that flows even when no photons are absorbed into the device, which is called dark or reverse bias leakage depending on type of field (I0 or Is).21–23 Dark current is generated by random generation of electrons and holes within the depletion region or i-layer (undoped layer) of the device, which is located between the p-n junctions. Its level is dependent on doping levels. The charge generation rate is related to the specific crystallographic defects inside this region, thus the dark current level is dependent on material type, dopant concentration, and fabrication/packaging processes. So far, there has been no clear description on what factors play a greater role in affecting device dark current levels nor a clear parameter value. Leakage current can be caused by the initial wafer or by the fabrication process during which inappropriate parameters or a wrong handling are set in. Handling consists of packaging techniques such as passivation (anti-reflection [AR] coating) to reduce surface recombination or epoxy coating for mechanical protection. Both can potentially lead to negative effects. These leakage sites are distributed non-uniformly in the entire PV device. Device defects cause resistive effects in PVs that reduce the efficiency by dissipating the power.24,25 The parasitic resistances are series and shunt resistance (Rs and Rsh). Figure 7 shows a symbolic schematic of a PV device. Both the magnitude and impact of series and shunt resistance depend on the “geometry” of the device along with voltage operating point (high – series, low – shunt). If the device is large in volume, this increases the probability of more defects and negative metrics that introduce parasitic losses that are evident and greatly affects power conversion during low-light levels.

8
Fig. 7 Symbolic schematic of a PV device showing the different parasitic resistances of the device: shunt resistance Rsh and series resistance Rs26
We can easily relate the dark current of a PV to the background noise floor. If the leakage current level is high, this means that minor amounts of current under low-light conditions will be not be “collected” or harvested as efficiently as higher light conditions because the “current signal” is close to the noise. From the ideal diode equation, the slope is exponential. If the shunt resistance is low, then the slope will be very sharp, which means that FF will be lowered, as well. FF is maximized by the slope magnitude of the ideal diode model.
Low shunt resistance is typically due to manufacturing defects, the packaging process, and the geometry of the device.27 It causes power dissipation by allowing alternative current paths for the photon-generated electron hole pairs. Again, this is particularly noticeable under low-light conditions where less current is generated at a lower voltage operating point, which is where shunt resistance is determined. Shunt resistance (Rsh) of the device is calculated from the slope of the I-V dark current curve close to the short-circuit current (Isc) point. It is also possible to approximate Rs and Rsh from the slopes of the I-V curve at Voc and Isc, respectively, under light illumination. That being stated, it is important to note that for real devices, these resistances are often a function of the light level and can differ in value between the light and dark I-V measurements.28 Nevertheless, the relationship between these parasitic resistances and FF do not change even though the resistance values slightly differ from the measuring environment. Low Rsh decreases open circuit voltage, thus reducing FF and the overall energy conversion efficiency. Figure 8 demonstrate effects of shunt resistance on FF. Figure 9 shows a plot of typical dark current I-V and how to measure the shunt and series resistance.

9
Fig. 8 Rs and Rsh effects on FF and conversion efficiency under low-light intensities shown in a typical I-V curve of a device. Increasing Rs and decreasing Rsh decrease FF and the energy conversion efficiency of the device.29
Fig. 9 A plot of a typical dark current I-V and how to calculate the shunt and series resistance from the slopes of the leakage curve30
4. Experiment Setup
4.1 Materials
Five PV devices are characterized under low-light illumination: cool white LED, blue and green LED, and monochromator. All low-light illumination is between 400 to 700 nm with different radiant power densities and irradiance.
4.1.1 Light Sources and Spectra
The indoor light spectrum is dependent on the specific light source and reflected and diffused light in the closed space. There is no normal indoor light spectrum standard like the solar spectrum. The indoor light spectrum, i.e., fluorescent and

10
incandescent, and LED lighting, is in the visible light spectrum range from 400 to 700 nm with the largest portion between 450 and 600 nm. Although the indoor artificial lighting is a lower intensity than solar lighting, its irradiance or luminosity intensity is higher in the visible light when both light spectra are normalized with respect to the total power density (E), also called radiant power density (RPD). The total power density (E) of the radiation is determined by the summing of the spectral irradiance (𝐸𝐸𝜆𝜆(𝜆𝜆) ) at each wavelength (λ) shown in Eq 2.15 Indoor lighting has higher photon flux at visible range. Higher photon flux is important in determining the number of generated electrons in the absorber, which is directly related to the current produced by the PV. Figure 10 shows the standard solar spectrum compared to other indoor lighting spectrums.
𝐸𝐸 = ∫ 𝐸𝐸𝜆𝜆(𝜆𝜆) ∙ 𝑑𝑑𝜆𝜆∞0 (2)
Fig. 10 Spectral intensity/irradiance as a function of the incident photon wavelength comparing the cool white LED at an RPD of 0.01 and 0.001 mW/cm2 to the 10–3 sun global AM 1.5G solar spectrum at 0.088 mWopt/cm2. Bandwidth for the bandpass filters is ±25 nm (y-axis). The error for cool white LED at 0.01 and 0.001 mWopt/cm2 is 3% and 1.5%, which includes the calibration uncertainty of the Newport photodetector 818-UV model (x-axis).
If one compares the RPD of both the solar spectrum and white LED spectrum at the same magnitude, the cool white LED (400–700 nm) has 57% and 63% more RPD than solar radiation, including solar ultraviolet (UV) (280–700 nm) and excluding solar UV (400–700 nm), respectively. The solar infrared (IR) spectrum is disregarded since it just transmits through the single-junction PV cell without being converted. Three light sources are selected to simulate indoor light and phosphor RL from tritium (3H) and 63Ni.31 The optical power density of the light

11
sources ranges from 0.5 to 100 µWopt/cm2. Actual indoor optical power density vastly varies from 35 to 1000 µWopt/cm2 depending on location and distance from light source and shadowing.2 For this report, we have chosen a lower range to measure more realistic indoor lighting conditions. Indoor light conditions depend on the type of light source. Indoor light sources (white LED types, high pressure sodium lamp HP1, and metal halide lamp HP5) have similar light spectrum ranges (400 to 750 nm), but different spectral irradiance E (λ), Wopt/m2/nm, as shown in Fig. 11.11 White LED is selected as the primary indoor simulator due to its increase in use and superiority over other typical light sources with regard to lifetime, reliability, and overall energy efficiency from input electrical to output optical power. Also, its spectrum is similar to present light sources even though there are no proposed standard illuminants for LED lighting.
Fig. 11 Spectral irradiance of typical artificial light sources, including white LEDs11
The RPD is measured by the Newport photodetector 818-UV model at a fixed distance from the light source. The calibration uncertainty (without attenuator) is 1% at 350–949 nm, which covers the 3 light sources.32 A Cree 5-mm round cool white LED is used as a room light simulator with a spectrum range of 400 to 700 nm.33 Appendix A shows the spectra response and technical drawing schematic of the radiometer, and Appendix B shows the cool white LED relative intensity as function of wavelength compared with other white LED sources from the Cree datasheet. We considered using LED products from large LED suppliers. Since, the radiometer is designed to measure narrow spectrum lights sources, light binning was necessary to accurately measure the total optical power density. Calibrated bandpass filters from 400 to 700 ± 25 nm, covering the entire white LED spectrum, are individually placed over the top of the detector surface. The radiometer is set at the bandpass filter wavelength. The optical power density is recorded for each filter. All of the individual power densities, Wopt/(cm2)/nm, are summed up to calculate

12
the radiant power density, Wopt/cm2, for each input power setting. Lastly, the bandpass filters are removed and a median wavelength of the light spectrum is set on the radiometer to measure three optical power densities (1, 10, and 100 µWopt/cm2) at the 3 input power settings used in the binning procedure. The percent error is less than 3% at a 485-nm set wavelength on the optical meter. This allows us to measure the white light source without needing to bin the incident white light in every PV I-V curve measurement. Figure 12 shows images and an illustration of the experimental setup.
Fig. 12 Experimental setup showing a radiometer inside the light-tight enclosure. Bandpass filters are placed on the top of the radiometer silicon (Si) detector head to bin the incident light for the cool white LED. Six measurements were taken for each bandpass filter, which covered the entire white LED spectrum range. For each measurement, the radiometer set wavelength was changed to the central wavelength of the bandpass filter.
A HLMP brand34 blue LED at 470 nm and HLMP green LED at 523 nm35 simulate the RL of the phosphors used for the β-PV iBAT system. When measured by the radiometer, binning is not necessary because the 2 light sources have a central peak wavelength (470 and 523 nm), which is the set wavelength on the detector. The colored LED is not a complete monochromatic light source with 470 ± 30 and 523 ± 47 nm, but is qualitatively similar to a bell curve or Gaussian distribution. The optical detector averages over this distribution to give an approximate RPD. Refer to Appendix A for the absolute spectral responsivity of the detector for green and blue LEDs, uncertainty proof for the photodetector, and error between power measurements. An indirect energy conversion radioisotope battery converting phosphor RL into DC electrical energy to last 20 years has been developed.31 The phosphor platelets were fabricated by mb-microtec,36 a night-vision manufacturer
Radiometer Bandpass filter
LED Light Intensity Experiment Setup/Components
Radiometer

13
located in Switzerland. We are currently using 2 types of phosphors: green 528 nm at 1 µWopt/cm2 and ice-blue 455 nm at 1.9 µWopt/cm2.
Optical power density of the 2 phosphors was measured using an additional calibration factor with the Newport radiometer. The Newport radiometer (see Appendix A) is typically used to measure the RPD of directed beams. When used for diverging-beam light sources, isotropic point light sources, or finite area light sources, a calibration factor must be calculated to account for variation of the source radiated power and effective detector aperture. A numerical calculation was performed to determine the geometrical calibration factor describing the 0.8 × 4 × 20 mm finite area phosphor platelet geometry placed over the radiometer head at a distance of 8 mm above the Si detector head.
A 1-cm2 phosphor platelet filled with isotropic point-source emitters located a distance d above a 1-cm2 radiometer optical detector is illustrated in Fig. 13. The light collected by the detector is reduced as the source distance increases. A calibration factor is numerically calculated to account for this situation. For example, if a detector is located 9.5 mm from a 100-µWopt isotropic light source, then the power measured in the detector would yield 6 µWopt.
Fig. 13 A 1-cm2 phosphor platelet filled with isotropic point-source emitters is located above a 1-cm2 optical detector; 5% of the total light output is measured in the detector located 1 cm from the source
Both types of phosphor platelets (0.8 × 4 × 20 mm) contain 100 mCi of 3H with a nuclear power density of 4.1 µWnuc/cm2. The colored LEDs closely simulate RL low-light intensities, even though the spectra are narrower than the phosphors’ spectra. PVs are more efficient in harvesting radiant energy under a narrower spectrum such as a colored LED compared to RL emission from a phosphor.37 PVs are exposed to several light intensity points from 0.5 to 4 µWopt/cm2 to closely determine the PV conversion efficiency values and characteristic change under extremely low-light conditions. This is an important range because the phosphor

14
optical power density is also 1 ≥ Popt > 4 µWopt/cm2, depending on beta decay to optical conversion efficiency. Presently, commercially available phosphor products have efficiencies ranging from 27% to 47% using 2-dimensional radioisotope and phosphor particle interaction. Looking ahead, one of our goals is to determine the light intensity, either blue or green, that will give us the largest change in PV efficiency between the specified intensity ranges. This light intensity will determine what type of phosphor to use close to the specified emission. Colored LED and phosphor RL spectra with relative intensity are shown in Fig. 14. Relative intensity versus wavelength plots for both colored LEDs and absolute irradiance plots for both phosphors from vendor datasheets are shown in Appendix B.
Fig. 14 Relative intensity as a function of wavelength for green and blue LEDs compared to the phosphor RL emission from mb-microtec36
For further characterization of PV devices, a Princeton Instrument Acton SP2300 imaging triple monochromator is used to illuminate near single wavelengths on the device. The monochromator (400 nm to 700 nm) illuminates the PV cell that has the largest conversion efficiency for all 3 wider spectrum light sources. The light source is used to find the optimal wavelength for maximum energy conversion of the absorber. The RPD of the device is 92 and 185 nWopt/cm2 for each wavelength with a bandwidth less than a few nanometers from the central wavelength.
0
0.2
0.4
0.6
0.8
1
400 425 450 475 500 525 550 575 600 625 650
Rela
tive
Inte
nsity
Wavelength (nm)
Relative Intensity vs. WavelengthBlue LED 470 nm
Green LED 523 nm
Green Phosphor 528 nm
Ice-Blue Phosphor 455 nm

15
4.1.2 PV Solar Cells
Five single-junction PV solar cells of 3 different PV types (3× InGaP, 1× a-Si, and 1× mc-Si) are selected to determine a suitable candidate for low-light energy harvesting for indoor light (50–1000 µWopt/cm2)2 and scintillation light from phosphors (0.5–4 µWopt/cm2).29 The typical operating light intensity range and spectrum for solar cells is the outdoor lighting dominated by the solar spectrum with a range of 200 to 2500 nm and a RPD of 100 mW/cm2. The PV characteristics under STC are shown in Table 1. They are all commercially available for future large-scale energy recycling commercial and government initiatives. PV bandgaps (Eg) and EQE closely match with the visible spectrum. The PV EQE are shown in Fig. 15.
Table 1 An overview of PVs used in this study with STC characteristics and some material properties that include dark level parameters
STC 1 sun AM 1.5 PV
Type Vendor Device
Surface Area (cm2)
Eg (eV)
Dark/Leakage Current Density, J0
(A/cm2)
Rsh (Ω)
Jsc (mA/cm2)
Voc (V)
FF (%)
η (%)
InGaP 1st gen.
MicroLink 0.25 1.9 3.53E-10 5.38E+06 0.0224 1.11 82.5 2
InGaP 2nd gen.
MicroLink 4 1.9 3.60E-10 1.31E+08 10.8 1.40 84.5 13.3
InGaP 3rd gen.
RIT 1.2 1.9 1.49E-13 1.04E+10 14.4
1.35 83 16.5
a-Si Cymbet 17 1.7–1.8 3.52E-10 2.02E+06 0.007a 1.2a 63b 9.5b
mc-Si IXYS 1.3 1.12 8.62E-12 4.75E+06 42.4c >0.696 Max. 1.89c,d
>65 Max. 83.6c,d
22–24.4c,d
aReference 38 bReference 39 cReference 40 dReference 41

16
Fig. 15 EQE as a function of wavelength of selected PVs is shown.11,38,41–43 Both InGaP PVs show a maximum EQE at 540 nm (2.29 eV). This differs from InGaP bandgap edge at 1.9 eV (650 nm).
InGaP devices from MicroLink and Rochester Institute of Technology (RIT) have the same EQE shape as a function of wavelength, including the maximum EQE at certain wavelengths, 540 nm, but the magnitudes of the curves are different due to the difference in fabrication and post-packaging processes. The maximum EQE of InGaP is at 540 nm, which is a higher photon energy than expected. The EQE plot displays the visible and IR range. Appendix C displays a wider spectrum range EQE plot. Dark current was measured by our semiconductor parameter analyzer. The true dark current of the PV devices should be a few orders magnitude lower (10–3). The measurement is limited by the analyzer.
4.2 Methods
4.2.1 LED Illumination
For the LED illumination method, each LED illuminated the PV device at a constant distance. The LED illumination is controlled by a power supply. Two digital multimeters measure the LED current and voltage. Each LED is mounted to light-tight lid. Two light time enclosures are used for the optical meter and PV device. First, the optical meter’s wavelength is set to the light source’s central wavelength and zeroed. Once zeroed, the LED lid closes the optical meter’s enclosure and optical power density is measured. Then, the LED lid is placed on the PV enclosure. Detector active surface and PV surface are the same distance from the light source. The PV device is connected to a HP 4155B semiconductor
0%10%20%30%40%50%60%70%80%90%
100%
400 500 600 700 800 900 1000 1100 1200
EQE
Wavelength (nm)
External Quantum Efficiency (EQE)mc-Si
a-Si
MicroLink InGaP
RIT InGaPmax. EQE at540 nm for both InGaP
devices
17
parameter analyzer. An I-V curve is measured for each light intensity. Figure 16 shows an illustration of the method.
Fig. 16 Illustration of the LED illumination method. The optical power meter confirms the LED optical power density for every PV I-V curve trace on the semiconductor parameter analyzer. The photodetector surface and PV surface are both placed the same distance from the light source. Both devices are placed in light-tight enclosures.
4.2.2 Monochromator Illumination
InGaP PV is placed in light-tight enclosure. An optical power meter measures the radiant power densities of the monochromator for each wavelength, constant, at a stationary distance. PV device is set at this exact distance from the optical fiber cable. Monochromator illumination covers the entire PV active surface. This method’s setup is shown in Fig. 17. Short-circuit current as a function of wavelength is measured from 400 to 700 nm.
Fig. 17 Image of the monochromatic illumination setup

18
5. Results
PV devices are measured under the low-light illumination of 3 discrete LED light sources. Of the 5 PV devices measured, the 1 with the largest conversion efficiency is studied further by continuously varying the wavelength with a monochromator.
5.1 Highest Conversion Efficiency PV using Low-Light LED Illumination
Each PV type is tested under the same conditions. A 1-cm2 black aperture is placed on the a-Si and MicroLink 2nd generation InGaP PV, because the device surface area is larger than the illumination area. The other PV devices have active areas that are equal to or smaller than 1 cm2. These devices are not covered by the aperture. I-V curves are recorded for each PV under the illumination of the 3 different LED light sources ranging from 0.5 to 100 µWopt/cm2. Isc, Voc, maximum power point (MPP), surface power density (Se), energy conversion efficiency (η), and FF are measured and calculated. Appendix D shows plots of the 5 PV efficiencies relative to the changing light intensity and light source type along with the FF relative to the changing light intensity and light source. Table 2 compares PV conversion efficiency and FF with the 3 light sources at the same RPD. Figure 18 compares the 3 light sources’ spectral irradiance corresponding to wavelength spectrum at the same RPD.

19
Fig. 18 Spectral intensity as a function of wavelength of illumination sources is shown. All light sources have RPD of 0.1 mWopt/cm2.
In Fig, 18, the error of the cool white LED spectral irradiance is approximately 3% after repeated measurements. The radiometer uncertainty is 1%. The bandpass filters used to measure the cool white LED are ±25 nm, covering the entire light source spectrum. The spectral bandwidth of the colored LEDs is taken from the corresponding datasheets shown in Appendix B. The points for blue and green LEDs are reference markers from the datasheets (Appendix B.) that equal the RPD and the points for the white LED are measured by the detector. The corresponding curves are approximations with respect to the relative intensity as function of wavelength datasheet plots shown in Appendix B.
FF increases as light intensity increases. InGaP devices show a slight increase (81% to 84% for green light illumination), whereas a-Si and mc-Si show a large increase (25% to 75% for green illumination). Refer to Appendix D for plots of FF as a function of light intensity. η is higher under green illumination compared to the blue light, refer to Table 2. All 5 PV types have lower thermalization loss and higher EQE under green light (refer to Fig. 15). However, if the blue emission RPD is >2×
than that of green light, it would be a better option because the conversion efficiency increases much greater as the light intensity increases relative to low operating range from 0.5 to 5 µWopt/cm2. This means that a more efficient phosphor, as long as the photon energy is above the device bandgap, will give a higher device
0
0.01
0.02
0.03
0.04
0.05
0.06
400 450 500 550 600 650 700
Spec
tral
Inte
nsity
(W/m
^2/n
m)
Wavelength (nm)
Spectral Intensity vs. Wavelength of Light Sources
523 nm LED [RPD = 0.1mW/cm^2]
470 nm LED [RPD = 0.1mW/cm^2]
Cool White LED [RPD = 0.1 mW/cm^2]

20
Se, which is the reason why we are selecting the ice-blue phosphor to replace the lower light intensity green phosphor at 528 nm for the existing commercial-off-the-shelf (COTS) iBAT system.
Table 2 PV conversion efficiency and FF for the 3 experimental light sources performed at the same RPD. The highest efficiency measured is for the InGaP PV under 523-nm irradiation.
Light Source (RPD = 1 µWopt/cm2) 523 nm 470 nm Cool White LED
PV Type FF (%)
η (%)
FF (%)
η (%)
FF (%)
η (%)
RIT InGaP 84.4 29.1 63 13.3 61 14.5 a-Si 26 1.6 26 1.3 26 1.5 mc-Si 50 0.95 47 0.9 43.4 2
The PV efficiency as a function of light intensity curves are qualitatively the same in shape for all 3 light sources shown in Appendix D. The curves split into 2 different slopes relative to the 2 light intensity ranges that we initially specified in Section 2. There is a large efficiency increase from 500 to 5 µWopt/cm2 [1%/(µWopt/cm2)] compared to a gradual increase from 5 to 100 µWopt/cm2 [0.16%/(µWopt/cm2)] for all light sources. Overall, the 3 InGaP cells, when normalized to equal active areas, have the highest conversion efficiency (η) for all 3 light sources. InGaP cells have a lower dark current density of 1.49E-13 A/cm2, high EQE over the visible range (~90% at 540 nm), and a bandgap of 1.9 eV, which increases FF throughout the light intensity range. InGaP η ranges from 15% to 35% for white light intensity from 1 to 100 µWopt/cm2 (typical indoor light ranges from 50–1000 µWopt/cm2).
The 3 InGaP cells are from 2 vendors: MicroLink Devices and RIT Nanopower Research Labs (NPRL).42,43 The fabrication processes of all 3 devices are similar, but their post-packaging techniques are different. These post-packaging techniques include packaging epoxies and passivation, which includes AR coatings. The conversion efficiency of the devices are lowered because of the weakened EQE and higher dark current I-V curve caused by these avoidable losses.
5.2 Minimize Thermalization Loss/Maximize Quantum Efficiency
Thermalization losses (TLs) and EQE strongly impact the conversion efficiency of PV devices under low-light conditions. InGaP Eg and EQE closely match the 3 light sources’ central peak emission and overall spectra with high conversion efficiency and FF due to high shunt resistance (low dark current). Presently, we have designed, constructed, and tested a 100-µWe radioisotope battery that uses indirect energy conversion. COTS gallium arsenide (GaAs) solar cells surround phosphor glass

21
platelets filled with 3H and convert the low, 528-nm light into DC electrical power. Energy conversion from optical to electrical energy is ~3%. Energy conversion from nuclear to electrical is 1% efficiency (initial nuclear energy of beta decay).31
After measuring the 3 types of InGaP devices under LED illumination, we directly compared InGaP cells to GaAs under a RL light at 1 µWopt/cm2 from the phosphor platelets. I-V curves for both devices are shown in Fig. 19. InGaP’s Jsc and Voc, due to its higher bandgap, are nearly 2× more than GaAs. Again, this is due to the fundamental losses and lower dark current. Also, GaAs has 2× and 1.6× more TL than InGaP under green and blue illumination shown in Table 3. These magnitudes were calculated by dividing the device bandgap by the photon energy. Experimental results and device material properties prove that InGaP is the candidate to replace GaAs for low-light energy harvesting.
Fig. 19 I-V curves of InGaP and GaAs under phosphor-lined tritium platelets at 528 nm. The red dashed line highlights where the maximum power points/surface power densities are for InGaP (0.0524 µWe/cm2) and GaAs (0.03 µWe/cm2) under 528 nm at a RPD of 1 µWopt/cm2.
Table 3 TLs for the 2 PV (InGaP and GaAs) and 2 phosphors (528 and 455 nm). The PV-phosphor combination with the lowest TL is the InGaP PV with the 528-nm zinc selenide (ZnS):copper (Cu) phosphor.
Light Sources nm eV GaAs TL InGaP TL Green (ZnS:Cu) Phosphor
528 2.3 38% 17%
Ice-Blue Phosphor
455 2.72 47% 30%
Green LED 523 2.37 40% 20% Blue LED 470 2.63 46% 28%

22
5.3 Optimized Energy Conversion
Models have been developed to approximate PV conversion efficiency under monochromatic light. Green et al. proposed a model to calculate the maximum conversion efficiency at a high, concentrated light intensity (1000 suns) and narrow bandwidth light.44 At a high enough light intensity, independent of photon energy, the device open-circuit voltage is will change to match that power, even if that is beyond the device’s limit. PVs are capable of converting under these nonstandard conditions near 100%. These efficiencies are reached through radiative recombination. The model is limited to photon energies above and equal to the absorber bandgap. Sze et al.17,45 and Van Zeghbroeck et al.37 introduce a first-order model that provides an analytic approximation of PV conversion efficiency for monochromatic illumination shown in Eq. 3. The maximum efficiency of a single junction under STC and solar spectrum is 31% with for Eg = 1.35. The ideal efficiency under the model conditions is 37%. The ideal solar-cell efficiency is reached at 300 K and an optical concentration of 1000 suns magnitude. Again, the photon energy is ignored or assumed equal to the device bandgap. These models do not consider STC, low-light conditions, or narrow or wide spectrum.
𝜂𝜂 = 𝐼𝐼𝑝𝑝ℎ𝑉𝑉𝑚𝑚𝑃𝑃𝑖𝑖𝑖𝑖
= �1 − 2𝑘𝑘𝑘𝑘𝑄𝑄𝑔𝑔
ln �1 + 𝑄𝑄𝑔𝑔𝑘𝑘𝑘𝑘�� (3)
Iph is the photocurrent independent of the applied voltage, Vm is the voltage of the MPP, and Pin is the input power from light source. We modified the ideal solar efficiency model by including the device bandgap. The model is a function of photon energy shown in Eq. 4. For the single-junction cell, the model assumes that photons above the bandgap energy will be absorbed. The model is limited by photon energy less than the bandgap, since low photon energies mostly transmit through the device without being converted or contribute to usable power production (Eph ≥ Eg). As the photon energy matches the bandgap, the TL decreases, increasing the conversion efficiency, as shown in Fig. 20.
𝜂𝜂 = � 𝑄𝑄𝑔𝑔𝑄𝑄𝑝𝑝ℎ
− 2𝑘𝑘𝑘𝑘𝑄𝑄𝑔𝑔
ln �1 + 𝑄𝑄𝑔𝑔𝑘𝑘𝑘𝑘�� (4)
23
Fig. 20 Analytic approximation of TL for monochromatic. EQE of device is not included in this model. InGaP’s maximum power point is at 650 nm whereas GaAs’s maximum power point in close to the IR spectrum at 865 nm. At these optimal points, InGaP is still more efficient than GaAs (12% TL compared to 15% TL).
The maximum conversion efficiency limit for GaAs and InGaP when bandgap matched to the incident photon energy is 85% and 88%, respectively. There is a conversion efficiency limit of less than 90% because of radiative (band-to-band) recombination losses, which is familiar in direct bandgap materials such as GaAs and InGaP.21 InGaP’s efficiency is greater because of its larger bandgap, thus having a higher Voc limited by the recombination processes in the cell.46,47
The RIT InGaP device was illuminated by a monochromator at a constant RPD to further study the characteristics of the selected device and formulate an ideal, single-junction solar cell efficiency model for low-light conditions that are narrow bandwidth. The RIT device was selected because it had the lowest dark current and highest conversion efficiency for all 3 light sources. The device was exposed to monochromatic light ranging from 400 to 700 nm at RPD of 185 nWopt/cm2. The main objective of this test was to find the optimal wavelength for the highest device energy conversion. We discovered that the maximum Isc is at 614 nm, not at Eg of 650 nm. EQE of InGaP shows that the highest number of charge carriers collected is the highest and plateaus from ~510 to 590 nm where it then starts decreasing closer to the device bandgap.
We determined that the maximum energy conversion of a single-junction PV is based on the EQE and TL shown in Eq. 5. Focusing on the TL alone, InGaP’s conversion efficiency is higher than GaAs, especially in the visible range between
0%
10%
20%
30%
40%
50%
60%
70%
80%
400 450 500 550 600 650 700 750 800 850 900
Ther
mliz
atio
n Lo
ss (T
L)
Wavelength (nm)
Analytic Approximation of Thermalization loss for monochromatic illumination
InGaP
GaAs
Eg limit

24
400 to 700 nm, which are the operating ranges for both applications. So, it is justified that a perfect bandgap match would be the maximum conversion efficiency. However, we would be ignoring the spectral response of device, which starts to decrease after 600 nm. By incorporating the device EQE as a function of photon energy in the modified ideal model, the maximum theoretical conversion efficiency at the optimal wavelength matches the experimental results shown in Fig. 21. The formulated model showed an optimal wavelength for InGaP at 614 nm with a conversion efficiency of 70%, which is the same wavelength for the maximum short-circuit current under the monochromatic light.
𝜂𝜂 = � 𝑄𝑄𝑔𝑔𝑄𝑄𝑝𝑝ℎ
− 2𝑘𝑘𝑘𝑘𝑄𝑄𝑔𝑔
ln �1 + 𝑄𝑄𝑔𝑔𝑘𝑘𝑘𝑘�� × 𝐸𝐸𝐸𝐸𝐸𝐸(𝐸𝐸𝑝𝑝ℎ) (5)
Fig. 21 Experimental results qualitatively match the modified model of the device conversion efficiency under monochromatic illumination for low-light conditions. The optimal photon wavelength is 614 nm for InGaP even through the photon bandgap match is at 650 nm. This shows that the maximum conversion efficiency is dependent on device EQE and TL, not one or the other.
The spectral characteristics of the efficiency for the short-circuit current is shown, but one cannot completely compare this to the model without incorporating voltage changes. In summary, the model and short-circuit measurements closely approximate the optimal wavelength point for InGaP. Our results qualitatively match well with other research work from Bett et al.48 conversion efficiencies are not identical due to different model assumptions. Bett et al. states that the conversion efficiency peak of InGaP is 47.2% at 610 nm with a laser RPD intensity of 20 Wopt/cm2. Their results use the program EtaOpt for theoretical efficiency of device illuminated by a monochromatic light source.49 EtaOpt is a program code developed at Fraunhofer ISE (for download: http://www.ise.fraunhofer.de/).50 Figure 22 shows a plot of the monochromatic efficiency as a function of the laser

25
wavelength for different materials being investigated from Bett et al.48 Using our model shown in Eq. 5, the efficiency of InGaP is 69% at 610 nm. Our peak conversion efficiency for InGaP is 70% at 614 nm. Our model disregards light intensity, FF, and saturation current (J0). These factors would decrease the efficiency limit. The true overall conversion efficiency of the PV type is not calculated by this modified model. Nevertheless, the model is a more realistic version of the original ideal, single-junction solar cell model for monochromatic light from Sze et al. and Van Zeghbroeck et al. Our modified ideal model shows higher efficiency limits than EtaOpt because of a difference in model assumptions.
Fig. 22 Monochromatic efficiency vs. the wavelength of the laser at 20 Wopt/cm2. The curves are simulation results. Different PV single-junction devices were illuminated by the laser. The efficiency values shown as symbols were from the measured I-V curves. The stars mark the efficiencies from an 810-nm laser. The highest efficiency for InGaP was seen at 610 nm with 47.2%, and for GaAs, it is around 820 nm.48
6. Conclusion
PV solar cells optimized to near 30% efficiency for solar illumination (100 mWopt/cm2) can be very poor when illuminated at low-light intensity and narrow spectrum. However, similar efficiencies can be obtained even under these low-light conditions with single-junction solar cells whose bandgap close matches the photon energy, i.e., an InGaP device illuminated by 100 µWopt/cm2 of radiation at 523 nm, 470 nm, or white light (400–700 nm) from an LED has a conversion efficiency of near 30%. From these results, we were able to formulate a modified ideal solar cell model under low monochromatic light conditions, different from the

26
existing model, which is based on 1000× more light intensity than 100 mWopt/cm2. Also, we discovered that light intensity (phosphor conversion efficiency from beta decay to RL) is more important than the TL of incoming photon energy. The InGaP solar cells are ideal for low-light conditions in the visible range. Further development and optimization of InGaP cells is necessary for future application such as distributed sensors inside buildings or remote areas for environmental monitoring and for radioisotope batteries that convert beta decay emission into DC electrical energy by combining phosphors with photocells.
7. Further Evaluation
The experimental results show that InGaP devices have the highest conversion efficiency in the visible light spectrum range for all light intensities. Yet, there is still area for improvement dealing with the avoidable losses such as fabrication/manufacture process, post-packaging, and handling. Currently, the Alternative Energy team at the US Army Research Laboratory (ARL) and RIT are collaborating to lower these fabrication and post-packaging losses to increase the conversion efficiency for both energy harvesting systems. Material properties will be analyzed such as intrinsic dopant level reduction, diffusion, and recombination. This will improve the ARL iBAT system efficiency by 2, as well as indoor light energy harvesting for residential, commercial, and government applications.
In addition to the enhancement of InGaP, more PV cells and light sources will be tested using the same methods mentioned in the report. The PV cells will include GaAs cells from Alta and MicroLink Devices, organic PV (OPV) solar cells,50 dye-sensitized solar cells (DSSEs),51 pc-Si solar cells, and multi-junction solar cells.52 The new light sources will be neutral and warm white LEDs, high and low intensity, to fully cover actual indoor light conditions, and narrow spectrum LEDs like yellow, orange, and red light. We will formulate a more progressive model that includes the light intensity impact on FF and various light spectrums, narrow and wide, in the visible range. Finally, the monochromatic illumination method will be performed on GaAs cells (MicroLink and Alta Devices) to find the optimal wavelength for laser power converters (LPVs).53,54 We will measure the I-V curve for each wavelength at a constant light intensity, instead of just the short-circuit current measurement. The model will be closely based on EtaOpt. We will compare the device conversion efficiencies under monochromatic and broad spectrum light source illumination to the modified model in order to calculate more realistic efficiency limits.

27
8. References and Notes
1. Solar Spectra, NREL’s power systems engineering center, [accessed 6 8 2015]. http://rredc.nrel.gov/solar/spectra/.
2. Gasulla M, Penella MT, Lopez-Lapena O, Webster JG, Eren H. Powering autonomous sensors, in measurement, instrumentation, and sensors handbook Second Edition: Spatial, mechanical, thermal, and radiation measurement, Boca Raton (FL). CRC Press Taylor & Francis Group, pp. 88.1–88.10, 2014.
3. Vinel A, Wang L, Yang LT, Feng and Xia., Internet of things. International Journal of Communications Systems. 2012;25:1101–1102.
4. Randall JF. Designing indoor solar products: Photovoltaic technologies for Aes; Chichester (UK): John Wiley & Sons, Ltd, 2005.
5. Hande A, Polk T, Walker W, Bhatia D. Indoor solar energy harvesting for sensor network router nodes. Microprocessors and Microsystems. 2007;31(6):420–432.
6. Weddell A, Harris N, White N. An efficient indoor photovoltaic power harvesting system for energy-aware wireless sensor nodes. Pervasive Systems Centre, School of Electronics and Computer Science, University of Southampton, UK, 2008.
7. Russo J, Litz M, Katsis D, Brant J, Burns D, Argue R. Low power radiation detection sensor: architecture for unattended sensing suites. Adelphi (MD): Army Research Laboratory (US); 2015 September. Report No.: ARL-TR-7424.
8. Grady S. Energy Harvesting Powers Wireless Sensors. In Power Sources Manufacturing, 2nd Quarterly, 2012.
9. Thomas J, Qidwai M, Kellogg J. Energy scavenging for small-scale unmanned systems. Journal of Power Sources. 2006;159:1494–1509.
10. Marszal A. Zero energy building - A review of definitions and calculation methologies. Energy and Buildings. 2011;43:971–979.
11 Minnaert B, Veelaert P. A proposal for typical artificial light sources for the characterization of indoor photovoltaic applications. Energies. 2014;7:1500–1516.
12. Reich NH, van Sark W, Turkenburg WC. Charge yield potential of indoor-operated solar cells incorporated into product integrated photovoltaic (PIPV). Renewable Energy. 2011;36:642–647.

28
13. Jones K. Harvesting energy from the sun: solar photovoltaics. Colorado State University: Extension - A division of the Office of Engagement, 5 August 2014. [accessed 11 August 2015]. http://www.ext.colostate.edu/pubs/consumer/10624.html.
14. Litz M, Dimos D, Russo J, Caroll J. Tritium power sources for long-lived sensors. American Chemical Society. 2014.
15. Hirst L, Ekins-Daukes N. Fundamental losses in solar cells. Department of Physics, Imperial College London, UK, 2009.
16. Ekins-Daukes N. Controlling radiative loss in quantum well solar cells. Journal of Physics D: Applied Physics. 2013;46(26).
17. Shockley W, Queisser HJ. Detailed balance limit of efficiency of p-n junction solar cells. Journal of Applied Physics. 1961;32(3):510–519.
18. Sze SM, Ng KK. Chapter 13: Photodetectors and solar cells. in Physics of Semiconducto Devices, Hoboken, John Wiley & Sons, Inc., 2007, 663–742.
19. Green MA. Solar cell fill factors: General graph and empirical expressions. Solid-State Electronics. 1981;24:788–789.
20. Fill Factor. PVEducation.org [accessed 7 August 2015]. http://www.pveducation.org/pvcdrom/solar-cell-operation/fill-factor.
21. Dark IV Measurements. PVEducation.org, [accessed 7 August 2015]. www.pveducation.org/pvcdrom/characterisation/dark-iv-testing.
22. Zhao J, Wang A, Dai X, Green MA, Wenham SR. Improvements in silicon solar cell performance. in Photovoltaic Specialists Conference, Las Vegas, 1991.
23. Honsberg C, Bowden S. Photovoltaic Education Network. PVEducation.org [accessed 7 August 2015]. http://www.pveducation.org/.
24. Honsberg C, Bowden S. Effect of parasitic Resistances, PVEducation.org [accessed 7 August 2015]. http://www.pveducation.org/pvcdrom/solar-cell-operation/effect-of-parasitic-resistances.
25. Breitenstein O, Bauer J, Altermatt PP, Klaus R. Influence of defects on solar cell characteristics. Solid State Phenomena Vols. 2010;156–158:1–10.
26. Deibel C. Intermediate: Current-Voltage Characteristics of Organic Solar Cells, 5 March 2008. Notes on Disordered Matter. [accessed 7 August 2015]. http://blog.disorderedmatter.eu/2008/03/05/intermediate-current-voltage-characeristics-of-organic-solar-cells/.

29
27. Lucheng Z, Hui S. Novel approach for characterizing the specific shunt resistance caused by the penetration of the front contact through the p-n junction in solar cell. Journal of Semiconductors. 2009;30(7).
28. Pode R, Diouf B. Green energy and technology: Solar lighting, London: Springer, 2011.
29. Part II – Photovoltaic Cell I-V Characterization Theory and LabVIEW Analysis Code, 10 May 2012. National Instruments [accessed 7 August 2015]. http://www.ni.com/white-paper/7230/en/.
30. Dark I-V Measurements. PVEducation.org [accessed 7 August 2015]. http://www.pveducation.org/pvcdrom/characterisation/dark-iv-testing.
31. Russo J, Litz MS, Katsis D. Commercial-off-the-shelf (COTS) indirect energy conversion isotope (IDEC) design structure and power management. Adelphi (MD): Army Research Laboratory (US); 2014 December. Report No.: ARL-TR-7158.
32. Newport, 818 Series Photodetector Guide [accessed7 August 2015]. http://assets.newport.com/webDocuments-EN/images/RevB_818_Series_Manual.PDF.
33. CREE 5-mm Round LED C513A-WSS/WSN [accessed 7 August 2015]. http://www.cree.com/~/media/Files/Cree/LED%20Components%20and%20Modules/HB/Data%20Sheets/C513A%20WSN%20WSS%20MSN%20MSS%201042.pdf.
34 Registered trademark of Avago Technologies, http://www.avagotech.com/.
35. HLMP-Cx1A/1B/2A/2B/3A/3B New 5 mm Blue and Green LED Lamps Datasheet. Avago Technologies.
36. mb-microtec [accessed 7 August 2015] http://www.mbmicrotec.com/en/.
37. Zeghbroeck BV. Principles of Semiconductor Devices, 2011. [accessed 7 August 2015]. http://ecee.colorado.edu/~bart/book/book/title.htm.
38. C. Corporation. CBC-PV-02 Photovoltaic Cell: 2-Series Amorphous Silicon Solar Cell [accessed 8 August 2015]. http://www.cymbet.com/pdfs/DS-72-25.pdf.
39. Meier J, Spitznagel J, Kroll U, Bucher C, Fay S, Moriarty T, Shah A. Potential of amorphous and microcrystalline silicon solar cells. Thin Solid Films. 2004;451:518–524.

30
40. Zhao JH, Wang AH, Green MA Ferrazza F. 19.8% efficient “honeycomb” textured multicrystalline and 24.4% monocrystalline silicon solar cells. Applied Physics Letters. 1998;73:1991–1993.
41. IXYS, "IXOLAR High Efficiency SolarMD SLMD321H09L," IXYS, 2014.
42. Hubbard SM. Summary of RIT Low Intensity InGaP Results. NanoPower Research Laboratory, Rochester Institute of Technology, Rochester, NY, 2015.
43. "uLink Rao Samples 1-8199-IV Data Excel file," MicroLink Devices, 2014.
44. Green MA. Limiting photovoltaic monochromatic light conversion efficiency. Progress in Photovoltaics: Research and Applications. 2011;9:257–261.
45. Sze SM. Physics of Semiconductor Devices, New York: Wiley, 1981.
46. Haug F-J. Efficiency limits. [accessed 7 August 2015]. http://www.superstrate.net/pv/limit/.
47. Bett AW, Dimroth F, Lockenhoff R, Oliva E, Schubert J. III-V solar cells under monochromatic illumination. in Photovoltaic Specialists Conference 33rd IEEE, San Diego, CA, USA, 2008.
48. Letay G, Bett AW. EtaOpt - a program for calculating limiting efficiency and optimum bandgap structure for multi-bandgap solar cells and TPV cells," in 17th EC-PVSEC, Munich, 2001.
49. Bett DA. etaOpt," Fraunhofer ISE [accessed 7 August 2015]. http://www.ise.fraunhofer.de/de/geschaeftsfelder/iii-v-und-konzentrator-photovoltaik/themen/iii-v-epitaxie-und-solarzellen/fue-leistungen/simulation/etaopt.
50. Demonstrator, 2015. Infinity OPV [accessed 7 August] http://infinitypv.com/infinityopv.
51. G-Cell [accessed 7 August] http://gcell.com/.
52. ZTJ Photvoltaic Cell datasheet, Sept 2012. Emcore [accessed 7 August] http://www.emcore.com/wp-content/uploads/ZTJ-Cell.pdf.
53. Howell JT, O’Neill MJ, Fork RL. Advanced receiver/converter experiments for laser wireless power transmission. in Proc. of the 4th Int. Conf. on Solar Power from Space - SPS ‘04, togther with the 5th Int. Conf. on Wireless Power Transmission, Granada, 2004.

31
54. Rotman D. Alta Devices: Finding a Solar Solution, MIT Technology Review, 21 February 2012. [accessed 6 August 2015]. http://www.technologyreview.com/featuredstory/426972/alta-devices-finding-a-solar-solution/.

32
INTENTIONALLY LEFT BLANK.
33
Appendix A. Specifications of the Newport 818-UV Radiometer

34
The response curve of the radiometer is shown in Fig. A-1. The responsivity at 470 nm is 0.25 A/W and the responsivity at 523 nm is 0.3 A/W. After setting and measuring the light source peak, we measured the lower and upper wavelength bounds of both light-emitting diode (LED) devices to calculate the overall uncertainty of the detector. The detector was set at the wavelength of the lower and upper bounds. For the green LED, we measured at 476 nm (SR(476 nm) ≈ 0.256 A/W) and 570 nm (SR(570 nm) ≈ 0.37A/W), giving a power of 12.4 and 8.6 µWopt/cm2. The central wavelength is 523 nm (SR ≈ 0.3 A/W) at a power of 10.05 µWopt/cm2. We took the product of each SR(λ) and Se, and then, took the absolute difference between the upper and lower bounds. Last, the difference was divided by the central peak product, which gives the uncertainty or error of the detector. This uncertainty was nearly identical for the blue LED results. Also, the uncertainty agrees with the Newport datasheet result of 1%.
Optical power density error is calculated using SR(λ) and the corresponding Se shown in Eq. 5. The full width at half maximum (FWHM) of the green LED is from 500 nm (SR ≈ 0.27 A/W) to 545 nm (SR ≈ 0.31 A/W). The detector is measuring over the entire “broad” spectrum of the LED source, so the SR values of the 2 extreme FWHM values must be accounted for to calculate the optical power measurement error. The error is less than 10% for the green LED and 4% for the blue LED.
𝑆𝑆𝑒𝑒(523 𝑛𝑛𝑛𝑛)𝑆𝑆𝑆𝑆(523𝑛𝑛𝑛𝑛) × 𝑆𝑆𝑆𝑆(500)𝑙𝑙𝑙𝑙𝑙𝑙𝑒𝑒𝑙𝑙 = 9
µWopt
cm2
𝑆𝑆𝑒𝑒(523 𝑛𝑛𝑛𝑛)𝑆𝑆𝑆𝑆(523𝑛𝑛𝑛𝑛) × 𝑆𝑆𝑆𝑆(500)ℎ𝑖𝑖𝑖𝑖ℎ𝑒𝑒𝑙𝑙 = 10.33
µWopt
cm2

35
Fig. A-1 Spectral response of the Newport optical meter1
The geometry of the detector head comes into play when the source to be measured is larger than 1 cm2. The measured values of tritium-loaded phosphor vials are isotropic radiators and too large to fit on the detector surface. Numerical analysis describe in describe the calibration curve generated for light sources sitting above the radiometer. The geometry that effects this calculation is shown in Fig. A-2.
Fig. A-2 Schematic of the 818 Newport optical power meter with dimensions1
1Newport [accessed 7 August 2015]. http://assets.newport.com/webDocuments-
EN/images/RevB_818_Series_Manual.PDF.

36
INTENTIONALLY LEFT BLANK.

37
Appendix B. Specifications of LED and Phosphor Components Used in Report

38
The phosphor spectra are broader compared to the colored light-emitting diode (LED) spectra. The 3H gas filled phosphor platelets are shown in the Fig. B-1 (right of the spectrum plot). The phosphor full width at half maximum (FWHM) are on the order of 100 nm while the simulating LEDs are on the order of 50 nm FWHM (see Fig. B-1). This difference in FWHM does not diminish from the utility of measuring photovoltaic (PV) characteristics. Figure B-2 shows the relative intensity as function of wavelength.
Fig. B-1 Absolute intensity vs. emission spectrum of an ice-blue phosphor and green phosphor platelet excited by tritium decay

39
Fig. B-2 HLMP colored LEDs’ relative intensity as function of wavelength for green and blue32
It is interesting to note the CREE Inc makes available indoor lighting LED devices with variation in frequency content that are intended to simulate indoor lighting and, presently, used to illuminate indoor facilities (Fig. B-3).
Fig. B-3 Cree cool white LEDs relative intensity as a function of wavelength. All 3 white LEDs have the same visible range, but different relative intensities at certain wavelengths such as 450, 550, 575, and 600 nm. All have the same relative intensities between 470 to 500 nm.1
1 CREE 5-mm Round LED C513A-WSS/WSN [accessed 7 August 2015].
http://www.cree.com/~/media/Files/Cree/LED%20Components%20and%20Modules/HB/Data%20Sheets/C513A%20WSN%20WSS%20MSN%20MSS%201042.pdf.

40
INTENTIONALLY LEFT BLANK.

41
Appendix C. Quantum Efficiency Measurements of Single-Junction Solar Cells

42
Figure C-1 shows the quantum efficiency (QE) measurements of the single-junction photovoltaic (PV) solar cells.
Fig. C-1 QE measurements of single-junction PV solar cells. EQE = QE since IQE is equal to 100% through wavelength spectrum1
1 http://www.pvmeasurements.com/Products/Discontinued-Products/qex7-solar-cell-spectral-response-
quantum-efficiency-ipce-measurement-system.htm.
43
Appendix D. Photovoltaic Solar Cell Conversion Efficiencies and Fill Factor as Function of Light Intensities

44
For completeness, the following efficiency curves have been included. Both fill factor (FF) and device conversion efficiency (η), exposed to white, blue, and green light light-emitting diodes (LEDs) are documented below. White light exposures are described in Figs. D-1 and D-2, blue light exposures described in Figs. D-3 and D-4, and green light exposures shown in Figs. D-5 and D-6.
The FF for the amorphous silicon drops from the nominal 70% below 50 µWopt/cm2 intensity, making it unusable for low-light applications. It is not understood why the monocrystalline silicon cell FF decreases above 50 µWopt/cm2.
Fig. D-1 Photovoltaic (PV) device FF as function of light intensity for cool white LED

45
Fig. D-2 PV device conversion efficiency as function of light intensity for cool white LED
The exposure of the PV to blue light, simulating the ice-blue phosphor within the tritium loaded vials, shown in Figs. D-3 and D-4. FF reduces from its nominal 65% above 50 µWopt/cm2 for the 1st generation MicroLink indium gallium phosphide (InGaP) cells.
Fig. D-3 PV device FF as function of light intensity for blue LED

46
Fig. D-4 PV device conversion efficiency as a function of light intensity for blue LED
Fig. D-5 PV device conversion efficiency as a function of light intensity for green LED

47
Fig. D-6 PV device FF as a function of light intensity for green LED

48
List of Symbols, Abbreviations, and Acronyms
a-Si amorphous silicon
ARL US Army Research Laboratory
β-PV beta-photovoltaic
Cu copper
DSSE dye-sensitized solar cells
Eg bandgap of semiconductor device
Eph incident photon energy
E total power density of visible EM radiation
EQE external quantum efficiency
EM electromagnetic
FF fill factor
FWHM full width at half maximum
GaAs gallium arsenide
IDEC indirect energy conversion
iBAT isotope battery or radioisotope battery
I0, Id dark current
Isc, Ig short circuit current
InGaP indium gallium phosphide
IR infrared
IoT internet of things
I-V current-voltage
Jsc short circuit current density
LIL low illumination light
LPV laser power converter or photovoltaic
mc-Si monocrystalline silicon
MJ multi-junction

49
MPP maximum power point
NPRL Nanopower Research Labs
OPV organic photovoltaic
Pin input power of light source
PV photovoltaic
QE quantum efficiency
Rs series resistance
Rsh shunt resistance
RF radio frequency
RL radioluminescence
RIT Rochester Institute of Technology
RPD radiant power density
Se specific power density
Si silicon
STC standard test conditions
STP standard temperature and pressure
TL thermalization loss
UV ultraviolet
Voc open circuit voltage
Vm voltage of the maximal power point
WSN wireless sensor network
ZNE zero net energy
ZnS zinc selenide

50
1 DEFENSE TECHNICAL (PDF) INFORMATION CTR DTIC OCA 2 DIRECTOR (PDF) US ARMY RESEARCH LAB RDRL CIO LL IMAL HRA MAIL & RECORDS MGMT 1 GOVT PRINTG OFC (PDF) A MALHOTRA 4 DIRECTOR (PDF) US ARMY RESEARCH LAB RDRL SED E JOHNNY A RUSSO WILLIAM RAY MARC S LITZ CHARLIE WU