Embed Size (px)
Citation preview
Quasimem Workshop, Amsterdam , 14-15 October 2009
Low resolution triple quadrupole MS
compared to high resolution Orbitrap MS
for the analysis of PFCs
Laboratoire d’Etude des Résidus et Contaminants dans les Aliments
Ecole Nationale Vétérinaire de Nantes - France - www.laberca.org
for the analysis of PFCs
H.Kadar, B.Veyrand, P.Marchand, B. Le Bizec
Outline
Introduction
1. Analysis of perfluorinated compounds in breast milk
2. Analysis of perfluorinated compounds in fish samples
Quasimem workshop, Amsterdam, 14-15 October 2/18
2. Analysis of perfluorinated compounds in fish samples
Conclusion
Introduction
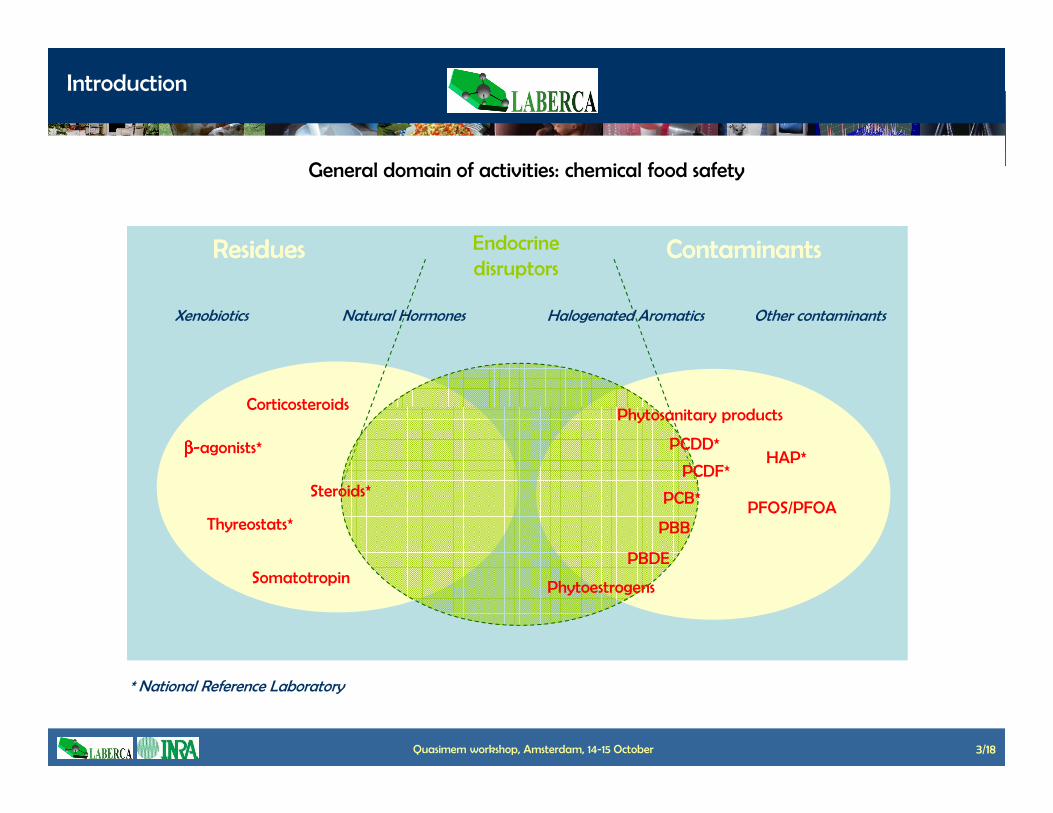
ResiduesResidues ContaminantsContaminants
Xenobiotics Natural Hormones Halogenated Aromatics Other contaminants
CorticosteroidsPhytosanitary products
Endocrine
disruptors
General domain of activities: chemical food safety
Quasimem workshop, Amsterdam, 14-15 October 3/18
Thyreostats*
Somatotropin
ββββ-agonists*
Corticosteroids
Steroids*
Phytosanitary products
PCDD*
PCDF*
PCB*
PBB
HAP*
PFOS/PFOA
PBDE
Phytoestrogens
* National Reference Laboratory
1
9
3
2 5 6
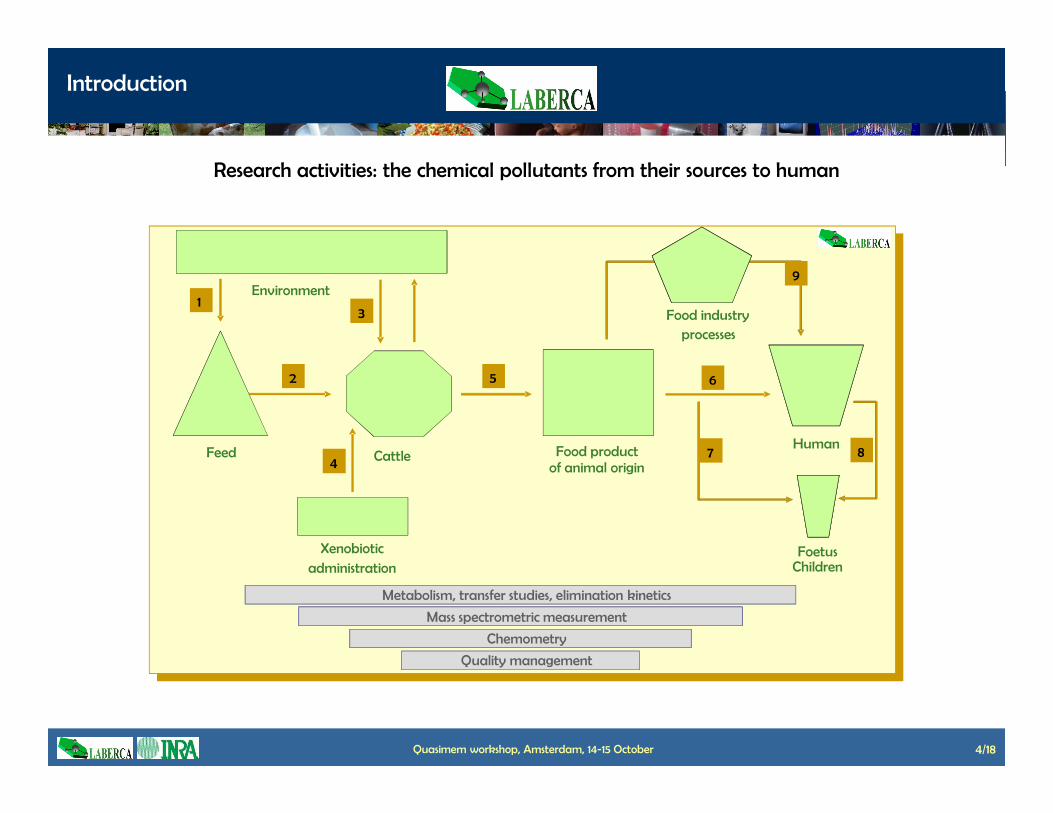
Food industry
Environment
processes
Research activities: the chemical pollutants from their sources to human
Introduction
Quasimem workshop, Amsterdam, 14-15 October 4/18
7 84
Human
Children
Xenobiotic
administration
Feed Cattle Food product
Foetus
Metabolism, transfer studies, elimination kinetics
of animal origin
Mass spectrometric measurement
Chemometry
Quality management
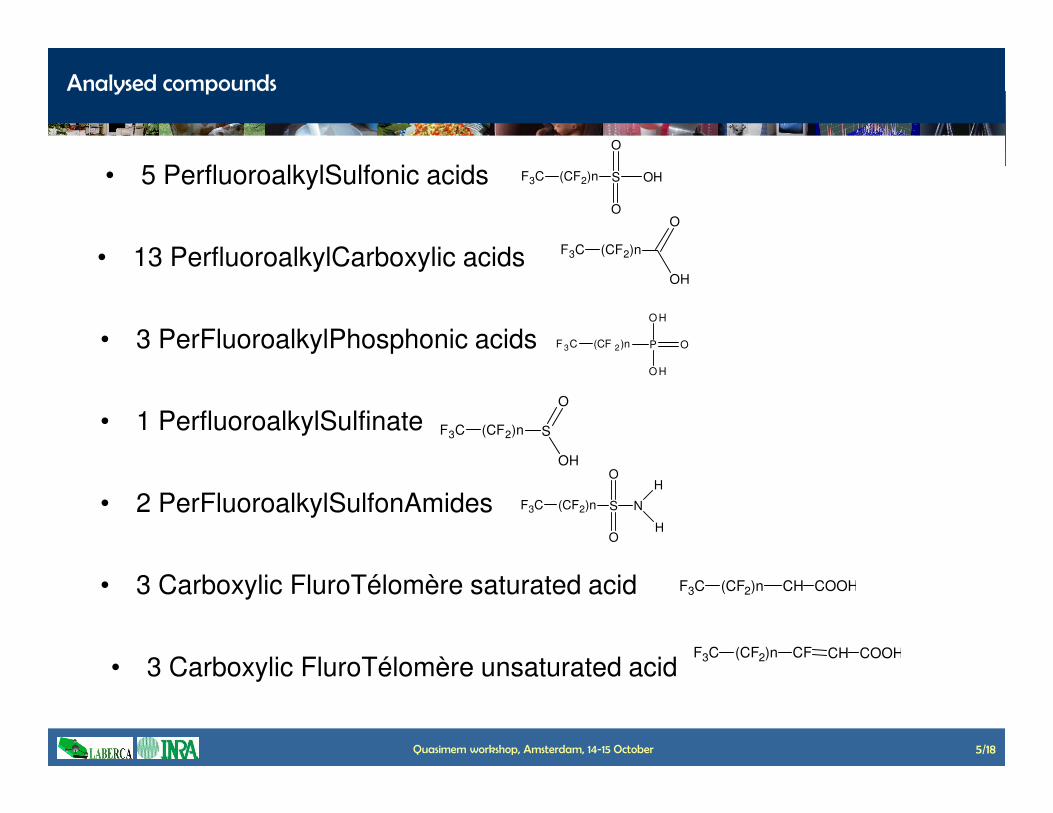
• 5 PerfluoroalkylSulfonic acids
Analysed compounds
• 13 PerfluoroalkylCarboxylic acids
• 3 PerFluoroalkylPhosphonic acids
• 1 PerfluoroalkylSulfinate
F3C (CF2)n S
O
O
OH
F 3C (CF 2)n P O
O H
O HCH4
F3C (CF2)n
O
OH
O
Quasimem workshop, Amsterdam, 14-15 October 5/18
• 1 PerfluoroalkylSulfinate
• 2 PerFluoroalkylSulfonAmides
• 3 Carboxylic FluroTélomère saturated acid
• 3 Carboxylic FluroTélomère unsaturated acid
F3C (CF2)n S
O
O
N
H
H
F3C (CF2)n S
O
OH
F3C (CF2)n CH COOH
F3C (CF2)n CF CH COOH
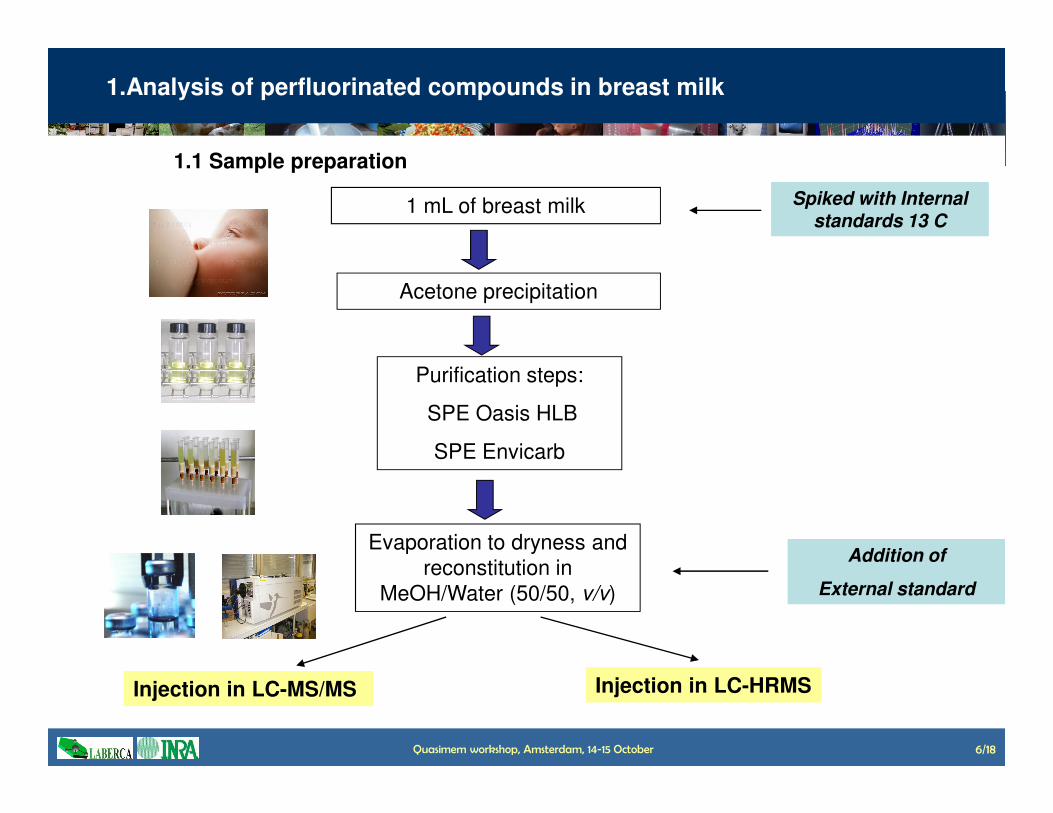
1.Analysis of perfluorinated compounds in breast milk
Acetone precipitation
Purification steps:
SPE Oasis HLB
1 mL of breast milk Spiked with Internal standards 13 C
1.1 Sample preparation
Quasimem workshop, Amsterdam, 14-15 October 6/18
SPE Oasis HLB
SPE Envicarb
Evaporation to dryness and
reconstitution in
MeOH/Water (50/50, v/v)
Addition of
External standard
Injection in LC-MS/MS Injection in LC-HRMS
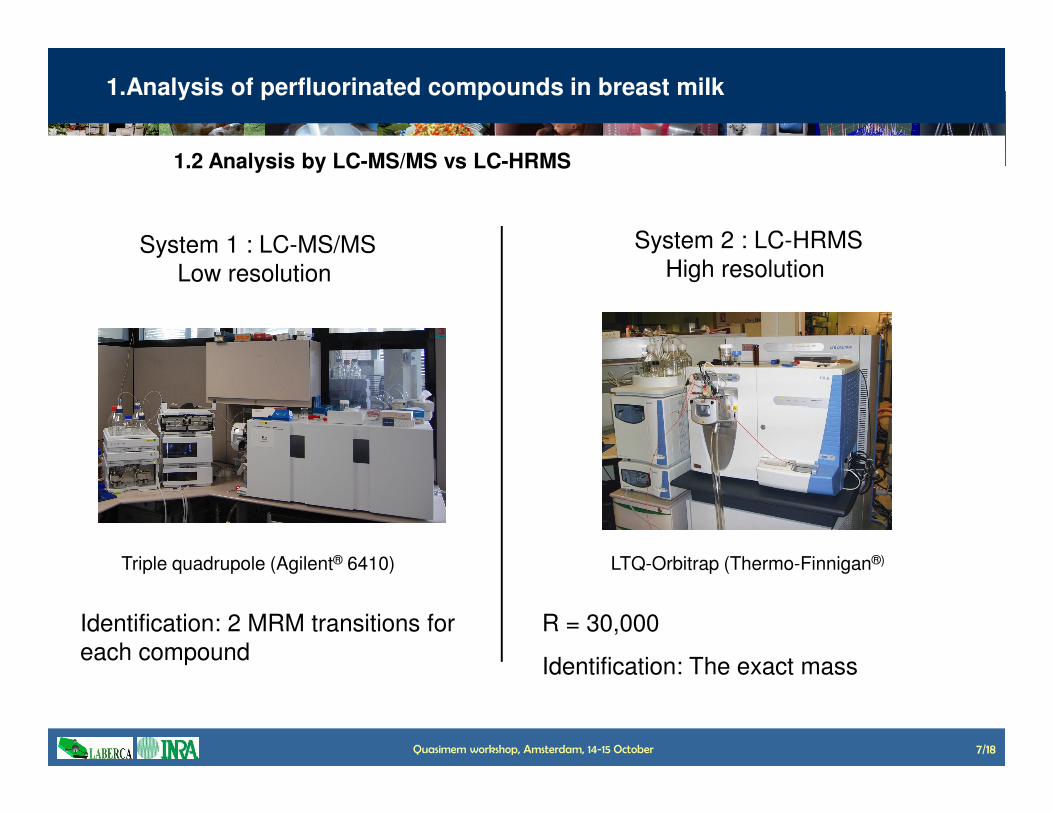
1.Analysis of perfluorinated compounds in breast milk
1.2 Analysis by LC-MS/MS vs LC-HRMS
System 1 : LC-MS/MSLow resolution
System 2 : LC-HRMSHigh resolution
Quasimem workshop, Amsterdam, 14-15 October 7/18
Identification: 2 MRM transitions for each compound
R = 30,000
Identification: The exact mass
LTQ-Orbitrap (Thermo-Finnigan®)Triple quadrupole (Agilent® 6410)
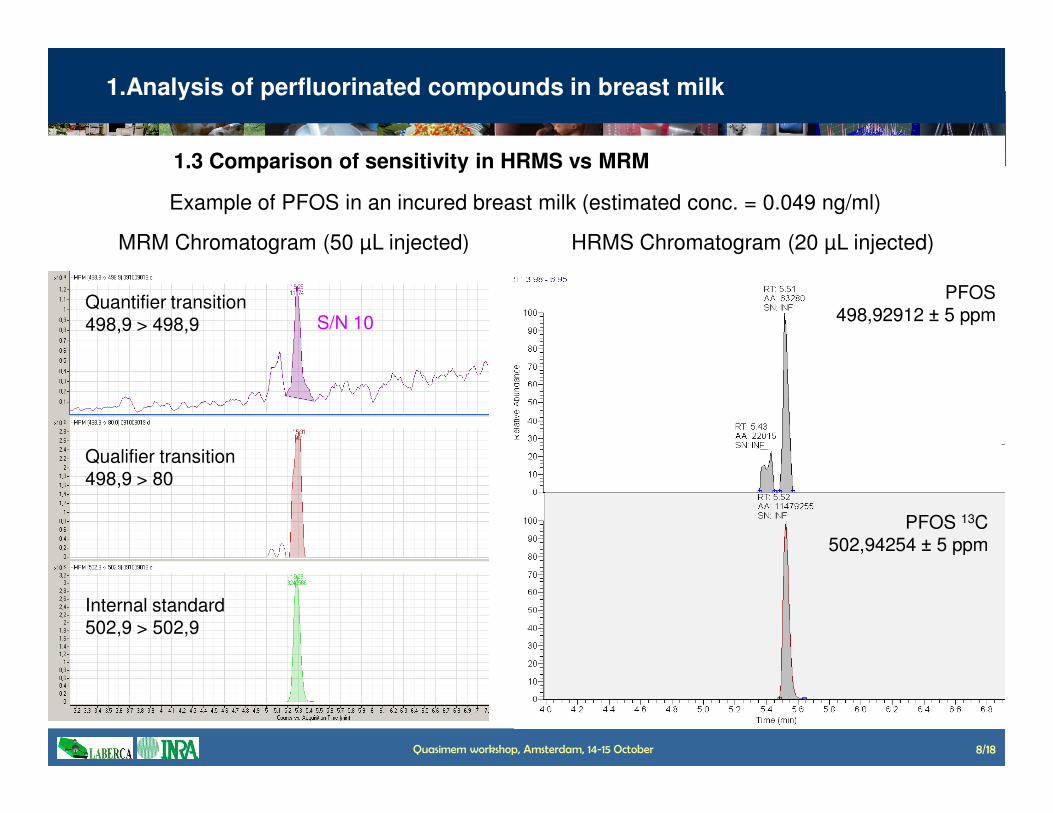
1.Analysis of perfluorinated compounds in breast milk
1.3 Comparison of sensitivity in HRMS vs MRM
PFOS498,92912 ± 5 ppm
Quantifier transition498,9 > 498,9
MRM Chromatogram (50 µL injected) HRMS Chromatogram (20 µL injected)
S/N 10
Example of PFOS in an incured breast milk (estimated conc. = 0.049 ng/ml)
Quasimem workshop, Amsterdam, 14-15 October 8/18
PFOS 13C502,94254 ± 5 ppm
Qualifier transition 498,9 > 80
Internal standard502,9 > 502,9
0,050
0,060
0,070
0,080
0,090
PF
OS
co
ncen
trati
on
(n
g/m
L o
r p
pb
)
K-S d=.10946, p> .20; Lilliefors p> .20
Theoretical Normal Distribution
0.00 0.01 0.02 0.03 0.04 0.05 0.06 0.07 0.08 0.090
2
4
6
8
10
12
14
Num
be
r o
f O
bse
rva
tio
ns
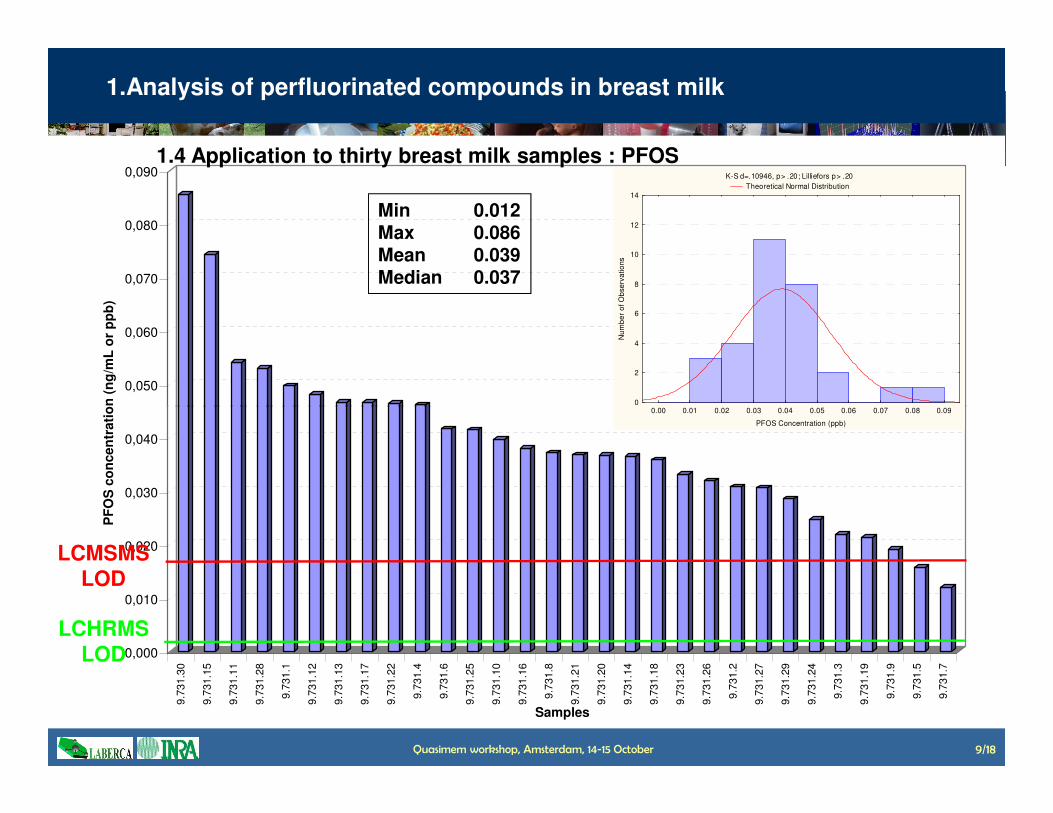
1.4 Application to thirty breast milk samples : PFOS
1.Analysis of perfluorinated compounds in breast milk
Min 0.012Max 0.086Mean 0.039Median 0.037
Quasimem workshop, Amsterdam, 14-15 October 9/18
0,000
0,010
0,020
0,030
0,040
PF
OS
co
ncen
trati
on
(n
g/m
L o
r p
pb
)
9.7
31.3
0
9.7
31.1
5
9.7
31.1
1
9.7
31.2
8
9.7
31.1
9.7
31.1
2
9.7
31.1
3
9.7
31.1
7
9.7
31.2
2
9.7
31.4
9.7
31.6
9.7
31.2
5
9.7
31.1
0
9.7
31.1
6
9.7
31.8
9.7
31.2
1
9.7
31.2
0
9.7
31.1
4
9.7
31.1
8
9.7
31.2
3
9.7
31.2
6
9.7
31.2
9.7
31.2
7
9.7
31.2
9
9.7
31.2
4
9.7
31.3
9.7
31.1
9
9.7
31.9
9.7
31.5
9.7
31.7
Samples
0.00 0.01 0.02 0.03 0.04 0.05 0.06 0.07 0.08 0.09
PFOS Concentration (ppb)
LCHRMS
LOD
LCMSMS
LOD
0,030
0,040
0,050
0,060
PF
OA
co
ncen
trati
on
(n
g/m
L o
r p
pb
)
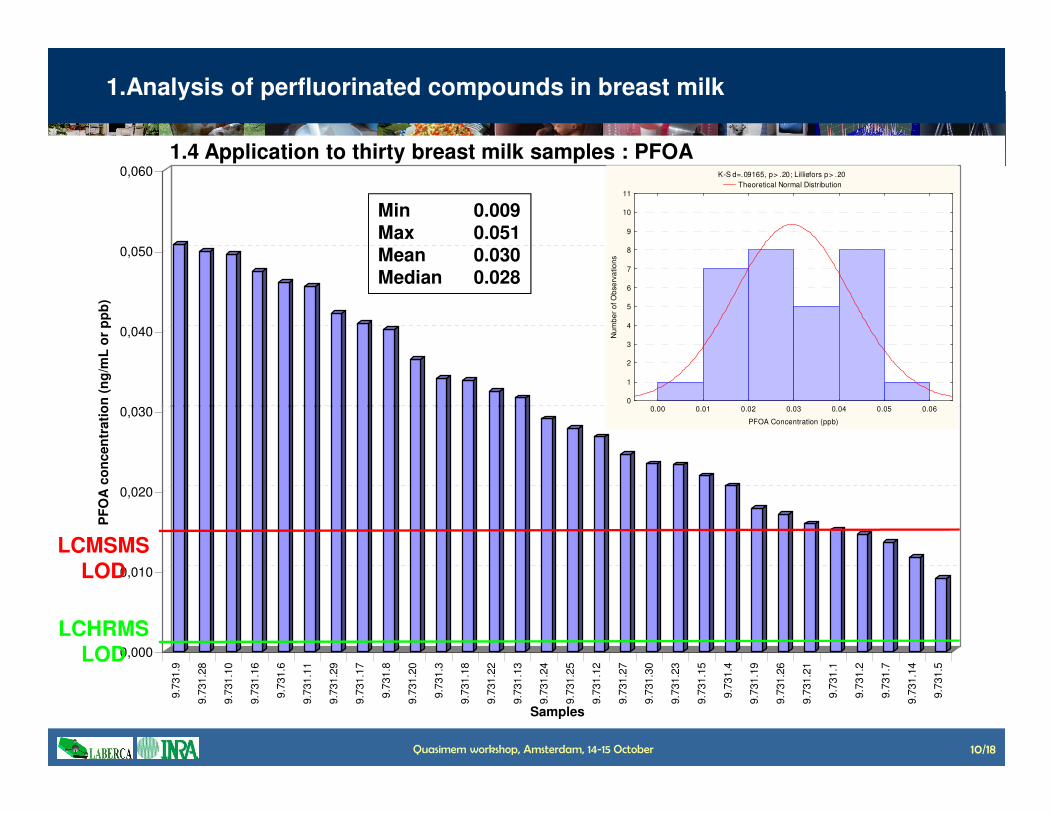
1.4 Application to thirty breast milk samples : PFOA
1.Analysis of perfluorinated compounds in breast milk
K-S d=.09165, p> .20; Lilliefors p> .20
Theoretical Normal Distribution
0.00 0.01 0.02 0.03 0.04 0.05 0.060
1
2
3
4
5
6
7
8
9
10
11
Num
be
r o
f O
bse
rva
tio
ns
Min 0.009Max 0.051Mean 0.030Median 0.028
Quasimem workshop, Amsterdam, 14-15 October 10/18
0,000
0,010
0,020
0,030
PF
OA
co
ncen
trati
on
(n
g/m
L o
r p
pb
)
9.7
31.9
9.7
31.2
8
9.7
31.1
0
9.7
31.1
6
9.7
31.6
9.7
31.1
1
9.7
31.2
9
9.7
31.1
7
9.7
31.8
9.7
31.2
0
9.7
31.3
9.7
31.1
8
9.7
31.2
2
9.7
31.1
3
9.7
31.2
4
9.7
31.2
5
9.7
31.1
2
9.7
31.2
7
9.7
31.3
0
9.7
31.2
3
9.7
31.1
5
9.7
31.4
9.7
31.1
9
9.7
31.2
6
9.7
31.2
1
9.7
31.1
9.7
31.2
9.7
31.7
9.7
31.1
4
9.7
31.5
Samples
0.00 0.01 0.02 0.03 0.04 0.05 0.06
PFOA Concentration (ppb)
LCMSMS
LOD
LCHRMS
LOD
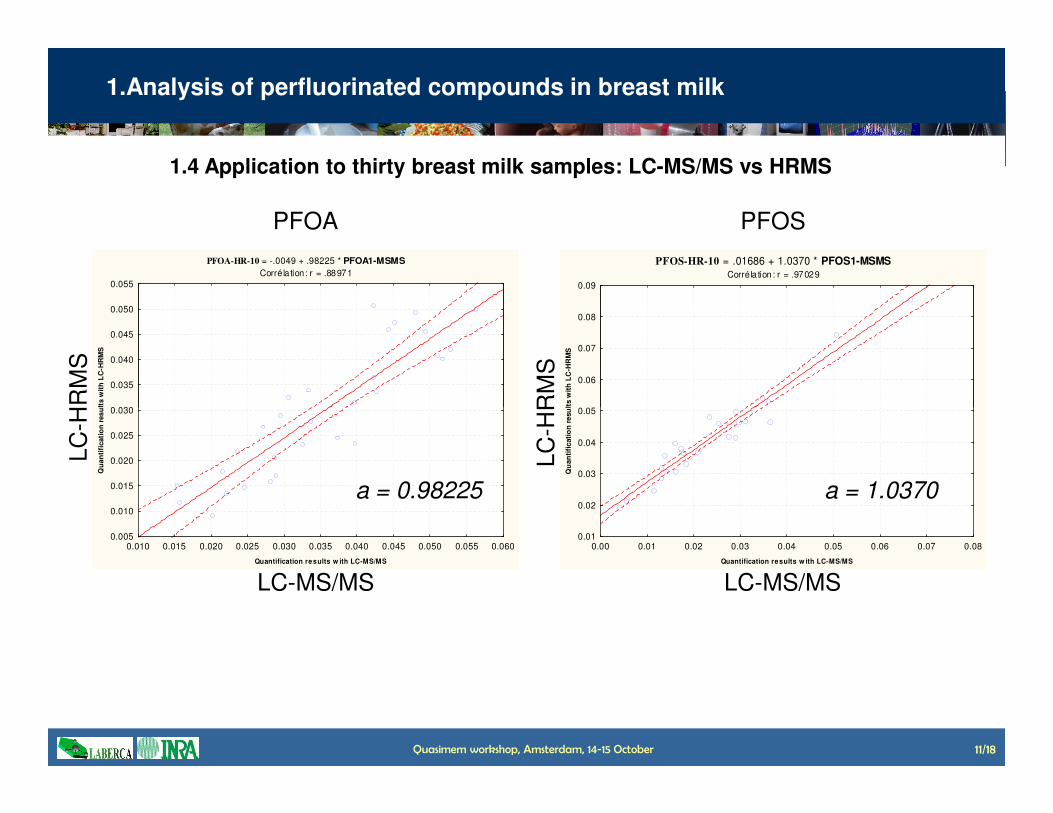
PFOA-HR-10 = -.0049 + .98225 * PFOA1-MSMS
Corréla tion : r = .88971
0.030
0.035
0.040
0.045
0.050
0.055
Qu
an
tifi
cati
on
res
ult
s w
ith
LC
-HR
MS
PFOS-HR-10 = .01686 + 1.0370 * PFOS1-MSMSCorréla tion : r = .97029
0.05
0.06
0.07
0.08
0.09
Qu
an
tifi
cati
on
re
su
lts w
ith
LC
-HR
MS
PFOA PFOS
HR
MS
HR
MS
1.4 Application to thirty breast milk samples: LC-MS/MS vs HRMS
1.Analysis of perfluorinated compounds in breast milk
Quasimem workshop, Amsterdam, 14-15 October 11/18
0.010 0.015 0.020 0.025 0.030 0.035 0.040 0.045 0.050 0.055 0.060
Quantification results w ith LC-MS/MS
0.005
0.010
0.015
0.020
0.025
0.030
Qu
an
tifi
cati
on
res
ult
s w
ith
LC
-HR
MS
0.00 0.01 0.02 0.03 0.04 0.05 0.06 0.07 0.08
Quantification results w ith LC-MS/MS
0.01
0.02
0.03
0.04
0.05
Qu
an
tifi
cati
on
re
su
lts w
ith
LC
-HR
MS
a = 0.98225 a = 1.0370
LC-MS/MS
LC
-HR
MS
LC
-HR
MS
LC-MS/MS
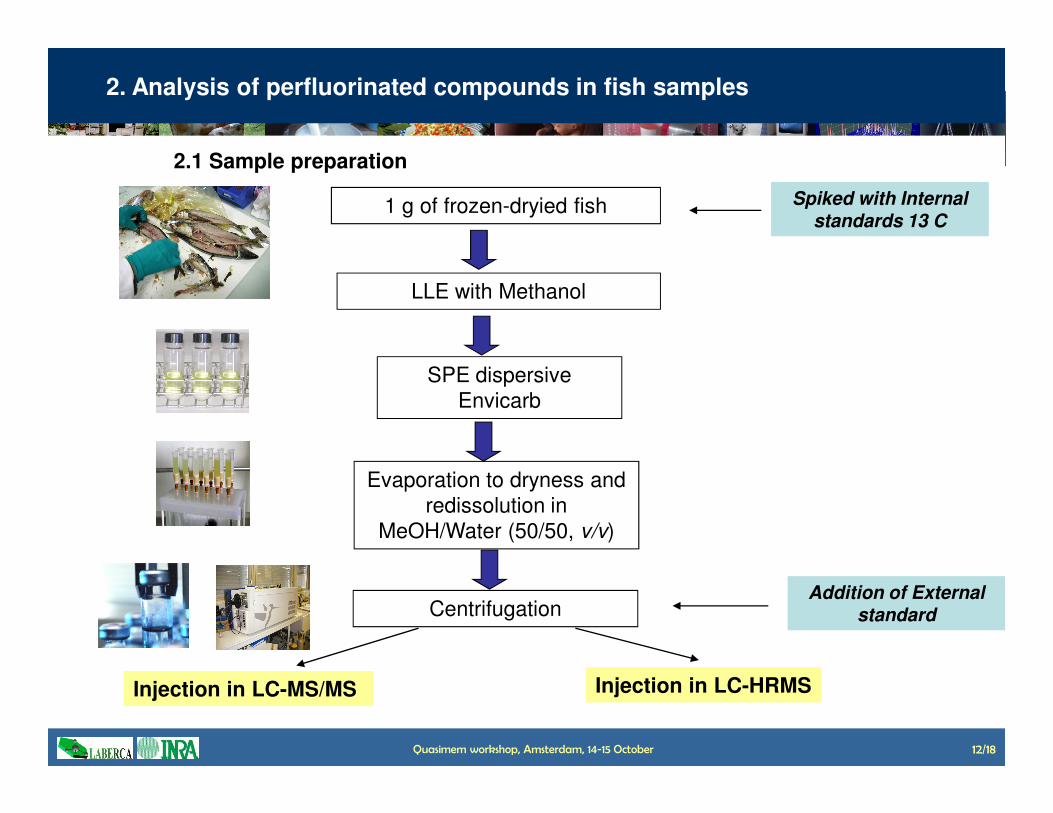
2. Analysis of perfluorinated compounds in fish samples
LLE with Methanol
SPE dispersive
Envicarb
1 g of frozen-dryied fish Spiked with Internal standards 13 C
2.1 Sample preparation
Quasimem workshop, Amsterdam, 14-15 October 12/18
Envicarb
Evaporation to dryness and
redissolution in
MeOH/Water (50/50, v/v)
Addition of External standard
Injection in LC-MS/MS Injection in LC-HRMS
Centrifugation
2. Analysis of perfluorinated compounds in fish samples
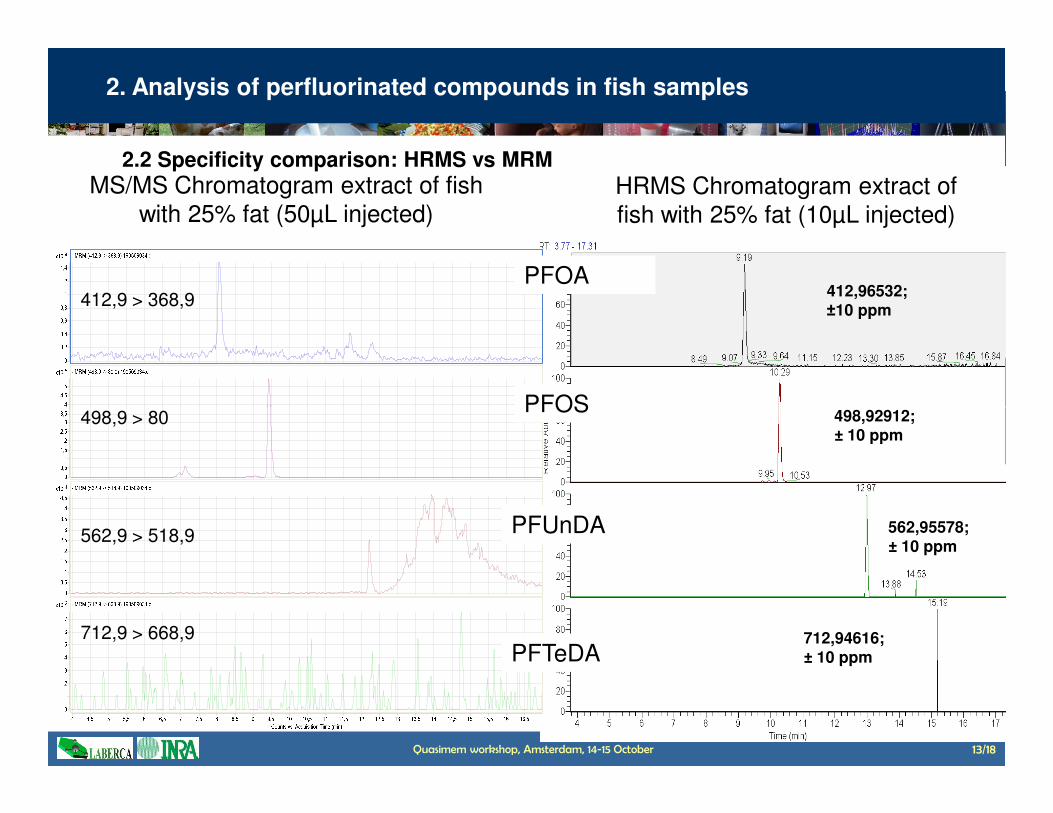
MS/MS Chromatogram extract of fish with 25% fat (50µL injected)
HRMS Chromatogram extract of fish with 25% fat (10µL injected)
PFOA
PFOS
412,9 > 368,9412,96532; ±10 ppm
498,92912;
2.2 Specificity comparison: HRMS vs MRM
Quasimem workshop, Amsterdam, 14-15 October 13/18
PFOS
PFUnDA
PFTeDA
498,9 > 80
562,9 > 518,9
712,9 > 668,9
498,92912; ± 10 ppm
562,95578; ± 10 ppm
712,94616; ± 10 ppm
2. Analysis of perfluorinated compounds in fish samples
2.3 Application to fish samples
- Observation : significant difference between quantitative results obtained inLC-MS/MS and LC-HRMS for PFOS
-Hypothesis : interference on the PFOS diagnostic signal in LC-MS/MS
Quasimem workshop, Amsterdam, 14-15 October 14/18
-Hypothesis : interference on the PFOS diagnostic signal in LC-MS/MS
- Experiment : extraction of the PFOS diagnostic signal with various mass precision
RT: 5.05 - 5.94
30
40
50
60
70
80
90
100
Rela
tive A
bundance
RT: 5.47
AA: 1552672
NL: 5.12E5
m/z=
498.87923-498.97901
F: FTMS - c ESI Full
ms [200.00-920.00]
MS Genesis
210809020
RT: 5.02 - 5.94
30
40
50
60
70
80
90
100
Rela
tive A
bundance
RT: 5.47
AA: 9253651
NL: 3.03E6
m/z=
498.87923-498.97901
F: FTMS - c ESI Full
ms [200.00-920.00]
MS Genesis
210809015
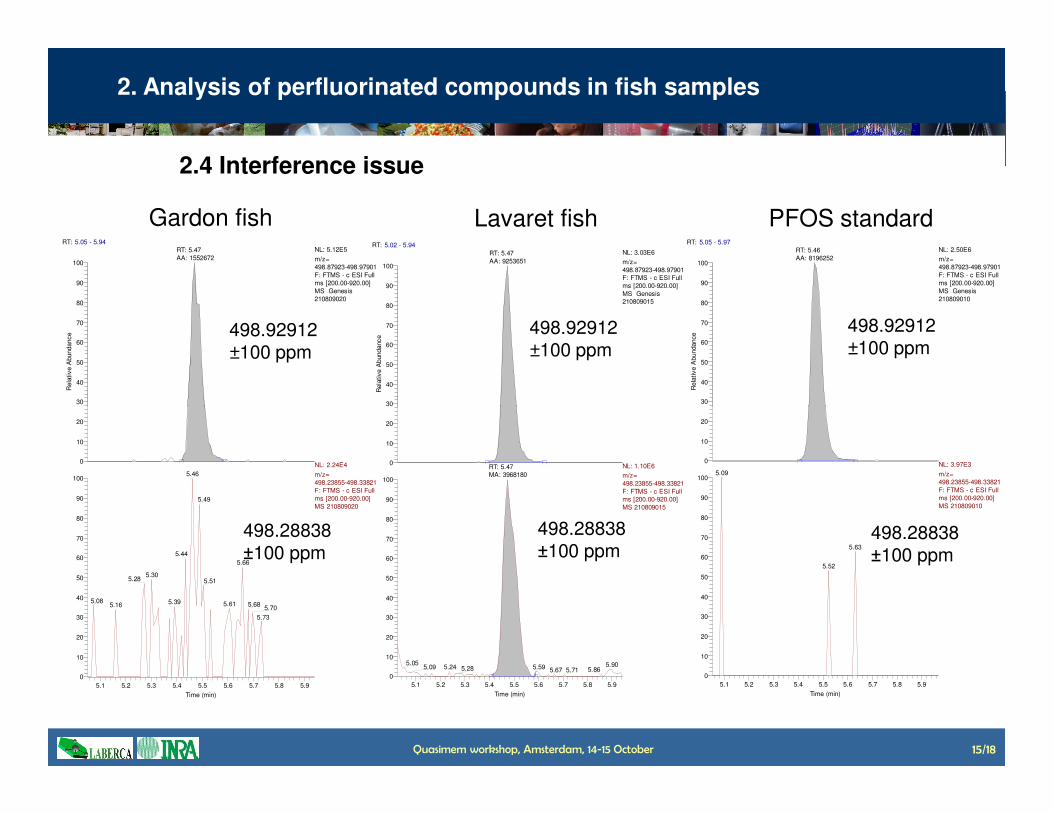
Lavaret fishGardon fish
498.92912 ±100 ppm
RT: 5.05 - 5.97
30
40
50
60
70
80
90
100
Rela
tive A
bundance
RT: 5.46
AA: 8196252
NL: 2.50E6
m/z=
498.87923-498.97901
F: FTMS - c ESI Full
ms [200.00-920.00]
MS Genesis
210809010
PFOS standard
498.92912 ±100 ppm
498.92912 ±100 ppm
2. Analysis of perfluorinated compounds in fish samples
2.4 Interference issue
Quasimem workshop, Amsterdam, 14-15 October 15/18
5.1 5.2 5.3 5.4 5.5 5.6 5.7 5.8 5.9
Time (min)
0
10
20
30
40
50
60
70
80
90
100
0
10
20
5.46
5.49
5.44
5.66
5.305.28 5.51
5.08 5.39 5.61 5.685.16 5.70
5.73
NL: 2.24E4
m/z=
498.23855-498.33821
F: FTMS - c ESI Full
ms [200.00-920.00]
MS 210809020
5.1 5.2 5.3 5.4 5.5 5.6 5.7 5.8 5.9
Time (min)
0
10
20
30
40
50
60
70
80
90
100
0
10
20
30
RT: 5.47
MA: 3968180
5.05 5.905.24 5.595.09 5.28 5.865.67 5.71
NL: 1.10E6
m/z=
498.23855-498.33821
F: FTMS - c ESI Full
ms [200.00-920.00]
MS 210809015
498.28838 ±100 ppm
5.1 5.2 5.3 5.4 5.5 5.6 5.7 5.8 5.9
Time (min)
0
10
20
30
40
50
60
70
80
90
100
0
10
20
5.09
5.63
5.52
NL: 3.97E3
m/z=
498.23855-498.33821
F: FTMS - c ESI Full
ms [200.00-920.00]
MS 210809010
498.28838 ±100 ppm
498.28838 ±100 ppm
2. Analysis of perfluorinated compounds in fish samples
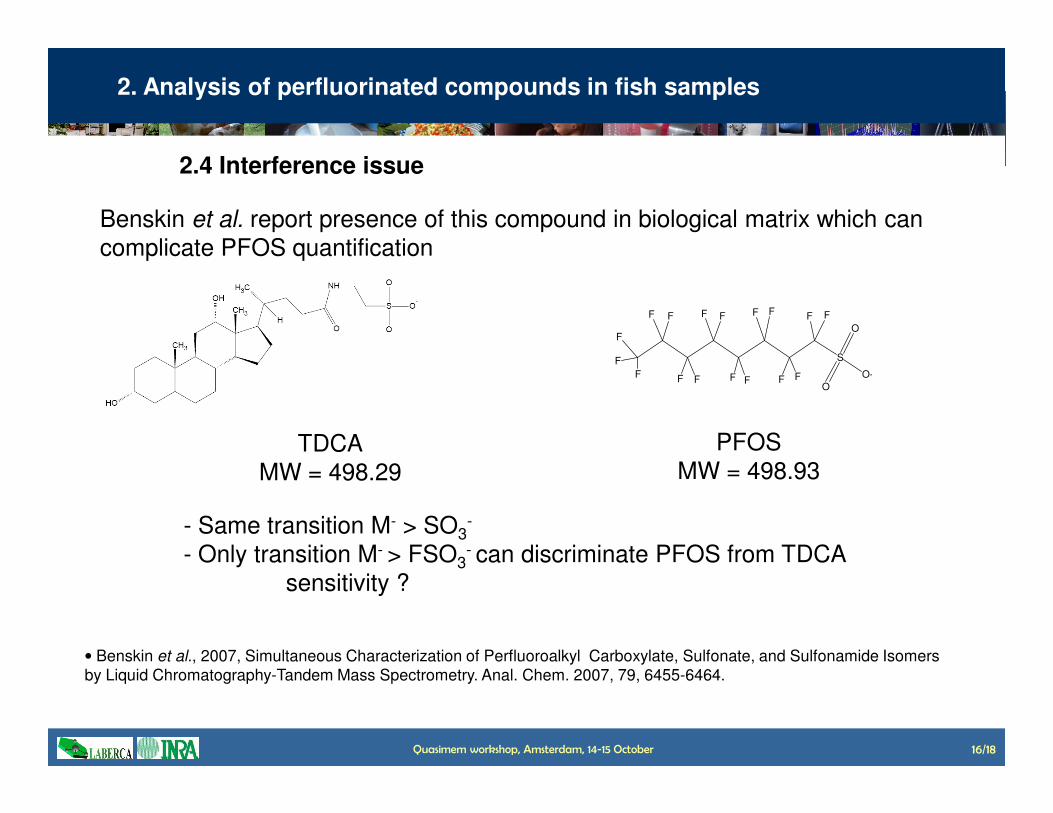
Benskin et al. report presence of this compound in biological matrix which can complicate PFOS quantification
S
O
O
O-FF
F F
F F
F F
F F
F FF F
F
F
F
2.4 Interference issue
Quasimem workshop, Amsterdam, 14-15 October 16/18
• Benskin et al., 2007, Simultaneous Characterization of Perfluoroalkyl Carboxylate, Sulfonate, and Sulfonamide Isomers by Liquid Chromatography-Tandem Mass Spectrometry. Anal. Chem. 2007, 79, 6455-6464.
TDCAMW = 498.29
PFOSMW = 498.93
- Same transition M- > SO3-
- Only transition M- > FSO3- can discriminate PFOS from TDCA
sensitivity ?
Conclusion
Sample preparation procedures dedicated to the monitoring of an extended range of PFC compounds have been developped for milk and fish samples
LC-MS/MS and LC-HRMS evaluated as measurement techniques
HRMS advantages :• Sensitivity increased with high resolution compared to low resolution• Better specificity for complex biological matrice• Provides good discrimination between compounds and interferents
Quasimem workshop, Amsterdam, 14-15 October 17/18
• Provides good discrimination between compounds and interferents• Efficient confirmatory methodHRMS limitations :• High cost compared to low resolution• Difficulty to be applied in routine laboratories
Other applications are running on other matrices (water, bakery products, human serum…)
First exposure and body burden data are generated through various projects
Quasimem Workshop, Amsterdam , 14-15 October 2009
Thank you for your attention
Laboratoire d’Etude des Résidus et Contaminants dans les Aliments
Ecole Nationale Vétérinaire de Nantes - France - www.laberca.org
H.Kadar, B.Veyrand, P Marchand, B Le Bizec