Embed Size (px)
Citation preview

'·"'·10
•
UNIVERSITY OF HAWAII LIBRARY
DESIGN AND COMPARISON OF DIN REMOVAL RATES BETWEEN FIVE 'LOW-TECH' FIXED FILM BIOLOGICAL REACTORS TREATING
AQUACUL TURE WASTEWATER ON COCONUT ISLAND
A THESIS SUBMITTED TO THE GRADUATE DIVISION OF THE UNIVERSITY OF HAW AI'I IN PARTIAL FULFILLMENT
OF THE REQUIREMENTS FOR THE DEGREE OF
•
MASTER OF SCIENCE -
IN
OCEANOGRAPHY
DECEMBER 2005
By
Lauren Carter Roth
Thesis Committee:
Edward Laws, Chairman David Karl
Barry Raleigh
. ...

10 002605469 UNIVE.RSITY OF HAWAII
HAWN Qlll
.H3 no. 4039
We certi fy that we have read thi s thesis and that it is satisfactory in the scope and quality as a thesis for the Master of Science degree in Oceanography_
T HESIS COMM ITTEE
Chairman
•
,
--II

© Copyright 2005
By
Lauren C. Roth
111

ACKNOWLEDGEMENTS
The work written in this thesis is the accumulation of education I have
obtained from both the Department of Oceanography at the University of Hawaii and
that of my work with John Todd of Ocean Arks International. This thesis is dedicated
to my parents, who have provide"d much support and interest in my chosen directions
in life, and to Pacific islanders, of whom I hope will benefit from this work.
I first want to thank my committee, Drs. Edward Laws, David Karl, and Barry
Raleigh who have invested much time and effort in helping shape this scope of work
and for their insights and critique of the thesis itself. I also would like to thank Grieg
Steward, who served on my academic committee who also supported me with advice
and insight. Also, I would like to give much thanks to my funders: SeaGrant Hawaii,
Center for Sustainable Future and the Hawaii Board of Water Supply. This project
would also not have occurred without the support of Hawaii Institute of Marine
Biology (HIMB) and I extend a warm thank you to Jo-Ann Leong, Jane Ball and the
HIMB staff.
I would also like to express my gratitude to David Hashimoto who analyzed
my water samples and to Jane Schoonmaker, who performed the X-ray diffraction
analysis. I particularly want to thank Mikael Schneider, a Global Environmental
Science graduate of the University of Hawaii, who helped build and operate both the
systems on Coconut Island and MSB, aided with sampling, media analysis, and
research contribution for this report.
IV

There are many volunteers I would also like to acknowledge who helped
construct the remediation system at Coconut Island: Rob Norris, Michael Cerrea,
Stephen Kubota, Roseanne and family, Meredith Grinimer, Orion Stambro, Fred
Nakumura and the Sierra Club hiking club, Yves, Jason Silverstein, Jim Lakey and
the HIMB maintenance crew. The commencement of this project was truly a
community effort! Additionally, I would like to thank Kai Fox, who has volunteered
to aid in the continuance of maintaining the system.
Lastly, I would like to thank the entire Ocean, GeoChem, Bio, and HIMB
offices who have helped to keep me on track and have provided the necessary tools
for me to complete my thesis studies. Mahala nui loa!
v

ABSTRACT
Over the past century, the human needs for the Earth's resources have
increased and the consequences of these actions are becoming more apparent as
ecological diversity and functionality are in decline. An approach to better service
our continuance and future generations' livelihoods is being explored by
implementing natural systems teclmologies. Ecological engineering is a mechanism
that can provide simple, 'low-tech' design and infrastructure while encouraging the
growth and development of nature's complexity as the primary operating system.
Ecologically engineered fixed film biological reactors were designed and
implemented to remediate freshwater, aquaculture wastewater on Coconut Island,
Oahu. The biological reactors principally operate by utilizing the inherent,
multifaceted biochemical development ofbiofilm ecologies. The primary objective of
this research was to design 'low-tech' systems that compared naturally occurring
media commonly found on Pacific Islands for their use in fixed film biological
reactor technology to remove dissolved inorganic nitrogen from the wastewater. The
media researched for the comparison study included: coral rubble, lava rock
(pumice), bluestone (hydropressurized basalt), coconut fiber, and a synthetic
geotextile material. The fixed film filters were connected to one freshwater
aquaculture tank containing Mozambique tilapia (Oreochromis mossambicus). Both
the influent (fish tank) and the effluents from the five filters were analyzed for total
suspended solids, ammonium, nitrate/nitrite, and phosphate concentrations. A
replicate system was also designed on a small scale to test for data reproducibility and
VI

was compared to the Coconut Island system. Overall, ammonium and total
suspended solids reduction was marked in all the systems. Therefore in order to
compare the media, the removal rate of ammonium + nitrate/nitrite (DIN) was
calculated for all the systems and statistical analysis was conducted to determine
differences between DIN removal rate efficiencies.
VI!

TABLE OF CONTENTS
ACKNOWLEDGEMENTS....................................................... IV
ABSTRACT..................................................................... ..... VI
LIST OF TABLES ................................................................... x
LIST OF FIGURES................................................................. xi
SECTION 1. Introduction................................................. I
SECTION 2.
SECTION 3.
SECTION 4.
Objectives.. ................................................ 4
Background.. ............................................... 7
1. Nitrification and Total Suspended Solids...... ..... 7
n. Phosphorus.............. .............. ................ 10
III. Fixed film reactors.. .. .. .. .. .... .. .. .. .... ...... .... . 11
IV. Biofilms ............................................... 12
Methods....... ......... ......... ............... ............ 15
1. Experimental Methods.... ................ ........... 15
I. Study Area.......... ............ .............. 16
2. Materials.... ............ ...................... 16
3. Small Scale Replication................ ..... 24
4. Sampling...................................... 26
5. FlowlHydraulic Residence Time.......... 26
6. Media .......................................... 27
Vlll
SECTION 5.
SECTION 6.
SECTION 7.
7. X-Ray Diffraction ........................... 28
8. Void Ratio and Specific Surface Area... 28
II. Laboratory Methods ...... , . .. . .. . .. .. .. .. . .. .. . . .. . .. .. .. .. . .. 32
1. TSS ............................................. 32
2. Nutrient Analysis........................... 32
III. Statistical Analysis......................................... ... 33
Results.......................................................... ..... 36
1. Media Results............................................... ... 36
II. Flow and Hydraulic Residence Time....................... 38
1. Flow....... .... ... ........... ....... ........... 38
2. Hydraulic Residence Time............... ... 39
III. Water Chemistry Results.. .................................. 40
I. Dissolved Oxygen and pH.............. .... 40
2. Nutrient and TSS Results................... 43
3. Statistical Results.. .................. ....... 46
4. Operations................................ .... 56"
Discussion............................................................................. 58
Future of Remediation System.................................. 63
REFERENCES ........................................ -....................................... 64
IX
LIST OF TABLES
Table Page
1 (Egli 2003)............................................................................ 9
2 Properties ofbilfilter media........................................................ 31
3a Hydraulic Residence Time (HRT) of the Coconut Island system....... ..... 39
3b Hydraulic Residence Time (HRT) of the MSB system........................ 39
4a Coconut Island O2 and pH values................................................. 41
4b MSB O2 and pH values............................................................. 42
5a Fixed Film Bioreactor Performances at Coconut Island........................ 44
5b Fixed Film Bioreactor Performances at MSB.................................... 45
6 Comparison ofC! and MSB biofilter systems based on Kruskal-Wallis test. 47
x
LIST OF FIGURES
Figure
1......................................... ....................................... ................. 18
2 .............................................................. :.................................. 21
3 ................................................................................................. 21
4 ................................................................................................. 22
5 ................................................................................................. 23
6 ................................................................................................. 25
7 ................................................................................................. 48
8 ................................................................................................. 49
9 ................................................................................................. 50
10 ................................................................................................ 51
11 ................................................................................................ 52
12 ................................................................................................ 53
13 ................................................................................................ 55
Xl

SECTION 1
Introduction
The Living Planet Report notes that in the past three decades the world's species
diversity has declined by 33% (WWF 2002). During the same time, the human need for
renewable resources (human footprint) has increased by 50%. Of the Earth's ecosystems,
freshwater species are cited as the most vulnerable with the least amount of regenerative
capacity. The Fresh Water Index in the same report describes a 50% decline of 194
freshwater aquatic species between 1970 and 1999 (WWF 2002). The United Nations
(UN) reports that 1.1 billion people around the world still lack access to safe drinking
water; 2.4 billion people live in areas with chronic water shortages; and contaminated
water and poor sanitation cause an estimated 80% of all diseases in the developing world
(UN, 2002). These global statistics are alarming. After attending the UN International
Meeting for Small Island Developing States (SIDS) in Mauritius, January 2005, I realized
that suitable technologies for correcting these problems are only in their infancy.
Hawken et al. (1999) point out that industrialized nations dominate technological
advancement yet deplete nonrenewable supplies and seek more. A more enlightened
approach would involve the use of sustainable technologies appropriately scaled to
address societal needs in a particular socio-politicallenvironmental milieu (Hawken et. al.
1999). Furthermore, advanced technologies that work well in first -world nations may be
associated with problems that become major obstacles to their widespread application in
second- and third-world countries (Weisman 1998). Examples include reliance on
I

sophisticated fanning equipment in countries that lack equipment maintenance
infrastructure and the use of agricultural pesticides in countries where there is no
satisfactory mechanism to train fanners about safety issues associated with their use.
Such use of inappropriate technologies can cascade into a 'tech' dependency so that
"when the developed word sneezes the rest of the (developing) world catches its cold"
(UN 2005). Weisman (1998) argues that addressing the growing needs of the global
human society will require an appropriate balance between nature and technology, e.g.,
the use of integrated pest management in agriculture. Sustainable development requires
that the relationship between dynamic human economic systems and the dynamics of
ecologic systems be such that human life can continue indefinitely without destroying the
diversity, complexity, and function of the environment (World Commission on
Environment and Development, 1987).
In order to implement sustainable practices, tools need to be provided to m.ake the
transition to alternative, ecologically sound practices for energy, agriculture, building
design, resource use, and water management. Ecological design/engineering is one
approach that provides a bridge towards more sustainable practices. Ecological design
I
incorporates lessons learned from natural selection processes that have been controlling
evolution for billions of years (Todd and Todd, 1994). Ecological design is intended to
support the long-term welfare of both humans and the environment by weaving together
nature and culture. Ecologically designed technologies provide and promote diversity in
their development through the incorporation oflocal materials, both living and nonliving.
The research described here was intended to approach aquatic food production and
wastewater remediation holistically by connecting these "industrial" ecological systems.
2

The research plan was to design, implement, and analyze a pilot bioremediation system to
treat aquaculture wastewater generated by fish culture facilities at the Hawaii Institute of
Marine Biology (Coconut Island, Oahu, Hawaiian Islands). The intention was to
scrutinize the potential application of such systems on other Pacific islands that share
common natural resources with the Hawaiian Islands.
3
SECTION 2
Objectives
In numerous parts ofthe world, freshwater aquaculture suffers from the constraint
oflimited freshwater supply. Recirculating aquaculture systems have therefore become
more common, since they not only conserve water but also reduce the land requirement
to farm fish (Bovendeur et al. 1987). There are a variety of recirculation filters available.
However, because of differences in local farming and operating conditions, lack of
expertise, and costs, imported aquaculture wastewater treatment systems sometimes fail
to provide adequate treatment and/or to be cost-effective and environmentally viable (Al
Hafedh et al. 2003). A major concern in recirculation systems is accumulation of
ammonia. EPA water quality criteria with respect to ammonia/ammonium are based
entirely on the toxicity of ammonia, since the amm<\nium ion is essentially benign. Since
the equilibrium between ammonia and ammonium shifts toward ammonia as the pH is
raised, the criterion for total ammonia (i.e., ammonium plus ammonia) becomes stricter
as pH increases. There is also a positive correlation between temperature and toxicity.
For the protection of sensitive fish species, the four-day average total annnonia
concentration should not exceed 4.7 IlM at a pH of 9 and temperature of 30°C (EPA
1986). At a pH of7 and temperature of 25°C the corresponding criterion is 61 J.!M.
Ammonia/ammonium results from the release of nitrogenous waste products by
cultured animals. To achieve satisfactory control over ammonia concentrations in a cost
effective manner, aquaculture recirculation systems in third-world countries need to be
4

tuned to local environmental conditions while being simple to operate. The experimental
aquaculture wastewater treatment systems at Coconut Island consisted of trickling filters,
which experience with conventional wastewater treatment systems has shown to be
relatively simple and inexpensive to operate (Laws, 2000). The filters contained readily
available media as substrates for microbial growth. The trickling filters were expected to
provide habitats for (a) ammonia oxidizing bacteria that would convert ammonia to
nitrate and (b) denitrifying bacteria that would convert the nitrate to N2. The objectives of
this study were fivefold:
I. Design "low-tech" fixed-film biological reactors that contain either a
commercially available synthetic medium or one or another of several
media that are commonly found on Hawaiian and other Pacific Islands and
that, to the best of my knowledge, had not previously been studied for
their utility in fixed-film biological reactors.
II. Engineer the bioreactors· as flow-through treatment systems that receive
equal fluxes of the aquaculture wastewater.
III. Compare ammonium and nitrate/nitrite (dissolved inorganic nitrogen
(DIN), and phosphate removal efficiencies of the trickling filters as
influenced by substrate type.
IV. Determine factors that may influence nitrogen removal.
v. Compare the reproducibility ofbioreactor performance with small-scale
replicas.
5
The following sections of this thesis will address these objectives in the following
manner. I begin in Section 3 with some background information regarding the basic
biochemical transformations involved in the conversion of ammonia to nitrogen gas
(nitrification and denitrification), history ofbiofilm reactors, and biofilm development.
Section 4 discusses the experimental methods including the location ofthe study,
materials that were used, design of the small-scale replica, sampling methods, discussion
of the media that were chosen, laboratory methods, and statistical methods used for this
study. Section 5 discusses the results of the study, which includes analysis of the media,
flow and hydraulic residence time, water chemistry, and statistical results. Section 6 is
the discussion. Lastly in Section 7, there is a discussion on the future of the remediation
project.
6
SECTION 3
Background
I. Nitrification and Total Suspended Solids
One of the primary purposes of wastewater bioreactor systems is to remove
inorganic nitrogen; in particular ammonium (Malone and Beecher 2000, Metcalf and
Eddy 1991). Hence, comparing the removal ofammonium"and inorganic nitrogen in the
biofilm reactors as a function of substrate type was the primary focus of this study.
Nitrification is a process carried out by groups of nitrifying bacteria, namely
Nitrosomonas and Nitrobacter, that oxidize ammonia (or equivalently ammonium) to
nitrite, and nitrite to nitrate (Schlesinger, 1997). Nitrification is commonly achieved in
biofilm reactors (Lekang et ai, 2000, Tseng et ai, 2004, Zhu et ai, 1999). Interestingly,
Giesake et al. 200 I found that different species of Nitrosomonas tended to colonize the
biofilm at different depths in the reactor. This observation suggests some fonn of niche
differentiation between Nitrosomonas species; alt!'lOugh the oxidation of ammonia to
nitrate is a common biogeochemical trait. The two steps in the nitrification process are
typically carried out as follows:
Ammonium oxidation to nitrite by Nitrosomonas:
2NH/ + 302 -> 2 N02' + 4H+ + 2H20
Conversion of nitrite to nitrate by Nitrobacter:
2N02' + O2 ----'> 2 N03'
7
(I)
(2)

The energy released from the reactions shown in is coupled with the fixation of
carbon by these chemoautotrophic bacteria (Schlesinger, 1997). Consequently, the two
reactions essentially supply the energy needed by bacteria for growth. At this point, the
nitrogen has just changed in form, and has not been removed. Aerobic oxidation of
organic matter is associated with a slightly more negative standard free energy change
than denitrification, and empirically one finds that the relative importance of aerobic
respiration and denitrification is sensitive to dissolved oxygen concentrations. The
denitrification process reduces the nitrate (from the nitrification process) into nitrogen
gas. A large group of denitrifying bacteria allows this process to occur. Denitrification
typically occurs under anoxic or anaerobic conditions by a variety of bacteria that use
nitrate as an electron acceptor in the oxidation of organic matter. The denitrification
reaction can be expressed as follows:
(3)
However, both Pastorelli et al. (1999) and Wik (1999) demonstrated that within
biofihn reactors nitrification and denitrification can occur simultaneously during aerobic
phases since biofilms innately can harbor both aerobic and anoxic conditions within the
fihn. Furthermore, Egli (2003) showed that Annamox can nitrify and denitrify in one
step. (Table 1, Eq. 6).
8

Table 1. (Egli 2003)
RI::tctiol1 I!JH.'rg~' BIOmass "icld (kJ/mnl{' . )hi gdllo
hl·1 1\'1l3 + 150: --> ~O~· + 1120 + Ir -::~7:'i 1.3-2.6
1'".2 NI b + (>;, + ~ ~r + ~ c- --> "II~()JI + 11:0 -I -lfI.6
1-:".:; NIl1UIl + IbU --> 1\'O~' + 4c' ~ 5H' 22.5
E".4 NO.::- + 0.5 02 ~ NO,.- -7~ 11')- I.g
Eq' .' 4 "03+ 51CH~01 +'I~t..,. ~N, + 5('0: + ilhO -IIS0'·' 27U'
1:".6 NH, +~O:!~~N.!+2H.!O -J57 1.5
~ -a) Gtbbs In:c (.'ncrgy change (pll f. 2) ~L): b) PCI' mol of oxidized ammonium or nitrite: (Chapter 1. Egli ;.'1 aL 200 I: EglL 20f)O: Jettell <,I aI., ~()O2). c) \Vith :.lel"tatc as c:lC\:trPll donor d) For growth of "arliCOCC1H d(~nifr!fical1.\" with glllttlm:1tl.:' as cmholl sllhslralc.
Factors that influence nitrification and denitrification rates include dissolved
oxygen concentrations and pH. According to the EPA, the DO concentration required for
the growth of nitrifying bacteria must be less than 2.0 mglL (EPA.2000). The best pH
range for performance of nitrifying bacteria is between 7.0 and 9.0. For Nitrosomonas,
the optimum pH varies from 7.9 to 8.2, whereas for Nitrobacter the optimum range is
from 7.2 to 7.6 (Alleman, 1984). Villaverde et al. (1997) found that within the range of
5.0-9.0, a pH increase of one unit produces a 13% increase of the nitrification rate in
submerged biofilters, which is correlated with increasing alkalinity. Relevant to this point
is the fact that nitrification is an acid-producing process and consumes alkalinity
(Schlesinger, 1997). Below a pH of 6.8, nitrifying bacteria can become inhibited and will
not oxidize ammonia (Michael et aI., 1995).
9

Wastewater generally contains large quantities of particulate matter (suspended
solids), which usually becomes trapped within the substrate. Total suspended solids are
typically correlated to biological oxygen demand (BOD) (Malone and Beecher 2000).
Before microbial digestion can take place, particulate materials typically need to be
hydrolyzed (Levine et al. 1985). Studies have shown that bacteria can utilize particulate
matter as a carbon source by releasing extra-cellular enzymes that presumably initiate the
hydrolysis process (Larsen and Harremoes 1994). The breakdown ofthe suspended
solids via hydrolysis provides a carbon source, which has been shown to increase
denitrification rates (Janning et aI1996).
II. Phosphorus
The removal of phosphorus as phosphate was not the focus of this study because
phosphate is not directly toxic to biological organisms. Phosphorus is nevertheless an
essential nutrient and is coupled with transformations of inorganic nitrogen via biomass
production and respiration. Biological phosphorus removal is associated with nitrification
since nitrification is the energy source for chemosynthetic bacteria. Since denitrification
is associated with the oxidation of organic matter, it is logically linked with the
transformation of organic phosphorus to phosphate. Under anaerobic conditions
phosphorus is released, while during aerobic stages phosphorus has been found to
accumulate in the biomass of active phosphorus accumulating organisms (PAOs) as
polyphosphates as long as there is an external carbon source available (Pastorelli et al.
1999). The incorporation of nitrogen and phosphorus into organic matter typically occurs
10

in a ratio that is more-or-Iess constant among organisms within rather broad taxonomic
categories. For marine microalgae, for example, the N:P ratio is roughly 16 by atoms
(Redfield et. a!., 1963). For macroalgae, the corresponding ratio is 30 (Atkinson and
Smith 1983). Marine bacteria have a N:P ratio of about 7 by atoms (Gundersen et al.
2002). Deviations by more than a factor of two from these ratios are uncommon.
III. Fixed film reactors
Over the years, technologies have been developed to address concerns related to
excess loading of anthropogenic nutrients into biological systems. In the next segment I
will provide some background on some of the "low tech" biological technologies that
have been utilized to remove nutrients from human waste streams.
The first common biofilm reactors consisted of trickling filters. These fixed
biomass or biofilm reactors have been used to remediate anthropogenic wastes for over
one hundred years (Karamanev and Nikolov 1991, Mendez et aI, 1992). During the early
1970's, fixed-film media filters for treatment of aquaculture wastewater began to emerge
(Wagener et a!. 2002). Other biofilters that have evolved for waste treatment include
submerged fixed-film filters, rotating biological contactors, fluidized bed reactors, and
recycled beds (Boller et ai, 1994). Due to the robust nature ofbiofilms, bioreactors have
been applied to remediate numerous high-strength wastewaters including municipal
sewage (Pastorelli et aI1999), pulp and paper industry wastes (Rusten et a!. 1994a),
grease (lipid) wastewater (Liu et a!. 1999), and industrial chemical plant waste (Rusten et
al 1999). Biofilm reactors have been compared to freecsuspended cells in a ferrnenter for
11

waste treatment. However, the processes occurring in biofilm reactors have been shown
'to be significantly more stable than in fermentation systems containing free-suspended
cells (Karamanev and Nikolov 1991). In biofilm reactors the medium becomes coated
with thin films of bacteria (biofilms) that extract nutrients from the water passing through
the bed.
IV. Biofilms
An important characteristic ofbiofilm wastewater treatment systems is the
diversity ofbac!eria and other microorganisms that constitute the biofilm community.
Biofilms were first discovered in the 17th century when Anton von Leewnhoek (the
inventor ofthe microscope) saw microbial aggregates from scrapings of plaque from his
teeth (Schachter 2003). Through time microbiologists have assumed that most microbes
lived as free-floating cells and have staged most microbial experiments under this
assumption. More recently, researchers have found that bacteria and other microbial life
live in communities as biofilms (Schachter 2003). Zobell (1943) observed layers of
microbial cells adhering to bottle walls, and the addition of surfaces within the bottle
increased biological activity of the suspended culture. Since these initial findings,
biofilm microbial communities has become of great interest to many facets of science;
from medical studies to engineering to ecology and evolution. Biofilms are classically
defined as a collection of microorganisms, predominantly bacteria, enmeshed within a
three-dimensional gelatinous matrix of extra-cellular polymers secreted by the
microorganisms. Within each three-dimensional biofilm, a complex microniche is
12

<
defined by the behavior of a diversity of microbial components. These mushroom
shaped microcolonies presuppose a measure of growth controlled by complex cell-to-cell
communication and often display coordinated activities that mimic those of multicellular
life forms (Costerton 1995).
Biofilms develop on virtually all surfaces submerged in water and have important
implications for wastewater engineering. There are several orderly processes that occur
as the biofilm reaches "maturity": conditioning the surface, bacterial adhesion, contact,
adsorption, growth, exo-polysacharride production, attachment, re-entrainment
(sloughing), and grazing (Costerton 1995). Heterotrophic and nitrifying bacteria co-exist
in the filters (Malone and Beecher 2000). The heterotrophs that form the biofilm are
necessary for nitrifying bacteria to attach since it is the heterotrophs that oxidize the
inorganic carbon. Without the heterotrophs' biomass, it is difficult for nitrifying bacteria
to adhere and multiply. However, at a high BOD concentration, the heterotrophs tend to
multiply at a higher rate than the nitrifying bacteria (Metcalf and Eddy 1991).
The choice of a bioreactor medium for robust biofilm development depends on
factors such as the surface area, durability, mechanical strength and cost. Some basic
requirements for an ideal medium are the same for aquaculture, industrial and domestic
'wastewater treatment (Chipperfiled, 1967). One important property is void space.
Adequate void space is needed to supply oxygen and permit free passage of the
wastewater. Additionally, the substrate should promote the uniform spread ofliquid to all
parts ofthe filter.
Typically, industrial-scale systems to treat aquaculture wastewater use plastic
substrates as media for biofilm development. Since 1961, the evolution of plastic media
13
has become widespread, and researchers continue to test various plastic substrates to find
the ideal shape for remediation of wastewater (Escritt, 1984). Sophisticated shape and
design can result in a high specific surface area (surface area per unit volume) and large
void spaces to support the growth of bacterial biomass. Another advantage of plastic is its
low density, which is desirable when constructing the filter. The basic materials for
plastic media are polypropylene, polyethylene, polyvinylchloride, polystyrene, and
polyvinylidene (Kruner et ai, 1983). However, these plastic media are often not the most
enviromnentally friendly or cost effective choices, especially for remote communities.
For Pacific island communities, plastic media are not readily available and would need to
be shipped over large distances. Additionally, once they no longer serve their purpose,
plastic media can create a burden on local landfills. Many Pacific islands are plagued
with inadequate landfill space for trash disposal. Plastics and other "wastes" are often
disposed of in local streams or coastal waters.
Although there has been great interest in the use of plastic media for wastewater
treatment systems, the popUlarity of plastic does not mean that other media are
ineffective. On the contrary, studies show that media that contain minerals compare
favorably with plastic with respect to the development ofbiofilm communities, even
when differences in surface area are taken into account (Bruce 1970). For attached
bacterial communities naturally occurring media may potentially contribute minerals and
surface "roughness" that plastic media may lack. This study was intended to compare
, "naturally" occurring substrates locally available on Pacific Islands for their use in fixed-
film reactors for treating wastewater from small-scale aquaculture systems.
14
SECTION 4
Methods
I. Experimental Methods
Five experimental biofilm reactors were constructed on Coconut Island (Cl) to
treat wastewater from an experimental tank containing approximately 300 Mozambique
tilapia (Oreochromis mossambicus), which are native to the Zambezi river system. Each
reactor contained an experimental substrate to be evaluated with respect to its ability to
facilitate ammonium and inorganic nitrogen removal. The substrates consisted of(1) lava
rock (pumice), (2) bluestone (hydropressurized basalt), (3) coral rubble, (4) coconut fiber,
and (5) geotextile material (Texel 090903.50M PPWH). The last of these is a
commercially available synthetic product. The size of the tanks, volume of media in the
tanks, design of the inflow and outflow, and flow rates were controlled for each of the
bioreactors. The experimental design involved weekly sampling to measure total
suspended solids (TSS), nitrate/nitrite, ammonium, and phosphate concentration in the
fish tank effluent and the effluents from the five treatment systems. Dissolved oxygen,
temperature, and pH were also monitored on sampling days. Temperature and dissolved
oxygen were recorded using a DO meter (YSI model 58). pH was recorded using a hand
held meter (IQ Scientific model 3000) with precision measurements recorded to O.lpH
unit (pH was standardized by analyzing replicate samples in the laboratory using
colorimetric methods). Both the DO and pH meters were calibrated before use.
15

1. Study Area
Coconut Island is located off the windward (east) side of Oahu at 21° 25'56.77N,
1570 47' 14.50W. The Hawaii Institute of Marine Biology currently uses the land for
marine research and aquaculture. Freshwater on Oahu comes from aquifers and is routed
to Coconut Island through a system of pipes that distribute the water to buildings and
research facilities. Tilapia aquaculture tanks account for by far the greatest freshwater use
on Coconut Island. Roughly 15.9 million liters of freshwater are used per month for the
aquaculture facility. Historically the tanks have been operated in a once-through ~ow
mode, with the overflow being discharged into Kaneohe Bay. Motivation for treating and
recycling the tank overflow comes from two sources: (1) the cost of the water, and (2) the
fact that the water contains elevated nutrient concentrations coming from the fish tanks.
2. Materials
The use of sustainable practices was a priority for this research project. Hence
most of the materials, including tanks and plumbing fixtures, were recycled items that
could be reconfigured and redesigned for durable and suitable reuse. Many of the system
components were discarded items obtained from the Coconut Island "landfill". One
fiberglass tank 1.55m long, 0.89m wide, and 0.61m height was used as a holding tank to
store the fish tank effluent before it was pumped to the bioreactors. Five cylindrical tanks
made from roughly one-meter-long sea pipes were chosen and reconfigured into biofilm
reactors. Each tank had a diameter of 107 em and height of approximately 91 cm. Each
tank was filled with 58 cm of media and the water level adjusted to 62 cm (Figure I).
Some recycled PVC pipes and fixtures were used to make plumbing connections. All "
16

recycled materials were thoroughly washed with freshwater before being incorporated
into the treatment system.
17

Figure 1
Fix.ed Fi lm Reactor Design
M la
PVC Pipe
1 .5"
2J
Efflv<"nt
(To WetlamlfToro)
Influent
18

One, 8,700-Iiter fish tank containing approximately 300 tilapia was connected to
the holding tank. The effluent from the fish tank flowed into the holding tank via a 7.5-
em diameter overflow pipe. The fish tank used in this study was chosen because it was
the only tank that consistently remained filled with freshwater.! The overflow from the
fish tank was piped into a 38-mm opening in the holding tank. A 0.25-horsepower sump
pump with a float-activated switch moved the water from the holding tank (when the
water level reached approximately 0.2m) to the study area, where the flow was
partitioned amongst the five fixed-film reactors. Figure 2 is a flow diagram of the study
system on Coconut Island. Each of the five fixed-film reactors had similar plumbing to
receive the inflow and discharge the effluent. The inflow entered through a 76-mm
opening on the bottom of the tank and was then routed through a 19-mm diameter pipe to
increase pressure. A ball valve was connected to the 19-mm diameter pipe to facilitate
adjustment of the incoming flow rate to each tank. Rotating spray bars purchased from
Aquatic Ecosystems (RB8) were secured onto the 19 mm inlet. The two spray bars that
came with the RB8 kit were replaced with new PVC spray bars designed to better fit the
dimensions of the tanks. The modified spray bars were each 46 cm long. Holes were
drilled into the bars with a 1/3 cm drill bit. Two bars were connected to each of the
fluidized bearings, and caps were placed on the ends. The bars rotated as the influent
rose and flowed through the spray holes, allowing for a fairly even distribution of water
over the media (Figure 3).' The influent was sprayed over the media to increase the
dissolved oxygen concentration in the water without the use of an aerator. Once the·
influent entered the tanks, the flow moved downward through the media and out the
! Other research fish tanks were sporadically switched back and forth from a freshwater to saltwater medium.
19

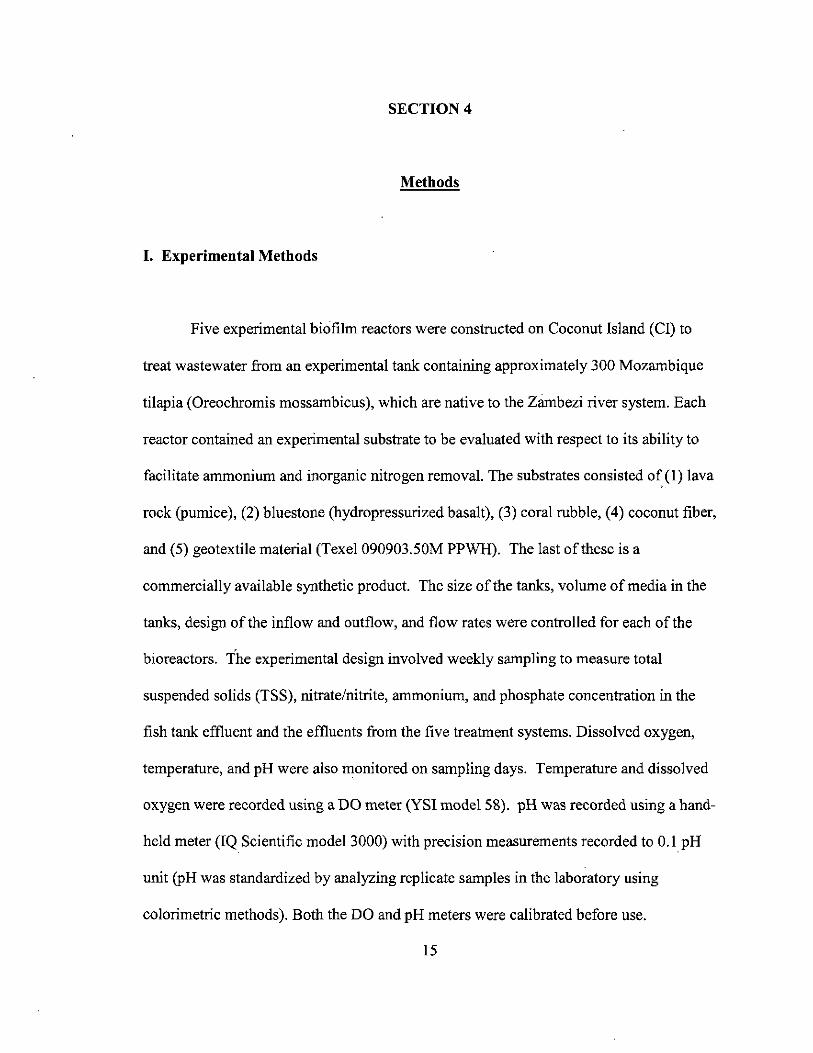
bottom via a 5-cm diameter "infiltrator" constructed from PVC pipe with 13-mm holes to
minimize clogging (Figure 4). The flow through the 5-cm diameter pipe was reduced and
routed through a 0.19 mm section of pipe just prior to leaving the tan1e Outside the tank
was a standpipe with a snorkel to maintain the water level and a faucet to take samples
from prior to discharge (Figure 5). Water quality was monitored in the effluent from the
fish tank and the effluent from the five bioreactors prior to discharge.
20

Figure 2
Holding t nkJ pu m p statJ'On
To outf. 1I
Figure 3
fish T
21
r GEote.lil .. • Coral Rubbl ~ • SJues one lava Rock Influent Efflu n.t
• •
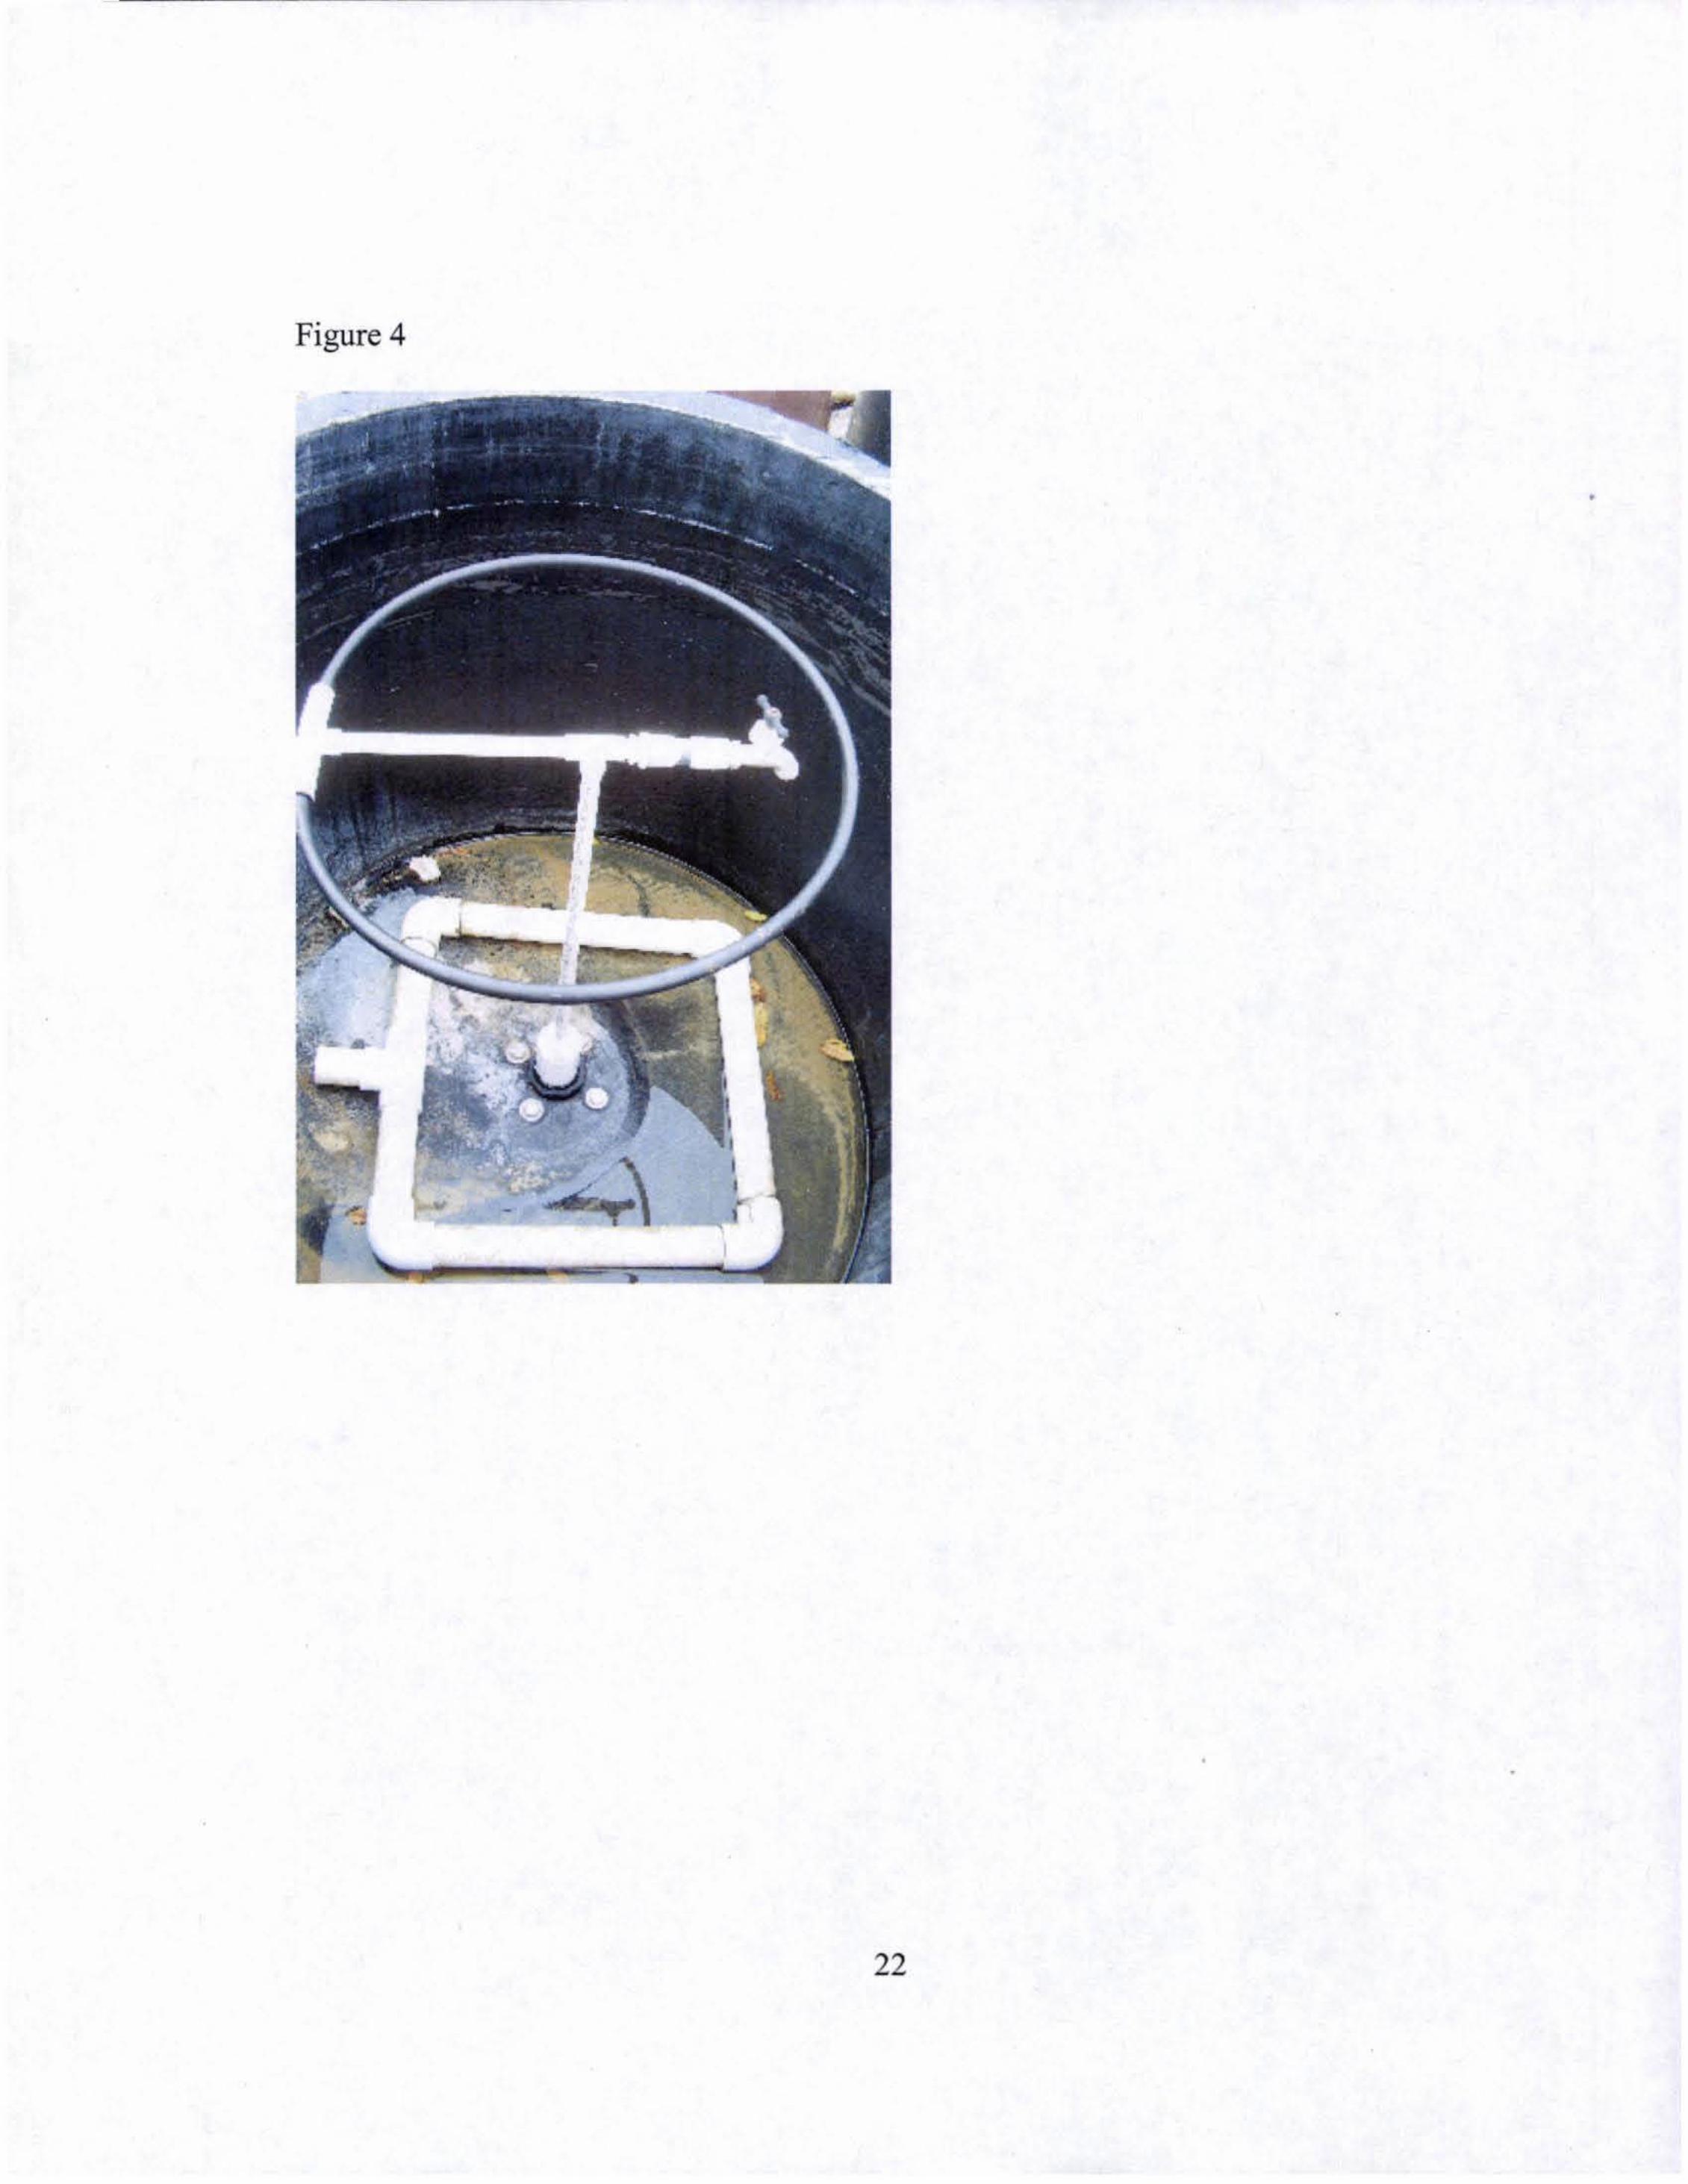
Figure 4
•
• •
22

Figure 5
23

3. Small Scale Replication
A small-scale replica of the study system on Coconut Island was used to
determine whether the performance of the treatment systems was reproducible when
appropriately scaled according to residence time. The replica was located on the roof of
the Marine Science Building on the University of Hawaii Campus and will be referred to
as MSB. Overflow from the CI fish tank was collected twice weekly and placed in the
holding tank of the MSB system. Approximately 225 liters oftilapia wastewater were
brought to the MSB each week. The holding tank was elevated in order to provide
gravitational flow to five 4.5-liter bioreactors scaled in proportion to the CI
bioremediation system. Faucets permitted dosing the flow equally among the trickling
filters. Because of small differences in the flow due to faucet imprecision, measuring
containers placed under the filters were used to quantity flow rates. A total of 75 liters of
wastewater were collected from Coconut Island and put in the system on Tuesday and
Friday, and 38 liters were added every Monday and Wednesday. A diagram of the replica
system is shown in Figure 6.
24
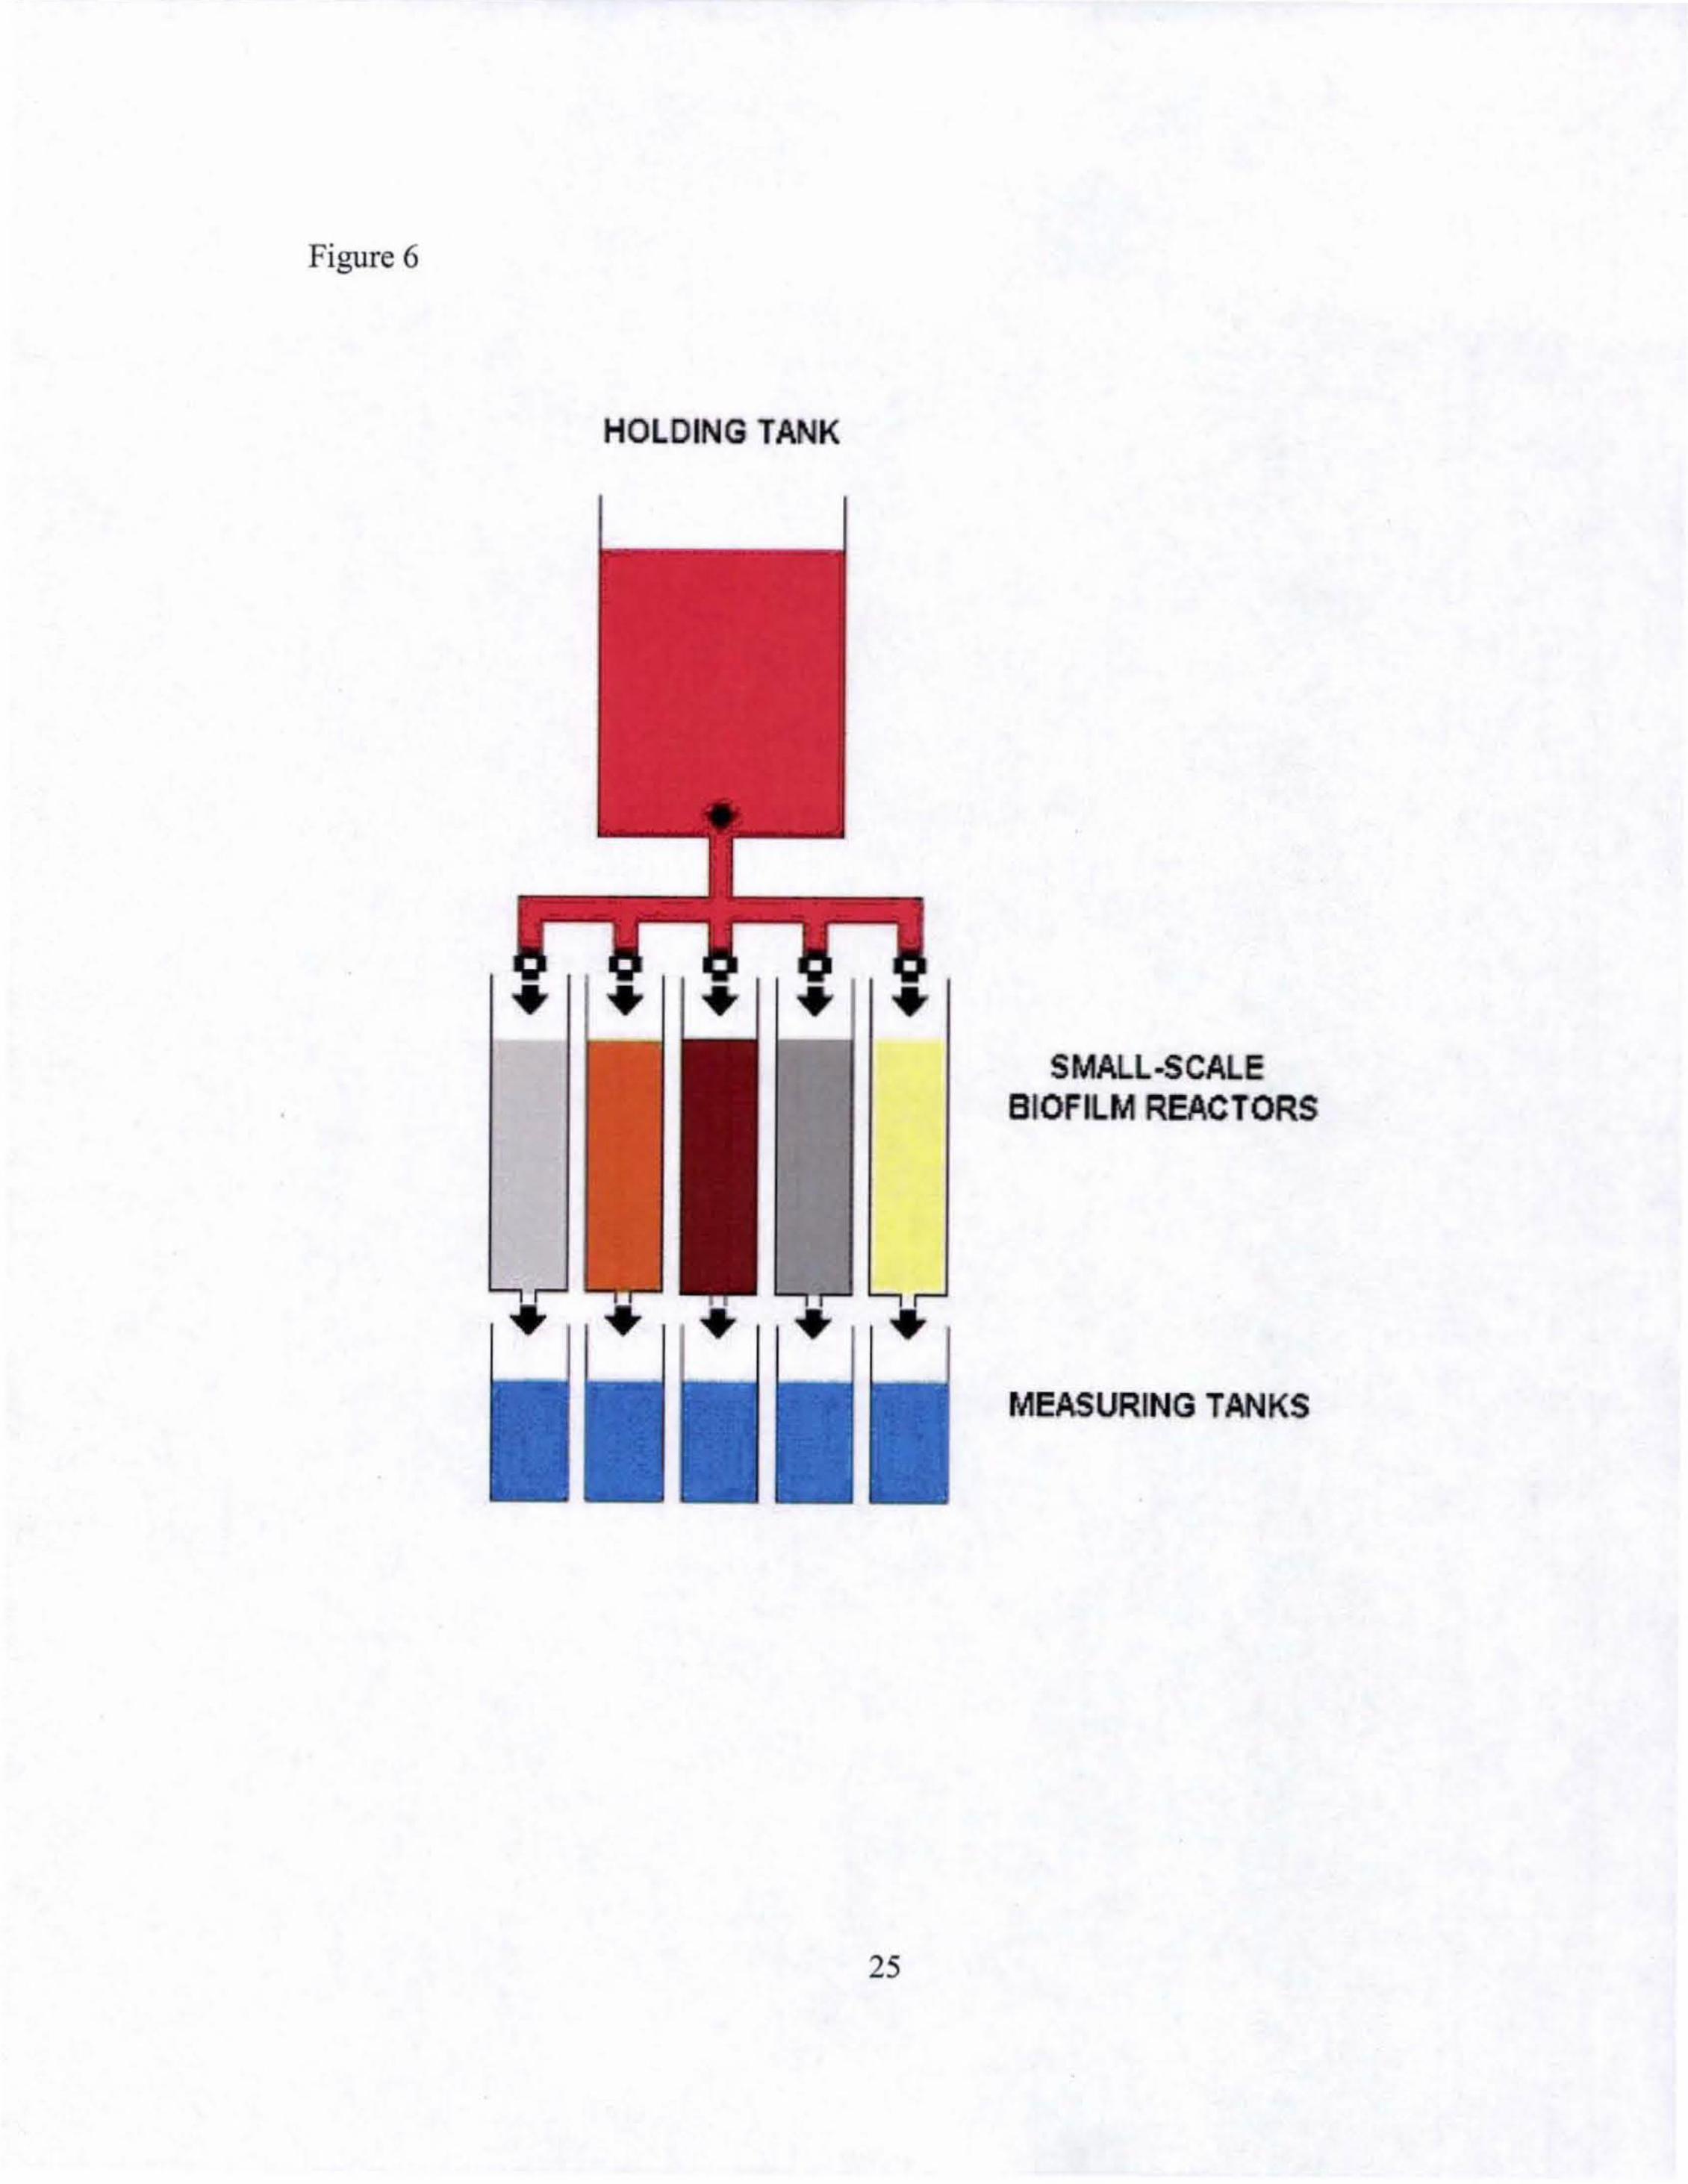
Figure 6
HOLDING TANK
• •
25
SMALL-SCALE BIOFILM REACTORS
MEASURING TANKS

4. Sampling
The MSB study system was activated on April 2, 2004 and continued through
June 9, 2004. Sampling of the inflow and effiuent from the bioreactors was made on a
weekly basis throughout the study period. Weekly sampling of the CI system commenced
June 16, 2004 and continued until the beginning of December 2004. Water samples were
taken a total often times. All water samples were collected in 800-mL plastic bottles.
Temperature, pH, and dissolved oxygen concentration (with the same equipment
• mentioned above) were recorded immediately. The samples were then placed in a cooler
filled with ice and taken to MSB 519 for further processing (see below).
5. FlowlHydraulic Residence Time
Flow rate can influence the formation ofbiofilms and their structural
characteristics (Casey et al. 1999) including homogeneity (Costerton et al. 1995). Thus,
flow rate along with residence time need to be considered in analyzing the performance
of a biofilm reactor. From July through November 2004 the CI treatment system
remained "open", i.e., the effiuent from the treatment system was discharged at a
designated outfall. Flow (liters per day) was estimated (1) using a flow meter and (2)
using the "bucket stopwatch" method? In the latter case empty carboys were placed at
the outflow of the biofilm reactors and the time required to fill the carboys recorded with
a stopwatch.
2 The bucket stopwatch method involves recording the amount of time required to fill a container of known volume.
26

The hydraulic residence time (HRT) within the bioreactor contributes to the
treatment performance. HRT is defined as the ratio of volume of water in the system
(m3) divided by the flow rate (m3 d· l
) (Campbell and Ogden 1999). The volume of water
in the trickling filters is equal to the volume of the trickling filters multiplied by the void
ratio. 3
6. Media
With the exception of the geotextile fabric, the media that were chosen for the
bioreactors were materials that are commonly found on Pacific Islands. The media
consisted of lava rocks, bluestone (commonly referred as gravel, a hydropressurized
basalt), coral rubble, coconut fiber husk, and a geotextile fabric.
Three size categories were chosen for the rock media. Type I rocks were those
greater than 7.5 cm in diameter. Type II rocks were 5.0-7.5 cm in diameter. Type III
were 1.3-2.5 cm diameter rocks. The three size categories were chosen so that the rock
bioreactors could be filled with graded bedding. The smallest rocks were placed near the
top and the largest rocks near the bottom of the reactor. This design tends to prevent
clogging and facilitates removal ofbiofilms that slough off, thus minimizing the need for
back-flushing. Type II lava rocks (pumice) were selected by hand from the area adjacent
to the CI parking lot. Type III lava rocks were collected from inshore areas near the
project site on Coconut Island. Type I lava rocks were purchased at a local gardening
store. Type II bluestone was purchased from Ameron, Kailua, Oahu, and Type I and
3 The void ratio is by definition the volume of water required to fill a container filled with a porous medium divided by the volume of the container.
27

Type III were collected on Coconut Island. Coral rubble Type I and II were purchased
from the Sand Island Quarry, Honolulu, Oahu, and Type III were collected from inland
sites on Coconut Island. The geotextile material was donated by Ocean Arks
International and came in only one size. All of the coconuts were collected on Coconut
Island, and theii- coir was husked on the island. Like the geotextile material, the coconut
fiber had only one size class.
7. X-Ray Diffraction
X-Ray diffraction is a method utilized by geologists to characterize the major
mineral contents within rocks by analyzing mineral structures at various angles. Dr. Jane
Schoonmaker of the Department of Oceanography, University of Hawaii at Manoa
conducted this analysis.
8. Void Ratio and Specific Surface Area
Since biofilms are attached microbial communities, their activity is very
dependent on physical characteristics of the medium such as porosity and specific surface
area. Increasing the surface area of the medium, for example, has been shown to increase
the level of treatment (Bellelo et aI. In Press). In the work described here, porosity was
measured using the void ratio for all the substrates used in the fixed film reactors. The
void ratio is defined as the volume that remains filled with water after the medium has
been placed in the filter housing divided by the total filter volume (Timmons et al. 1997),
28
1.e.,
where cp is the porosity, Vp is the volume ofliquid that can be accommodated with the
medium in place, and Vrnis the total volume of the filter housing. It is common to express
porosity as a percentage by mUltiplying the above ratio by 100. cp was calculated by
filling a one-liter beaker to the mark (V m) with dry medium. Water was then poured into
the beaker until the water just reached the mark. The volume of water required to fill the
beaker to the mark was recorded (Vp). This exercise was repeated for each of the five
media and, in the case ofthe rock media, for each of the size classes.
The surface area available for microbial attachment and the surface "stickiness"
are also characteristics that have been shown to influence the efficiency of trickling filter
systems (Cooksey, 1995). In the work reported here the specific surface areas of the
inorganic media were determined by sampling 500 mL of Type I objects and 150 mL of
Type II and III objects. Although mercury absorption is a more refined was to estimate
surface area, a "paper" method was chosen to provide ballpark estimates of the media's
surface areas. Each object was covered with a fine layer of paper, with care taken to
ensure that adjacent pieces of paper did not overlap. The area of paper required to cover
the object surface was then measured, and the surface area was calculated. This process
was repeated for each substrate.
For lava rocks and coral, cavities were neglected. The cavities are not uniform,
and because of their small size, their geometry was difficult to determine. The specific
29

surface areas for the lava rocks and coral should therefore be considered lower bounds to
the true specific surface areas. Specific surface area measurements for the coconut fibers
were not made. Since coconut fibers are organic substrates, this measurement is quite
difficult because there are surfaces that exist on the macro and micro levels. In addition
to the complexity of making this measurement, this medium is degradable with time, and
its surface area therefore has a temporal dependence. Table 2 shows the results of the
porosity and specific surface area measurements for the media according to the different
size classes (Types I-III) and their total arrangement in the fixed film reactors (Total).
30
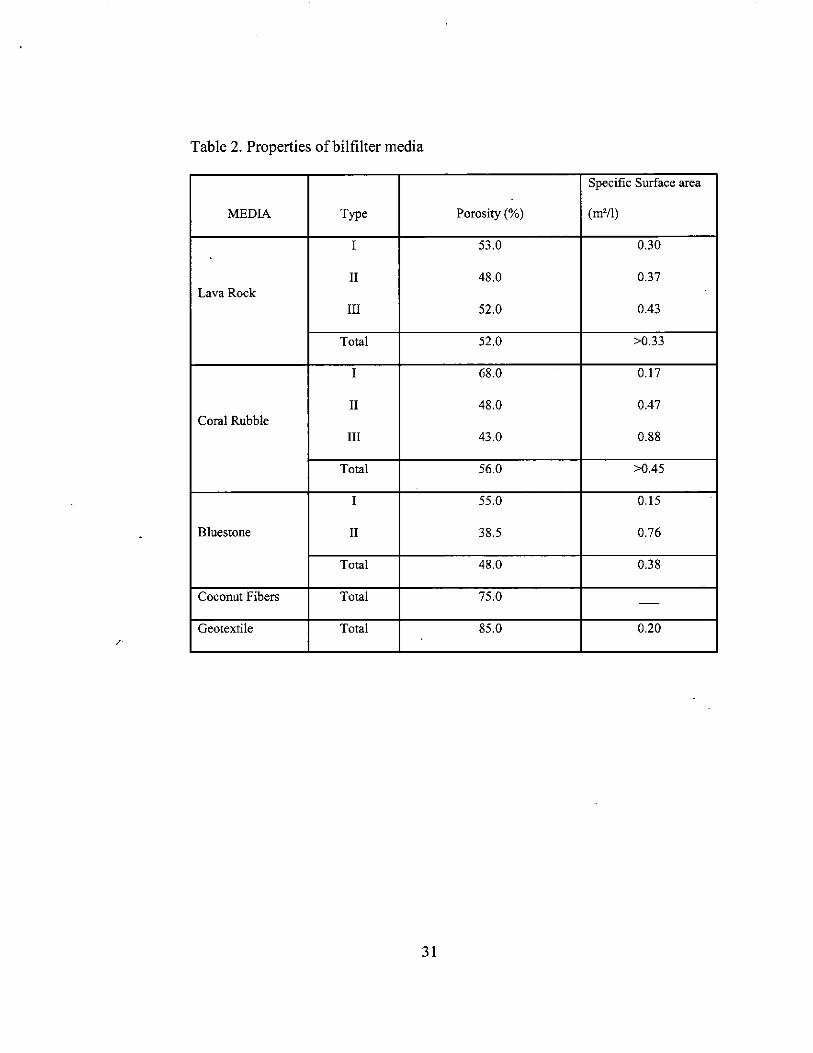
Table 2. Properties ofbilfilter media
Specific Surface area
MEDIA Type Porosity (%) (m'll)
I 53.0 0.30
II 48.0 0.37 Lava Rock
III 52.0 0.43
Total 52.0 >0.33
I 68.0 0.17
II 48.0 0.47 Coral Rubble
III 43.0 0.88
Total 56.0 >0.45
I 55.0 0.15
Bluestone n 38.5 0.76
Total 48.0 0.38
Coconut Fibers Total 75.0 -
Geotextile Total 85.0 0.20 /
31
\
II. Laboratory Methods
The following laboratory procedures are similar to the methods used in Laws and
Roth (2004).
1. TSS
Once the samples were taken, they were immediately stored on ice in a cooler.
Once the samples were brought to the laboratory, they were either filtered that day or
stored in the laboratory refrigerator for up to one week. Although refrigeration does
impede biochemical processes, it does not necessarily bring them to a halt. Therefore,
whenever possible, the samples were immediately analyzed. The TSS analysis method
followed American Public Health Association et al. (1995). The water samples were
filtered through preweighed glass fiber filters (Whatman GFF) with a nominal porosity of
0.7).lm. Approximately IL of the water sample was filtered. The filters were dried in a
drying oven at 105°C to constant weight. The filters were weighed on an analytical
balance (Metler model H20T) to the nearest 0.01 mg. Blanks were run by filtering 250
ml of distilled water through a filter. The concentration of the total suspended solids was
calculated as the difference in the weights of the filter before and after filtering.
32

2. Nutrient Analysis
Filtrate from the TSS analysis was transferred to plastic bottles to be processed
for nutrient analysis. Concentrations of nitrite/nitrate, ammonium and phosphate were
measured using colorimetric techniques on a Technicon Instruments AutoAnalyzer. The
methods used for the nutrient analysis were Technican (1977) for nitrite/nitrate,
ammonium EPA 350.1, and standard colorimetric methods (American Public Health
Association et a!., 1995) for phosphate. Limits of detection were 0.10 11M for
nitrite/nitrate, 0.13 11M for ammonium, and 0.05 11M for phosphate. Dissolved inorganic
nitrogen (DIN) was equated to the sum of nitrate/nitrite and ammonium.
III. Statistical Analysis
Nutrient removal rates (k) were calculated from the equation
C = c'e-kt , t (4)
Where Ce is the nutrient concentration in the effluent from the bioreactor, C j is the
nutrient concentration in the inflow, k is the rate of nutrient removal, and t is the
residence time of the water in the bioreactor. Solving equation 4 for k gives
k = In(C j /C,) t
33
(5)

Nutrient removal rates calculated for the CI and MSB systems were compared
statistically using either Kruskal-Wallis (KW) or one-way analysis of variance
(ANOV A). Initial comparisons were made between identical treatments from the CI and
MSB systems to determine if there was a significant difference between the performance
of the CI and MSB systems. The null hypothesis was that the CI and MSB systems
performed in a similar manner when removal rates were scaled to residence time
(equation 5). The null hypothesis was rejected if the difference in nutrient removal rates
was significant by a two-tailed test at p = 0.05. If there was no reason to reject the null
hypothesis, the nutrient removal rates from the MSB and CI systems were pooled and a
KW or one-way ANOV A run to determine whether there were significant differences in
nutrient removal rates between the five treatments.
ANOVA calculations assume that (1) all sample populations are normally
distributed, (2) all sample populations have equal variance, and (3) all observations are
mutually independent. The Kruskal-Wallis test is a nonparametric or distribution-free
analogue of ANOV A that is commonly used when the first and/or second assumptions of
ANOVA are not met. The ANOVA test is known to be robust to modest violations of the
first two assumptions, and in cases where these assumptions hold entirely or even
approximately, the ANOV A is generally the more efficient statistical procedure for
detecting departures from the null hypothesis (Sokal and Rohlf, 1981, p. 429). A simple
test for normality that.is particularly useful when sample sizes are sma1l4 is the Lilliefors
modification of the Kolmogorov-Smirnov test for goodness of fit (Sokal and Rohlf, 1995,
p. 711). The test is based on differences in two cumulative relative frequency
4 For the MSB data sets, n = 9.
34

distributions and is available in the MA TLAB statistical toolbox. I used the Lilliefors test
to decide whether to analyze the nutrient removal rate data using KW or ANOV A.
If the assumption that the CI and MSB bioreactors were similar could not be
rejected at p = 0.05, the data from the two systems were pooled, giving a combined'data
set with 27 replicates for each ofthe five treatments. The rationale for pooling the data
was to increase the sample size and hence the probability of detecting differences
between treatments. Given the larger number of sample size in the combined data sets, it
seemed reasonable to examine the data for outliers, the rationale again being to increase
the power of the KW or ANOV A. The MATLAB BOXPLOT routine was used to detect
outliers. A datum is considered to be an outlier by BOXPLOT if it lies outside 1.5 times
the interquartile range. For a normally distributed variate, the interquartile range
corresponds to 1.35 normal deviates, and the BOXPLOT criterion therefore corresponds
to a deviation by more than 2.0 normal deviates. The two-tailed probability that an
observation wil1lie outside this range is 4%. Data identified by BOXPLOT as outliers
were excluded from subsequent analysis.
35

SECTIONS
Results
I. Media Results
Coral Rubble. As expected, the X-ray diffraction results for the coral powder detected
calcite and aragonite, two fonns of calcium carbonate (CaC03). CaC03 is susceptible to
dissolution by microbial processes that produce CO2 (e.g., respiration) andlor H+ (e.g.,
equation I). The relevant equation is
This is obviously a concern in a trickling filter that utilizes coral rubble as a substrate for
bacterial activity (respiration and nitrification).
Lava Rock (Pumice). The X-ray diffrac!ion results for the pumice powder indicated that
the lava rock (basalt) is composed of plagioclase feldspar, olivine, and pyroxene.
Plagioclase minerals were also found in the bluestone. These minerals are also subject to
attack by C02 and acid. Products of the weathering of olivine and pyroxene include
calcium, iron, silicon and magnesium (Schlesinger, 1997).
36

Bluestone. The X-ray diffraction results for the bluestone powder (another form of
basalt) contained the same minerals as the lava rock pumice. Additional minerals found
in the bluestone included quartz and chlorite, which are not commonly found in basalt.
The presence of the quartz and chlorite suggest that the bluestone underwent
hydrothermal alteration.
Non-rock materials
Geotextile. The geotextile fabric used is a woven material made from polypropylene.
Coconut fiber. Coconut fiber is an organic substrate and hence contains carbon. This is
potentially advantageous, since organic carbon is typically added (e.g., acetate) in tertiary
wastewater treatment systems to stimulate nutrient removal (Casey et aI1999). A
concern with the use of a natural, organic medium for filtration is fiber degradation over
time. All natural fibers will eventually degrade, but the rate of degradation will vary
according to the chemical composition. Luzton (1996) showed that natural fibers could
be used successfully as media in slow sand filtration and that coconut fiber was the most
favorable medium with respect to degradation, with a weight loss of only 2% after four
weeks. Coconut fiber, commonly referred to as coir, is one of the hardest natural fibers
because of its high lignin content, 46% (Sudhakaran, 2003). Interestingly, lignin has
become the subject of recent research for its anti-algal activity. The Center for aquatic
Plant Management in England has discovered and developed the use of natural fibers as a
method of algal control. They have concluded that when natural fibers are placed in
37

water, the soluble components (carbohydrates and hemicelluloses) are washed out,
leaving lignin to slowly decompose. The decomposition process leads to the production
of fulvic and humic acids via bacterial and fungal enzymes activity. These substances, in
the presence of dissolved oxygen, form hydrogen peroxide, which inhibits the growth of
algae (IACR-Center for Aquatic Plant Management, 1999).
II. Flow and Hydraulic Residence Time
1. Flow
On Coconut Island the flow through the system was restricted by the output range
ofthe 0.25 horsepower sump pump and the approximately a three-meter head between
the fish tank and the holding tan1e The maximum and minimum flow rates were
approximately 21 m3 and 4 m3 per day, respectively. Geometric mean flow rates through
the treatment system when the system was "open" and "closed" were 14.6 m3 and 11.8
m l per day, respectively.
The flow on the MSB' system was restricted by the total amount of wastewater
delivered to the system weekly. Although the CI and MSB systems were intended to
have similar hydraulic residence times, the average residence time in the MSB systems
was about 3.5 times longer.
38

2. Hydraulic Residence Time
Table (3) shows the void ratio, volume ofliquid in each tank, and HRT for the study
system at Coconut Island and MSB based on average flow.
Table 3a: Hydraulic Residence Time (HRT) of the Coconut Island system
Volume of media Volume ofliquid Hydraulic Residence
Void Ratio (liters) (liters) Time (days)
Lava 0.52 603 314 0.11
Coral 0.56 603 339 0.12
Bluestone 0.48 603 290 0.10
Coconut 0.75 603 453 0.16
Geotextile 0.85 603 514 0.18
Table 3b: Hydraulic Residence Time (HRT) of the MSB system
Volume of media Volume ofliquid Hydraulic Residence
Void Ratio (liters) (liters) Time (days)
Lava 0.52 4.53 2.35 0.38
Coral 0.56 4.53 2.54 0.41
Bluestone 0.48 4.53 2.16 0.35
Coconut 0.75 4.53 3.37 0.55
Geotextile 0.85 4.53 3.82 0.62
39

III. Water Chemistry Results
1. Dissolved Oxygen and pH
Dissolved oxygen remained greater than 2mgIL in the effluent from all five
biofilm reactors, and effluent pH in aU cases was in the range 7.0-9.0. Due to some
technical problems with the DO and pH meters only 67% and 50% of the sampling days
were recorded for DO and pH respectively at Coconut Island. DO and pH measurements
were conducted at MSB on the sampling days and were measured randomly between
sampling dates. Tables 4a and 4b show the mean and standard deviation for each filter
for CI and MSB respectively.
40

Table 4a Coconut Island 0, and pH yalues
0, (mgIL) n=12 pHn=9
Coral mean 8.0 8.7 stdev 0.9 0.3
Bluestone mean 7.5 8.3 stdey 0.3 1.2
Lava mean 7.7 8.5 stdey 0.8 0.4
Geotextil. mean 7.7 8.4 stdev 1.0 0.4
Coconut mean 5.9 7.8 stdey 0.4 0.1
Fisb Tank mean 7.3 8.3 stdev 0.6 0.3
41

Table 4b
MSB 0, and pH values 0, (mg/L) (n~19) pH (n~19)
Coral mean 4.9 8.6 stdev 1.3 0.2
Bluestone mean 5.1 8.5
stdev 1.2 0.3
Lava mean 4.9 8.4 stdev 1.4 0.3
Geotexlile mean 5.0 8.1
stdev 1.3 0.4
Coconut mean 4.6 7.8 stdev 1.3 0.3
Fish Tank mean 7.0 8.3 stdev 0.8 0.4
42

2. Nutrient and TSS Results
Table 5 summarizes characteristics of nutrient and TSS concentrations in the
inflow and effluent of the CI and MSB biofilter systems. Average concentrations and
percent removal have been calculated using both geometric means and median values. In
. • the case of ammonia, effluent concentrations were in many cases below the limit of
detection «0.13 11M). As long as the median value in the data set is above the limit of
detection, the median value is an unbiased measure ofthe true median. However, in four
often cases, the median ammonia concentration in the effluent was below the limit of
detection. The geometric mean of the data set is a biased estimator of the true geometric
mean as long as any of the measured values are below the limit of detection.5 The same
logic applies to an arithmetic mean. For nitrate/nitrite and phosphate analytical
sensitivity was not a problem, and because nitrate/nitrite concentrations were much
higher than ammonia concentrations, analytical sensitivity had virtually no effect on DIN
characteristics.
5 The limit of detection was substituted for values below the limit of detection.
43

Table 5a: Fixed Film Bioreactor Performances at Coconut Island. In all cases, n = 18.
TSS (mg NH, NO,INO, DIN PO, drywt/L) (J.lM) (j.tM) (j.tM) (J.lM) DIN:P
Lava Geometric mean 0.02 0.29 13.92 14.34 1.82 7.9 Median 0.05 0.26 14.68 14.99 1.96 7.4
% Reduction Geometric mean 99 92 -84 6 -18 Median 97 91 -47 -2 -21
Bluestone Geometric mean 0 0.37 9.42 10.97 1.56 7.0 Median 0.06 0.38 16.56 16.87 1.68 8.7
% Reduction Geometric mean 100 89 -25 28 -2 Median 96 90 -38 -9 -10
Coral Geometric mean 0.23 0.31 11.74 12.55 1.44 8.7 Median 0.35 0.30 13.33 13.46 1.55 8.1
% Reduction Geometric mean 89 91 -56 18 6 Median 75 90 -21 13 4
Geotextile Geometric mean 0.08 0.71 7.99 9.72 1.54 6.3 Median 0.23 1.07 13.93 15.01 1.95 7.3
% Reduction Geometric mean 96 79 -6 36 0 Median 84 72 -29 -6 -15
Cocoout Fiber Geometric mean 0.17 0.37 5.54 7.28 1.50 4.9
Median 0.36 0.13 8.94 10.39 1.48 6.4 % Reduction Geometric mean 91 89 26 52 2
Median 74 91 4 38 7
(Fish tank) Geometric mean 2.02 3.45 7.55 15.29 1.54 10.0 Median 1.39 3.41 9.73 14.05 1.52 9.2
44

Table 5b: Fixed Film Rioreactor PerfoTIllances at MSB. In all cases, n ~ 9.
TSS (mg dry NH, N02IN03
DIN PO, wtlL) (f1M) (flM) (11M) (f1M) N:P
Lava Geometric mean 0.41 0.24 11.56 12.01 1.54 7.8 Median 0.37 0.13 10.15 10.48 1.43 7.7
% Reduction Geometric mean 93 85 4 19 -45 Median 97 90 10'" 27 -30
Blnestone Geometric mean 0.31 0.24 8.42 8.86 1.16 7.7 Median 0.42 0.13 10.53 11.03 0.98 10.1
% Reduction Geometric Mean 95 85 30 40 -9 Median 97 82 10 26 -5
Coral Geometric mean 0.5 0.64 8.40 9.45 0.61 15.5 Median 0.52 0.86 7.33 8.18 0.62 13.2
% Reduction Geometric Mean 91 60 30 36 42 Median 96 45 36 35 42
Geotextile Geometric mean 0.19 0.19 8.31 8.56 0.82 10.4 Median 0.15 0.13 7.54 7.67 0.76 12.0
% Reduction Geometric Mean 97 88 31 42 23 Median 95 92 32 41 32
Coconut Fiber Geometric mean 0.6 1.29 1.46 5.21 0.47 11.0
Median 0.57 1.55 2.10 4.27 0.44 7.5 % Reduction Geometric mean 90 20 88 65 55
Median 95 23 79 70 49
(Fish tank) Geometric mean 5.83 1.61 12.02 14.81 1.06 13.9 Median 12.21 2.81 11.53 14.31 1.06 13.8
45

3. Statistical Results
It was impossible to carry out a meaningful comparison of anunonia removal rates
calculated from equation 5 for the CI and MSB systems since effluent concentrations
were so frequently below the limit of analytical detection. The CI systems, with
residence times of roughly three hours, removed 70-90% of the anunonia and reduced
effluent concentrations one micromolar or less. The MSB systems, with the exception of
the coconut fiber treatment, produced comparable effluent concentrations. The fact that
the residence times in the MSB systems were substantially longer (eleven hours) and the
influent anunonia concentrations lower suggests that there is a threshold concentration
below which ammonia removal either ceases or proceeds at a very slow rate. The MSB
coconut fiber treatment was an unusual both in tenns of its anunonia removal, which was
anomalously low, and its nitrate removal, which was higher than that of any other
treatment. A likely explanation is that the environment in the MSB coconut fiber
treatment was more reducing and hence facilitated nitrate reduction at the expense of
nitrification.
To compare removal rates of DIN between the CI and MSB systems, the
Lilliefors test was first used to detennine if the data for each bioreactor were normally
distributed. In some cases we could not accept the null hypothesis, and we therefore used
a Kruskal-Wallis (KW) test to compare the CI and MSB DIN removal rates. Results of
the KW comparison are summarized in Table 6 and Figs. 7-12. In aJl cases the p-values
were greater than 0.05 and the 'null hypothesis that the CI and MSB systems removed
DIN at comparable rates, i.e., k values calculated from equation 5 was not rejected.
46

Table 6
Comparison ofCI and MSB biofilter systems based on Kruskal-Wallis test.
Media 'X.' P-value
Coconut Fiber 0.04 0.84
Lava 0.76 0.38
Bluestone 2.71 0.10
Geotextile 1.52 0.22
Coral Rubble 0.07 0.80
47

~ ::l -co >
Figure 7: Kruskal-Wallis analysis of coconut fiber bioreactors ar MSB and CI
2
o
-2
-4
-6
-8
-10
-12
-14
-16
-18 ~--------~-----------------------L--------~ 1 2
MSB (Group 1) CI (Group 2)
48

<J)
~ -'" >
8
6
4
2
o
-2
-4
-6
-8
-10
Figure 8: Kruskal-Wallis analysis of lava rock bioreactors ar MSB and CI
-
-
-
-
I ..l -
,
1 2 MSB (Group 1) CI (Group 2)
49

---------------- - ---
Figure 9: Kruskal-Wallis analys is of bluestone bioreactors ar MSB and CI
<J)
CD :::> -'" >
4
2
o
-2
-4
-6
-8
-10
-12
,
""5 ~
~
+
1 2 MSB (Group 1) CI (Group 2)
50
-
•

., OJ :J iU >
Figure 10: Kruskal-Wallis analysis of geotextile bioreactors ar MSS and CI 6
5
4
3
2
1
0
-1
-2
-3
-4
1 MSS (Group1)
51
T I
I
I
-.L 2
CI (Group 2)

Figure 11 : Kruskal-Wallis analysis of coral rubble bioreactors from MSB and CI
6
4
2 -
o -
'" -2 -(])
'" -'" > -4 -
-6 I -8 I
-10 -
-12 -, 1 2
MSB (Group 1) CI (Group 2)
52
6
4
2
o
'" -2 OJ ::l
'" > -4
-6
-8
-10
-12 ' r
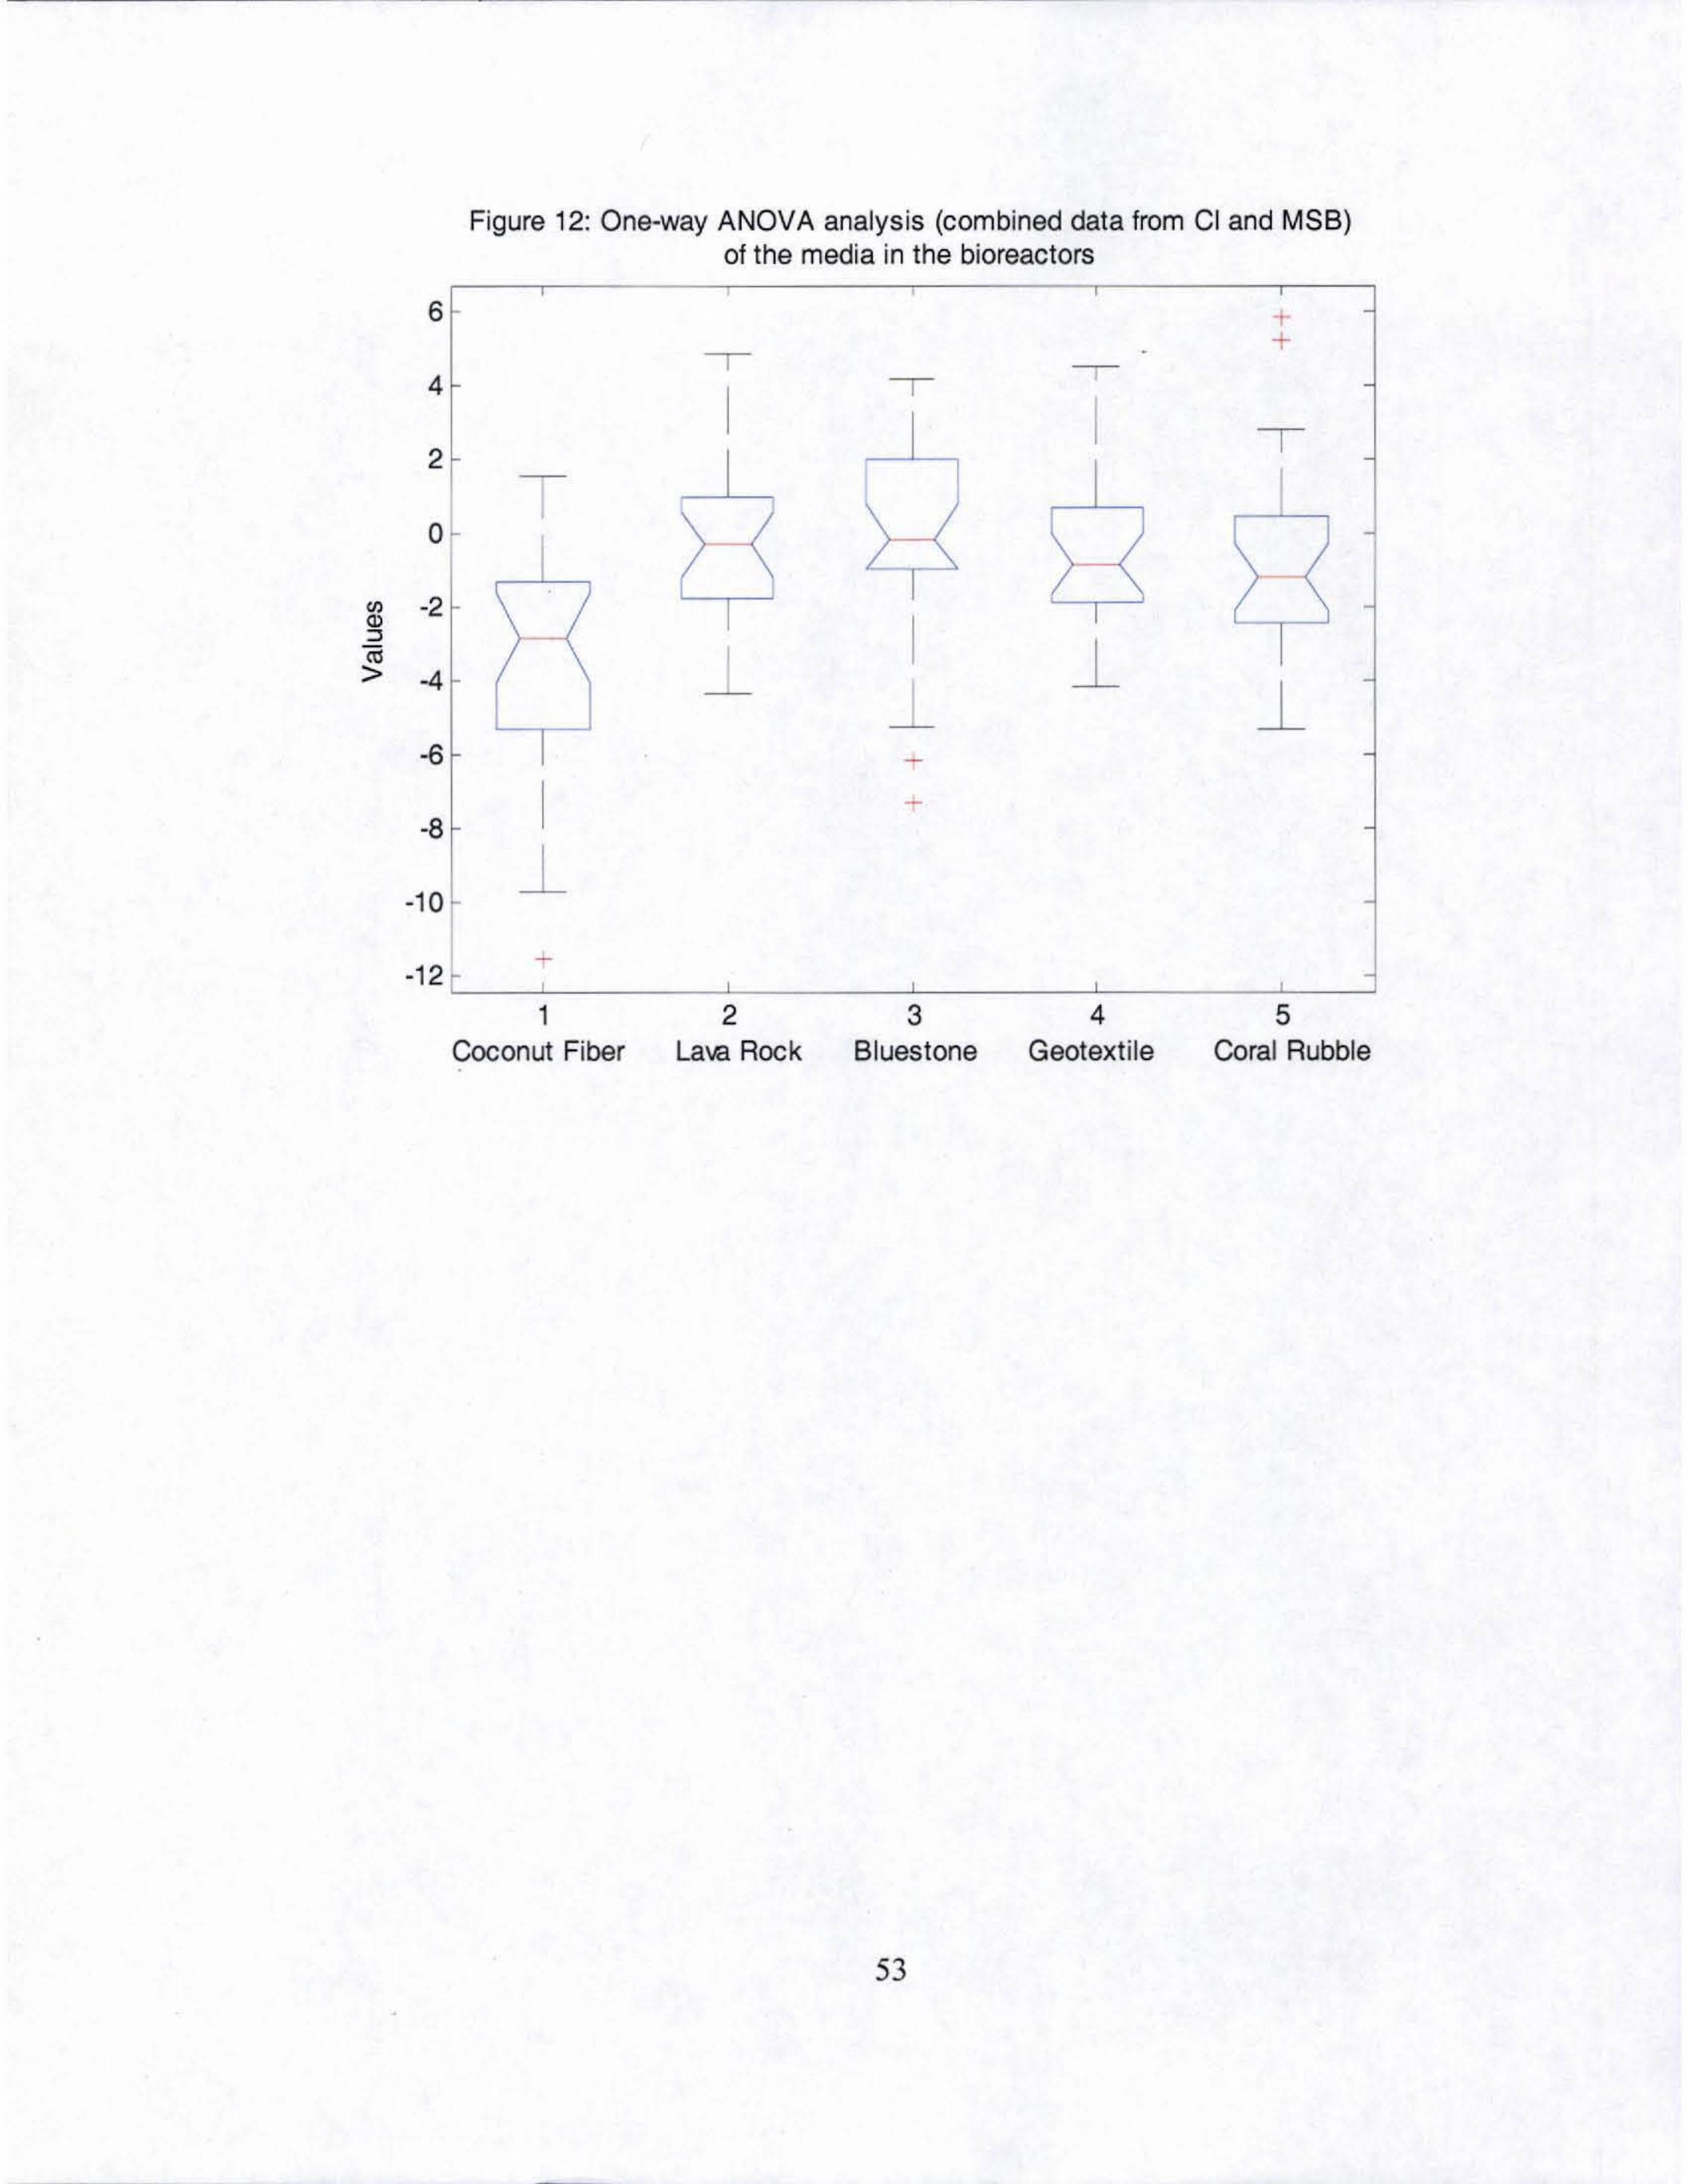
Figure 12: One-way ANOVA analysis (combined data from CI and MSB) of the media in the bioreactors
,
+ + -I
I I
I
I l
~ ~
~ ~
--
~
-1 2 3 4 5
-
-
-
-
-
-
-
Coconut Fiber Lale Rock Bluestone Geotextile Coral Rubble •
53

Given the similarity of the CI and MSB results, the data were pooled, resulting in
five data sets each containing 27 k values. Given the large value ofn (i.e., 5x27 = 135),
we elected to discard outliers on the assumption that there were probably some spurious
data whose presence in the data set would confound identification of treatment effects.
BOXPLOT identified a total of 15 outliers, i.e., 11% ofthe data. Since the criterion used
by BOXPLOT should exclude about 4% of the data if the underlying distribution is
nonnal (see above), this result suggests that roughly 7% of the data may have been
spurious. With the outliers removed, the Lilliefors test was repeated on the combined CI
and MSB data. This time the null hypothesis was rejected that the data were not
nonnally distributed for all five treatments. Therefore the treatment effects were tested
using a one-way ANOV A. Treatment effects were judged to be significant at p = 0.0003.
To determine the cause of the treatment effect, we carried out a multiple comparisons test
using the MATLAB program MULTCOMPARE with a = 0.05. Based on this test, the
coconut fiber treatment, which had the highest DIN removal rate, was judged to be
significantly different from the other four treatments (Fig. 13). There were no significant
differences between the other four treatments with respect to DIN removal.
54

Figure 13: Multiple comparison of means between 5 media types
1 o
2- o
3 o
4 o
5 o
-5 -4 -3 -2 -1 o 1 2 The 4 bioreactors haw means significantly different from Group 1 (Coconut Fiber)
55

Phosphate removal rates were compared in the same manner as the DIN. The
Lilliefors test indicated that not all the data sets were normally distributed, and a KW test
was therefore used to test the null hypothesis that the CI and MSB systems were similar
with respect to rates of phosphate removal. This null hypothesis could be accepted for all
treatments except coconut fibers. The phosphate removal rate for coconut fibers was
about 3.5 times faster in the MSB system. For the other treatments the CI and MSB data
sets were combined and outliers discarded. There were a total of 8 outliers among the n =
4x27 = 108 data. The Lilliefors test indicated that we could accept the null hypothesis
that the data were normally distributed for all four treatments at p < 0.05. We therefore
tested for treatment effects using a one-way ANOV A. Treatment effects were judged to
be significant at p = 5xIO·6. Coral rubble had the highest phosphate removal rate and was
judged to be significantly different from both lava rock and bluestone by
MULTCOMPARE at p < 0.05. Lava rock was significantly different from the other three
treatments (p < 0.05) and was associated with an increase in phosphate concentration.
Although not a focus of this research, the geometric mean reduction ofTSS for all
the treatments was 89% or greater.
4. Operations
I would like to make a few comments relative to maintenance of the biofilter
systems and their potential for use elsewhere. Knowledge of the average nutrient loads
and their temporal variability are crucial to the informed design of a bioreactor
wastewater treatment system. Water quality data collected before the research
56

commenced indicated a low nitrogen burden. However, water quality analyses carried out
during this project revealed there was significant temporal variability in ammonium
concentrations coming from the fish tanle This could be attributed to times offeeding
and types of feed.
Generally, the bioreactor systems were fairly easy to operate. The pump needed
to be cleaned occasionally with a hose (once per week). The rotating trickling spray bars
needed to be cleaned often (more than once per week) since algae can build up within the
pipe and restrict flow. No back flushing was found to be necessary in the fixed film
reactors during the study periods. During times of light or no rainfall, especially during
the summer months on Coconut Island, evaporative losses were considered and some
replacement water was added.
57

'.
SECTION 6
Discussion
EPA water quality criterion, with respect to ammoniaiannnoniurn, are based
entirely on the toxicity of annnonia, since the ammonium ion is essentially benign.
However, this criterion ranges since the concentration of annnoniaiammoniurn is entirely
based upon temperature and pH. One obvious concern with a biological filter is the
possibility that removal efficiency becomes substrate-limited at substrate concentrations
that are potentially dangerous to cultured species. The results indicate that this did not
happen with respect to annnoniaiannnonium removal in the systems studied here. Within
a few hours total annnoniurn concentrations were reduced from 3.5 /-1M to less than 1 /-1M
in the CI biofilters. Although the coconut fiber treatment achieved the best overall rate of
DIN removal, the CI and MSB systems behaved rather differently, in contrast to the
consistent behavior displayed by the other treatments. The CI coconut fiber system
removed about 16% of the DIN per hour primarily by removing total annnonia and a
much smaller fraction of the nitrate .. The MSB coconut fiber system removed about 8.5%
of the DIN per hour primarily by removing nitrate and a smaller fraction of the total
ammonia. Redox conditions within the bioreactors probably account for these
differences, which are implied by the differences in mean DO concentrations between the
two sites. The implication is that a properly engineered coconut fiber bioreactor can be
very effective in reducing total annnonia and DIN concentrations, but empirical studies
will probably be needed to scale the reactor design to the flow rate and concentration of
inorganic nitrogen species in the wastewater.
58

Perhaps one conclusion from this work is that a single biofilter design may not be
the most efficient way to nitrify and denitrify. This is not a particularly surprising
conclusion, since the redox conditions that facilitate these two processes are quite
different. While the environment within the biofilter is undoubtedly heterogeneous in
some respects, insofar as inorganic nitrogen transformations are concerned, the filters
seemed to behave as ifthe environment within them was either reducing (denitrification)
or oxidizing (nitrification). All but the MSB coconut fiber system appeared to be
oxidizing environments. Given the fact that the CI and MSB coconut fiber biofilters
were intended to function in a similar manner, it is surprising that they behaved so
differently, despite the fact that their overall removal rate of DIN was similar. One
explanation may come from the DO analysis; as the retention time increases, more
oxygen is consumed. Although the effluents from the MSB reactors remained
significantly above 2.0mg/L, the DO was noticeably less than the CI reactor effluents,
indicating that the environment within the filters becomes more reducing as retention
time increases.
The phosphate results varied between the filters. The coral rubble and coconut
fiber reactors appear to have removed phosphate most efficiently, while the basalt rock
media (lava and bluestone) reactors tended to have higher concentrations of phosphate in
their effluents compared to the influent. One explanation for this occurrence may again
be attributed to the rock media itself. Basalts can have the mineral apatite which is
typically mined for phosphorus. Furthermore, Felitsyn (2002) found that alkaline basic
volcanic rocks can serve as the continental source for the formation of phosphates.
59

There is no mechanism analogous to denitrification that can remove phosphate
from a biofilter. Possible mechanisms ofremoval from the dissolved phase include
precipitation, adsorption, and biological uptake. The fact that the coral rubble treatment
achieved the highest rate of phosphate removal probably reflects the fact (noted above)
that the rubble contains calcium carbonate. Calcium can effectively bind phosphate
under basic conditions. The fact that phosphate concentrations actually increased in the
effiuent from the lava rock biofilter is provocative, since the minerals in the rock contain
calcium, iron, and aluminum, all of which are capable of binding phosphate under
appropriate pH conditions. Uptake or release of phosphate is associated with the
synthesis or decomposition of organic matter, respectively. To the extent that these
processes were occurring, nitrogen would also be taken up or released. Assuming that
much of the biological activity in the biofilters is due to bacteria, the N:P ratio associated
with that activity would probably be about 7 by atoms (see above). Since phosphate
concentrations in the lava rock biofilters increased by about 0.3-0.4 f.LM", the implied
increase in DIN would be about 2-3 I!M if bacterial respiration were responsible for the
increase in phosphate. Since DIN concentrations in the lava rock biofilters either
decreased or remained more-or-less constant, the implication is that any increases in DIN
due to respiration were more than offset by losses caused by denitrification. Without
knowing the rates of denitrification in the biofilters, it is impossible to pursue this line of
. reasoning much further. In almost all cases the ratio of DIN to phosphate decreased
between the inflow and outflow of the bioreactors, a result very likely reflecting the role
of denitrification/nitrification and the lack of an analogous mechanism for removing
phosphate. The only exception was the MSB coral rubble system, where the long
60

residence time (9.8 hours) may have facilitated phosphate removal via chemical reactions
with calcium.
Although TSS were significantly reduced in all the bioreactors (89-100%), there
was no need for removal of solids via backflushing during the course ofthis study. It is
likely that the reduction in TSS can be attributed to particles being trapped within the
media. Once trapped, the particles may be consumed by metazoans or broken down
through the action of extracellular enzymes released by bacteria. The potential impact of
such remineralization on inorganic nutrient concentrations in the effiuent depends on the
composition of the TSS. Assuming that the TSS consists entirely of organic matter and
that the organic matter contains roughly 45% carbon by weight (Laws and Berning 1991),
the concentration of particulate organic carbon in the fish tank effiuent would be, in
round numbers, 100-200 fLM. The C:N ratio in the TSS is unknown but is likely in the
range 5-10 by atoms. Hence remineralization ofthe TSS could release anywhere
between 10 and 40 fLM DIN. In other words, the nitrogen associated with the TSS is
present in the fish tank effiuent at a concentration comparable to the DIN in the same
effluent. The same logic applies to phosphorus. Given the fact that the biofilters removed
roughly 90% of the TSS and that no backflushing of the filters to remove solids was
necessary (nor has been necessary up to the present time of October 2005), the
implication is that the biofilters may have been removing substantially more nitrogen
than is implied by the DIN budget in Table 3.
Although this study has answered some important questions, as in often the case
in scientific research, it has generated even more questions. Issues that were not
addressed in this work include the composition, heterogeneity, and spatial distribution of
61
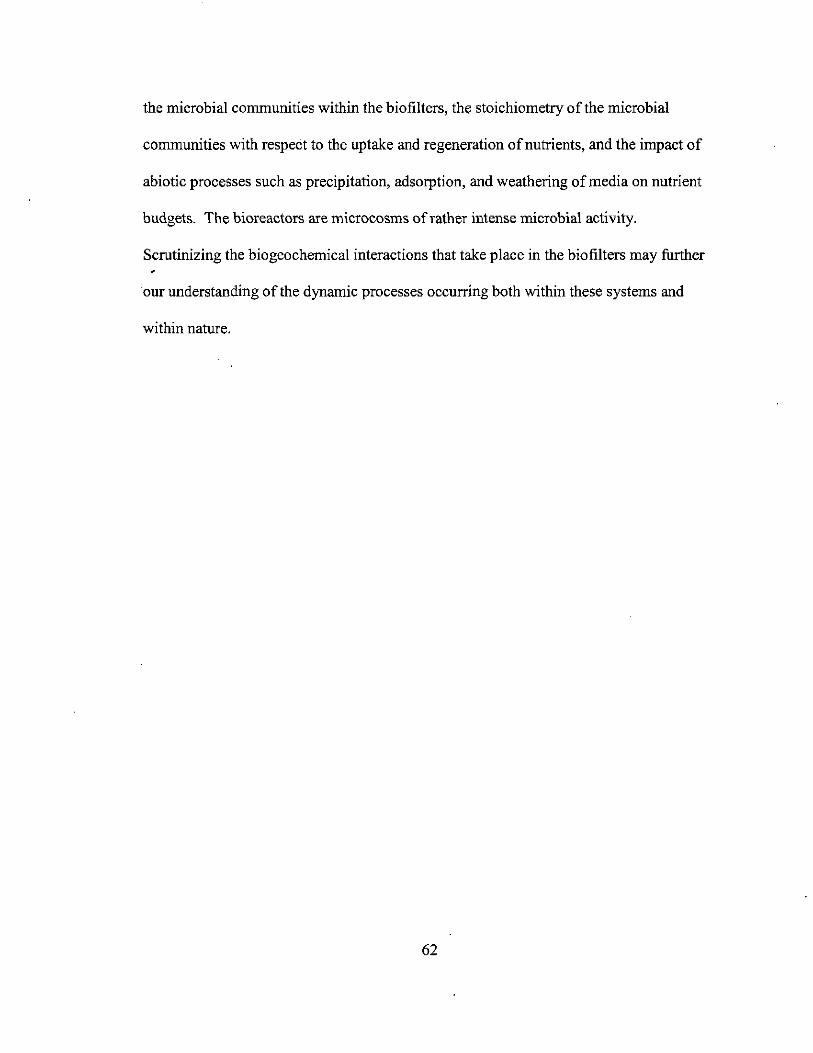
the microbial communities within the biofilters, the stoichiometry of the microbial
communities with respect to the uptake and regeneration of nutrients, and the impact of
abiotic processes such as precipitation, adsorption, and weathering of media on nutrient
budgets. The bioreactors are microcosms of rather intense microbial activity.
Scrutinizing the biogeochemical interactions that take place in the biofilters may further
our understanding of the dynamic processes occurring both within these systems and
within nature.
62

SECTION 7
Future of Remediation System
Since the remediation system was put into operation, the facility has hosted a
variety of educational groups from the local community, NGOs, Hawaii Pacific
University, Windward Community College, and the University of Hawaii at Manoa.
Persons visiting the site have been interested in integrated food production and waste
treatment systems that conserve water and utilize excess nutrients. It is hoped that this
project will receive additional funding for the continuation of its educational mission and
will provide training for individuals from the community and/or from local educational
institutions. I am hopeful that the continued operation of the biofilter system will provide
an opportunity for additional research aimed at advancing the design of sustainable,
engineered ecosystems that convert wastes and conserve water on Coconut Island.
63

References
Books
American Public Health Association, American Water Works Association and Water
Pollution Control Federation. 1995. Standard Methods for the Examination of Water and
Wastewater. American Public Health Association.
Adey, W. and Loveland, K. 1991. Dynamic Aquaria: Building Living Ecosystems. San ,
Diego: Academic Press.
Campbell, C.S. and Ogden, M.H. 1999. Constructed Wetlands in the Sustainable
Landscape. New York: John Wiley & Sons, Inc.
Environmental Protection Agency. 1986. Quality Criteria for Water. EPA 440/5-86-001.
Washington, D.C.
Hawken, P., Lovins, A., and Lovins H.L. 1999. Natural Capitalism. Boston: Little,
Brown and Company.
Mendez, R. and Lema, I.M. 1992. Biofilm reactors technology in wastewater treatment.
Biofilms: Science and Technology. Edited by LF Melo et. al. Boston: Academic
Publishers.
64

Metcalf, F. and Eddy, Inc. 1993. Wastewater Engineering: Treatment, Disposal and
Reuse. 3Td ed., New York, NY: McGraw-Hill.
Redfield, A. C., Ketchum, B.H., Richards, F.A. 1963. The influence of organisms on the
composition of sea-water. The sea. eds: M.N. Hill. v. 2: 26-77.
Richards, F.A. 1965. Anoxic basins and fiords. Chemical Oceanography. eds: J.P. Riley
and G Skirrow. v. 1. Academic.
Sokal, R. R., and F. J. Rohlf. 1981. Biometry. 2nd ed. New York, NY: W. H. Freeman and
Company.
Sokal, R. R., and F. J. Rohlf. 1995. Biometry. 3rd ed. New York, NY: W. H. Freeman and
Company.
Todd, N., and Todd, J. 1994. From Eco-Cities to Living Machines. Berkeley: North
Atlantic Books.
Weisman, A. 1998. Gaviotas: A Village to Reinvent the World. Vermont: Chelsea Green
Publishing Company.
65

Articles iiI Journals
Al-Hafedth, Y., Alam, A., Alam, M.A. 200 I. Performance of plastic biofilter media
with different configuration in a water recirculation system for culture of Nile tilapia
(Oreochromis niloticus). Aquacultural Engineering (29):139-154.
Alleman, J. E. 1984. Elevated nitrite occurrence in biological wastewater treatment
systems. Water Science Technology. 17: 409-419.
Atkinson, MJ. and Smith, S.V. 1983. C:N:P ratios of benthic marine plants. Limnology
and Oceanography. 28(3),568-574.
Brussaard, C.P.D., Mari, X., Van Bleijswijk, J.D.L., Veldhuis, M.J.W. 2005.
A mesocosm study ofPhaeocystis globosa (Prymnesiophyceae) population dynamics II.
Significance for the microbial community. Harmful Algae. 4: 875-893
Bellelo, S.M., Wagener, C.A., and Malone, R.F. Concurrent physical and biological
treatment: the influence of media characteristics in static low density media filters. In
press.
Boller, M., Gujer, W., and Tschui, M. 1994. Parameters affecting nitrifying biofilm
reactors. Water Science and Technology. (29): I-II.
66

Bovenduer, J., Eding, E.H., and Henken, A.M. 1987. Design and performance ofa water
recirculation system for high-density culture of African catfish, Clarias gaiepinus
(Burchell 1822). Aquaculture (63): 329-353.
Casey, E., Glennon, B., and Hamer G. 2000. Biofilm Development in a membrane
aerated biofilm reactor: Effect of flow velocity on performance. Biotechnology and
Bioengineering (67) 4: 476-486.
Cooksey, K. E. and Wigglesworth-Cooksey, B. 1995. Adhesion of bacteria and diatoms
to surfaces in the sea: a review. Aquatic Microbial Ecology (9): 87 - 96.
Costerton, J. W. 1995. Overview of microbial biofilms. Journal of Industrial
Microbiology (15): 137 - 140.
Dang, H. and Lovell, C.R. 2000. Bacterial primary colonization and early succession on
surfaces in marine waters as determined by amplified rRNA gene restriction anal)isis and
sequence analysis of 16s rRNA genes. Applied and Environmental Microbiology 66(2):
467-475.
Evens, M.R, Stamps, R.H., and Konduru, S. 1996. Source variation in physical and
chemical properties of coconut coir dust. HortScience: a publication of the American
Society for Horticultural Science. v. 31(6): 965-967.
67

Felitsyn, S.B. 2002. The Redistribution of Phosphorus in Basic Volcanic Rocks.
Lithology and Mineral Resources. 37(1): 94-96.
Gerloff, G. C. and Krombholz, P.H. 1966. Tissue analysis as a measure of nutrient
availability for the growth of angiospenn aquatic plants. Limnology and Oceanography.
11: 529-537.
Gundersen, K., M. Heldal, S. Norland, D. A. Purdie, and A. H. Knap. 2002. Elemental C,
N, and P cell content of individual bacteria collected at the Bennuda Atlantic Time-series
Study (BATS) site. Limnology and Oceanography. 47: 1525-1530.
Holloway, 1.M., R.A. Dahlgren, B. Hansen, and W.H. Casey. 1998. Contribution of
bedrock nitrogen to high nitrate concentrations in stream water. Nature. 395:785-788.
Janning, K.F., Tallec, x.L., Herremoes, P. 1998. Hydrolysis of organic wastewater
particles in laboratory scale and pilot scale biofilm reactors under anoxic and aerobic
conditions. Water Science Technology (38) 8-9: 179-188.
Karamanev, D., Nikolov, L. 1991. A comparison between the reaction rates in biofilm
reactors and free suspended cells bioreactors. Bioprocess Engineering. (6): 127-136.
Kruner, G. and Rosenthal, H. 1983. Efficiency of nitrification in trickling filters using
different substrates. Aquacultural Engineering (2):49-67.
68
Larsen, T. and Harremoes, P. 1994. Degradation mechanisms of colloidal organic matter
in biofilm reactors. Water Research. (28) 6: 1443-1452.
Laws, E. A. and J. L. Berning. 1991. Photosynthetic efficiency optimization studies with
the macro alga Gracilaria tikvihae: Implications for C02 emission control from power
plants. Bioresource Technology (37) 25-33.
Laws, E.A and Roth, L. 2004. Impact of stream hardening on water quality and
metabolic characteristics of Waimanalo and Kaneohe streams, Oahu, Hawaiian Islands.
Pacific Science (58) 2: 261-280.
Lekang, OJ. and H. Kleppe. 2000. Efficiency of nitrification in trickling filters using
different filter media. Aquacultural engineering (21) 3: 181-199.
Levine A. D., Tchobanoglous, G. and Asano, T. 1991. Particle contaminants in
wastewater: A comparison of measurement techniques and reported size distributions.
Fluid/Particle Separation Journal (4) 2:89-106.
Liu, Q., Mancl, K., and Tuovinen, O. 1999. Study of the use of fine media biofilm
reactors to remove high fat wastewater. The Small Flows Journal (5) 1: 4-11.
69

Magnien, R.E., Summers, R.M., Sellner, K.G. 1992. External Nutrient sources, internal
nutrient pools, and phytoplankton production in Chesapeake Bay. Estuaries 15 (4): 497-
516.
Malone, R.F. and Beecher, L.E. 2000. Use of floating bead filters to recondition
recirculating waters in warm water aquaculture production systems. Aquacultural
Engineering (22): 57-73.
Meany, B.J. and Strickland J.E.T. 1994. Operating experiences with submerged filters
for nitrification and denitrification. Water Science and Technology (29): 119-125.
Michael, P.M., R. James, and T.M. Losordo. 1995. Recirculating Aquaculture Tank
Production Systems: Management of Recirculation Systems. Louisana State University
Agricultural center and Louisiana Cooperative Extension service. Pub. No. 2583: 1-12.
Pastore IIi, G., Canziani, R., Pedrazzi, L., and Rozzi, A. 1999. Phosphorus and nitrogen
removal in moving-bed sequencing batch biofilm reactors. Water Science Technology
(40) 4-5: 169-176.
Rusten, B., Johnson, C., Devell, S., Davoren, D., and Cashion, B. 1999. Biological
pretreatment of a chemical plant wastewater in high-rate moving bed biofilm reactors.
Water Science Technology (39) 10-11: 257-264.
70 •
Rusten, B., Mattson E., Broch-Due A., and Westrum, T. 1994a. Treatment of pulp and
paper industry wastewaters in novel moving bed biofilm reactors. Water Science
Technology (30) 3: 161-171.
Smith, S. V., W. J. Kimmerer, E. A. Laws, R. E. Brock, and T. W. Walsh. 1981. Kaneohe
Bay sewage diversion experiment: Perspectives on ecosystem responses to nutritional
perturbation. Pacific Science 35: 279-396.
Teseng, K., and Wu, K. 2003. The ammonia removal cycle for a submerged biofilter
used in a recirculating eel culture system. Aquacultural Engineering (31): 17-30.
Tillett, D. and Neilan, B. 2000. Xanthogenate nucleic acid isolation from cultured and
environmental cyanobacteria. Journal of Phycology (36):251-258.
Todd, J. and Josephson, B. 1996. The design of living technologies for waste treatment.
Ecological Enginee,.ing. (6): 109-136.
Villaverde, S., Garcia-Encina, P.A. and F. Fdz-Polanco. 1997. Influence of pH over
nitrifying biofilm activity in subinerged biofilters. Water research, vol. 31(5): 1180-1186.
Zhu, S. and S. Chen. 1999. An experimental study on nitrification biofilm performances
using a series reactor system. Aquacultural engineering, vol. 20 (4): 245-259.
71

Institutional Authors
Egli, K. 2003. On the use of anammox in treating ammonium-rich wastewater. DISS.
ETH NO. 14886. Swiss Federal Instituate of Technology Zurich.
IACR Centre for Aquatic Plant Management. 1999. Information Sheet 3: Control of
Algae Using Straw.
Technicon Industrial Systems. 1977. Nitrate & nitrite In water and seawater.
Autoanalyzer II Industrial Methods No. 155-71 W. W. Terrytown, NY, NY 10591.
United Nations. 2002. Internal Year of Freshwater 2003 brochure. United Nations
Department of Public Information. DPII2283IRev.I-December 2002.
United Nations Environment Programme. 2002. UNEP Annual Report 2002.
World Commission on Environment and Development. 1987. Our common future.
Oxford: Oxford University Press.
World Wildlife Fund. 2002. Living Planet Report, 2002.
72
Conferences
Sudhakaran, P. 2003. Eco-friendly practices/remedial measures for environmental
sustainability. 4th International R&D Conference on Water and Energy for 21 st Century.
Maharashtra, India.
United Nations. 2005. International Meeting to Review the Implementation of the
Program of Action for Sustainable Development of Small Island Developing States
(SillS). Port Luis, Mauritius.
73